Exhibit 99.2
The information presented herein is derived from Monster Energy Company’s proprietary, custom NielsenIQ database (and is not derived from our, or any industry participant’s, financial statements). While such information is based on data received from NielsenIQ , the results reported in this presentation may vary from those found in publicly available syndicated sources such as NielsenIQ and IRI Circana due to differing definitions of the energy drinks category and other factors. Further, Monster Energy Company has not independently verified industry data collected or provided by Nielsen and makes no representations as to its accuracy or completeness. Data provided by NielsenIQ (and other third - party sources), as well as our analysis of such data, involve a variety of assumptions and methodologies that are subject to uncertainties, and therefore you are cautioned not to give undue weight to the information contained in this presentation.
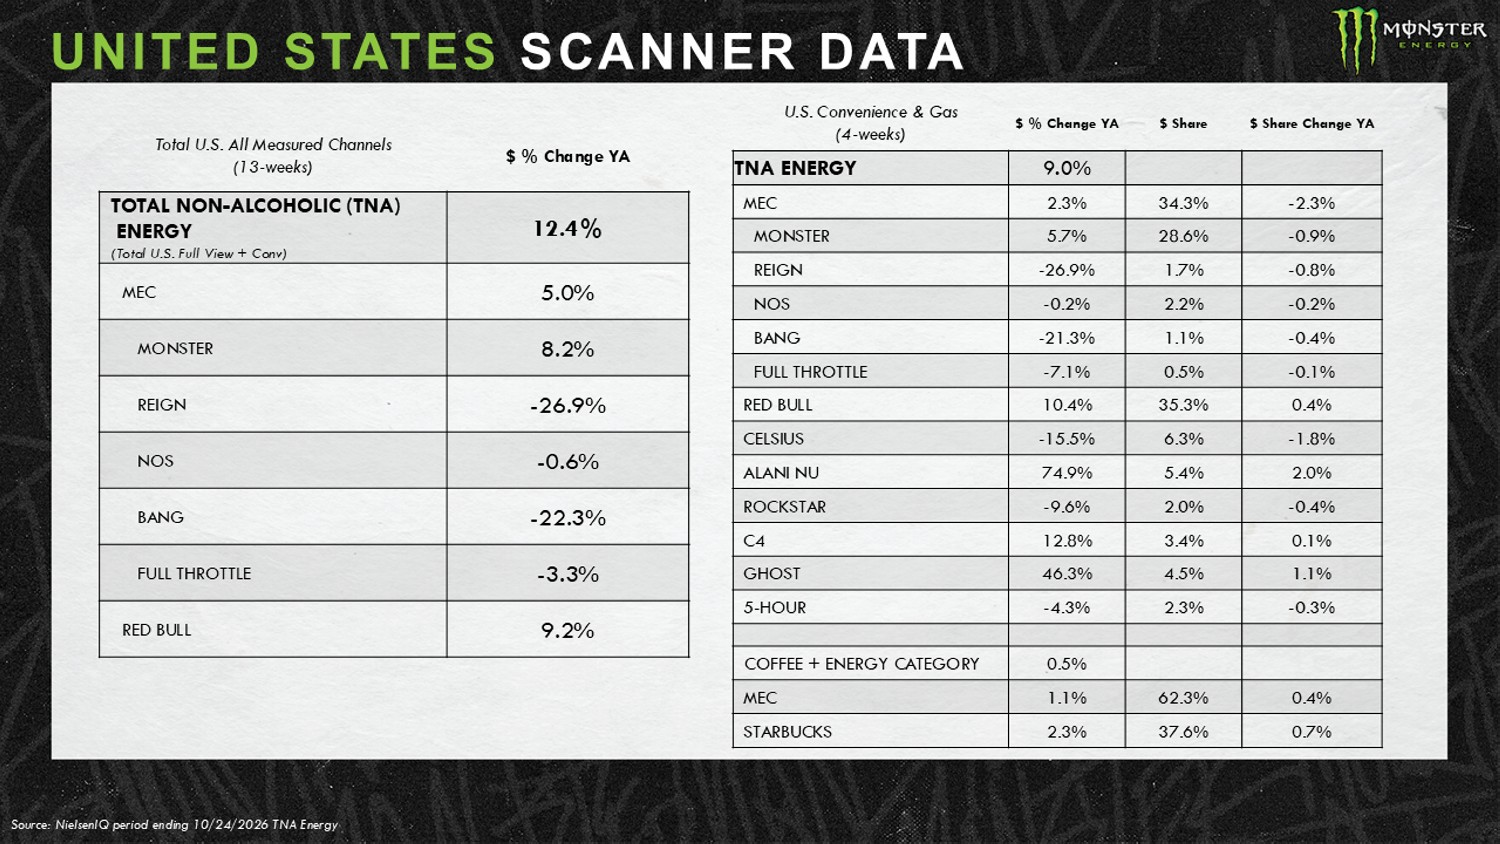
UNITED STATES SCANNER DATA Source: NielsenIQ p eriod ending 10 /24/2026 TNA Energy $ % Change YA Total U.S. All Measured Channels (13 - weeks) 12.4% TOTAL NON - ALCOHOLIC (TNA) ENERGY (Total U.S. Full View + Conv) 5.0% MEC 8.2% MONSTER - 26.9% REIGN - 0.6% NOS - 22.3% BANG - 3.3% FULL THROTTLE 9.2% RED BULL $ Share Change YA $ Share $ % Change YA U.S. Convenience & Gas (4 - weeks) 9.0% TNA ENERGY - 2.3% 34.3% 2.3% MEC - 0.9% 28.6% 5.7% MONSTER - 0.8% 1.7% - 26.9% REIGN - 0.2% 2.2% - 0.2% NOS - 0.4% 1.1% - 21.3% BANG - 0.1% 0.5% - 7.1% FULL THROTTLE 0.4% 35.3% 10.4% RED BULL - 1.8% 6.3% - 15.5% CELSIUS 2.0% 5.4% 74.9% ALANI NU - 0.4% 2.0% - 9.6% ROCKSTAR 0.1% 3.4% 12.8% C4 1.1% 4.5% 46.3% GHOST - 0.3% 2.3% - 4.3% 5 - HOUR 0.5% COFFEE + ENERGY CATEGORY 0.4% 62.3% 1.1% MEC 0.7% 37.6% 2.3% STARBUCKS
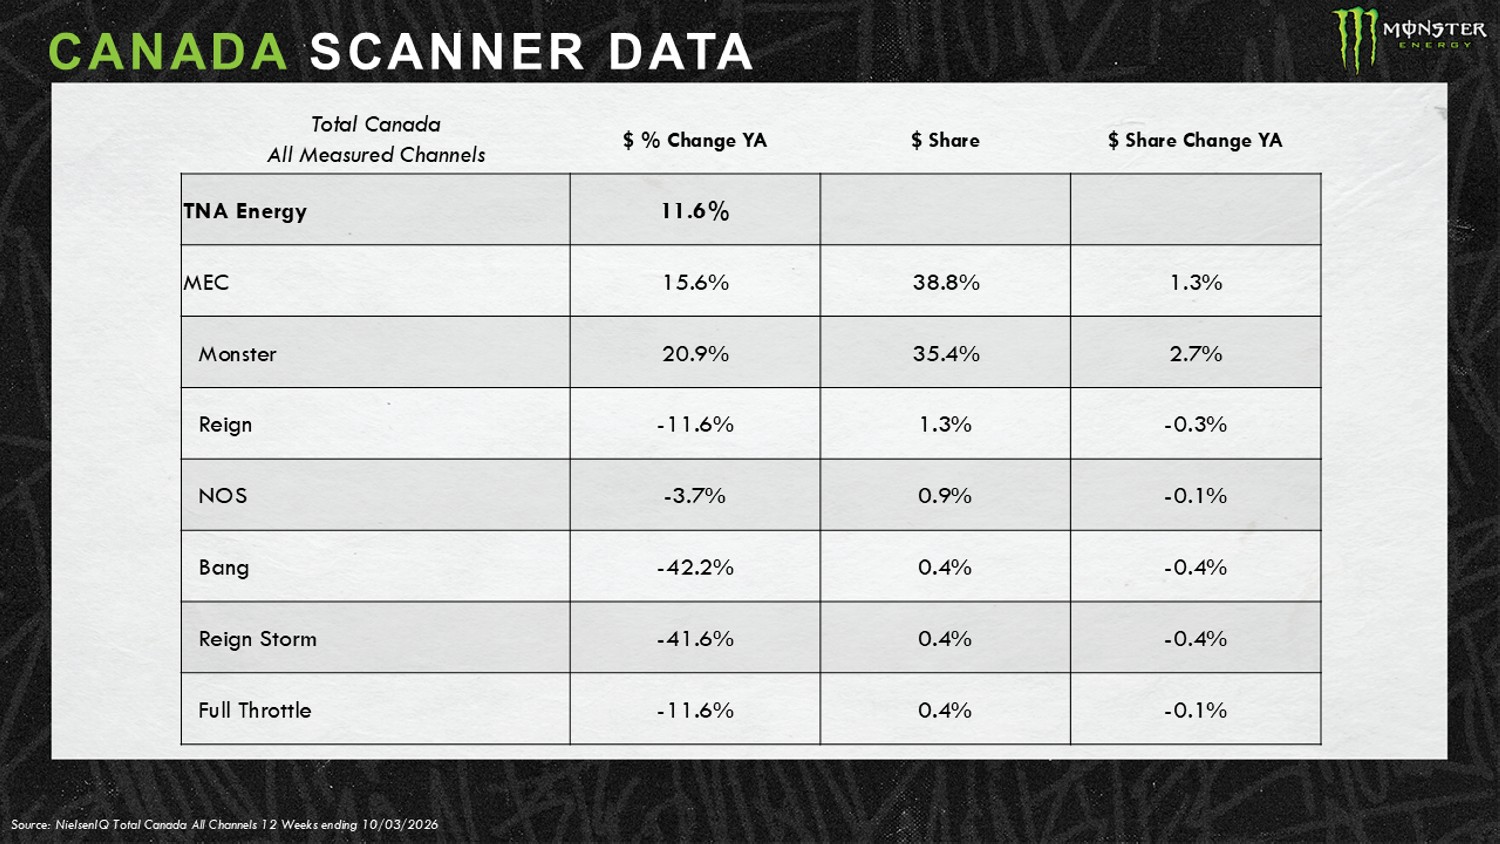
CANADA SCANNER DATA Source: NielsenIQ Total Canada All Channels 12 Weeks ending 10 /03/2026 $ Share Change YA $ Share $ % Change YA Total Canada All Measured Channels 11.6% TNA Energy 1.3% 38.8% 15.6% MEC 2.7% 35.4% 20.9% Monster - 0.3% 1.3% - 11.6% Reign - 0.1% 0.9% - 3.7% NOS - 0.4% 0.4% - 42.2% Bang - 0.4% 0.4% - 41.6% Reign Storm - 0.1% 0.4% - 11.6% Full Throttle
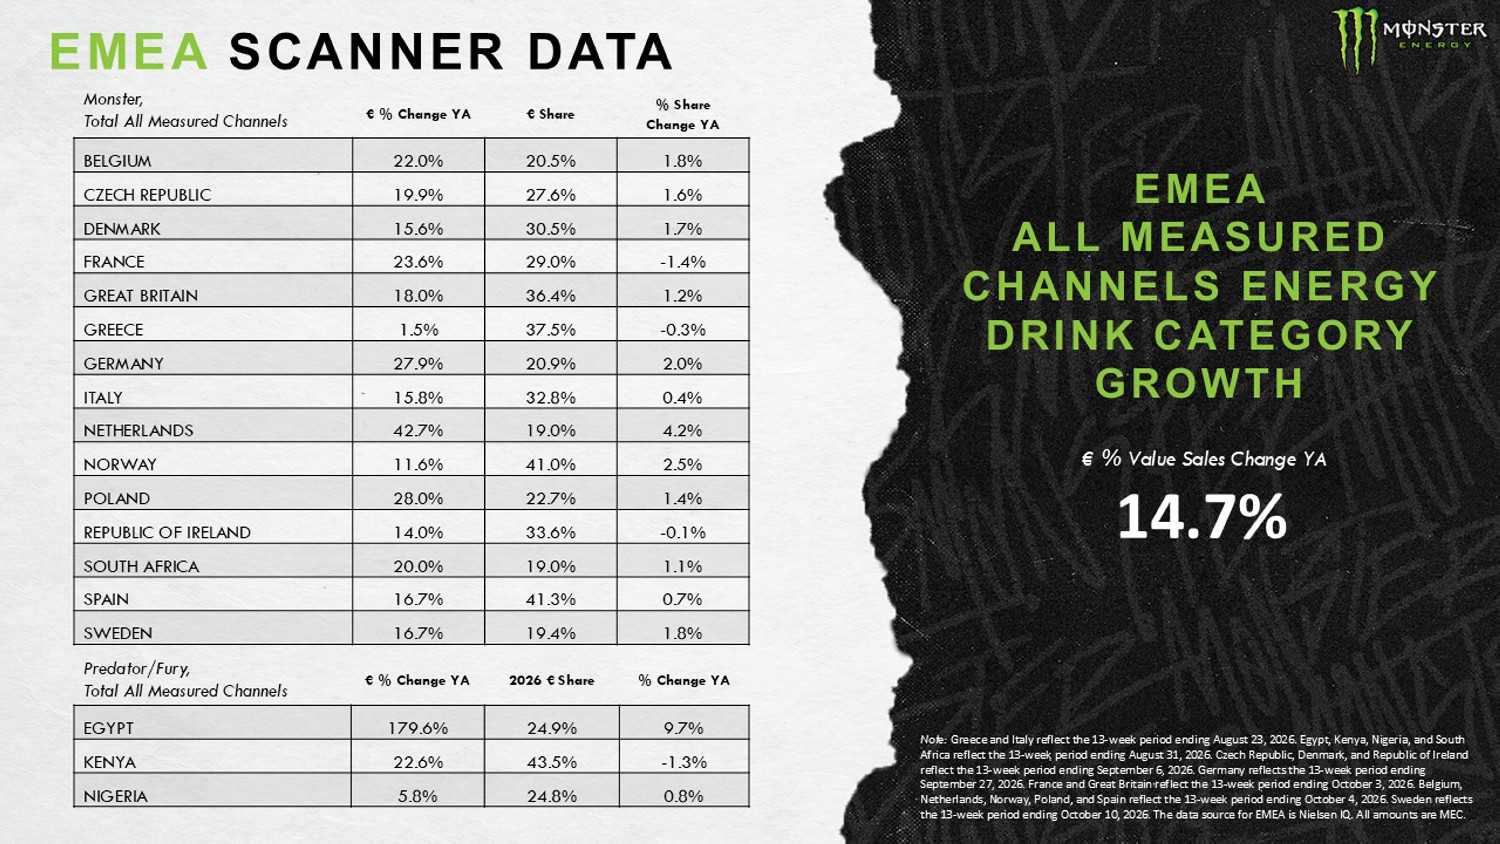
EMEA SCANNER DATA % Share Change YA € Share € % Change YA 1.8% 20.5% 22.0% BELGIUM 1.6% 27.6% 19.9% CZECH REPUBLIC 1.7% 30.5% 15.6% DENMARK - 1.4% 29.0% 23.6% FRANCE 1.2% 36.4% 18.0% GREAT BRITAIN - 0.3% 37.5% 1.5% GREECE 2.0% 20.9% 27.9% GERMANY 0.4% 32.8% 15.8% ITALY 4.2% 19.0% 42.7% NETHERLANDS 2.5% 41.0% 11.6% NORWAY 1.4% 22.7% 28.0% POLAND - 0.1% 33.6% 14.0% REPUBLIC OF IRELAND 1.1% 19.0% 20.0% SOUTH AFRICA 0.7% 41.3% 16.7% SPAIN 1.8% 19.4% 16.7% SWEDEN % Change YA 2026 € Share € % Change YA 9.7% 24.9% 179.6% EGYPT - 1.3% 43.5% 22.6% KENYA 0.8% 24.8% 5.8% NIGERIA Note: Greece and Italy reflect the 13 - week period ending August 23, 2026. Egypt, Kenya, Nigeria, and South Africa reflect the 13 - week period ending August 31, 2026. Czech Republic, Denmark, and Republic of Ireland reflect the 13 - week period ending September 6, 2026. Germany reflects the 13 - week period ending September 27, 2026. France and Great Britain reflect the 13 - week period ending October 3, 2026. Belgium, Netherlands, Norway, Poland, and Spain reflect the 13 - week period ending October 4, 2026. Sweden reflects the 13 - week period ending October 10, 2026. The data source for EMEA is Nielsen IQ. All amounts are MEC. EMEA ALL MEASURED CHANNELS ENERGY DRINK CATEGORY GROWTH € % Value Sales Change YA Monster, Total All Measured Channels Predator/Fury, Total All Measured Channels 14.7 %
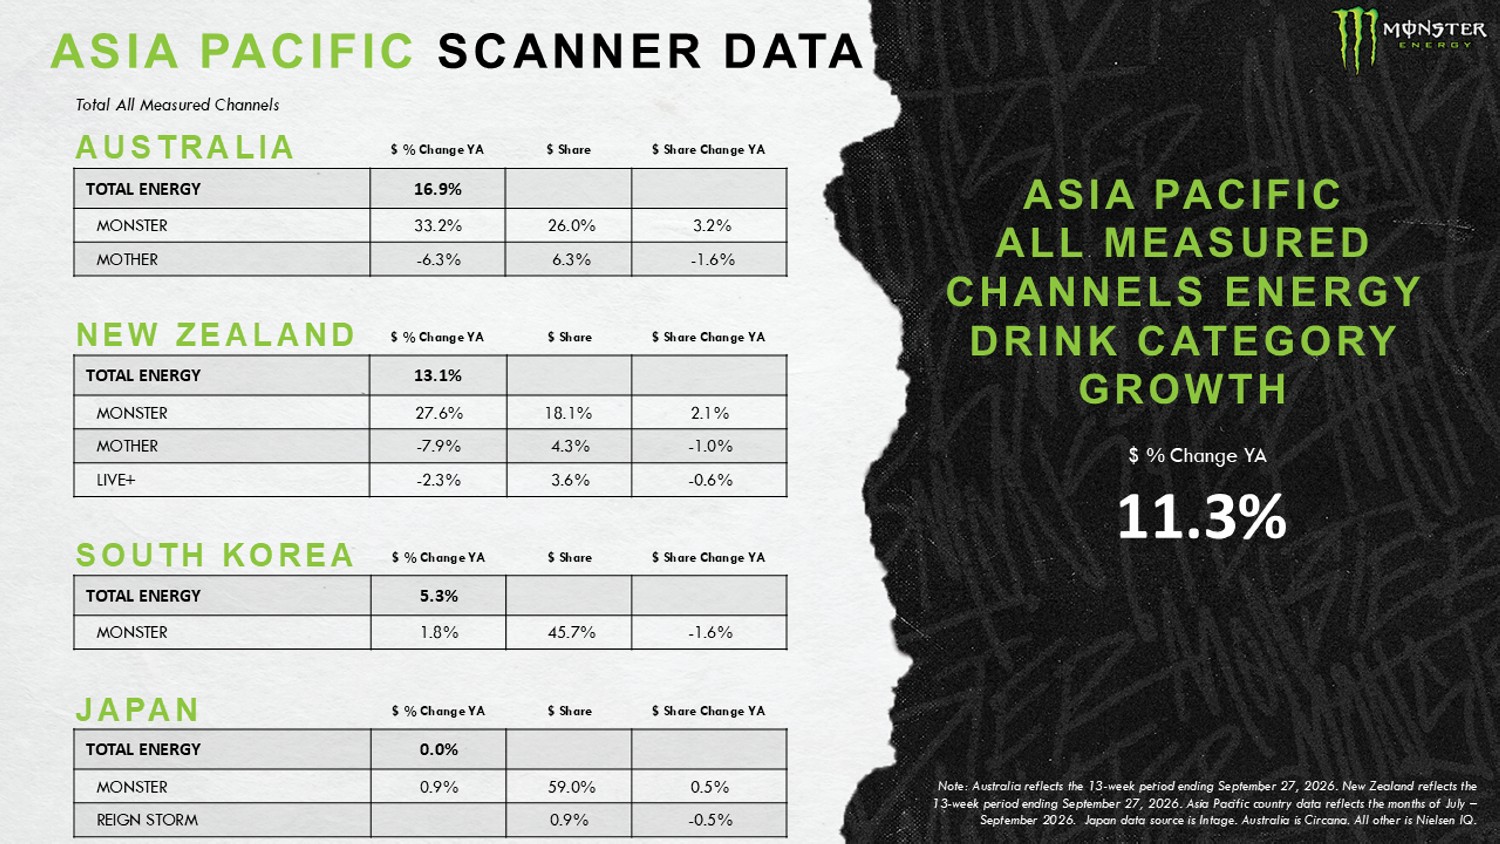
ASIA PACIFIC SCANNER DATA Note: Australia reflects the 13 - week period ending September 27, 2026. New Zealand reflects the 13 - week period ending September 27, 2026. Asia Pacific country data reflects the months of July – September 2026. Japan data source is Intage . Australia is Circana . All other is Nielsen IQ. 11 .3% $ % Change YA ASIA PACIFIC ALL MEASURED CHANNELS ENERGY DRINK CATEGORY GROWTH $ Share Change YA $ Share $ % Change YA 16.9% TOTAL ENERGY 3.2% 26.0% 33.2% MONSTER - 1.6% 6.3% - 6.3% MOTHER AUSTRALIA $ Share Change YA $ Share $ % Change YA 13.1% TOTAL ENERGY 2.1% 18.1% 27.6% MONSTER - 1.0% 4.3% - 7.9% MOTHER - 0.6% 3.6% - 2.3% LIVE+ $ Share Change YA $ Share $ % Change YA 0.0% TOTAL ENERGY 0.5% 59.0% 0.9% MONSTER - 0.5% 0.9% REIGN STORM $ Share Change YA $ Share $ % Change YA 5.3% TOTAL ENERGY - 1.6% 45.7% 1.8% MONSTER NEW ZEALAND SOUTH KOREA JAPAN Total All Measured Channels
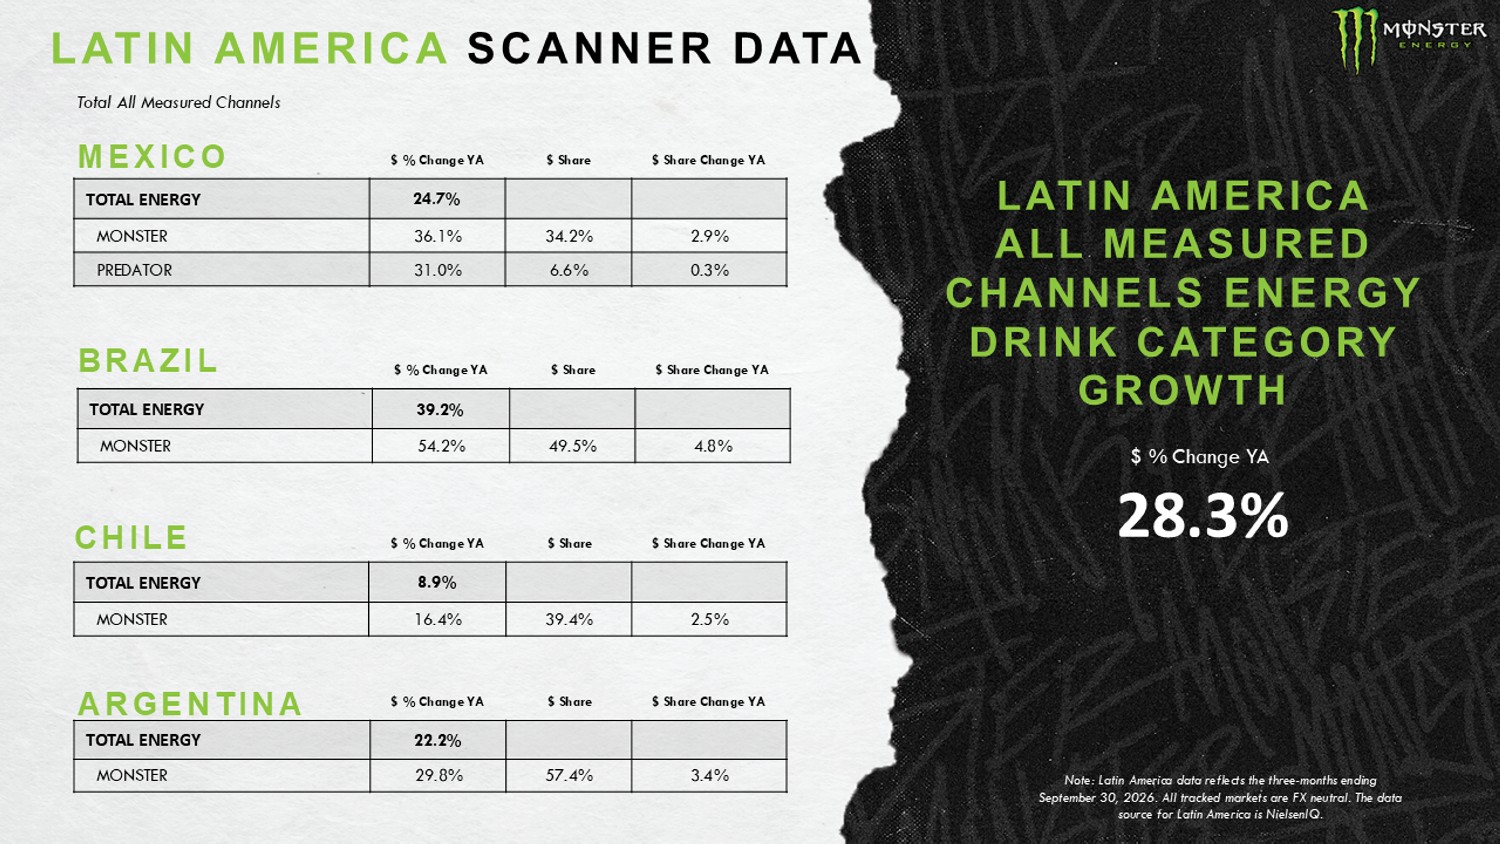
LATIN AMERICA SCANNER DATA 28.3% $ % Change YA LATIN AMERICA ALL MEASURED CHANNELS ENERGY DRINK CATEGORY GROWTH $ Share Change YA $ Share $ % Change YA 24.7% TOTAL ENERGY 2.9% 34.2% 36.1% MONSTER 0.3% 6.6% 31.0% PREDATOR MEXICO $ Share Change YA $ Share $ % Change YA 22.2% TOTAL ENERGY 3.4 % 57.4% 29.8% MONSTER $ Share Change YA $ Share $ % Change YA 8.9% TOTAL ENERGY 2.5% 39.4% 16.4% MONSTER CHILE ARGENTINA Total All Measured Channels $ Share Change YA $ Share $ % Change YA 39.2% TOTAL ENERGY 4.8% 49.5% 54.2% MONSTER BRAZIL Note: Latin America data reflects the three - months ending September 30, 2026. All tracked markets are FX neutral. The data source for Latin America is NielsenIQ .