Q3 2026 Financial Results and Commentary November 5, 2026
Cautionary Statements & Disclosures This presentation and the accompanying oral presentation contain “forward-looking” statements that are based on our management’s beliefs and assumptions, including statements regarding dividends and capital return, demand and market trends, strategy and competitive positioning, financial performance and profitability, supply chain management, and 2026 financial guidance and long-term financial targets. Forward-looking statements are subject to known and unknown risks and uncertainties and are based on assumptions that may prove to be incorrect, which could cause actual results to differ materially from those expected or implied by the forward-looking statements. Factors that may cause actual results to differ include any unforeseen need for capital which may require us to divert funds we may have otherwise used for the dividend program or stock repurchase program, which may in turn negatively impact our ability to administer the quarterly dividends or the repurchase of our common stock; a significant decline in global macroeconomic or political conditions that have an adverse impact on our business and financial results; an expansion of adversarial global trade dynamics or other changes to international trade regulations; business interruptions related to our supply chain; our ability to manage our business and expenses if customers cancel or delay orders; execution risks related to closing key deals and improving our execution; the continued market adoption of our products; our ability to successfully anticipate market needs and opportunities; our timely development of new products and features; our ability to achieve or maintain profitability; any loss or delay of expected purchases by our largest end-customers; our ability to maintain or improve our competitive position; competitive and execution risks related to cloud-based computing trends; our ability to attract and retain new end-customers and our largest end-consumers; our ability to maintain and enhance our brand and reputation; changes demanded by our customers in the deployment and payment model for our products; continued growth in markets relating to network security; the success of any future acquisitions or investments in complementary companies, products, services or technologies; the ability of our sales team to execute well; our ability to shorten our close cycles; the ability of our channel partners to sell our products; variations in product mix or geographic locations of our sales; risks associated with our presence in international markets; weaknesses or deficiencies in our internal control over financial reporting; our ability to timely file periodic reports required to be filed under the Securities Exchange Act of 1934; and other risks that are described in “Risk Factors” in our periodic filings with the Securities and Exchange Commission, including our Form 10-K filed with the Securities and Exchange Commission on February 25, 2026. We do not intend to update or alter our forward-looking statements, whether as a result of new information, future events or otherwise, except as required by applicable law. This presentation and the accompanying oral presentation also include certain non-GAAP financial measures including non-GAAP net income, non-GAAP net income per basic and diluted share (or non-GAAP EPS), non-GAAP gross profit and gross margin, non-GAAP operating expenses, non-GAAP operating income and operating margin, Adjusted EBITDA and Adjusted EBITDA margin. Non-GAAP financial measures do not have any standardized meaning and are therefore unlikely to be comparable to similarly titles measures presented by other companies. A10 Networks considers these non-GAAP financial measures to be important because they provide useful measures of the operating performance of the company by excluding certain items that, while they may recur, can vary significantly in amount and timing or are not directly indicative of ongoing operational trends, and are used by the company’s management to evaluate operating performance, prepare budgets and forecasts, and assess performance relative to peer companies. Non-GAAP financial measures should not be considered in isolation from, or as a substitute for, financial information prepared in accordance with GAAP. We define non-GAAP net income as our GAAP net income excluding: (i) stock-based compensation and related payroll tax, (ii) acquisition-related expense, (iii) amortization of acquired intangible assets, (iv) amortization of debt issuance costs, (v) certain legal expense, (vi) tax planning expense and (vii) income tax effect of non-GAAP items (i) to (vi) listed above. We define non-GAAP net income per basic and diluted share as our non-GAAP net income divided by our basic and diluted weighted- average shares outstanding. We define non-GAAP gross profit as our GAAP gross profit excluding (i) stock-based compensation and related payroll tax and (ii) amortization of acquired intangible assets. We define non-GAAP gross margin as our non-GAAP gross profit divided by our GAAP revenue. We define non-GAAP operating expense as our GAAP operating expense excluding (i) stock-based compensation and related payroll tax, (ii) acquisition-related expense, (iii) amortization of acquired intangible assets, (iv) certain legal expense and (v) tax planning expense. We define non-GAAP operating income as our GAAP income from operations excluding (i) stock-based compensation and related payroll tax, (ii) acquisition-related expense, (iii) amortization of acquired intangible assets, (iv) certain legal expense and (v) tax planning expense. We define non-GAAP operating margin as our non-GAAP operating income divided by our GAAP revenue. We define Adjusted EBITDA as our GAAP net income excluding (i) interest and other income, net, (ii) depreciation and amortization expense, (iii) provision for income taxes, (iv) stock-based compensation and related payroll tax, (v) acquisition-related expense, (vi) certain legal expense and (vii) tax planning expense. We define Adjusted EBITDA margin as our Adjusted EBITDA divided by our GAAP revenue. Non-GAAP financial measures are presented for supplemental informational purposes only for understanding the company's operating results.
Agenda Q3 and YTD 2026 Overview 2026 Outlook
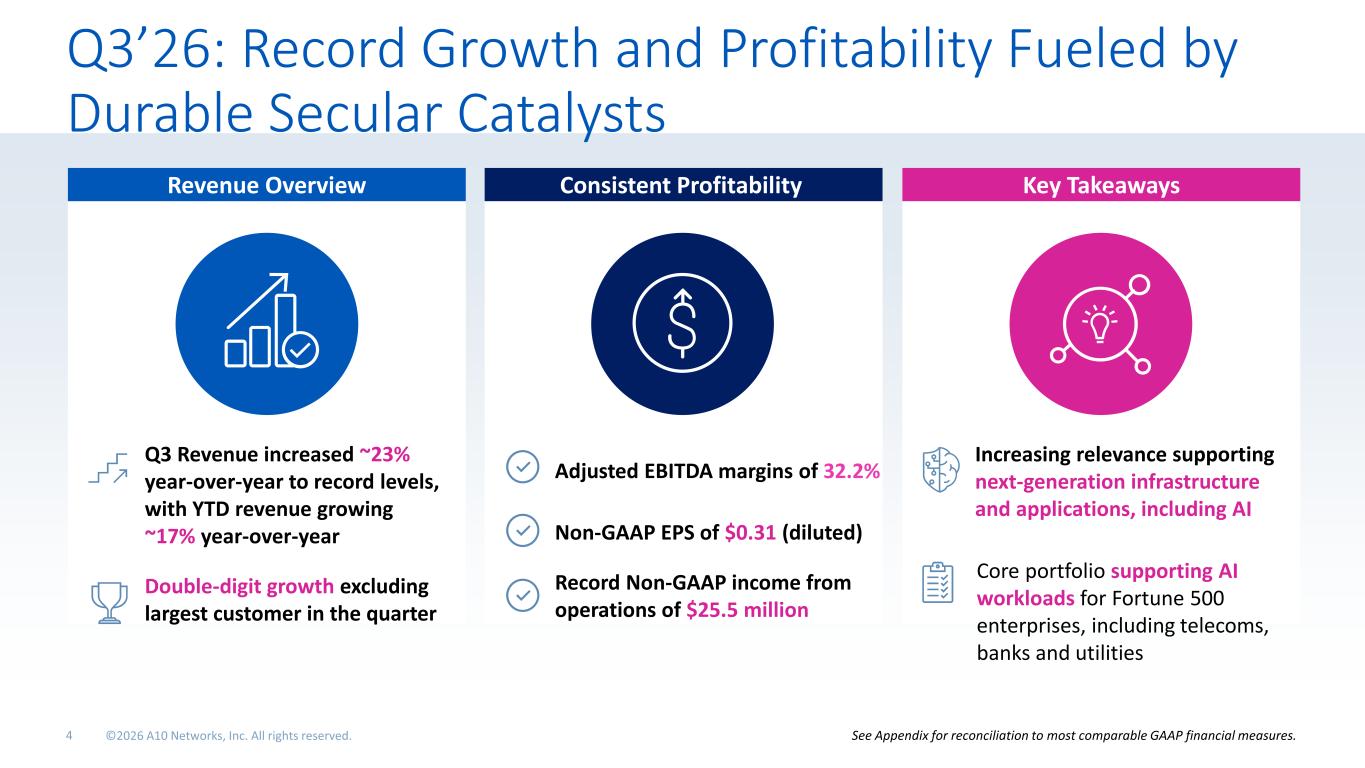
Q3’26: Record Growth and Profitability Fueled by Durable Secular Catalysts Consistent Profitability Key TakeawaysRevenue Overview Q3 Revenue increased ~23% year-over-year to record levels, with YTD revenue growing ~17% year-over-year Double-digit growth excluding largest customer in the quarter Adjusted EBITDA margins of 32.2% Non-GAAP EPS of $0.31 (diluted) Record Non-GAAP income from operations of $25.5 million Increasing relevance supporting next-generation infrastructure and applications, including AI See Appendix for reconciliation to most comparable GAAP financial measures. Core portfolio supporting AI workloads for Fortune 500 enterprises, including telecoms, banks and utilities
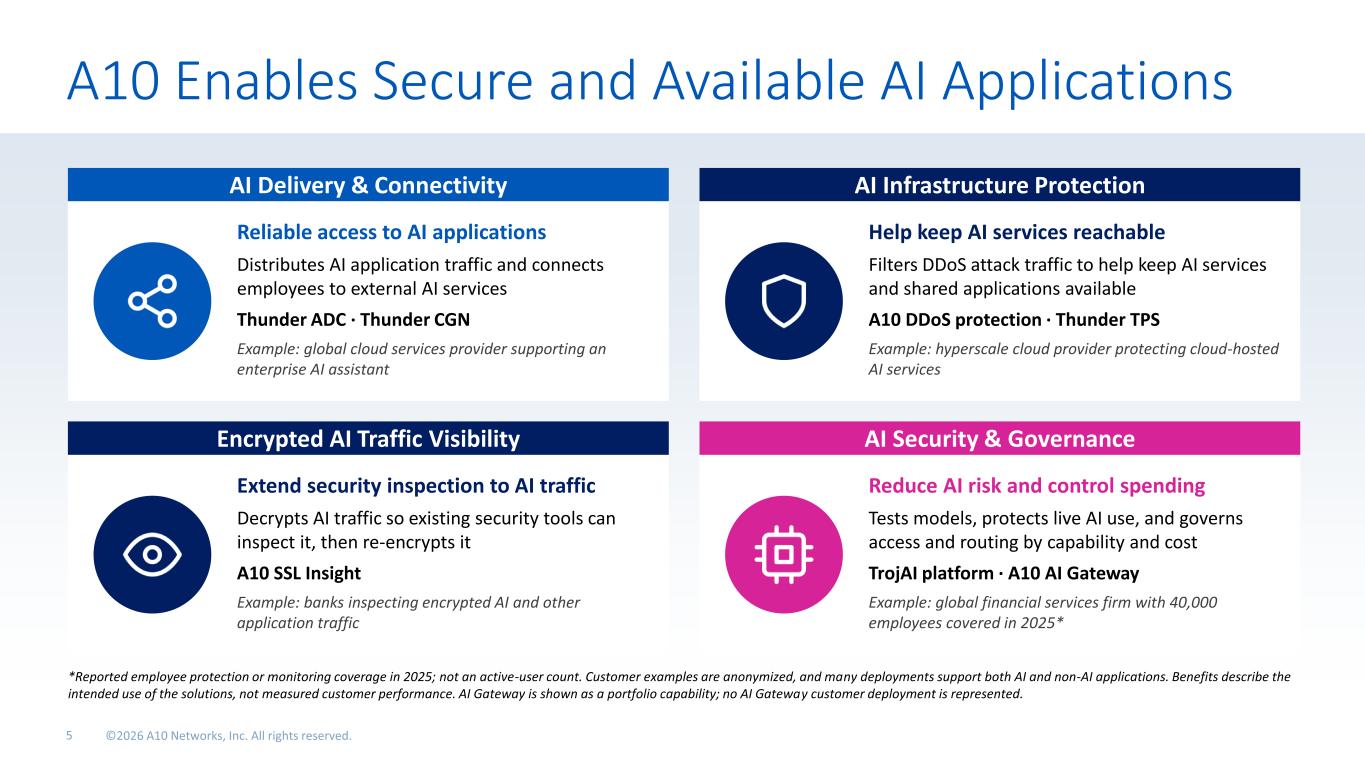
A10 Enables Secure and Available AI Applications AI Delivery & Connectivity Reliable access to AI applications Distributes AI application traffic and connects employees to external AI services Thunder ADC · Thunder CGN Example: global cloud services provider supporting an enterprise AI assistant AI Infrastructure Protection Help keep AI services reachable Filters DDoS attack traffic to help keep AI services and shared applications available A10 DDoS protection · Thunder TPS Example: hyperscale cloud provider protecting cloud-hosted AI services Encrypted AI Traffic Visibility Extend security inspection to AI traffic Decrypts AI traffic so existing security tools can inspect it, then re-encrypts it A10 SSL Insight Example: banks inspecting encrypted AI and other application traffic AI Security & Governance Reduce AI risk and control spending Tests models, protects live AI use, and governs access and routing by capability and cost TrojAI platform · A10 AI Gateway Example: global financial services firm with 40,000 employees covered in 2025* *Reported employee protection or monitoring coverage in 2025; not an active-user count. Customer examples are anonymized, and many deployments support both AI and non-AI applications. Benefits describe the intended use of the solutions, not measured customer performance. AI Gateway is shown as a portfolio capability; no AI Gateway customer deployment is represented.
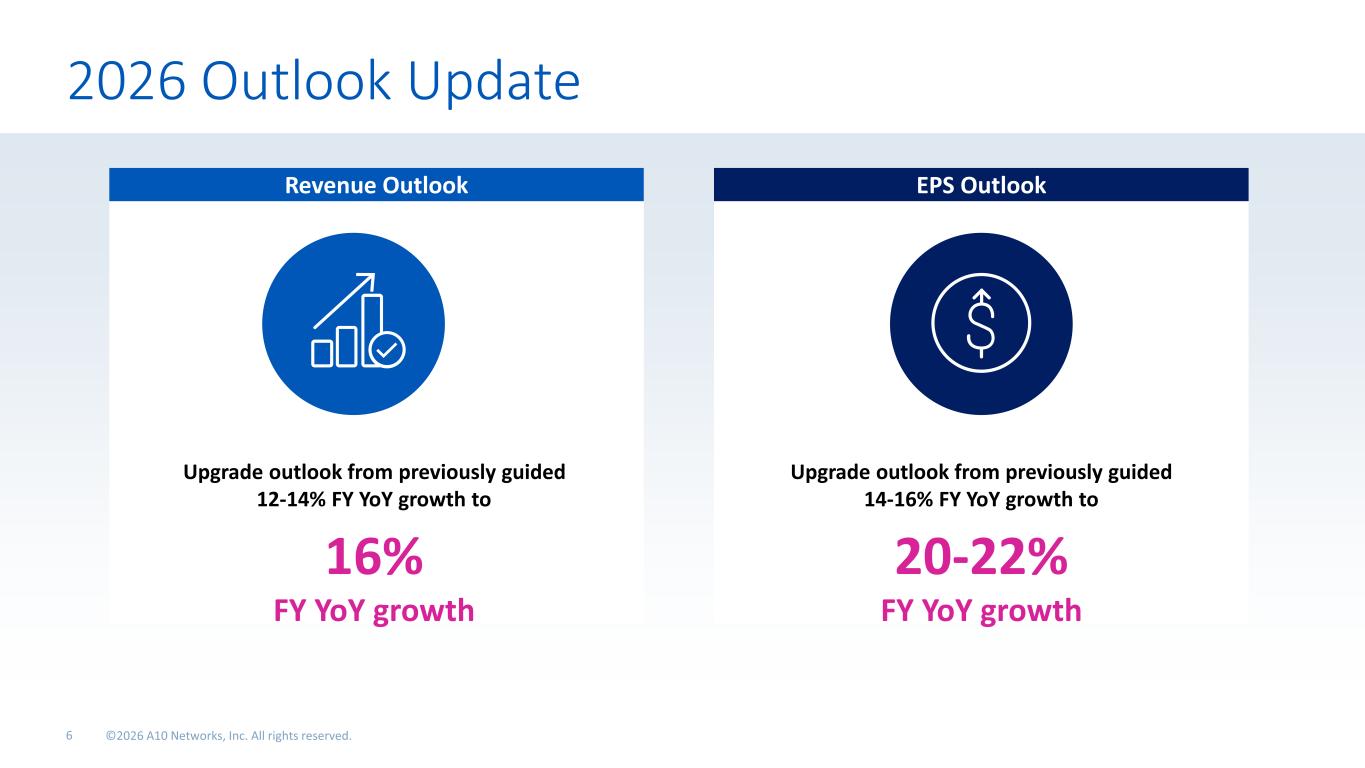
2026 Outlook Update Revenue Outlook EPS Outlook Upgrade outlook from previously guided 12-14% FY YoY growth to 16% FY YoY growth Upgrade outlook from previously guided 14-16% FY YoY growth to 20-22% FY YoY growth
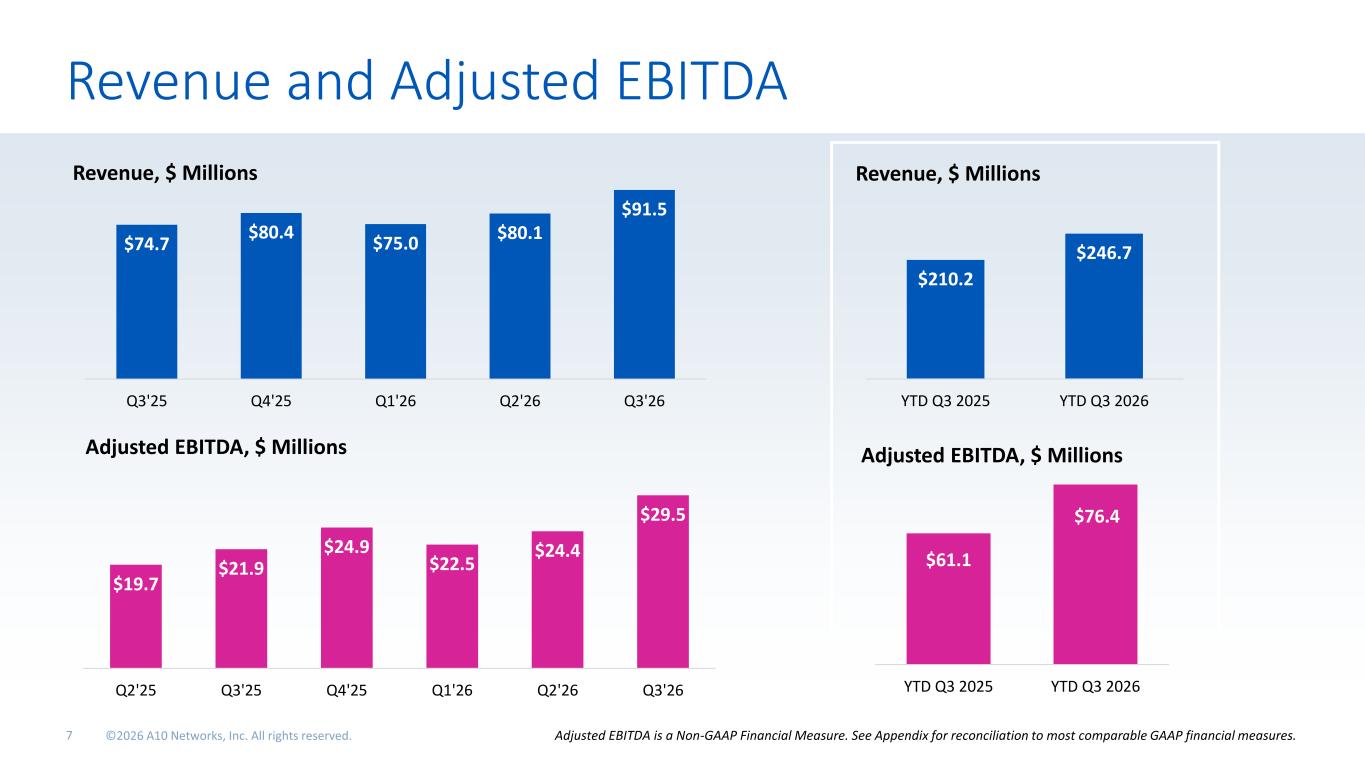
Revenue and Adjusted EBITDA $74.7 $80.4 $75.0 $80.1 $91.5 Q3'25 Q4'25 Q1'26 Q2'26 Q3'26 Revenue, $ Millions $19.7 $21.9 $24.9 $22.5 $24.4 $29.5 Q2'25 Q3'25 Q4'25 Q1'26 Q2'26 Q3'26 Adjusted EBITDA, $ Millions $210.2 $246.7 YTD Q3 2025 YTD Q3 2026 Revenue, $ Millions $61.1 $76.4 YTD Q3 2025 YTD Q3 2026 Adjusted EBITDA is a Non-GAAP Financial Measure. See Appendix for reconciliation to most comparable GAAP financial measures. Adjusted EBITDA, $ Millions
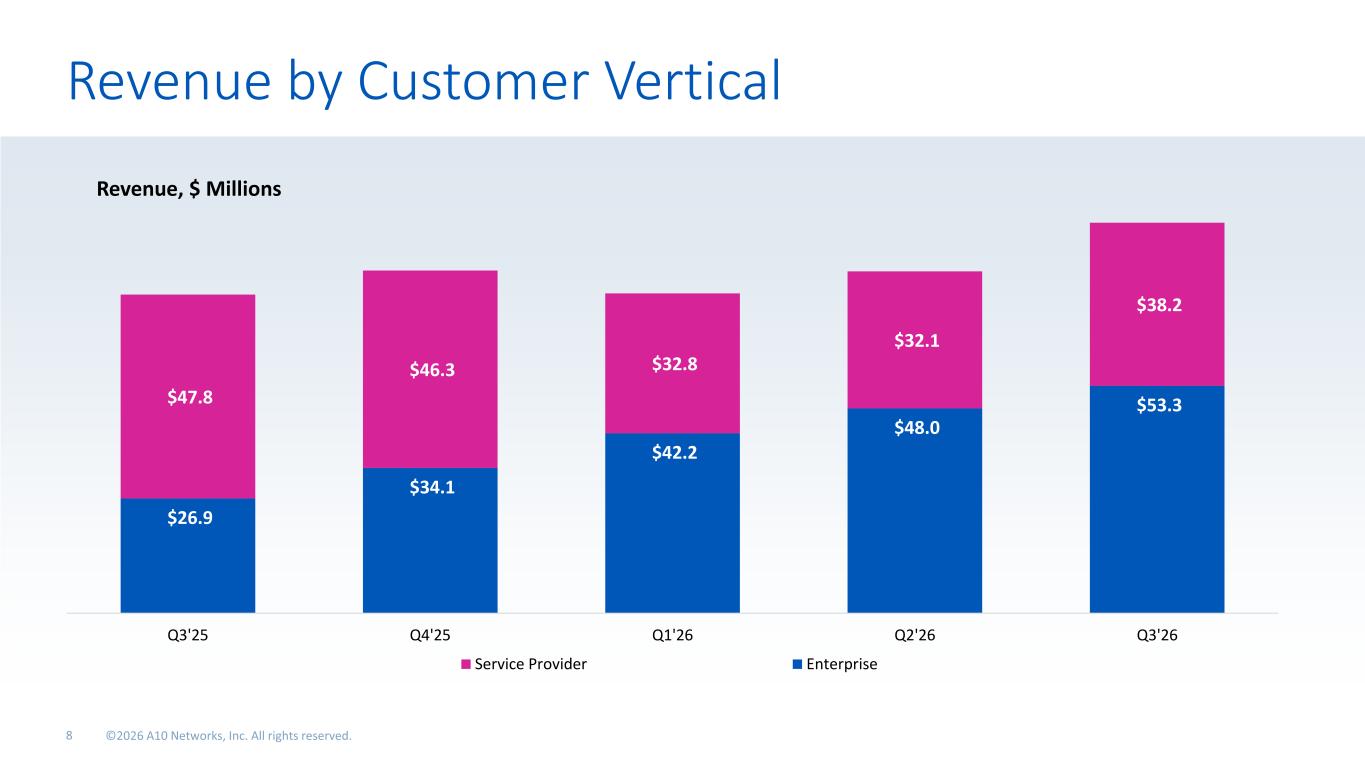
Revenue by Customer Vertical $26.9 $34.1 $42.2 $48.0 $53.3 $47.8 $46.3 $32.8 $32.1 $38.2 Q3'25 Q4'25 Q1'26 Q2'26 Q3'26 Revenue, $ Millions Service Provider Enterprise
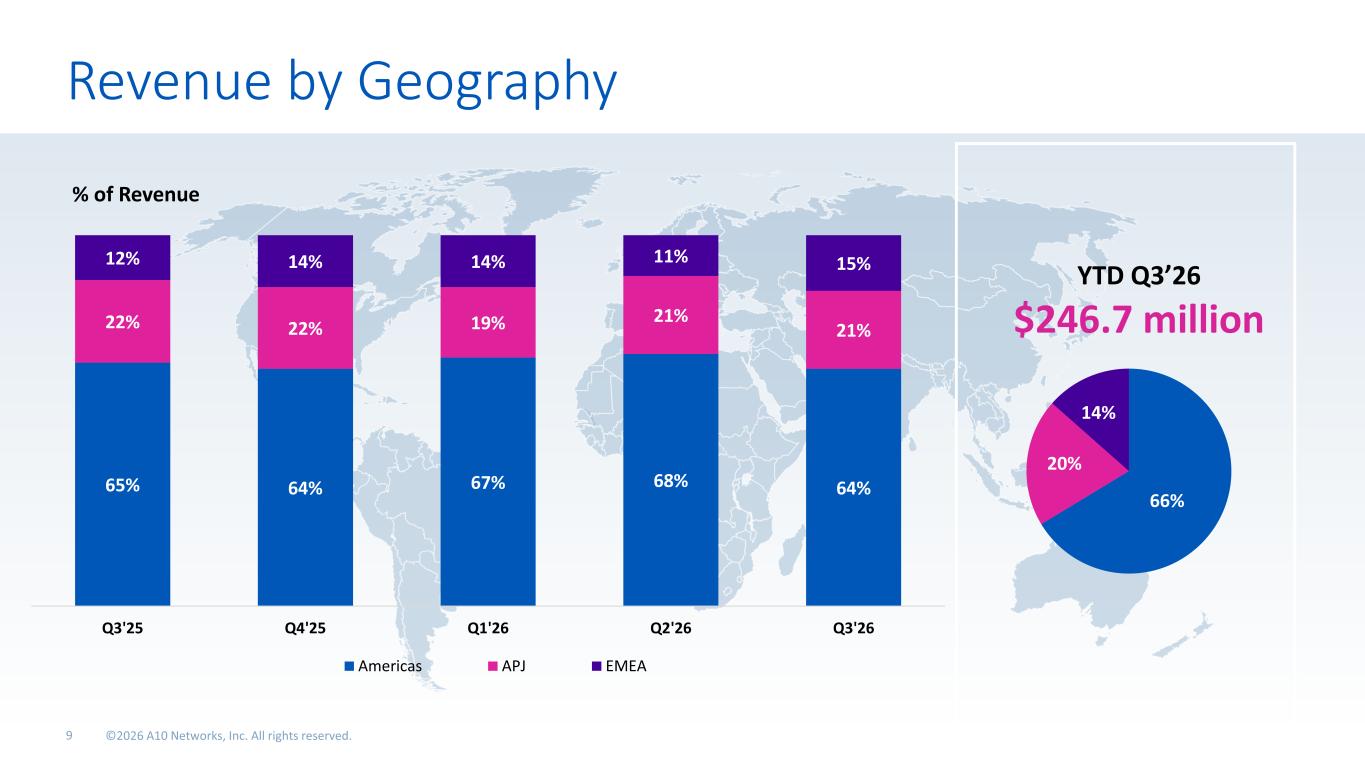
Revenue by Geography 65% 64% 67% 68% 64% 22% 22% 19% 21% 21% 12% 14% 14% 11% 15% Q3'25 Q4'25 Q1'26 Q2'26 Q3'26 % of Revenue Americas APJ EMEA 66% 20% 14% YTD Q3’26 $246.7 million
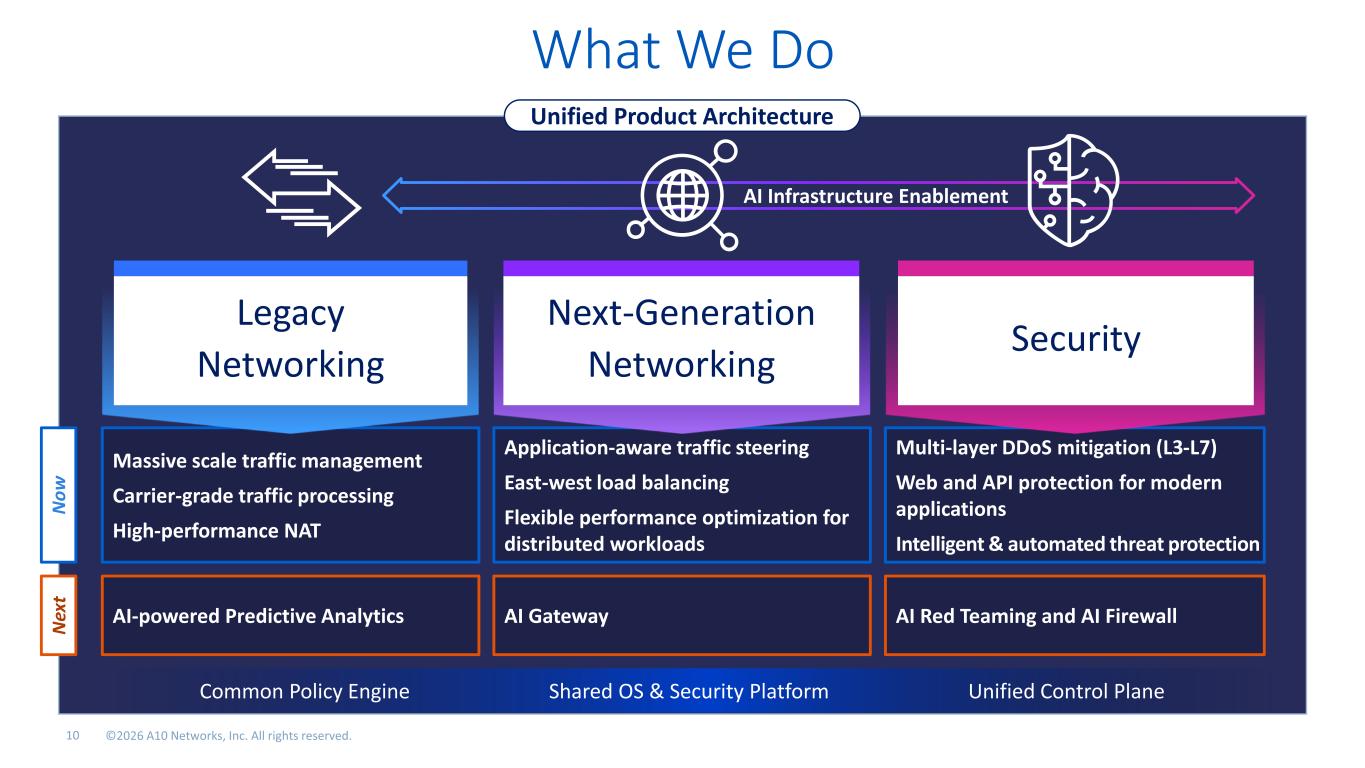
Unified Product Architecture What We Do AI Infrastructure Enablement Massive scale traffic management Carrier-grade traffic processing High-performance NAT Application-aware traffic steering East-west load balancing Flexible performance optimization for distributed workloads Multi-layer DDoS mitigation (L3-L7) Web and API protection for modern applications Intelligent & automated threat protection N o w Security Next-Generation Networking Legacy Networking AI Gateway AI Red Teaming and AI FirewallAI-powered Predictive Analytics N ex t Common Policy Engine Shared OS & Security Platform Unified Control Plane
Consistent Value Creation Business Model Revenue Growth Capital Allocation

Thank You

A10Networks.com

Appendix
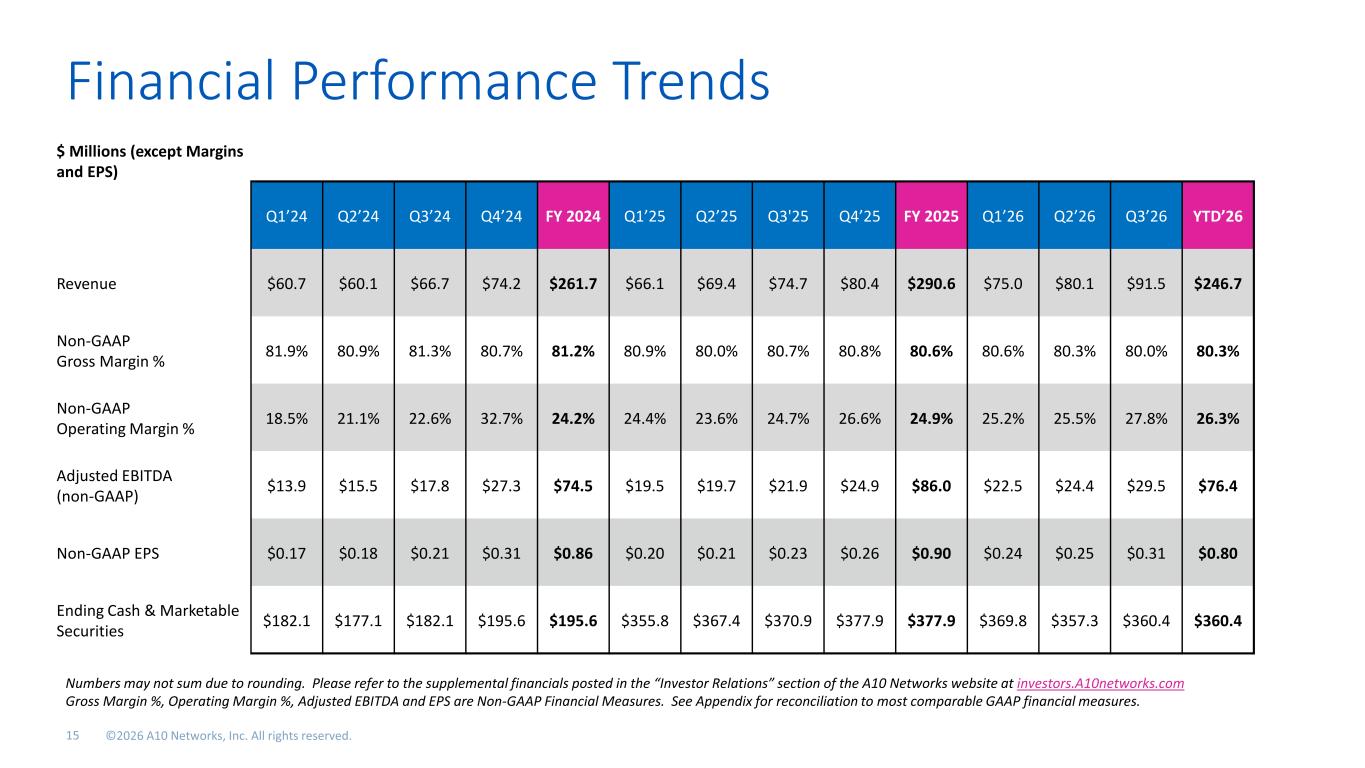
Financial Performance Trends Numbers may not sum due to rounding. Please refer to the supplemental financials posted in the “Investor Relations” section of the A10 Networks website at investors.A10networks.com Gross Margin %, Operating Margin %, Adjusted EBITDA and EPS are Non-GAAP Financial Measures. See Appendix for reconciliation to most comparable GAAP financial measures. $ Millions (except Margins and EPS) Q1’24 Q2’24 Q3’24 Q4’24 FY 2024 Q1’25 Q2’25 Q3'25 Q4’25 FY 2025 Q1’26 Q2’26 Q3’26 YTD’26 Revenue $60.7 $60.1 $66.7 $74.2 $261.7 $66.1 $69.4 $74.7 $80.4 $290.6 $75.0 $80.1 $91.5 $246.7 Non-GAAP Gross Margin % 81.9% 80.9% 81.3% 80.7% 81.2% 80.9% 80.0% 80.7% 80.8% 80.6% 80.6% 80.3% 80.0% 80.3% Non-GAAP Operating Margin % 18.5% 21.1% 22.6% 32.7% 24.2% 24.4% 23.6% 24.7% 26.6% 24.9% 25.2% 25.5% 27.8% 26.3% Adjusted EBITDA (non-GAAP) $13.9 $15.5 $17.8 $27.3 $74.5 $19.5 $19.7 $21.9 $24.9 $86.0 $22.5 $24.4 $29.5 $76.4 Non-GAAP EPS $0.17 $0.18 $0.21 $0.31 $0.86 $0.20 $0.21 $0.23 $0.26 $0.90 $0.24 $0.25 $0.31 $0.80 Ending Cash & Marketable Securities $182.1 $177.1 $182.1 $195.6 $195.6 $355.8 $367.4 $370.9 $377.9 $377.9 $369.8 $357.3 $360.4 $360.4
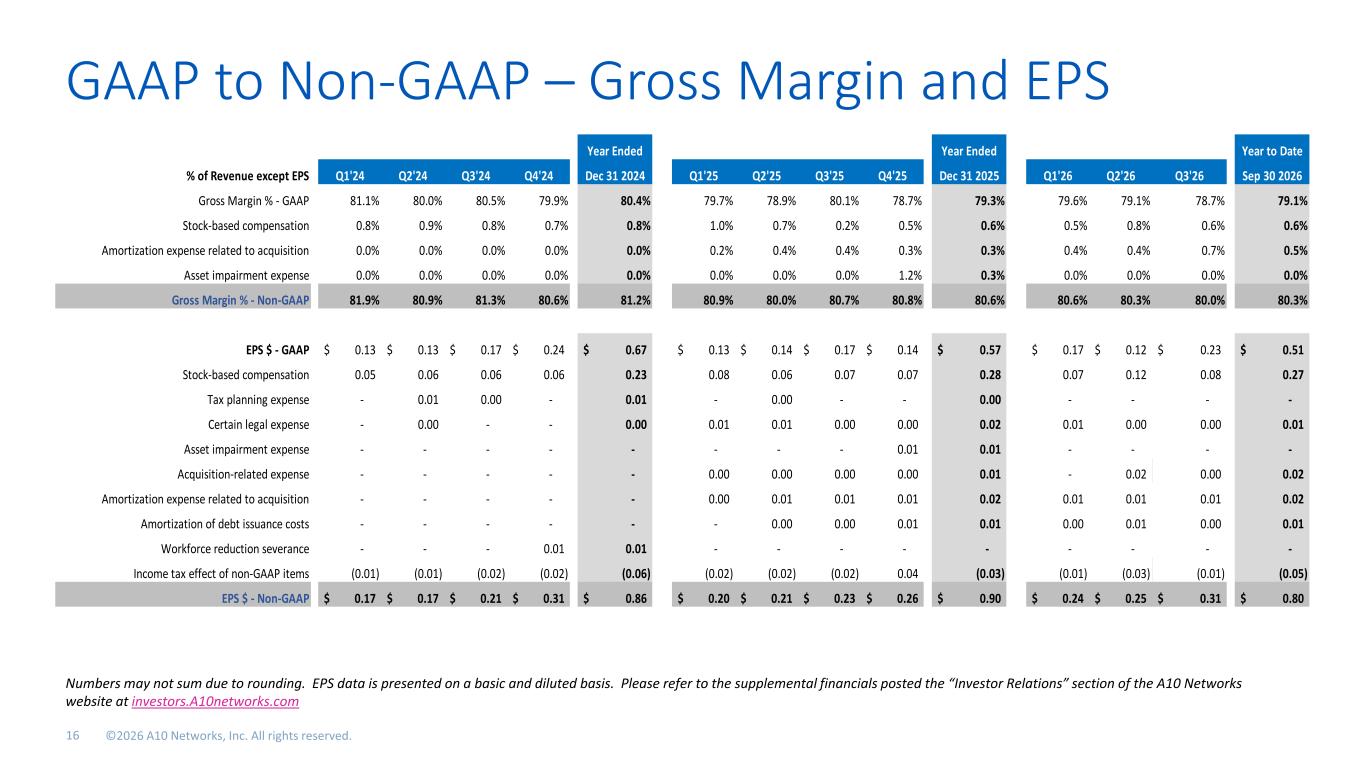
GAAP to Non-GAAP – Gross Margin and EPS Numbers may not sum due to rounding. EPS data is presented on a basic and diluted basis. Please refer to the supplemental financials posted the “Investor Relations” section of the A10 Networks website at investors.A10networks.com. Year Ended Year Ended Year to Date % of Revenue except EPS Q1'24 Q2'24 Q3'24 Q4'24 Dec 31 2024 Q1'25 Q2'25 Q3'25 Q4'25 Dec 31 2025 Q1'26 Q2'26 Q3'26 Sep 30 2026 Gross Margin % - GAAP 81.1% 80.0% 80.5% 79.9% 80.4% 79.7% 78.9% 80.1% 78.7% 79.3% 79.6% 79.1% 78.7% 79.1% Stock-based compensation 0.8% 0.9% 0.8% 0.7% 0.8% 1.0% 0.7% 0.2% 0.5% 0.6% 0.5% 0.8% 0.6% 0.6% Amortization expense related to acquisition 0.0% 0.0% 0.0% 0.0% 0.0% 0.2% 0.4% 0.4% 0.3% 0.3% 0.4% 0.4% 0.7% 0.5% Asset impairment expense 0.0% 0.0% 0.0% 0.0% 0.0% 0.0% 0.0% 0.0% 1.2% 0.3% 0.0% 0.0% 0.0% 0.0% Gross Margin % - Non-GAAP 81.9% 80.9% 81.3% 80.6% 81.2% 80.9% 80.0% 80.7% 80.8% 80.6% 80.6% 80.3% 80.0% 80.3% EPS $ - GAAP 0.13$ 0.13$ 0.17$ 0.24$ 0.67$ 0.13$ 0.14$ 0.17$ 0.14$ 0.57$ 0.17$ 0.12$ 0.23$ 0.51$ Stock-based compensation 0.05 0.06 0.06 0.06 0.23 0.08 0.06 0.07 0.07 0.28 0.07 0.12 0.08 0.27 Tax planning expense - 0.01 0.00 - 0.01 - 0.00 - - 0.00 - - - - Certain legal expense - 0.00 - - 0.00 0.01 0.01 0.00 0.00 0.02 0.01 0.00 0.00 0.01 Asset impairment expense - - - - - - - - 0.01 0.01 - - - - Acquisition-related expense - - - - - 0.00 0.00 0.00 0.00 0.01 - 0.02 0.00 0.02 Amortization expense related to acquisition - - - - - 0.00 0.01 0.01 0.01 0.02 0.01 0.01 0.01 0.02 Amortization of debt issuance costs - - - - - - 0.00 0.00 0.01 0.01 0.00 0.01 0.00 0.01 Workforce reduction severance - - - 0.01 0.01 - - - - - - - - - Income tax effect of non-GAAP items (0.01) (0.01) (0.02) (0.02) (0.06) (0.02) (0.02) (0.02) 0.04 (0.03) (0.01) (0.03) (0.01) (0.05) EPS $ - Non-GAAP 0.17$ 0.17$ 0.21$ 0.31$ 0.86$ 0.20$ 0.21$ 0.23$ 0.26$ 0.90$ 0.24$ 0.25$ 0.31$ 0.80$
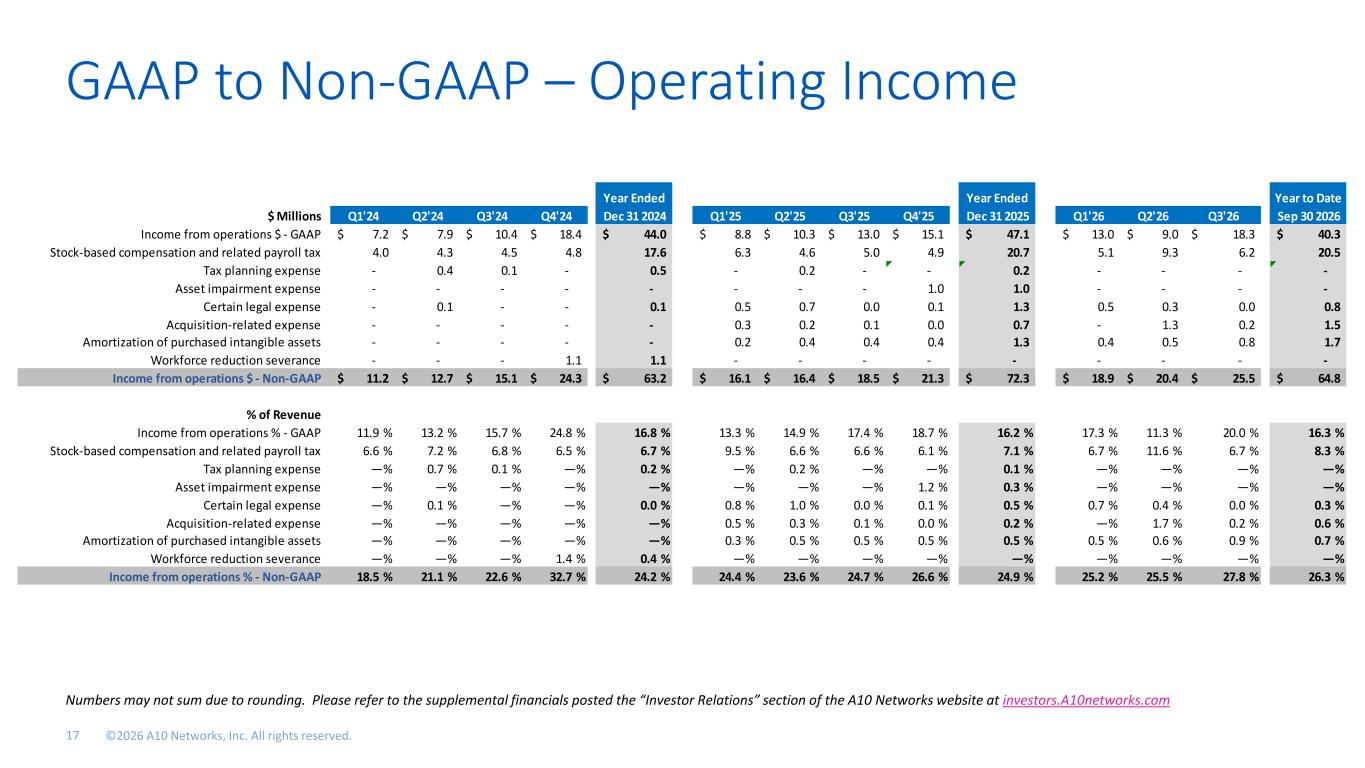
GAAP to Non-GAAP – Operating Income Numbers may not sum due to rounding. Please refer to the supplemental financials posted the “Investor Relations” section of the A10 Networks website at investors.A10networks.com. Q3’23 Year Ended Year Ended Year to Date $ Millions Q1'24 Q2'24 Q3'24 Q4'24 Dec 31 2024 Q1'25 Q2'25 Q3'25 Q4'25 Dec 31 2025 Q1'26 Q2'26 Q3'26 Sep 30 2026 Income from operations $ - GAAP 7.2$ 7.9$ 10.4$ 18.4$ 44.0$ 8.8$ 10.3$ 13.0$ 15.1$ 47.1$ 13.0$ 9.0$ 18.3$ 40.3$ Stock-based compensation and related payroll tax 4.0 4.3 4.5 4.8 17.6 6.3 4.6 5.0 4.9 20.7 5.1 9.3 6.2 20.5 Tax planning expense - 0.4 0.1 - 0.5 - 0.2 - - 0.2 - - - - Asset impairment expense - - - - - - - - 1.0 1.0 - - - - Certain legal expense - 0.1 - - 0.1 0.5 0.7 0.0 0.1 1.3 0.5 0.3 0.0 0.8 Acquisition-related expense - - - - - 0.3 0.2 0.1 0.0 0.7 - 1.3 0.2 1.5 Amortization of purchased intangible assets - - - - - 0.2 0.4 0.4 0.4 1.3 0.4 0.5 0.8 1.7 Workforce reduction severance - - - 1.1 1.1 - - - - - - - - - Income from operations $ - Non-GAAP 11.2$ 12.7$ 15.1$ 24.3$ 63.2$ 16.1$ 16.4$ 18.5$ 21.3$ 72.3$ 18.9$ 20.4$ 25.5$ 64.8$ % of Revenue Income from operations % - GAAP 11.9 % 13.2 % 15.7 % 24.8 % 16.8 % 13.3 % 14.9 % 17.4 % 18.7 % 16.2 % 17.3 % 11.3 % 20.0 % 16.3 % Stock-based compensation and related payroll tax 6.6 % 7.2 % 6.8 % 6.5 % 6.7 % 9.5 % 6.6 % 6.6 % 6.1 % 7.1 % 6.7 % 11.6 % 6.7 % 8.3 % Tax planning expense —% 0.7 % 0.1 % —% 0.2 % —% 0.2 % —% —% 0.1 % —% —% —% —% Asset impairment expense —% —% —% —% —% —% —% —% 1.2 % 0.3 % —% —% —% —% Certain legal expense —% 0.1 % —% —% 0.0 % 0.8 % 1.0 % 0.0 % 0.1 % 0.5 % 0.7 % 0.4 % 0.0 % 0.3 % Acquisition-related expense —% —% —% —% —% 0.5 % 0.3 % 0.1 % 0.0 % 0.2 % —% 1.7 % 0.2 % 0.6 % Amortization of purchased intangible assets —% —% —% —% —% 0.3 % 0.5 % 0.5 % 0.5 % 0.5 % 0.5 % 0.6 % 0.9 % 0.7 % Workforce reduction severance —% —% —% 1.4 % 0.4 % —% —% —% —% —% —% —% —% —% Income from operations % - Non-GAAP 18.5 % 21.1 % 22.6 % 32.7 % 24.2 % 24.4 % 23.6 % 24.7 % 26.6 % 24.9 % 25.2 % 25.5 % 27.8 % 26.3 %
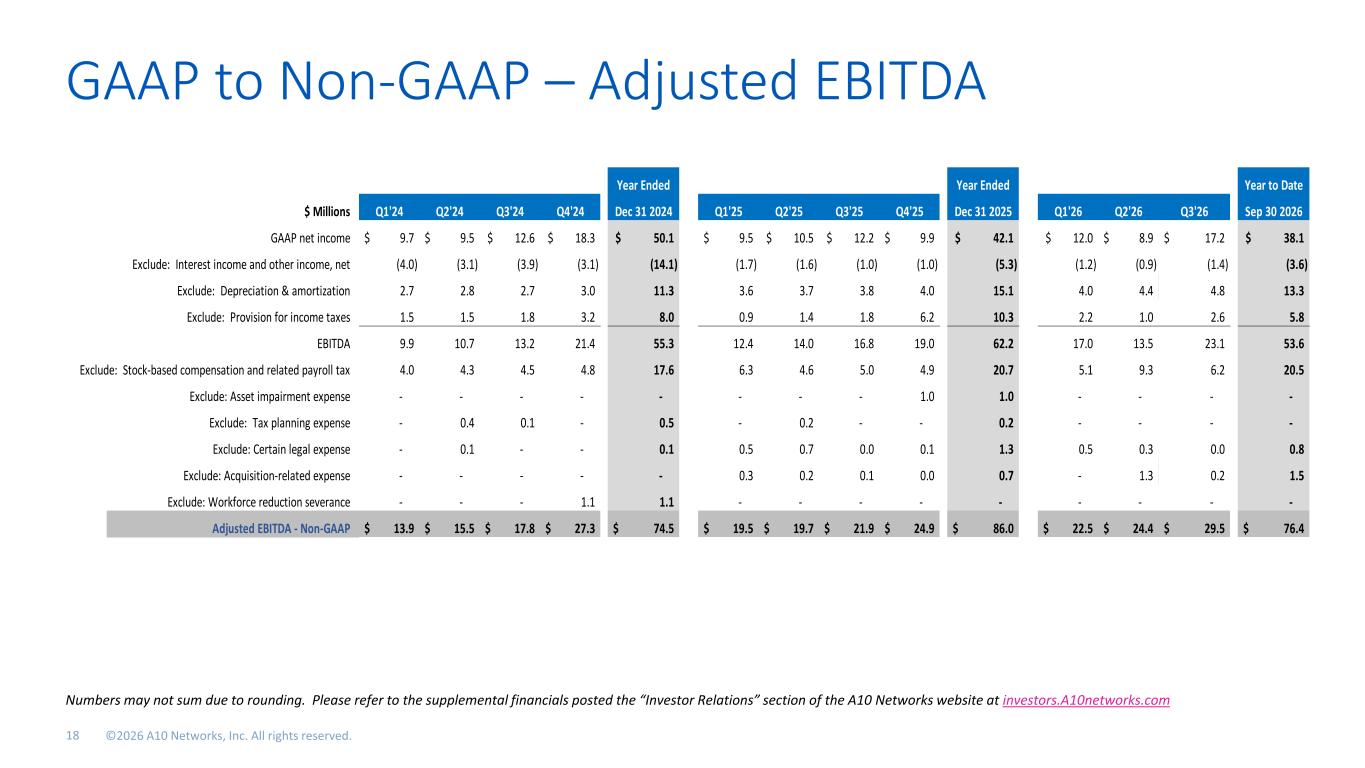
GAAP to Non-GAAP – Adjusted EBITDA Numbers may not sum due to rounding. Please refer to the supplemental financials posted the “Investor Relations” section of the A10 Networks website at investors.A10networks.com. Year Ended Year Ended Year to Date $ Millions Q1'24 Q2'24 Q3'24 Q4'24 Dec 31 2024 Q1'25 Q2'25 Q3'25 Q4'25 Dec 31 2025 Q1'26 Q2'26 Q3'26 Sep 30 2026 GAAP net income 9.7$ 9.5$ 12.6$ 18.3$ 50.1$ 9.5$ 10.5$ 12.2$ 9.9$ 42.1$ 12.0$ 8.9$ 17.2$ 38.1$ Exclude: Interest income and other income, net (4.0) (3.1) (3.9) (3.1) (14.1) (1.7) (1.6) (1.0) (1.0) (5.3) (1.2) (0.9) (1.4) (3.6) Exclude: Depreciation & amortization 2.7 2.8 2.7 3.0 11.3 3.6 3.7 3.8 4.0 15.1 4.0 4.4 4.8 13.3 Exclude: Provision for income taxes 1.5 1.5 1.8 3.2 8.0 0.9 1.4 1.8 6.2 10.3 2.2 1.0 2.6 5.8 EBITDA 9.9 10.7 13.2 21.4 55.3 12.4 14.0 16.8 19.0 62.2 17.0 13.5 23.1 53.6 Exclude: Stock-based compensation and related payroll tax 4.0 4.3 4.5 4.8 17.6 6.3 4.6 5.0 4.9 20.7 5.1 9.3 6.2 20.5 Exclude: Asset impairment expense - - - - - - - - 1.0 1.0 - - - - Exclude: Tax planning expense - 0.4 0.1 - 0.5 - 0.2 - - 0.2 - - - - Exclude: Certain legal expense - 0.1 - - 0.1 0.5 0.7 0.0 0.1 1.3 0.5 0.3 0.0 0.8 Exclude: Acquisition-related expense - - - - - 0.3 0.2 0.1 0.0 0.7 - 1.3 0.2 1.5 Exclude: Workforce reduction severance - - - 1.1 1.1 - - - - - - - - - Adjusted EBITDA - Non-GAAP 13.9$ 15.5$ 17.8$ 27.3$ 74.5$ 19.5$ 19.7$ 21.9$ 24.9$ 86.0$ 22.5$ 24.4$ 29.5$ 76.4$