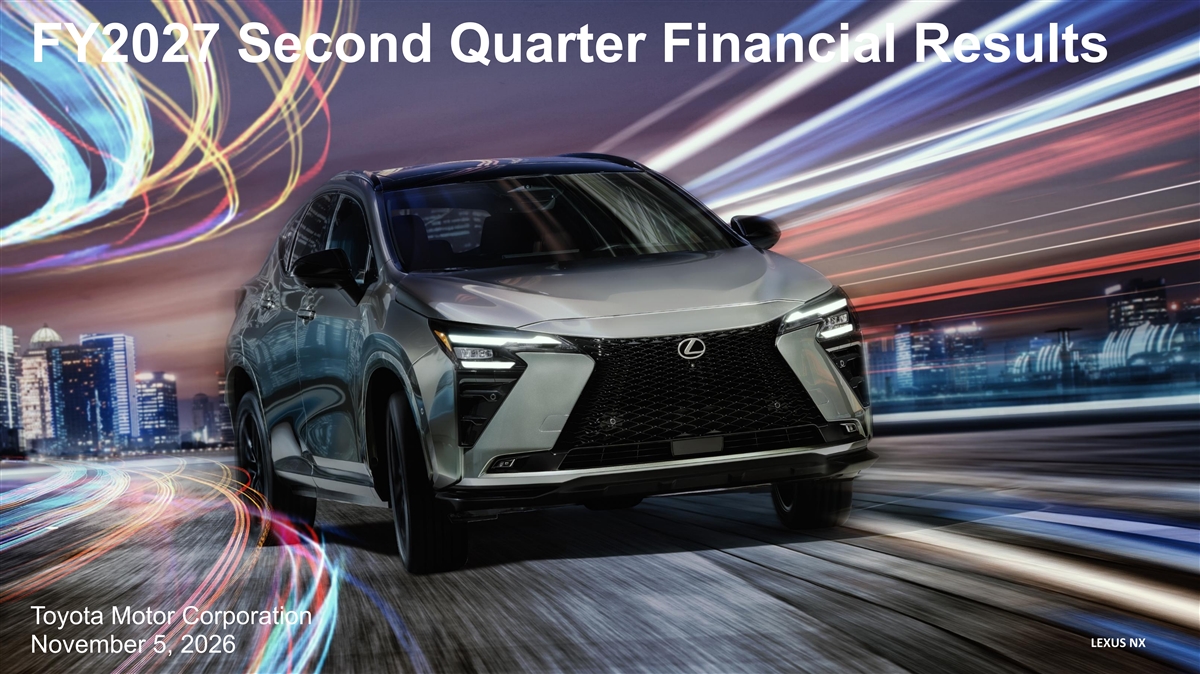
FY2027 Second Quarter Financial Results Toyota Motor Corporation LEXUSNX November 5, 2026
Cautionary Statement with Respect to Forward-Looking Statements and Caution Concerning Insider Trading This presentation contains forward-looking statements that reflect the plans and expectations of Toyota Motor Corporation and its consolidated subsidiaries (“Toyota”). These forward-looking statements are not guarantees of future performance and involve known and unknown risks, uncertainties and other factors that may cause Toyota’s actual results, performance, achievements or financial position to be materially different from any future results, performance, achievements or financial position expressed or implied by these forward-looking statements. These factors include, but are not limited to: (i) changes in economic conditions, market demand, and the competitive environment affecting the automotive markets in Japan, North America, Europe, Asia and other markets in which Toyota operates; (ii) fluctuations in currency exchange rates (particularly with respect to the value of the Japanese yen, the U.S. dollar, the euro, the Australian dollar, the Canadian dollar and the British pound), stock prices and interest rates; (iii) changes in funding environment in financial markets and increased competition in the financial services industry; (iv) Toyota’s ability to market and distribute effectively; (v) Toyota’s ability to realize production efficiencies and to implement capital expenditures at the levels and times planned by management;(vi) changes in the laws and regulations, as well as other government actions, in the markets in which Toyota operates that affect Toyota’s operations, particularly laws, regulations and government actions relating to vehicle safety including remedial measures such as recalls, environmental protection, vehicle emissions and vehicle fuel economy, and tariffs and other trade policies, as well as current and future litigation and other legal proceedings, government proceedings and investigations; (vii) political and economic instability in the markets in which Toyota operates; (viii) Toyota’s ability to timely develop and achieve market acceptance of new products that meet customer demand; (ix) any damage to Toyota’s brand image; (x) Toyota’s reliance on various suppliers for the provision of supplies; (xi) increases in prices of raw materials; (xii) Toyota’s reliance on various digital and information technologies, as well as information security; (xiii) fuel shortages or interruptions in electricity, transportation systems, labor strikes, work stoppages or other interruptions to, or difficulties in, the employment of labor in the major markets where Toyota purchases materials, components and supplies for the production of its products or where its products are produced, distributed or sold; (xiv) the impact of natural calamities, epidemics, political and economic instability, fuel shortages or interruptions in social infrastructure, wars, terrorism and labor strikes, including their negative effect on Toyota’s vehicle production and sales; (xv) the impact of climate change and the transition towards a low-carbon economy; and (xvi) the ability of Toyota to hire or retain sufficient human resources. A discussion of these and other factors which may affect Toyota’s actual results, performance, achievements or financial position is contained in Toyota Motor Corporation’s annual report on Form 20-F, which is on file with the United States Securities and Exchange Commission. Caution concerning Insider Trading Under Japanese securities laws and regulations (the Regulations ), subject to certain exceptions, any person who receives certain material information relating to the business, etc. of Toyota which may be contained in this document is prohibited from trading in Toyota's shares or certain other transactions related to such shares (as set forth in the Regulations) until such material information is deemed to be made public. Under the Regulations, material information is deemed to be made public when (i) such material information is notified to a stock exchange and is disclosed by ways of electromagnetic means as prescribed by the ordinance of the Cabinet Office (posting on the TDnet (Timely Disclosure Network) information service) or (ii) twelve (12) hours have elapsed since a listed company, such as Toyota, disclosed such material information to at least two (2) media sources as prescribed by the Regulations. 2
FY2027 Second Quarter Results Summary Despite a challenging competitive environment, continued improvement efforts led to a YoY increase in profit and an upward revision to the FY2027 forecast. Operating income 2.2 trillion yen (+0.2 trillion yen YoY) Actual - Mitigated the impact on earnings through swift responses to changes in the external environment, (First Half) including the situation in the Middle East. - Supported by strong demand, vehicle sales remained resilient, led by HEVs Operating income 3.9 trillion yen (+0.5 trillion yen from the previous forecast, +0.1 trillion yen YoY) - Mitigated the impact of rising materials prices and production disruptions caused by earthquakes FY2027 and floods through recovery efforts at production sites and optimized global supply, thereby Forecast maintaining consolidated vehicle sales. - In addition to reduced tariff-related costs, through the accumulation of improvement efforts, including the expansion of value chain earnings, we expect year-on-year profit growth, and have revised our forecast upward. - We will maintain our policy to increase dividends in a stable manner to reward our long-term shareholders. Return to Interim : 50 yen (+5 yen YoY) / Full-year (forecast) : 100 yen (+5 yen YoY) - Share repurchase authorization : Increase by 300 billion yen (FY total:1.3 trillion yen) Share- - Share cancellation : Additional 1 billion shares of treasury stock (FY total:1.2 billion shares) holders We have reduced the level of treasury stock holdings and will pursue capital policies focused on enhancing capital efficiency 3
FY2027 Second Quarter Financial Performance 4
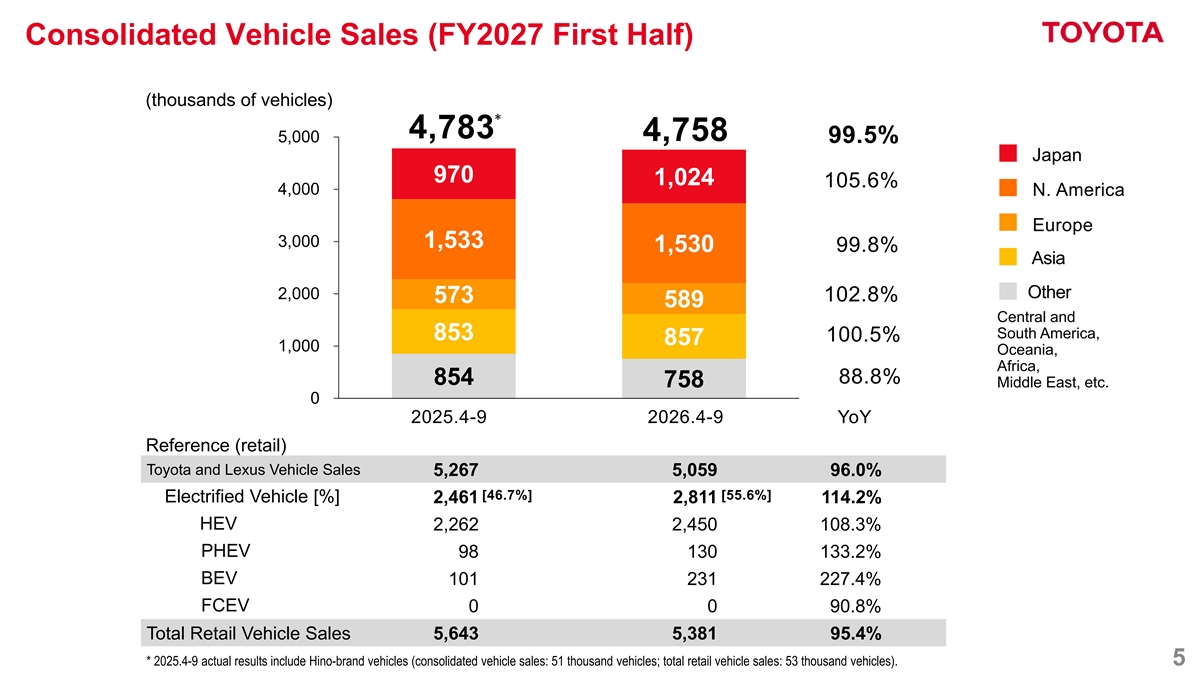
Consolidated Vehicle Sales (FY2027 First Half) (thousands of vehicles) * 4,783 4,758 5,000 99.5% Japan 970 1,024 105.6% 4,000 N. America Europe 3,000 1,533 1,530 99.8% Asia Other 2,000 102.8% 573 589 Central and South America, 853 100.5% 857 1,000 Oceania, Africa, 88.8% 854 758 Middle East, etc. 0 2025.4-9 2026.4-9 YoY Reference (retail) Toyota and Lexus Vehicle Sales 5,267 5,059 96.0% [46.7%] [55.6%] Electrified Vehicle [%] 2,461 2,811 114.2% HEV 2,262 2,450 108.3% PHEV 98 130 133.2% BEV 101 231 227.4% FCEV 0 0 90.8% Total Retail Vehicle Sales 5,643 5,381 95.4% * 2025.4-9 actual results include Hino-brand vehicles (consolidated vehicle sales: 51 thousand vehicles; total retail vehicle sales: 53 thousand vehicles). 5
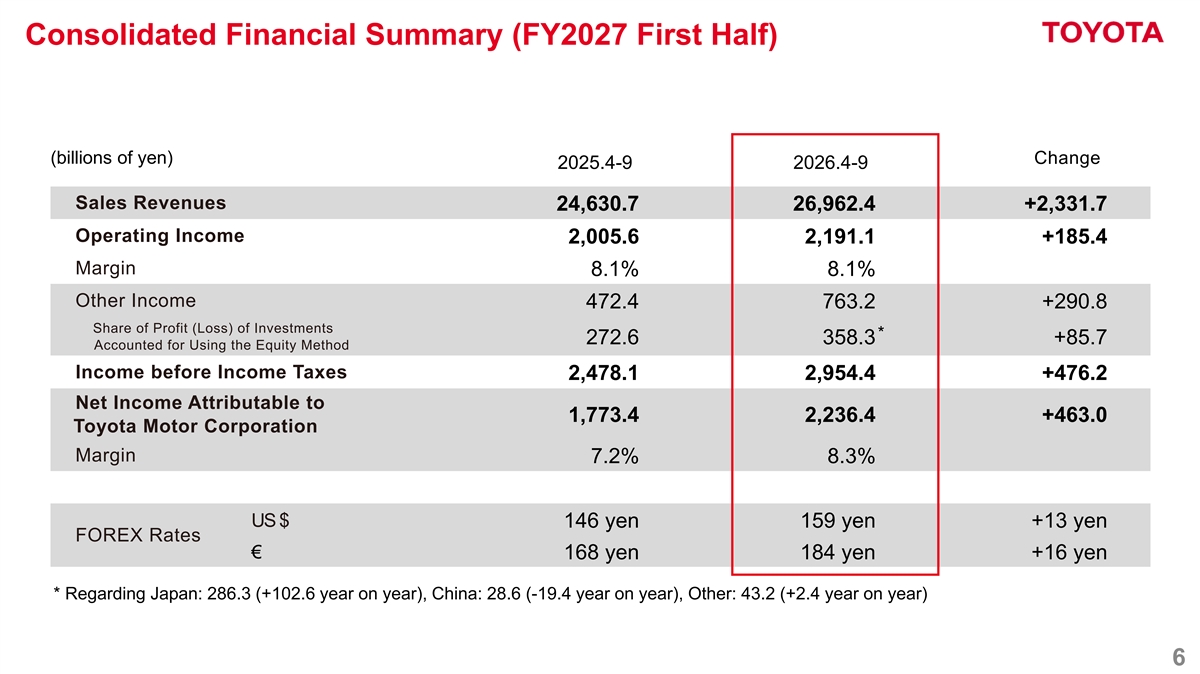
Consolidated Financial Summary (FY2027 First Half) 10/28 (billions of yen) Change 2025.4-9 2026.4-9 Sales Revenues 24,630.7 26,962.4 +2,331.7 Operating Income 2,005.6 2,191.1 +185.4 Margin 8.1% 8.1% Other Income 472.4 763.2 +290.8 Share of Profit (Loss) of Investments * 272.6 358.3 +85.7 Accounted for Using the Equity Method Income before Income Taxes 2,478.1 2,954.4 +476.2 Net Income Attributable to 1,773.4 2,236.4 +463.0 Toyota Motor Corporation Margin 7.2% 8.3% US $ 146 yen 159 yen +13 yen FOREX Rates € 168 yen 184 yen +16 yen * Regarding Japan: 286.3 (+102.6 year on year), China: 28.6 (-19.4 year on year), Other: 43.2 (+2.4 year on year) 6
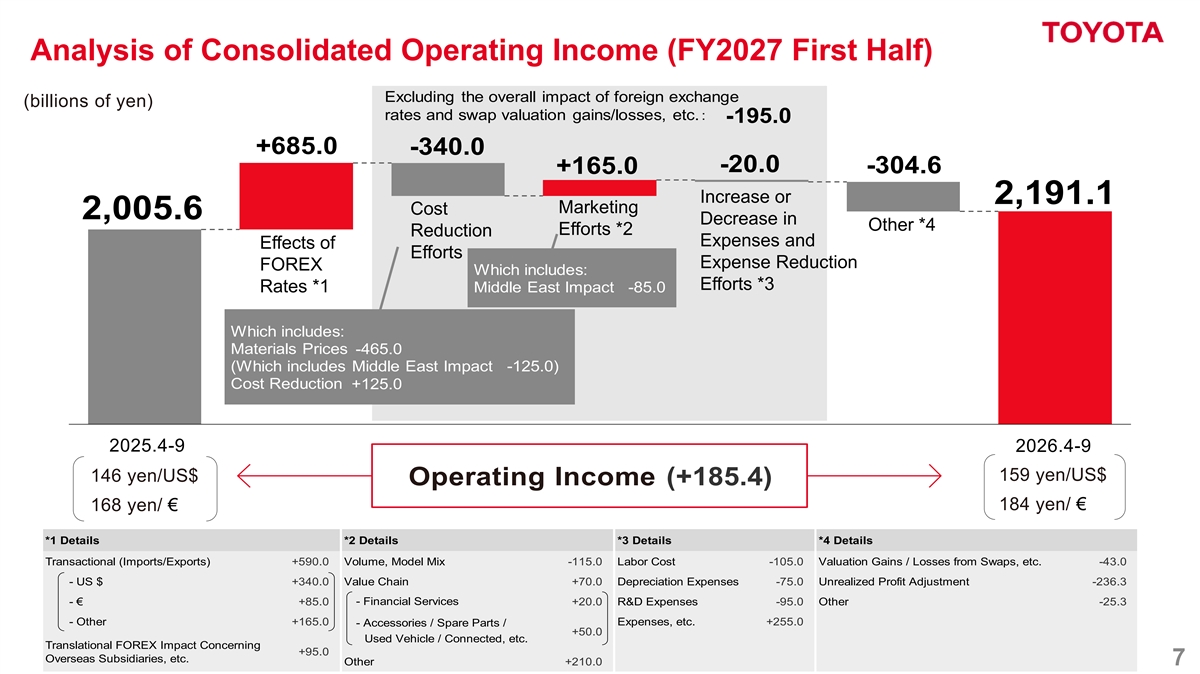
Analysis of Consolidated Operating Income (FY2027 First Half) 作成中 Excluding the overall impact of foreign exchange (billions of yen) rates and swap valuation gains/losses, etc.: -195.0 +685.0 -340.0 -20.0 -304.6 +165.0 ・台数/構成:△1,950 ・価格改定:+2,450・無償修理費増:△2,450 Increase or 2,191.1 Marketing Cost ・市況影響:+1,650 ・販売諸費用:+1,300・LG等向け補償金:△1,300 2,005.6 Decrease in Other *4 ・原価改善:△150 ・VC収益:+1,500※総合投資相当:+100 Efforts *2 Reduction Expenses and Effects of ※総合投資相当:△500 ※総合投資相当:+50 Efforts Expense Reduction FOREX Which includes: Efforts *3 Rates *1 Middle East Impact -85.0 ■為替・その他除きでは+3,250億円の増益 Which includes: ■台数減少(連販950万台→936万台)/構成悪化△1,950億円、 Materials Prices -465.0 生産台数減少に伴う課題解消申し入れ見送りによる原価改善△200億円 (Which includes Middle East Impact -125.0) 無償修理費増△2,450億円、LG等向け補償金△1,300億円等による減益があるも Cost Reduction +125.0 市況リスク未実現の追い風+1,650億円に加え、 価格改定+2,450億円(中国リスクの未実現・為替改定除く+1,000億円ほどが改善努力と想定) 販売諸費用の抑制+1,300億円、VC+1,500億円( +1,000億円ほどが改善努力と想定)等により、 2025.4-9 2026.4-9 期首時点比で収益改善を実現 159 yen/US$ 146 yen/US$ Operating Income (+185.4) 184 yen/ € 168 yen/ € *1 Details *2 Details *3 Details *4 Details Transactional (Imports/Exports) +590.0 Volume, Model Mix -115.0 Labor Cost -105.0 Valuation Gains / Losses from Swaps, etc. -43.0 - US $ +340.0 Value Chain +70.0 Depreciation Expenses -75.0 Unrealized Profit Adjustment -236.3 - € +85.0 - Financial Services +20.0 R&D Expenses -95.0 Other -25.3 - Other +165.0 Expenses, etc. +255.0 - Accessories / Spare Parts / +50.0 Used Vehicle / Connected, etc. Translational FOREX Impact Concerning +95.0 Overseas Subsidiaries, etc. Other +210.0 7
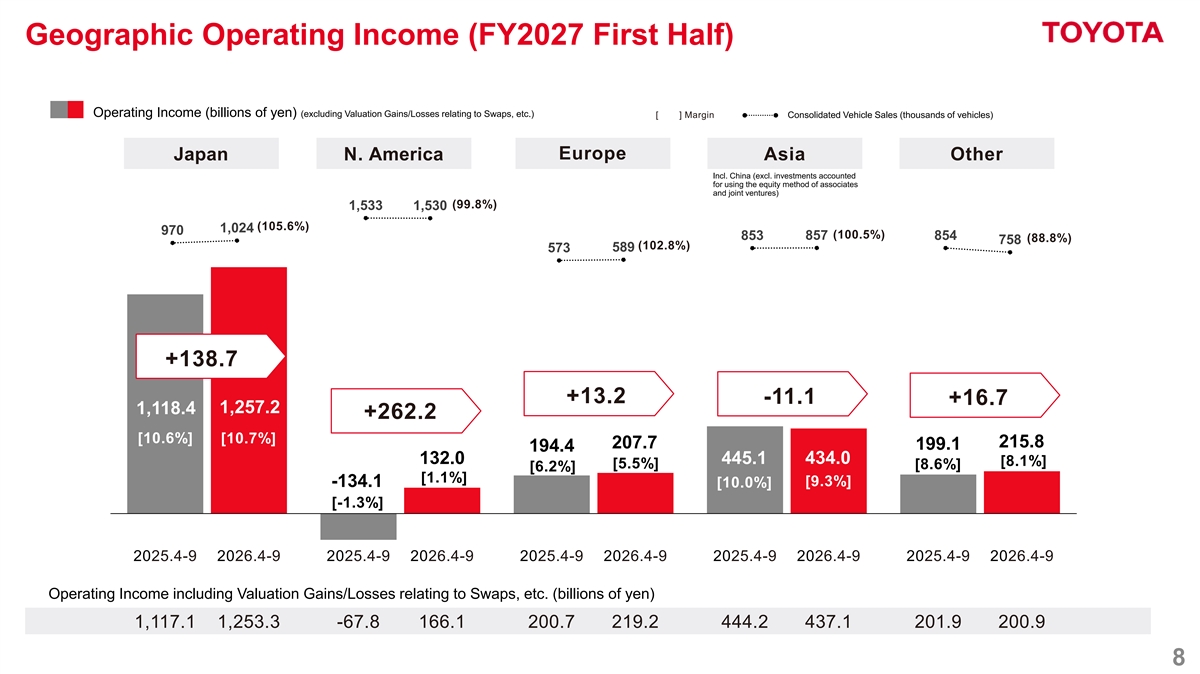
Geographic Operating Income (FY2027 First Half) 作成中 Operating Income (billions of yen) (excluding Valuation Gains/Losses relating to Swaps, etc.) [ ] Margin Consolidated Vehicle Sales (thousands of vehicles) Europe Japan N. America Asia Other Incl. China (excl. investments accounted for using the equity method of associates and joint ventures) (99.8%) 1,533 1,530 (105.6%) 1,024 970 (100.5%) 853 857 854 (88.8%) 758 (102.8%) 589 573 +138.7 +13.2 -11.1 +16.7 1,257.2 1,118.4 +262.2 [10.6%] [10.7%] 215.8 207.7 199.1 194.4 132.0 445.1 434.0 [8.1%] [5.5%] [8.6%] [6.2%] [1.1%] [9.3%] -134.1 [10.0%] [-1.3%] 2025.4-9 2026.4-9 2025.4-9 2026.4-9 2025.4-9 2026.4-9 2025.4-9 2026.4-9 2025.4-9 2026.4-9 Operating Income including Valuation Gains/Losses relating to Swaps, etc. (billions of yen) 1,117.1 1,253.3 -67.8 166.1 200.7 219.2 444.2 437.1 201.9 200.9 8
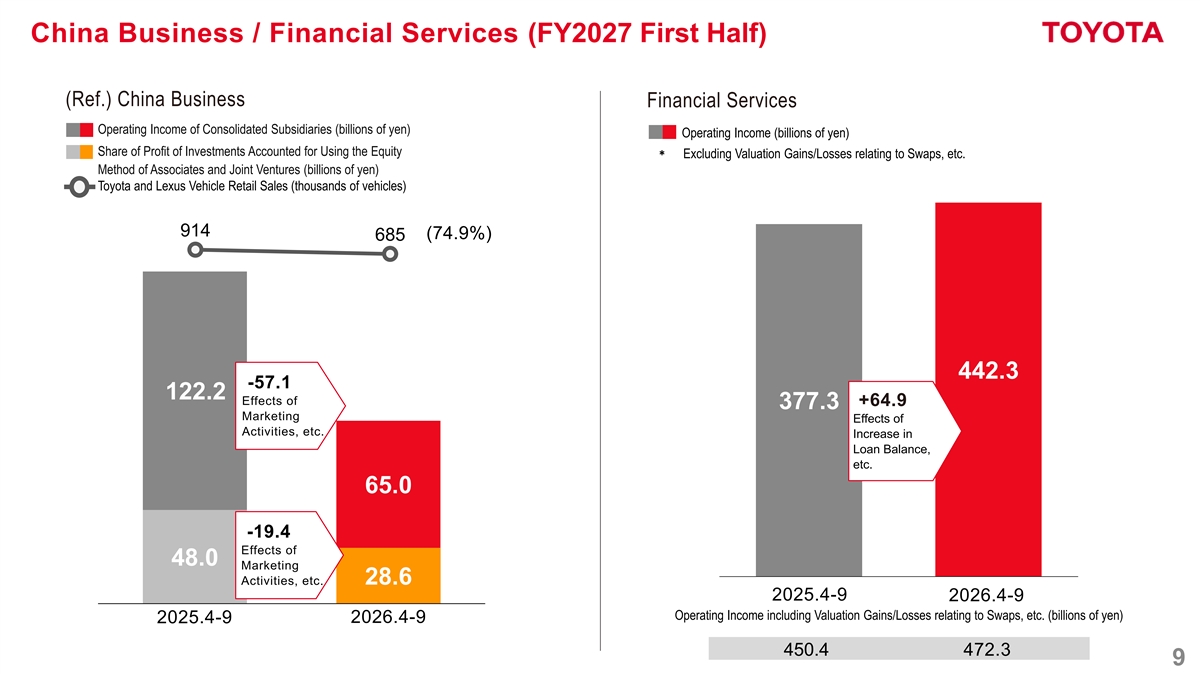
China Business / Financial Services (FY2027 First Half) (Ref.) China Business Financial Services Operating Income of Consolidated Subsidiaries (billions of yen) Operating Income (billions of yen) Share of Profit of Investments Accounted for Using the Equity* Excluding Valuation Gains/Losses relating to Swaps, etc. Method of Associates and Joint Ventures (billions of yen) Toyota and Lexus Vehicle Retail Sales (thousands of vehicles) 914 (74.9%) 685 442.3 -57.1 122.2 Effects of +64.9 377.3 Marketing Effects of Activities, etc. Increase in Loan Balance, etc. 65.0 -19.4 Effects of 48.0 Marketing Activities, etc. 28.6 2025.4-9 2026.4-9 Operating Income including Valuation Gains/Losses relating to Swaps, etc. (billions of yen) 2026.4-9 2025.4-9 450.4 472.3 9

FY2027 Financial Forecasts 10
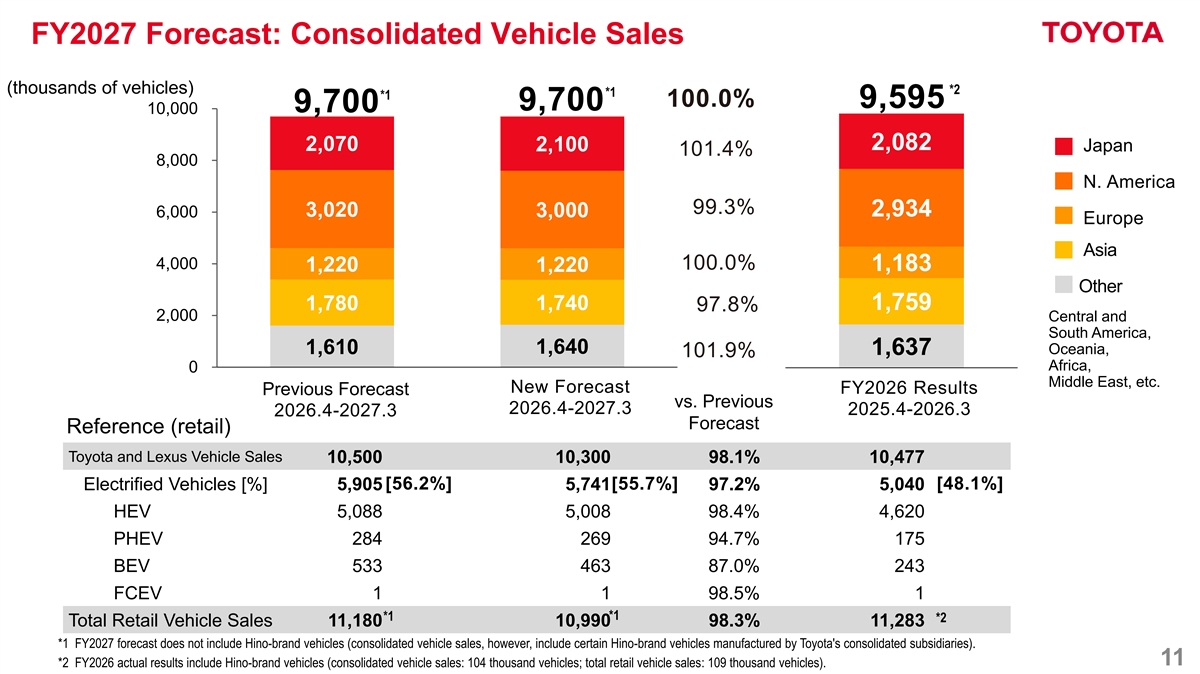
FY2027 Forecast: Consolidated Vehicle Sales (thousands of vehicles) *2 *1 *1 100.0% 9,595 9,700 9,700 10,000 2,082 2,070 2,100 Japan 101.4% 8,000 N. America 99.3% 2,934 3,020 3,000 6,000 Europe Asia 4,000 100.0% 1,183 1,220 1,220 Other 1,780 1,740 1,759 97.8% 2,000 Central and South America, 1,610 1,640 Oceania, 1,637 101.9% Africa, 0 Middle East, etc. New Forecast FY2026 Results Previous Forecast vs. Previous 2026.4-2027.3 2025.4-2026.3 2026.4-2027.3 Forecast Reference (retail) Toyota and Lexus Vehicle Sales 10,500 10,300 98.1% 10,477 [56.2%] [55.7%] [48.1%] Electrified Vehicles [%] 5,905 5,741 97.2% 5,040 HEV 5,088 5,008 98.4% 4,620 PHEV 284 269 94.7% 175 BEV 533 463 87.0% 243 FCEV 1 1 98.5% 1 *1 *1 *2 Total Retail Vehicle Sales 11,180 10,990 98.3% 11,283 *1 FY2027 forecast does not include Hino-brand vehicles (consolidated vehicle sales, however, include certain Hino-brand vehicles manufactured by Toyota's consolidated subsidiaries). 11 *2 FY2026 actual results include Hino-brand vehicles (consolidated vehicle sales: 104 thousand vehicles; total retail vehicle sales: 109 thousand vehicles).
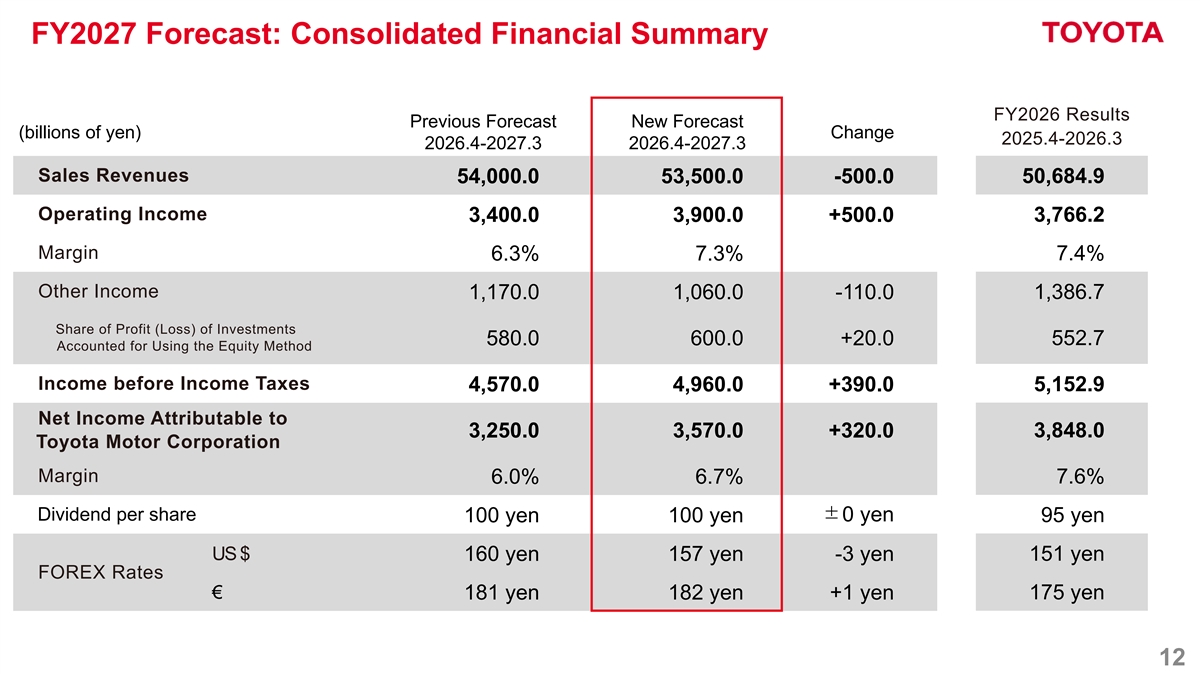
作成中 FY2027 Forecast: Consolidated Financial Summary FY2026 Results Previous Forecast New Forecast (billions of yen) Change 2025.4-2026.3 2026.4-2027.3 2026.4-2027.3 Sales Revenues 50,684.9 54,000.0 53,500.0 -500.0 Operating Income 3,766.2 3,400.0 3,900.0 +500.0 Margin 7.4% 6.3% 7.3% Other Income 1,386.7 1,170.0 1,060.0 -110.0 Share of Profit (Loss) of Investments 552.7 580.0 600.0 +20.0 Accounted for Using the Equity Method Income before Income Taxes 5,152.9 4,570.0 4,960.0 +390.0 Net Income Attributable to 3,848.0 3,250.0 3,570.0 +320.0 Toyota Motor Corporation Margin 6.0% 6.7% 7.6% Dividend per share ±0 yen 100 yen 100 yen 95 yen US $ 151 yen 160 yen 157 yen -3 yen FOREX Rates € 175 yen 181 yen 182 yen +1 yen 12 *第3 四半期実績:米 ドル143円/ ユーロ155円、'24年1月以 降の 前提為替レート:米 ドル140円/ ユーロ150円 *第3 四半期実績:米 ドル153円/ ユーロ165円、'25年1月以 降の 前提為替レート:米 ドル150円/ ユーロ160円
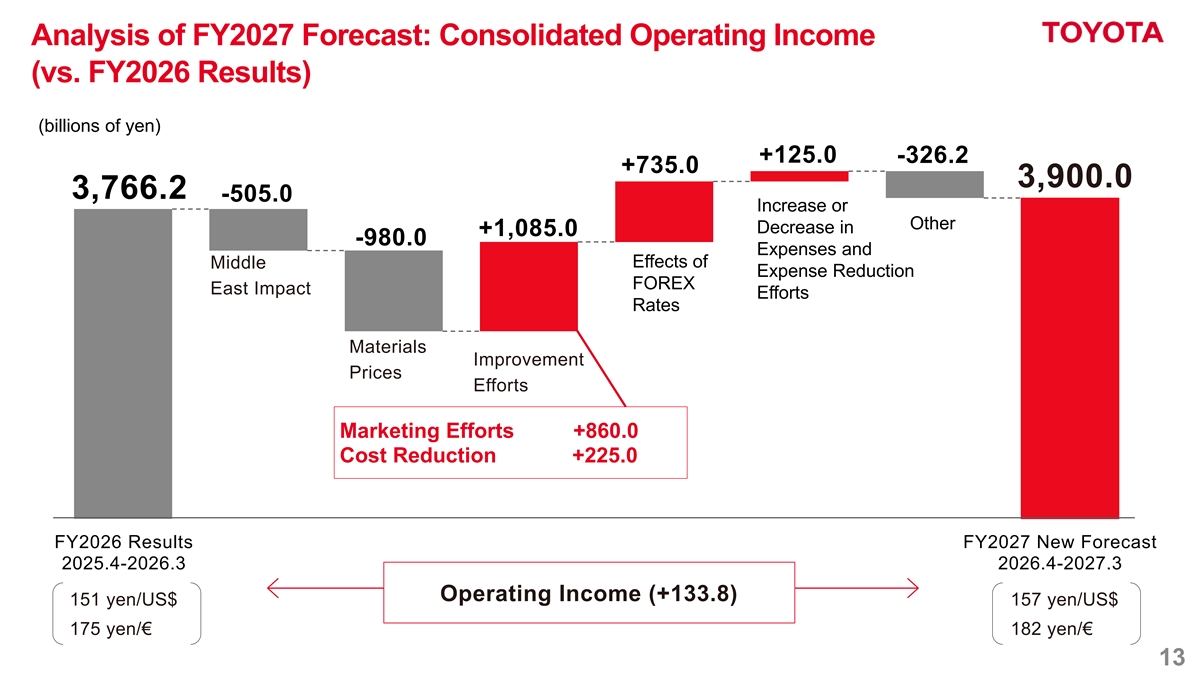
<修正履歴> 「作成中」テキストを外してから、 Analysis of FY2027 Forecast: Consolidated Operating Income 修正をした場合は、 (vs. FY2026 Results) 完了の日付と時刻の入力をお願いしま す (Teamsのチャットに、事前連絡いれてます (billions of yen) か? 完了後は、チャットに完了の投稿をお願いしま +125.0 -326.2 +735.0 す) 3,900.0 3,766.2 -505.0 Increase or 修正①: Other Decrease in +1,085.0 修正②: -980.0 Expenses and Effects of Middle Expense Reduction FOREX East Impact Efforts Rates Materials Improvement Prices Efforts Marketing Efforts +860.0 Cost Reduction +225.0 FY2026 Results FY2027 New Forecast 2025.4-2026.3 2026.4-2027.3 Operating Income (+133.8) 151 yen/US$ 157 yen/US$ 175 yen/€ 182 yen/€ 13

Shareholder Return 14
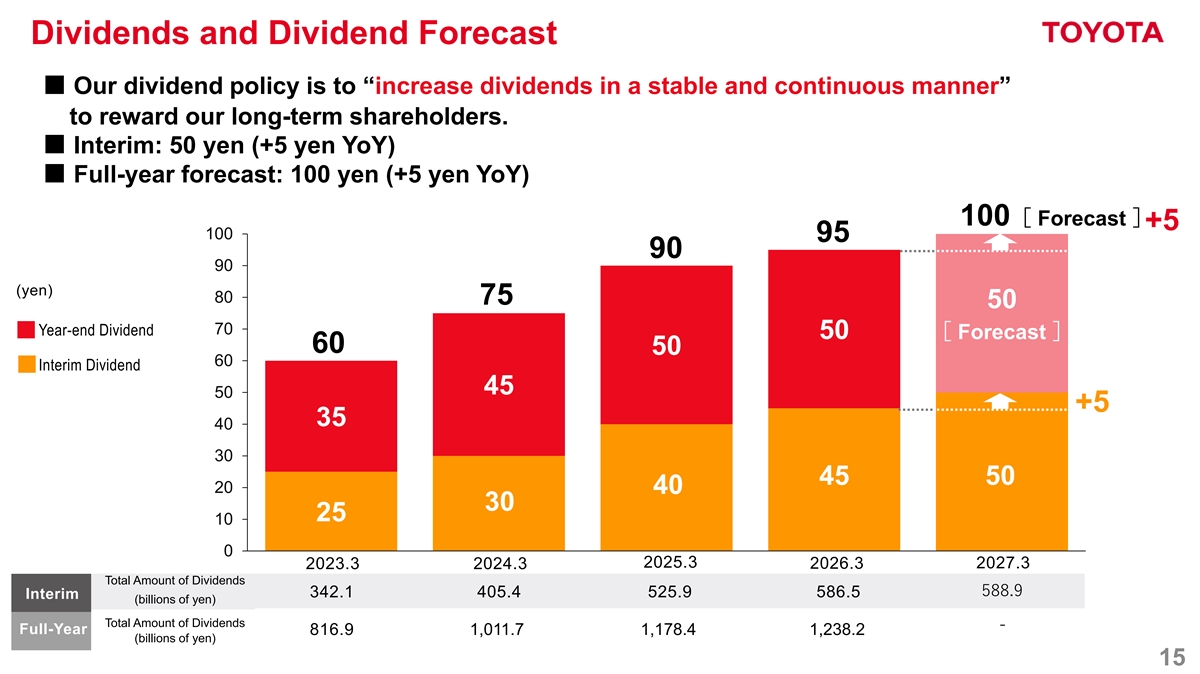
Dividends and Dividend Forecast ■ Our dividend policy is to “increase dividends in a stable and continuous manner” to reward our long-term shareholders. ■ Interim: 50 yen (+5 yen YoY) ■ Full-year forecast: 100 yen (+5 yen YoY) 100[ Forecast ] +5 100 95 90 90 (yen) 80 75 50 70 Year-end Dividend 50[ Forecast ] 60 50 60 Interim Dividend 45 50 +5 35 40 30 45 50 20 40 30 25 10 0 2025.3 2027.3 2023.3 2024.3 2026.3 Total Amount of Dividends 588.9 342.1 405.4 525.9 586.5 Interim (billions of yen) Total Amount of Dividends - Full-Year 816.9 1,011.7 1,178.4 1,238.2 (billions of yen) 15
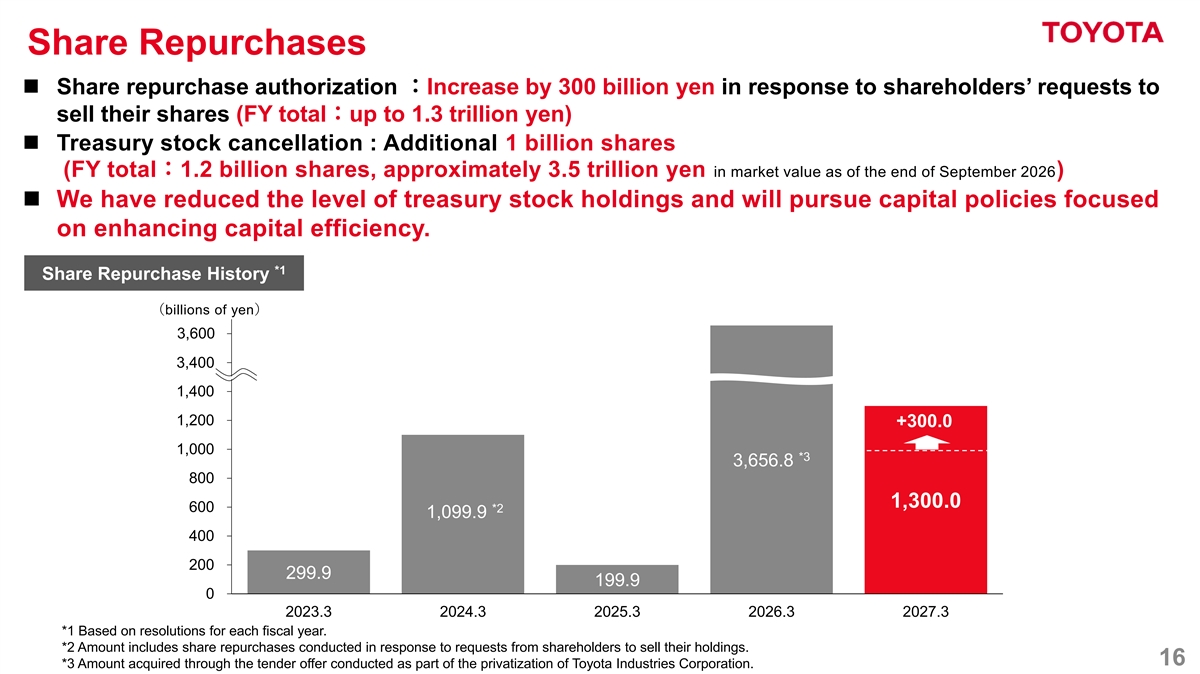
ご参考 ご参考 2026/3期 Q4決算 2023/3期 Q2決算 Share Repurchases ◼ Share repurchase authorization :Increase by 300 billion yen in response to shareholders’ requests to sell their shares (FY total:up to 1.3 trillion yen) ◼ Treasury stock cancellation : Additional 1 billion shares (FY total:1.2 billion shares, approximately 3.5 trillion yen in market value as of the end of September 2026) ◼ We have reduced the level of treasury stock holdings and will pursue capital policies focused on enhancing capital efficiency. *1 Share Repurchase History (billions of yen) 1,80 3,600 0 1,60 3,400 0 1,400 1,200 +300.0 1,000 *3 3,656.8 Memo(坂爪) 800 24/3月期に5.2億株分の自己株式の消却を行った際には、期 ご参考 末日時点の株価での概算額も記載していました。 1,300.0 600 *2 2024/3期 Q4決算 1,099.9 EPSが向上することを伝える為、発行済み株式総数への影響度 ◼株価水準を踏まえ、自己株式取得を機動的に実施 も記載してみました。 400 最適な資本構成の実現とROE改善を通じて、中長期的な企業価値向上を図る 200 299.9 199.9 0 2023.3 2024.3 2025.3 2026.3 2027.3 ◼取得枠:1兆円(上限・全額市場買付) *1 Based on resolutions for each fiscal year. Memo(坂爪) *2 Amount includes share repurchases conducted in response to requests from shareholders to sell their holdings. BOD資料に記載のある27/3月期見通し「37.0」兆円 ◼自己株式消却:2億株/0.5兆円相当(2026年6月末時点時価) 16 *3 Amount acquired through the tender offer conducted as part of the privatization of Toyota Industries Corporation. は、本件の自己株取得に加え、中間配当での減額分も 考慮されているかと思いますので、 IRプレゼン上は金額は未記載にしております。

Progress with Business Structure Reform 17
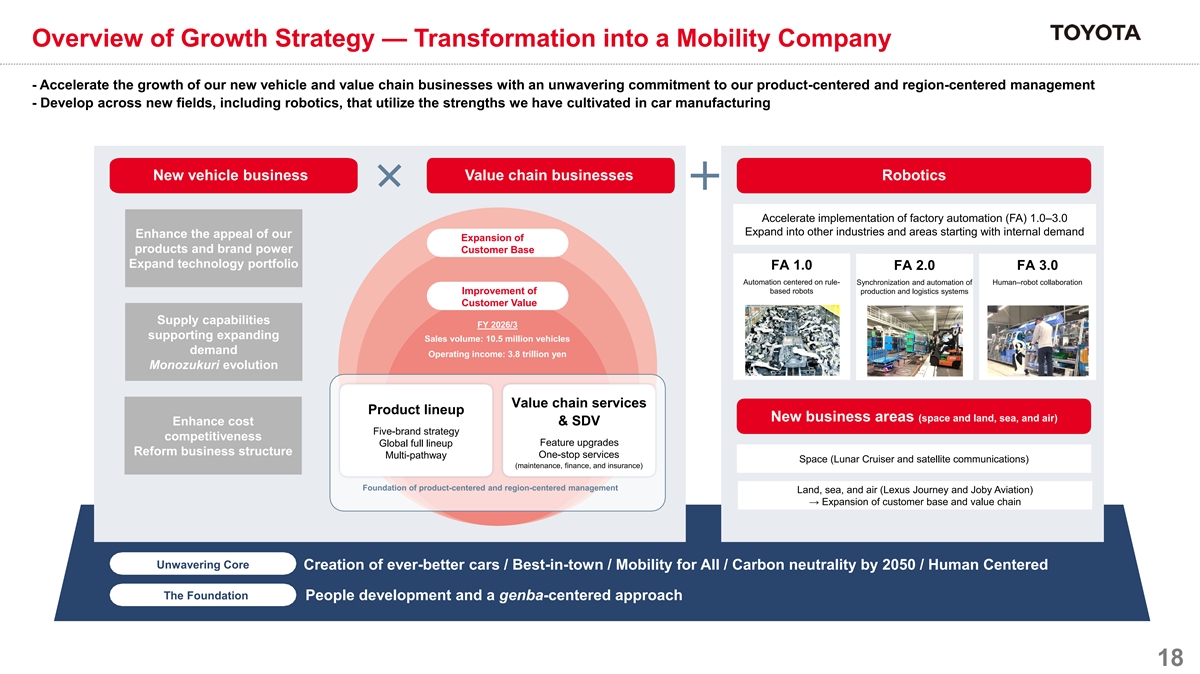
Overview of Growth Strategy — Transformation into a Mobility Company - Accelerate the growth of our new vehicle and value chain businesses with an unwavering commitment to our product-centered and region-centered management - Develop across new fields, including robotics, that utilize the strengths we have cultivated in car manufacturing New vehicle business Value chain businesses Robotics Accelerate implementation of factory automation (FA) 1.0–3.0 Expand into other industries and areas starting with internal demand Enhance the appeal of our Expansion of products and brand power Customer Base Expand technology portfolio FA 1.0 FA 2.0 FA 3.0 Automation centered on rule- Synchronization and automation of Human–robot collaboration based robots Improvement of production and logistics systems Customer Value Supply capabilities FY 2026/3 supporting expanding Sales volume: 10.5 million vehicles demand Operating income: 3.8 trillion yen Monozukuri evolution Value chain services Product lineup New business areas (space and land, sea, and air) & SDV Enhance cost Five-brand strategy competitiveness Feature upgrades Global full lineup Reform business structure One-stop services Multi-pathway Space (Lunar Cruiser and satellite communications) (maintenance, finance, and insurance) Foundation of product-centered and region-centered management Land, sea, and air (Lexus Journey and Joby Aviation) → Expansion of customer base and value chain Unwavering Core Creation of ever-better cars / Best-in-town / Mobility for All / Carbon neutrality by 2050 / Human Centered The Foundation People development and a genba-centered approach 18
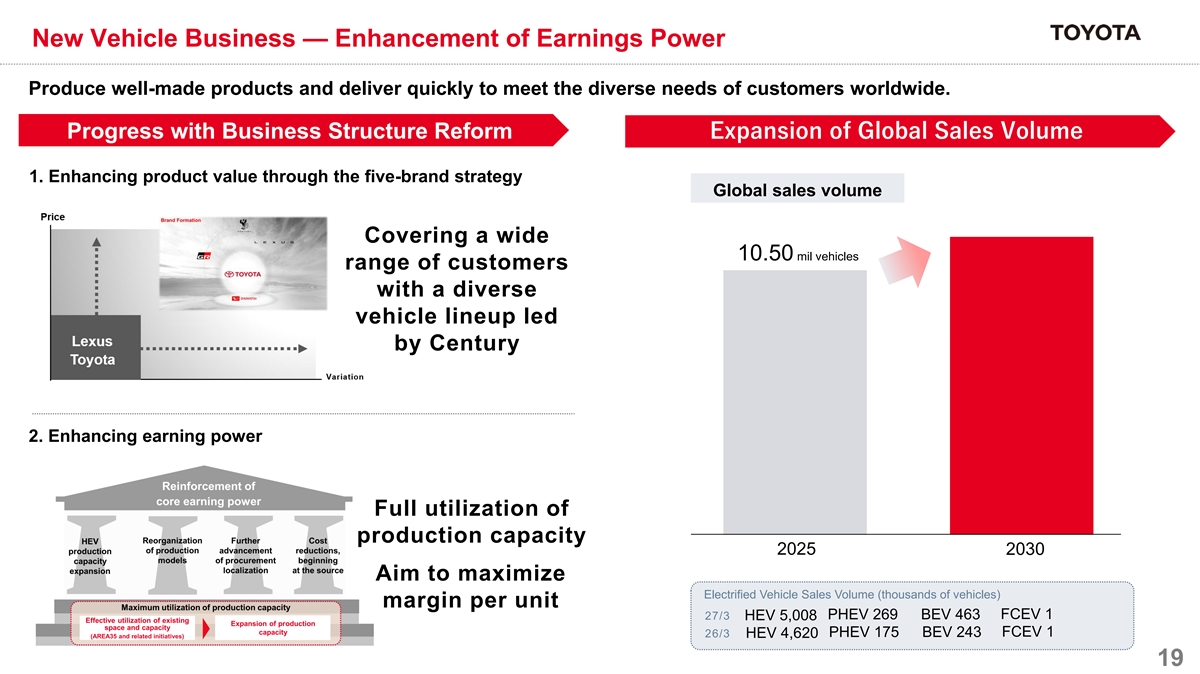
New Vehicle Business — Enhancement of Earnings Power Produce well-made products and deliver quickly to meet the diverse needs of customers worldwide. Progress with Business Structure Reform Expansion of Global Sales Volume 1. Enhancing product value through the five-brand strategy Global sales volume Covering a wide 10.50 mil vehicles range of customers with a diverse vehicle lineup led by Century 2. Enhancing earning power Full utilization of production capacity 2025 2030 Aim to maximize Electrified Vehicle Sales Volume (thousands of vehicles) margin per unit FCEV 1 27/3 PHEV 269 BEV 463 HEV 5,008 PHEV 175 BEV 243 FCEV 1 26/3 HEV 4,620 19
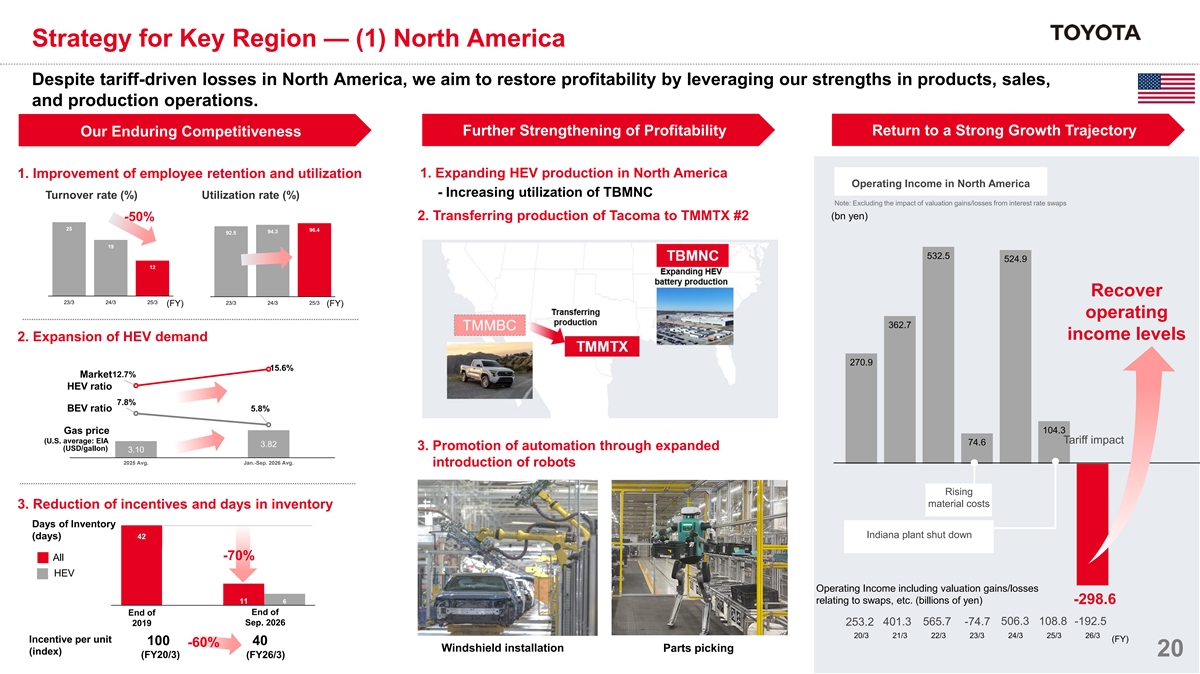
Strategy for Key Region — (1) North America Despite tariff-driven losses in North America, we aim to restore profitability by leveraging our strengths in products, sales, and production operations. Despite tariff-driven losses in North America, we aim to restore profitability by leveraging our strengths in products, sales, and production operations. Further Strengthening of Profitability Return to a Strong Growth Trajectory Our Enduring Competitiveness 1. Expanding HEV production in North America 1. Improvement of employee retention and utilization Operating Income in North America - Increasing utilization of TBMNC Turnover rate (%) Utilization rate (%) Note: Excluding the impact of valuation gains/losses from interest rate swaps (bn yen) 2. Transferring production of Tacoma to TMMTX #2 -50% 25 96.4 94.3 92.5 19 532.5 524.9 12 Recover 23/3 24/3 25/3 23/3 24/3 25/3 (FY) (FY) operating 362.7 income levels 2. Expansion of HEV demand 270.9 15.6% Market12.7% HEV ratio 7.8% BEV ratio 5.8% 104.3 Gas price (U.S. average: EIA Tariff impact 74.6 3.82 3. Promotion of automation through expanded (USD/gallon) 3.10 2025 Avg. Jan.-Sep. 2026 Avg. introduction of robots Rising material costs 3. Reduction of incentives and days in inventory Days of Inventory Indiana plant shut down (days) 42 -70% All HEV Operating Income including valuation gains/losses 資材高騰 11 6 relating to swaps, etc. (billions of yen) -298.6 End of End of 506.3 108.8 -192.5 Sep. 2026 253.2 401.3 565.7 -74.7 2019 20/3 21/3 22/3 23/3 24/3 25/3 26/3 (FY) Incentive per unit 100 40 -60% Windshield installation Parts picking (index) 20 (FY20/3) (FY26/3) HEV
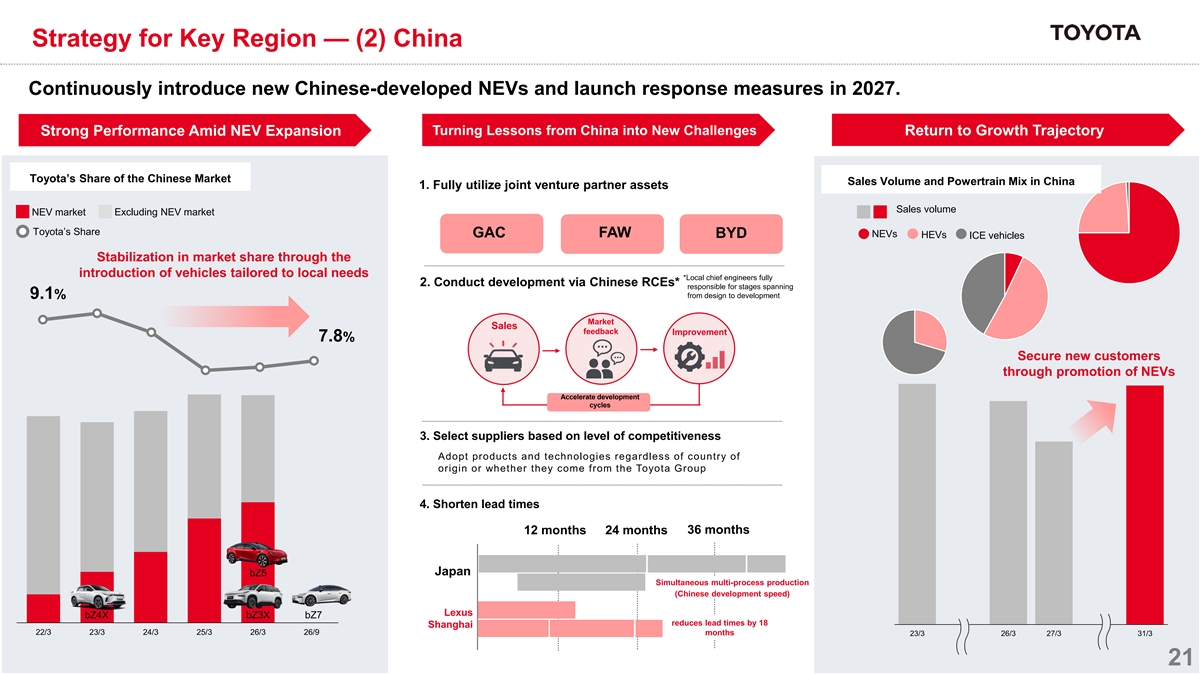
Strategy for Key Region — (2) China Continuously introduce new Chinese-developed NEVs and launch response measures in 2027. Turning Lessons from China into New Challenges Return to Growth Trajectory Strong Performance Amid NEV Expansion Toyota’s Share of the Chinese Market Sales Volume and Powertrain Mix in China 1. Fully utilize joint venture partner assets Sales volume NEV market Excluding NEV market Toyota’s Share GAC FAW NEVs BYD HEVs ICE vehicles Stabilization in market share through the introduction of vehicles tailored to local needs *Local chief engineers fully 2. Conduct development via Chinese RCEs* responsible for stages spanning from design to development 9.1% Market Sales feedback Improvement 7.8% Secure new customers through promotion of NEVs Accelerate development cycles 3. Select suppliers based on level of competitiveness Adopt products and technologies regardless of country of origin or whether they come from the Toyota Group 4. Shorten lead times 12 months 24 months 36 months Japan bZ5 Simultaneous multi-process production (Chinese development speed) Lexus bZ4X bZ3X bZ7 reduces lead times by 18 Shanghai 22/3 23/3 24/3 25/3 26/3 26/9 months 23/3 26/3 27/3 31/3 21 21
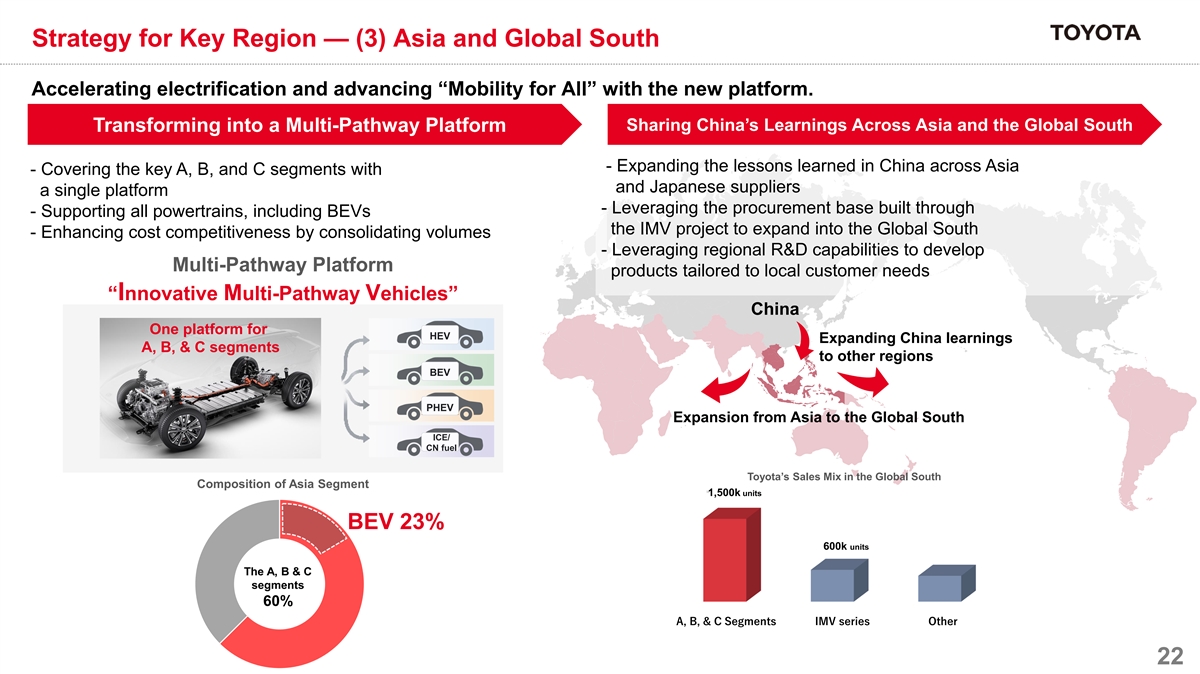
Strategy for Key Region — (3) Asia and Global South Accelerating electrification and advancing “Mobility for All” with the new platform. Sharing China’s Learnings Across Asia and the Global South Transforming into a Multi-Pathway Platform - Expanding the lessons learned in China across Asia - Covering the key A, B, and C segments with and Japanese suppliers a single platform - Leveraging the procurement base built through - Supporting all powertrains, including BEVs the IMV project to expand into the Global South - Enhancing cost competitiveness by consolidating volumes - Leveraging regional R&D capabilities to develop Multi-Pathway Platform products tailored to local customer needs “Innovative Multi-Pathway Vehicles” China One platform for HEV Expanding China learnings A, B, & C segments to other regions BEV 60万台 PHEV Expansion from Asia to the Global South ICE/ CN fuel Toyota’s Sales Mix in the Global South Composition of Asia Segment 1,500k units BEV 23% 600k units The A, B & C segments 60% A, B, & C Segments IMV series Other 22
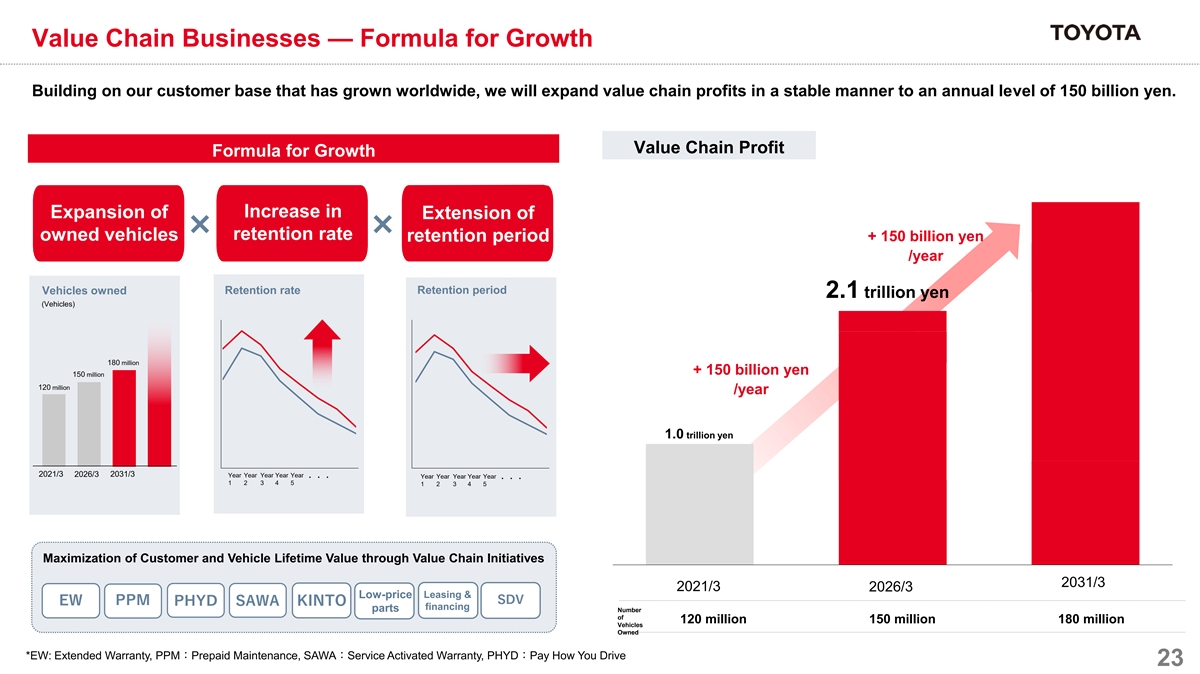
Value Chain Businesses — Formula for Growth Building on our customer base that has grown worldwide, we will expand value chain profits in a stable manner to an annual level of 150 billion yen. Value Chain Profit Formula for Growth Increase in Expansion of Extension of retention rate owned vehicles + 150 billion yen retention period /year Vehicles owned Retention rate Retention period 2.1 trillion yen (Vehicles) 180 million + 150 billion yen 150 million 120 million /year 1.0 trillion yen 2021/3 2026/3 2031/3 Year Year Year Year Year Year Year Year Year Year ・・・ ・・・ 1 2 3 4 5 1 2 3 4 5 Maximization of Customer and Vehicle Lifetime Value through Value Chain Initiatives 2031/3 2021/3 2026/3 Leasing & Low-price financing parts Number of 120 million 150 million 180 million Vehicles Owned *EW: Extended Warranty, PPM:Prepaid Maintenance, SAWA:Service Activated Warranty, PHYD:Pay How You Drive 23
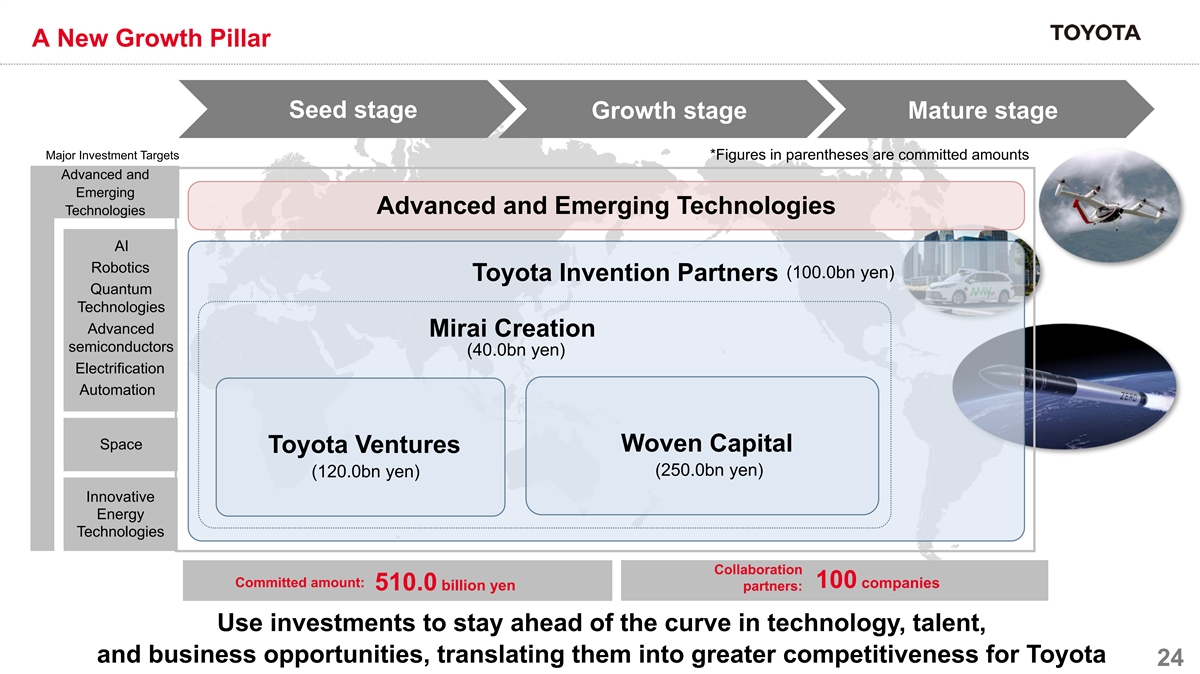
A New Growth Pillar Seed stage Growth stage Mature stage Major Investment Targets *Figures in parentheses are committed amounts Advanced and Emerging Advanced and Emerging Technologies Technologies AI Robotics (100.0bn yen) Toyota Invention Partners Quantum Technologies Advanced Mirai Creation semiconductors (40.0bn yen) Electrification Automation Space Woven Capital Toyota Ventures (250.0bn yen) (120.0bn yen) Innovative Energy Technologies Collaboration Committed amount: 100 companies 510.0 billion yen partners: Use investments to stay ahead of the curve in technology, talent, and business opportunities, translating them into greater competitiveness for Toyota 24 (1,000億円) Toyota Invention Partners
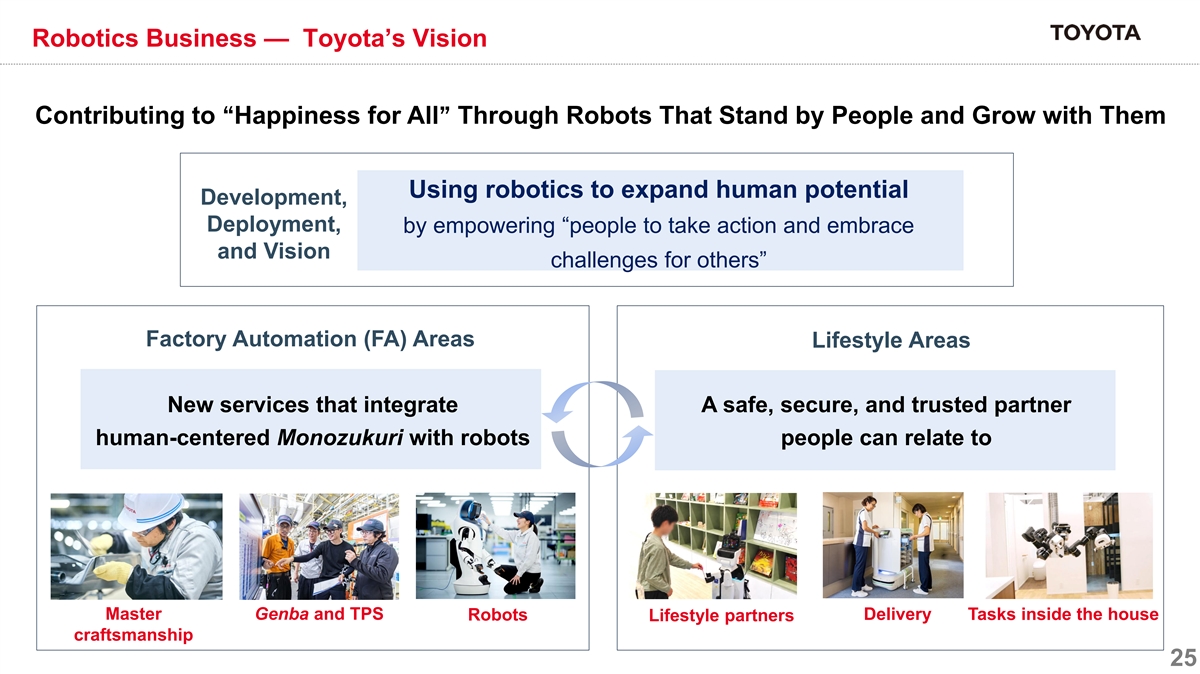
Robotics Business — Toyota’s Vision Contributing to Happiness for All Through Robots That Stand by People and Grow with Them “” Using robotics to expand human potential Development, Deployment, by empowering “people to take action and embrace and Vision challenges for others” Factory Automation (FA) Areas Lifestyle Areas New services that integrate A safe, secure, and trusted partner human-centered Monozukuri with robots people can relate to 25 Master Genba and TPS Delivery Robots Tasks inside the house Lifestyle partners craftsmanship 25 匠の技能現場・TPS
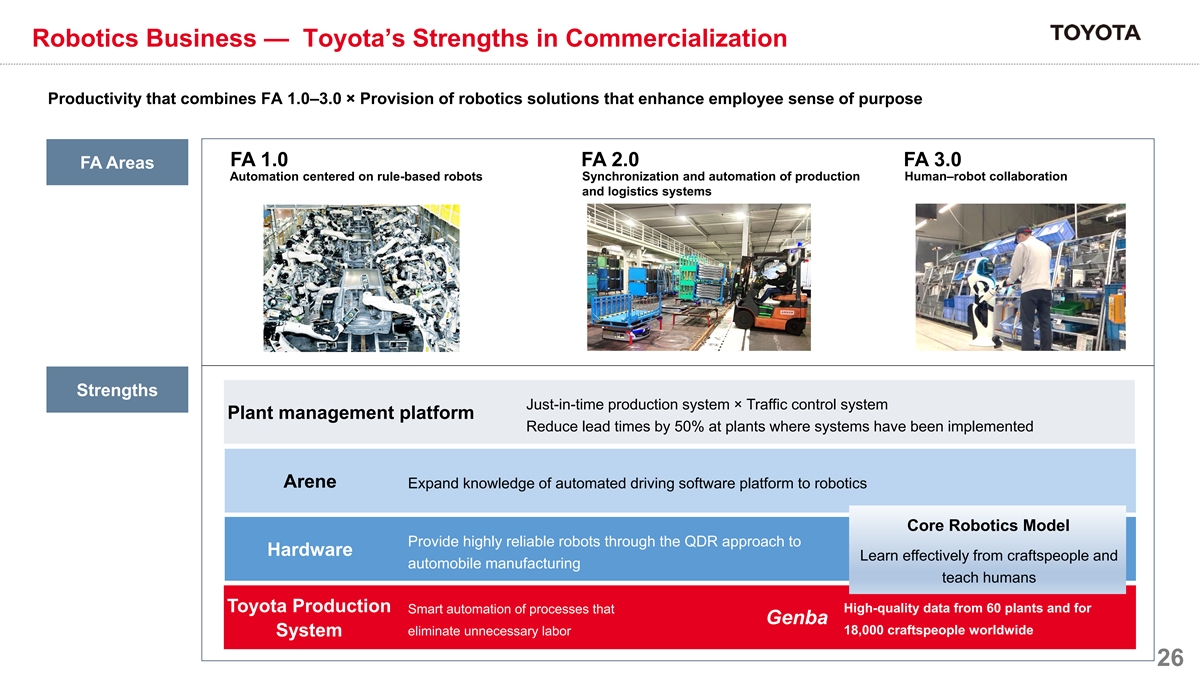
Robotics Business — Toyota’s Strengths in Commercialization Productivity that combines FA 1.0–3.0 × Provision of robotics solutions that enhance employee sense of purpose FA 1.0 FA 2.0 FA 3.0 FA Areas Automation centered on rule-based robots Synchronization and automation of production Human–robot collaboration and logistics systems Strengths Just-in-time production system × Traffic control system Plant management platform Reduce lead times by 50% at plants where systems have been implemented Arene Expand knowledge of automated driving software platform to robotics Core Robotics Model Provide highly reliable robots through the QDR approach to Hardware Learn effectively from craftspeople and automobile manufacturing teach humans Toyota Production High-quality data from 60 plants and for Smart automation of processes that Genba 18,000 craftspeople worldwide eliminate unnecessary labor System 26
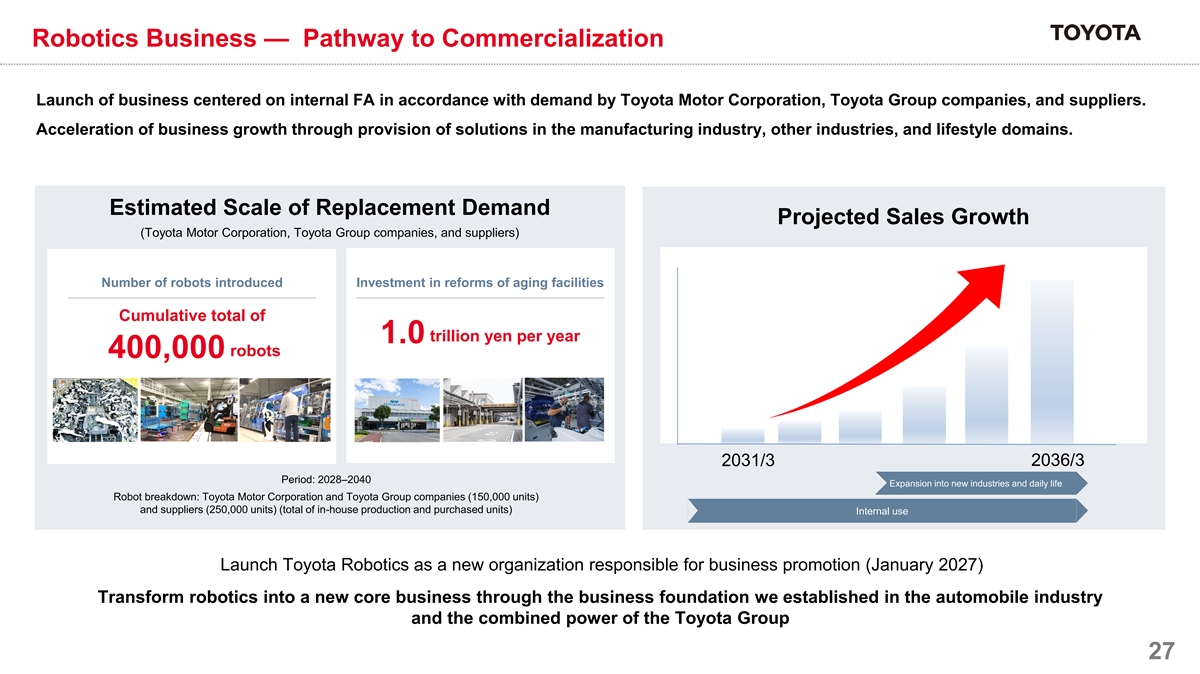
Robotics Business — Pathway to Commercialization Launch of business centered on internal FA in accordance with demand by Toyota Motor Corporation, Toyota Group companies, and suppliers. Acceleration of business growth through provision of solutions in the manufacturing industry, other industries, and lifestyle domains. Estimated Scale of Replacement Demand Projected Sales Growth (Toyota Motor Corporation, Toyota Group companies, and suppliers) Number of robots introduced Investment in reforms of aging facilities Cumulative total of trillion yen per year 1.0 robots 400,000 2031/3 2036/3 Period: 2028–2040 Expansion into new industries and daily life Robot breakdown: Toyota Motor Corporation and Toyota Group companies (150,000 units) and suppliers (250,000 units) (total of in-house production and purchased units) Internal use Launch Toyota Robotics as a new organization responsible for business promotion (January 2027) Transform robotics into a new core business through the business foundation we established in the automobile industry and the combined power of the Toyota Group 27
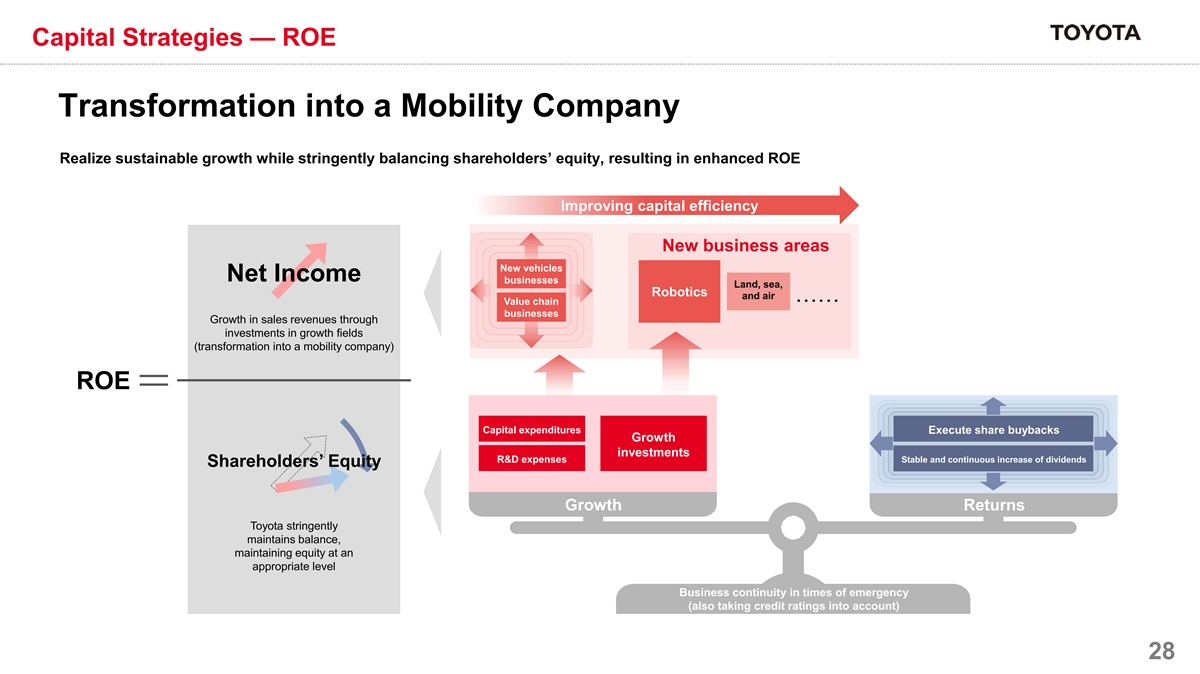
Capital Strategies — ROE Transformation into a Mobility Company Transformation into a Mobility Company Realize sustainable growth while stringently balancing shareholders’ equity, resulting in enhanced ROE Improving capital efficiency New business areas New vehicles Net Income businesses Land, sea, Robotics and air …… Value chain businesses Growth in sales revenues through investments in growth fields (transformation into a mobility company) ROE Capital expenditures Execute share buybacks Growth investments R&D expenses Stable and continuous increase of dividends Shareholders’ Equity Growth Returns Toyota stringently maintains balance, maintaining equity at an appropriate level Business continuity in times of emergency (also taking credit ratings into account) 28
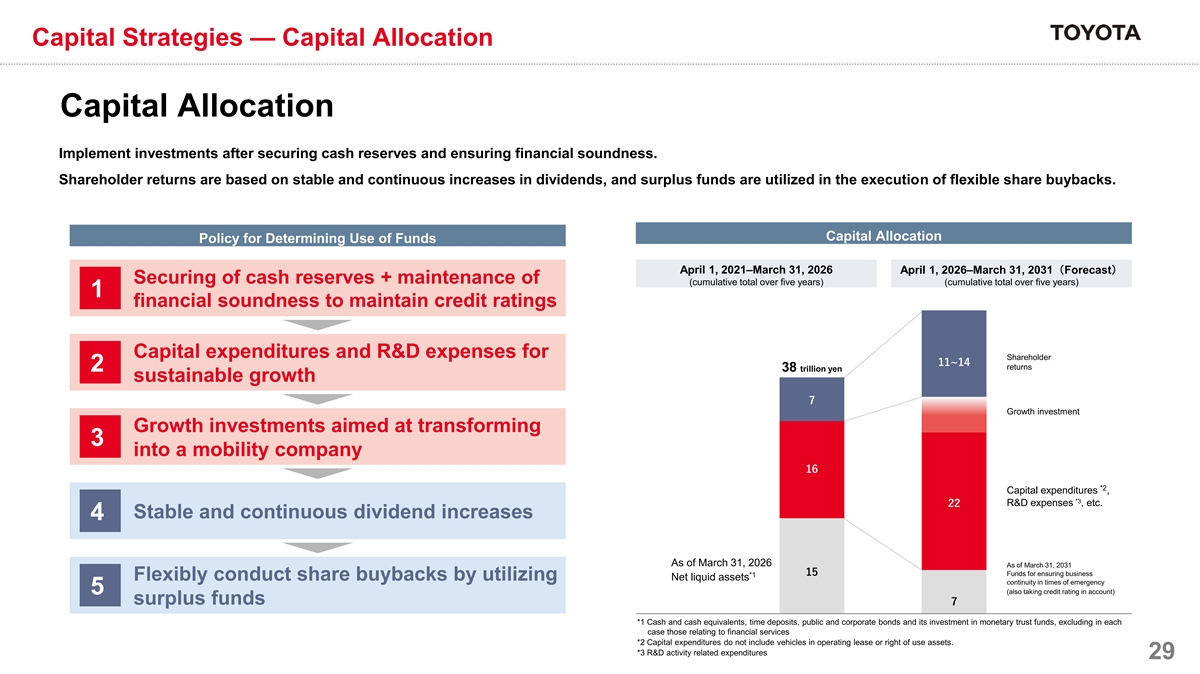
Capital Strategies — Capital Allocation Capital Allocation Capital Allocation Implement investments after securing cash reserves and ensuring financial soundness. Shareholder returns are based on stable and continuous increases in dividends, and surplus funds are utilized in the execution of flexible share buybacks. Capital Allocation Policy for Determining Use of Funds April 1, 2021–March 31, 2026 April 1, 2026–March 31, 2031(Forecast) Securing of cash reserves + maintenance of (cumulative total over five years) (cumulative total over five years) 1 financial soundness to maintain credit ratings Capital expenditures and R&D expenses for Shareholder 11~14 returns 2 38 trillion yen sustainable growth 7 Growth investment Growth investments aimed at transforming 3 into a mobility company 16 *2 Capital expenditures , *3 R&D expenses , etc. 22 Stable and continuous dividend increases 4 As of March 31, 2026 As of March 31, 2031 15 Funds for ensuring business *1 Net liquid assets Flexibly conduct share buybacks by utilizing continuity in times of emergency (also taking credit rating in account) 5 surplus funds 7 2 4 *1 Cash and cash equivalents, time deposits, public and corporate bonds and its investment in monetary trust funds, excluding in each case those relating to financial services *2 Capital expenditures do not include vehicles in operating lease or right of use assets. *3 R&D activity related expenditures 29
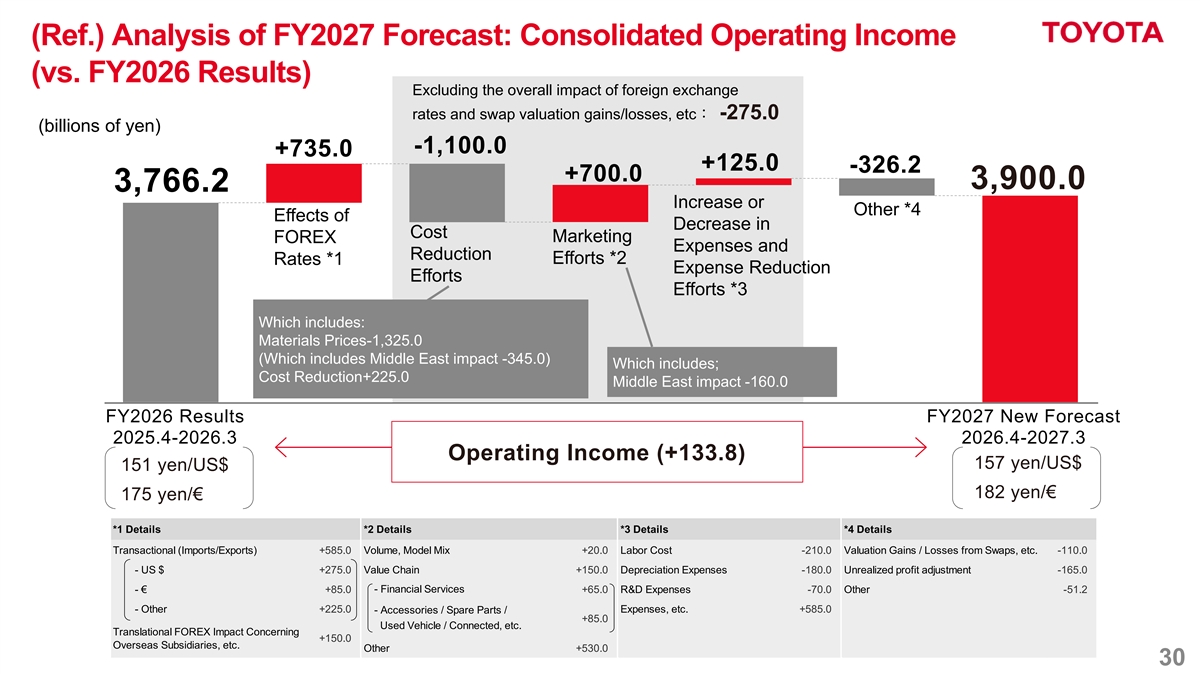
色情報※カラーモデル:すべてRGB (Ref.) Analysis of FY2027 Forecast: Consolidated Operating Income <グラフ> (vs. FY2026 Results) 赤:235緑:010青:030 Excluding the overall impact of foreign exchange 赤:135緑:135青:135 rates and swap valuation gains/losses, etc: -275.0 (billions of yen) -1,100.0 +735.0 <ご留意頂きたい点> +125.0 -326.2 ・下の【内訳】は本番資料の +700.0 3,900.0 3,766.2 文章形式から表形式に変更。 Increase or PPT上で修正が可能。 Other *4 Effects of Decrease in Cost Marketing FOREX Expenses and Reduction Efforts *2 Rates *1 Expense Reduction Efforts Efforts *3 Which includes: Materials Prices-1,325.0 (Which includes Middle East impact -345.0) Which includes; Cost Reduction+225.0 Middle East impact -160.0 FY2026 Results FY2027 New Forecast 2025.4-2026.3 2026.4-2027.3 Operating Income (+133.8) 157 yen/US$ 151 yen/US$ 182 yen/€ 175 yen/€ *1 Details *2 Details *3 Details *4 Details Transactional (Imports/Exports) +585.0 Volume, Model Mix +20.0 Labor Cost -210.0 Valuation Gains / Losses from Swaps, etc. -110.0 - US $ +275.0 Value Chain +150.0 Depreciation Expenses -180.0 Unrealized profit adjustment -165.0 - Financial Services - € +85.0 +65.0 R&D Expenses -70.0 Other -51.2 - Other +225.0 Expenses, etc. +585.0 - Accessories / Spare Parts / +85.0 Used Vehicle / Connected, etc. Translational FOREX Impact Concerning +150.0 Overseas Subsidiaries, etc. Other +530.0 30 内訳 内訳 内訳 内訳 △ -米ドル△△△ -ユーロ△△△ -その他通貨
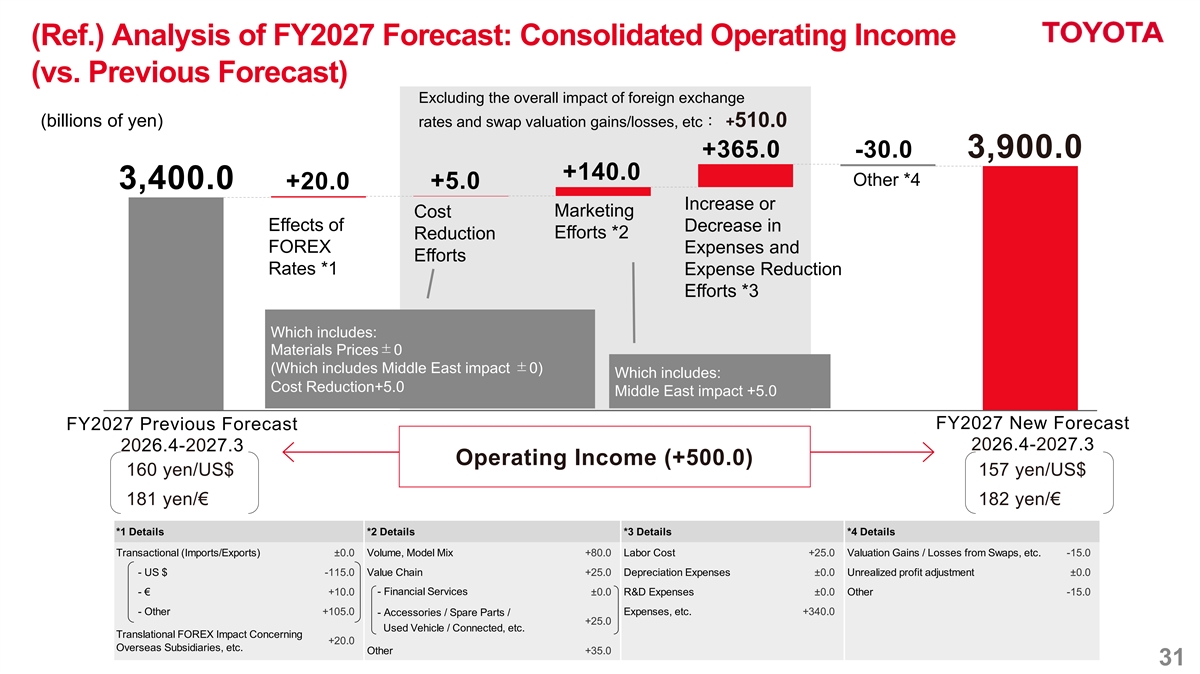
<修正履歴> 「作成中」テキストを外してから、 (Ref.) Analysis of FY2027 Forecast: Consolidated Operating Income 修正をした場合は、 (vs. Previous Forecast) 完了の日付と時刻の入力をお願いしま Excluding the overall impact of foreign exchange す (Teamsのチャットに、事前連絡いれてます (billions of yen) rates and swap valuation gains/losses, etc: +510.0 か? +365.0 -30.0 3,900.0 完了後は、チャットに完了の投稿をお願いしま +140.0す) Other *4 3,400.0 +5.0 +20.0 Increase or Marketing Cost 修正①: Effects of Decrease in Efforts *2 Reduction 修正②: FOREX Expenses and Efforts Rates *1 Expense Reduction Efforts *3 Which includes: Materials Prices±0 (Which includes Middle East impact ±0) Which includes: Cost Reduction+5.0 Middle East impact +5.0 FY2027 New Forecast FY2027 Previous Forecast 2026.4-2027.3 2026.4-2027.3 Operating Income (+500.0) 160 yen/US$ 157 yen/US$ 181 yen/€ 182 yen/€ *1 Details *2 Details *3 Details *4 Details Transactional (Imports/Exports) ±0.0 Volume, Model Mix +80.0 Labor Cost +25.0 Valuation Gains / Losses from Swaps, etc. -15.0 - US $ -115.0 Value Chain +25.0 Depreciation Expenses ±0.0 Unrealized profit adjustment ±0.0 - € +10.0 - Financial Services ±0.0 R&D Expenses ±0.0 Other -15.0 - Other +105.0 Expenses, etc. +340.0 - Accessories / Spare Parts / +25.0 Used Vehicle / Connected, etc. Translational FOREX Impact Concerning +20.0 Overseas Subsidiaries, etc. Other +35.0 31
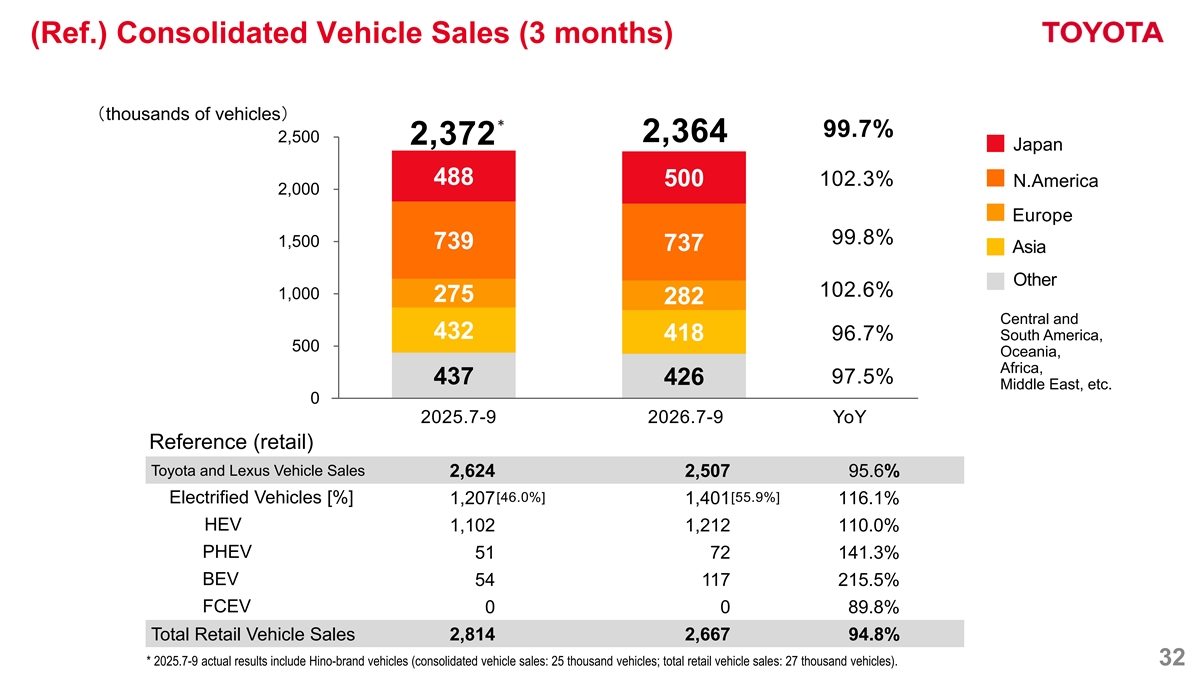
(Ref.) Consolidated Vehicle Sales (3 months) (thousands of vehicles) * 99.7% 2,500 2,364 2,372 Japan 488 102.3% 500 N.America 2,000 Europe 99.8% 1,500 739 737 Asia Other 102.6% 1,000 275 282 Central and 432 96.7% South America, 418 500 Oceania, Africa, 97.5% 437 426 Middle East, etc. 0 2025.7-9 2026.7-9 YoY Reference (retail) Toyota and Lexus Vehicle Sales 2,624 2,507 95.6% [46.0%] [55.9%] Electrified Vehicles [%] 1,207 1,401 116.1% HEV 1,102 1,212 110.0% PHEV 51 72 141.3% BEV 54 117 215.5% FCEV 0 0 89.8% Total Retail Vehicle Sales 2,814 2,667 94.8% * 2025.7-9 actual results include Hino-brand vehicles (consolidated vehicle sales: 25 thousand vehicles; total retail vehicle sales: 27 thousand vehicles). 32
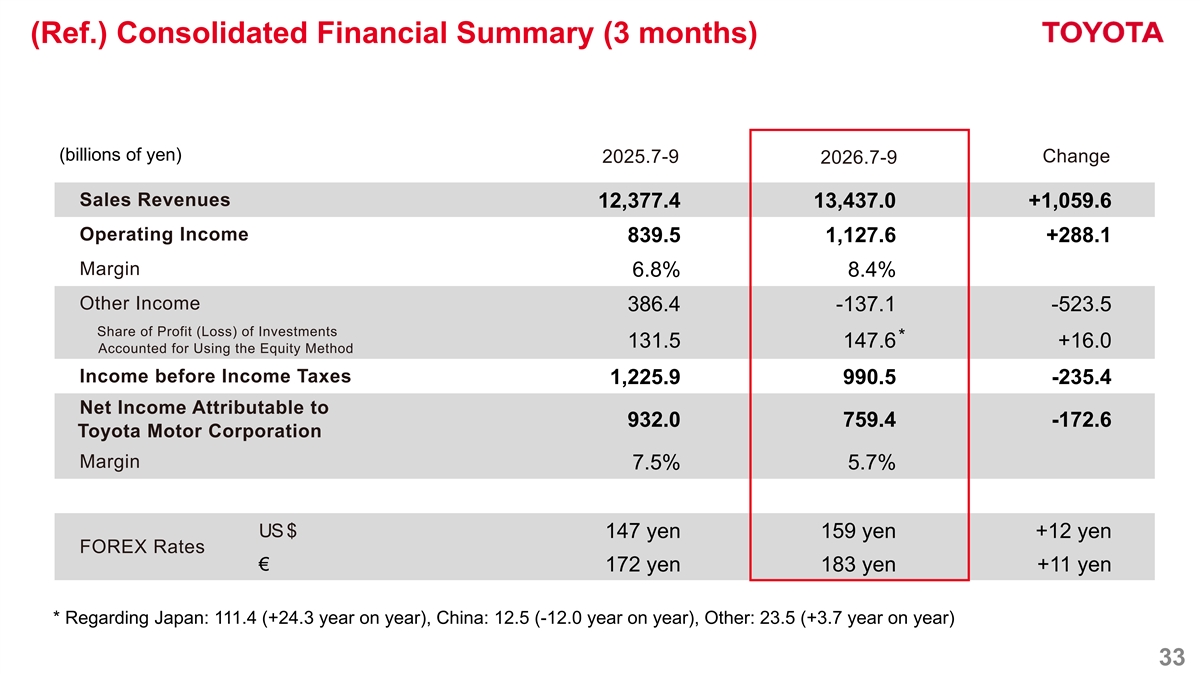
(Ref.) Consolidated Financial Summary (3 months) 作成中 (billions of yen) Change 2025.7-9 2026.7-9 Sales Revenues 12,377.4 13,437.0 +1,059.6 Operating Income 839.5 1,127.6 +288.1 Margin 6.8% 8.4% Other Income 386.4 -137.1 -523.5 Share of Profit (Loss) of Investments * 131.5 147.6 +16.0 Accounted for Using the Equity Method Income before Income Taxes 1,225.9 990.5 -235.4 Net Income Attributable to 932.0 759.4 -172.6 Toyota Motor Corporation Margin 7.5% 5.7% US $ 147 yen 159 yen +12 yen FOREX Rates € 172 yen 183 yen +11 yen * Regarding Japan: 111.4 (+24.3 year on year), China: 12.5 (-12.0 year on year), Other: 23.5 (+3.7 year on year) 33
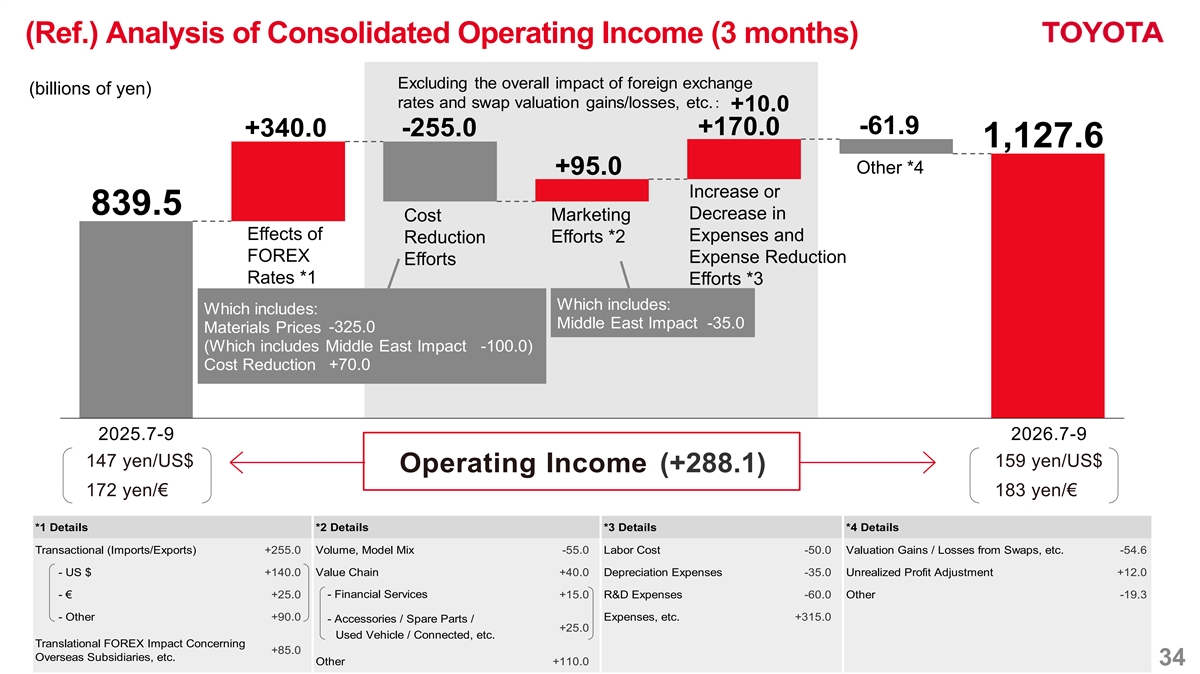
(Ref.) Analysis of Consolidated Operating Income (3 months) Excluding the overall impact of foreign exchange (billions of yen) rates and swap valuation gains/losses, etc.: +10.0 作成中 作成中 -61.9 +170.0 -255.0 +340.0 1,127.6 Other *4 +95.0 Increase or 839.5 Decrease in Marketing Cost Effects of Expenses and Efforts *2 Reduction FOREX Expense Reduction Efforts Rates *1 Efforts *3 Which includes: Which includes: Middle East Impact -35.0 Materials Prices -325.0 (Which includes Middle East Impact -100.0) Cost Reduction +70.0 2025.7-9 2026.7-9 147 yen/US$ 159 yen/US$ Operating Income (+288.1) 172 yen/€ 183 yen/€ * *1 1 D De et ta aiills s * *2 2 D De et ta aiills s * *3 3 D De et ta aiills s * *4 4 D De et ta aiills s T Tr ra an nsa sact ctiio on na all ( (IIm mp po or rtts/ s/E Ex xp po or rtts) s) + +2 25 55 5..0 0 V Vo ollu um me e,, M Mo od de ell M Miix x - -5 55 5..0 0 L La ab bo or r C Co ost st - -5 50 0..0 0 V Va allu ua attiio on n G Ga aiin ns s // L Lo osse sses s ffr ro om m S Sw wa ap ps, s, e ettc. c. - -5 54 4..6 6 - - U US S $ $ + +1 14 40 0..0 0 V Va allu ue e C Ch ha aiin n + +4 40 0..0 0 D De ep pr re eci cia attiio on n E Ex xp pe en nse ses s - -3 35 5..0 0 U Un nr re ea alliize zed d P Pr ro offiitt A Ad djju ust stm me en ntt + +1 12 2..0 0 - Financial Services - - € € + +2 25 5..0 0 - Financial Services + +1 15 5..0 0 R R& &D D E Ex xp pe en nse ses s - -6 60 0..0 0 O Otth he er r - -1 19 9..3 3 - Other +90.0 Expenses, etc. +315.0 - Other +90.0 Expenses, etc. +315.0 - - A Acce ccesso ssor riie es s // S Sp pa ar re e P Pa ar rtts s // + +2 25 5..0 0 Used Vehicle / Connected, etc. Used Vehicle / Connected, etc. T Tr ra an nsl sla attiio on na all F FO OR RE EX X IIm mp pa act ct C Co on nce cer rn niin ng g +85.0 +85.0 O Ov ve er rse sea as s S Su ub bsi sid diia ar riie es, s, e ettc. c. Other +110.0 Other +110.0 34
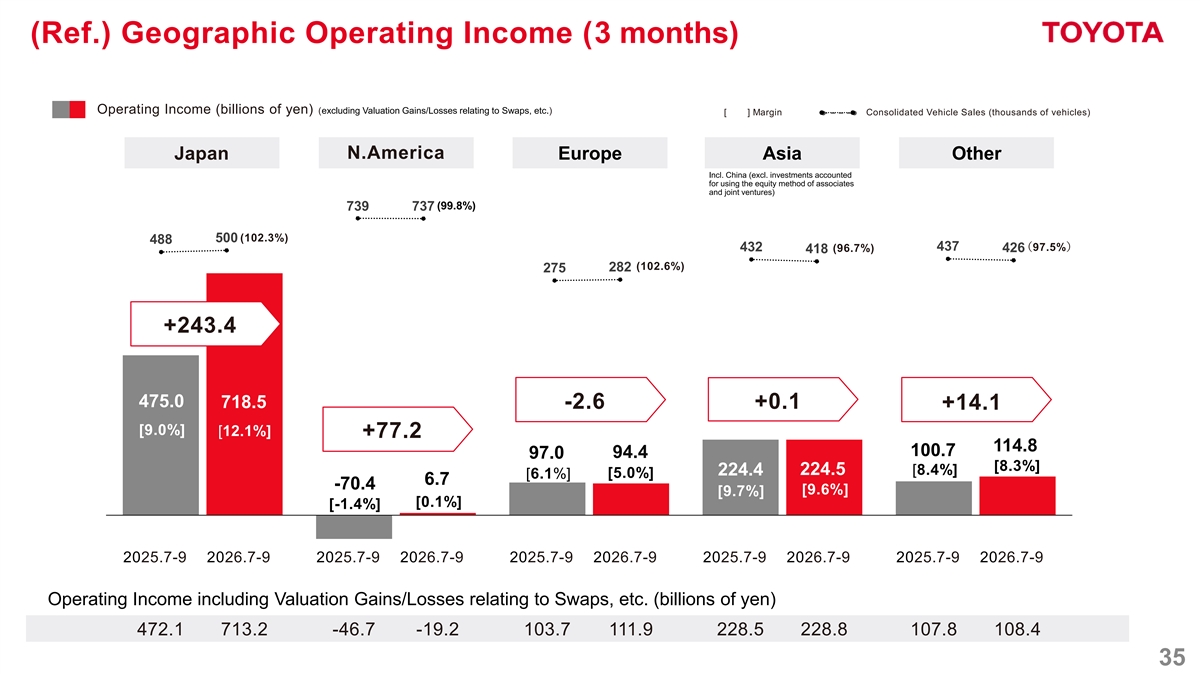
(Ref.) Geographic Operating Income (3 months) 10/28 Operating Income (billions of yen) (excluding Valuation Gains/Losses relating to Swaps, etc.) [ ] Margin Consolidated Vehicle Sales (thousands of vehicles) N.America Japan Europe Asia Other Incl. China (excl. investments accounted for using the equity method of associates and joint ventures) (99.8%) 739 737 500 (102.3%) 488 437 (97.5%) 432 (96.7%) 426 418 (102.6%) 282 275 +243.4 475.0 718.5 -2.6 +0.1 +14.1 [9.0%] [12.1%] +77.2 114.8 100.7 94.4 97.0 [8.3%] 224.5 [8.4%] 224.4 [5.0%] [6.1%] 6.7 -70.4 [9.6%] [9.7%] [0.1%] [-1.4%] 2025.7-9 2026.7-9 2025.7-9 2026.7-9 2025.7-9 2026.7-9 2025.7-9 2026.7-9 2025.7-9 2026.7-9 Operating Income including Valuation Gains/Losses relating to Swaps, etc. (billions of yen) 472.1 713.2 -46.7 -19.2 103.7 111.9 228.5 228.8 107.8 108.4 35
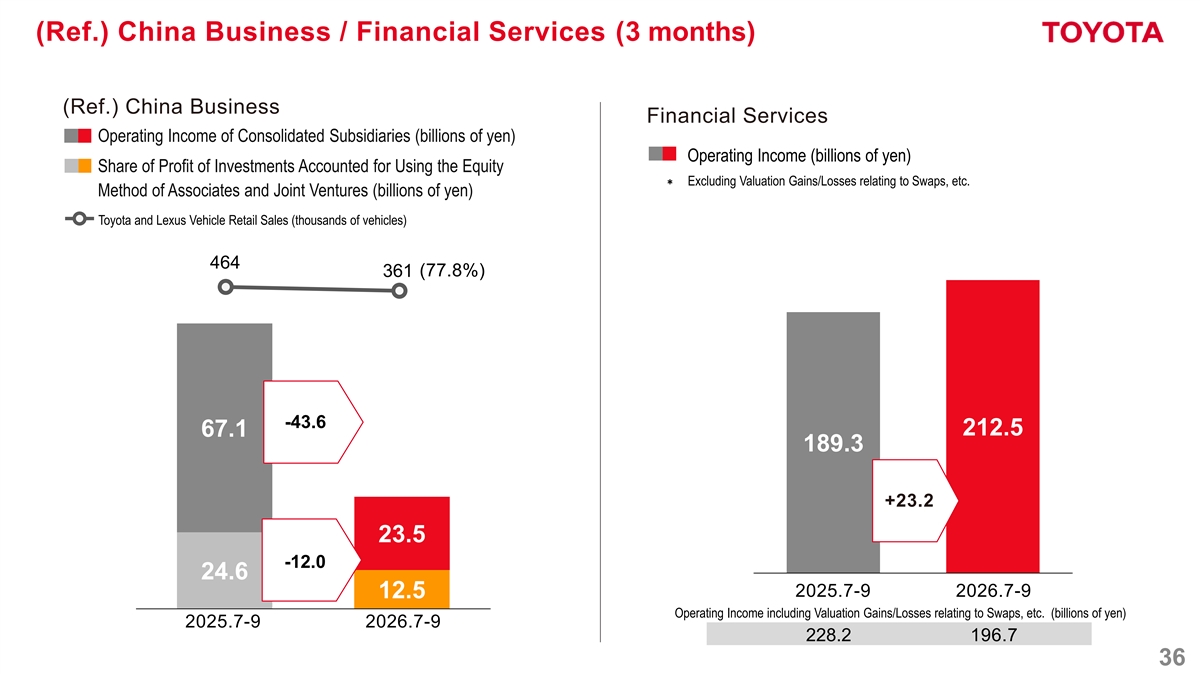
(Ref.) China Business / Financial Services (3 months) (Ref.) China Business Financial Services Operating Income of Consolidated Subsidiaries (billions of yen) Operating Income (billions of yen) Share of Profit of Investments Accounted for Using the Equity * Excluding Valuation Gains/Losses relating to Swaps, etc. Method of Associates and Joint Ventures (billions of yen) Toyota and Lexus Vehicle Retail Sales (thousands of vehicles) 464 361 (77.8%) -43.6 212.5 67.1 189.3 +23.2 23.5 -12.0 24.6 2025.7-9 2026.7-9 12.5 Operating Income including Valuation Gains/Losses relating to Swaps, etc. (billions of yen) 2025.7-9 2026.7-9 228.2 196.7 36
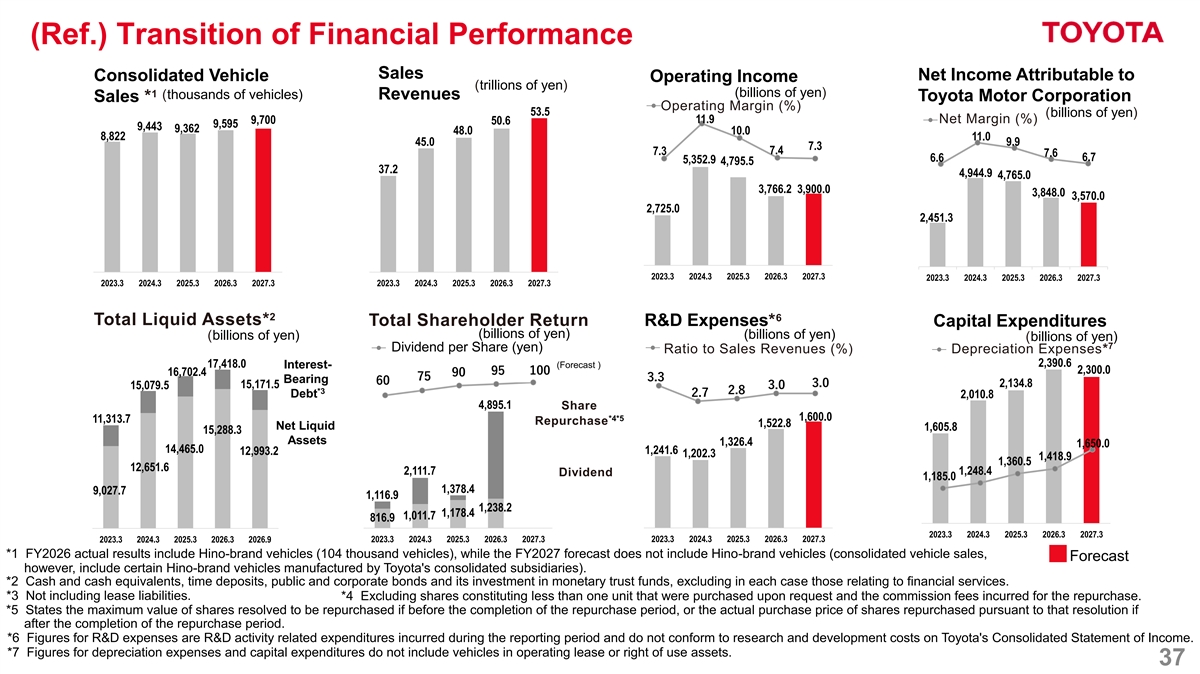
(Ref.) Transition of Financial Performance Sales Net Income Attributable to Consolidated Vehicle Operating Income (trillions of yen) (billions of yen) 1 (thousands of vehicles) Revenues Toyota Motor Corporation Sales * Operating Margin (%) 53.5 (billions of yen) 11.9 Net Margin (%) 9,700 50.6 9,595 9,443 9,362 48.0 10.0 8,822 11.0 45.0 9.9 7.3 7.4 7.3 7.6 6.7 6.6 5,352.9 4,795.5 37.2 4,944.9 4,765.0 3,766.2 3,900.0 3,848.0 3,570.0 2,725.0 2,451.3 2023.3 2024.3 2025.3 2026.3 2027.3 2023.3 2024.3 2025.3 2026.3 2027.3 2023.3 2024.3 2025.3 2026.3 2027.3 2023.3 2024.3 2025.3 2026.3 2027.3 2 6 Total Liquid Assets* Total Shareholder Return R&D Expenses* Capital Expenditures (billions of yen) (billions of yen) (billions of yen) (billions of yen) 7 Dividend per Share (yen) Ratio to Sales Revenues (%) Depreciation Expenses* 2,390.6 17,418.0 Interest- (Forecast ) 2,300.0 100 95 16,702.4 90 75 3.3 Bearing 60 3.0 2,134.8 15,171.5 3.0 15,079.5 *3 2.8 2.7 Debt 2,010.8 4,895.1 Share 1,600.0 *4*5 11,313.7 Repurchase 1,522.8 Net Liquid 1,605.8 15,288.3 Assets 1,326.4 1,650.0 14,465.0 1,241.6 12,993.2 1,202.3 1,418.9 1,360.5 12,651.6 2,111.7 1,248.4 Dividend 1,185.0 1,378.4 9,027.7 1,116.9 1,238.2 1,178.4 1,011.7 816.9 2023.3 2024.3 2025.3 2026.3 2027.3 2023.3 2024.3 2025.3 2026.3 2026.9 2023.3 2024.3 2025.3 2026.3 2027.3 2023.3 2024.3 2025.3 2026.3 2027.3 *1 FY2026 actual results include Hino-brand vehicles (104 thousand vehicles), while the FY2027 forecast does not include Hino-brand vehicles (consolidated vehicle sales, Forecast however, include certain Hino-brand vehicles manufactured by Toyota's consolidated subsidiaries). *2 Cash and cash equivalents, time deposits, public and corporate bonds and its investment in monetary trust funds, excluding in each case those relating to financial services. *3 Not including lease liabilities. *4 Excluding shares constituting less than one unit that were purchased upon request and the commission fees incurred for the repurchase. *5 States the maximum value of shares resolved to be repurchased if before the completion of the repurchase period, or the actual purchase price of shares repurchased pursuant to that resolution if after the completion of the repurchase period. *6 Figures for R&D expenses are R&D activity related expenditures incurred during the reporting period and do not conform to research and development costs on Toyota's Consolidated Statement of Income. *7 Figures for depreciation expenses and capital expenditures do not include vehicles in operating lease or right of use assets. 37
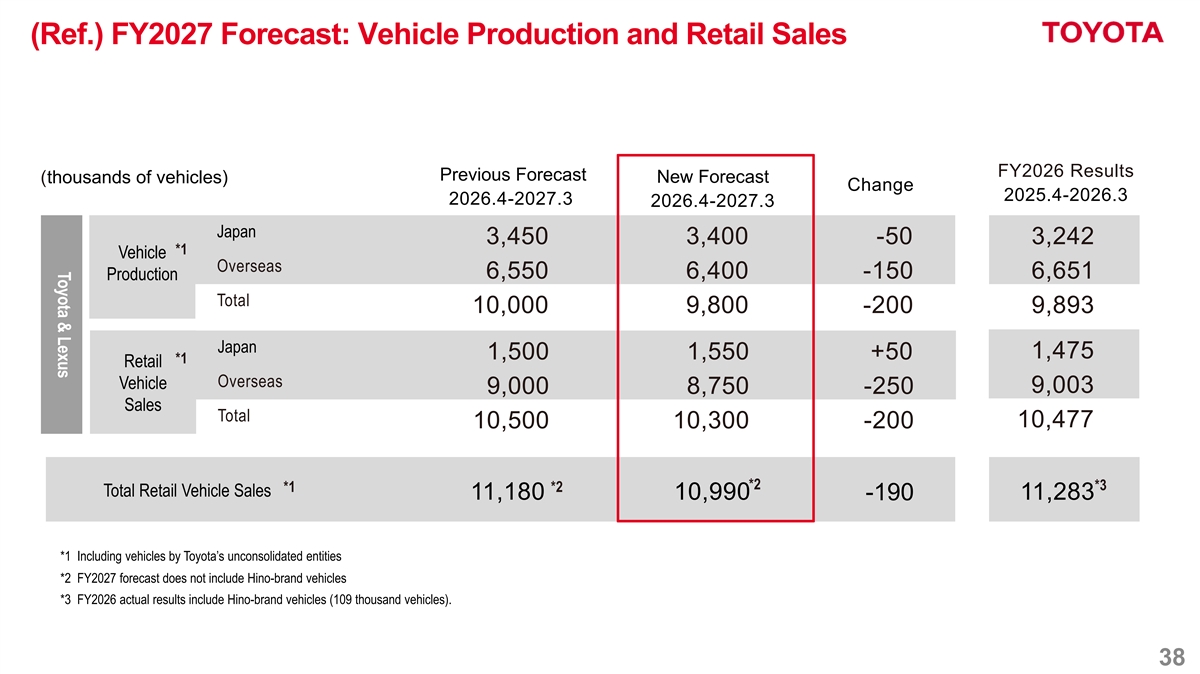
Toyota & Lexus (Ref.) FY2027 Forecast: Vehicle Production and Retail Sales FY2026 Results Previous Forecast New Forecast (thousands of vehicles) Change 2025.4-2026.3 2026.4-2027.3 2026.4-2027.3 Japan 3,450 3,400 -50 3,242 *1 Vehicle 生産 Overseas 6,550 6,400 -150 6,651 Production Total 10,000 9,800 -200 9,893 Japan 1,475 1,500 1,550 +50 *1 Retail Overseas Vehicle 9,003 9,000 8,750 -250 Sales Total 10,477 10,500 10,300 -200 *2 *3 *1 *2 Total Retail Vehicle Sales 11,180 10,990 -190 11,283 *1 Including vehicles by Toyota’s unconsolidated entities *2 FY2027 forecast does not include Hino-brand vehicles *3 FY2026 actual results include Hino-brand vehicles (109 thousand vehicles). 38
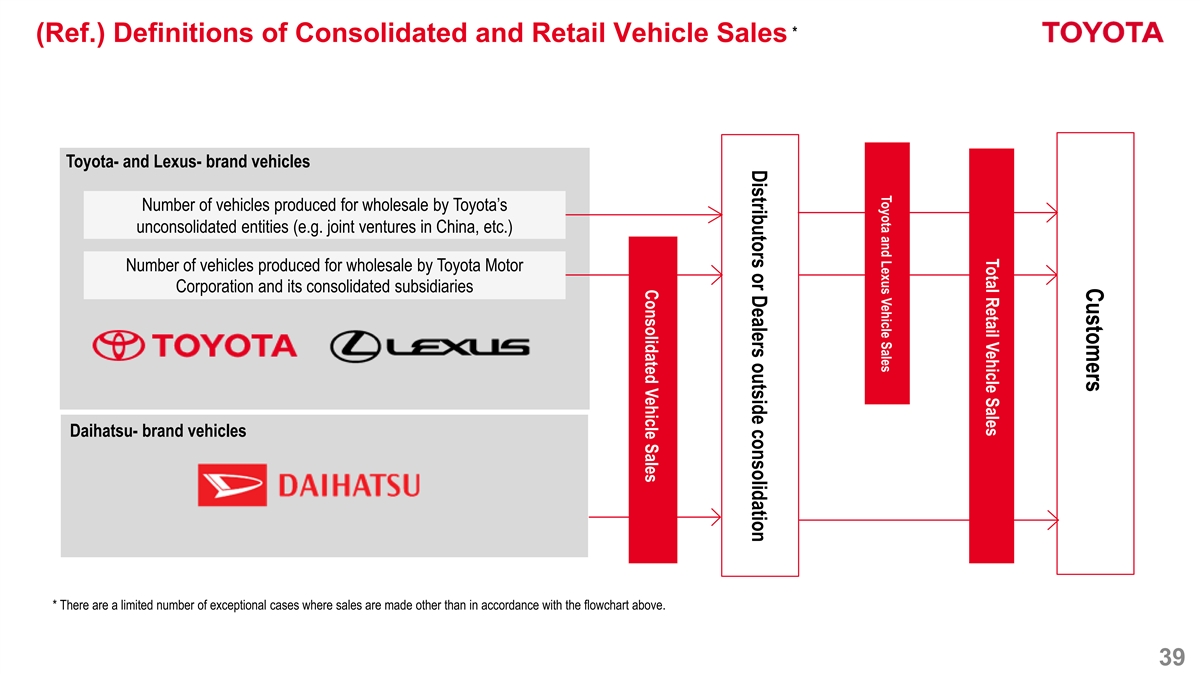
Customers Total Retail Vehicle Sales Toyota and Lexus Vehicle Sales Distributors or Dealers outside consolidation Consolidated Vehicle Sales * (Ref.) Definitions of Consolidated and Retail Vehicle Sales Toyota- and Lexus- brand vehicles Number of vehicles produced for wholesale by Toyota’s unconsolidated entities (e.g. joint ventures in China, etc.) Number of vehicles produced for wholesale by Toyota Motor Corporation and its consolidated subsidiaries Daihatsu- brand vehicles * There are a limited number of exceptional cases where sales are made other than in accordance with the flowchart above. 39