
1 Q3 2026 Investor Presentation November 5, 2026
Certain statements contained in this presentation, other than purely historical information, including, but not limited to estimates, projections, statements relating to our business plans, objectives and expected operating results, financial outlook and cost synergies, and the assumptions upon which those statements are based, are forward-looking statements. Statements preceded by, followed by or that otherwise include the word “believes,” “expects,” “anticipates,” “intends,” “projects,” “estimates,” “plans,” “priorities,” “may increase,” “may fluctuate,” and similar expressions or future or conditional verbs such as “will,” “should,” “would,” “may,” and “could,” are generally forward- looking in nature and not historical facts. Where, in any forward-looking statement, we express an expectation or belief as to future results or events, such expectation or belief is based on the current plans and expectations of our management. Although we believe that these statements are based on reasonable assumptions, they are subject to numerous factors, risks and uncertainties that could cause actual outcomes and results to be materially different from those indicated in such statements. These factors include those listed under “Risk Factors” in Part I, Item 1A of our Form 10-K for the fiscal year ended December 28, 2025, Part II, Item 1A of our subsequent Forms 10-Q and other filings with the SEC. The forward-looking statements included in this document are made as of the date of this presentation and, except pursuant to any obligations to disclose material information under the federal securities laws, we undertake no obligation to update, amend or clarify any forward-looking statements to reflect events, new information or circumstances occurring after the date of this presentation. Forward Looking Statements
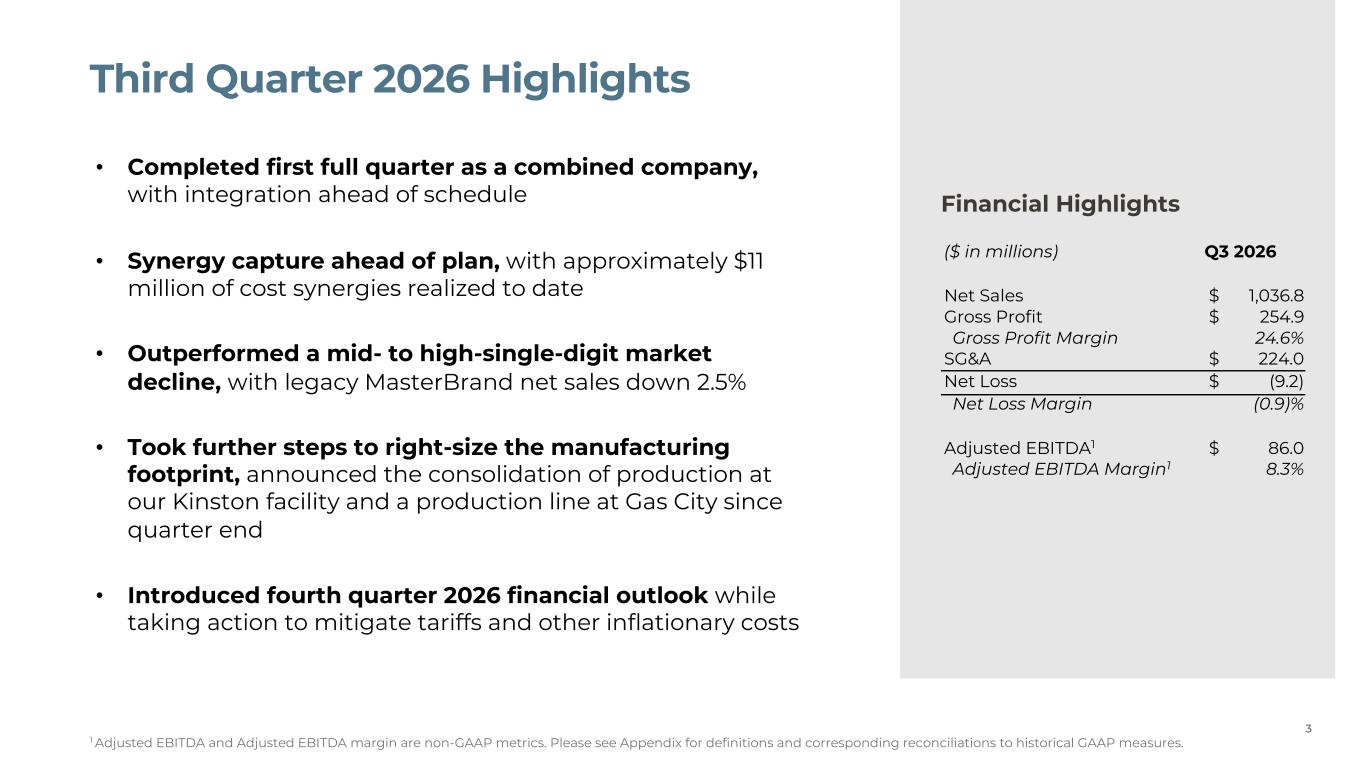
Third Quarter 2026 Highlights • Completed first full quarter as a combined company, with integration ahead of schedule • Synergy capture ahead of plan, with approximately $11 million of cost synergies realized to date • Outperformed a mid- to high-single-digit market decline, with legacy MasterBrand net sales down 2.5% • Took further steps to right-size the manufacturing footprint, announced the consolidation of production at our Kinston facility and a production line at Gas City since quarter end • Introduced fourth quarter 2026 financial outlook while taking action to mitigate tariffs and other inflationary costs 3 Financial Highlights ($ in millions) Q3 2026 Net Sales $ 1,036.8 Gross Profit $ 254.9 Gross Profit Margin 24.6% SG&A $ 224.0 Net Loss $ (9.2) Net Loss Margin (0.9)% Adjusted EBITDA1 $ 86.0 Adjusted EBITDA Margin1 8.3% 1 Adjusted EBITDA and Adjusted EBITDA margin are non-GAAP metrics. Please see Appendix for definitions and corresponding reconciliations to historical GAAP measures.
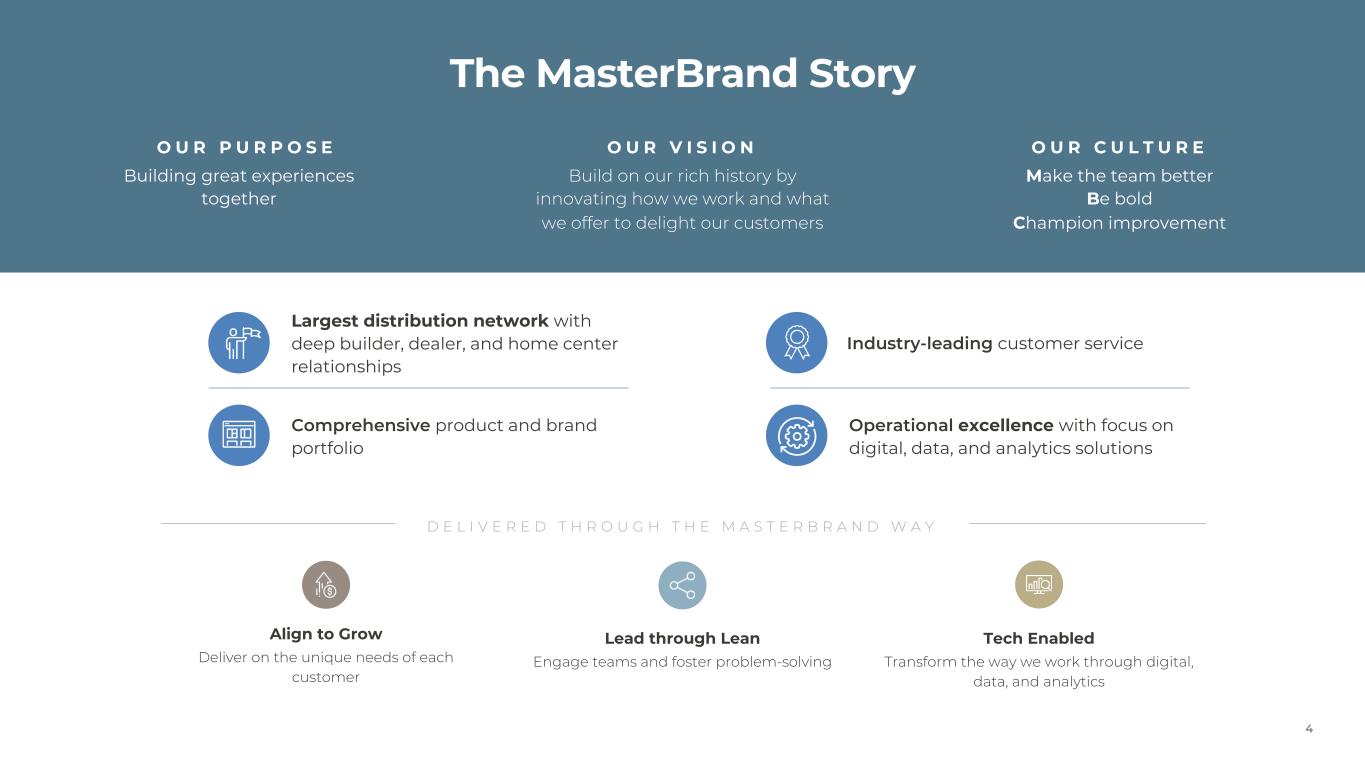
The MasterBrand Story Building great experiences together O U R P U R P O S E Build on our rich history by innovating how we work and what we offer to delight our customers O U R V I S I O N Make the team better Be bold Champion improvement O U R C U L T U R E Lead through Lean Engage teams and foster problem-solving Align to Grow Deliver on the unique needs of each customer Tech Enabled Transform the way we work through digital, data, and analytics Operational excellence with focus on digital, data, and analytics solutions Largest distribution network with deep builder, dealer, and home center relationships Comprehensive product and brand portfolio D E L I V E R E D T H R O U G H T H E M A S T E R B R A N D W A Y Industry-leading customer service 4
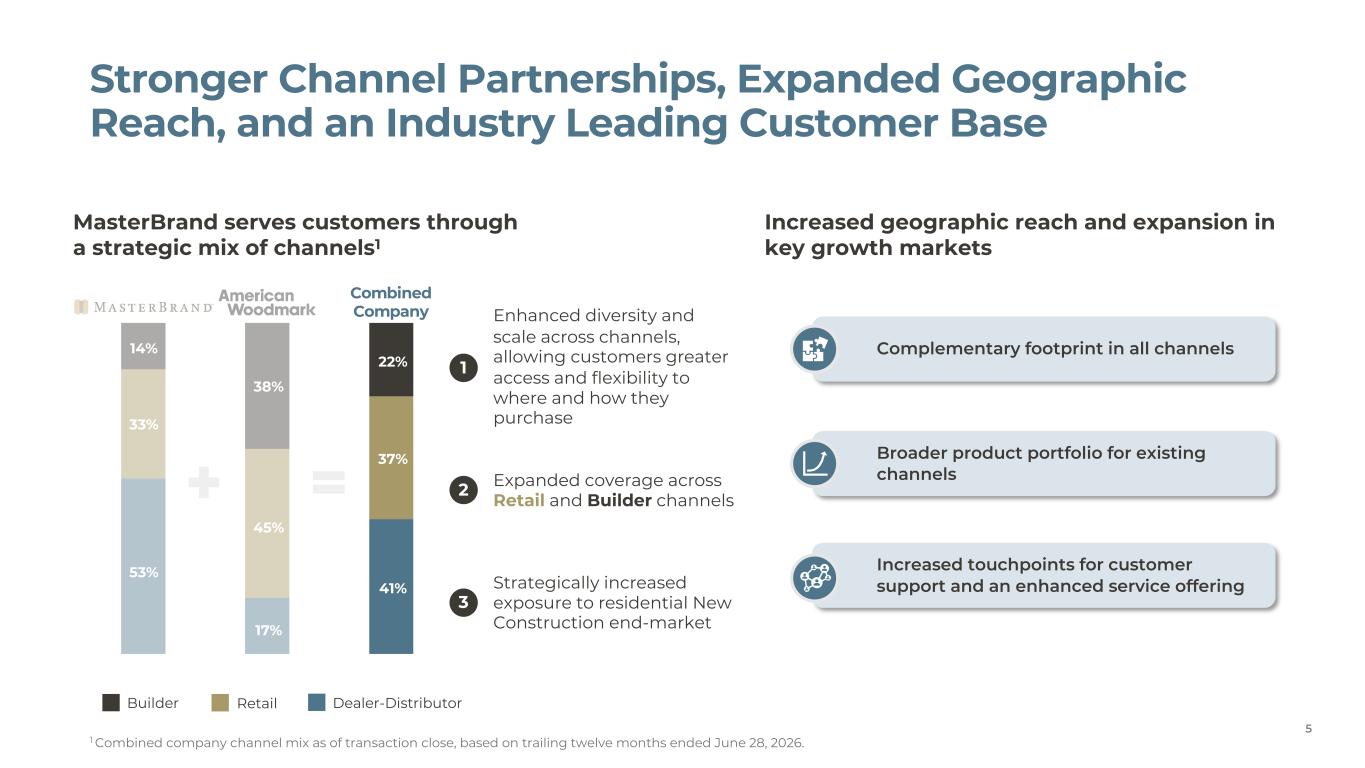
Stronger Channel Partnerships, Expanded Geographic Reach, and an Industry Leading Customer Base MasterBrand serves customers through a strategic mix of channels1 14% 33% 53% 22% 37% 41% 38% 45% 17% Dealer-DistributorRetailBuilder Combined Company 5 Enhanced diversity and scale across channels, allowing customers greater access and flexibility to where and how they purchase Expanded coverage across Retail and Builder channels Strategically increased exposure to residential New Construction end-market Broader product portfolio for existing channels Increased touchpoints for customer support and an enhanced service offering Complementary footprint in all channels Increased geographic reach and expansion in key growth markets 1 2 3 1 Combined company channel mix as of transaction close, based on trailing twelve months ended June 28, 2026.
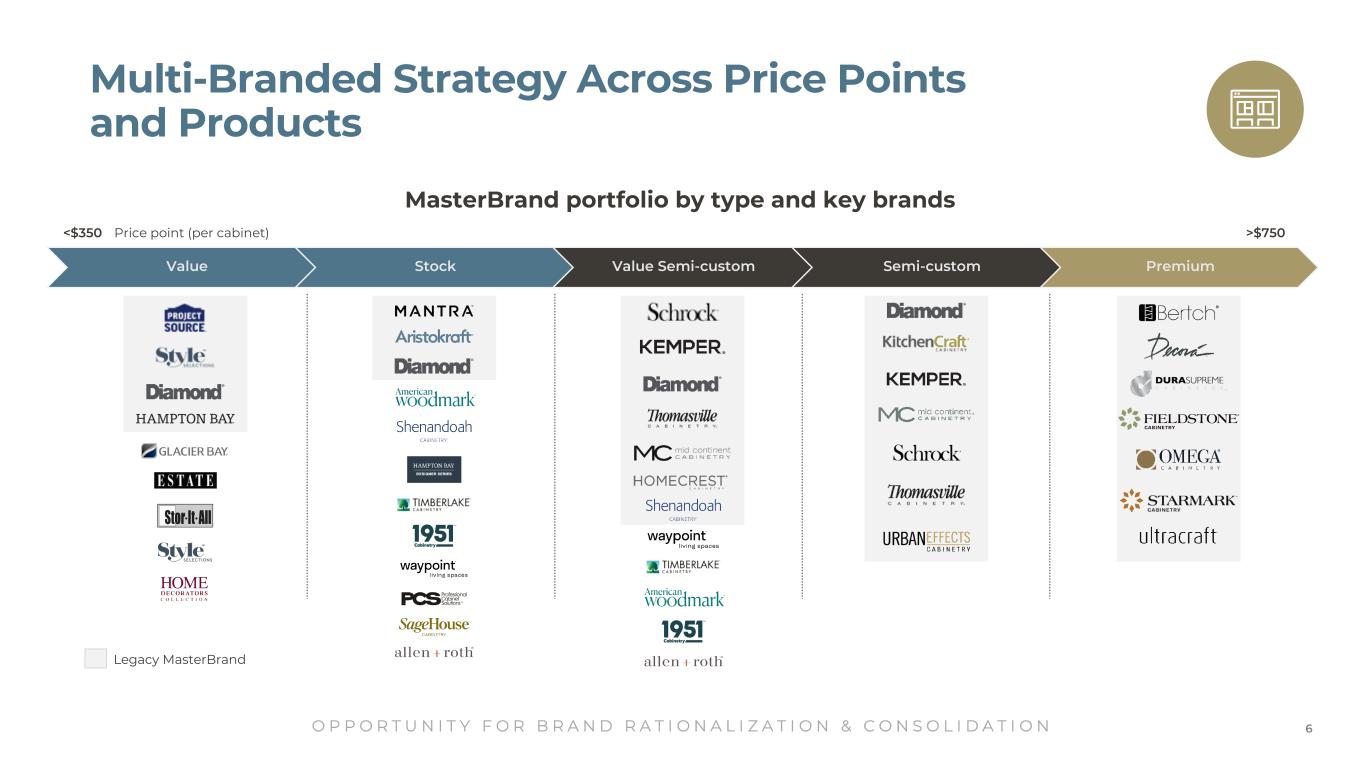
Multi-Branded Strategy Across Price Points and Products MasterBrand portfolio by type and key brands O P P O R T U N I T Y F O R B R A N D R A T I O N A L I Z A T I O N & C O N S O L I D A T I O N Price point (per cabinet)<$350 >$750 Value Semi-custom Semi-custom PremiumValue Stock Legacy MasterBrand 6
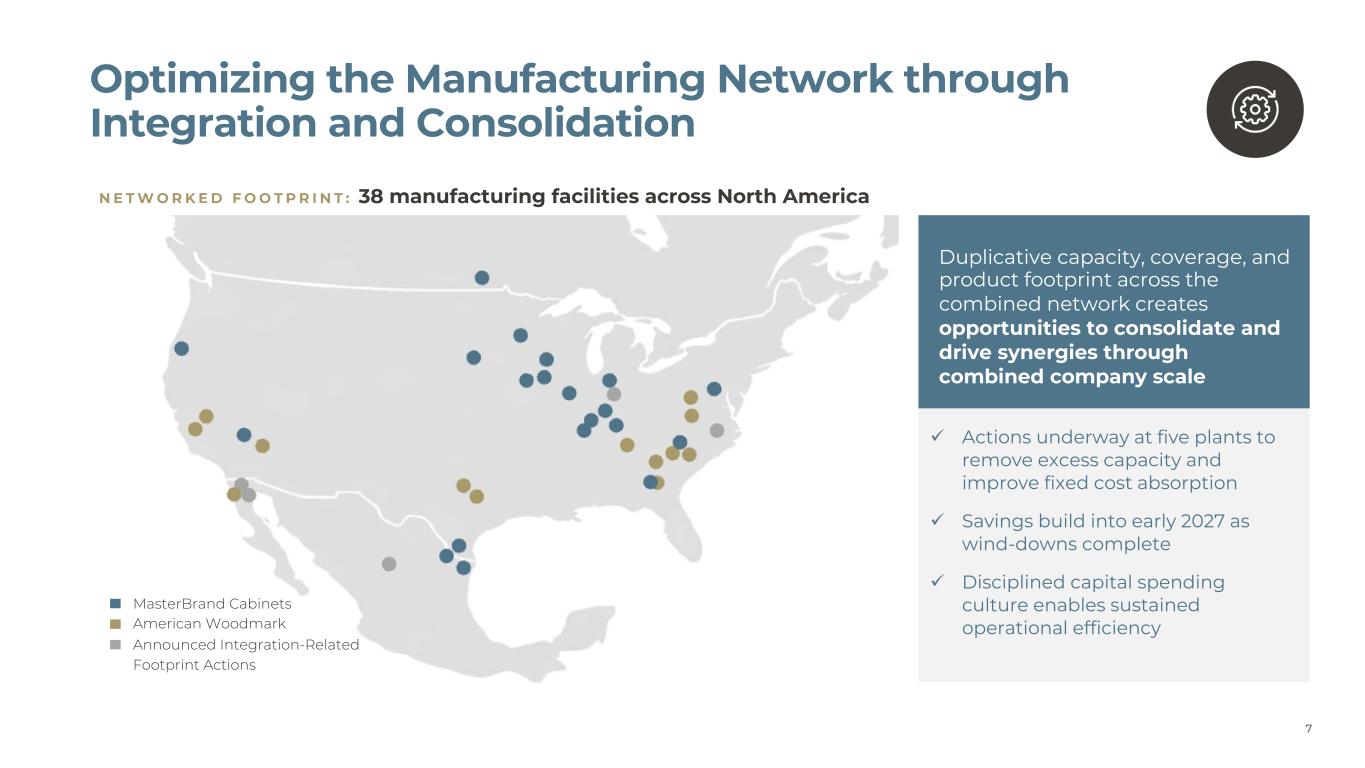
Optimizing the Manufacturing Network through Integration and Consolidation N E T W O R K E D F O O T P R I N T : 38 manufacturing facilities across North America MasterBrand Cabinets American Woodmark Announced Integration-Related Footprint Actions Duplicative capacity, coverage, and product footprint across the combined network creates opportunities to consolidate and drive synergies through combined company scale ü Actions underway at five plants to remove excess capacity and improve fixed cost absorption ü Savings build into early 2027 as wind-downs complete ü Disciplined capital spending culture enables sustained operational efficiency 7
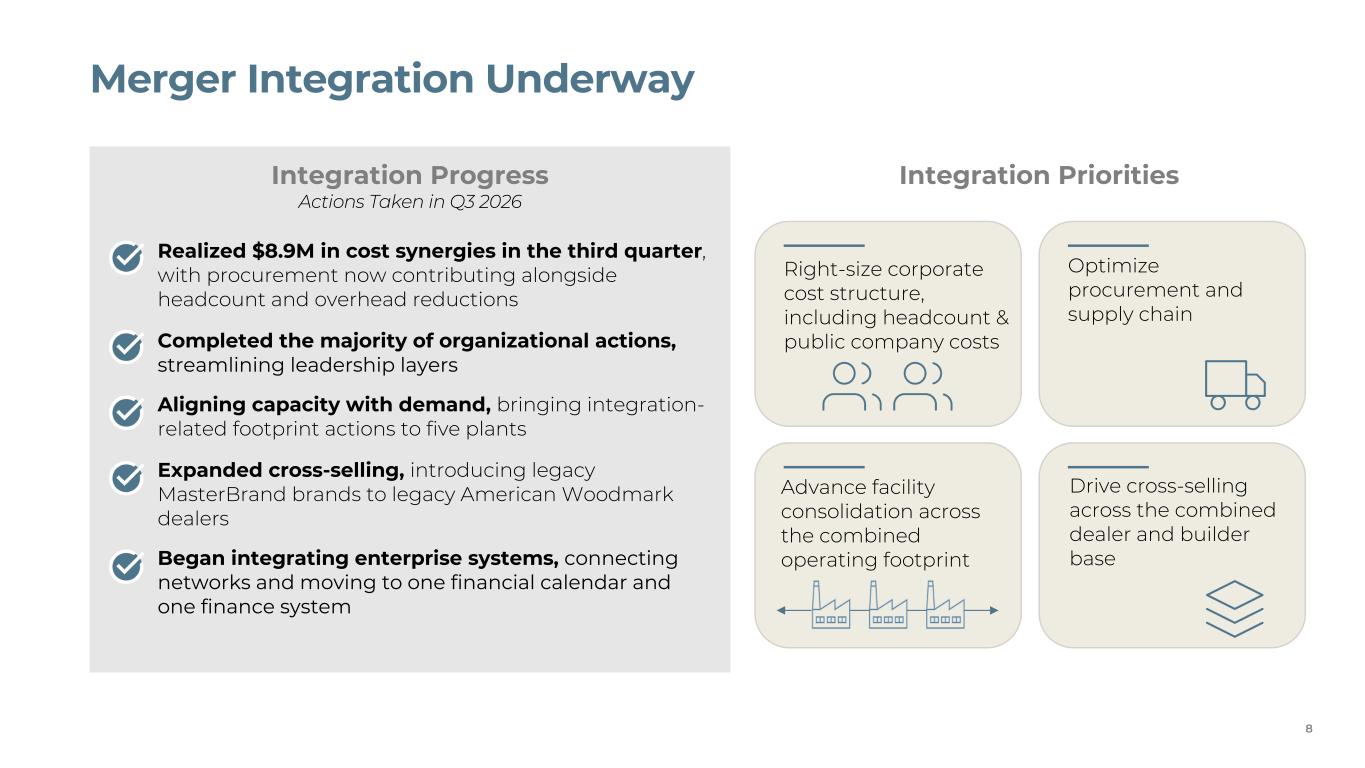
Merger Integration Underway Integration PrioritiesIntegration Progress Actions Taken in Q3 2026 • Realized $8.9M in cost synergies in the third quarter, with procurement now contributing alongside headcount and overhead reductions • Completed the majority of organizational actions, streamlining leadership layers • Aligning capacity with demand, bringing integration- related footprint actions to five plants • Expanded cross-selling, introducing legacy MasterBrand brands to legacy American Woodmark dealers • Began integrating enterprise systems, connecting networks and moving to one financial calendar and one finance system Optimize procurement and supply chain Drive cross-selling across the combined dealer and builder base Advance facility consolidation across the combined operating footprint Right-size corporate cost structure, including headcount & public company costs 8
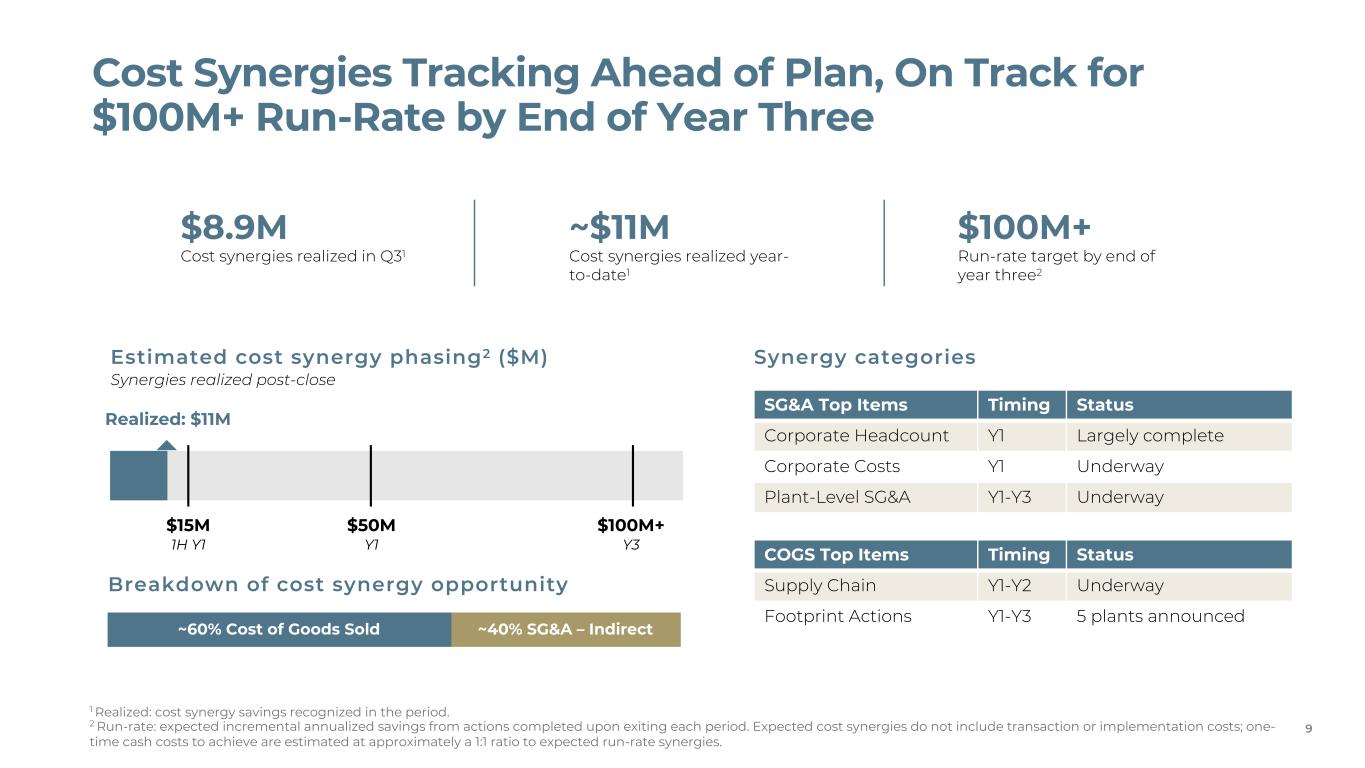
Breakdown of cost synergy opportunity Cost Synergies Tracking Ahead of Plan, On Track for $100M+ Run-Rate by End of Year Three 9 $50M+ Y2-Y3 Synergies realized post-close COGS Top Items Timing Status Supply Chain Y1-Y2 Underway Footprint Actions Y1-Y3 5 plants announced SG&A Top Items Timing Status Corporate Headcount Y1 Largely complete Corporate Costs Y1 Underway Plant-Level SG&A Y1-Y3 Underway 1 Realized: cost synergy savings recognized in the period. 2 Run-rate: expected incremental annualized savings from actions completed upon exiting each period. Expected cost synergies do not include transaction or implementation costs; one- time cash costs to achieve are estimated at approximately a 1:1 ratio to expected run-rate synergies. ~40% SG&A – Indirect~60% Cost of Goods Sold Estimated cost synergy phasing2 ($M) $15M 1H Y1 $50M Y1 $100M+ Y3 Realized: $11M Synergy categories $8.9M Cost synergies realized in Q31 ~$11M Cost synergies realized year- to-date1 $100M+ Run-rate target by end of year three2
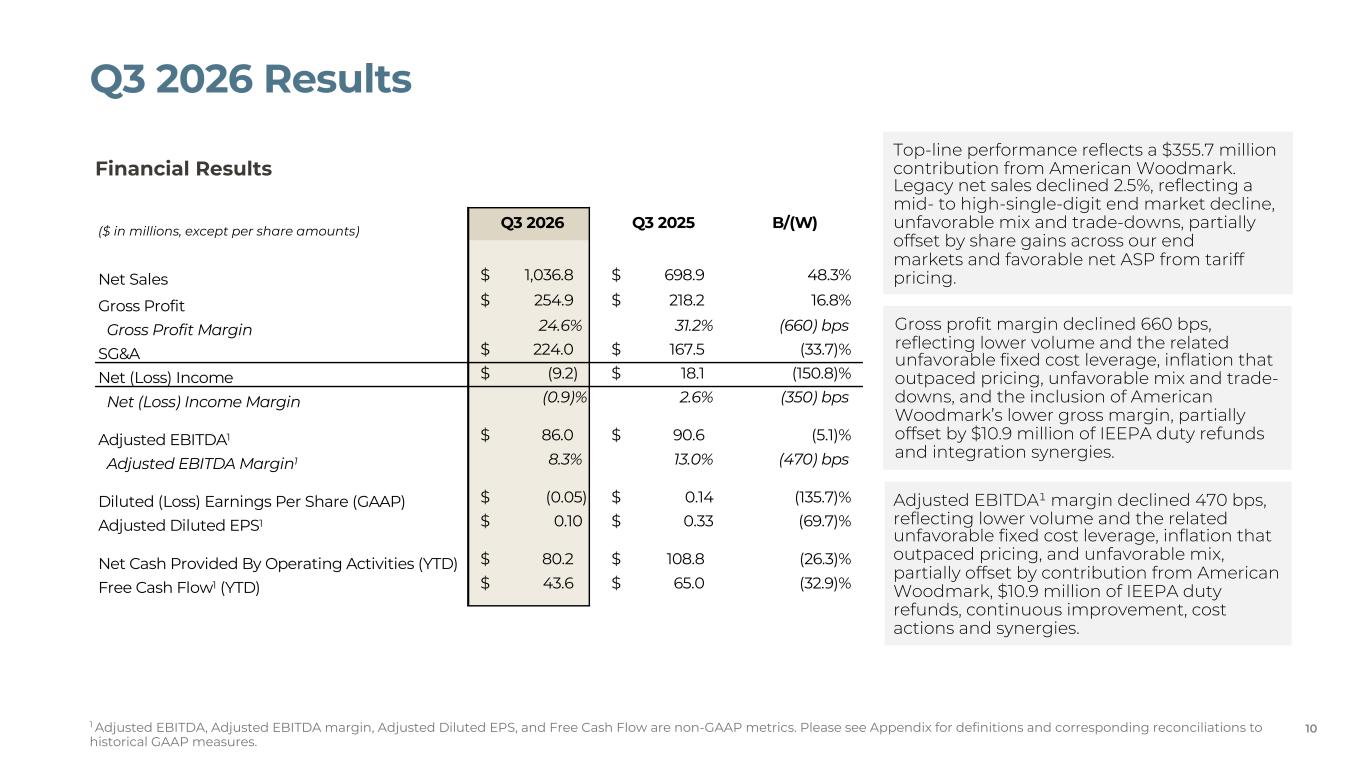
Financial Results ($ in millions, except per share amounts) Q3 2026 Q3 2025 B/(W) Net Sales $ 1,036.8 $ 698.9 48.3% Gross Profit $ 254.9 $ 218.2 16.8% Gross Profit Margin 24.6% 31.2% (660) bps SG&A $ 224.0 $ 167.5 (33.7)% Net (Loss) Income $ (9.2) $ 18.1 (150.8)% Net (Loss) Income Margin (0.9)% 2.6% (350) bps Adjusted EBITDA1 $ 86.0 $ 90.6 (5.1)% Adjusted EBITDA Margin1 8.3% 13.0% (470) bps Diluted (Loss) Earnings Per Share (GAAP) $ (0.05) $ 0.14 (135.7)% Adjusted Diluted EPS1 $ 0.10 $ 0.33 (69.7)% Net Cash Provided By Operating Activities (YTD) $ 80.2 $ 108.8 (26.3)% Free Cash Flow1 (YTD) $ 43.6 $ 65.0 (32.9)% Q3 2026 Results 10 Top-line performance reflects a $355.7 million contribution from American Woodmark. Legacy net sales declined 2.5%, reflecting a mid- to high-single-digit end market decline, unfavorable mix and trade-downs, partially offset by share gains across our end markets and favorable net ASP from tariff pricing. Gross profit margin declined 660 bps, reflecting lower volume and the related unfavorable fixed cost leverage, inflation that outpaced pricing, unfavorable mix and trade- downs, and the inclusion of American Woodmark’s lower gross margin, partially offset by $10.9 million of IEEPA duty refunds and integration synergies. Adjusted EBITDA¹ margin declined 470 bps, reflecting lower volume and the related unfavorable fixed cost leverage, inflation that outpaced pricing, and unfavorable mix, partially offset by contribution from American Woodmark, $10.9 million of IEEPA duty refunds, continuous improvement, cost actions and synergies. 1 Adjusted EBITDA, Adjusted EBITDA margin, Adjusted Diluted EPS, and Free Cash Flow are non-GAAP metrics. Please see Appendix for definitions and corresponding reconciliations to historical GAAP measures.
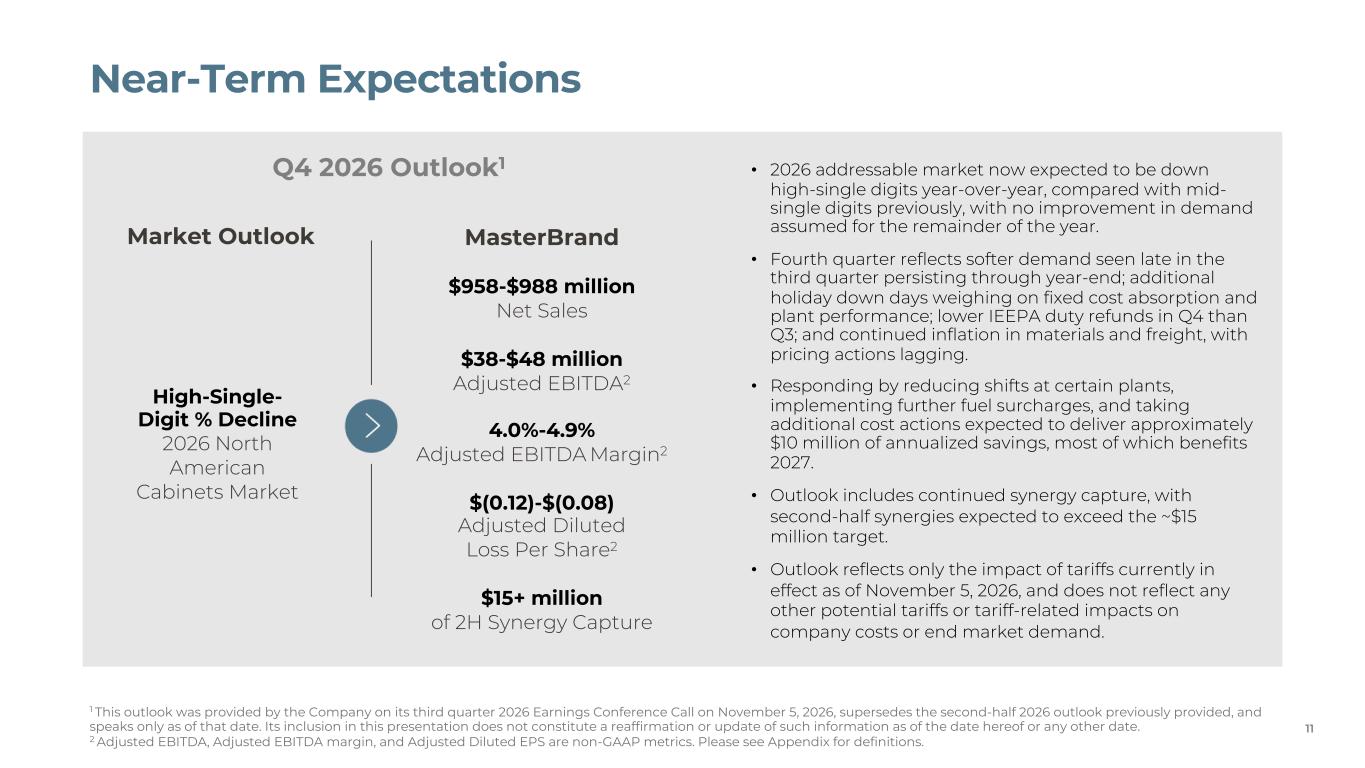
Q4 2026 Outlook1 • 2026 addressable market now expected to be down high-single digits year-over-year, compared with mid- single digits previously, with no improvement in demand assumed for the remainder of the year. • Fourth quarter reflects softer demand seen late in the third quarter persisting through year-end; additional holiday down days weighing on fixed cost absorption and plant performance; lower IEEPA duty refunds in Q4 than Q3; and continued inflation in materials and freight, with pricing actions lagging. • Responding by reducing shifts at certain plants, implementing further fuel surcharges, and taking additional cost actions expected to deliver approximately $10 million of annualized savings, most of which benefits 2027. • Outlook includes continued synergy capture, with second-half synergies expected to exceed the ~$15 million target. • Outlook reflects only the impact of tariffs currently in effect as of November 5, 2026, and does not reflect any other potential tariffs or tariff-related impacts on company costs or end market demand. High-Single- Digit % Decline 2026 North American Cabinets Market MasterBrand $958-$988 million Net Sales $38-$48 million Adjusted EBITDA2 4.0%-4.9% Adjusted EBITDA Margin2 $(0.12)-$(0.08) Adjusted Diluted Loss Per Share2 $15+ million of 2H Synergy Capture Market Outlook Near-Term Expectations 11 1 This outlook was provided by the Company on its third quarter 2026 Earnings Conference Call on November 5, 2026, supersedes the second-half 2026 outlook previously provided, and speaks only as of that date. Its inclusion in this presentation does not constitute a reaffirmation or update of such information as of the date hereof or any other date. 2 Adjusted EBITDA, Adjusted EBITDA margin, and Adjusted Diluted EPS are non-GAAP metrics. Please see Appendix for definitions.
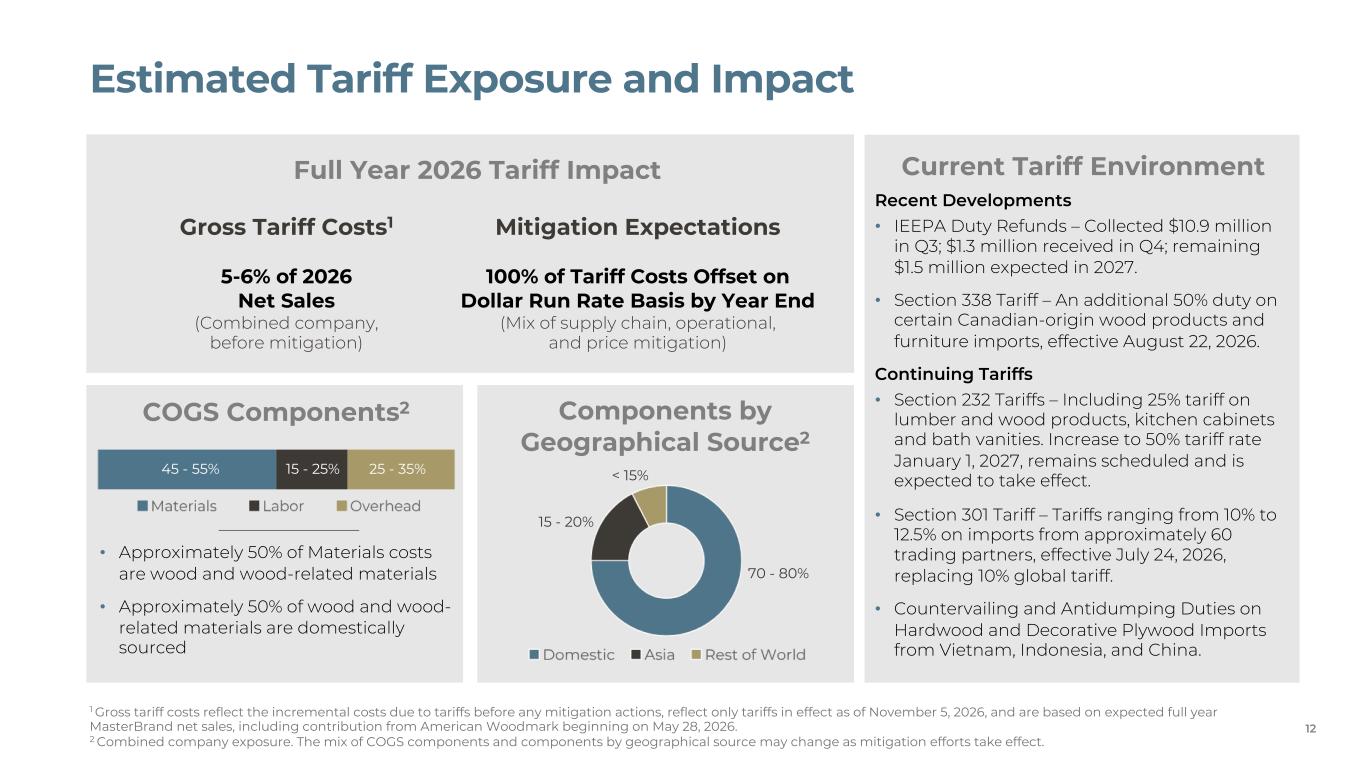
Current Tariff Environment Recent Developments • IEEPA Duty Refunds – Collected $10.9 million in Q3; $1.3 million received in Q4; remaining $1.5 million expected in 2027. • Section 338 Tariff – An additional 50% duty on certain Canadian-origin wood products and furniture imports, effective August 22, 2026. Continuing Tariffs • Section 232 Tariffs – Including 25% tariff on lumber and wood products, kitchen cabinets and bath vanities. Increase to 50% tariff rate January 1, 2027, remains scheduled and is expected to take effect. • Section 301 Tariff – Tariffs ranging from 10% to 12.5% on imports from approximately 60 trading partners, effective July 24, 2026, replacing 10% global tariff. • Countervailing and Antidumping Duties on Hardwood and Decorative Plywood Imports from Vietnam, Indonesia, and China. COGS Components2 70 - 80% 15 - 20% 45 - 55% 15 - 25% 25 - 35% • Approximately 50% of Materials costs are wood and wood-related materials • Approximately 50% of wood and wood- related materials are domestically sourced Components by Geographical Source2 < 15% Full Year 2026 Tariff Impact Gross Tariff Costs1 5-6% of 2026 Net Sales (Combined company, before mitigation) Estimated Tariff Exposure and Impact Mitigation Expectations 100% of Tariff Costs Offset on Dollar Run Rate Basis by Year End (Mix of supply chain, operational, and price mitigation) 12 1 Gross tariff costs reflect the incremental costs due to tariffs before any mitigation actions, reflect only tariffs in effect as of November 5, 2026, and are based on expected full year MasterBrand net sales, including contribution from American Woodmark beginning on May 28, 2026. 2 Combined company exposure. The mix of COGS components and components by geographical source may change as mitigation efforts take effect.
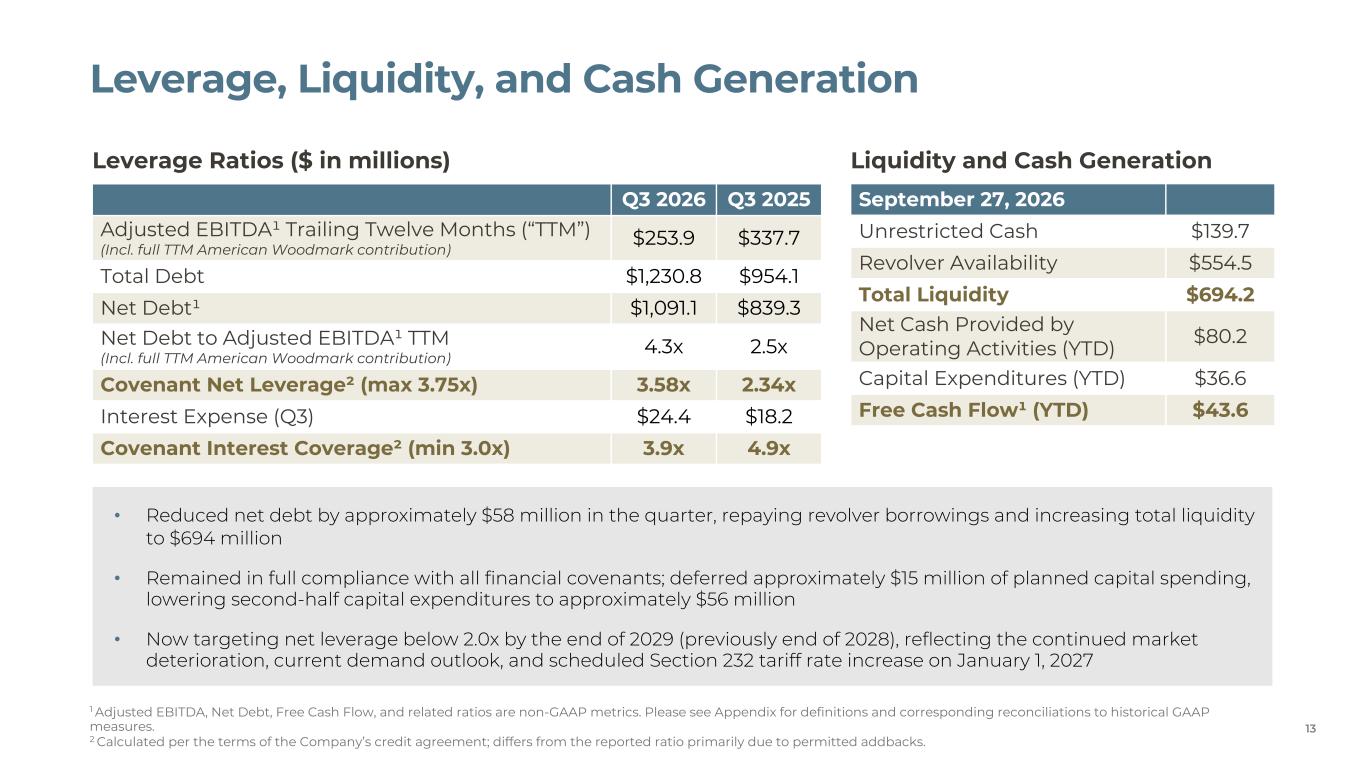
Leverage, Liquidity, and Cash Generation Leverage Ratios ($ in millions) Q3 2026 Q3 2025 Adjusted EBITDA¹ Trailing Twelve Months (“TTM”) (Incl. full TTM American Woodmark contribution) $253.9 $337.7 Total Debt $1,230.8 $954.1 Net Debt¹ $1,091.1 $839.3 Net Debt to Adjusted EBITDA¹ TTM (Incl. full TTM American Woodmark contribution) 4.3x 2.5x Covenant Net Leverage² (max 3.75x) 3.58x 2.34x Interest Expense (Q3) $24.4 $18.2 Covenant Interest Coverage² (min 3.0x) 3.9x 4.9x Liquidity and Cash Generation September 27, 2026 Unrestricted Cash $139.7 Revolver Availability $554.5 Total Liquidity $694.2 Net Cash Provided by Operating Activities (YTD) $80.2 Capital Expenditures (YTD) $36.6 Free Cash Flow¹ (YTD) $43.6 • Reduced net debt by approximately $58 million in the quarter, repaying revolver borrowings and increasing total liquidity to $694 million • Remained in full compliance with all financial covenants; deferred approximately $15 million of planned capital spending, lowering second-half capital expenditures to approximately $56 million • Now targeting net leverage below 2.0x by the end of 2029 (previously end of 2028), reflecting the continued market deterioration, current demand outlook, and scheduled Section 232 tariff rate increase on January 1, 2027 13 1 Adjusted EBITDA, Net Debt, Free Cash Flow, and related ratios are non-GAAP metrics. Please see Appendix for definitions and corresponding reconciliations to historical GAAP measures. 2 Calculated per the terms of the Company’s credit agreement; differs from the reported ratio primarily due to permitted addbacks.
14 05 Appendix
To supplement the financial information presented in accordance with generally accepted accounting principles in the United States (“GAAP”) in this presentation, certain non-GAAP financial measures as defined under SEC rules have been included. It is our intent to provide non-GAAP financial information to enhance understanding of our financial information as prepared in accordance with GAAP. Non-GAAP financial measures should be considered in addition to, not as a substitute for, other financial measures prepared in accordance with GAAP. Our methods of determining these non-GAAP financial measures may differ from the methods used by other companies for these or similar non-GAAP financial measures. Accordingly, these non-GAAP financial measures may not be comparable to measures used by other companies. We use EBITDA, adjusted EBITDA, adjusted EBITDA margin, adjusted net income, adjusted net income margin, adjusted diluted earnings per share (“adjusted diluted EPS”), free cash flow, net debt, and net debt to adjusted EBITDA, which are all non-GAAP financial measures. EBITDA is defined as earnings before interest, taxes, depreciation and amortization. We evaluate the performance of our business based on income before income taxes, but also look to EBITDA as a performance evaluation measure because interest expense is related to corporate functions, as opposed to operations. For that reason, we believe EBITDA is a useful metric to investors in evaluating our operating results. Adjusted EBITDA is calculated by removing the impact of non-operational results and special items from EBITDA. Adjusted EBITDA margin is calculated as adjusted EBITDA divided by net sales. Adjusted net income is calculated by removing the impact of non-operational results, including non-cash amortization expense, which is not deemed to be indicative of the results of current or future operations, and special items from net income. Adjusted net income margin is calculated as adjusted net income divided by net sales. Adjusted diluted EPS is a measure of our diluted earnings per share excluding non-operational results and special items. We believe these non-GAAP measures are useful to investors as they are representative of our core operations and are used in the management of our business, including decisions concerning the allocation of resources and assessment of performance. Free cash flow is defined as cash flow from operations less capital expenditures. We believe that free cash flow is a useful measure to investors because it is a meaningful indicator of cash generated from operating activities available for the execution of our business strategy, and is used in the management of our business, including decisions concerning the allocation of resources and assessment of performance. Net debt is defined as total balance sheet debt less cash and cash equivalents. We believe this measure is useful to investors as it provides a measure to compare debt less cash and cash equivalents across periods on a consistent basis. Net debt to adjusted EBITDA is calculated by dividing net debt by the trailing twelve months adjusted EBITDA. For periods impacted by an acquisition, trailing twelve months adjusted EBITDA includes the full trailing twelve months adjusted EBITDA of the acquired entity. Net debt to adjusted EBITDA is used by management to assess our financial leverage and ability to service our debt obligations. As required by SEC rules, detailed reconciliations of these non-GAAP financial measures to the most directly comparable GAAP measure are included in the appendix of this presentation. We have not provided a reconciliation of our fiscal 2026 fourth quarter adjusted EBITDA, adjusted EBITDA margin and adjusted diluted EPS guidance because the information needed to reconcile these measures is unavailable due to the inherent difficulty of forecasting the timing or amount of various items that have not yet occurred, including restructuring and other charges, which are excluded from adjusted EBITDA, adjusted EBITDA margin, and adjusted diluted EPS. Additionally, estimating such GAAP measures and providing a meaningful reconciliation consistent with the Company’s accounting policies for future periods requires a level of precision that is unavailable for these future periods and cannot be accomplished without unreasonable effort. Forward-looking non-GAAP measures are estimated consistent with the relevant definitions and assumptions used for historical non-GAAP measures. Non-GAAP Financial Measures 15
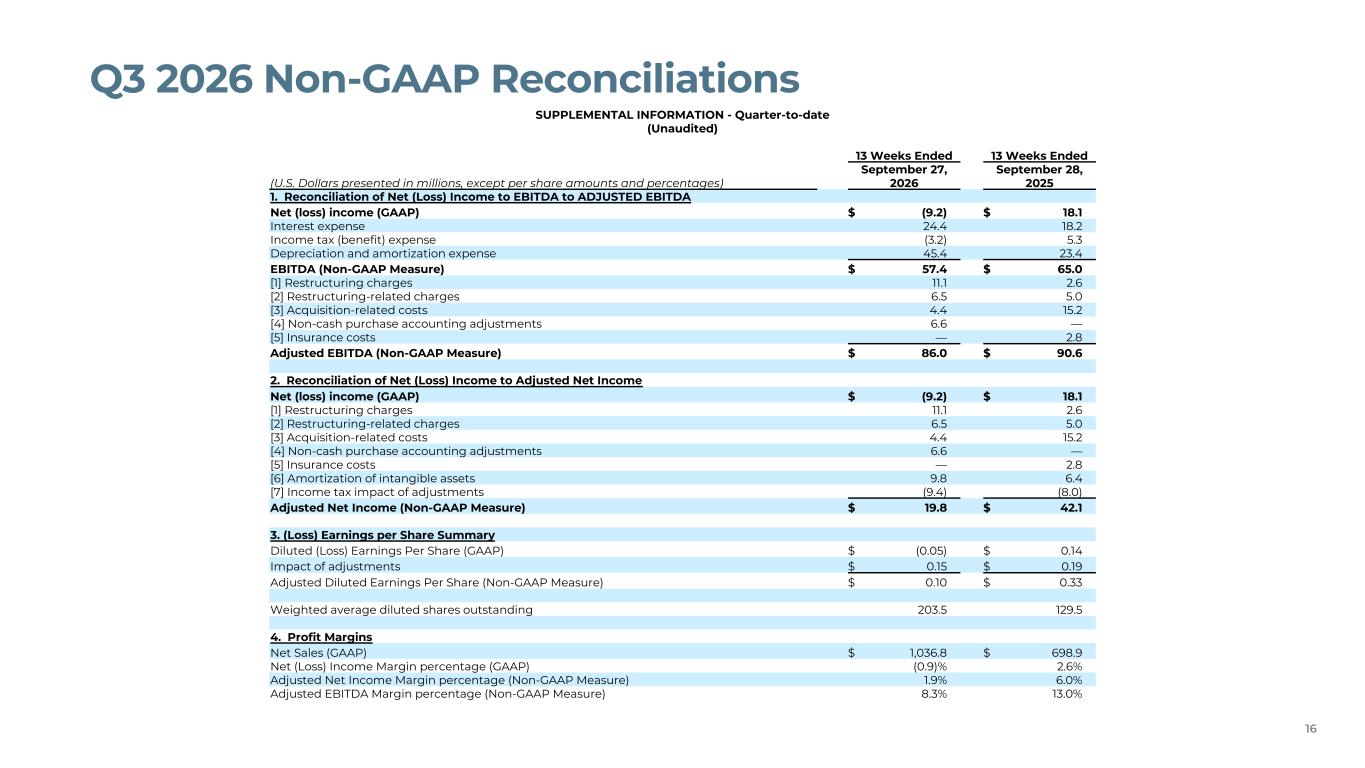
Q3 2026 Non-GAAP Reconciliations 16 SUPPLEMENTAL INFORMATION - Quarter-to-date (Unaudited) 13 Weeks Ended 13 Weeks Ended September 27, September 28, (U.S. Dollars presented in millions, except per share amounts and percentages) 2026 2025 1. Reconciliation of Net (Loss) Income to EBITDA to ADJUSTED EBITDA Net (loss) income (GAAP) $ (9.2) $ 18.1 Interest expense 24.4 18.2 Income tax (benefit) expense (3.2) 5.3 Depreciation and amortization expense 45.4 23.4 EBITDA (Non-GAAP Measure) $ 57.4 $ 65.0 [1] Restructuring charges 11.1 2.6 [2] Restructuring-related charges 6.5 5.0 [3] Acquisition-related costs 4.4 15.2 [4] Non-cash purchase accounting adjustments 6.6 — [5] Insurance costs — 2.8 Adjusted EBITDA (Non-GAAP Measure) $ 86.0 $ 90.6 2. Reconciliation of Net (Loss) Income to Adjusted Net Income Net (loss) income (GAAP) $ (9.2) $ 18.1 [1] Restructuring charges 11.1 2.6 [2] Restructuring-related charges 6.5 5.0 [3] Acquisition-related costs 4.4 15.2 [4] Non-cash purchase accounting adjustments 6.6 — [5] Insurance costs — 2.8 [6] Amortization of intangible assets 9.8 6.4 [7] Income tax impact of adjustments (9.4) (8.0) Adjusted Net Income (Non-GAAP Measure) $ 19.8 $ 42.1 3. (Loss) Earnings per Share Summary Diluted (Loss) Earnings Per Share (GAAP) $ (0.05) $ 0.14 Impact of adjustments $ 0.15 $ 0.19 Adjusted Diluted Earnings Per Share (Non-GAAP Measure) $ 0.10 $ 0.33 Weighted average diluted shares outstanding 203.5 129.5 4. Profit Margins Net Sales (GAAP) $ 1,036.8 $ 698.9 Net (Loss) Income Margin percentage (GAAP) (0.9)% 2.6% Adjusted Net Income Margin percentage (Non-GAAP Measure) 1.9% 6.0% Adjusted EBITDA Margin percentage (Non-GAAP Measure) 8.3% 13.0%
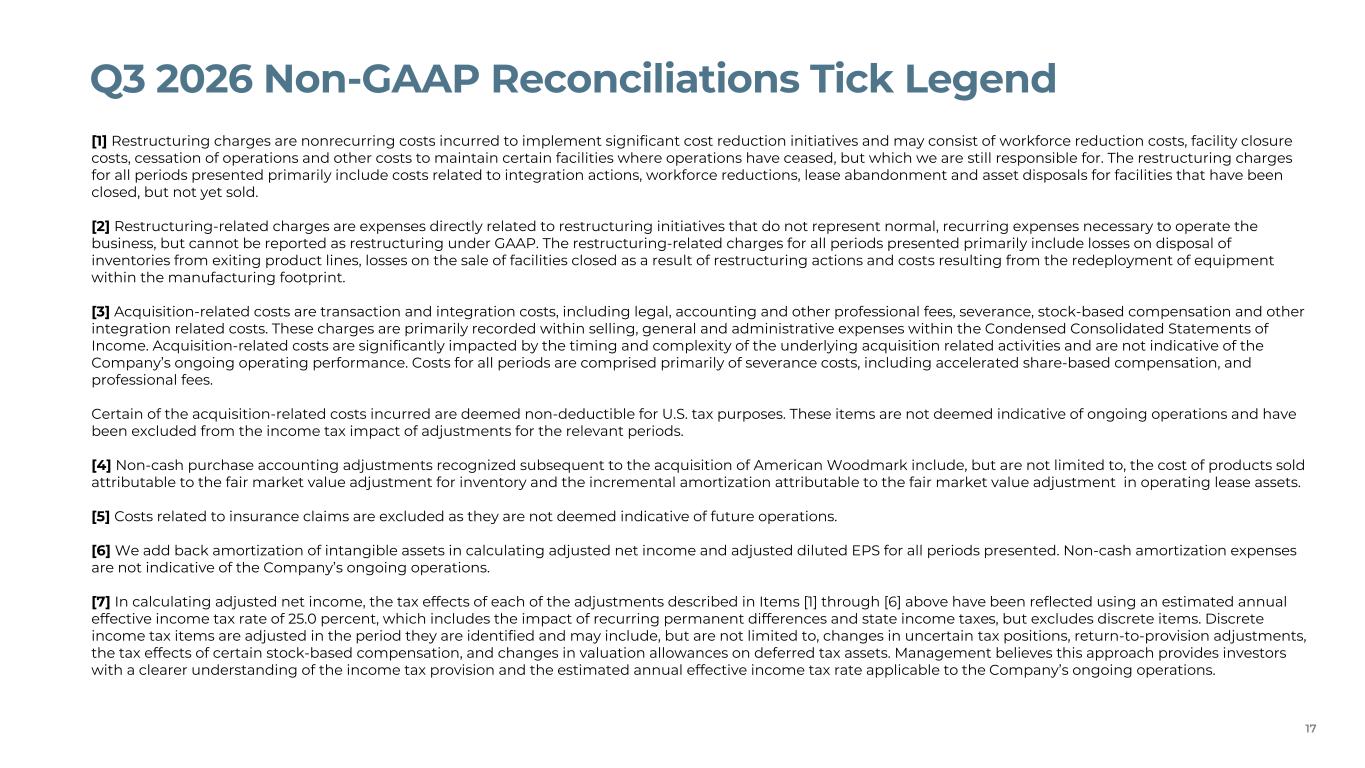
[1] Restructuring charges are nonrecurring costs incurred to implement significant cost reduction initiatives and may consist of workforce reduction costs, facility closure costs, cessation of operations and other costs to maintain certain facilities where operations have ceased, but which we are still responsible for. The restructuring charges for all periods presented primarily include costs related to integration actions, workforce reductions, lease abandonment and asset disposals for facilities that have been closed, but not yet sold. [2] Restructuring-related charges are expenses directly related to restructuring initiatives that do not represent normal, recurring expenses necessary to operate the business, but cannot be reported as restructuring under GAAP. The restructuring-related charges for all periods presented primarily include losses on disposal of inventories from exiting product lines, losses on the sale of facilities closed as a result of restructuring actions and costs resulting from the redeployment of equipment within the manufacturing footprint. [3] Acquisition-related costs are transaction and integration costs, including legal, accounting and other professional fees, severance, stock-based compensation and other integration related costs. These charges are primarily recorded within selling, general and administrative expenses within the Condensed Consolidated Statements of Income. Acquisition-related costs are significantly impacted by the timing and complexity of the underlying acquisition related activities and are not indicative of the Company’s ongoing operating performance. Costs for all periods are comprised primarily of severance costs, including accelerated share-based compensation, and professional fees. Certain of the acquisition-related costs incurred are deemed non-deductible for U.S. tax purposes. These items are not deemed indicative of ongoing operations and have been excluded from the income tax impact of adjustments for the relevant periods. [4] Non-cash purchase accounting adjustments recognized subsequent to the acquisition of American Woodmark include, but are not limited to, the cost of products sold attributable to the fair market value adjustment for inventory and the incremental amortization attributable to the fair market value adjustment in operating lease assets. [5] Costs related to insurance claims are excluded as they are not deemed indicative of future operations. [6] We add back amortization of intangible assets in calculating adjusted net income and adjusted diluted EPS for all periods presented. Non-cash amortization expenses are not indicative of the Company’s ongoing operations. [7] In calculating adjusted net income, the tax effects of each of the adjustments described in Items [1] through [6] above have been reflected using an estimated annual effective income tax rate of 25.0 percent, which includes the impact of recurring permanent differences and state income taxes, but excludes discrete items. Discrete income tax items are adjusted in the period they are identified and may include, but are not limited to, changes in uncertain tax positions, return-to-provision adjustments, the tax effects of certain stock-based compensation, and changes in valuation allowances on deferred tax assets. Management believes this approach provides investors with a clearer understanding of the income tax provision and the estimated annual effective income tax rate applicable to the Company’s ongoing operations. Q3 2026 Non-GAAP Reconciliations Tick Legend 17
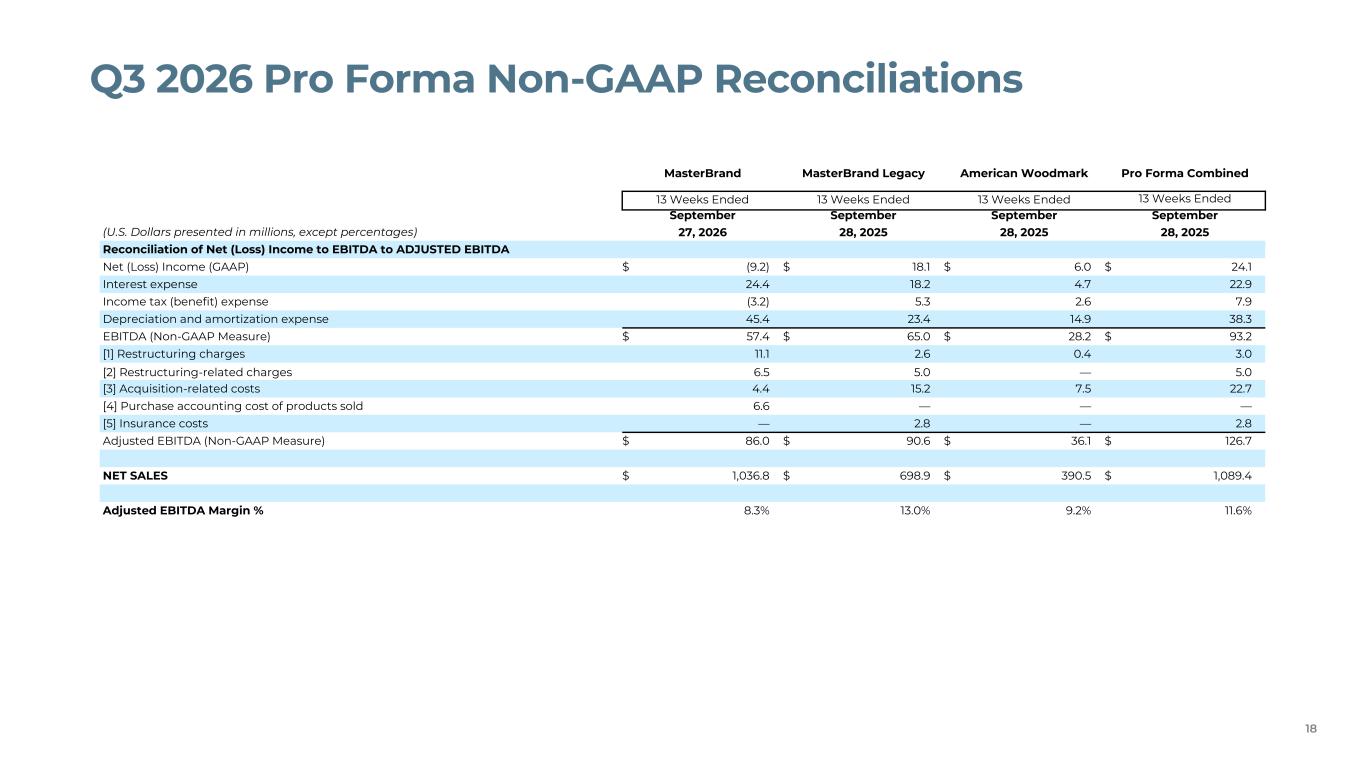
Q3 2026 Pro Forma Non-GAAP Reconciliations 18 MasterBrand MasterBrand Legacy American Woodmark Pro Forma Combined 13 Weeks Ended 13 Weeks Ended 13 Weeks Ended 13 Weeks Ended (U.S. Dollars presented in millions, except percentages) September 27, 2026 September 28, 2025 September 28, 2025 September 28, 2025 Reconciliation of Net (Loss) Income to EBITDA to ADJUSTED EBITDA Net (Loss) Income (GAAP) $ (9.2) $ 18.1 $ 6.0 $ 24.1 Interest expense 24.4 18.2 4.7 22.9 Income tax (benefit) expense (3.2) 5.3 2.6 7.9 Depreciation and amortization expense 45.4 23.4 14.9 38.3 EBITDA (Non-GAAP Measure) $ 57.4 $ 65.0 $ 28.2 $ 93.2 [1] Restructuring charges 11.1 2.6 0.4 3.0 [2] Restructuring-related charges 6.5 5.0 — 5.0 [3] Acquisition-related costs 4.4 15.2 7.5 22.7 [4] Purchase accounting cost of products sold 6.6 — — — [5] Insurance costs — 2.8 — 2.8 Adjusted EBITDA (Non-GAAP Measure) $ 86.0 $ 90.6 $ 36.1 $ 126.7 NET SALES $ 1,036.8 $ 698.9 $ 390.5 $ 1,089.4 Adjusted EBITDA Margin % 8.3% 13.0% 9.2% 11.6%
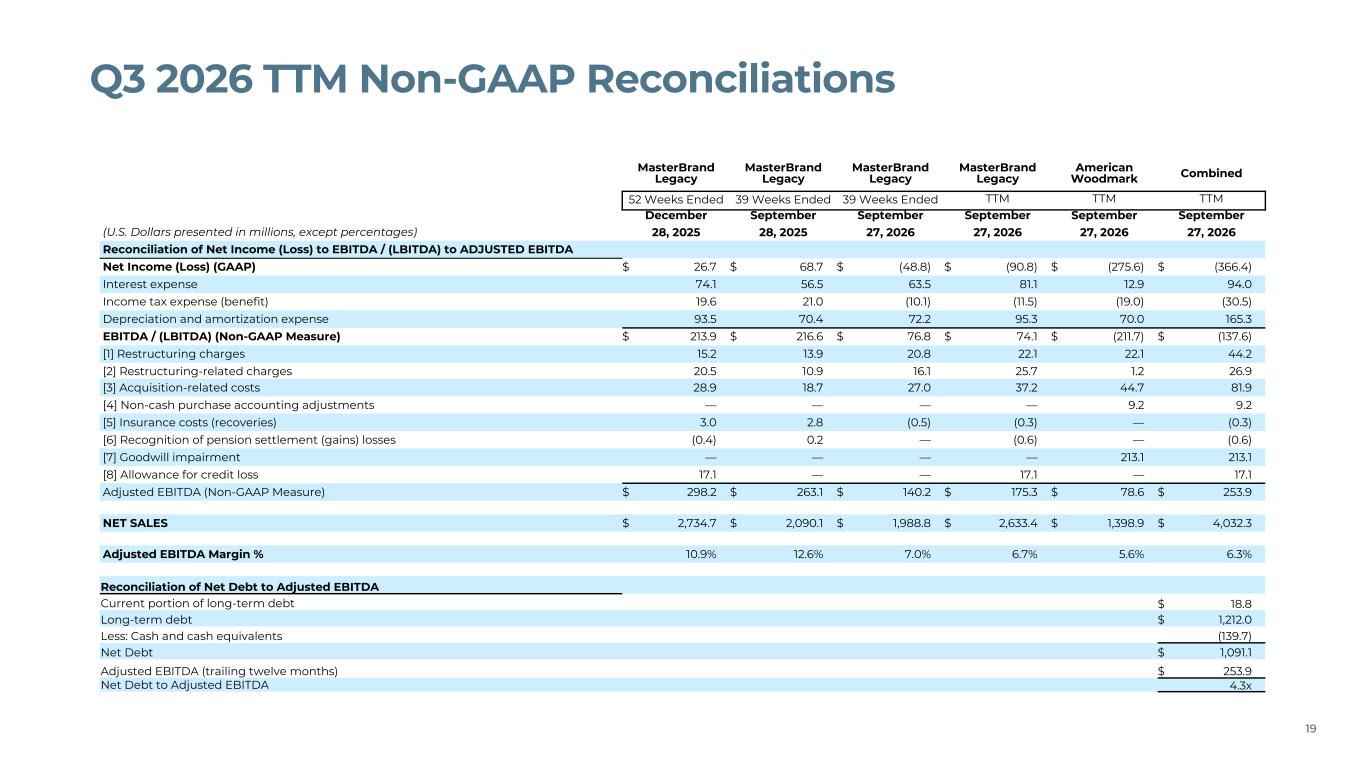
Q3 2026 TTM Non-GAAP Reconciliations 19 MasterBrand Legacy MasterBrand Legacy MasterBrand Legacy MasterBrand Legacy American Woodmark Combined 52 Weeks Ended 39 Weeks Ended 39 Weeks Ended TTM TTM TTM (U.S. Dollars presented in millions, except percentages) December 28, 2025 September 28, 2025 September 27, 2026 September 27, 2026 September 27, 2026 September 27, 2026 Reconciliation of Net Income (Loss) to EBITDA / (LBITDA) to ADJUSTED EBITDA Net Income (Loss) (GAAP) $ 26.7 $ 68.7 $ (48.8) $ (90.8) $ (275.6) $ (366.4) Interest expense 74.1 56.5 63.5 81.1 12.9 94.0 Income tax expense (benefit) 19.6 21.0 (10.1) (11.5) (19.0) (30.5) Depreciation and amortization expense 93.5 70.4 72.2 95.3 70.0 165.3 EBITDA / (LBITDA) (Non-GAAP Measure) $ 213.9 $ 216.6 $ 76.8 $ 74.1 $ (211.7) $ (137.6) [1] Restructuring charges 15.2 13.9 20.8 22.1 22.1 44.2 [2] Restructuring-related charges 20.5 10.9 16.1 25.7 1.2 26.9 [3] Acquisition-related costs 28.9 18.7 27.0 37.2 44.7 81.9 [4] Non-cash purchase accounting adjustments — — — — 9.2 9.2 [5] Insurance costs (recoveries) 3.0 2.8 (0.5) (0.3) — (0.3) [6] Recognition of pension settlement (gains) losses (0.4) 0.2 — (0.6) — (0.6) [7] Goodwill impairment — — — — 213.1 213.1 [8] Allowance for credit loss 17.1 — — 17.1 — 17.1 Adjusted EBITDA (Non-GAAP Measure) $ 298.2 $ 263.1 $ 140.2 $ 175.3 $ 78.6 $ 253.9 NET SALES $ 2,734.7 $ 2,090.1 $ 1,988.8 $ 2,633.4 $ 1,398.9 $ 4,032.3 Adjusted EBITDA Margin % 10.9% 12.6% 7.0% 6.7% 5.6% 6.3% Reconciliation of Net Debt to Adjusted EBITDA Current portion of long-term debt $ 18.8 Long-term debt $ 1,212.0 Less: Cash and cash equivalents (139.7) Net Debt $ 1,091.1 Adjusted EBITDA (trailing twelve months) $ 253.9 Net Debt to Adjusted EBITDA 4.3x
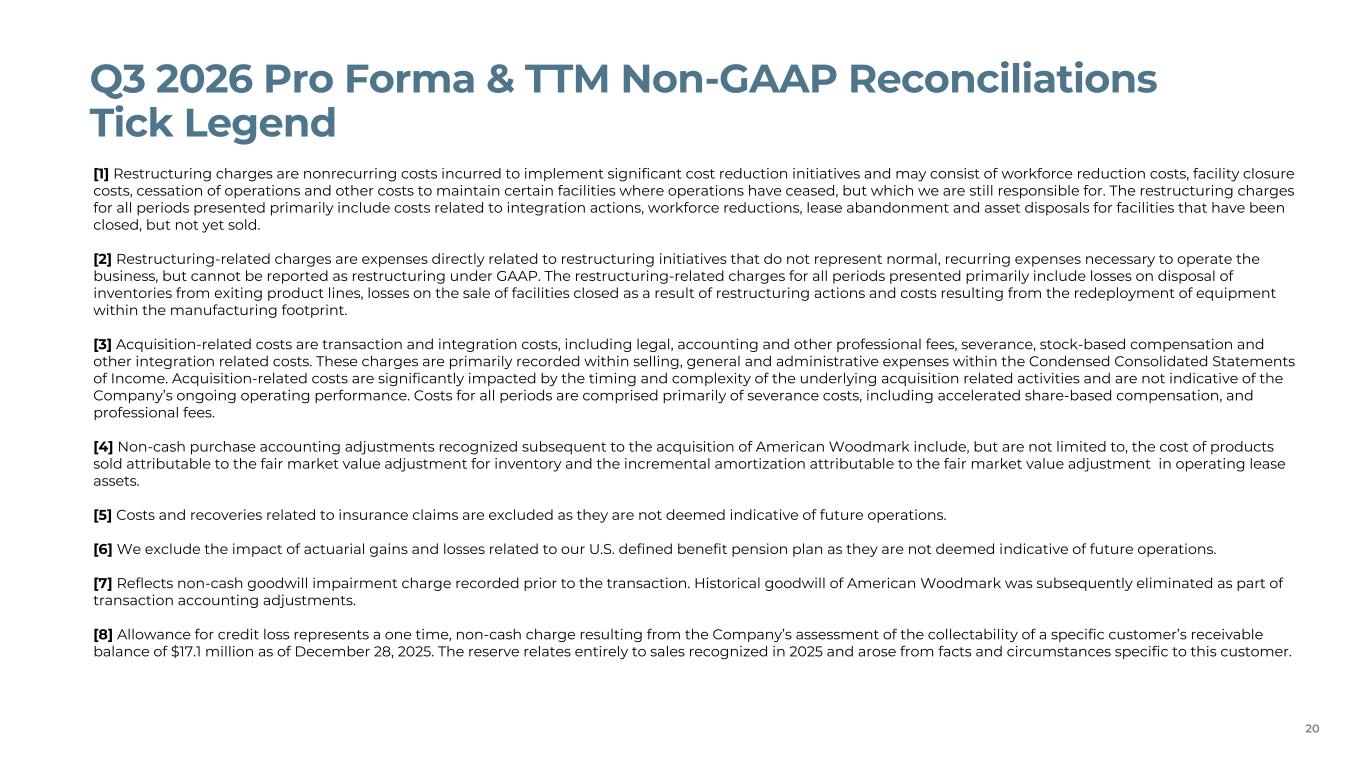
Q3 2026 Pro Forma & TTM Non-GAAP Reconciliations Tick Legend 20 [1] Restructuring charges are nonrecurring costs incurred to implement significant cost reduction initiatives and may consist of workforce reduction costs, facility closure costs, cessation of operations and other costs to maintain certain facilities where operations have ceased, but which we are still responsible for. The restructuring charges for all periods presented primarily include costs related to integration actions, workforce reductions, lease abandonment and asset disposals for facilities that have been closed, but not yet sold. [2] Restructuring-related charges are expenses directly related to restructuring initiatives that do not represent normal, recurring expenses necessary to operate the business, but cannot be reported as restructuring under GAAP. The restructuring-related charges for all periods presented primarily include losses on disposal of inventories from exiting product lines, losses on the sale of facilities closed as a result of restructuring actions and costs resulting from the redeployment of equipment within the manufacturing footprint. [3] Acquisition-related costs are transaction and integration costs, including legal, accounting and other professional fees, severance, stock-based compensation and other integration related costs. These charges are primarily recorded within selling, general and administrative expenses within the Condensed Consolidated Statements of Income. Acquisition-related costs are significantly impacted by the timing and complexity of the underlying acquisition related activities and are not indicative of the Company’s ongoing operating performance. Costs for all periods are comprised primarily of severance costs, including accelerated share-based compensation, and professional fees. [4] Non-cash purchase accounting adjustments recognized subsequent to the acquisition of American Woodmark include, but are not limited to, the cost of products sold attributable to the fair market value adjustment for inventory and the incremental amortization attributable to the fair market value adjustment in operating lease assets. [5] Costs and recoveries related to insurance claims are excluded as they are not deemed indicative of future operations. [6] We exclude the impact of actuarial gains and losses related to our U.S. defined benefit pension plan as they are not deemed indicative of future operations. [7] Reflects non-cash goodwill impairment charge recorded prior to the transaction. Historical goodwill of American Woodmark was subsequently eliminated as part of transaction accounting adjustments. [8] Allowance for credit loss represents a one time, non-cash charge resulting from the Company’s assessment of the collectability of a specific customer’s receivable balance of $17.1 million as of December 28, 2025. The reserve relates entirely to sales recognized in 2025 and arose from facts and circumstances specific to this customer.
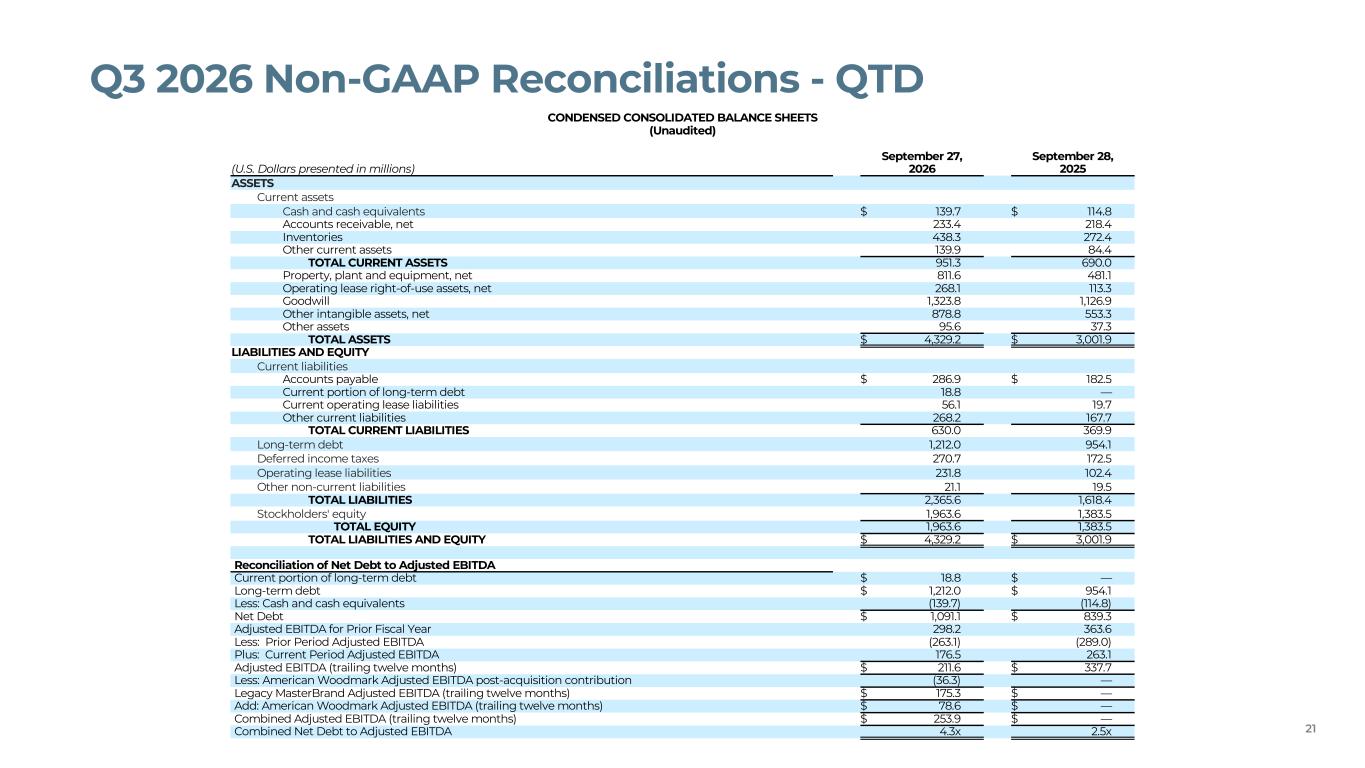
21 Q3 2026 Non-GAAP Reconciliations - QTD CONDENSED CONSOLIDATED BALANCE SHEETS (Unaudited) September 27, September 28, (U.S. Dollars presented in millions) 2026 2025 ASSETS Current assets Cash and cash equivalents $ 139.7 $ 114.8 Accounts receivable, net 233.4 218.4 Inventories 438.3 272.4 Other current assets 139.9 84.4 TOTAL CURRENT ASSETS 951.3 690.0 Property, plant and equipment, net 811.6 481.1 Operating lease right-of-use assets, net 268.1 113.3 Goodwill 1,323.8 1,126.9 Other intangible assets, net 878.8 553.3 Other assets 95.6 37.3 TOTAL ASSETS $ 4,329.2 $ 3,001.9 LIABILITIES AND EQUITY Current liabilities Accounts payable $ 286.9 $ 182.5 Current portion of long-term debt 18.8 — Current operating lease liabilities 56.1 19.7 Other current liabilities 268.2 167.7 TOTAL CURRENT LIABILITIES 630.0 369.9 Long-term debt 1,212.0 954.1 Deferred income taxes 270.7 172.5 Operating lease liabilities 231.8 102.4 Other non-current liabilities 21.1 19.5 TOTAL LIABILITIES 2,365.6 1,618.4 Stockholders' equity 1,963.6 1,383.5 TOTAL EQUITY 1,963.6 1,383.5 TOTAL LIABILITIES AND EQUITY $ 4,329.2 $ 3,001.9 Reconciliation of Net Debt to Adjusted EBITDA Current portion of long-term debt $ 18.8 $ — Long-term debt $ 1,212.0 $ 954.1 Less: Cash and cash equivalents (139.7) (114.8) Net Debt $ 1,091.1 $ 839.3 Adjusted EBITDA for Prior Fiscal Year 298.2 363.6 Less: Prior Period Adjusted EBITDA (263.1) (289.0) Plus: Current Period Adjusted EBITDA 176.5 263.1 Adjusted EBITDA (trailing twelve months) $ 211.6 $ 337.7 Less: American Woodmark Adjusted EBITDA post-acquisition contribution (36.3) — Legacy MasterBrand Adjusted EBITDA (trailing twelve months) $ 175.3 $ — Add: American Woodmark Adjusted EBITDA (trailing twelve months) $ 78.6 $ — Combined Adjusted EBITDA (trailing twelve months) $ 253.9 $ — Combined Net Debt to Adjusted EBITDA 4.3x 2.5x
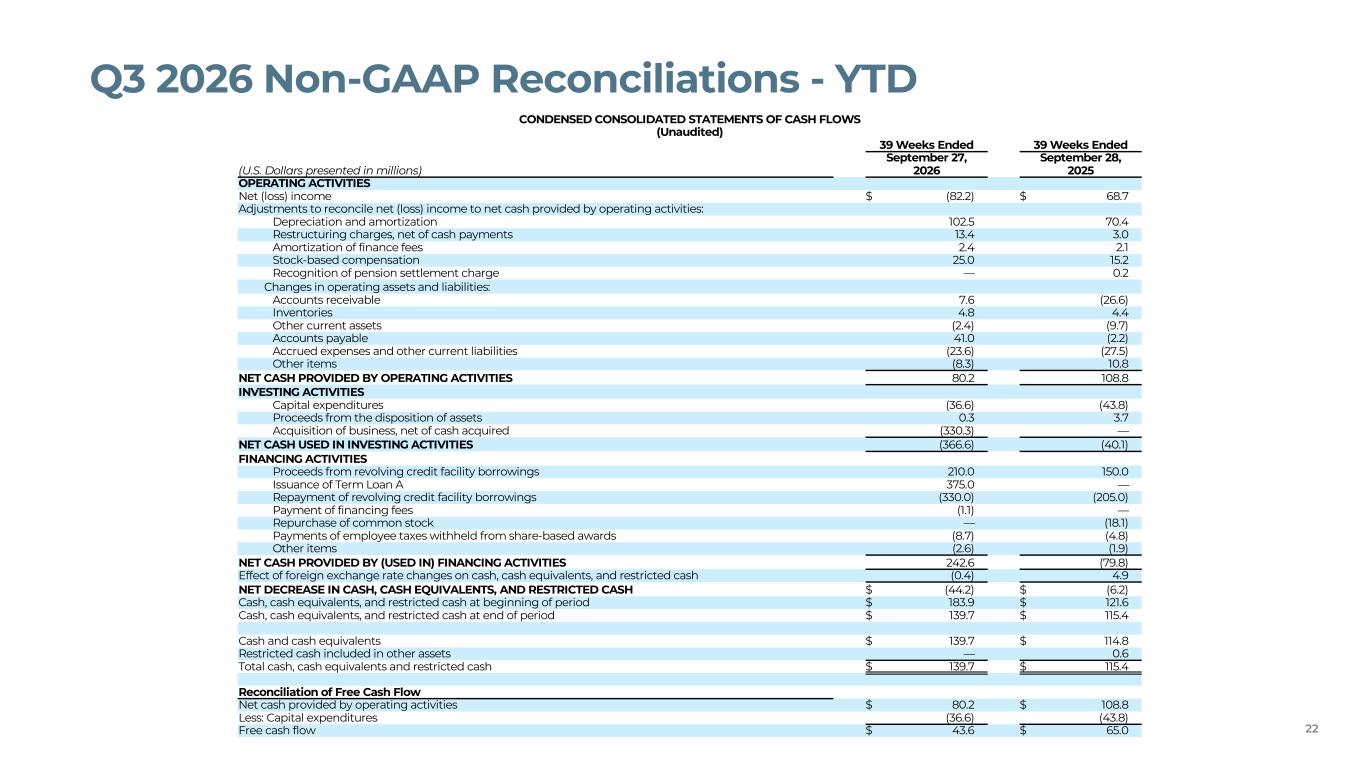
22 Q3 2026 Non-GAAP Reconciliations - YTD CONDENSED CONSOLIDATED STATEMENTS OF CASH FLOWS (Unaudited) 39 Weeks Ended 39 Weeks Ended September 27, September 28, (U.S. Dollars presented in millions) 2026 2025 OPERATING ACTIVITIES Net (loss) income $ (82.2) $ 68.7 Adjustments to reconcile net (loss) income to net cash provided by operating activities: Depreciation and amortization 102.5 70.4 Restructuring charges, net of cash payments 13.4 3.0 Amortization of finance fees 2.4 2.1 Stock-based compensation 25.0 15.2 Recognition of pension settlement charge — 0.2 Changes in operating assets and liabilities: Accounts receivable 7.6 (26.6) Inventories 4.8 4.4 Other current assets (2.4) (9.7) Accounts payable 41.0 (2.2) Accrued expenses and other current liabilities (23.6) (27.5) Other items (8.3) 10.8 NET CASH PROVIDED BY OPERATING ACTIVITIES 80.2 108.8 INVESTING ACTIVITIES Capital expenditures (36.6) (43.8) Proceeds from the disposition of assets 0.3 3.7 Acquisition of business, net of cash acquired (330.3) — NET CASH USED IN INVESTING ACTIVITIES (366.6) (40.1) FINANCING ACTIVITIES Proceeds from revolving credit facility borrowings 210.0 150.0 Issuance of Term Loan A 375.0 — Repayment of revolving credit facility borrowings (330.0) (205.0) Payment of financing fees (1.1) — Repurchase of common stock — (18.1) Payments of employee taxes withheld from share-based awards (8.7) (4.8) Other items (2.6) (1.9) NET CASH PROVIDED BY (USED IN) FINANCING ACTIVITIES 242.6 (79.8) Effect of foreign exchange rate changes on cash, cash equivalents, and restricted cash (0.4) 4.9 NET DECREASE IN CASH, CASH EQUIVALENTS, AND RESTRICTED CASH $ (44.2) $ (6.2) Cash, cash equivalents, and restricted cash at beginning of period $ 183.9 $ 121.6 Cash, cash equivalents, and restricted cash at end of period $ 139.7 $ 115.4 Cash and cash equivalents $ 139.7 $ 114.8 Restricted cash included in other assets — 0.6 Total cash, cash equivalents and restricted cash $ 139.7 $ 115.4 Reconciliation of Free Cash Flow Net cash provided by operating activities $ 80.2 $ 108.8 Less: Capital expenditures (36.6) (43.8) Free cash flow $ 43.6 $ 65.0
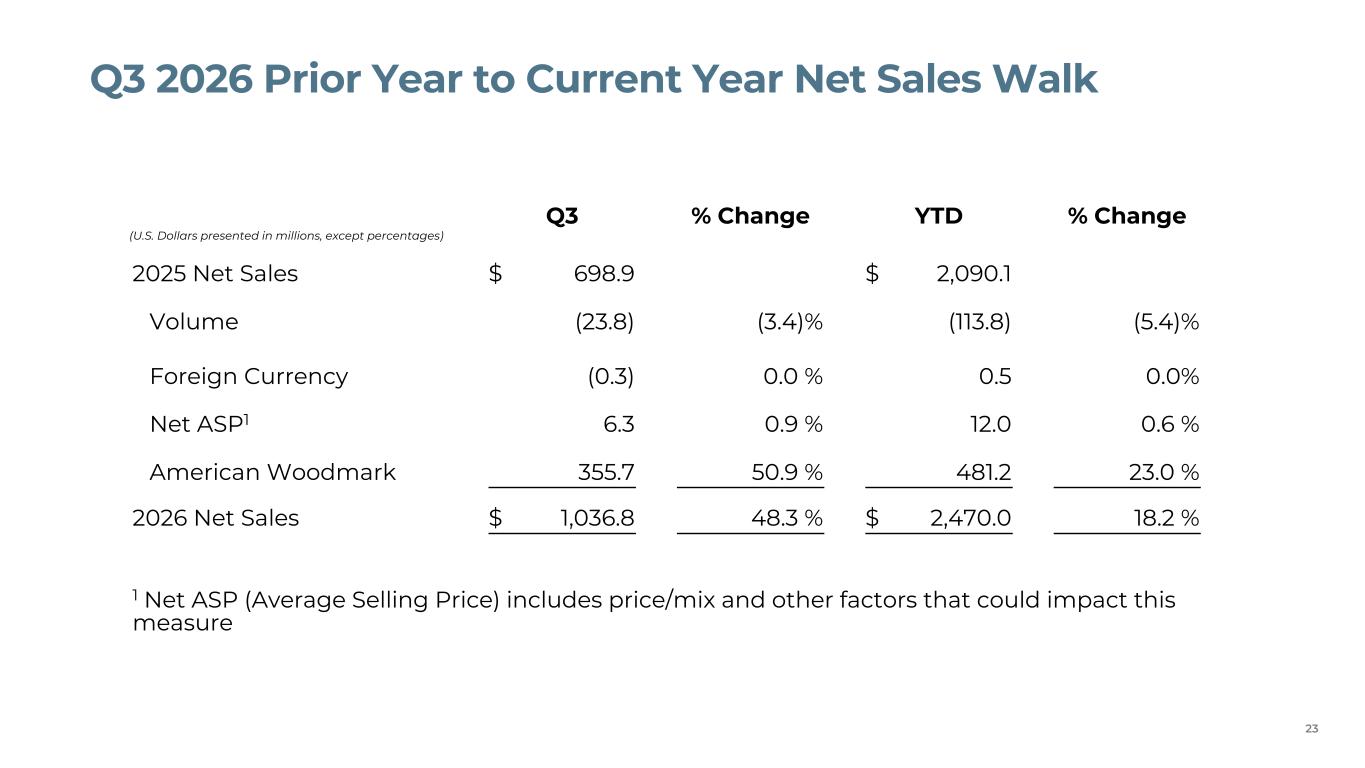
(U.S. Dollars presented in millions, except percentages) Q3 % Change YTD % Change 2025 Net Sales $ 698.9 $ 2,090.1 Volume (23.8) (3.4)% (113.8) (5.4)% Foreign Currency (0.3) 0.0 % 0.5 0.0% Net ASP1 6.3 0.9 % 12.0 0.6 % American Woodmark 355.7 50.9 % 481.2 23.0 % 2026 Net Sales $ 1,036.8 48.3 % $ 2,470.0 18.2 % 1 Net ASP (Average Selling Price) includes price/mix and other factors that could impact this measure 23 Q3 2026 Prior Year to Current Year Net Sales Walk