
Howard Hughes Holdings Inc. Third Quarter 2026 Supplemental Information September 30, 2026 Exhibit 99.2
2H O W A R D H U G H E S H O L D I N G S Cautionary Statements Forward-Looking Statements This presentation contains forward-looking statements. Forward-looking statements give our current expectations relating to our financial condition, results of operations, plans, objectives, future performance, or business, and are not guarantees of performance. These statements may include words such as “anticipate,” "believe," “estimate,” “expect,” “forecast,” “intend,” “likely,” “may,” “plan,” "project,” “realize,” “should,” “transform,” "will," “would,” and other statements of similar expression. Forward-looking statements should not be relied upon, and actual results may differ materially from those contemplated by such forward-looking statements. For a discussion of the risk factors that could have an impact on these forward-looking statements, see our Annual Report on Form 10-K for the fiscal year ended December 31, 2025, as filed with the Securities and Exchange Commission (SEC) on February 19, 2026, our Quarterly Report on Form 10-Q for the period ended June 30, 2026, as filed with the SEC on August 5, 2026, and our Quarterly Report on Form 10-Q for the period ended September 30, 2026, as filed with the SEC on November 5, 2026. The statements made herein speak only as of the date of this presentation, and we do not undertake to update this information except as required by law. Past performance does not guarantee future results. Performance during time periods shown is limited and may not reflect the performance for the full year or future years, or in different economic and market cycles. Non-GAAP Financial Measures Our financial statements have been prepared in accordance with accounting principles generally accepted in the United States (GAAP); however, we use certain non-GAAP performance measures in this presentation, in addition to GAAP measures, as we believe these measures improve the understanding of our operational results and make comparisons of operating results among peer companies more meaningful. Management continually evaluates the usefulness, relevance, limitations, and calculation of our reported non-GAAP performance measures to determine how best to provide relevant information to the public, and thus such reported measures could change. The non-GAAP financial measures used in this presentation are operating assets net operating income (NOI), total operating assets NOI, same store NOI, adjusted maintenance free cash flow, adjusted G&A expense, and net debt. Non-GAAP financial measures should not be considered independently, or as a substitute, for financial information presented in accordance with GAAP and our calculation of these non-GAAP measures may differ from similarly titled measures used by other companies. A detailed description of the non-GAAP financial measures used in this presentation, along with their definitions and purposes is provided on the “Non-GAAP Definitions” section (page 28) included in this supplemental presentation and reconciliations to the most directly comparable GAAP measures are included on the applicable pages within this presentation. Refer to page 31 for “Vantage Non-GAAP Definitions”. Additional Information Our website address is www.howardhughes.com. Our Annual Report on Form 10-K, Quarterly Reports on Form 10-Q, Current Reports on Form 8-K, and other publicly filed or furnished documents are available and may be accessed free of charge through the “Investors” section of our website under the "Financial Reporting" subsection, as soon as reasonably practicable after those documents are filed with, or furnished to, the SEC. Also available through the Investors section of our website are beneficial ownership reports filed by our directors, officers, and certain shareholders on Forms 3, 4, and 5. Monetary amounts presented are calculated based on the amounts in thousands of dollars stated in our consolidated financial statements, and then rounded to the nearest million (unless otherwise noted). Therefore, certain totals may not recalculate based on the amounts rounded to the nearest million.
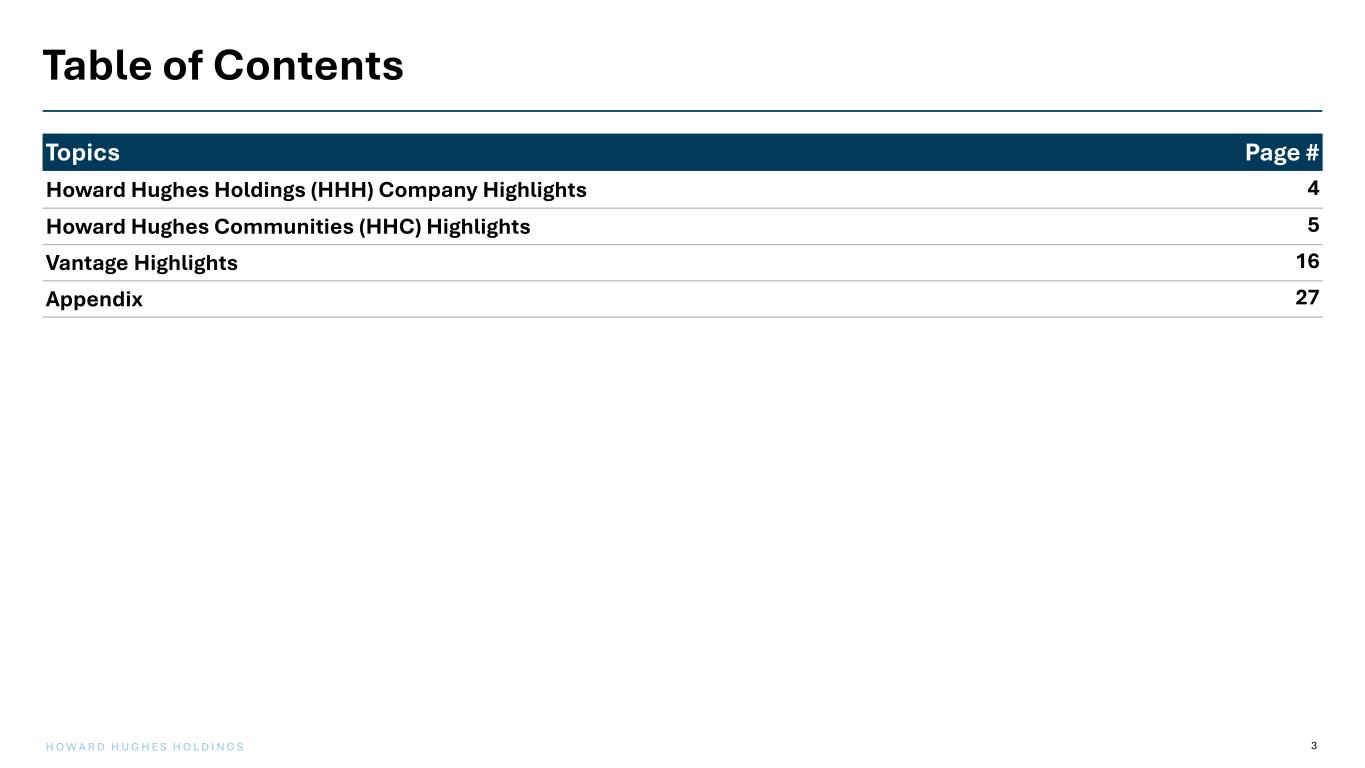
3H O W A R D H U G H E S H O L D I N G S Table of Contents Topics Page # Howard Hughes Holdings (HHH) Company Highlights 4 Howard Hughes Communities (HHC) Highlights 5 Vantage Highlights 16 Appendix 27
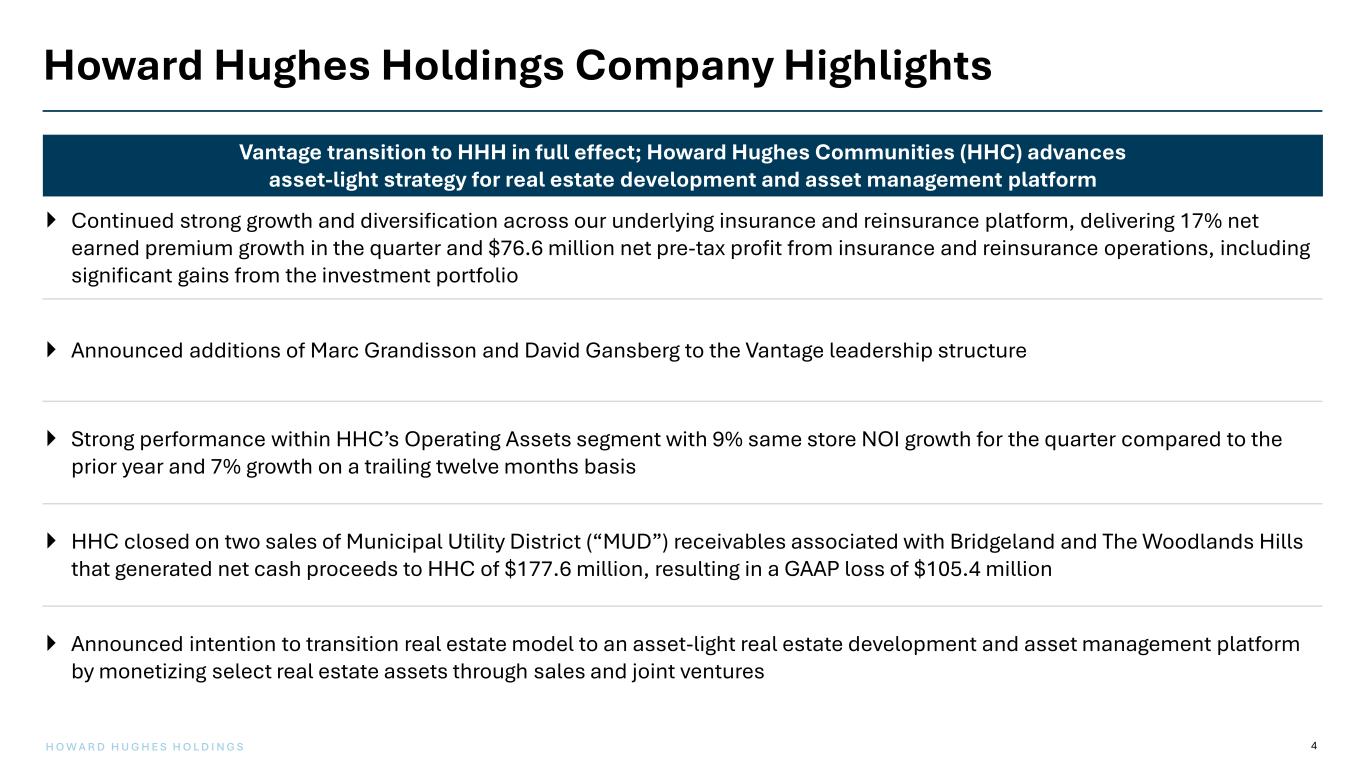
4H O W A R D H U G H E S H O L D I N G S Howard Hughes Holdings Company Highlights Continued strong growth and diversification across our underlying insurance and reinsurance platform, delivering 17% net earned premium growth in the quarter and $76.6 million net pre-tax profit from insurance and reinsurance operations, including significant gains from the investment portfolio Announced additions of Marc Grandisson and David Gansberg to the Vantage leadership structure Strong performance within HHC’s Operating Assets segment with 9% same store NOI growth for the quarter compared to the prior year and 7% growth on a trailing twelve months basis HHC closed on two sales of Municipal Utility District (“MUD”) receivables associated with Bridgeland and The Woodlands Hills that generated net cash proceeds to HHC of $177.6 million, resulting in a GAAP loss of $105.4 million Announced intention to transition real estate model to an asset-light real estate development and asset management platform by monetizing select real estate assets through sales and joint ventures Vantage transition to HHH in full effect; Howard Hughes Communities (HHC) advances asset-light strategy for real estate development and asset management platform

Howard Hughes Communities Highlights
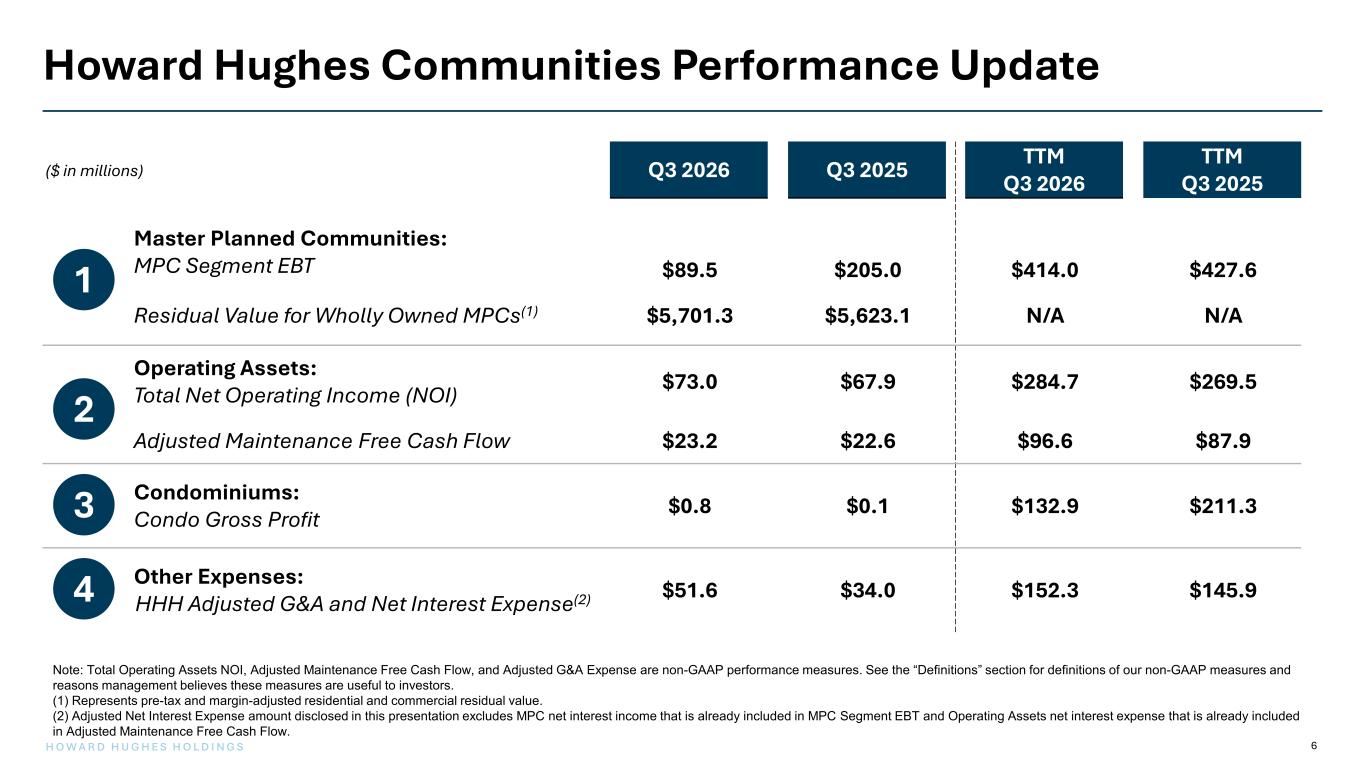
6H O W A R D H U G H E S H O L D I N G S ($ in millions) Q3 2026 Q3 2025 TTM Q3 2026 TTM Q3 2025 Master Planned Communities: MPC Segment EBT $89.5 $205.0 $414.0 $427.6 Residual Value for Wholly Owned MPCs(1) $5,701.3 $5,623.1 N/A N/A Operating Assets: Total Net Operating Income (NOI) $73.0 $67.9 $284.7 $269.5 Adjusted Maintenance Free Cash Flow $23.2 $22.6 $96.6 $87.9 Condominiums: Condo Gross Profit $0.8 $0.1 $132.9 $211.3 Other Expenses: HHH Adjusted G&A and Net Interest Expense(2) $51.6 $34.0 $152.3 $145.9 Howard Hughes Communities Performance Update 1 2 3 4 Note: Total Operating Assets NOI, Adjusted Maintenance Free Cash Flow, and Adjusted G&A Expense are non-GAAP performance measures. See the “Definitions” section for definitions of our non-GAAP measures and reasons management believes these measures are useful to investors. (1) Represents pre-tax and margin-adjusted residential and commercial residual value. (2) Adjusted Net Interest Expense amount disclosed in this presentation excludes MPC net interest income that is already included in MPC Segment EBT and Operating Assets net interest expense that is already included in Adjusted Maintenance Free Cash Flow.
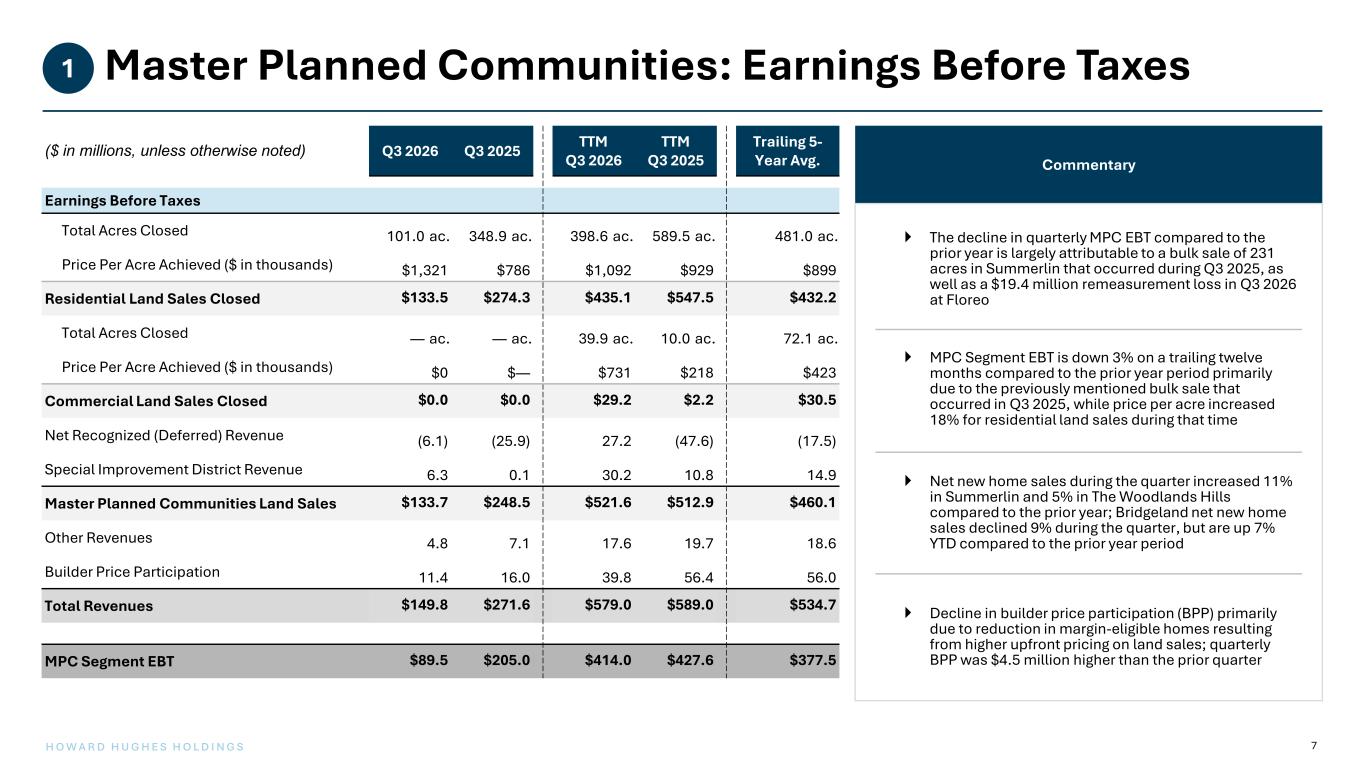
7H O W A R D H U G H E S H O L D I N G S Master Planned Communities: Earnings Before Taxes1 ($ in millions, unless otherwise noted) Q3 2026 Q3 2025 TTM Q3 2026 TTM Q3 2025 Trailing 5- Year Avg. Earnings Before Taxes Total Acres Closed 101.0 ac. 348.9 ac. 398.6 ac. 589.5 ac. 481.0 ac. Price Per Acre Achieved ($ in thousands) $1,321 $786 $1,092 $929 $899 Residential Land Sales Closed $133.5 $274.3 $435.1 $547.5 $432.2 Total Acres Closed — ac. — ac. 39.9 ac. 10.0 ac. 72.1 ac. Price Per Acre Achieved ($ in thousands) $0 $— $731 $218 $423 Commercial Land Sales Closed $0.0 $0.0 $29.2 $2.2 $30.5 Net Recognized (Deferred) Revenue (6.1) (25.9) 27.2 (47.6) (17.5) Special Improvement District Revenue 6.3 0.1 30.2 10.8 14.9 Master Planned Communities Land Sales $133.7 $248.5 $521.6 $512.9 $460.1 Other Revenues 4.8 7.1 17.6 19.7 18.6 Builder Price Participation 11.4 16.0 39.8 56.4 56.0 Total Revenues $149.8 $271.6 $579.0 $589.0 $534.7 MPC Segment EBT $89.5 $205.0 $414.0 $427.6 $377.5 Commentary The decline in quarterly MPC EBT compared to the prior year is largely attributable to a bulk sale of 231 acres in Summerlin that occurred during Q3 2025, as well as a $19.4 million remeasurement loss in Q3 2026 at Floreo MPC Segment EBT is down 3% on a trailing twelve months compared to the prior year period primarily due to the previously mentioned bulk sale that occurred in Q3 2025, while price per acre increased 18% for residential land sales during that time Net new home sales during the quarter increased 11% in Summerlin and 5% in The Woodlands Hills compared to the prior year; Bridgeland net new home sales declined 9% during the quarter, but are up 7% YTD compared to the prior year period Decline in builder price participation (BPP) primarily due to reduction in margin-eligible homes resulting from higher upfront pricing on land sales; quarterly BPP was $4.5 million higher than the prior quarter
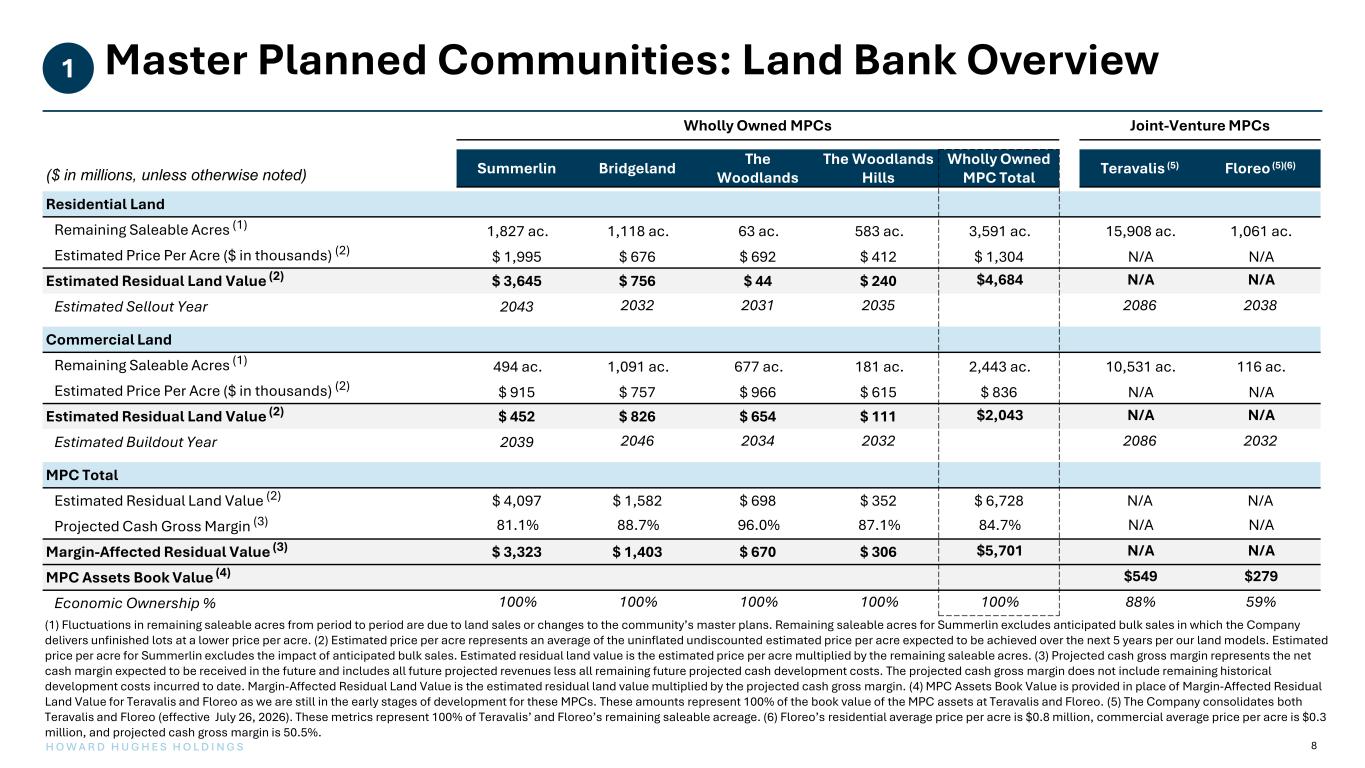
8H O W A R D H U G H E S H O L D I N G S Master Planned Communities: Land Bank Overview1 Wholly Owned MPCs Joint-Venture MPCs ($ in millions, unless otherwise noted) Summerlin Bridgeland The Woodlands The Woodlands Hills Wholly Owned MPC Total Teravalis (5) Floreo (5)(6) Residential Land Remaining Saleable Acres (1) 1,827 ac. 1,118 ac. 63 ac. 583 ac. 3,591 ac. 15,908 ac. 1,061 ac. Estimated Price Per Acre ($ in thousands) (2) $ 1,995 $ 676 $ 692 $ 412 $ 1,304 N/A N/A Estimated Residual Land Value (2) $ 3,645 $ 756 $ 44 $ 240 $4,684 N/A N/A Estimated Sellout Year 2043 2032 2031 2035 2086 2038 Commercial Land Remaining Saleable Acres (1) 494 ac. 1,091 ac. 677 ac. 181 ac. 2,443 ac. 10,531 ac. 116 ac. Estimated Price Per Acre ($ in thousands) (2) $ 915 $ 757 $ 966 $ 615 $ 836 N/A N/A Estimated Residual Land Value (2) $ 452 $ 826 $ 654 $ 111 $2,043 N/A N/A Estimated Buildout Year 2039 2046 2034 2032 2086 2032 MPC Total Estimated Residual Land Value (2) $ 4,097 $ 1,582 $ 698 $ 352 $ 6,728 N/A N/A Projected Cash Gross Margin (3) 81.1% 88.7% 96.0% 87.1% 84.7% N/A N/A Margin-Affected Residual Value (3) $ 3,323 $ 1,403 $ 670 $ 306 $5,701 N/A N/A MPC Assets Book Value (4) $549 $279 Economic Ownership % 100% 100% 100% 100% 100% 88% 59% (1) Fluctuations in remaining saleable acres from period to period are due to land sales or changes to the community’s master plans. Remaining saleable acres for Summerlin excludes anticipated bulk sales in which the Company delivers unfinished lots at a lower price per acre. (2) Estimated price per acre represents an average of the uninflated undiscounted estimated price per acre expected to be achieved over the next 5 years per our land models. Estimated price per acre for Summerlin excludes the impact of anticipated bulk sales. Estimated residual land value is the estimated price per acre multiplied by the remaining saleable acres. (3) Projected cash gross margin represents the net cash margin expected to be received in the future and includes all future projected revenues less all remaining future projected cash development costs. The projected cash gross margin does not include remaining historical development costs incurred to date. Margin-Affected Residual Land Value is the estimated residual land value multiplied by the projected cash gross margin. (4) MPC Assets Book Value is provided in place of Margin-Affected Residual Land Value for Teravalis and Floreo as we are still in the early stages of development for these MPCs. These amounts represent 100% of the book value of the MPC assets at Teravalis and Floreo. (5) The Company consolidates both Teravalis and Floreo (effective July 26, 2026). These metrics represent 100% of Teravalis’ and Floreo’s remaining saleable acreage. (6) Floreo’s residential average price per acre is $0.8 million, commercial average price per acre is $0.3 million, and projected cash gross margin is 50.5%.
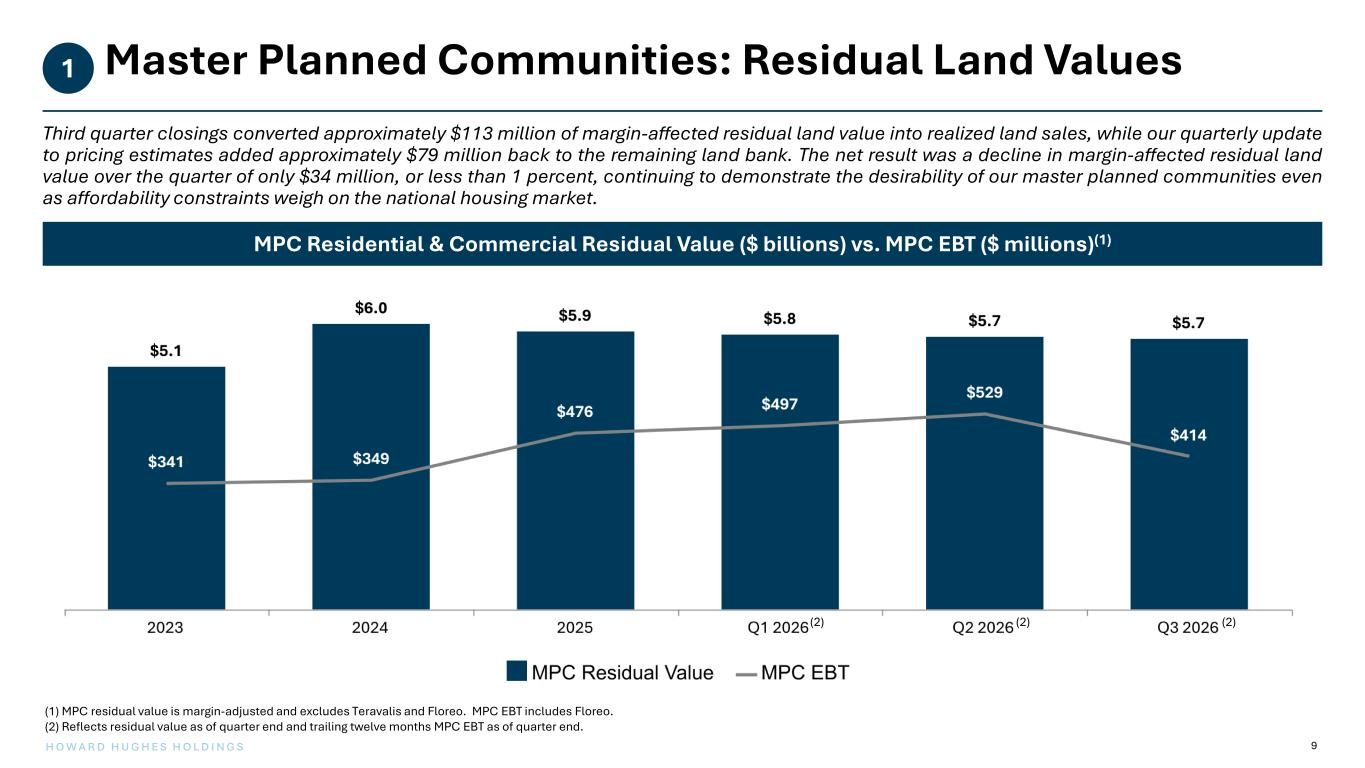
9H O W A R D H U G H E S H O L D I N G S Master Planned Communities: Residual Land Values1 (1) MPC residual value is margin-adjusted and excludes Teravalis and Floreo. MPC EBT includes Floreo. (2) Reflects residual value as of quarter end and trailing twelve months MPC EBT as of quarter end. MPC Residential & Commercial Residual Value ($ billions) vs. MPC EBT ($ millions)(1) Third quarter closings converted approximately $113 million of margin-affected residual land value into realized land sales, while our quarterly update to pricing estimates added approximately $79 million back to the remaining land bank. The net result was a decline in margin-affected residual land value over the quarter of only $34 million, or less than 1 percent, continuing to demonstrate the desirability of our master planned communities even as affordability constraints weigh on the national housing market. (2) (2)(2)
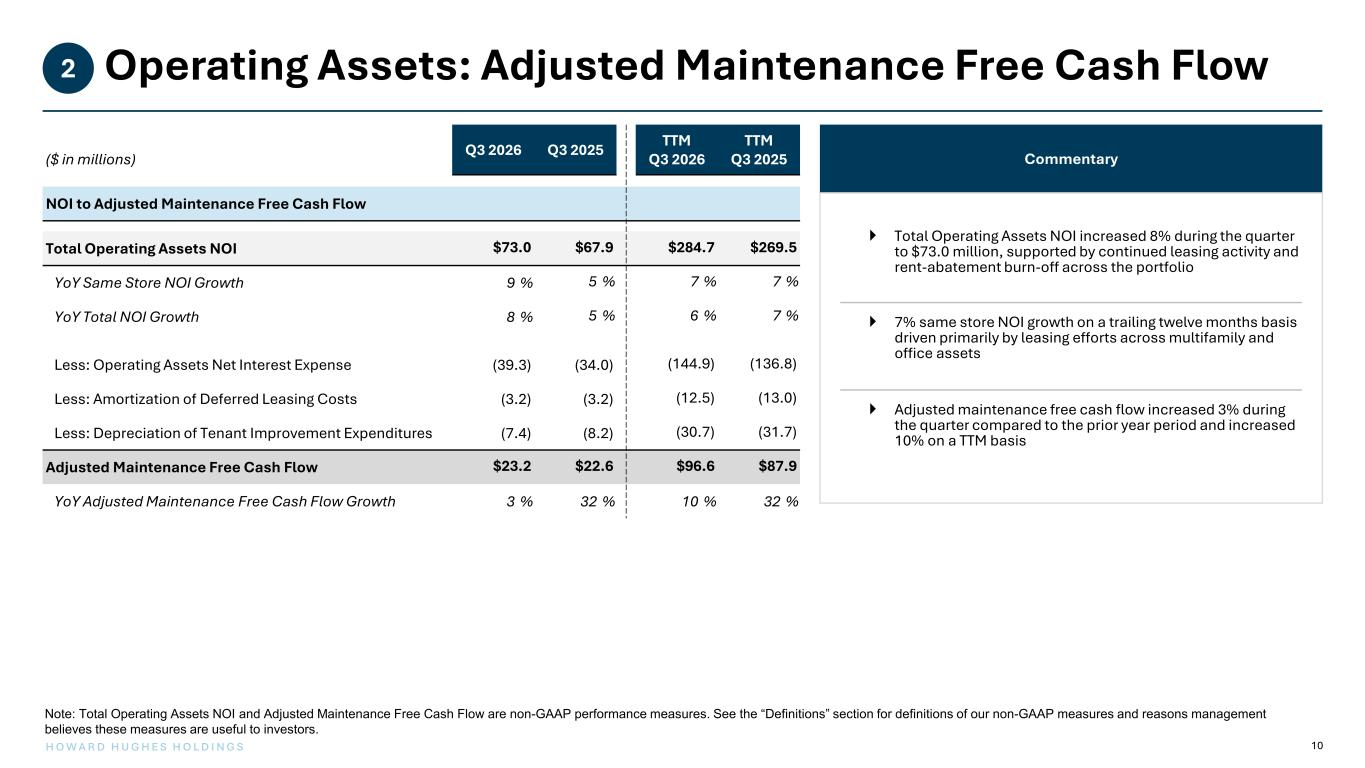
10H O W A R D H U G H E S H O L D I N G S Operating Assets: Adjusted Maintenance Free Cash Flow2 ($ in millions) Q3 2026 Q3 2025 TTM Q3 2026 TTM Q3 2025 NOI to Adjusted Maintenance Free Cash Flow Total Operating Assets NOI $73.0 $67.9 $284.7 $269.5 YoY Same Store NOI Growth 9 % 5 % 7 % 7 % YoY Total NOI Growth 8 % 5 % 6 % 7 % Less: Operating Assets Net Interest Expense (39.3) (34.0) (144.9) (136.8) Less: Amortization of Deferred Leasing Costs (3.2) (3.2) (12.5) (13.0) Less: Depreciation of Tenant Improvement Expenditures (7.4) (8.2) (30.7) (31.7) Adjusted Maintenance Free Cash Flow $23.2 $22.6 $96.6 $87.9 YoY Adjusted Maintenance Free Cash Flow Growth 3 % 32 % 10 % 32 % Note: Total Operating Assets NOI and Adjusted Maintenance Free Cash Flow are non-GAAP performance measures. See the “Definitions” section for definitions of our non-GAAP measures and reasons management believes these measures are useful to investors. Commentary Total Operating Assets NOI increased 8% during the quarter to $73.0 million, supported by continued leasing activity and rent-abatement burn-off across the portfolio 7% same store NOI growth on a trailing twelve months basis driven primarily by leasing efforts across multifamily and office assets Adjusted maintenance free cash flow increased 3% during the quarter compared to the prior year period and increased 10% on a TTM basis
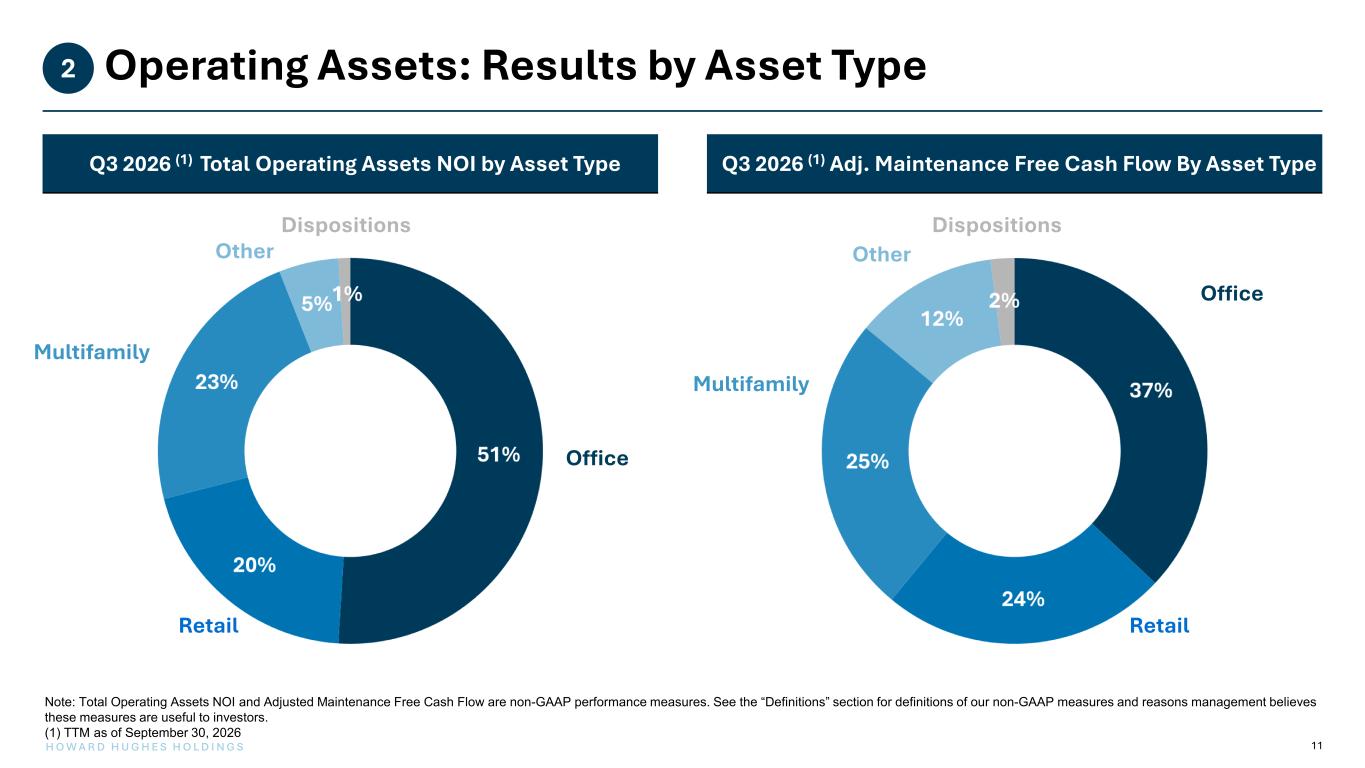
11H O W A R D H U G H E S H O L D I N G S Operating Assets: Results by Asset Type2 Q3 2026 (1) Adj. Maintenance Free Cash Flow By Asset Type Note: Total Operating Assets NOI and Adjusted Maintenance Free Cash Flow are non-GAAP performance measures. See the “Definitions” section for definitions of our non-GAAP measures and reasons management believes these measures are useful to investors. (1) TTM as of September 30, 2026 Q3 2026 (1) Total Operating Assets NOI by Asset Type Other Other Multifamily Office Retail Office Multifamily Retail DispositionsDispositions
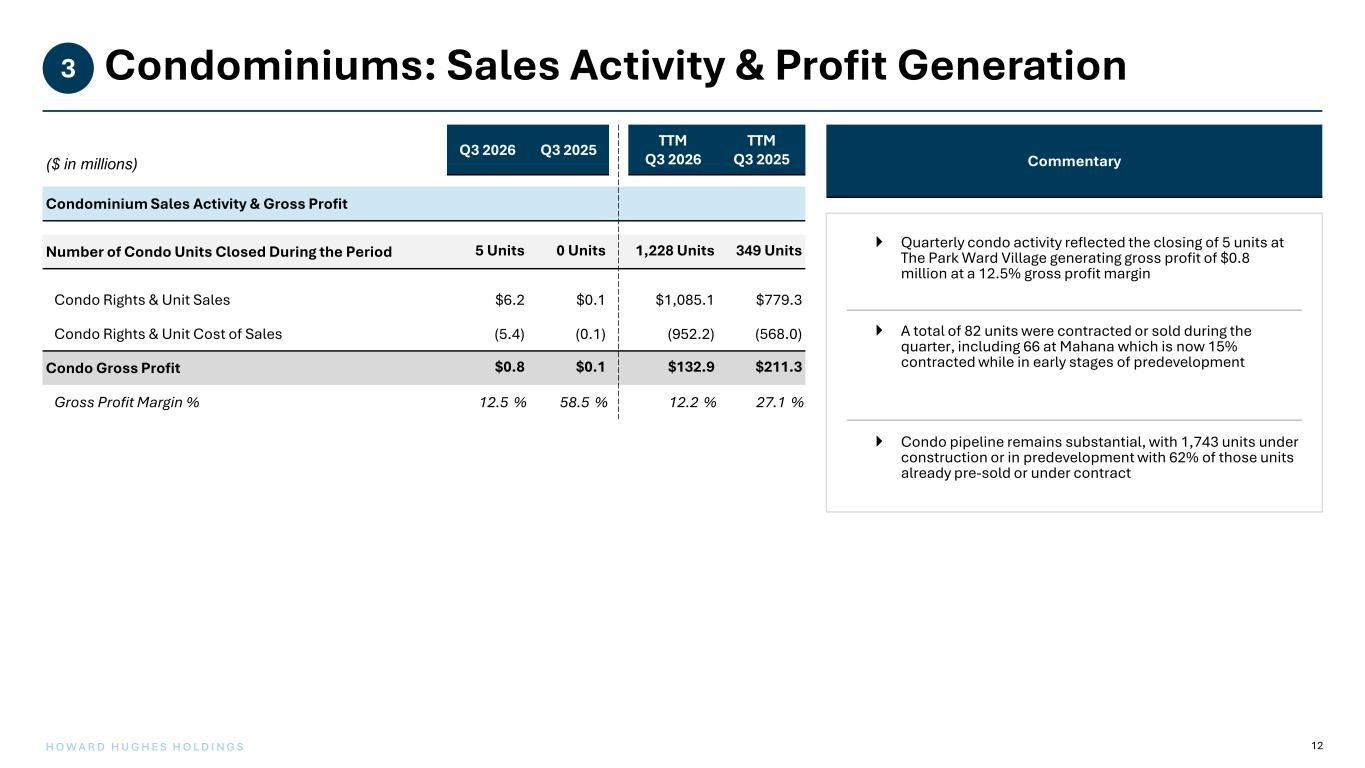
12H O W A R D H U G H E S H O L D I N G S Condominiums: Sales Activity & Profit Generation3 ($ in millions) Q3 2026 Q3 2025 TTM Q3 2026 TTM Q3 2025 Condominium Sales Activity & Gross Profit Number of Condo Units Closed During the Period 5 Units 0 Units 1,228 Units 349 Units Condo Rights & Unit Sales $6.2 $0.1 $1,085.1 $779.3 Condo Rights & Unit Cost of Sales (5.4) (0.1) (952.2) (568.0) Condo Gross Profit $0.8 $0.1 $132.9 $211.3 Gross Profit Margin % 12.5 % 58.5 % 12.2 % 27.1 % Commentary Quarterly condo activity reflected the closing of 5 units at The Park Ward Village generating gross profit of $0.8 million at a 12.5% gross profit margin A total of 82 units were contracted or sold during the quarter, including 66 at Mahana which is now 15% contracted while in early stages of predevelopment Condo pipeline remains substantial, with 1,743 units under construction or in predevelopment with 62% of those units already pre-sold or under contract
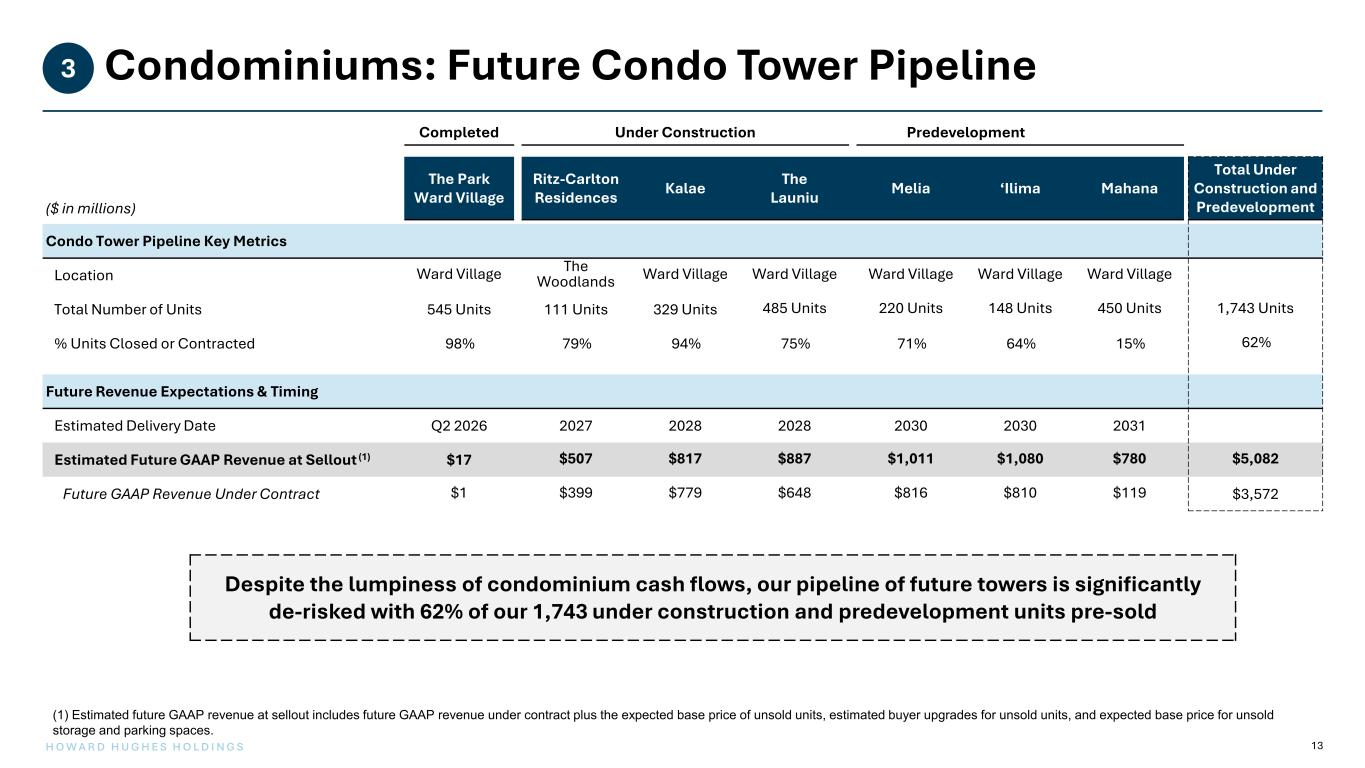
13H O W A R D H U G H E S H O L D I N G S Condominiums: Future Condo Tower Pipeline3 Completed Under Construction Predevelopment ($ in millions) The Park Ward Village Ritz-Carlton Residences Kalae The Launiu Melia ‘Ilima Mahana Total Under Construction and Predevelopment Condo Tower Pipeline Key Metrics Location Ward Village The Woodlands Ward Village Ward Village Ward Village Ward Village Ward Village Total Number of Units 545 Units 111 Units 329 Units 485 Units 220 Units 148 Units 450 Units 1,743 Units % Units Closed or Contracted 98% 79% 94% 75% 71% 64% 15% 62% Future Revenue Expectations & Timing Estimated Delivery Date Q2 2026 2027 2028 2028 2030 2030 2031 Estimated Future GAAP Revenue at Sellout (1) $17 $507 $817 $887 $1,011 $1,080 $780 $5,082 Future GAAP Revenue Under Contract $1 $399 $779 $648 $816 $810 $119 $3,572 Despite the lumpiness of condominium cash flows, our pipeline of future towers is significantly de-risked with 62% of our 1,743 under construction and predevelopment units pre-sold (1) Estimated future GAAP revenue at sellout includes future GAAP revenue under contract plus the expected base price of unsold units, estimated buyer upgrades for unsold units, and expected base price for unsold storage and parking spaces.
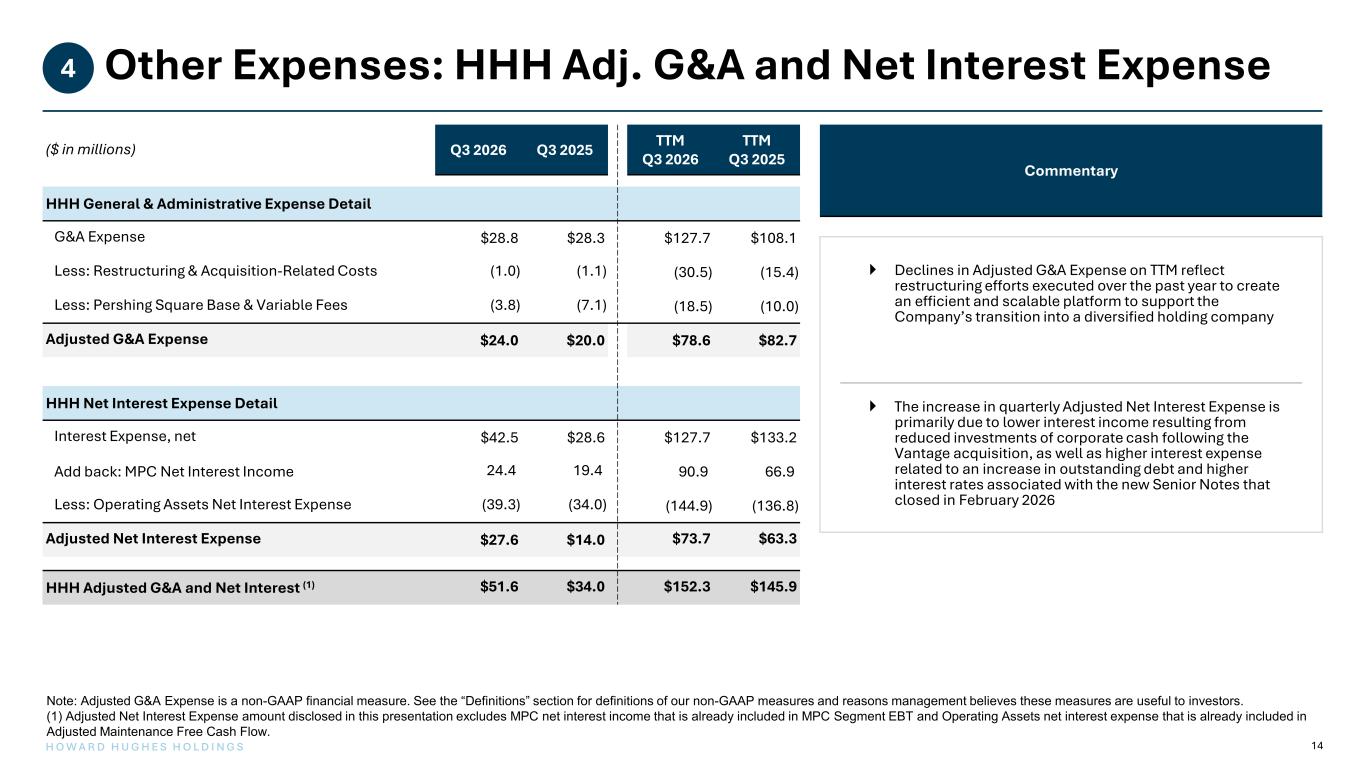
14H O W A R D H U G H E S H O L D I N G S ($ in millions) Q3 2026 Q3 2025 TTM Q3 2026 TTM Q3 2025 HHH General & Administrative Expense Detail G&A Expense $28.8 $28.3 $127.7 $108.1 Less: Restructuring & Acquisition-Related Costs (1.0) (1.1) (30.5) (15.4) Less: Pershing Square Base & Variable Fees (3.8) (7.1) (18.5) (10.0) Adjusted G&A Expense $24.0 $20.0 $78.6 $82.7 HHH Net Interest Expense Detail Interest Expense, net $42.5 $28.6 $127.7 $133.2 Add back: MPC Net Interest Income 24.4 19.4 90.9 66.9 Less: Operating Assets Net Interest Expense (39.3) (34.0) (144.9) (136.8) Adjusted Net Interest Expense $27.6 $14.0 $73.7 $63.3 HHH Adjusted G&A and Net Interest (1) $51.6 $34.0 $152.3 $145.9 Other Expenses: HHH Adj. G&A and Net Interest Expense4 Note: Adjusted G&A Expense is a non-GAAP financial measure. See the “Definitions” section for definitions of our non-GAAP measures and reasons management believes these measures are useful to investors. (1) Adjusted Net Interest Expense amount disclosed in this presentation excludes MPC net interest income that is already included in MPC Segment EBT and Operating Assets net interest expense that is already included in Adjusted Maintenance Free Cash Flow. Commentary Declines in Adjusted G&A Expense on TTM reflect restructuring efforts executed over the past year to create an efficient and scalable platform to support the Company’s transition into a diversified holding company The increase in quarterly Adjusted Net Interest Expense is primarily due to lower interest income resulting from reduced investments of corporate cash following the Vantage acquisition, as well as higher interest expense related to an increase in outstanding debt and higher interest rates associated with the new Senior Notes that closed in February 2026
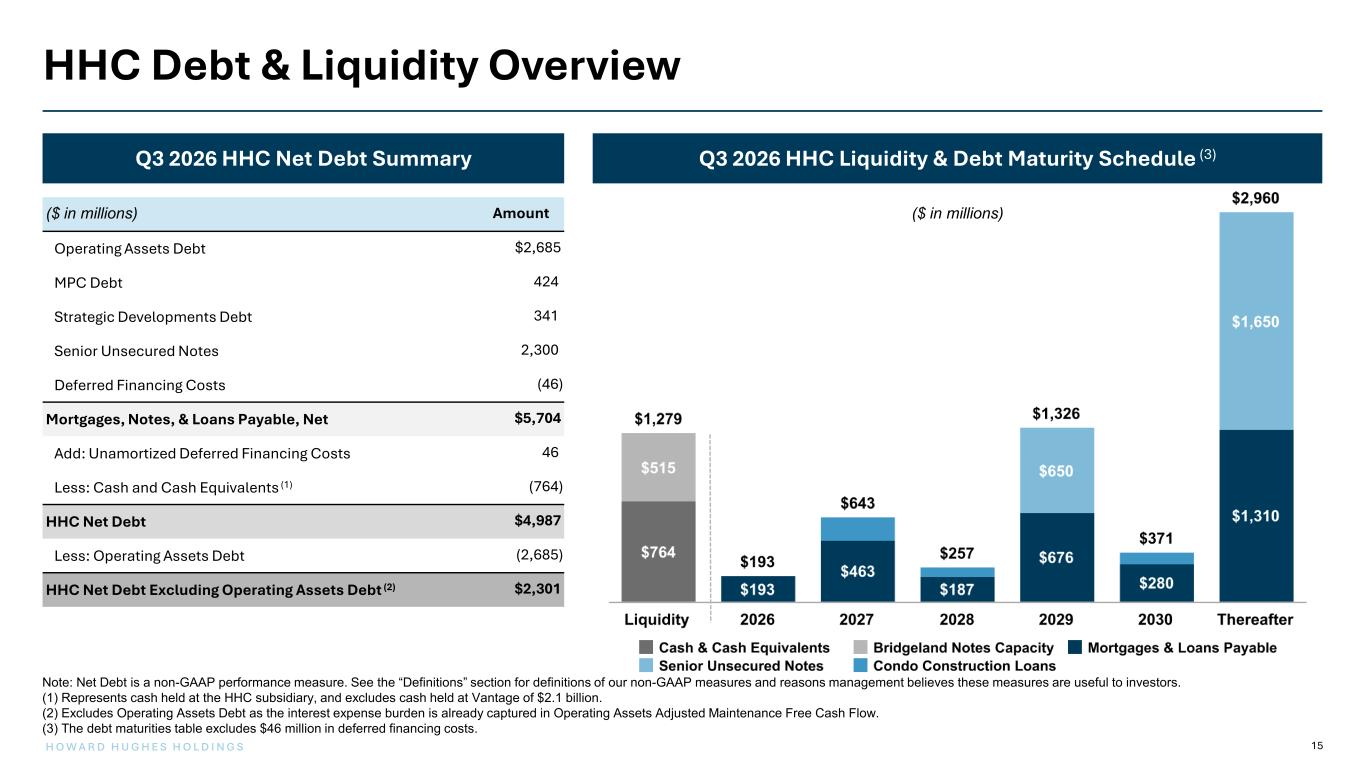
15H O W A R D H U G H E S H O L D I N G S Q3 2026 HHC Liquidity & Debt Maturity Schedule (3) ($ in millions) Q3 2026 HHC Net Debt Summary ($ in millions) Amount Operating Assets Debt $2,685 MPC Debt 424 Strategic Developments Debt 341 Senior Unsecured Notes 2,300 Deferred Financing Costs (46) Mortgages, Notes, & Loans Payable, Net $5,704 Add: Unamortized Deferred Financing Costs 46 Less: Cash and Cash Equivalents (1) (764) HHC Net Debt $4,987 Less: Operating Assets Debt (2,685) HHC Net Debt Excluding Operating Assets Debt (2) $2,301 HHC Debt & Liquidity Overview Note: Net Debt is a non-GAAP performance measure. See the “Definitions” section for definitions of our non-GAAP measures and reasons management believes these measures are useful to investors. (1) Represents cash held at the HHC subsidiary, and excludes cash held at Vantage of $2.1 billion. (2) Excludes Operating Assets Debt as the interest expense burden is already captured in Operating Assets Adjusted Maintenance Free Cash Flow. (3) The debt maturities table excludes $46 million in deferred financing costs.

Vantage Highlights
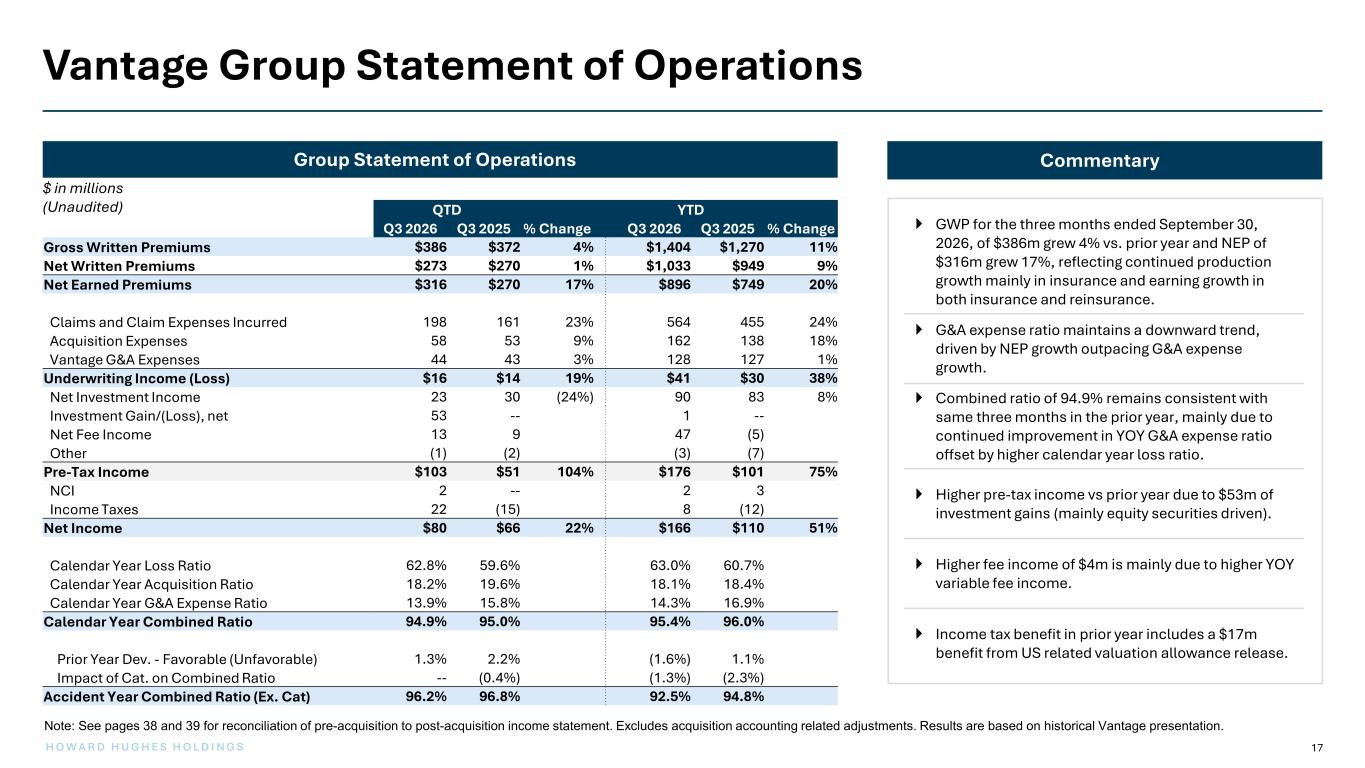
17 H O W A R D H U G H E S H O L D I N G S CommentaryGroup Statement of Operations $ in millions (Unaudited) GWP for the three months ended September 30, 2026, of $386m grew 4% vs. prior year and NEP of $316m grew 17%, reflecting continued production growth mainly in insurance and earning growth in both insurance and reinsurance. G&A expense ratio maintains a downward trend, driven by NEP growth outpacing G&A expense growth. Combined ratio of 94.9% remains consistent with same three months in the prior year, mainly due to continued improvement in YOY G&A expense ratio offset by higher calendar year loss ratio. Higher pre-tax income vs prior year due to $53m of investment gains (mainly equity securities driven). Higher fee income of $4m is mainly due to higher YOY variable fee income. Income tax benefit in prior year includes a $17m benefit from US related valuation allowance release. QTD YTD Q3 2026 Q3 2025 % Change Q3 2026 Q3 2025 % Change Gross Written Premiums $386 $372 4% $1,404 $1,270 11% Net Written Premiums $273 $270 1% $1,033 $949 9% Net Earned Premiums $316 $270 17% $896 $749 20% Claims and Claim Expenses Incurred 198 161 23% 564 455 24% Acquisition Expenses 58 53 9% 162 138 18% Vantage G&A Expenses 44 43 3% 128 127 1% Underwriting Income (Loss) $16 $14 19% $41 $30 38% Net Investment Income 23 30 (24%) 90 83 8% Investment Gain/(Loss), net 53 -- 1 -- Net Fee Income 13 9 47 (5) Other (1) (2) (3) (7) Pre-Tax Income $103 $51 104% $176 $101 75% NCI 2 -- 2 3 Income Taxes 22 (15) 8 (12) Net Income $80 $66 22% $166 $110 51% Calendar Year Loss Ratio 62.8% 59.6% 63.0% 60.7% Calendar Year Acquisition Ratio 18.2% 19.6% 18.1% 18.4% Calendar Year G&A Expense Ratio 13.9% 15.8% 14.3% 16.9% Calendar Year Combined Ratio 94.9% 95.0% 95.4% 96.0% Prior Year Dev. - Favorable (Unfavorable) 1.3% 2.2% (1.6%) 1.1% Impact of Cat. on Combined Ratio -- (0.4%) (1.3%) (2.3%) Accident Year Combined Ratio (Ex. Cat) 96.2% 96.8% 92.5% 94.8% Vantage Group Statement of Operations Note: See pages 38 and 39 for reconciliation of pre-acquisition to post-acquisition income statement. Excludes acquisition accounting related adjustments. Results are based on historical Vantage presentation.
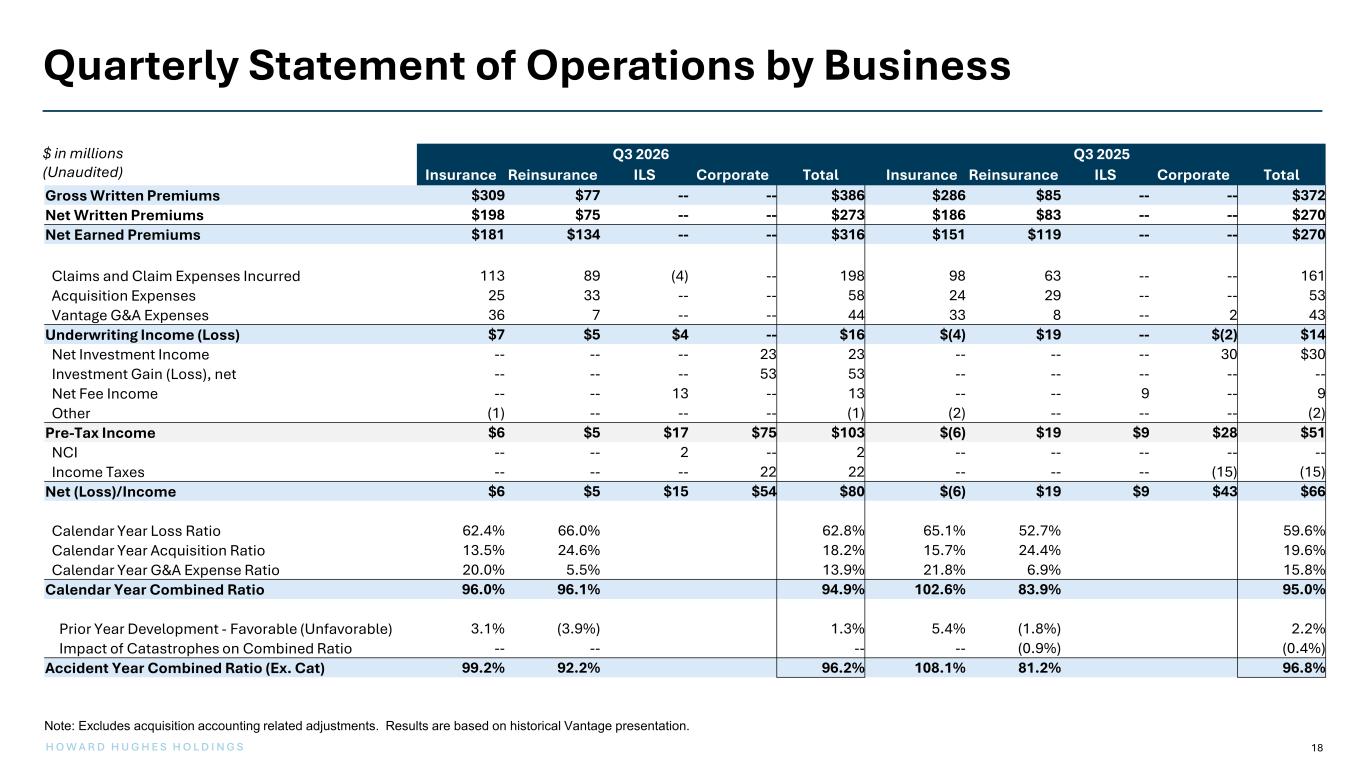
18 H O W A R D H U G H E S H O L D I N G S Q3 2026 Q3 2025 Insurance Reinsurance ILS Corporate Total Insurance Reinsurance ILS Corporate Total Gross Written Premiums $309 $77 -- -- $386 $286 $85 -- -- $372 Net Written Premiums $198 $75 -- -- $273 $186 $83 -- -- $270 Net Earned Premiums $181 $134 -- -- $316 $151 $119 -- -- $270 Claims and Claim Expenses Incurred 113 89 (4) -- 198 98 63 -- -- 161 Acquisition Expenses 25 33 -- -- 58 24 29 -- -- 53 Vantage G&A Expenses 36 7 -- -- 44 33 8 -- 2 43 Underwriting Income (Loss) $7 $5 $4 -- $16 $(4) $19 -- $(2) $14 Net Investment Income -- -- -- 23 23 -- -- -- 30 $30 Investment Gain (Loss), net -- -- -- 53 53 -- -- -- -- -- Net Fee Income -- -- 13 -- 13 -- -- 9 -- 9 Other (1) -- -- -- (1) (2) -- -- -- (2) Pre-Tax Income $6 $5 $17 $75 $103 $(6) $19 $9 $28 $51 NCI -- -- 2 -- 2 -- -- -- -- -- Income Taxes -- -- -- 22 22 -- -- -- (15) (15) Net (Loss)/Income $6 $5 $15 $54 $80 $(6) $19 $9 $43 $66 Calendar Year Loss Ratio 62.4% 66.0% 62.8% 65.1% 52.7% 59.6% Calendar Year Acquisition Ratio 13.5% 24.6% 18.2% 15.7% 24.4% 19.6% Calendar Year G&A Expense Ratio 20.0% 5.5% 13.9% 21.8% 6.9% 15.8% Calendar Year Combined Ratio 96.0% 96.1% 94.9% 102.6% 83.9% 95.0% Prior Year Development - Favorable (Unfavorable) 3.1% (3.9%) 1.3% 5.4% (1.8%) 2.2% Impact of Catastrophes on Combined Ratio -- -- -- -- (0.9%) (0.4%) Accident Year Combined Ratio (Ex. Cat) 99.2% 92.2% 96.2% 108.1% 81.2% 96.8% Quarterly Statement of Operations by Business $ in millions (Unaudited) Note: Excludes acquisition accounting related adjustments. Results are based on historical Vantage presentation.
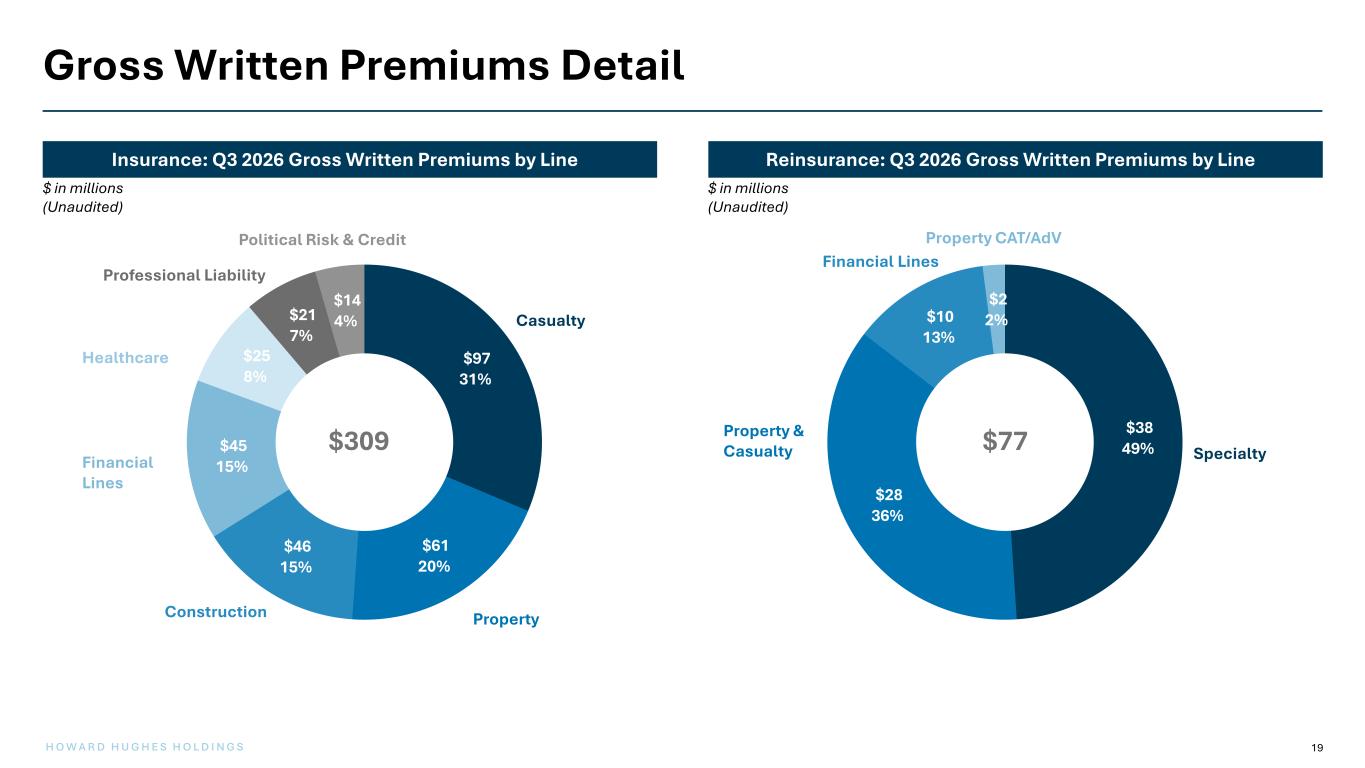
19 H O W A R D H U G H E S H O L D I N G S Gross Written Premiums Detail Reinsurance: Q3 2026 Gross Written Premiums by LineInsurance: Q3 2026 Gross Written Premiums by Line $ in millions (Unaudited) $97 31% $61 20% $46 15% $45 15% $25 8% $21 7% $14 4% Casualty PropertyConstruction Financial Lines Healthcare Professional Liability Political Risk & Credit $38 49% $28 36% $10 13% $2 2% Specialty Property & Casualty Financial Lines Property CAT/AdV $77$309 $ in millions (Unaudited)
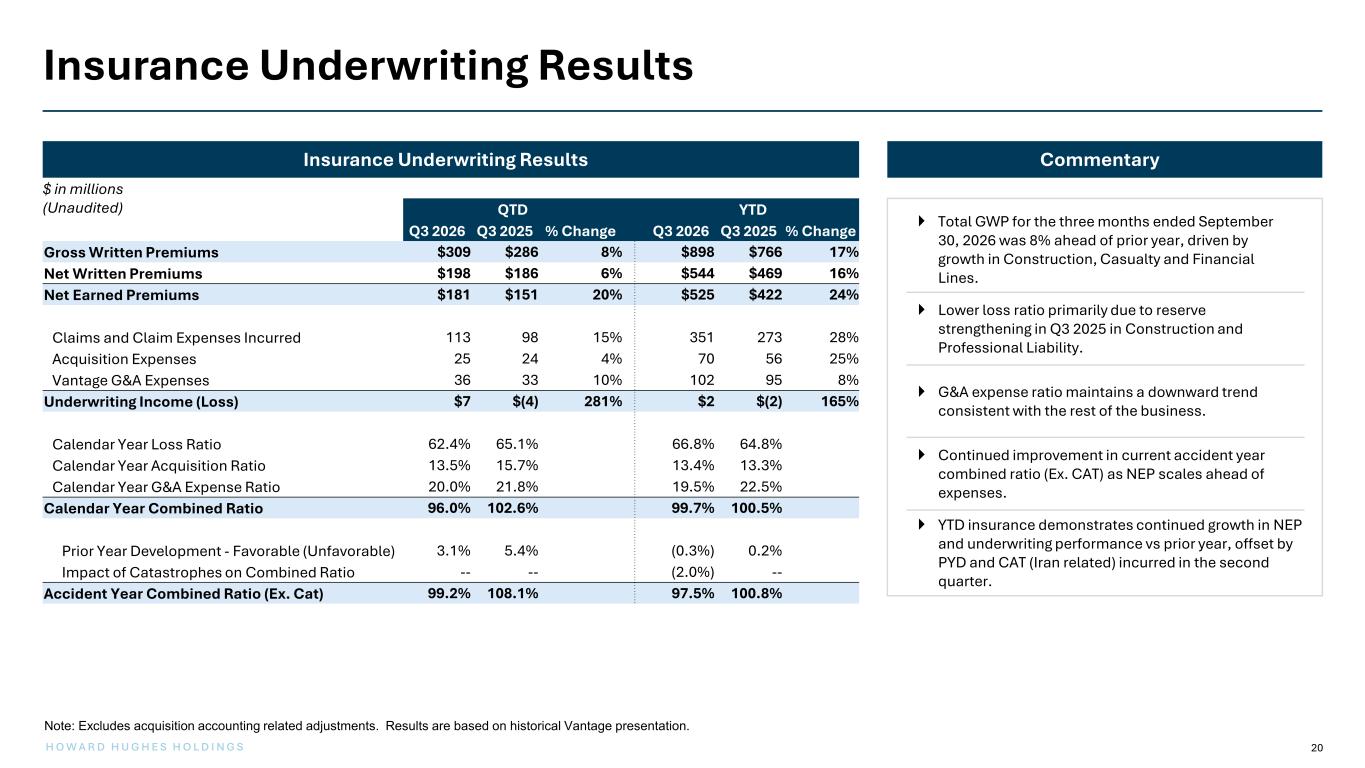
20 H O W A R D H U G H E S H O L D I N G S Insurance Underwriting Results $ in millions (Unaudited) Commentary Total GWP for the three months ended September 30, 2026 was 8% ahead of prior year, driven by growth in Construction, Casualty and Financial Lines. Lower loss ratio primarily due to reserve strengthening in Q3 2025 in Construction and Professional Liability. G&A expense ratio maintains a downward trend consistent with the rest of the business. Continued improvement in current accident year combined ratio (Ex. CAT) as NEP scales ahead of expenses. YTD insurance demonstrates continued growth in NEP and underwriting performance vs prior year, offset by PYD and CAT (Iran related) incurred in the second quarter. Insurance Underwriting Results QTD YTD Q3 2026 Q3 2025 % Change Q3 2026 Q3 2025 % Change Gross Written Premiums $309 $286 8% $898 $766 17% Net Written Premiums $198 $186 6% $544 $469 16% Net Earned Premiums $181 $151 20% $525 $422 24% Claims and Claim Expenses Incurred 113 98 15% 351 273 28% Acquisition Expenses 25 24 4% 70 56 25% Vantage G&A Expenses 36 33 10% 102 95 8% Underwriting Income (Loss) $7 $(4) 281% $2 $(2) 165% Calendar Year Loss Ratio 62.4% 65.1% 66.8% 64.8% Calendar Year Acquisition Ratio 13.5% 15.7% 13.4% 13.3% Calendar Year G&A Expense Ratio 20.0% 21.8% 19.5% 22.5% Calendar Year Combined Ratio 96.0% 102.6% 99.7% 100.5% Prior Year Development - Favorable (Unfavorable) 3.1% 5.4% (0.3%) 0.2% Impact of Catastrophes on Combined Ratio -- -- (2.0%) -- Accident Year Combined Ratio (Ex. Cat) 99.2% 108.1% 97.5% 100.8% Note: Excludes acquisition accounting related adjustments. Results are based on historical Vantage presentation.
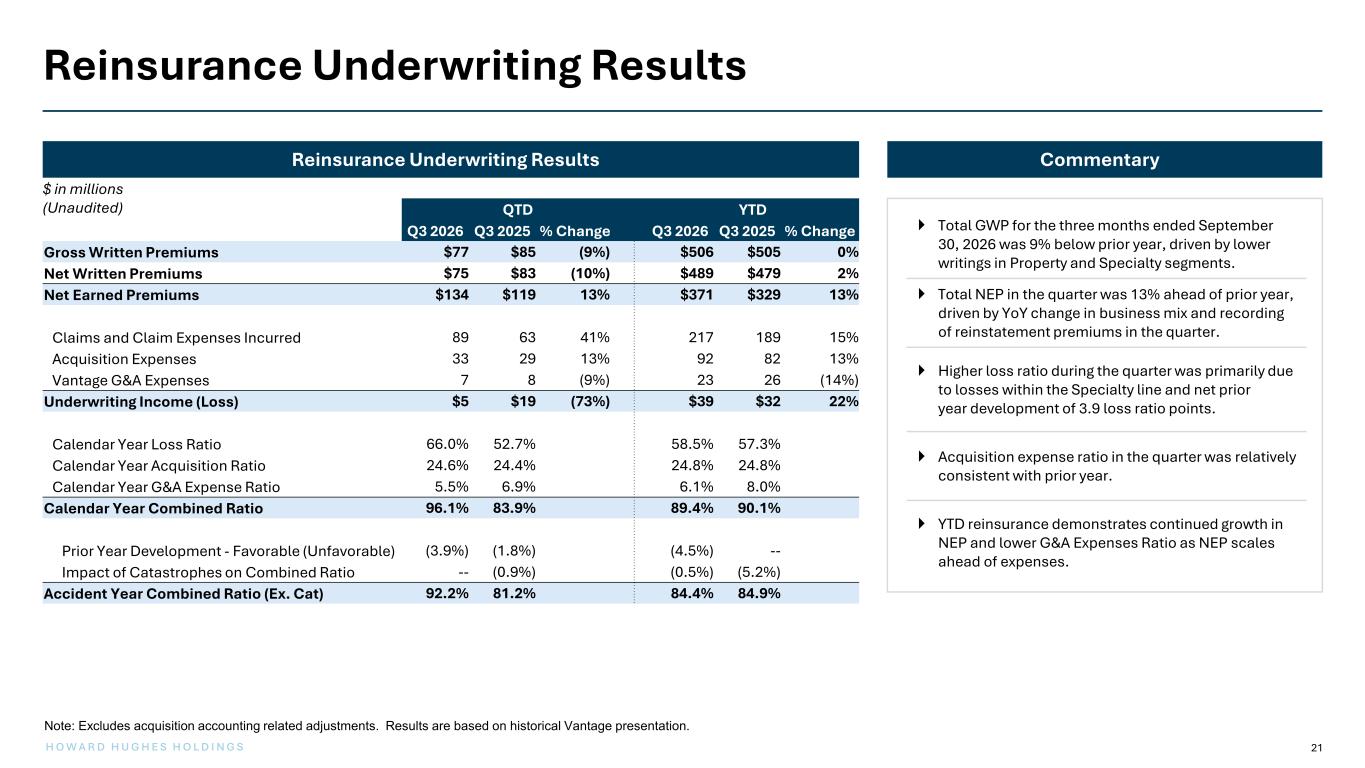
21 H O W A R D H U G H E S H O L D I N G S Reinsurance Underwriting Results $ in millions (Unaudited) Total GWP for the three months ended September 30, 2026 was 9% below prior year, driven by lower writings in Property and Specialty segments. Total NEP in the quarter was 13% ahead of prior year, driven by YoY change in business mix and recording of reinstatement premiums in the quarter. Higher loss ratio during the quarter was primarily due to losses within the Specialty line and net prior year development of 3.9 loss ratio points. Acquisition expense ratio in the quarter was relatively consistent with prior year. YTD reinsurance demonstrates continued growth in NEP and lower G&A Expenses Ratio as NEP scales ahead of expenses. QTD YTD Q3 2026 Q3 2025 % Change Q3 2026 Q3 2025 % Change Gross Written Premiums $77 $85 (9%) $506 $505 0% Net Written Premiums $75 $83 (10%) $489 $479 2% Net Earned Premiums $134 $119 13% $371 $329 13% Claims and Claim Expenses Incurred 89 63 41% 217 189 15% Acquisition Expenses 33 29 13% 92 82 13% Vantage G&A Expenses 7 8 (9%) 23 26 (14%) Underwriting Income (Loss) $5 $19 (73%) $39 $32 22% Calendar Year Loss Ratio 66.0% 52.7% 58.5% 57.3% Calendar Year Acquisition Ratio 24.6% 24.4% 24.8% 24.8% Calendar Year G&A Expense Ratio 5.5% 6.9% 6.1% 8.0% Calendar Year Combined Ratio 96.1% 83.9% 89.4% 90.1% Prior Year Development - Favorable (Unfavorable) (3.9%) (1.8%) (4.5%) -- Impact of Catastrophes on Combined Ratio -- (0.9%) (0.5%) (5.2%) Accident Year Combined Ratio (Ex. Cat) 92.2% 81.2% 84.4% 84.9% Note: Excludes acquisition accounting related adjustments. Results are based on historical Vantage presentation. CommentaryReinsurance Underwriting Results
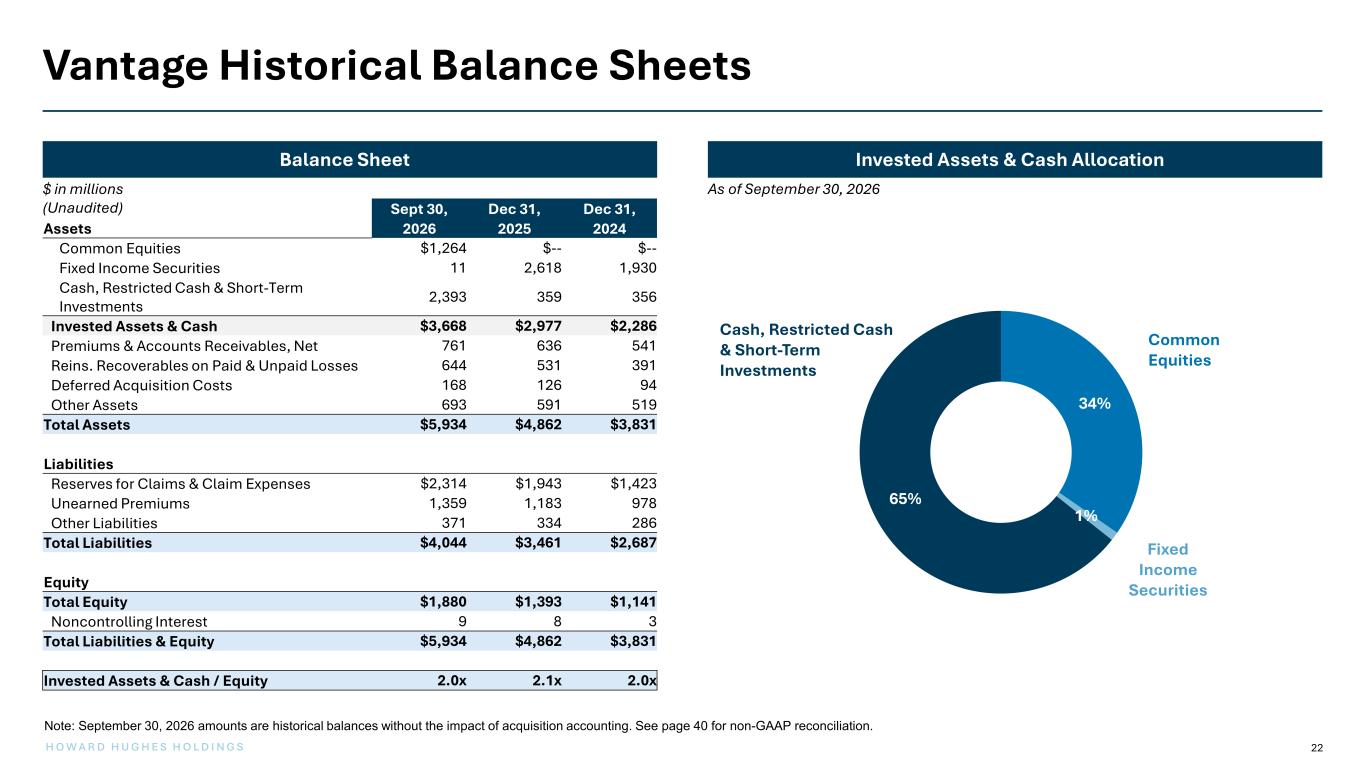
22 H O W A R D H U G H E S H O L D I N G S 34% 1% 65% Invested Assets & Cash AllocationBalance Sheet Vantage Historical Balance Sheets As of September 30, 2026 Fixed Income Securities Sept 30, Dec 31, Dec 31, Assets 2026 2025 2024 Common Equities $1,264 $-- $-- Fixed Income Securities 11 2,618 1,930 Cash, Restricted Cash & Short-Term Investments 2,393 359 356 Invested Assets & Cash $3,668 $2,977 $2,286 Premiums & Accounts Receivables, Net 761 636 541 Reins. Recoverables on Paid & Unpaid Losses 644 531 391 Deferred Acquisition Costs 168 126 94 Other Assets 693 591 519 Total Assets $5,934 $4,862 $3,831 Liabilities Reserves for Claims & Claim Expenses $2,314 $1,943 $1,423 Unearned Premiums 1,359 1,183 978 Other Liabilities 371 334 286 Total Liabilities $4,044 $3,461 $2,687 Equity Total Equity $1,880 $1,393 $1,141 Noncontrolling Interest 9 8 3 Total Liabilities & Equity $5,934 $4,862 $3,831 Invested Assets & Cash / Equity 2.0x 2.1x 2.0x Cash, Restricted Cash & Short-Term Investments Common Equities $ in millions (Unaudited) Note: September 30, 2026 amounts are historical balances without the impact of acquisition accounting. See page 40 for non-GAAP reconciliation.
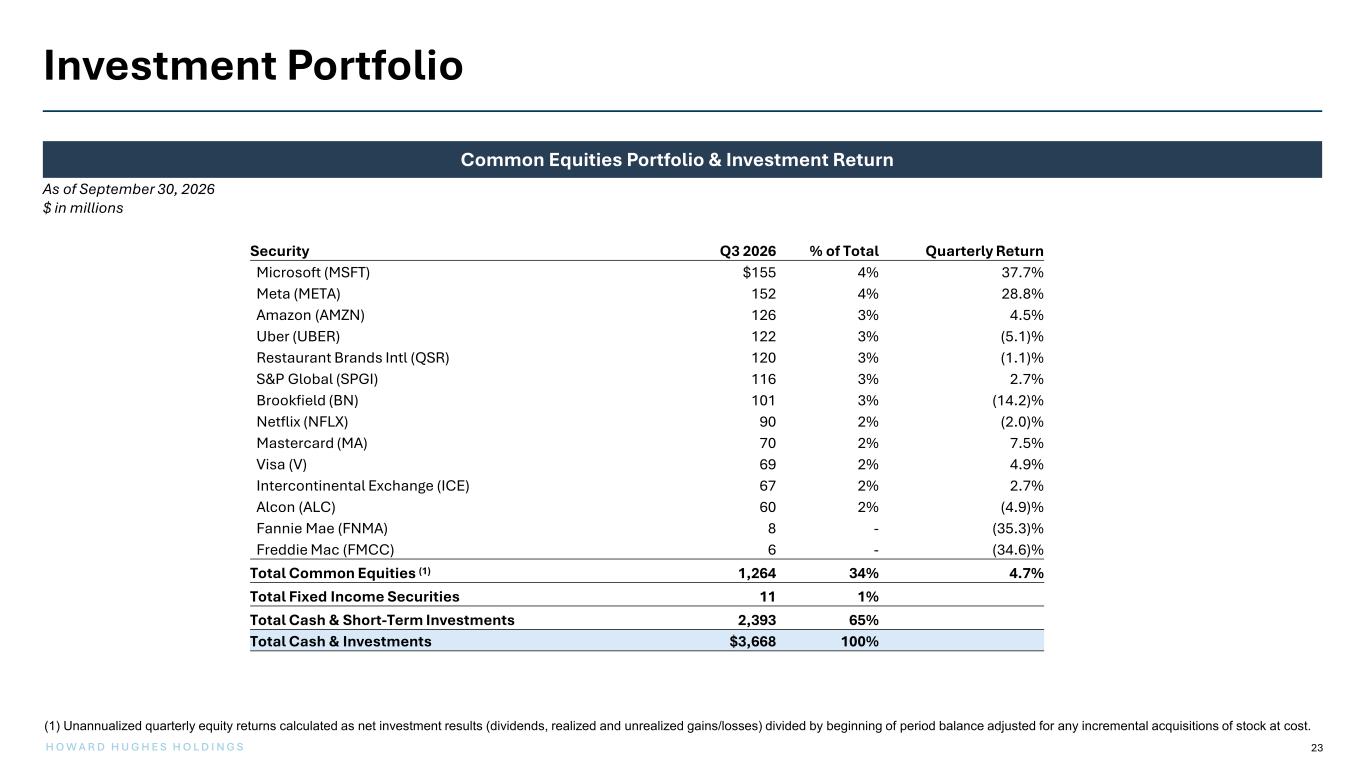
23 H O W A R D H U G H E S H O L D I N G S Investment Portfolio As of September 30, 2026 $ in millions Common Equities Portfolio & Investment Return Security Q3 2026 % of Total Quarterly Return Microsoft (MSFT) $155 4% 37.7% Meta (META) 152 4% 28.8% Amazon (AMZN) 126 3% 4.5% Uber (UBER) 122 3% (5.1)% Restaurant Brands Intl (QSR) 120 3% (1.1)% S&P Global (SPGI) 116 3% 2.7% Brookfield (BN) 101 3% (14.2)% Netflix (NFLX) 90 2% (2.0)% Mastercard (MA) 70 2% 7.5% Visa (V) 69 2% 4.9% Intercontinental Exchange (ICE) 67 2% 2.7% Alcon (ALC) 60 2% (4.9)% Fannie Mae (FNMA) 8 - (35.3)% Freddie Mac (FMCC) 6 - (34.6)% Total Common Equities (1) 1,264 34% 4.7% Total Fixed Income Securities 11 1% Total Cash & Short-Term Investments 2,393 65% Total Cash & Investments $3,668 100% (1) Unannualized quarterly equity returns calculated as net investment results (dividends, realized and unrealized gains/losses) divided by beginning of period balance adjusted for any incremental acquisitions of stock at cost.
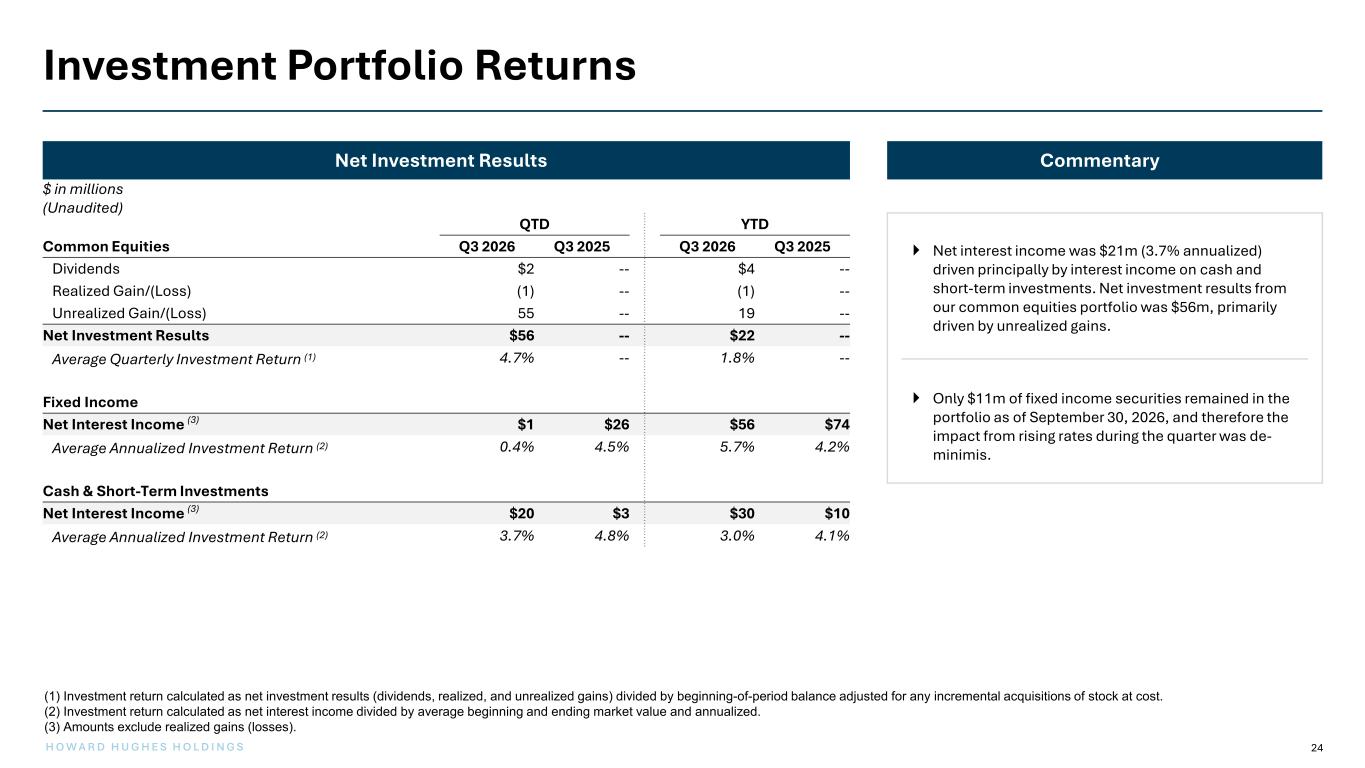
24 H O W A R D H U G H E S H O L D I N G S Investment Portfolio Returns $ in millions (Unaudited) Net Investment Results Commentary Net interest income was $21m (3.7% annualized) driven principally by interest income on cash and short-term investments. Net investment results from our common equities portfolio was $56m, primarily driven by unrealized gains. Only $11m of fixed income securities remained in the portfolio as of September 30, 2026, and therefore the impact from rising rates during the quarter was de- minimis. QTD YTD Common Equities Q3 2026 Q3 2025 Q3 2026 Q3 2025 Dividends $2 -- $4 -- Realized Gain/(Loss) (1) -- (1) -- Unrealized Gain/(Loss) 55 -- 19 -- Net Investment Results $56 -- $22 -- Average Quarterly Investment Return (1) 4.7% -- 1.8% -- Fixed Income Net Interest Income (3) $1 $26 $56 $74 Average Annualized Investment Return (2) 0.4% 4.5% 5.7% 4.2% Cash & Short-Term Investments Net Interest Income (3) $20 $3 $30 $10 Average Annualized Investment Return (2) 3.7% 4.8% 3.0% 4.1% (1) Investment return calculated as net investment results (dividends, realized, and unrealized gains) divided by beginning-of-period balance adjusted for any incremental acquisitions of stock at cost. (2) Investment return calculated as net interest income divided by average beginning and ending market value and annualized. (3) Amounts exclude realized gains (losses).
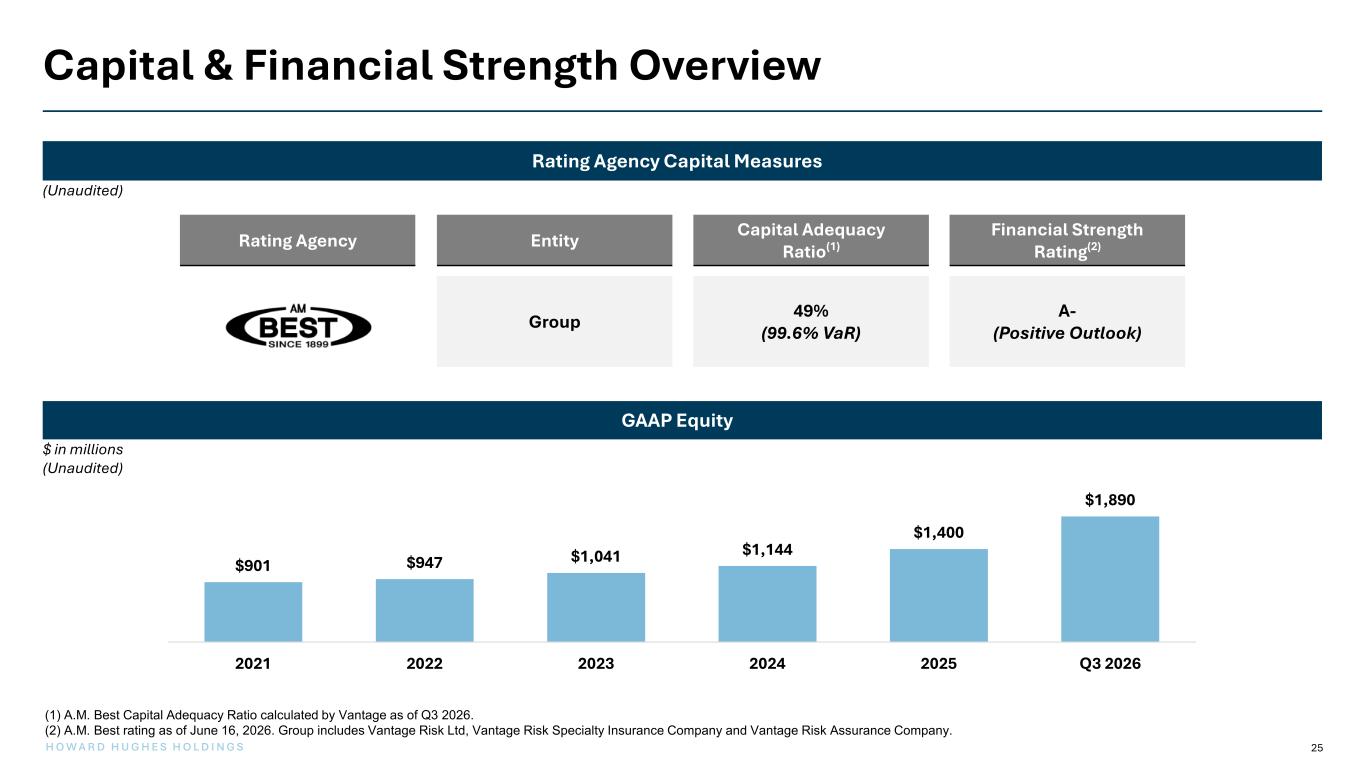
25 H O W A R D H U G H E S H O L D I N G S Rating Agency Entity Capital Adequacy Ratio(1) Financial Strength Rating(2) Group 49% (99.6% VaR) A- (Positive Outlook) Capital & Financial Strength Overview Rating Agency Capital Measures GAAP Equity (1) A.M. Best Capital Adequacy Ratio calculated by Vantage as of Q3 2026. (2) A.M. Best rating as of June 16, 2026. Group includes Vantage Risk Ltd, Vantage Risk Specialty Insurance Company and Vantage Risk Assurance Company. $901 $947 $1,041 $1,144 $1,400 $1,890 2021 2022 2023 2024 2025 Q3 2026 (Unaudited) $ in millions (Unaudited)
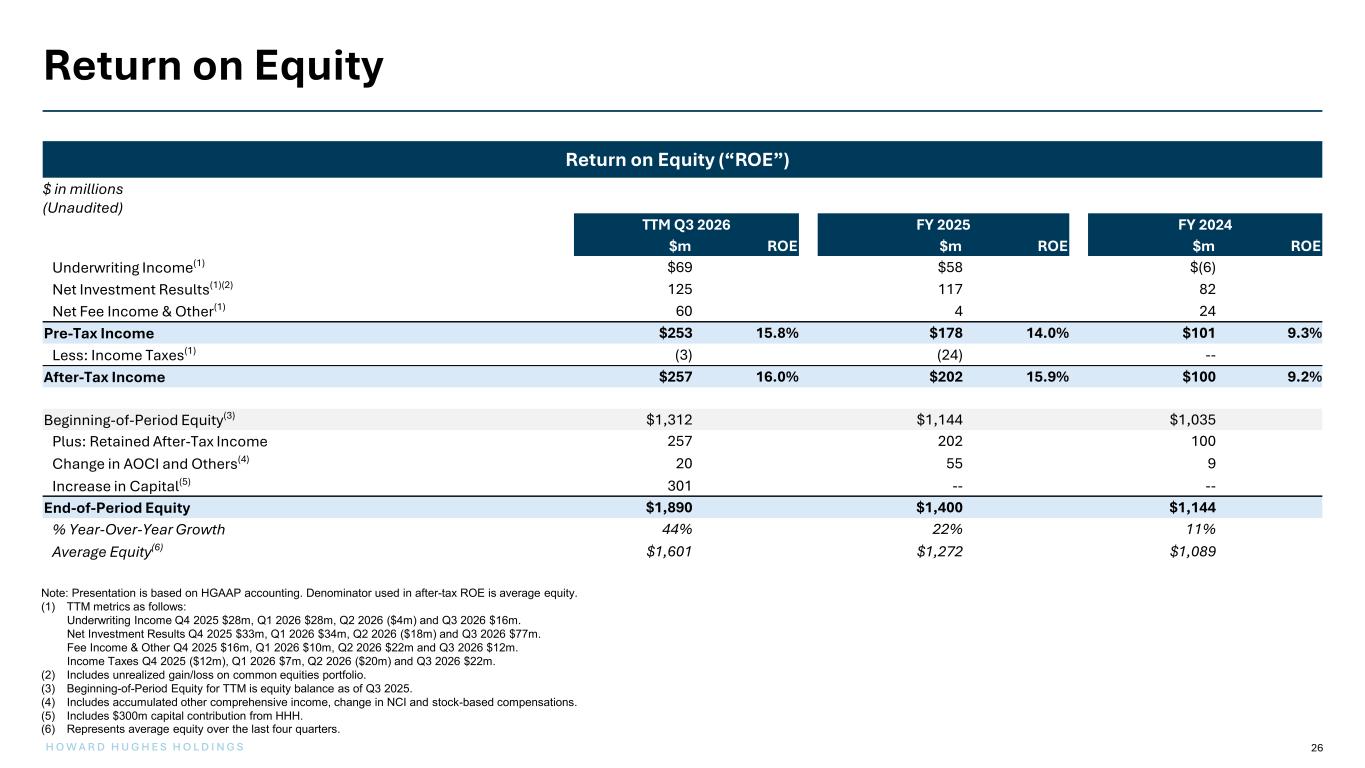
26 H O W A R D H U G H E S H O L D I N G S Return on Equity (“ROE”) Return on Equity Note: Presentation is based on HGAAP accounting. Denominator used in after-tax ROE is average equity. (1) TTM metrics as follows: Underwriting Income Q4 2025 $28m, Q1 2026 $28m, Q2 2026 ($4m) and Q3 2026 $16m. Net Investment Results Q4 2025 $33m, Q1 2026 $34m, Q2 2026 ($18m) and Q3 2026 $77m. Fee Income & Other Q4 2025 $16m, Q1 2026 $10m, Q2 2026 $22m and Q3 2026 $12m. Income Taxes Q4 2025 ($12m), Q1 2026 $7m, Q2 2026 ($20m) and Q3 2026 $22m. (2) Includes unrealized gain/loss on common equities portfolio. (3) Beginning-of-Period Equity for TTM is equity balance as of Q3 2025. (4) Includes accumulated other comprehensive income, change in NCI and stock-based compensations. (5) Includes $300m capital contribution from HHH. (6) Represents average equity over the last four quarters. $ in millions (Unaudited) TTM Q3 2026 FY 2025 FY 2024 $m ROE $m ROE $m ROE Underwriting Income(1) $69 $58 $(6) Net Investment Results(1)(2) 125 117 82 Net Fee Income & Other(1) 60 4 24 Pre-Tax Income $253 15.8% $178 14.0% $101 9.3% Less: Income Taxes(1) (3) (24) -- After-Tax Income $257 16.0% $202 15.9% $100 9.2% Beginning-of-Period Equity(3) $1,312 $1,144 $1,035 Plus: Retained After-Tax Income 257 202 100 Change in AOCI and Others(4) 20 55 9 Increase in Capital(5) 301 -- -- End-of-Period Equity $1,890 $1,400 $1,144 % Year-Over-Year Growth 44% 22% 11% Average Equity(6) $1,601 $1,272 $1,089

Appendix
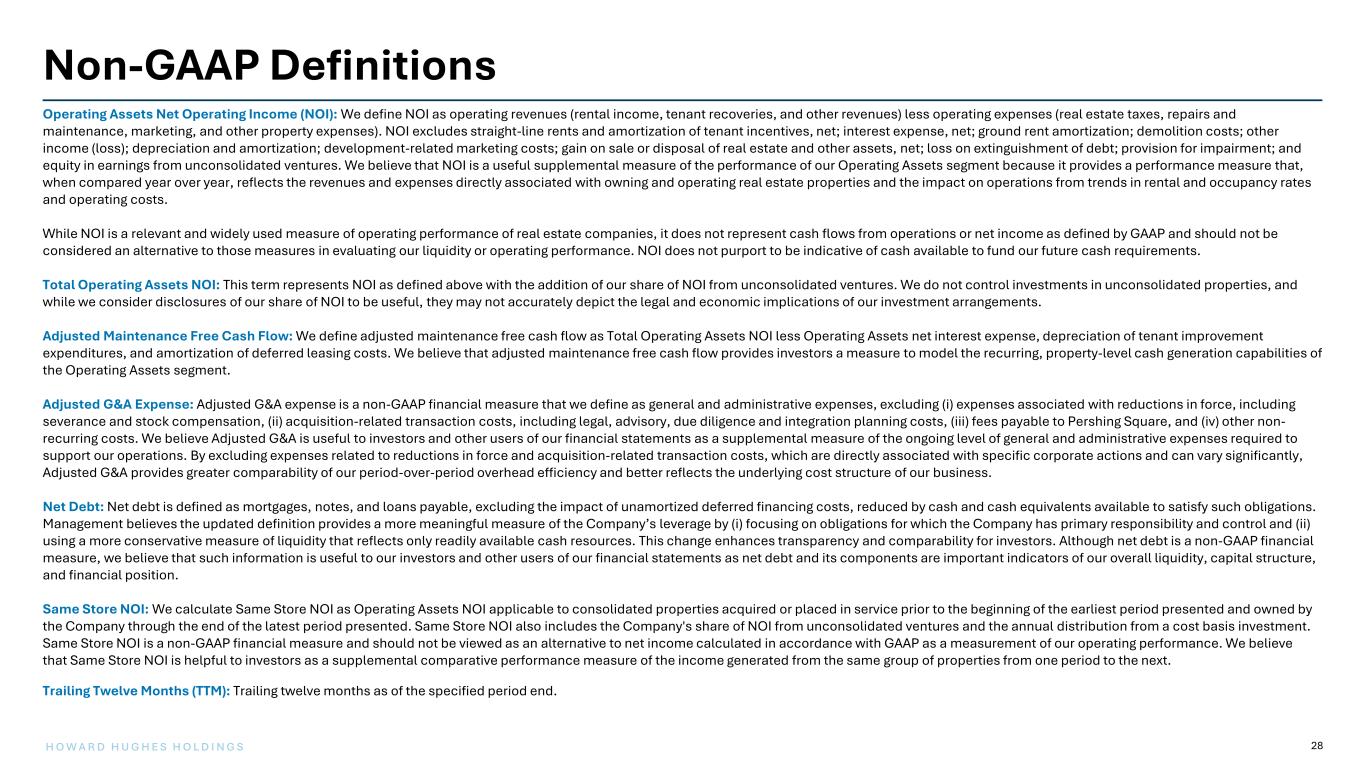
28H O W A R D H U G H E S H O L D I N G S Operating Assets Net Operating Income (NOI): We define NOI as operating revenues (rental income, tenant recoveries, and other revenues) less operating expenses (real estate taxes, repairs and maintenance, marketing, and other property expenses). NOI excludes straight-line rents and amortization of tenant incentives, net; interest expense, net; ground rent amortization; demolition costs; other income (loss); depreciation and amortization; development-related marketing costs; gain on sale or disposal of real estate and other assets, net; loss on extinguishment of debt; provision for impairment; and equity in earnings from unconsolidated ventures. We believe that NOI is a useful supplemental measure of the performance of our Operating Assets segment because it provides a performance measure that, when compared year over year, reflects the revenues and expenses directly associated with owning and operating real estate properties and the impact on operations from trends in rental and occupancy rates and operating costs. While NOI is a relevant and widely used measure of operating performance of real estate companies, it does not represent cash flows from operations or net income as defined by GAAP and should not be considered an alternative to those measures in evaluating our liquidity or operating performance. NOI does not purport to be indicative of cash available to fund our future cash requirements. Total Operating Assets NOI: This term represents NOI as defined above with the addition of our share of NOI from unconsolidated ventures. We do not control investments in unconsolidated properties, and while we consider disclosures of our share of NOI to be useful, they may not accurately depict the legal and economic implications of our investment arrangements. Adjusted Maintenance Free Cash Flow: We define adjusted maintenance free cash flow as Total Operating Assets NOI less Operating Assets net interest expense, depreciation of tenant improvement expenditures, and amortization of deferred leasing costs. We believe that adjusted maintenance free cash flow provides investors a measure to model the recurring, property-level cash generation capabilities of the Operating Assets segment. Adjusted G&A Expense: Adjusted G&A expense is a non-GAAP financial measure that we define as general and administrative expenses, excluding (i) expenses associated with reductions in force, including severance and stock compensation, (ii) acquisition-related transaction costs, including legal, advisory, due diligence and integration planning costs, (iii) fees payable to Pershing Square, and (iv) other non- recurring costs. We believe Adjusted G&A is useful to investors and other users of our financial statements as a supplemental measure of the ongoing level of general and administrative expenses required to support our operations. By excluding expenses related to reductions in force and acquisition-related transaction costs, which are directly associated with specific corporate actions and can vary significantly, Adjusted G&A provides greater comparability of our period-over-period overhead efficiency and better reflects the underlying cost structure of our business. Net Debt: Net debt is defined as mortgages, notes, and loans payable, excluding the impact of unamortized deferred financing costs, reduced by cash and cash equivalents available to satisfy such obligations. Management believes the updated definition provides a more meaningful measure of the Company’s leverage by (i) focusing on obligations for which the Company has primary responsibility and control and (ii) using a more conservative measure of liquidity that reflects only readily available cash resources. This change enhances transparency and comparability for investors. Although net debt is a non-GAAP financial measure, we believe that such information is useful to our investors and other users of our financial statements as net debt and its components are important indicators of our overall liquidity, capital structure, and financial position. Same Store NOI: We calculate Same Store NOI as Operating Assets NOI applicable to consolidated properties acquired or placed in service prior to the beginning of the earliest period presented and owned by the Company through the end of the latest period presented. Same Store NOI also includes the Company's share of NOI from unconsolidated ventures and the annual distribution from a cost basis investment. Same Store NOI is a non-GAAP financial measure and should not be viewed as an alternative to net income calculated in accordance with GAAP as a measurement of our operating performance. We believe that Same Store NOI is helpful to investors as a supplemental comparative performance measure of the income generated from the same group of properties from one period to the next. Trailing Twelve Months (TTM): Trailing twelve months as of the specified period end. Non-GAAP Definitions
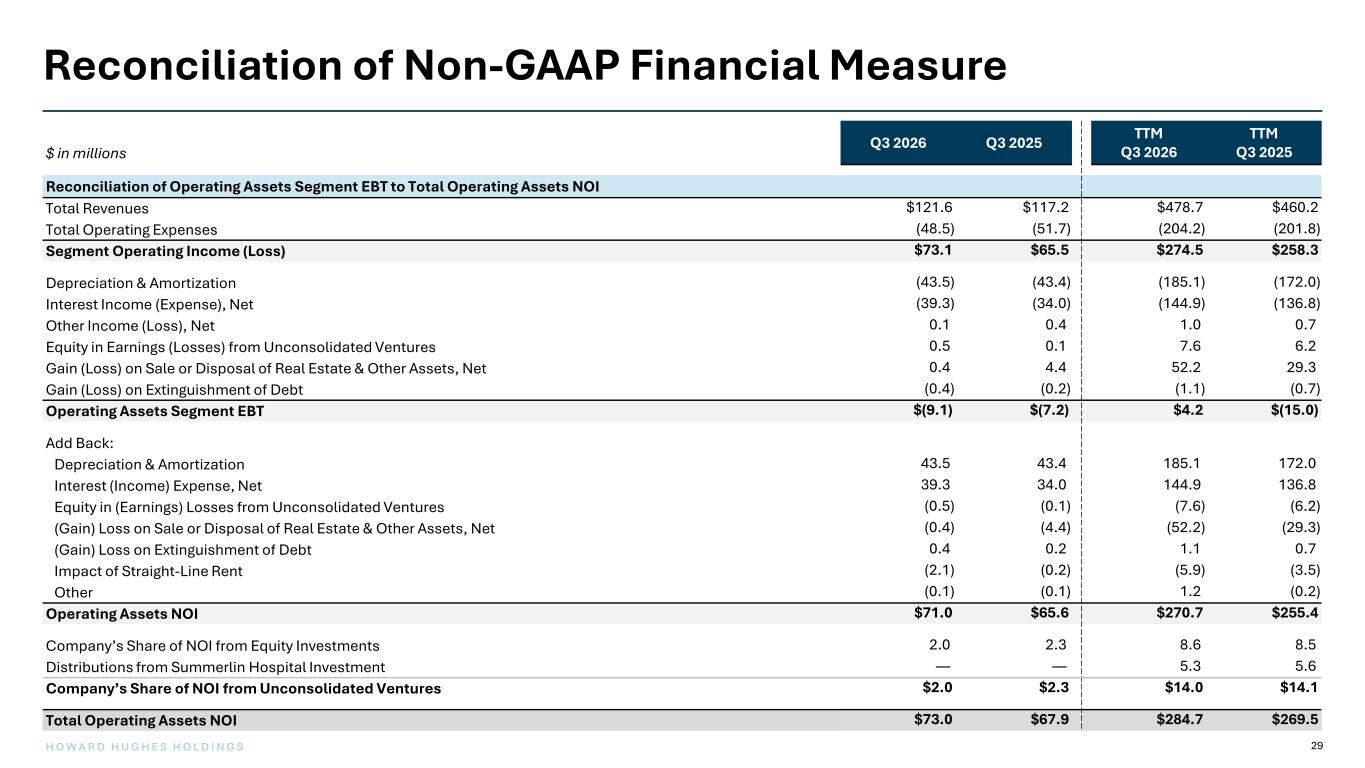
29H O W A R D H U G H E S H O L D I N G S Reconciliation of Non-GAAP Financial Measure $ in millions Q3 2026 Q3 2025 TTM Q3 2026 TTM Q3 2025 Reconciliation of Operating Assets Segment EBT to Total Operating Assets NOI Total Revenues $121.6 $117.2 $478.7 $460.2 Total Operating Expenses (48.5) (51.7) (204.2) (201.8) Segment Operating Income (Loss) $73.1 $65.5 $274.5 $258.3 Depreciation & Amortization (43.5) (43.4) (185.1) (172.0) Interest Income (Expense), Net (39.3) (34.0) (144.9) (136.8) Other Income (Loss), Net 0.1 0.4 1.0 0.7 Equity in Earnings (Losses) from Unconsolidated Ventures 0.5 0.1 7.6 6.2 Gain (Loss) on Sale or Disposal of Real Estate & Other Assets, Net 0.4 4.4 52.2 29.3 Gain (Loss) on Extinguishment of Debt (0.4) (0.2) (1.1) (0.7) Operating Assets Segment EBT $(9.1) $(7.2) $4.2 $(15.0) Add Back: Depreciation & Amortization 43.5 43.4 185.1 172.0 Interest (Income) Expense, Net 39.3 34.0 144.9 136.8 Equity in (Earnings) Losses from Unconsolidated Ventures (0.5) (0.1) (7.6) (6.2) (Gain) Loss on Sale or Disposal of Real Estate & Other Assets, Net (0.4) (4.4) (52.2) (29.3) (Gain) Loss on Extinguishment of Debt 0.4 0.2 1.1 0.7 Impact of Straight-Line Rent (2.1) (0.2) (5.9) (3.5) Other (0.1) (0.1) 1.2 (0.2) Operating Assets NOI $71.0 $65.6 $270.7 $255.4 Company’s Share of NOI from Equity Investments 2.0 2.3 8.6 8.5 Distributions from Summerlin Hospital Investment — — 5.3 5.6 Company’s Share of NOI from Unconsolidated Ventures $2.0 $2.3 $14.0 $14.1 Total Operating Assets NOI $73.0 $67.9 $284.7 $269.5
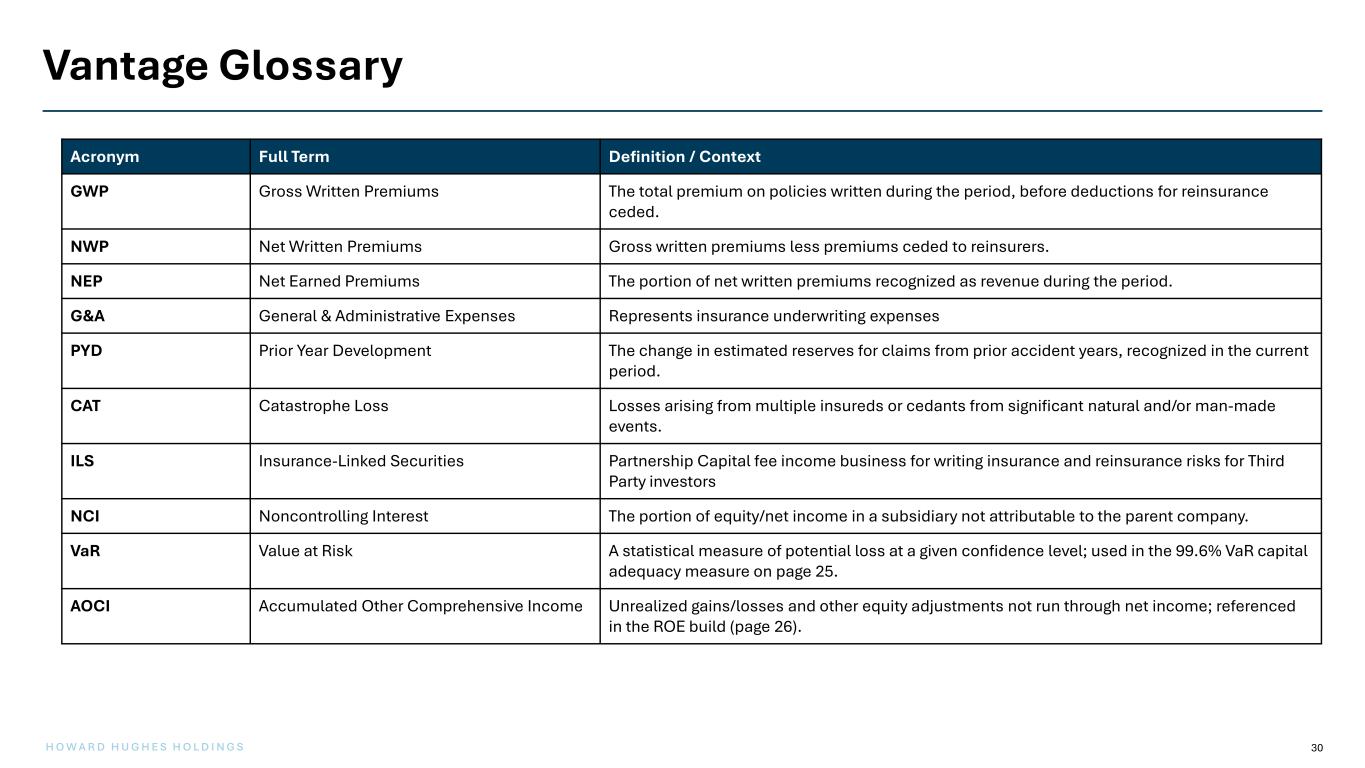
30 H O W A R D H U G H E S H O L D I N G S Vantage Glossary Acronym Full Term Definition / Context GWP Gross Written Premiums The total premium on policies written during the period, before deductions for reinsurance ceded. NWP Net Written Premiums Gross written premiums less premiums ceded to reinsurers. NEP Net Earned Premiums The portion of net written premiums recognized as revenue during the period. G&A General & Administrative Expenses Represents insurance underwriting expenses PYD Prior Year Development The change in estimated reserves for claims from prior accident years, recognized in the current period. CAT Catastrophe Loss Losses arising from multiple insureds or cedants from significant natural and/or man-made events. ILS Insurance-Linked Securities Partnership Capital fee income business for writing insurance and reinsurance risks for Third Party investors NCI Noncontrolling Interest The portion of equity/net income in a subsidiary not attributable to the parent company. VaR Value at Risk A statistical measure of potential loss at a given confidence level; used in the 99.6% VaR capital adequacy measure on page 25. AOCI Accumulated Other Comprehensive Income Unrealized gains/losses and other equity adjustments not run through net income; referenced in the ROE build (page 26).
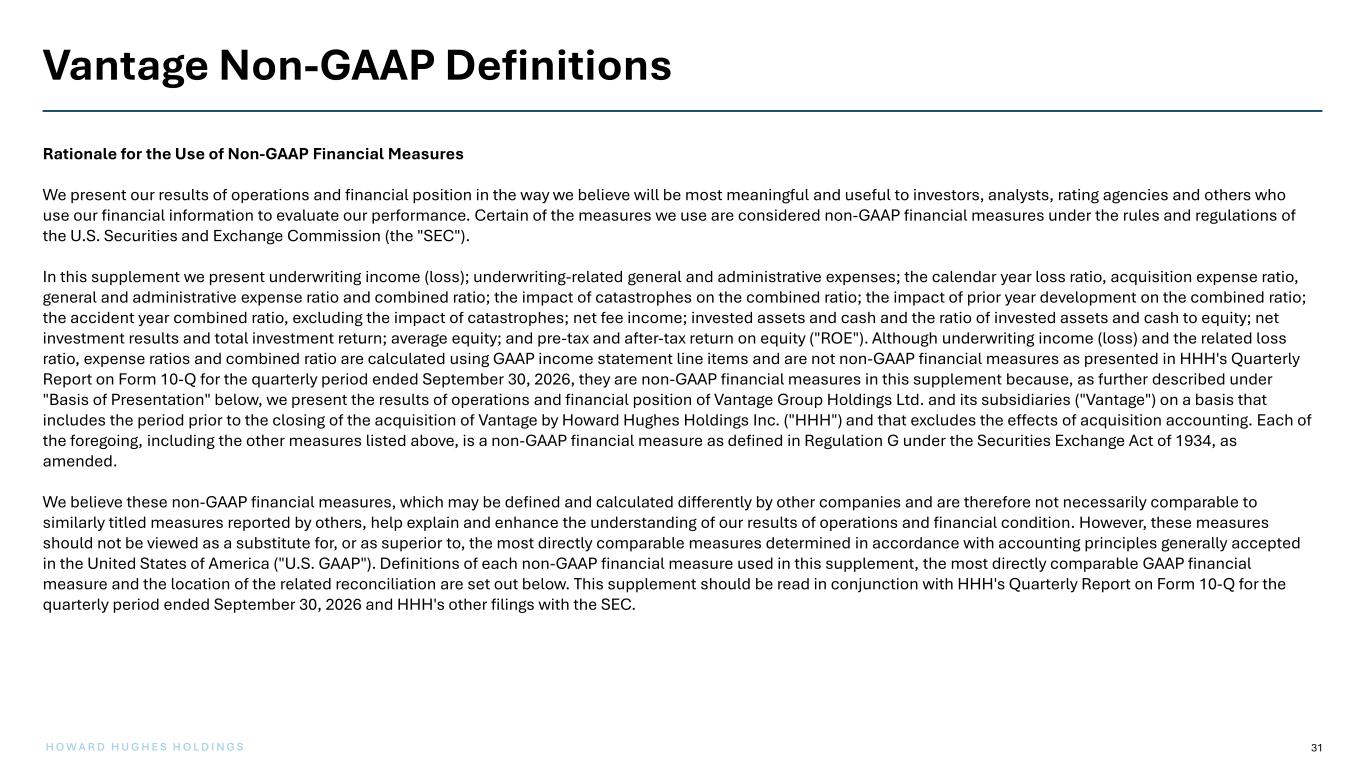
31 H O W A R D H U G H E S H O L D I N G S Vantage Non-GAAP Definitions Rationale for the Use of Non-GAAP Financial Measures We present our results of operations and financial position in the way we believe will be most meaningful and useful to investors, analysts, rating agencies and others who use our financial information to evaluate our performance. Certain of the measures we use are considered non-GAAP financial measures under the rules and regulations of the U.S. Securities and Exchange Commission (the "SEC"). In this supplement we present underwriting income (loss); underwriting-related general and administrative expenses; the calendar year loss ratio, acquisition expense ratio, general and administrative expense ratio and combined ratio; the impact of catastrophes on the combined ratio; the impact of prior year development on the combined ratio; the accident year combined ratio, excluding the impact of catastrophes; net fee income; invested assets and cash and the ratio of invested assets and cash to equity; net investment results and total investment return; average equity; and pre-tax and after-tax return on equity ("ROE"). Although underwriting income (loss) and the related loss ratio, expense ratios and combined ratio are calculated using GAAP income statement line items and are not non-GAAP financial measures as presented in HHH's Quarterly Report on Form 10-Q for the quarterly period ended September 30, 2026, they are non-GAAP financial measures in this supplement because, as further described under "Basis of Presentation" below, we present the results of operations and financial position of Vantage Group Holdings Ltd. and its subsidiaries ("Vantage") on a basis that includes the period prior to the closing of the acquisition of Vantage by Howard Hughes Holdings Inc. ("HHH") and that excludes the effects of acquisition accounting. Each of the foregoing, including the other measures listed above, is a non-GAAP financial measure as defined in Regulation G under the Securities Exchange Act of 1934, as amended. We believe these non-GAAP financial measures, which may be defined and calculated differently by other companies and are therefore not necessarily comparable to similarly titled measures reported by others, help explain and enhance the understanding of our results of operations and financial condition. However, these measures should not be viewed as a substitute for, or as superior to, the most directly comparable measures determined in accordance with accounting principles generally accepted in the United States of America ("U.S. GAAP"). Definitions of each non-GAAP financial measure used in this supplement, the most directly comparable GAAP financial measure and the location of the related reconciliation are set out below. This supplement should be read in conjunction with HHH's Quarterly Report on Form 10-Q for the quarterly period ended September 30, 2026 and HHH's other filings with the SEC.
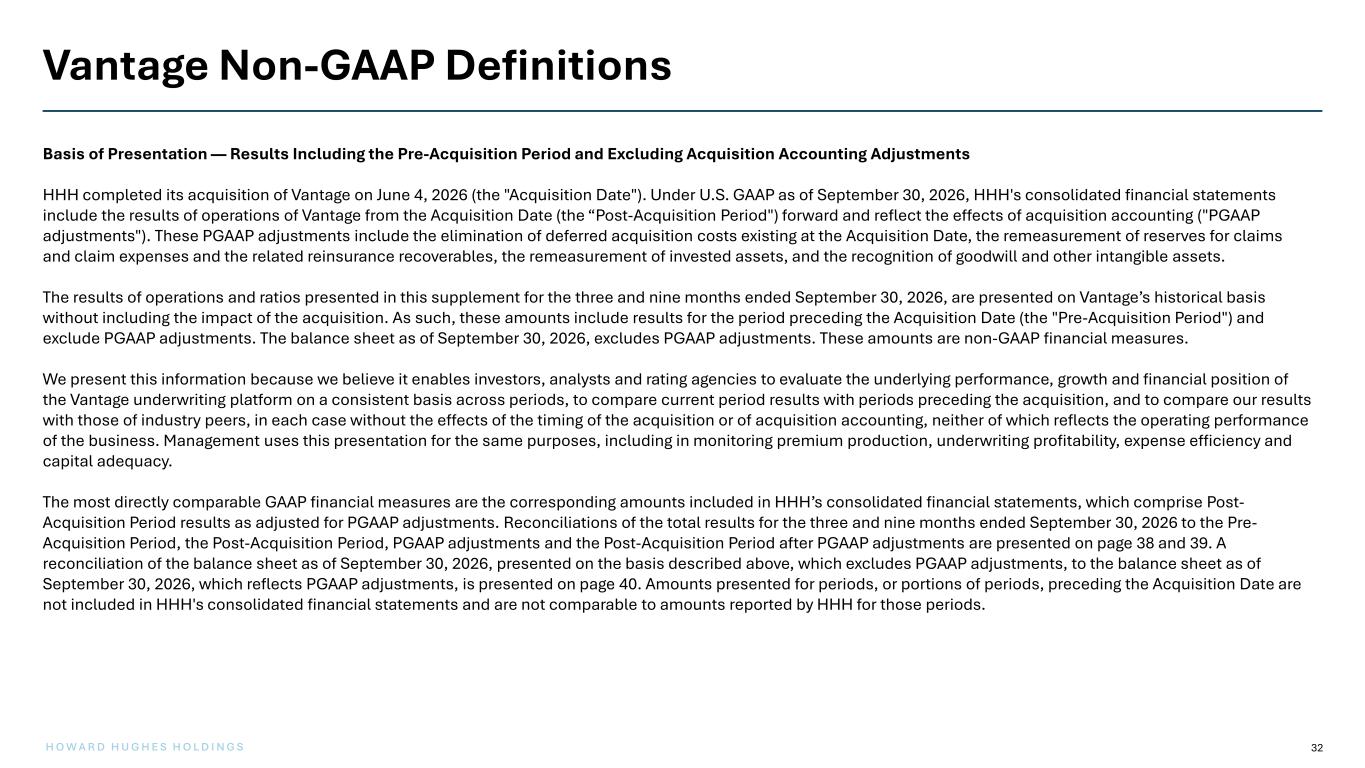
32 H O W A R D H U G H E S H O L D I N G S Vantage Non-GAAP Definitions Basis of Presentation — Results Including the Pre-Acquisition Period and Excluding Acquisition Accounting Adjustments HHH completed its acquisition of Vantage on June 4, 2026 (the "Acquisition Date"). Under U.S. GAAP as of September 30, 2026, HHH's consolidated financial statements include the results of operations of Vantage from the Acquisition Date (the “Post-Acquisition Period") forward and reflect the effects of acquisition accounting ("PGAAP adjustments"). These PGAAP adjustments include the elimination of deferred acquisition costs existing at the Acquisition Date, the remeasurement of reserves for claims and claim expenses and the related reinsurance recoverables, the remeasurement of invested assets, and the recognition of goodwill and other intangible assets. The results of operations and ratios presented in this supplement for the three and nine months ended September 30, 2026, are presented on Vantage’s historical basis without including the impact of the acquisition. As such, these amounts include results for the period preceding the Acquisition Date (the "Pre-Acquisition Period") and exclude PGAAP adjustments. The balance sheet as of September 30, 2026, excludes PGAAP adjustments. These amounts are non-GAAP financial measures. We present this information because we believe it enables investors, analysts and rating agencies to evaluate the underlying performance, growth and financial position of the Vantage underwriting platform on a consistent basis across periods, to compare current period results with periods preceding the acquisition, and to compare our results with those of industry peers, in each case without the effects of the timing of the acquisition or of acquisition accounting, neither of which reflects the operating performance of the business. Management uses this presentation for the same purposes, including in monitoring premium production, underwriting profitability, expense efficiency and capital adequacy. The most directly comparable GAAP financial measures are the corresponding amounts included in HHH’s consolidated financial statements, which comprise Post- Acquisition Period results as adjusted for PGAAP adjustments. Reconciliations of the total results for the three and nine months ended September 30, 2026 to the Pre- Acquisition Period, the Post-Acquisition Period, PGAAP adjustments and the Post-Acquisition Period after PGAAP adjustments are presented on page 38 and 39. A reconciliation of the balance sheet as of September 30, 2026, presented on the basis described above, which excludes PGAAP adjustments, to the balance sheet as of September 30, 2026, which reflects PGAAP adjustments, is presented on page 40. Amounts presented for periods, or portions of periods, preceding the Acquisition Date are not included in HHH's consolidated financial statements and are not comparable to amounts reported by HHH for those periods.
33 H O W A R D H U G H E S H O L D I N G S Vantage Non-GAAP Definitions Underwriting Income (Loss) and Underwriting-Related General and Administrative Expenses Underwriting income (loss) is a pre-tax measure of underwriting profitability that takes into account net earned premiums as revenue, and claims and claim expenses incurred, acquisition expenses and general and administrative expenses as expenses. In the HHH Form-10Q acquisition expenses and general and administrative expenses are reported as Insurance Underwriting Expenses. We evaluate our underwriting results separately from the performance of our investment portfolio, our fee-generating activities and corporate-level items. Although the investment of premiums to generate investment income and investment gains and losses is an integral part of our operations, the determination to realize investment gains and losses is independent of the underwriting process and is heavily influenced by the availability of market opportunities. Accordingly, net investment income, investment gains and losses, net fee income, corporate expenses, interest expense, foreign exchange gains and losses, amortization of intangible assets and income taxes are excluded from underwriting income (loss). We believe the presentation of underwriting income (loss) provides investors with an enhanced understanding of our results of operations by highlighting the underlying pre- tax profitability of our underwriting activities. The most directly comparable GAAP financial measure is income (loss) before income taxes. Reconciliations of underwriting income (loss) to income (loss) before income taxes are presented on pages 17, 18, 20, 21, 26, 38 and 39. Calendar Year Loss, Acquisition Expense, General and Administrative Expense and Combined Ratios The calendar year loss ratio, calendar year acquisition expense ratio and calendar year general and administrative expense ratio represent, respectively, claims and claim expenses incurred, acquisition expenses and underwriting-related general and administrative expenses recognized in the period, in each case expressed as a percentage of net earned premiums for the period. The calendar year combined ratio is the sum of these three ratios. A combined ratio of less than 100% indicates an underwriting profit and a combined ratio of greater than 100% indicates an underwriting loss. Because these ratios are calculated using underwriting-related general and administrative expenses rather than total general and administrative expenses, and because they are presented on the basis described under "Basis of Presentation" above, they are non-GAAP financial measures when presented on a consolidated basis. The components of each ratio are reconciled to the corresponding GAAP amounts on pages 17, 18, 20, 21, 38 and 39.
34 H O W A R D H U G H E S H O L D I N G S Vantage Non-GAAP Definitions Impact of Catastrophes on the Combined Ratio The impact of catastrophes on the combined ratio represents claims and claim expenses incurred in the current accident year in respect of natural catastrophes, man-made disasters and other significant events designated as catastrophes by management, net of reinsurance and net of related reinstatement premiums, expressed as a percentage of net earned premiums for the period. Impact from catastrophes exclude any net favorable or unfavorable development of catastrophe losses relating to prior accident years, which is included within prior year development. We believe that separately identifying claims and claim expenses associated with catastrophe events provides investors with an enhanced understanding of our results of operations, given the inherently unpredictable frequency and severity of these events, the potential magnitude of the associated losses and the complexity involved in estimating ultimate losses arising from them. The most directly comparable GAAP financial measure is the combined ratio. Prior Year Development — Favorable (Unfavorable) Prior year development represents the net favorable or unfavorable change recognized in the current period in our estimate of ultimate claims and claim expenses for accident years preceding the current accident year, together with the related impact on acquisition expenses, expressed as a percentage of net earned premiums for the period. Favorable development is presented as a positive amount and unfavorable (adverse) development is presented as a negative amount. We believe that separately identifying prior year development provides investors with an enhanced understanding of our results of operations by distinguishing changes in estimates relating to business written in earlier periods from the performance of business written in the current period. The most directly comparable GAAP financial measure is the combined ratio.
35 H O W A R D H U G H E S H O L D I N G S Vantage Non-GAAP Definitions Accident Year Combined Ratio, Excluding Impact from Catastrophes The accident year combined ratio, excluding impact from catastrophes, is the calendar year combined ratio adjusted to exclude (i) claims and claim expenses incurred in the current accident year in respect of natural catastrophes, man-made disasters and other significant events designated as catastrophes by management, net of reinsurance and net of related reinstatement premiums, and (ii) net favorable or unfavorable development in prior year loss reserves and related adjustments expressed as a percentage of net earned premiums for the period. We believe this ratio provides investors with an enhanced understanding of the underlying performance of the business written in the current period. Catastrophe activity is inherently unpredictable, and prior year development relates to business written in earlier periods; neither is indicative of current period pricing, underwriting or reserving decisions. Management uses this ratio in its analysis of the underwriting performance of the Group and of each of its underwriting segments. The most directly comparable GAAP financial measure is the combined ratio. Reconciliations of the accident year combined ratio, excluding catastrophe losses, to the combined ratio are presented on pages 17, 18, 20, 21, 38 and 39. Net Fee Income Net fee income represents management fees and variable, performance-based fee income earned in respect of insurance and reinsurance risks written on behalf of third- party investors through our insurance-linked securities ("ILS") and partnership capital vehicles, less expenses that are incremental to, and/or directly attributable to, the generation of that income. Variable fee income is recognized by reference to the performance of the relevant underwriting years and may vary significantly between periods. Net fee income excludes net investment income, investment gains and losses, and income taxes. We believe the presentation of net fee income provides investors with an enhanced understanding of the profitability of our fee-generating activities, which we manage and evaluate separately from our underwriting operations and our investment portfolio. The most directly comparable GAAP financial measure is income (loss) before income taxes. A reconciliation of net fee income to income (loss) before income taxes is presented on pages 17, 18, 38 and 39.
36 H O W A R D H U G H E S H O L D I N G S Vantage Non-GAAP Definitions Invested Assets and Cash; Invested Assets and Cash to Equity Invested assets and cash represents the sum of common equity securities, fixed income securities, cash, restricted cash and short-term investments (including U.S. Treasury securities with remaining maturities of three months or less), in each case as of the balance sheet date. Invested assets and cash to equity represents invested assets and cash divided by total equity as of the same date. We present these measures because we believe they are useful to investors, analysts and rating agencies in assessing the scale of our investment portfolio relative to our capital base and the resulting investment leverage. The most directly comparable GAAP financial measure to invested assets and cash is the sum of total investments and cash and cash equivalents as presented in the consolidated balance sheet. A reconciliation is presented on pages 22 and 40. Net Investment Results and Total Investment Return Net investment results represents net investment income together with realized and unrealized gains and losses generated by our investment portfolio, including dividend income on common equity securities, in each case calculated on a pre-tax basis and before investment expenses. Investment return on the common equity portfolio is calculated as net investment results for the period (comprising dividends and realized and unrealized gains and losses) divided by the beginning-of-period portfolio balance, adjusted for any incremental acquisitions of common equity securities at cost, and is presented for the quarterly period. Investment return on the fixed income and short-term portfolio is calculated as net interest income divided by the average of the beginning-of-period and end-of-period market value and is presented on an annualized basis. Management uses net investment results and investment return as key measures of the performance generated by our investment portfolio and compares these returns against benchmark returns for the periods presented. Because these measures include unrealized gains and losses, are calculated before investment expenses and income taxes, and use denominators that are not presented in the consolidated financial statements, they are non-GAAP financial measures. The most directly comparable GAAP financial measure to net investment results is net investment income. A reconciliation is presented on page 24.
37 H O W A R D H U G H E S H O L D I N G S Vantage Non-GAAP Definitions Average Equity; Pre-Tax and After-Tax Return on Equity Average equity value represents the average of total equity as of the end of each of the four most recent quarterly periods. Pre-tax return on equity represents income (loss) before income taxes for the period divided by average equity. After-tax return on equity represents net income (loss) for the period divided by average equity. Amounts presented for the trailing twelve months ("TTM") ended September 30, 2026 comprise the sum of the four most recent quarterly periods and, accordingly, do not correspond to a period for which financial statements are presented under U.S. GAAP. We present return on equity because we believe it is a useful measure, widely used by investors, analysts and rating agencies, of the return generated on the capital deployed in our business, and because management uses it to evaluate performance over time and relative to industry peers. Because average equity is calculated on a four-quarter average basis rather than as a simple average of beginning-of-period and end-of-period equity, because the TTM period is not a GAAP reporting period, and because the underlying income amounts are presented on the basis described under "Basis of Presentation" above, average equity and return on equity are non-GAAP financial measures. The most directly comparable GAAP financial measures are net income (loss) and total equity. A reconciliation of the components of return on equity, including a roll forward of beginning-of-period equity to end-of-period equity, is presented on page 26. Measures That Are Not Non-GAAP Financial Measures Gross written premiums and net written premiums are operating measures commonly used in the insurance and reinsurance industry and are not presented in the consolidated statements of operations, in which net earned premiums is the corresponding revenue measure determined in accordance with U.S. GAAP. Gross written premiums represents the total premium on policies and contracts written during the period before deduction of premiums ceded to reinsurers; net written premiums represents gross written premiums less premiums ceded to reinsurers. The capital adequacy ratio presented on page 25 is an estimated rating agency capital measure calculated in accordance with the relevant rating agency's proprietary methodology. It is not a financial measure derived from our financial statements and is not a non-GAAP financial measure. Financial strength ratings are opinions of the applicable rating agency, are subject to change or withdrawal at any time and are not recommendations to buy, sell or hold any security.
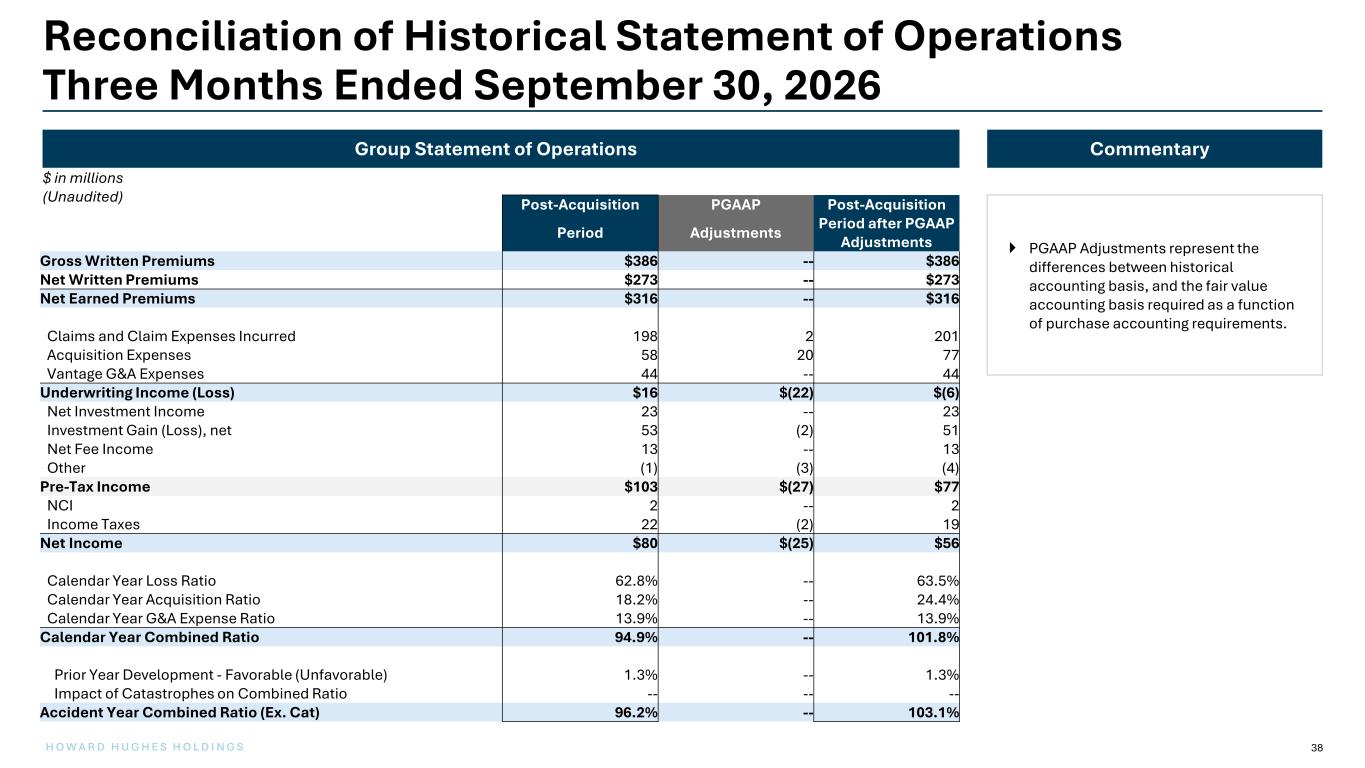
38 H O W A R D H U G H E S H O L D I N G S Post-Acquisition PGAAP Post-Acquisition Period after PGAAP AdjustmentsPeriod Adjustments Gross Written Premiums $386 -- $386 Net Written Premiums $273 -- $273 Net Earned Premiums $316 -- $316 Claims and Claim Expenses Incurred 198 2 201 Acquisition Expenses 58 20 77 Vantage G&A Expenses 44 -- 44 Underwriting Income (Loss) $16 $(22) $(6) Net Investment Income 23 -- 23 Investment Gain (Loss), net 53 (2) 51 Net Fee Income 13 -- 13 Other (1) (3) (4) Pre-Tax Income $103 $(27) $77 NCI 2 -- 2 Income Taxes 22 (2) 19 Net Income $80 $(25) $56 Calendar Year Loss Ratio 62.8% -- 63.5% Calendar Year Acquisition Ratio 18.2% -- 24.4% Calendar Year G&A Expense Ratio 13.9% -- 13.9% Calendar Year Combined Ratio 94.9% -- 101.8% Prior Year Development - Favorable (Unfavorable) 1.3% -- 1.3% Impact of Catastrophes on Combined Ratio -- -- -- Accident Year Combined Ratio (Ex. Cat) 96.2% -- 103.1% $ in millions (Unaudited) Reconciliation of Historical Statement of Operations Three Months Ended September 30, 2026 CommentaryGroup Statement of Operations PGAAP Adjustments represent the differences between historical accounting basis, and the fair value accounting basis required as a function of purchase accounting requirements.
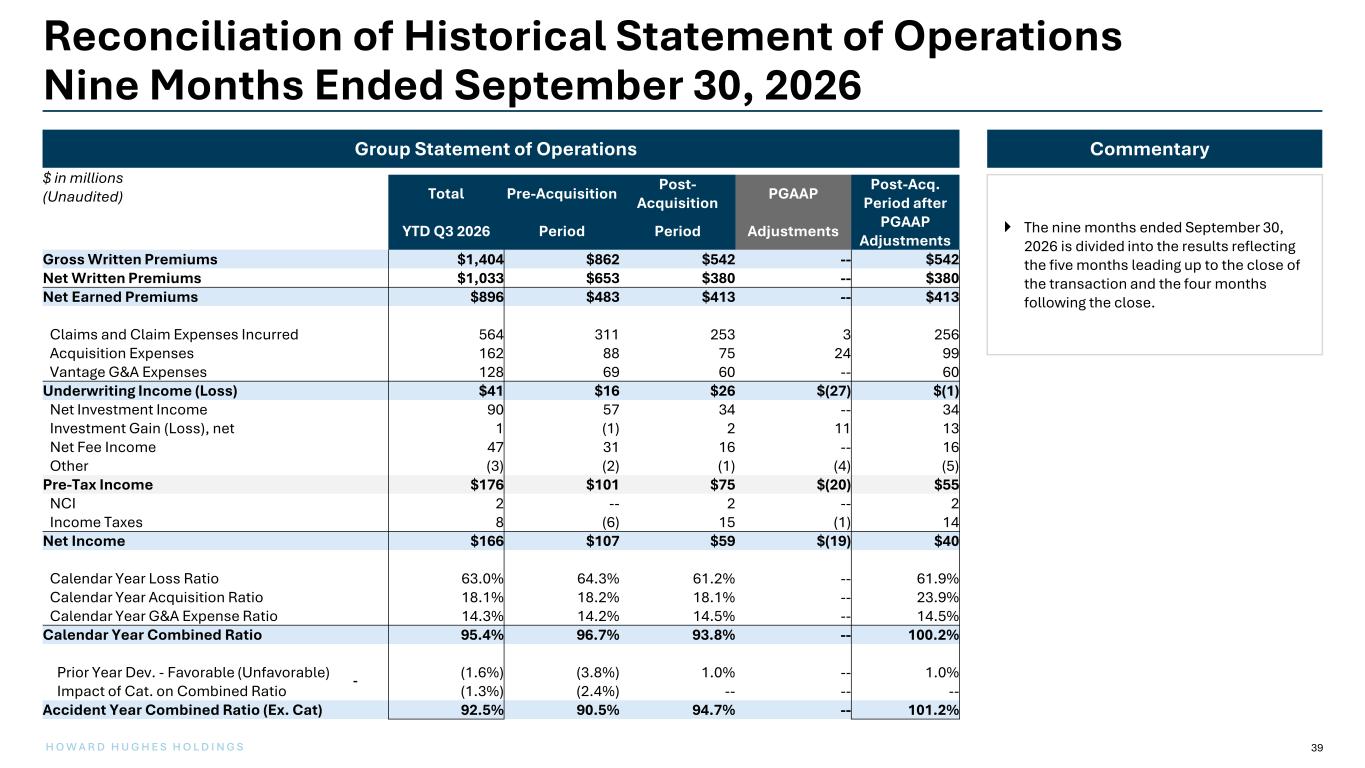
39 H O W A R D H U G H E S H O L D I N G S Total Pre-Acquisition Post- Acquisition PGAAP Post-Acq. Period after PGAAP AdjustmentsYTD Q3 2026 Period Period Adjustments Gross Written Premiums $1,404 $862 $542 -- $542 Net Written Premiums $1,033 $653 $380 -- $380 Net Earned Premiums $896 $483 $413 -- $413 Claims and Claim Expenses Incurred 564 311 253 3 256 Acquisition Expenses 162 88 75 24 99 Vantage G&A Expenses 128 69 60 -- 60 Underwriting Income (Loss) $41 $16 $26 $(27) $(1) Net Investment Income 90 57 34 -- 34 Investment Gain (Loss), net 1 (1) 2 11 13 Net Fee Income 47 31 16 -- 16 Other (3) (2) (1) (4) (5) Pre-Tax Income $176 $101 $75 $(20) $55 NCI 2 -- 2 -- 2 Income Taxes 8 (6) 15 (1) 14 Net Income $166 $107 $59 $(19) $40 Calendar Year Loss Ratio 63.0% 64.3% 61.2% -- 61.9% Calendar Year Acquisition Ratio 18.1% 18.2% 18.1% -- 23.9% Calendar Year G&A Expense Ratio 14.3% 14.2% 14.5% -- 14.5% Calendar Year Combined Ratio 95.4% 96.7% 93.8% -- 100.2% Prior Year Dev. - Favorable (Unfavorable) (1.6%) (3.8%) 1.0% -- 1.0% Impact of Cat. on Combined Ratio (1.3%) (2.4%) -- -- -- Accident Year Combined Ratio (Ex. Cat) 92.5% 90.5% 94.7% -- 101.2% Group Statement of Operations Commentary The nine months ended September 30, 2026 is divided into the results reflecting the five months leading up to the close of the transaction and the four months following the close. $ in millions (Unaudited) Reconciliation of Historical Statement of Operations Nine Months Ended September 30, 2026
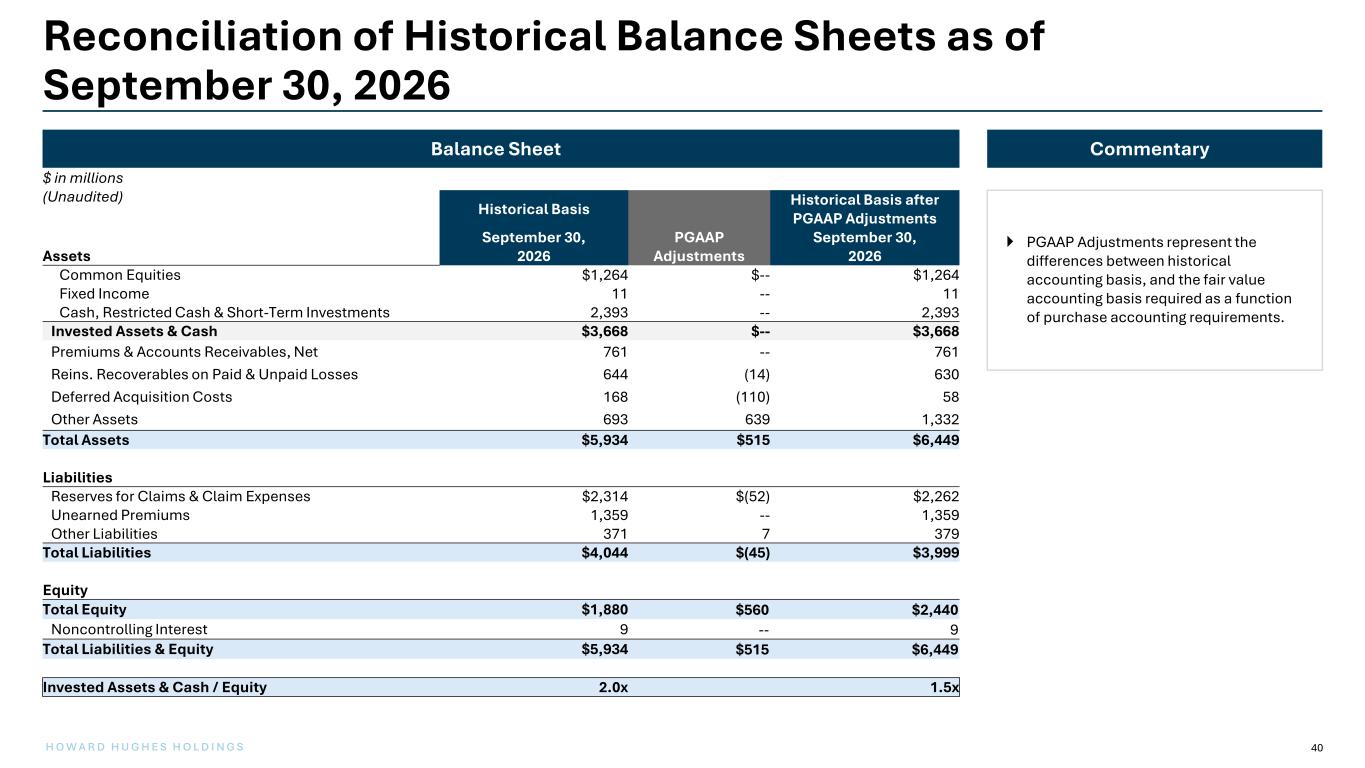
40 H O W A R D H U G H E S H O L D I N G S Balance Sheet Historical Basis Historical Basis after PGAAP Adjustments September 30, PGAAP September 30, Assets 2026 Adjustments 2026 Common Equities $1,264 $-- $1,264 Fixed Income 11 -- 11 Cash, Restricted Cash & Short-Term Investments 2,393 -- 2,393 Invested Assets & Cash $3,668 $-- $3,668 Premiums & Accounts Receivables, Net 761 -- 761 Reins. Recoverables on Paid & Unpaid Losses 644 (14) 630 Deferred Acquisition Costs 168 (110) 58 Other Assets 693 639 1,332 Total Assets $5,934 $515 $6,449 Liabilities Reserves for Claims & Claim Expenses $2,314 $(52) $2,262 Unearned Premiums 1,359 -- 1,359 Other Liabilities 371 7 379 Total Liabilities $4,044 $(45) $3,999 Equity Total Equity $1,880 $560 $2,440 Noncontrolling Interest 9 -- 9 Total Liabilities & Equity $5,934 $515 $6,449 Invested Assets & Cash / Equity 2.0x 1.5x PGAAP Adjustments represent the differences between historical accounting basis, and the fair value accounting basis required as a function of purchase accounting requirements. Commentary Reconciliation of Historical Balance Sheets as of September 30, 2026 $ in millions (Unaudited)