
Second Quarter FY 2027 Results November 5th, 2026 Exhibit 99.2
S E C O N D Q U A R T E R F Y 2 7 R E S U L T S Safe Harbor Disclosure This presentation contains certain “forward-looking” statements within the meaning of the Private Securities Litigation Reform Act of 1995, such as statements regarding the Company’s expected financial performance, including revenues, organic revenue growth, adjusted diluted EPS, gross margin and adjusted free cash flow; the Company’s ability to expand its Clear Eyes® supply and restore the Company’s Eye Care leadership position; stable organic growth across the Company’s portfolio and growth in eCommerce; growth from the Breathe Right® and LaCorium® acquisitions above Company averages; and the Company’s ability to reduce leverage. Words such as “anticipate,” “expect,” “believe,” “target,” “outlook,” “focus,” “set up,” “positioned,” “prioritize,” “on track,” “continue,” “can,” “will,” “may,” “should,” “could,” “would,” and similar expressions identify forward-looking statements. Such forward-looking statements represent the Company’s expectations and beliefs and involve a number of known and unknown risks, uncertainties and other factors that may cause actual results to differ materially from those expressed or implied by such forward-looking statements. These factors include, among others, the ability to increase the supply of Clear Eyes® from Pillar5 and other suppliers, including the timing and cost of improvements to the Pillar5 facility; the Company’s ability to comply with regulatory requirements and maintain product quality; the impact of any product recalls; the ability of the Company’s manufacturing operations and third party manufacturers and logistics providers and suppliers to meet demand for its other products and to avoid inflationary cost increases and supply disruption; the Company’s ability to successfully integrate the Breathe Right® and LaCorium® acquisitions and realize anticipated synergies; the Company’s level of indebtedness and changes in interest rates; the impact of economic and business conditions; consumer trends; competitive pressures; the impact of the Company’s advertising and promotional and new product development initiatives; customer inventory management initiatives and ordering patterns; the ability to pass along rising costs to customers without impacting sales; fluctuating foreign exchange rates; evolving U.S. and international tariffs and trade actions; geopolitical instability; and other risks set forth in Part I, Item 1A. Risk Factors in the Company’s Annual Report on Form 10-K for the year ended March 31, 2026 and in subsequent Quarterly Reports on Form 10-Q. You are cautioned not to place undue reliance on these forward-looking statements, which speak only as of the date of this presentation. Except to the extent required by applicable law, the Company undertakes no obligation to update any forward-looking statement contained in this presentation, whether as a result of new information, future events, or otherwise. All non-GAAP numbers presented are footnoted and reconciled to their closest GAAP measurement in the attached reconciliation schedule and in our November 5, 2026 earnings release in the “About Non-GAAP Financial Measures” section. Footnotes Reference footnotes on certain pages are detailed in the appendix on page 17.

S E C O N D Q U A R T E R F Y 2 7 R E S U L T S I. Performance Highlights
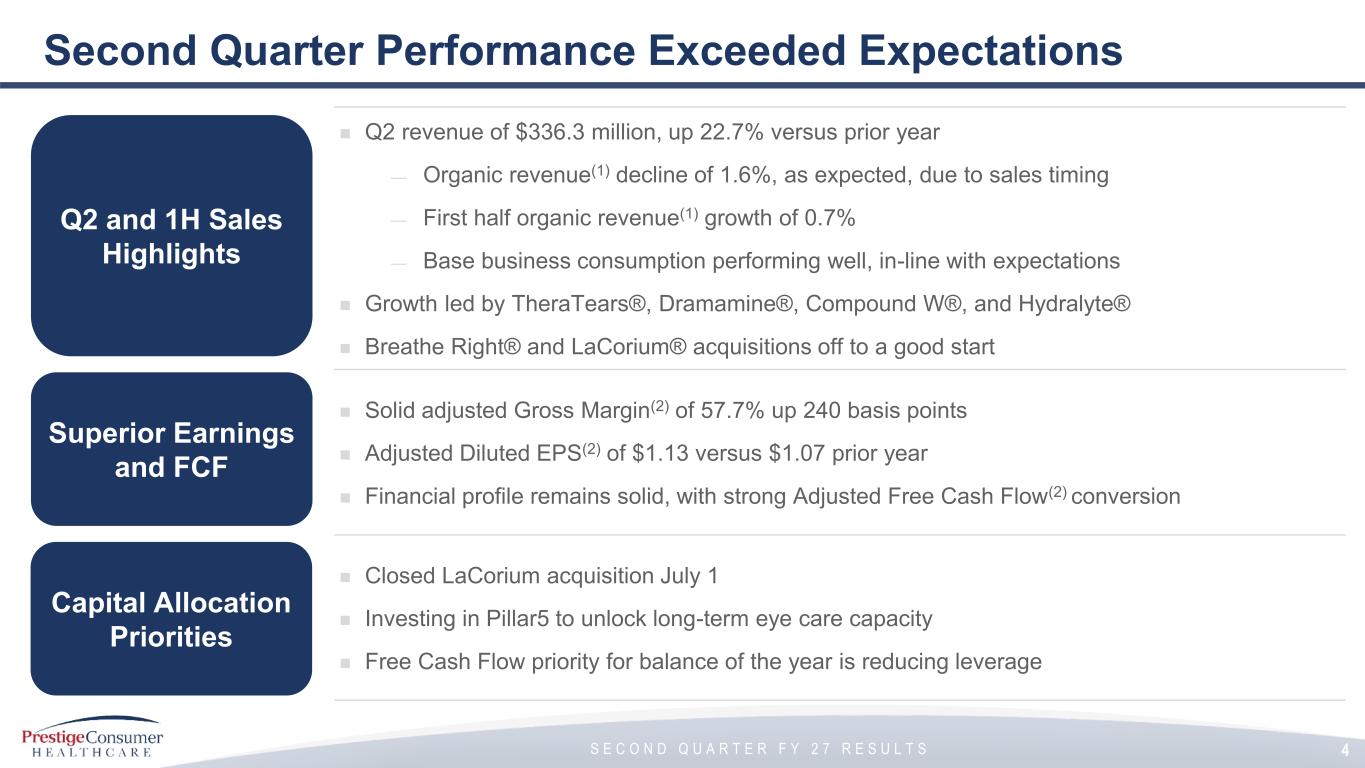
S E C O N D Q U A R T E R F Y 2 7 R E S U L T S Second Quarter Performance Exceeded Expectations ◼ Q2 revenue of $336.3 million, up 22.7% versus prior year — Organic revenue(1) decline of 1.6%, as expected, due to sales timing — First half organic revenue(1) growth of 0.7% — Base business consumption performing well, in-line with expectations ◼ Growth led by TheraTears®, Dramamine®, Compound W®, and Hydralyte® ◼ Breathe Right® and LaCorium® acquisitions off to a good start ◼ Solid adjusted Gross Margin(2) of 57.7% up 240 basis points ◼ Adjusted Diluted EPS(2) of $1.13 versus $1.07 prior year ◼ Financial profile remains solid, with strong Adjusted Free Cash Flow(2) conversion ◼ Closed LaCorium acquisition July 1 ◼ Investing in Pillar5 to unlock long-term eye care capacity ◼ Free Cash Flow priority for balance of the year is reducing leverage Q2 and 1H Sales Highlights Capital Allocation Priorities Superior Earnings and FCF 4
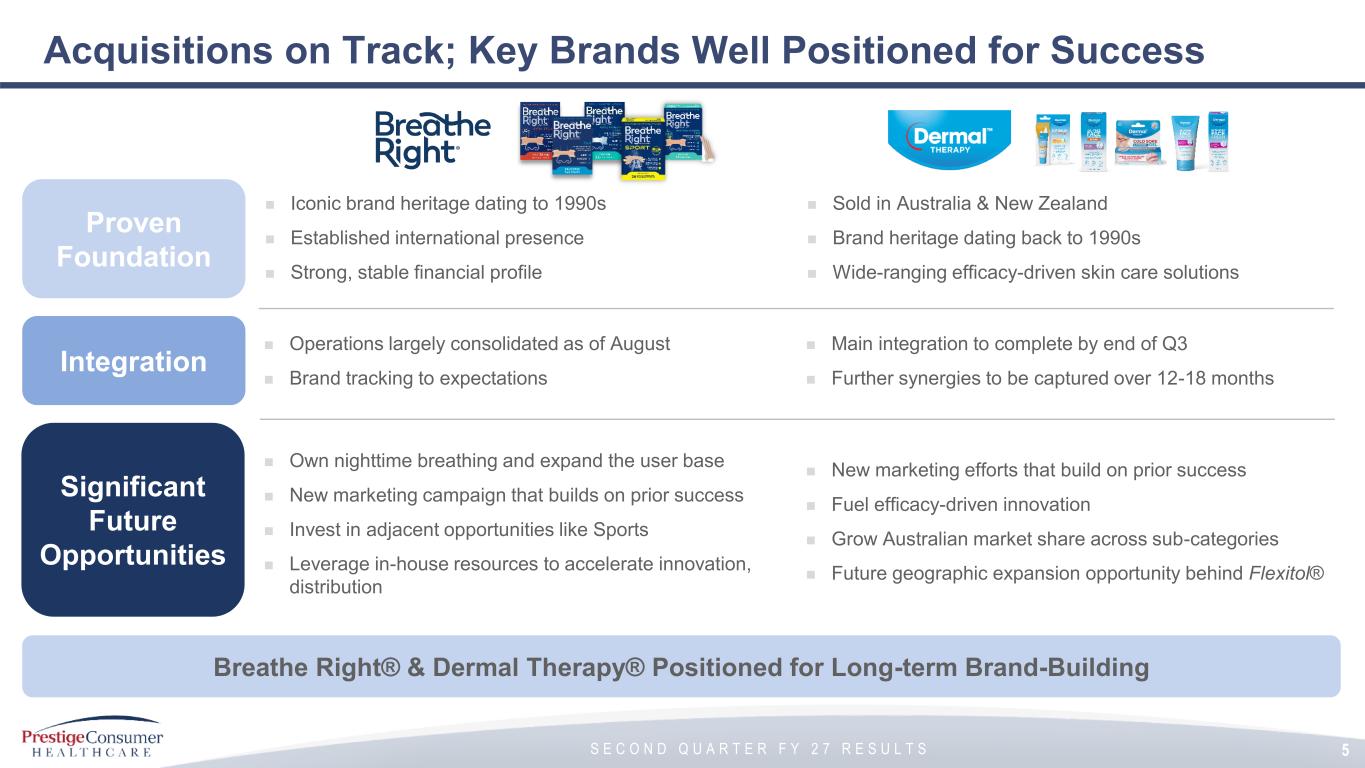
S E C O N D Q U A R T E R F Y 2 7 R E S U L T S ◼ Own nighttime breathing and expand the user base ◼ New marketing campaign that builds on prior success ◼ Invest in adjacent opportunities like Sports ◼ Leverage in-house resources to accelerate innovation, distribution ◼ Operations largely consolidated as of August ◼ Brand tracking to expectations ◼ Main integration to complete by end of Q3 ◼ Further synergies to be captured over 12-18 months Acquisitions on Track; Key Brands Well Positioned for Success Breathe Right® & Dermal Therapy® Positioned for Long-term Brand-Building Integration Proven Foundation Significant Future Opportunities ◼ Iconic brand heritage dating to 1990s ◼ Established international presence ◼ Strong, stable financial profile ◼ Sold in Australia & New Zealand ◼ Brand heritage dating back to 1990s ◼ Wide-ranging efficacy-driven skin care solutions ◼ New marketing efforts that build on prior success ◼ Fuel efficacy-driven innovation ◼ Grow Australian market share across sub-categories ◼ Future geographic expansion opportunity behind Flexitol® 5
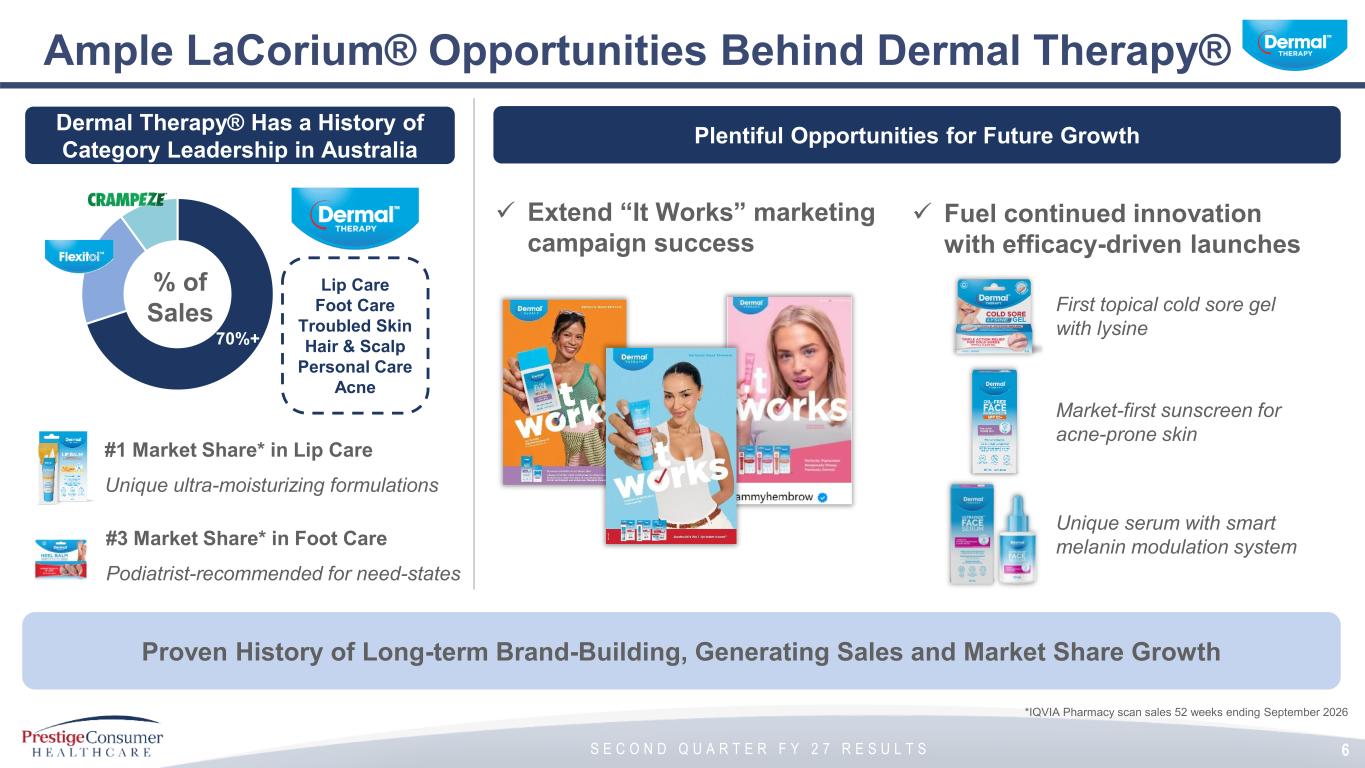
S E C O N D Q U A R T E R F Y 2 7 R E S U L T S Ample LaCorium® Opportunities Behind Dermal Therapy® Proven History of Long-term Brand-Building, Generating Sales and Market Share Growth ✓ Extend “It Works” marketing campaign success 70%+ % of Sales Lip Care Foot Care Troubled Skin Hair & Scalp Personal Care Acne Dermal Therapy® Has a History of Category Leadership in Australia #1 Market Share* in Lip Care Unique ultra-moisturizing formulations Plentiful Opportunities for Future Growth ✓ Fuel continued innovation with efficacy-driven launches *IQVIA Pharmacy scan sales 52 weeks ending September 2026 First topical cold sore gel with lysine #3 Market Share* in Foot Care Podiatrist-recommended for need-states Market-first sunscreen for acne-prone skin Unique serum with smart melanin modulation system 6
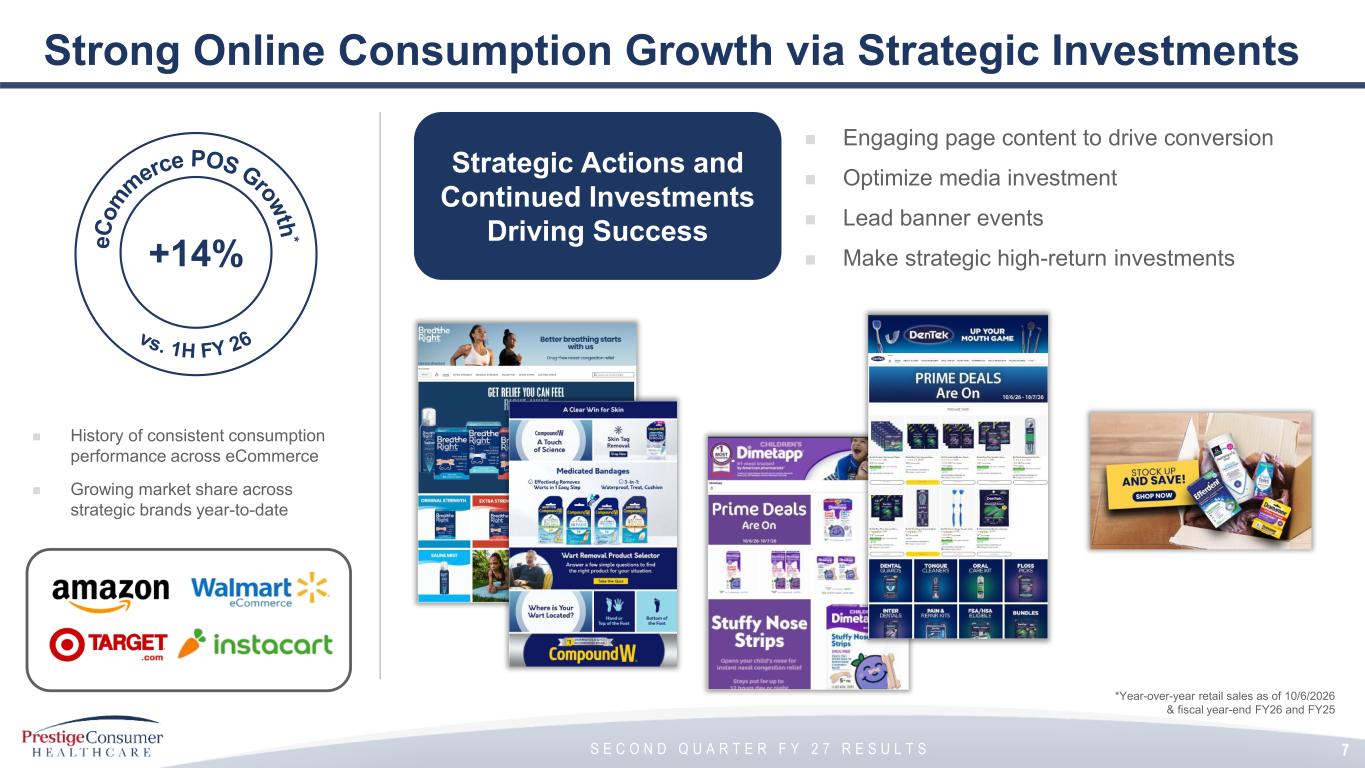
S E C O N D Q U A R T E R F Y 2 7 R E S U L T S Strong Online Consumption Growth via Strategic Investments 7 ◼ History of consistent consumption performance across eCommerce ◼ Growing market share across strategic brands year-to-date *Year-over-year retail sales as of 10/6/2026 & fiscal year-end FY26 and FY25 Strategic Actions and Continued Investments Driving Success ◼ Engaging page content to drive conversion ◼ Optimize media investment ◼ Lead banner events ◼ Make strategic high-return investments+14%e C o m m erce POS Grow th * vs. 1H FY 26

S E C O N D Q U A R T E R F Y 2 7 R E S U L T S II. Financial Overview
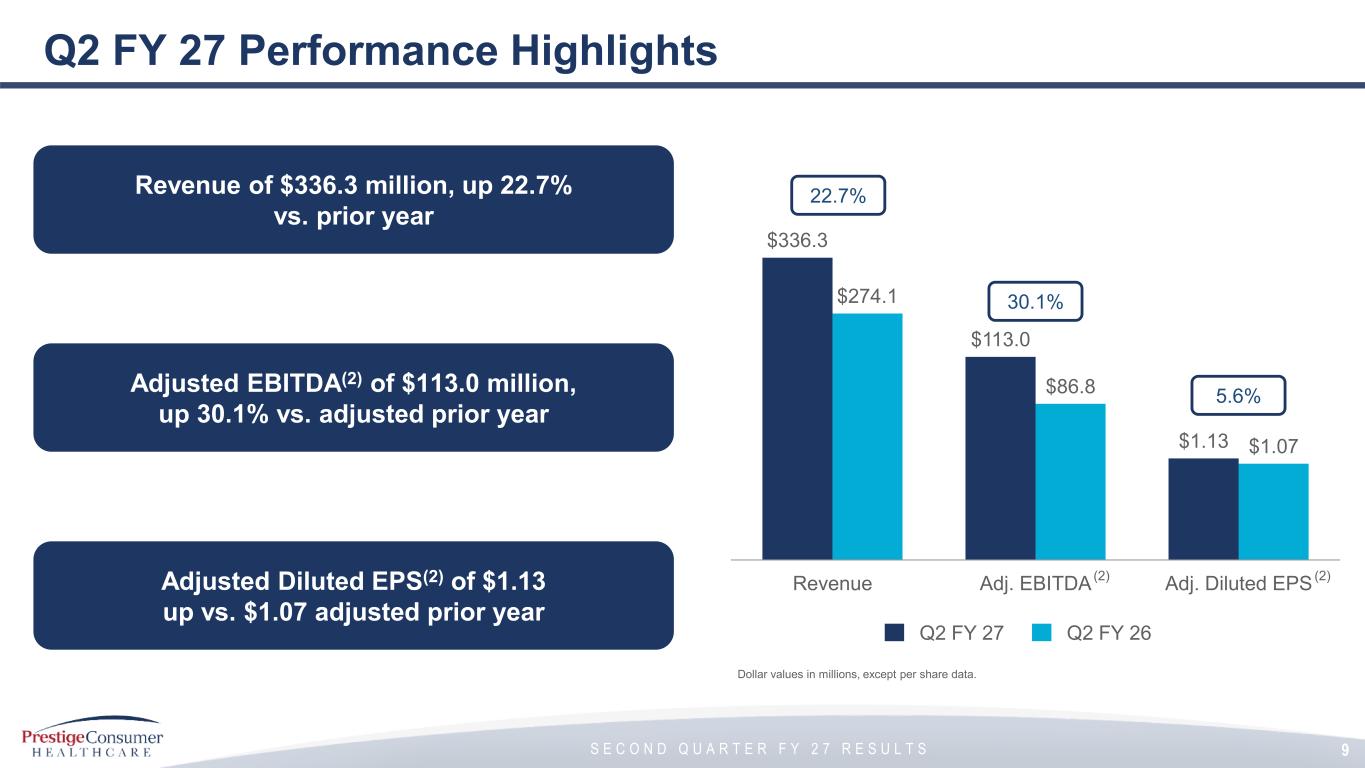
S E C O N D Q U A R T E R F Y 2 7 R E S U L T S Q2 FY 27 Performance Highlights Q2 FY 27 Q2 FY 26 Dollar values in millions, except per share data. $336.3 $113.0 $1.13 $274.1 $86.8 $1.07 Revenue Adj. EBITDA Adj. Diluted EPS 22.7% 30.1% 5.6% Revenue of $336.3 million, up 22.7% vs. prior year Adjusted Diluted EPS(2) of $1.13 up vs. $1.07 adjusted prior year Adjusted EBITDA(2) of $113.0 million, up 30.1% vs. adjusted prior year 9 (2) (2)
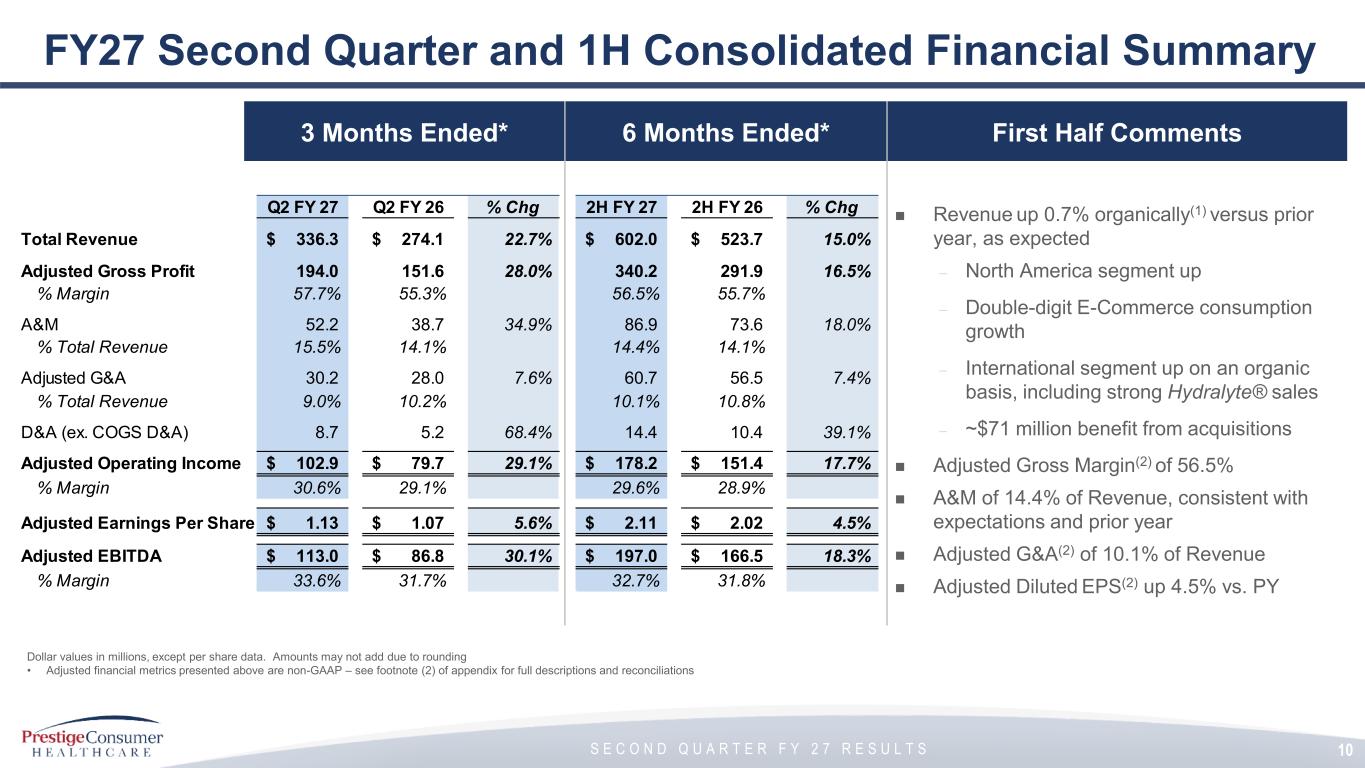
S E C O N D Q U A R T E R F Y 2 7 R E S U L T S 3 Months Ended* First Half Comments FY27 Second Quarter and 1H Consolidated Financial Summary ◼ Revenue up 0.7% organically(1) versus prior year, as expected – North America segment up – Double-digit E-Commerce consumption growth – International segment up on an organic basis, including strong Hydralyte® sales – ~$71 million benefit from acquisitions ◼ Adjusted Gross Margin(2) of 56.5% ◼ A&M of 14.4% of Revenue, consistent with expectations and prior year ◼ Adjusted G&A(2) of 10.1% of Revenue ◼ Adjusted Diluted EPS(2) up 4.5% vs. PY 10 6 Months Ended* Dollar values in millions, except per share data. Amounts may not add due to rounding • Adjusted financial metrics presented above are non-GAAP – see footnote (2) of appendix for full descriptions and reconciliations Q2 FY 27 Q2 FY 26 % Chg 2H FY 27 2H FY 26 % Chg Total Revenue 336.3$ 274.1$ 22.7% 602.0$ 523.7$ 15.0% Adjusted Gross Profit 194.0 151.6 28.0% 340.2 291.9 16.5% % Margin 57.7% 55.3% 56.5% 55.7% A&M 52.2 38.7 34.9% 86.9 73.6 18.0% % Total Revenue 15.5% 14.1% 14.4% 14.1% Adjusted G&A 30.2 28.0 7.6% 60.7 56.5 7.4% % Total Revenue 9.0% 10.2% 10.1% 10.8% D&A (ex. COGS D&A) 8.7 5.2 68.4% 14.4 10.4 39.1% Adjusted Operating Income 102.9$ 79.7$ 29.1% 178.2$ 151.4$ 17.7% % Margin 30.6% 29.1% 29.6% 28.9% Adjusted Earnings Per Share 1.13$ 1.07$ 5.6% 2.11$ 2.02$ 4.5% Adjusted EBITDA 113.0$ 86.8$ 30.1% 197.0$ 166.5$ 18.3% % Margin 33.6% 31.7% 32.7% 31.8%
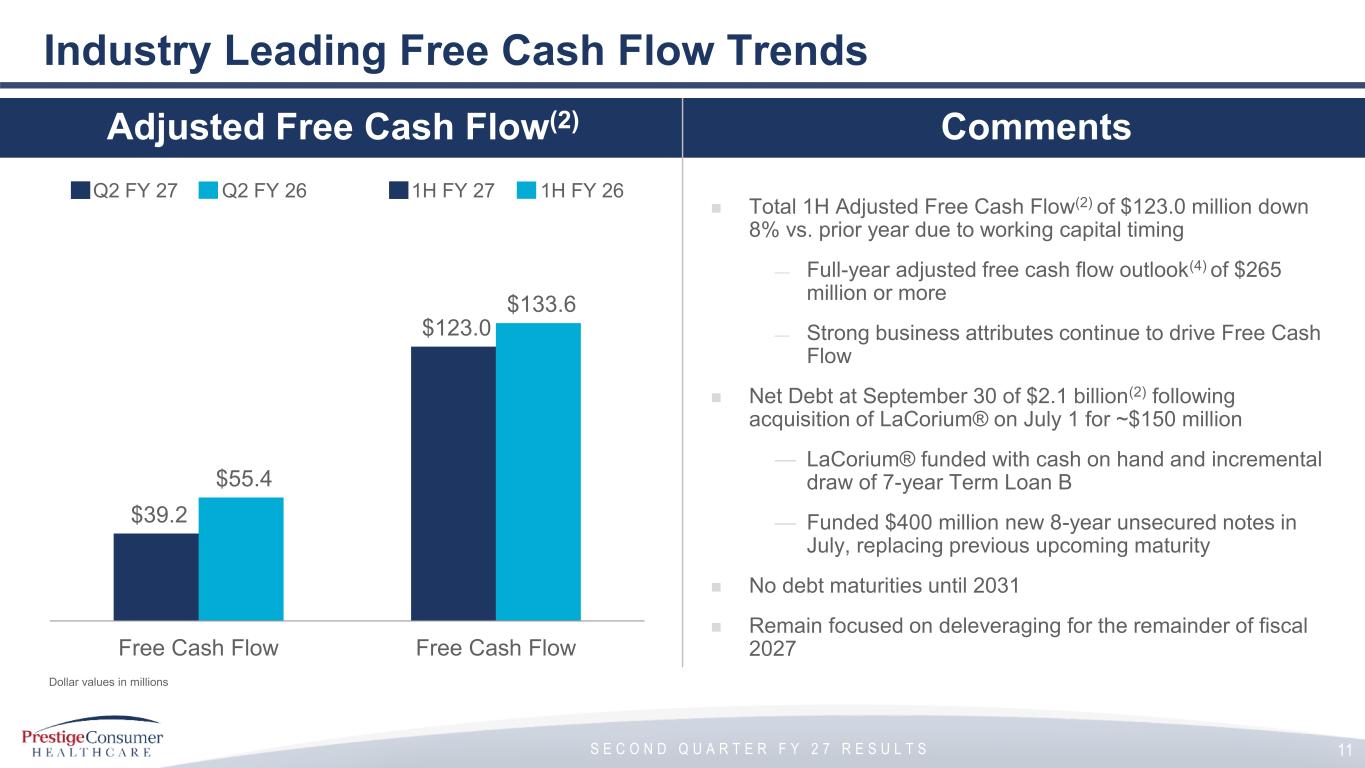
S E C O N D Q U A R T E R F Y 2 7 R E S U L T S Adjusted Free Cash Flow(2) Comments ◼ Total 1H Adjusted Free Cash Flow(2) of $123.0 million down 8% vs. prior year due to working capital timing — Full-year adjusted free cash flow outlook(4) of $265 million or more — Strong business attributes continue to drive Free Cash Flow ◼ Net Debt at September 30 of $2.1 billion(2) following acquisition of LaCorium® on July 1 for ~$150 million — LaCorium® funded with cash on hand and incremental draw of 7-year Term Loan B — Funded $400 million new 8-year unsecured notes in July, replacing previous upcoming maturity ◼ No debt maturities until 2031 ◼ Remain focused on deleveraging for the remainder of fiscal 2027 Industry Leading Free Cash Flow Trends Dollar values in millions 11 $39.2 $123.0 $55.4 $133.6 Free Cash Flow Free Cash Flow Q2 FY 27 Q2 FY 26 1H FY 27 1H FY 26

S E C O N D Q U A R T E R F Y 2 7 R E S U L T S III. The Road Ahead
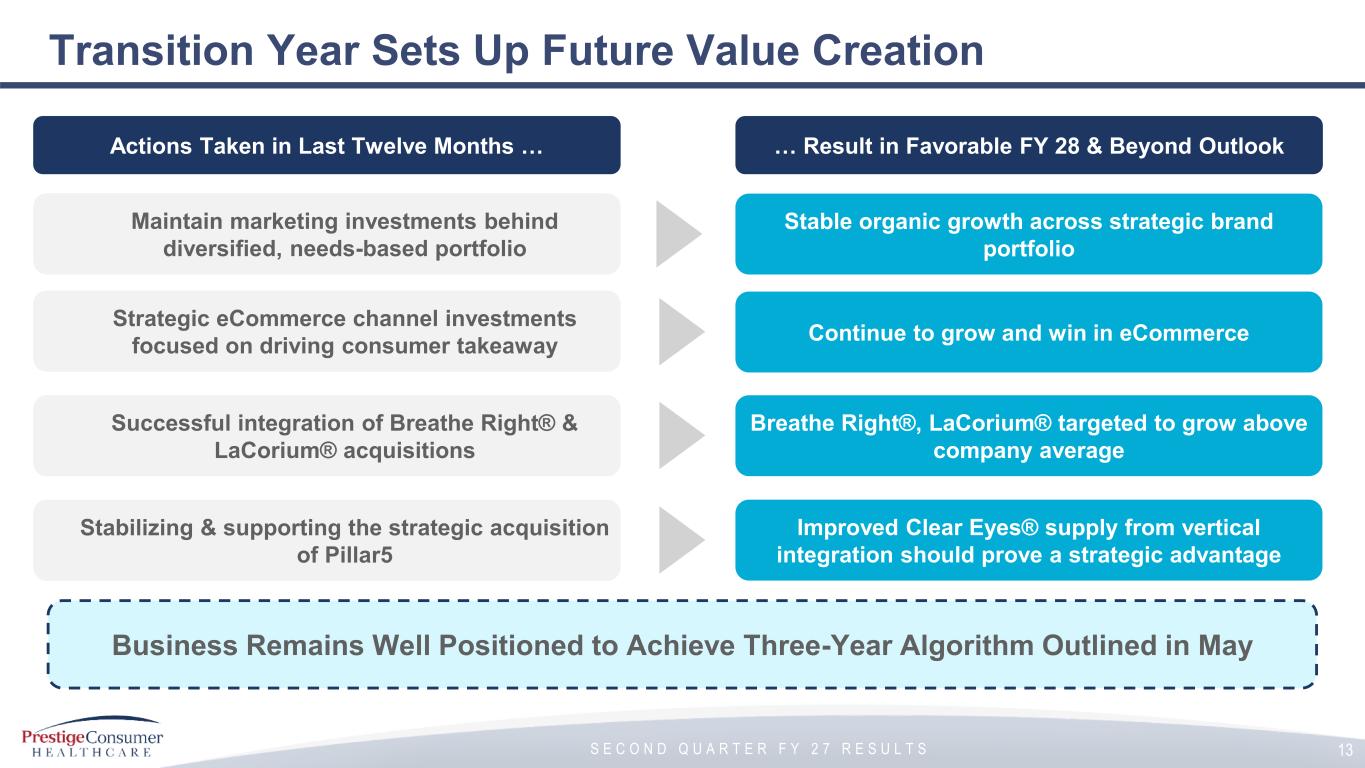
S E C O N D Q U A R T E R F Y 2 7 R E S U L T S Transition Year Sets Up Future Value Creation Business Remains Well Positioned to Achieve Three-Year Algorithm Outlined in May Maintain marketing investments behind diversified, needs-based portfolio Stable organic growth across strategic brand portfolio Actions Taken in Last Twelve Months … … Result in Favorable FY 28 & Beyond Outlook Strategic eCommerce channel investments focused on driving consumer takeaway Successful integration of Breathe Right® & LaCorium® acquisitions Stabilizing & supporting the strategic acquisition of Pillar5 Continue to grow and win in eCommerce Breathe Right®, LaCorium® targeted to grow above company average Improved Clear Eyes® supply from vertical integration should prove a strategic advantage 13
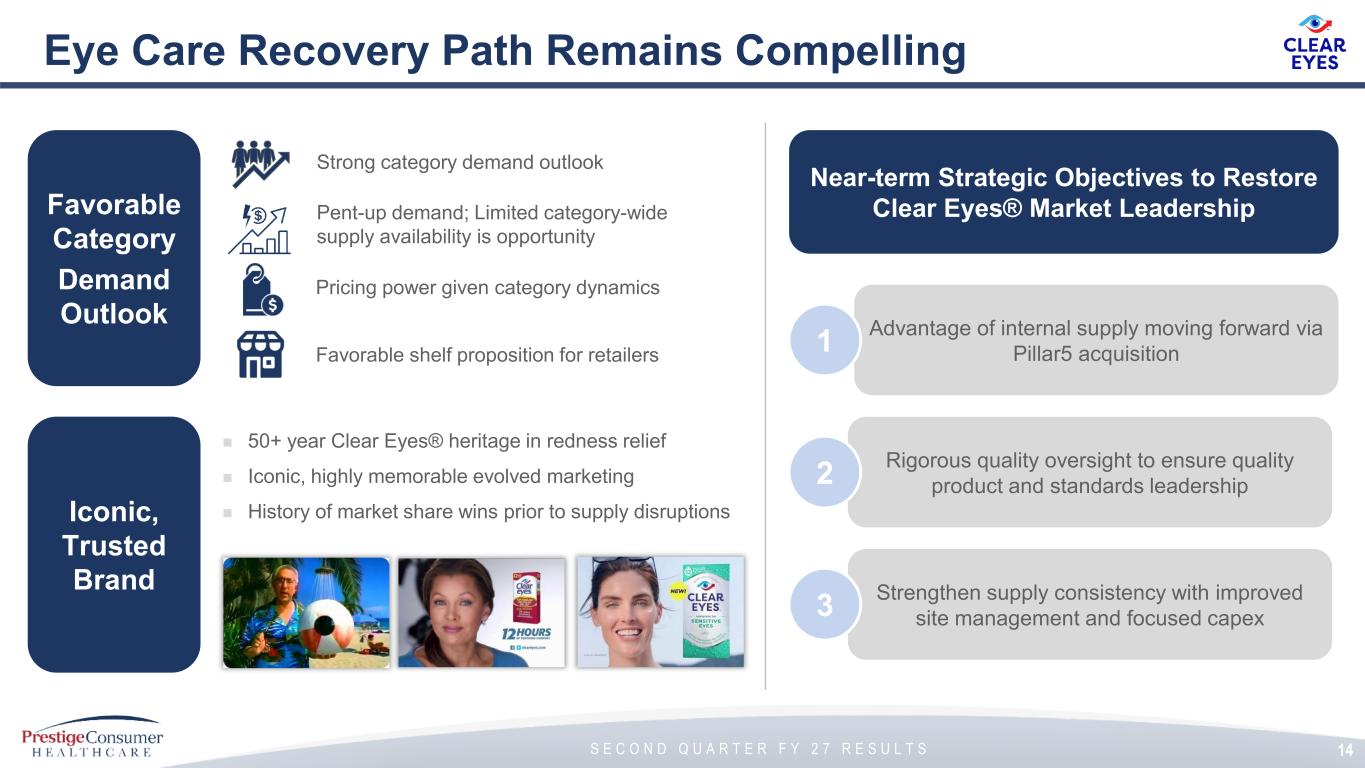
S E C O N D Q U A R T E R F Y 2 7 R E S U L T S Eye Care Recovery Path Remains Compelling Favorable Category Demand Outlook Iconic, Trusted Brand ◼ 50+ year Clear Eyes® heritage in redness relief ◼ Iconic, highly memorable evolved marketing ◼ History of market share wins prior to supply disruptions Favorable shelf proposition for retailers Rigorous quality oversight to ensure quality product and standards leadership Advantage of internal supply moving forward via Pillar5 acquisition Strengthen supply consistency with improved site management and focused capex 1 2 3 Near-term Strategic Objectives to Restore Clear Eyes® Market Leadership Strong category demand outlook Pricing power given category dynamics Pent-up demand; Limited category-wide supply availability is opportunity 14
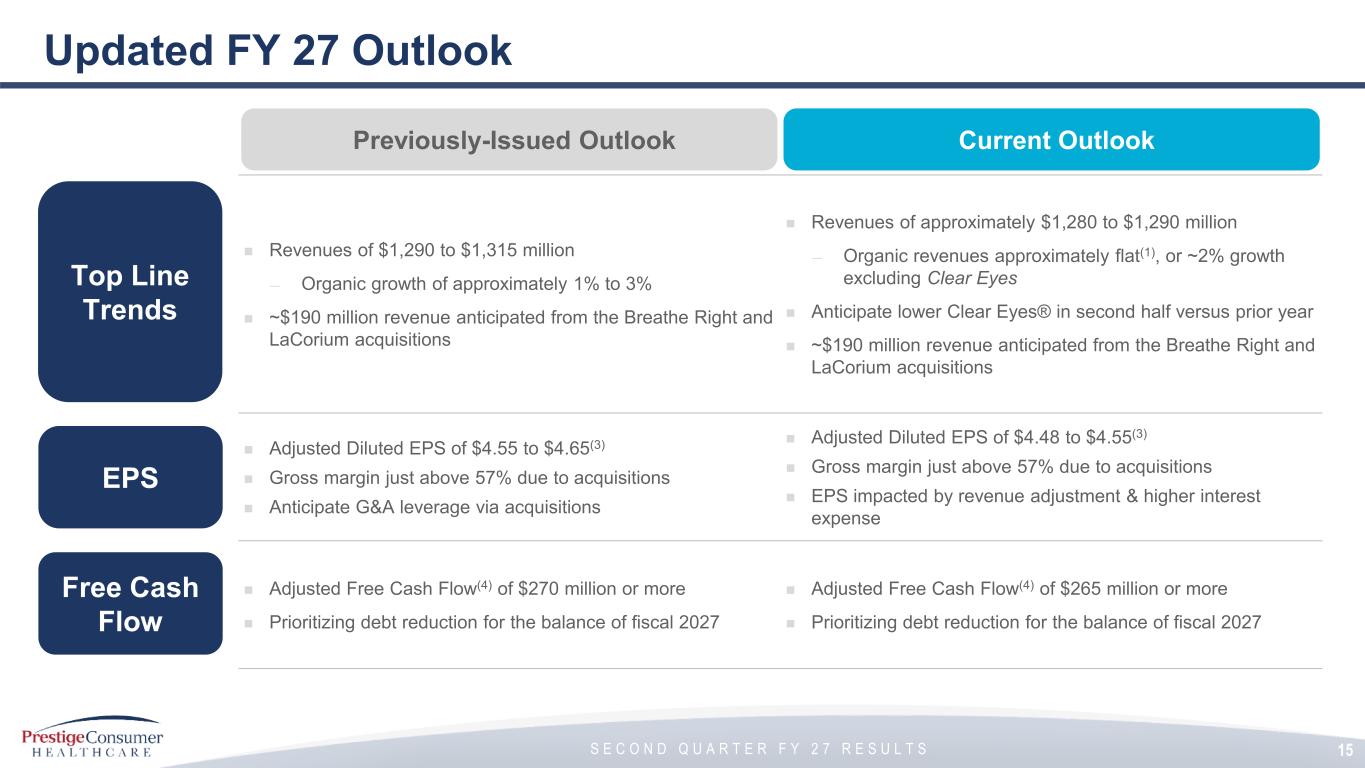
S E C O N D Q U A R T E R F Y 2 7 R E S U L T S Updated FY 27 Outlook ◼ Revenues of $1,290 to $1,315 million — Organic growth of approximately 1% to 3% ◼ ~$190 million revenue anticipated from the Breathe Right and LaCorium acquisitions ◼ Revenues of approximately $1,280 to $1,290 million — Organic revenues approximately flat(1), or ~2% growth excluding Clear Eyes ◼ Anticipate lower Clear Eyes® in second half versus prior year ◼ ~$190 million revenue anticipated from the Breathe Right and LaCorium acquisitions ◼ Adjusted Diluted EPS of $4.55 to $4.65(3) ◼ Gross margin just above 57% due to acquisitions ◼ Anticipate G&A leverage via acquisitions ◼ Adjusted Diluted EPS of $4.48 to $4.55(3) ◼ Gross margin just above 57% due to acquisitions ◼ EPS impacted by revenue adjustment & higher interest expense ◼ Adjusted Free Cash Flow(4) of $270 million or more ◼ Prioritizing debt reduction for the balance of fiscal 2027 ◼ Adjusted Free Cash Flow(4) of $265 million or more ◼ Prioritizing debt reduction for the balance of fiscal 2027 Top Line Trends Free Cash Flow EPS 15 Previously-Issued Outlook Current Outlook

S E C O N D Q U A R T E R F Y 2 7 R E S U L T S Appendix
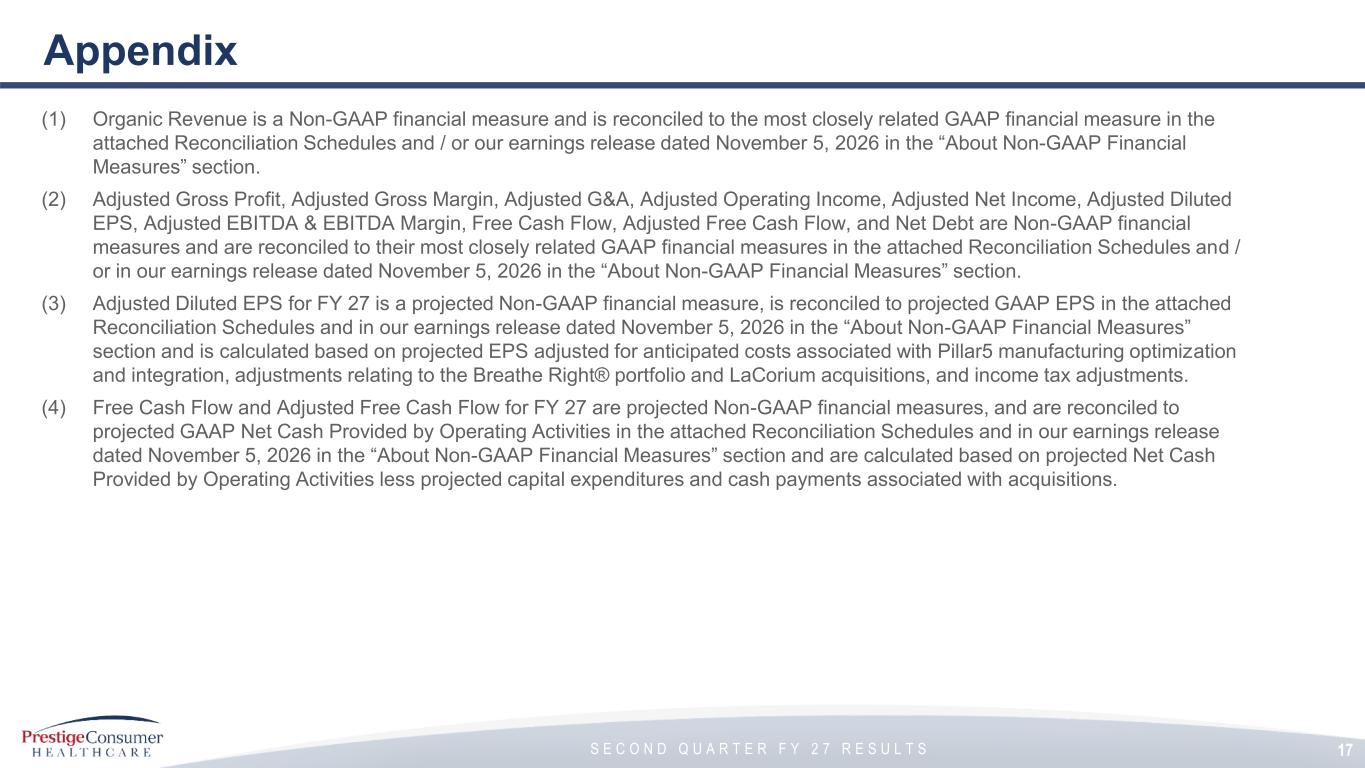
S E C O N D Q U A R T E R F Y 2 7 R E S U L T S Appendix (1) Organic Revenue is a Non-GAAP financial measure and is reconciled to the most closely related GAAP financial measure in the attached Reconciliation Schedules and / or our earnings release dated November 5, 2026 in the “About Non-GAAP Financial Measures” section. (2) Adjusted Gross Profit, Adjusted Gross Margin, Adjusted G&A, Adjusted Operating Income, Adjusted Net Income, Adjusted Diluted EPS, Adjusted EBITDA & EBITDA Margin, Free Cash Flow, Adjusted Free Cash Flow, and Net Debt are Non-GAAP financial measures and are reconciled to their most closely related GAAP financial measures in the attached Reconciliation Schedules and / or in our earnings release dated November 5, 2026 in the “About Non-GAAP Financial Measures” section. (3) Adjusted Diluted EPS for FY 27 is a projected Non-GAAP financial measure, is reconciled to projected GAAP EPS in the attached Reconciliation Schedules and in our earnings release dated November 5, 2026 in the “About Non-GAAP Financial Measures” section and is calculated based on projected EPS adjusted for anticipated costs associated with Pillar5 manufacturing optimization and integration, adjustments relating to the Breathe Right® portfolio and LaCorium acquisitions, and income tax adjustments. (4) Free Cash Flow and Adjusted Free Cash Flow for FY 27 are projected Non-GAAP financial measures, and are reconciled to projected GAAP Net Cash Provided by Operating Activities in the attached Reconciliation Schedules and in our earnings release dated November 5, 2026 in the “About Non-GAAP Financial Measures” section and are calculated based on projected Net Cash Provided by Operating Activities less projected capital expenditures and cash payments associated with acquisitions. 17
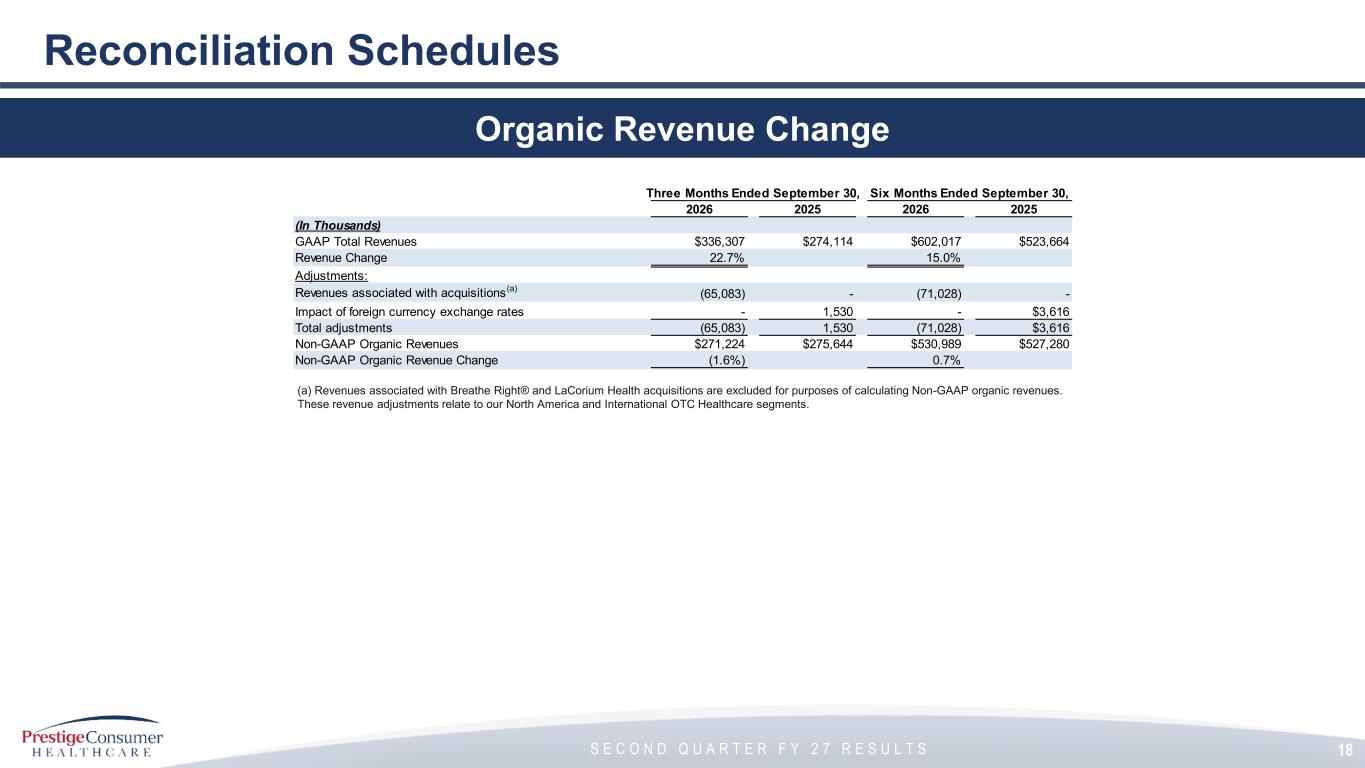
S E C O N D Q U A R T E R F Y 2 7 R E S U L T S 18 Reconciliation Schedules Organic Revenue Change (a) Revenues associated with Breathe Right® and LaCorium Health acquisitions are excluded for purposes of calculating Non-GAAP organic revenues. These revenue adjustments relate to our North America and International OTC Healthcare segments. Three Months Ended September 30, Six Months Ended September 30, 2026 2025 2026 2025 (In Thousands) GAAP Total Revenues $336,307 $274,114 $602,017 $523,664 Revenue Change 22.7% 15.0% Adjustments: Revenues associated with acquisitions(a) (65,083) - (71,028) - Impact of foreign currency exchange rates - 1,530 - $3,616 Total adjustments (65,083) 1,530 (71,028) $3,616 Non-GAAP Organic Revenues $271,224 $275,644 $530,989 $527,280 Non-GAAP Organic Revenue Change (1.6%) 0.7%
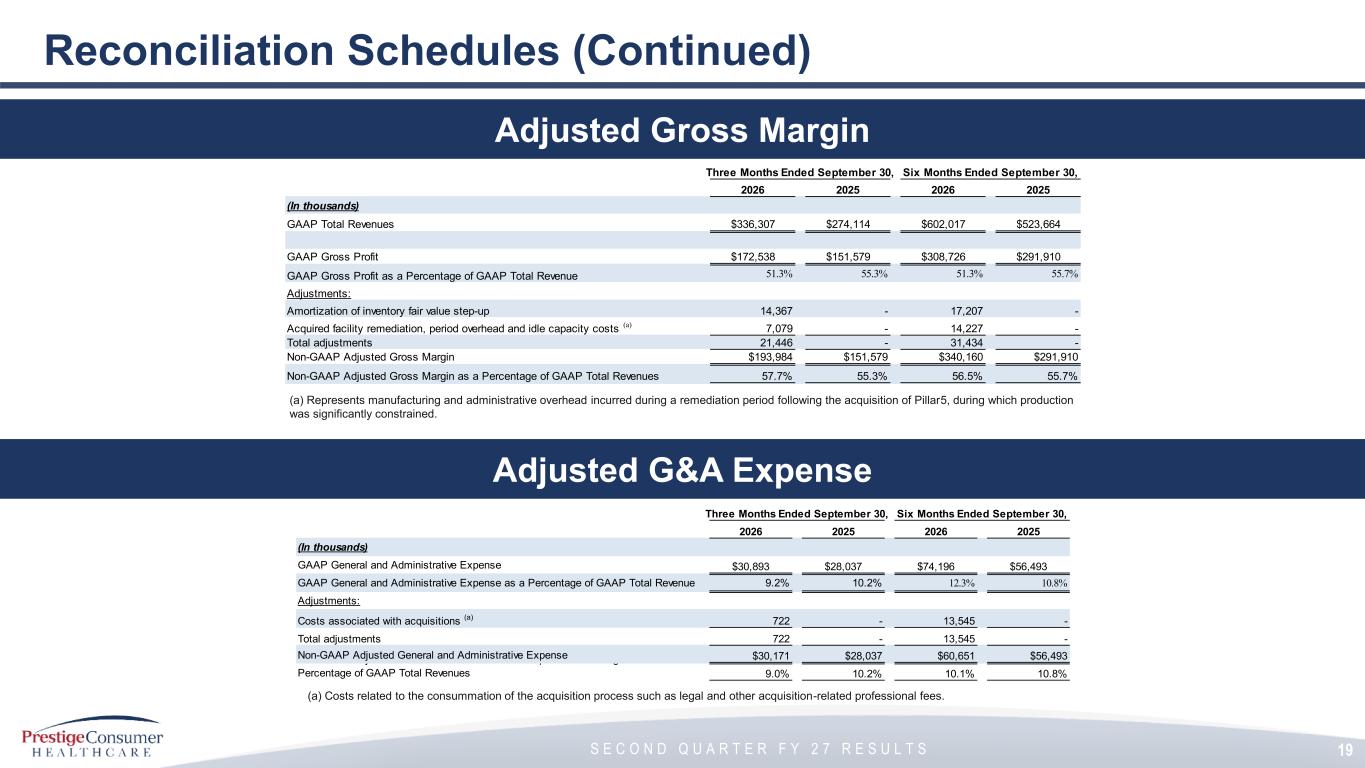
S E C O N D Q U A R T E R F Y 2 7 R E S U L T S 19 Reconciliation Schedules (Continued) Adjusted G&A Expense (a) Costs related to the consummation of the acquisition process such as legal and other acquisition-related professional fees. Adjusted Gross Margin Three Months Ended September 30, Six Months Ended September 30, 2026 2025 2026 2025 (In thousands) GAAP Total Revenues $336,307 $274,114 $602,017 $523,664 GAAP Gross Profit $172,538 $151,579 $308,726 $291,910 GAAP Gross Profit as a Percentage of GAAP Total Revenue 51.3% 55.3% 51.3% 55.7% Adjustments: Amortization of inventory fair value step-up 14,367 - 17,207 - Acquired facility remediation, period overhead and idle capacity costs (a) 7,079 - 14,227 - Total adjustments 21,446 - 31,434 - Non-GAAP Adjusted Gross Margin $193,984 $151,579 $340,160 $291,910 Non-GAAP Adjusted Gross Margin as a Percentage of GAAP Total Revenues 57.7% 55.3% 56.5% 55.7% (a) Represents manufacturing and administrative overhead incurred during a remediation period following the acquisition of Pillar5, during which production was significantly constrained. Three Months Ended September 30, Six Months Ended September 30, 2026 2025 2026 2025 (In thousands) GAAP General and Administrative Expense $30,893 $28,037 $74,196 $56,493 GAAP General and Administrative Expense as a Percentage of GAAP Total Revenue 9.2% 10.2% 12.3% 10.8% Adjustments: Costs associated with acquisitions (a) 722 - 13,545 - Total adjustments 722 - 13,545 - Non-GAAP Adjusted General and Administrative Expense $30,171 $28,037 $60,651 $56,493Non-GAAP Adjusted General and Administrative Expense Percentage as a Percentage of GAAP Total Revenues 9.0% 10.2% 10.1% 10.8%
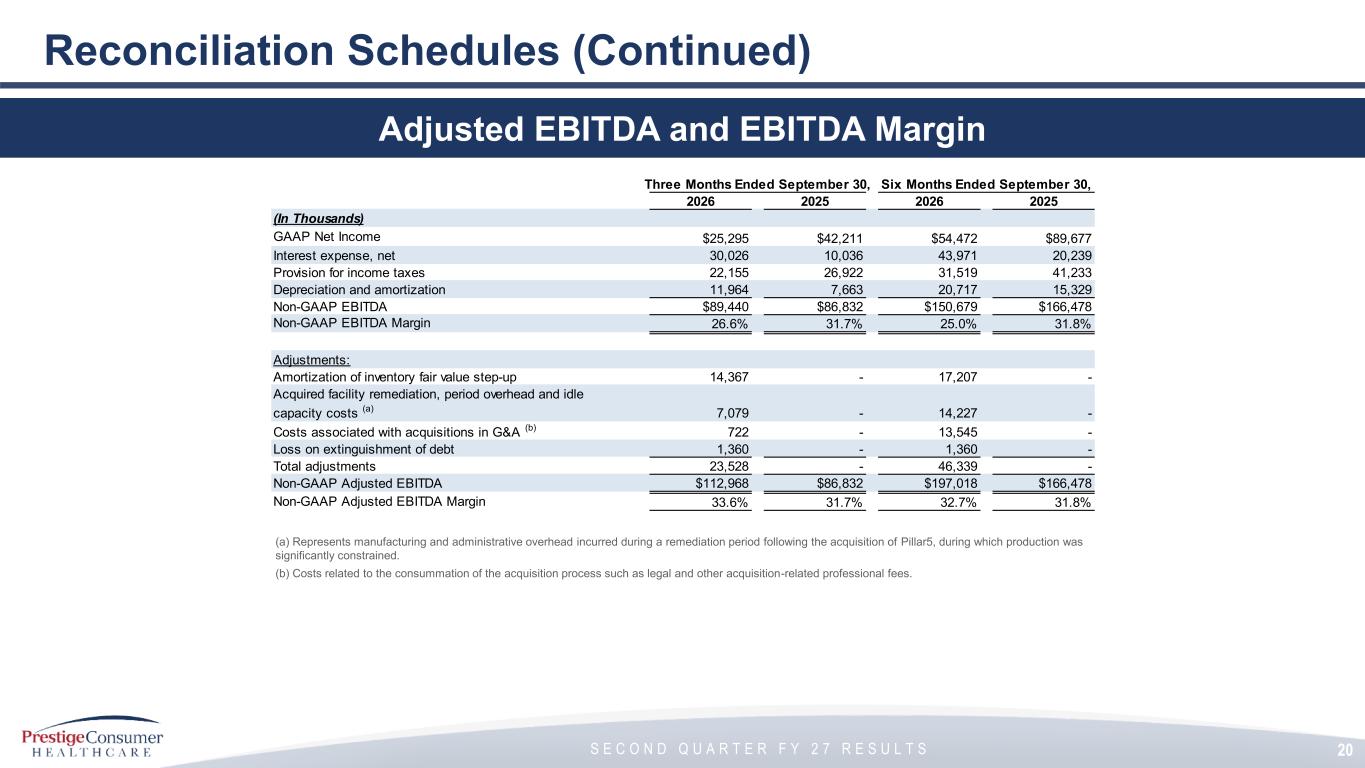
S E C O N D Q U A R T E R F Y 2 7 R E S U L T S 20 Reconciliation Schedules (Continued) Adjusted EBITDA and EBITDA Margin (a) Represents manufacturing and administrative overhead incurred during a remediation period following the acquisition of Pillar5, during which production was significantly constrained. (b) Costs related to the consummation of the acquisition process such as legal and other acquisition-related professional fees. Three Months Ended September 30, Six Months Ended September 30, 2026 2025 2026 2025 (In Thousands) GAAP Net Income $25,295 $42,211 $54,472 $89,677 Interest expense, net 30,026 10,036 43,971 20,239 Provision for income taxes 22,155 26,922 31,519 41,233 Depreciation and amortization 11,964 7,663 20,717 15,329 Non-GAAP EBITDA $89,440 $86,832 $150,679 $166,478 Non-GAAP EBITDA Margin 26.6% 31.7% 25.0% 31.8% Adjustments: Amortization of inventory fair value step-up 14,367 - 17,207 - Acquired facility remediation, period overhead and idle capacity costs (a) 7,079 - 14,227 - Costs associated with acquisitions in G&A (b) 722 - 13,545 - Loss on extinguishment of debt 1,360 - 1,360 - Total adjustments 23,528 - 46,339 - Non-GAAP Adjusted EBITDA $112,968 $86,832 $197,018 $166,478 Non-GAAP Adjusted EBITDA Margin 33.6% 31.7% 32.7% 31.8%
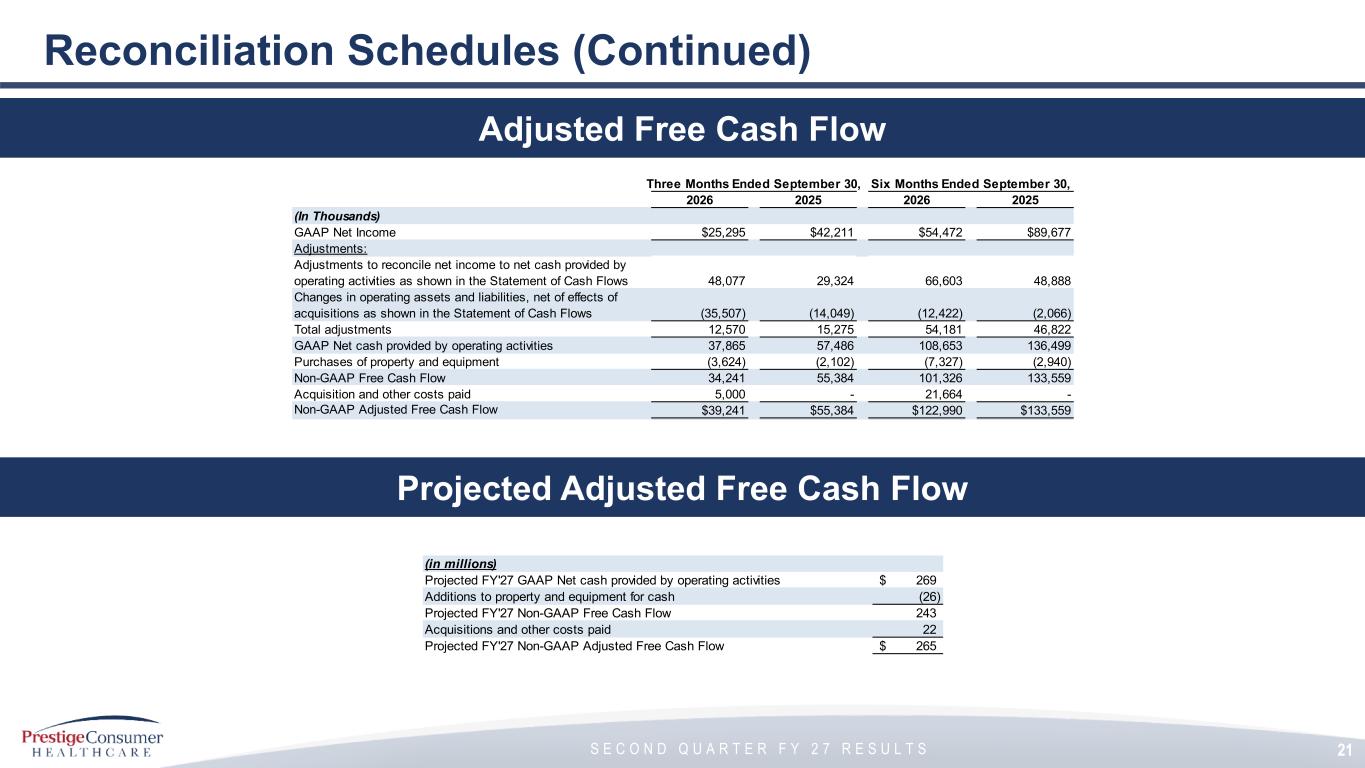
S E C O N D Q U A R T E R F Y 2 7 R E S U L T S 21 Reconciliation Schedules (Continued) Adjusted Free Cash Flow Projected Adjusted Free Cash Flow Three Months Ended September 30, Six Months Ended September 30, 2026 2025 2026 2025 (In Thousands) GAAP Net Income $25,295 $42,211 $54,472 $89,677 Adjustments: Adjustments to reconcile net income to net cash provided by operating activities as shown in the Statement of Cash Flows 48,077 29,324 66,603 48,888 Changes in operating assets and liabilities, net of effects of acquisitions as shown in the Statement of Cash Flows (35,507) (14,049) (12,422) (2,066) Total adjustments 12,570 15,275 54,181 46,822 GAAP Net cash provided by operating activities 37,865 57,486 108,653 136,499 Purchases of property and equipment (3,624) (2,102) (7,327) (2,940) Non-GAAP Free Cash Flow 34,241 55,384 101,326 133,559 Acquisition and other costs paid 5,000 - 21,664 - Non-GAAP Adjusted Free Cash Flow $39,241 $55,384 $122,990 $133,559 (in millions) Projected FY'27 GAAP Net cash provided by operating activities 269$ Additions to property and equipment for cash (26) Projected FY'27 Non-GAAP Free Cash Flow 243 Acquisitions and other costs paid 22 Projected FY'27 Non-GAAP Adjusted Free Cash Flow 265$
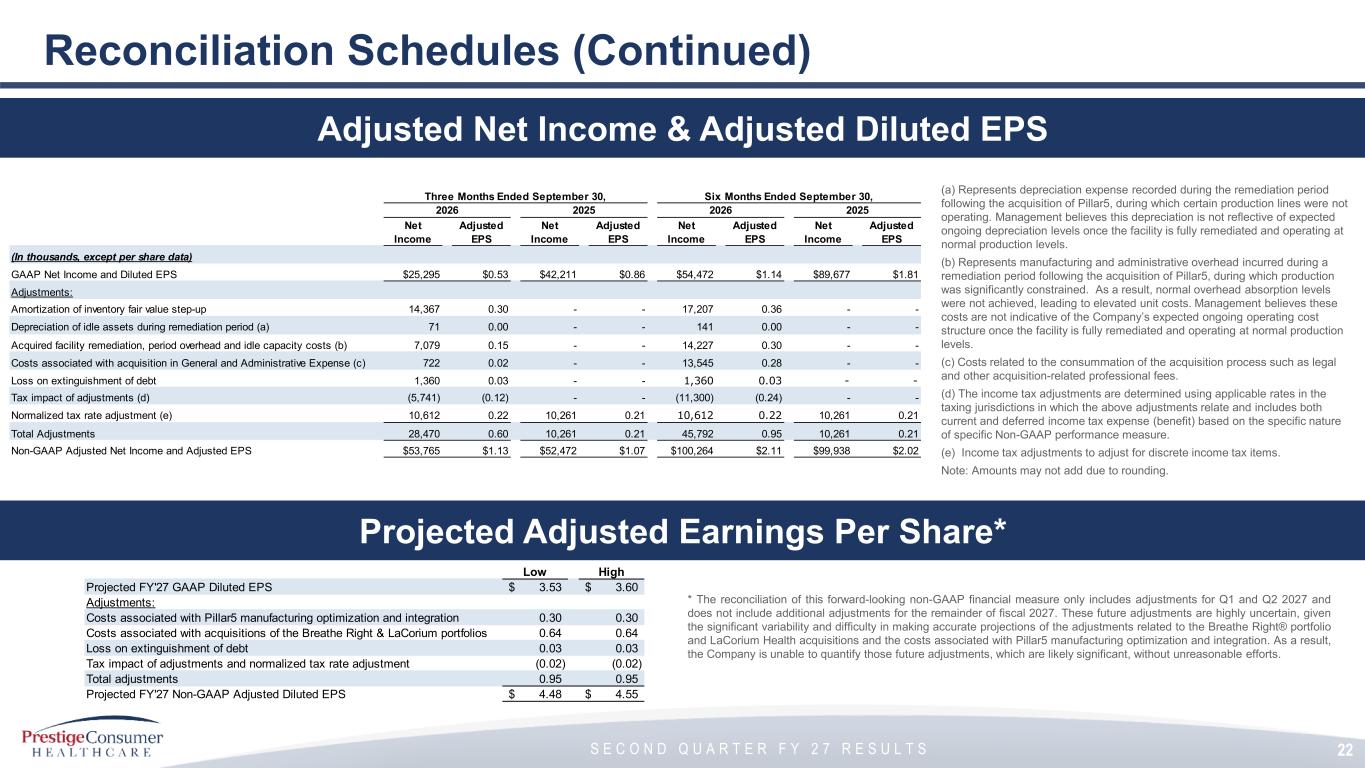
S E C O N D Q U A R T E R F Y 2 7 R E S U L T S 22 Reconciliation Schedules (Continued) Adjusted Net Income & Adjusted Diluted EPS (a) Represents depreciation expense recorded during the remediation period following the acquisition of Pillar5, during which certain production lines were not operating. Management believes this depreciation is not reflective of expected ongoing depreciation levels once the facility is fully remediated and operating at normal production levels. (b) Represents manufacturing and administrative overhead incurred during a remediation period following the acquisition of Pillar5, during which production was significantly constrained. As a result, normal overhead absorption levels were not achieved, leading to elevated unit costs. Management believes these costs are not indicative of the Company’s expected ongoing operating cost structure once the facility is fully remediated and operating at normal production levels. (c) Costs related to the consummation of the acquisition process such as legal and other acquisition-related professional fees. (d) The income tax adjustments are determined using applicable rates in the taxing jurisdictions in which the above adjustments relate and includes both current and deferred income tax expense (benefit) based on the specific nature of specific Non-GAAP performance measure. (e) Income tax adjustments to adjust for discrete income tax items. Note: Amounts may not add due to rounding. Projected Adjusted Earnings Per Share* * The reconciliation of this forward-looking non-GAAP financial measure only includes adjustments for Q1 and Q2 2027 and does not include additional adjustments for the remainder of fiscal 2027. These future adjustments are highly uncertain, given the significant variability and difficulty in making accurate projections of the adjustments related to the Breathe Right® portfolio and LaCorium Health acquisitions and the costs associated with Pillar5 manufacturing optimization and integration. As a result, the Company is unable to quantify those future adjustments, which are likely significant, without unreasonable efforts. Three Months Ended September 30, Six Months Ended September 30, 2026 2025 2026 2025 Net Income Adjusted EPS Net Income Adjusted EPS Net Income Adjusted EPS Net Income Adjusted EPS (In thousands, except per share data) GAAP Net Income and Diluted EPS $25,295 $0.53 $42,211 $0.86 $54,472 $1.14 $89,677 $1.81 Adjustments: Amortization of inventory fair value step-up 14,367 0.30 - - 17,207 0.36 - - Depreciation of idle assets during remediation period (a) 71 0.00 - - 141 0.00 - - Acquired facility remediation, period overhead and idle capacity costs (b) 7,079 0.15 - - 14,227 0.30 - - Costs associated with acquisition in General and Administrative Expense (c) 722 0.02 - - 13,545 0.28 - - Loss on extinguishment of debt 1,360 0.03 - - 1,360 0.03 - - Tax impact of adjustments (d) (5,741) (0.12) - - (11,300) (0.24) - - Normalized tax rate adjustment (e) 10,612 0.22 10,261 0.21 10,612 0.22 10,261 0.21 Total Adjustments 28,470 0.60 10,261 0.21 45,792 0.95 10,261 0.21 Non-GAAP Adjusted Net Income and Adjusted EPS $53,765 $1.13 $52,472 $1.07 $100,264 $2.11 $99,938 $2.02 Low High Projected FY'27 GAAP Diluted EPS 3.53$ 3.60$ Adjustments: Costs associated with Pillar5 manufacturing optimization and integration 0.30 0.30 Costs associated with acquisitions of the Breathe Right & LaCorium portfolios 0.64 0.64 Loss on extinguishment of debt 0.03 0.03 Tax impact of adjustments and normalized tax rate adjustment (0.02) (0.02) Total adjustments 0.95 0.95 Projected FY'27 Non-GAAP Adjusted Diluted EPS 4.48$ 4.55$

P C H C O N F I D E N T I A L A N D P R O P R I E T A R Y I N F O R M A T I O N