Insight Proprietary & Confidential. Do Not Copy or Distribute. © 2026 Insight. All Rights Reserved. Insight Enterprises, Inc. Third Quarter 2026 Earnings Conference Call and Webcast 1
Insight Proprietary & Confidential. Do Not Copy or Distribute. © 2026 Insight. All Rights Reserved. Disclosures Safe harbor statement This presentation includes “forward-looking statements” within the meaning of the Private Securities Litigation Reform Act of 1995 related to Insight’s plans and expectations. Statements that are not historical facts, including those related to our expectations about future financial results and the assumptions related thereto, our expectations regarding future expected trends in the IT market and our opportunities for growth, are forward-looking statements. These forward-looking statements are subject to assumptions, risks and uncertainties which could cause actual results or future events to differ materially from such statements. Insight Enterprises, Inc. (the "Company") undertakes no obligation to update publicly or revise any of the forward-looking statements, except as otherwise required by law. More detailed information about forward-looking statements and risk factors is included in today’s press release and discussed in the Company’s most recently filed periodic reports and subsequent filings with the Securities and Exchange Commission. Non-GAAP measures This presentation will reference certain non-GAAP financial information as ‘Adjusted’. A reconciliation of non-GAAP financial measures presented in this document to our actual GAAP results is attached to the back of this presentation and included in the press release issued today, which you may find on the Investor Relations section of our website at investor.insight.com. These non-GAAP measures are used by the Company and its management to evaluate financial performance against budgeted amounts, to calculate incentive compensation, to assist in forecasting future performance and to compare the Company’s results to those of the Company’s competitors. The Company believes that these non-GAAP financial measures are useful to investors because they allow for greater transparency, facilitate comparisons to prior periods and the Company’s competitors’ results and assist in forecasting performance for future periods. These non-GAAP financial measures are not prepared in accordance with GAAP and may be different from non-GAAP financial measures presented by other companies. Non-GAAP financial measures should not be considered as a substitute for, or superior to, measures of financial performance prepared in accordance with GAAP. Constant currency In some instances, the Company refers to changes in net sales, gross profit, earnings from operations and Adjusted earnings from operations on a consolidated basis and in EMEA and APAC, as applicable, excluding the effects of fluctuating foreign currency exchange rates. In addition, the Company refers to changes in Adjusted diluted earnings per share on a consolidated basis excluding the effects of fluctuating foreign currency exchange rates. These are also considered to be non-GAAP measures. The Company believes providing this information excluding the effects of fluctuating foreign currency exchange rates provides valuable supplemental information to investors regarding its underlying business and results of operations, consistent with how the Company and its management evaluate the Company’s performance. In computing these changes and percentages, the Company compares the current year amount as translated into U.S. dollars under the applicable accounting standards to the prior year amount in local currency translated into U.S. dollars utilizing the weighted average translation rate for the current period. 2
Insight Proprietary & Confidential. Do Not Copy or Distribute. © 2026 Insight. All Rights Reserved. Table of Contents • Solutions Integrator Strategy • Solutions at Work • Employer Awards • Partner and Industry Recognitions • Third Quarter 2026 Highlights and Performance • 2026 Outlook • Appendix 3
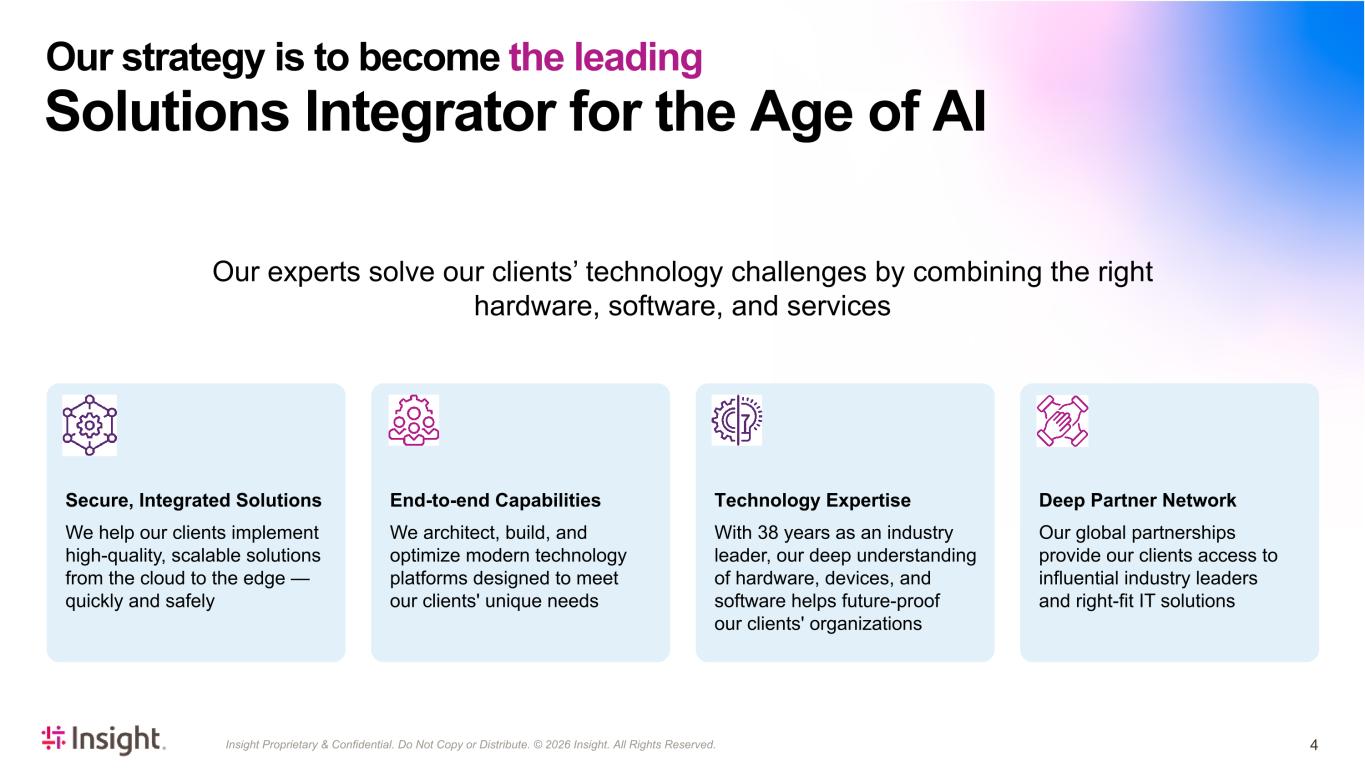
Insight Proprietary & Confidential. Do Not Copy or Distribute. © 2026 Insight. All Rights Reserved. Secure, Integrated Solutions We help our clients implement high-quality, scalable solutions from the cloud to the edge — quickly and safely End-to-end Capabilities We architect, build, and optimize modern technology platforms designed to meet our clients' unique needs Technology Expertise With 38 years as an industry leader, our deep understanding of hardware, devices, and software helps future-proof our clients' organizations Deep Partner Network Our global partnerships provide our clients access to influential industry leaders and right-fit IT solutions 4 Our experts solve our clients’ technology challenges by combining the right hardware, software, and services Our strategy is to become the leading Solutions Integrator for the Age of AI
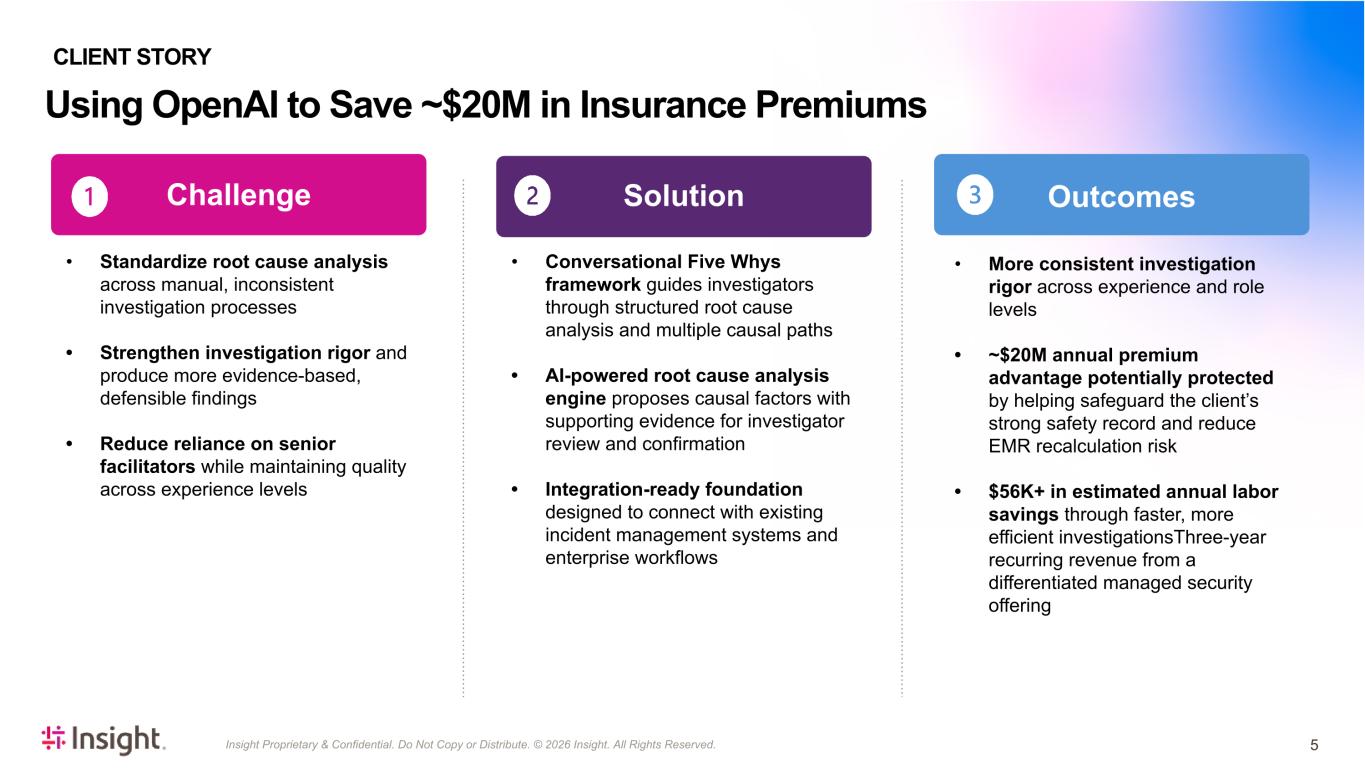
Insight Proprietary & Confidential. Do Not Copy or Distribute. © 2026 Insight. All Rights Reserved. Challenge Solution Outcomes 5 • Conversational Five Whys framework guides investigators through structured root cause analysis and multiple causal paths • AI-powered root cause analysis engine proposes causal factors with supporting evidence for investigator review and confirmation • Integration-ready foundation designed to connect with existing incident management systems and enterprise workflows • More consistent investigation rigor across experience and role levels • ~$20M annual premium advantage potentially protected by helping safeguard the client’s strong safety record and reduce EMR recalculation risk • $56K+ in estimated annual labor savings through faster, more efficient investigationsThree-year recurring revenue from a differentiated managed security offering • Standardize root cause analysis across manual, inconsistent investigation processes • Strengthen investigation rigor and produce more evidence-based, defensible findings • Reduce reliance on senior facilitators while maintaining quality across experience levels Using OpenAI to Save ~$20M in Insurance Premiums CLIENT STORY
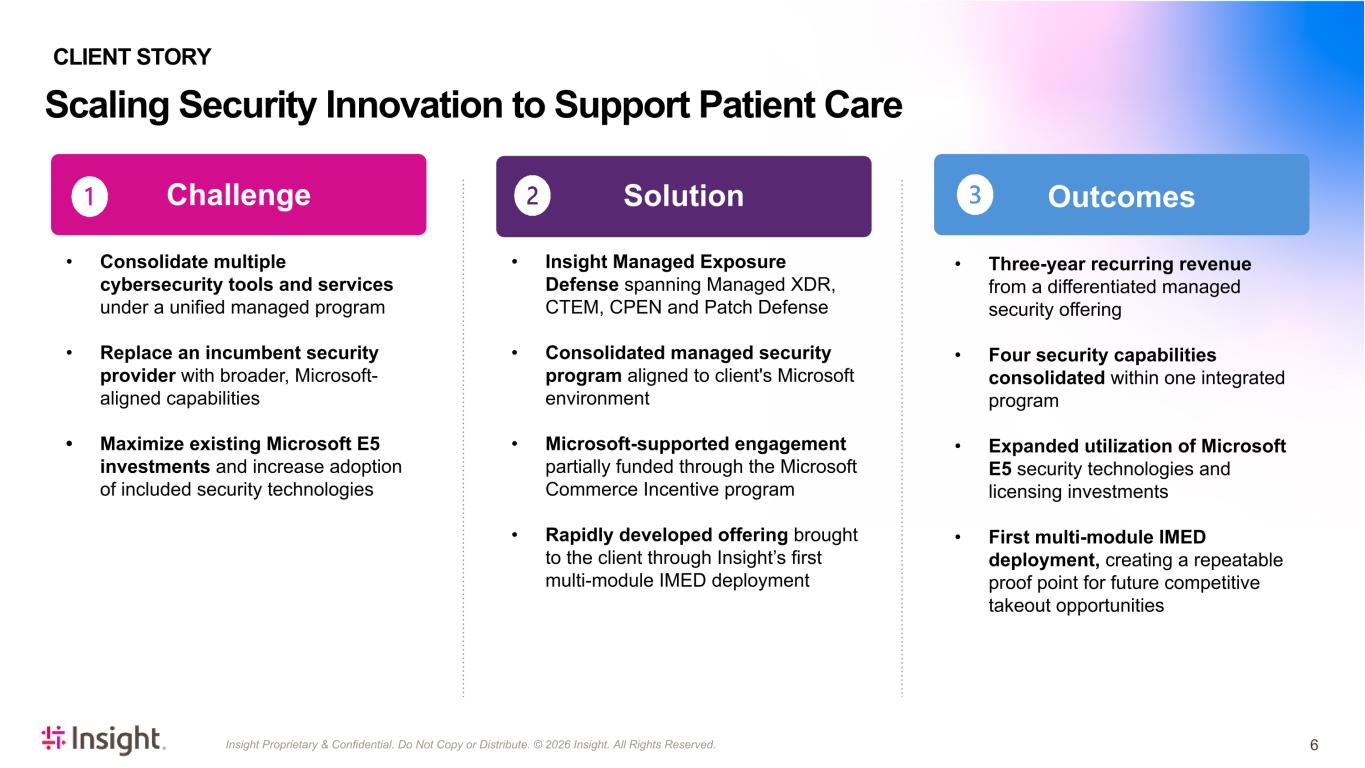
Insight Proprietary & Confidential. Do Not Copy or Distribute. © 2026 Insight. All Rights Reserved. Challenge Solution Outcomes 6 • Insight Managed Exposure Defense spanning Managed XDR, CTEM, CPEN and Patch Defense • Consolidated managed security program aligned to client's Microsoft environment • Microsoft-supported engagement partially funded through the Microsoft Commerce Incentive program • Rapidly developed offering brought to the client through Insight’s first multi-module IMED deployment • Three-year recurring revenue from a differentiated managed security offering • Four security capabilities consolidated within one integrated program • Expanded utilization of Microsoft E5 security technologies and licensing investments • First multi-module IMED deployment, creating a repeatable proof point for future competitive takeout opportunities • Consolidate multiple cybersecurity tools and services under a unified managed program • Replace an incumbent security provider with broader, Microsoft- aligned capabilities • Maximize existing Microsoft E5 investments and increase adoption of included security technologies Scaling Security Innovation to Support Patient Care CLIENT STORY
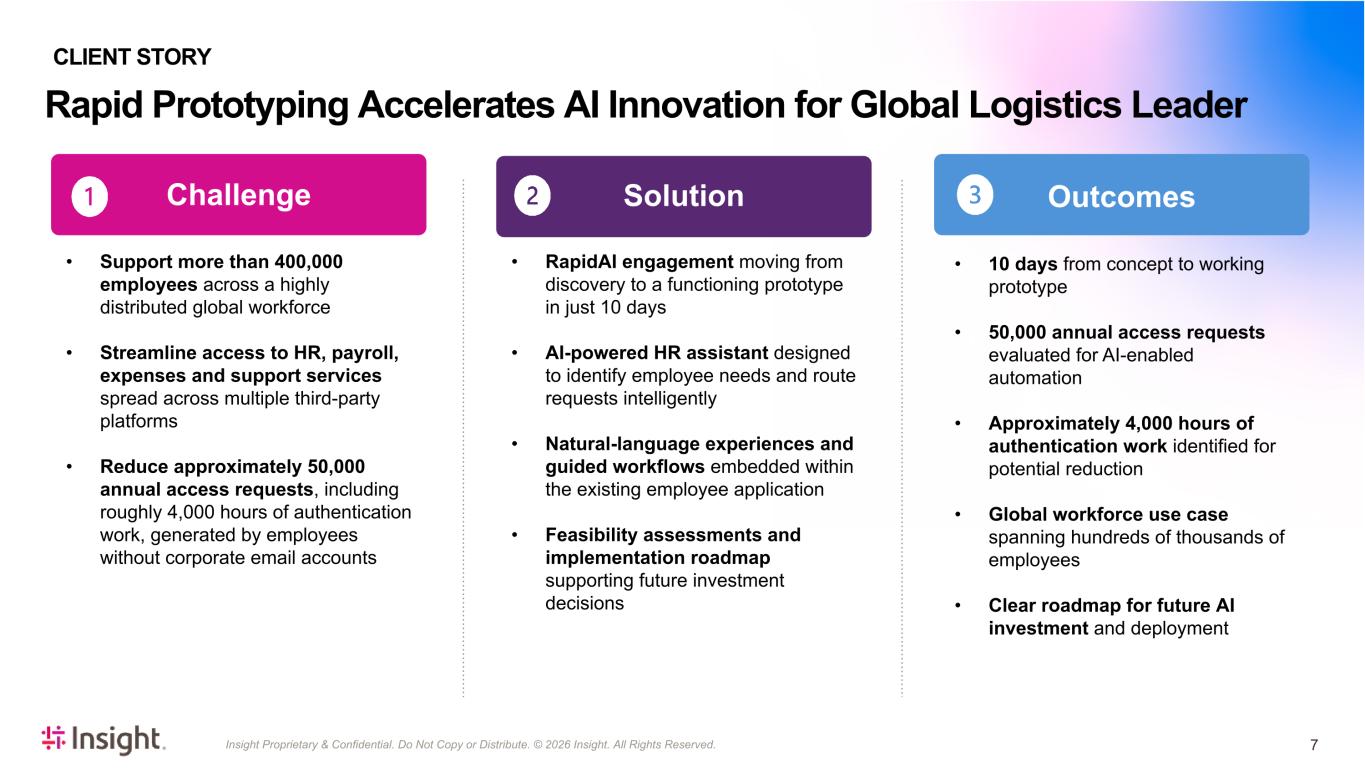
Insight Proprietary & Confidential. Do Not Copy or Distribute. © 2026 Insight. All Rights Reserved. 7 Challenge Solution Outcomes • RapidAI engagement moving from discovery to a functioning prototype in just 10 days • AI-powered HR assistant designed to identify employee needs and route requests intelligently • Natural-language experiences and guided workflows embedded within the existing employee application • Feasibility assessments and implementation roadmap supporting future investment decisions • 10 days from concept to working prototype • 50,000 annual access requests evaluated for AI-enabled automation • Approximately 4,000 hours of authentication work identified for potential reduction • Global workforce use case spanning hundreds of thousands of employees • Clear roadmap for future AI investment and deployment • Support more than 400,000 employees across a highly distributed global workforce • Streamline access to HR, payroll, expenses and support services spread across multiple third-party platforms • Reduce approximately 50,000 annual access requests, including roughly 4,000 hours of authentication work, generated by employees without corporate email accounts Rapid Prototyping Accelerates AI Innovation for Global Logistics Leader CLIENT STORY

Insight Proprietary & Confidential. Do Not Copy or Distribute. © 2026 Insight. All Rights Reserved. Employer Awards 8 – 2026 World's Best Employers – 2025 America’s Best Employers for Women – 2025 America's Best Employers for Company Culture – 2025 America's Best Employers for Tech Workers – 2025 America's Best Employers by State – Best Employers in Arizona Disability Index World's Top Disability Employer Phoenix Business Journal No. 9 | 2026 Arizona-based Public Companies 2025 Healthiest Employers Award Finalist International Great Place to Work No. 35 |2026 Best Workplaces in Canada No. 12 | 2026 Best Workplaces in Italy 2026 Best Workplaces for Mental Wellness in Canada 2026 Best Workplaces™ in Technology in Canada 2026 Best Workplaces Led by Women Best Workplaces in Quebec 2026 Philippines Best Workplaces™ in IT-BPM CRN Magazine No. 21 | 2026 Solution Provider 500 Elite 150 | 2026 Managed Solution Provider 500 2026 Tech Elite 250 Finalist | Best of the Channel - Best AI Solution Provider TIME Magazine No. 883 | 2026 America's Best Companies FORBES 2026 World's Best Employers No. 36 in IT IDC IDC CIO Awards Canada 2026 Dialogue Top 20 in Canada's Healthiest Workplaces Canada's Top 100 Employers Montreal's Top Employers 2026
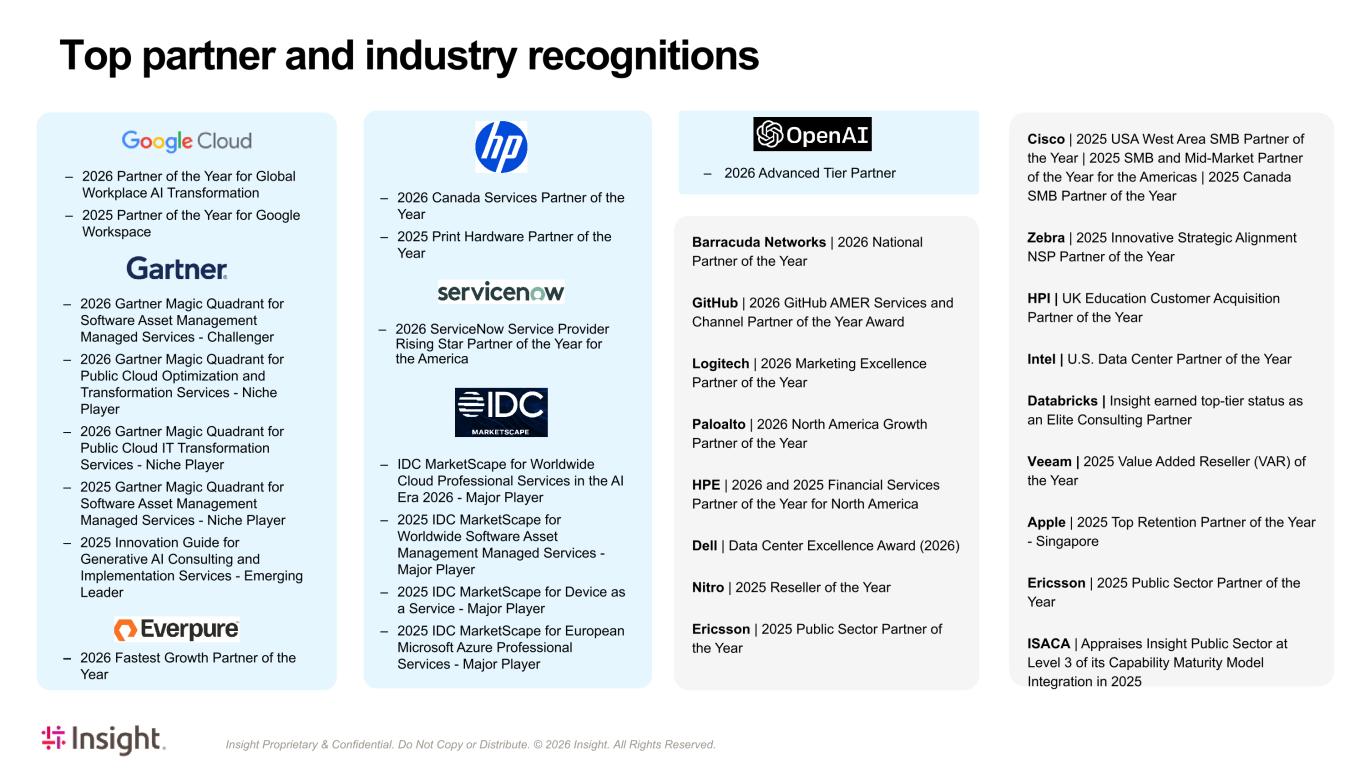
Insight Proprietary & Confidential. Do Not Copy or Distribute. © 2026 Insight. All Rights Reserved. Cisco | 2025 USA West Area SMB Partner of the Year | 2025 SMB and Mid-Market Partner of the Year for the Americas | 2025 Canada SMB Partner of the Year Zebra | 2025 Innovative Strategic Alignment NSP Partner of the Year HPI | UK Education Customer Acquisition Partner of the Year Intel | U.S. Data Center Partner of the Year Databricks | Insight earned top-tier status as an Elite Consulting Partner Veeam | 2025 Value Added Reseller (VAR) of the Year Apple | 2025 Top Retention Partner of the Year - Singapore Ericsson | 2025 Public Sector Partner of the Year ISACA | Appraises Insight Public Sector at Level 3 of its Capability Maturity Model Integration in 2025 Barracuda Networks | 2026 National Partner of the Year GitHub | 2026 GitHub AMER Services and Channel Partner of the Year Award Logitech | 2026 Marketing Excellence Partner of the Year Paloalto | 2026 North America Growth Partner of the Year HPE | 2026 and 2025 Financial Services Partner of the Year for North America Dell | Data Center Excellence Award (2026) Nitro | 2025 Reseller of the Year Ericsson | 2025 Public Sector Partner of the Year Top partner and industry recognitions – 2026 Partner of the Year for Global Workplace AI Transformation – 2025 Partner of the Year for Google Workspace – 2026 Gartner Magic Quadrant for Software Asset Management Managed Services - Challenger – 2026 Gartner Magic Quadrant for Public Cloud Optimization and Transformation Services - Niche Player – 2026 Gartner Magic Quadrant for Public Cloud IT Transformation Services - Niche Player – 2025 Gartner Magic Quadrant for Software Asset Management Managed Services - Niche Player – 2025 Innovation Guide for Generative AI Consulting and Implementation Services - Emerging Leader – IDC MarketScape for Worldwide Cloud Professional Services in the AI Era 2026 - Major Player – 2025 IDC MarketScape for Worldwide Software Asset Management Managed Services - Major Player – 2025 IDC MarketScape for Device as a Service - Major Player – 2025 IDC MarketScape for European Microsoft Azure Professional Services - Major Player – 2026 Canada Services Partner of the Year – 2025 Print Hardware Partner of the Year – 2026 Fastest Growth Partner of the Year – 2026 Advanced Tier Partner – 2026 ServiceNow Service Provider Rising Star Partner of the Year for the America
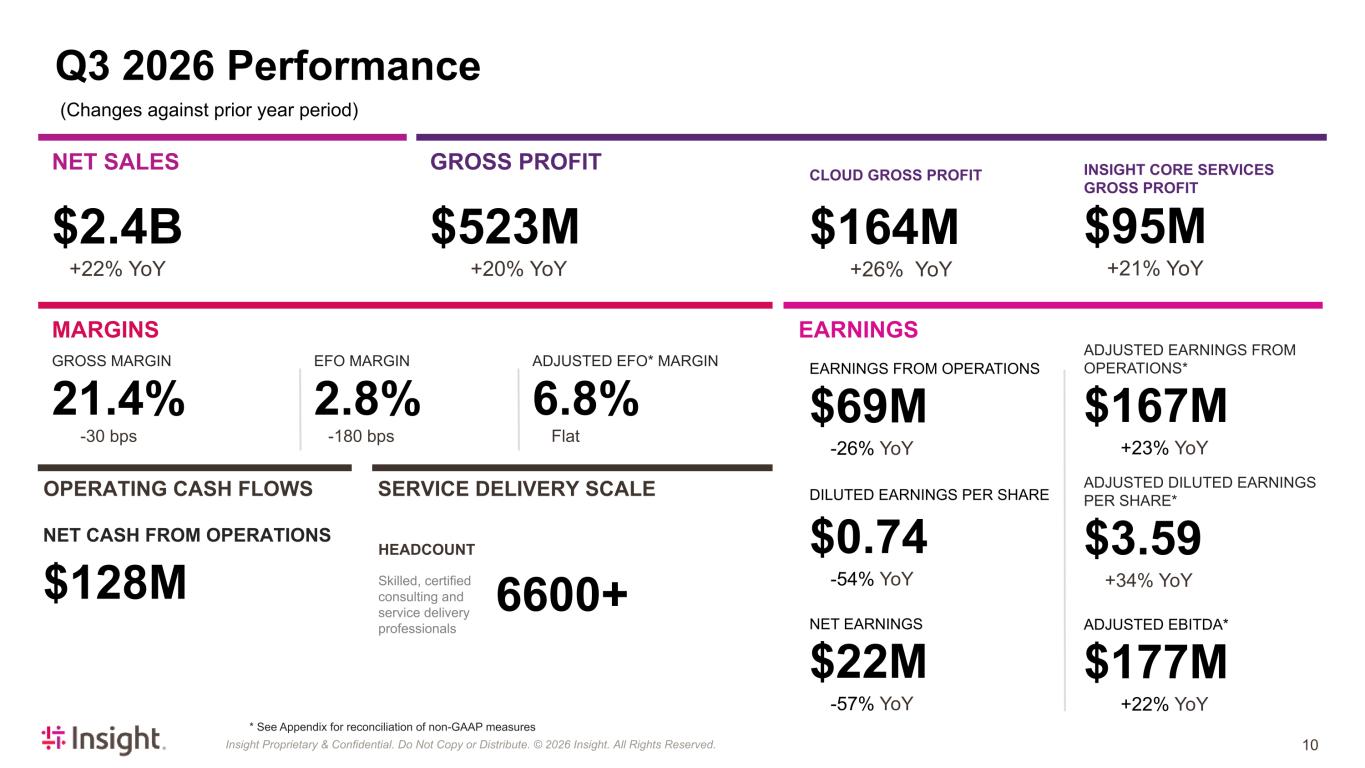
Insight Proprietary & Confidential. Do Not Copy or Distribute. © 2026 Insight. All Rights Reserved. Q3 2026 Performance (Changes against prior year period) * See Appendix for reconciliation of non-GAAP measures NET SALES $2.4B +22% YoY GROSS PROFIT $523M +20% YoY MARGINS GROSS MARGIN 21.4% -30 bps EFO MARGIN 2.8% -180 bps ADJUSTED EFO* MARGIN 6.8% Flat EARNINGS CLOUD GROSS PROFIT XD $164M +26% YoY INSIGHT CORE SERVICES GROSS PROFIT $95M +21% YoY EARNINGS FROM OPERATIONS EARNINGS FROM OPERATIONS X $69M -26% YoY DILUTED EARNINGS PER SHARE X $0.74 -54% YoY NET EARNINGS NET EARNINGS $22M -57% YoY ADJUSTED EARNINGS FROM OPERATIONS* $167M +23% YoY ADJUSTED DILUTED EARNINGS PER SHARE* $3.59 +34% YoY ADJUSTED EBITDA* $177M +22% YoY OPERATING CASH FLOWS NET CASH FROM OPERATIONS X $128M SERVICE DELIVERY SCALE HEADCOUNT Skilled, certified consulting and service delivery professionals 6600+ 10
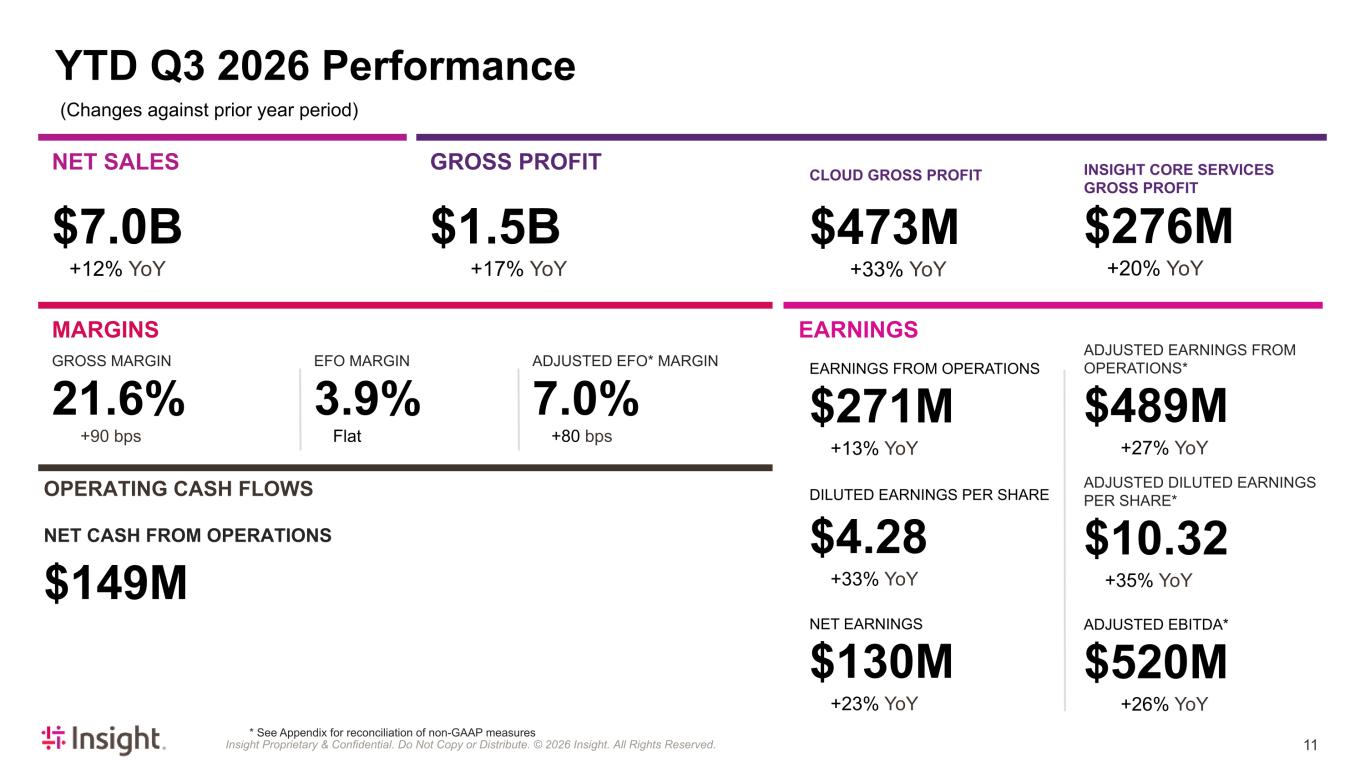
Insight Proprietary & Confidential. Do Not Copy or Distribute. © 2026 Insight. All Rights Reserved. YTD Q3 2026 Performance (Changes against prior year period) * See Appendix for reconciliation of non-GAAP measures NET SALES $7.0B +12% YoY GROSS PROFIT $1.5B +17% YoY MARGINS GROSS MARGIN 21.6% +90 bps EFO MARGIN 3.9% Flat ADJUSTED EFO* MARGIN 7.0% +80 bps EARNINGS CLOUD GROSS PROFIT XD $473M +33% YoY INSIGHT CORE SERVICES GROSS PROFIT $276M +20% YoY EARNINGS FROM OPERATIONS EARNINGS FROM OPERATIONS X $271M +13% YoY DILUTED EARNINGS PER SHARE X $4.28 +33% YoY NET EARNINGS NET EARNINGS $130M +23% YoY ADJUSTED EARNINGS FROM OPERATIONS* $489M +27% YoY ADJUSTED DILUTED EARNINGS PER SHARE* $10.32 +35% YoY ADJUSTED EBITDA* $520M +26% YoY NET CASH FROM OPERATIONS X $149M OPERATING CASH FLOWS 11
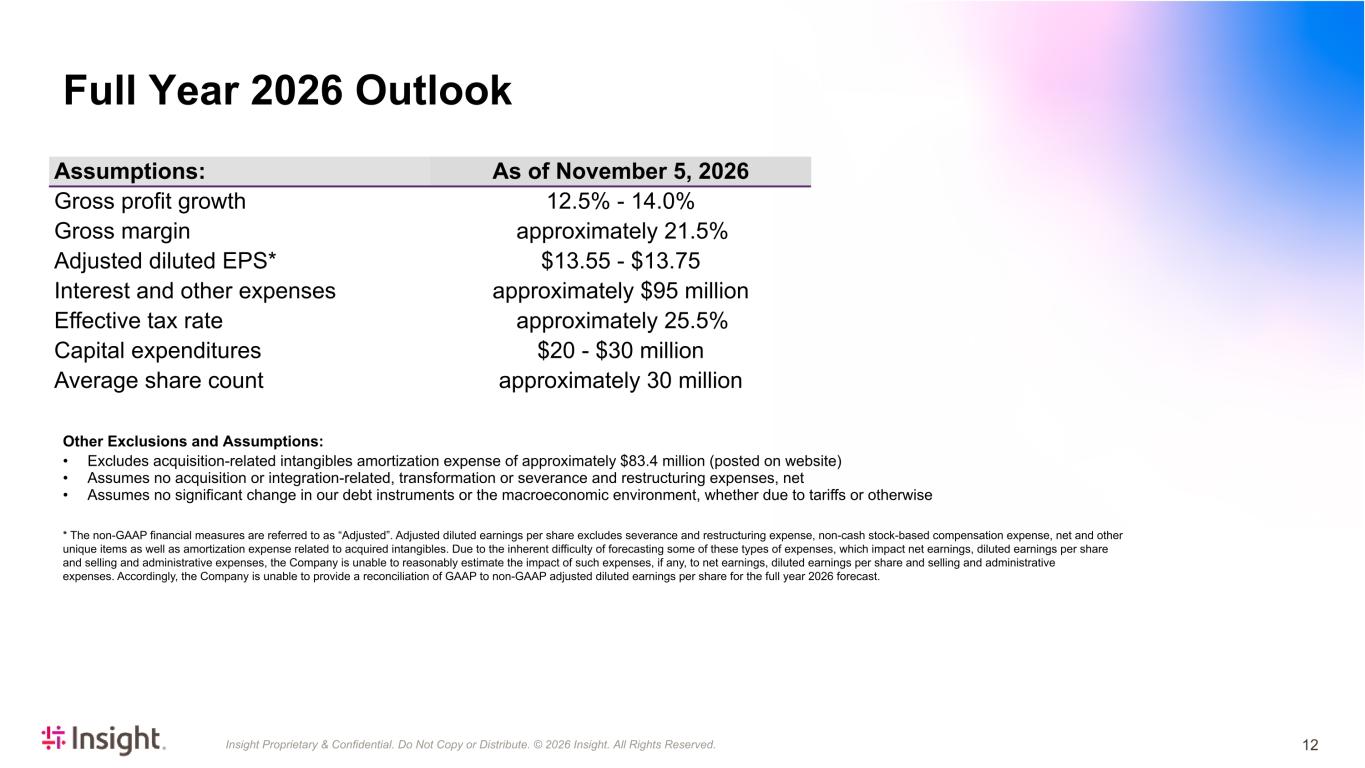
Insight Proprietary & Confidential. Do Not Copy or Distribute. © 2026 Insight. All Rights Reserved. Assumptions: As of November 5, 2026 Gross profit growth 12.5% - 14.0% Gross margin approximately 21.5% Adjusted diluted EPS* $13.55 - $13.75 Interest and other expenses approximately $95 million Effective tax rate approximately 25.5% Capital expenditures $20 - $30 million Average share count approximately 30 million Other Exclusions and Assumptions: • Excludes acquisition-related intangibles amortization expense of approximately $83.4 million (posted on website) • Assumes no acquisition or integration-related, transformation or severance and restructuring expenses, net • Assumes no significant change in our debt instruments or the macroeconomic environment, whether due to tariffs or otherwise * The non-GAAP financial measures are referred to as “Adjusted”. Adjusted diluted earnings per share excludes severance and restructuring expense, non-cash stock-based compensation expense, net and other unique items as well as amortization expense related to acquired intangibles. Due to the inherent difficulty of forecasting some of these types of expenses, which impact net earnings, diluted earnings per share and selling and administrative expenses, the Company is unable to reasonably estimate the impact of such expenses, if any, to net earnings, diluted earnings per share and selling and administrative expenses. Accordingly, the Company is unable to provide a reconciliation of GAAP to non-GAAP adjusted diluted earnings per share for the full year 2026 forecast. Full Year 2026 Outlook 12
Insight Proprietary & Confidential. Do Not Copy or Distribute. © 2026 Insight. All Rights Reserved. Appendix 13
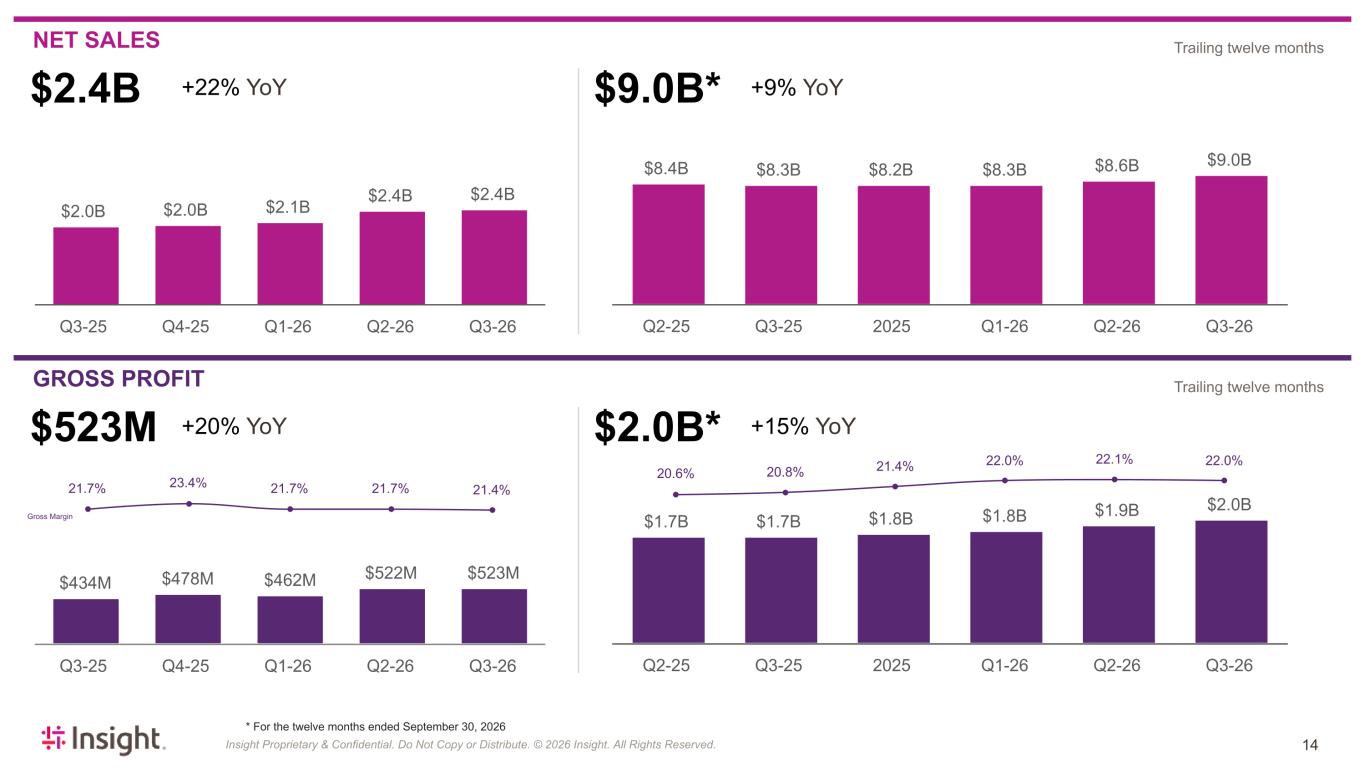
Insight Proprietary & Confidential. Do Not Copy or Distribute. © 2026 Insight. All Rights Reserved. NET SALES GROSS PROFIT * For the twelve months ended September 30, 2026 Trailing twelve months Trailing twelve months $2.4B +22% YoY $2.0B $2.0B $2.1B $2.4B $2.4B Q3-25 Q4-25 Q1-26 Q2-26 Q3-26 $8.4B $8.3B $8.2B $8.3B $8.6B $9.0B Q2-25 Q3-25 2025 Q1-26 Q2-26 Q3-26 $9.0B* +9% YoY $523M +20% YoY 21.7% 23.4% 21.7% 21.7% 21.4% $434M $478M $462M $522M $523M Q3-25 Q4-25 Q1-26 Q2-26 Q3-26 $2.0B* +15% YoY 20.6% 20.8% 21.4% 22.0% 22.1% 22.0% $1.7B $1.7B $1.8B $1.8B $1.9B $2.0B Q2-25 Q3-25 2025 Q1-26 Q2-26 Q3-26 Gross Margin 14
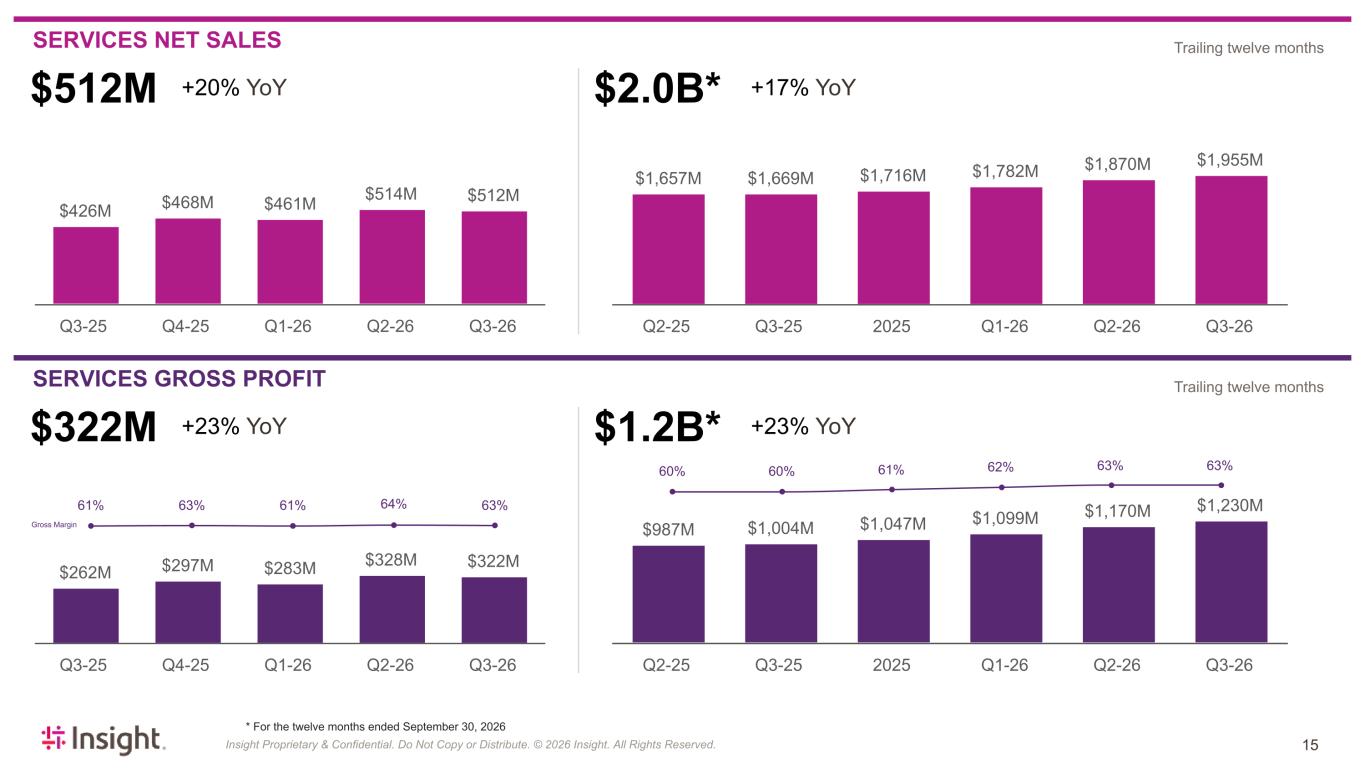
Insight Proprietary & Confidential. Do Not Copy or Distribute. © 2026 Insight. All Rights Reserved. Gross Margin SERVICES NET SALES SERVICES GROSS PROFIT * For the twelve months ended September 30, 2026 Trailing twelve months Trailing twelve months $512M +20% YoY $426M $468M $461M $514M $512M Q3-25 Q4-25 Q1-26 Q2-26 Q3-26 $1,657M $1,669M $1,716M $1,782M $1,870M $1,955M Q2-25 Q3-25 2025 Q1-26 Q2-26 Q3-26 $2.0B* +17% YoY $262M $297M $283M $328M $322M Q3-25 Q4-25 Q1-26 Q2-26 Q3-26 61% 63% 61% 64% 63% $322M +23% YoY $987M $1,004M $1,047M $1,099M $1,170M $1,230M Q2-25 Q3-25 2025 Q1-26 Q2-26 Q3-26 $1.2B* +23% YoY 60% 60% 61% 62% 63% 63% 15
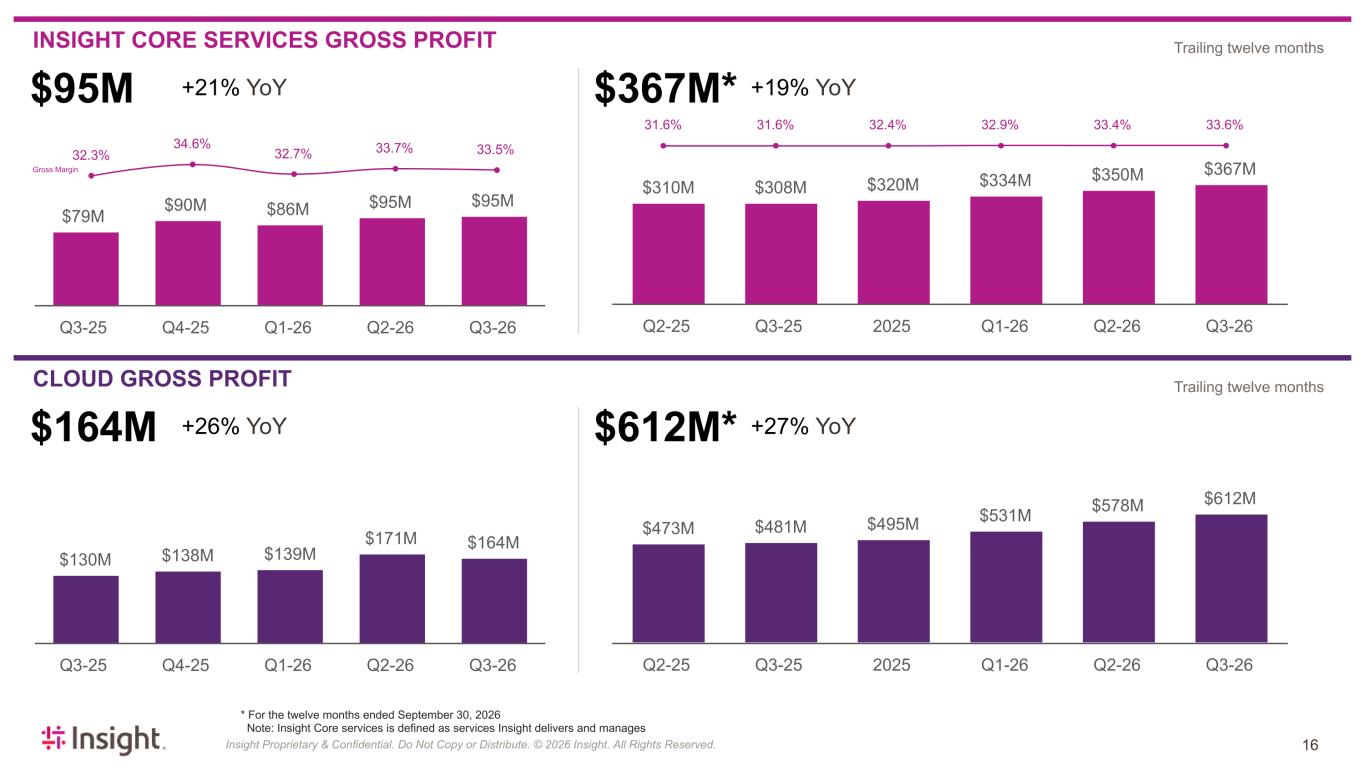
Insight Proprietary & Confidential. Do Not Copy or Distribute. © 2026 Insight. All Rights Reserved. INSIGHT CORE SERVICES GROSS PROFIT CLOUD GROSS PROFIT * For the twelve months ended September 30, 2026 Note: Insight Core services is defined as services Insight delivers and manages Trailing twelve months Trailing twelve months $79M $90M $86M $95M $95M Q3-25 Q4-25 Q1-26 Q2-26 Q3-26 32.3% 34.6% 32.7% 33.7% 33.5% $95M +21% YoY Gross Margin $310M $308M $320M $334M $350M $367M Q2-25 Q3-25 2025 Q1-26 Q2-26 Q3-26 31.6% 31.6% 32.4% 32.9% 33.4% 33.6% $367M* +19% YoY $130M $138M $139M $171M $164M Q3-25 Q4-25 Q1-26 Q2-26 Q3-26 $473M $481M $495M $531M $578M $612M Q2-25 Q3-25 2025 Q1-26 Q2-26 Q3-26 $164M +26% YoY $612M* +27% YoY 16
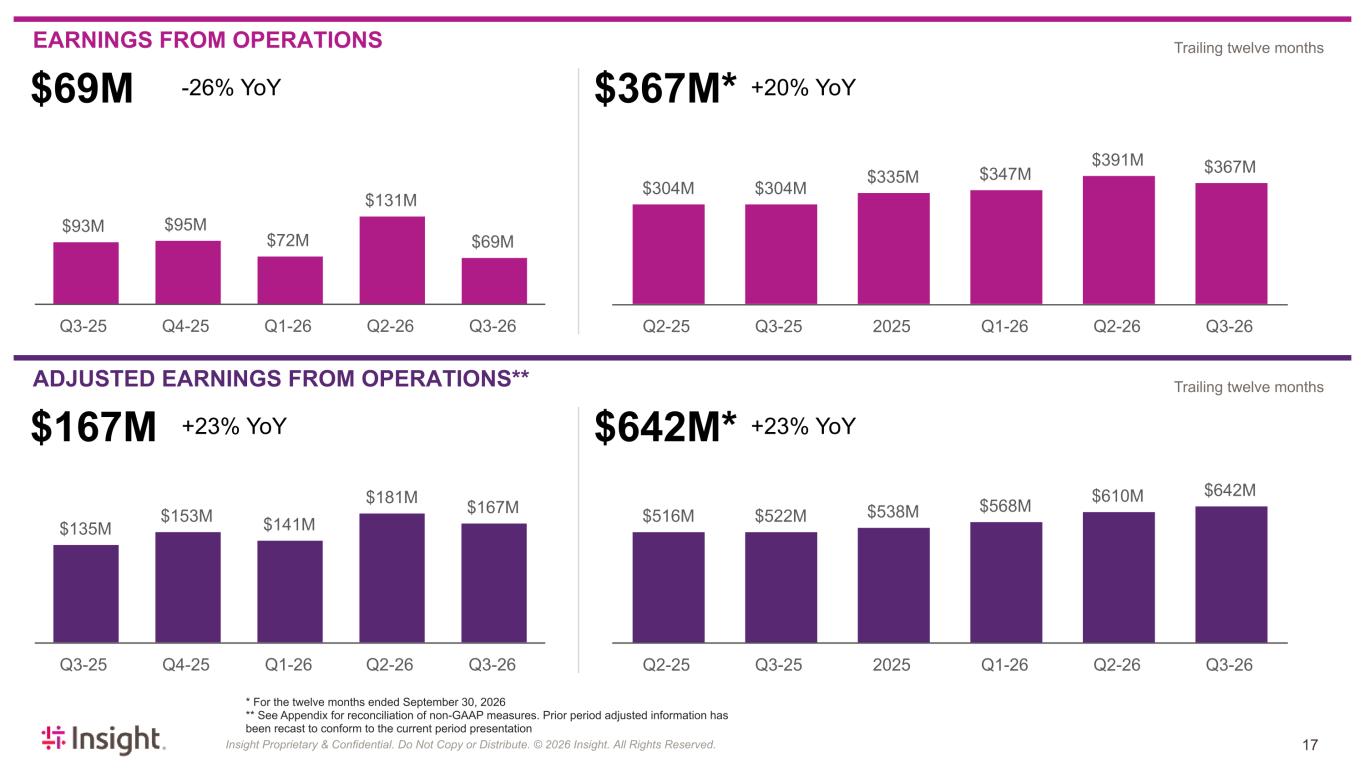
Insight Proprietary & Confidential. Do Not Copy or Distribute. © 2026 Insight. All Rights Reserved. EARNINGS FROM OPERATIONS ADJUSTED EARNINGS FROM OPERATIONS** * For the twelve months ended September 30, 2026 ** See Appendix for reconciliation of non-GAAP measures. Prior period adjusted information has been recast to conform to the current period presentation Trailing twelve months Trailing twelve months $93M $95M $72M $131M $69M Q3-25 Q4-25 Q1-26 Q2-26 Q3-26 $304M $304M $335M $347M $391M $367M Q2-25 Q3-25 2025 Q1-26 Q2-26 Q3-26 $69M -26% YoY $367M* +20% YoY $135M $153M $141M $181M $167M Q3-25 Q4-25 Q1-26 Q2-26 Q3-26 $167M +23% YoY $516M $522M $538M $568M $610M $642M Q2-25 Q3-25 2025 Q1-26 Q2-26 Q3-26 $642M* +23% YoY 17
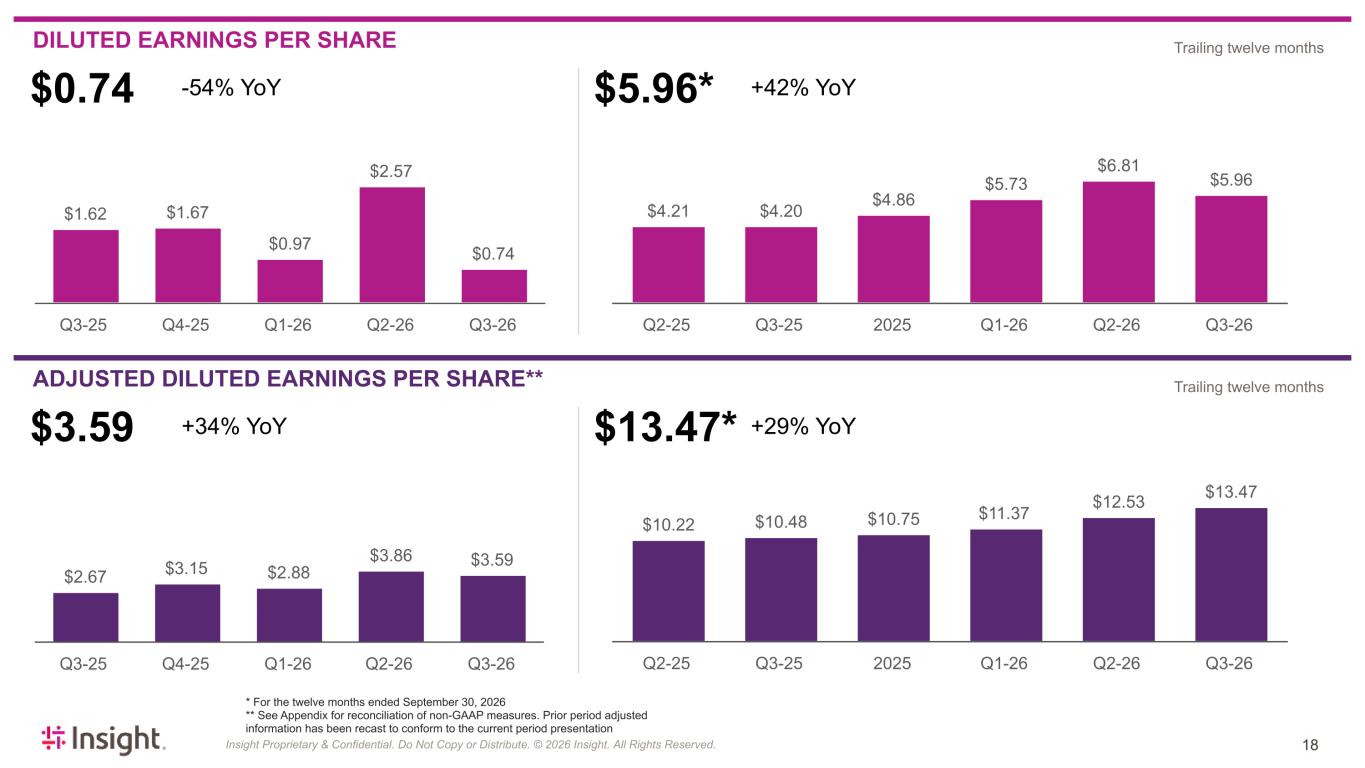
Insight Proprietary & Confidential. Do Not Copy or Distribute. © 2026 Insight. All Rights Reserved. DILUTED EARNINGS PER SHARE ADJUSTED DILUTED EARNINGS PER SHARE** * For the twelve months ended September 30, 2026 ** See Appendix for reconciliation of non-GAAP measures. Prior period adjusted information has been recast to conform to the current period presentation Trailing twelve months Trailing twelve months $1.62 $1.67 $0.97 $2.57 $0.74 Q3-25 Q4-25 Q1-26 Q2-26 Q3-26 $4.21 $4.20 $4.86 $5.73 $6.81 $5.96 Q2-25 Q3-25 2025 Q1-26 Q2-26 Q3-26 $2.67 $3.15 $2.88 $3.86 $3.59 Q3-25 Q4-25 Q1-26 Q2-26 Q3-26 $10.22 $10.48 $10.75 $11.37 $12.53 $13.47 Q2-25 Q3-25 2025 Q1-26 Q2-26 Q3-26 $0.74 -54% YoY $5.96* +42% YoY $3.59 +34% YoY $13.47* +29% YoY 18
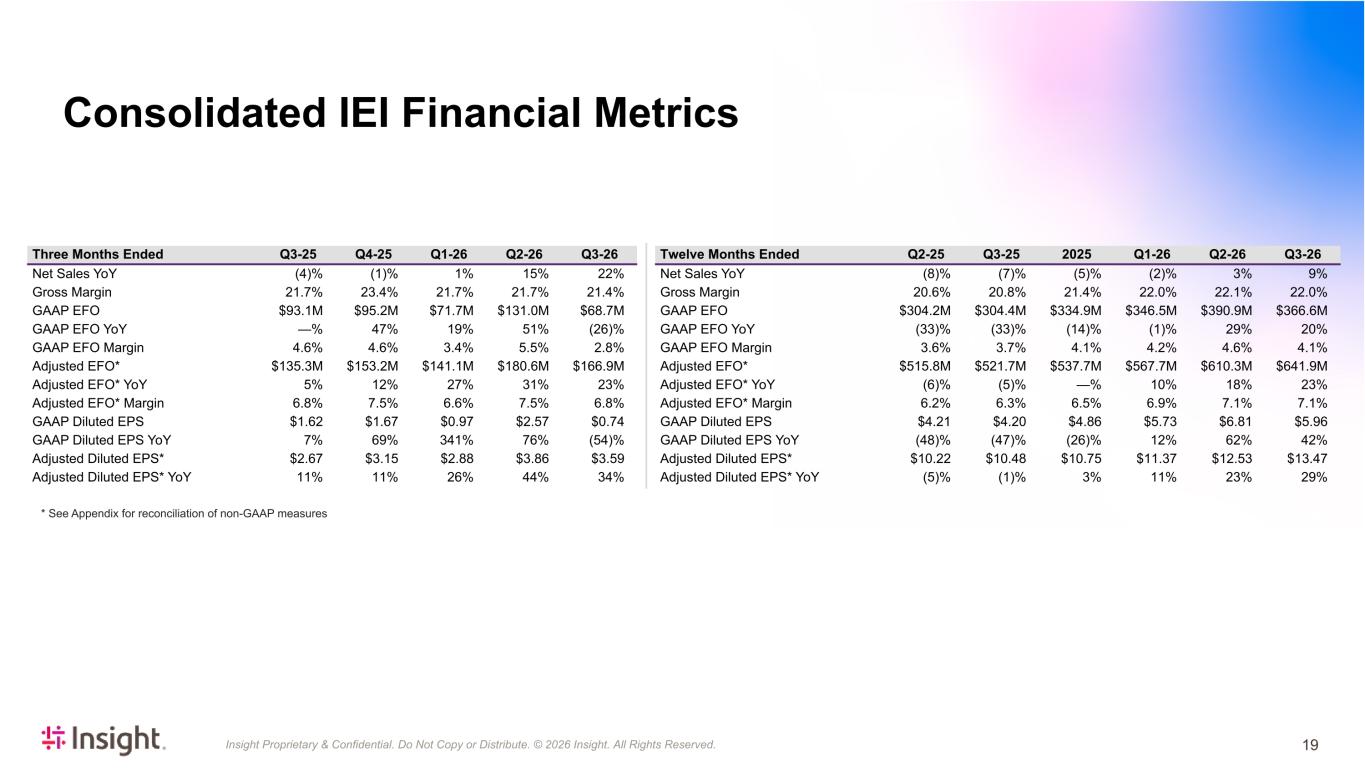
Insight Proprietary & Confidential. Do Not Copy or Distribute. © 2026 Insight. All Rights Reserved. * See Appendix for reconciliation of non-GAAP measures Three Months Ended Q3-25 Q4-25 Q1-26 Q2-26 Q3-26 Net Sales YoY (4) % (1) % 1 % 15 % 22 % Gross Margin 21.7 % 23.4 % 21.7 % 21.7 % 21.4 % GAAP EFO $93.1M $95.2M $71.7M $131.0M $68.7M GAAP EFO YoY — % 47 % 19 % 51 % (26) % GAAP EFO Margin 4.6 % 4.6 % 3.4 % 5.5 % 2.8 % Adjusted EFO* $135.3M $153.2M $141.1M $180.6M $166.9M Adjusted EFO* YoY 5 % 12 % 27 % 31 % 23 % Adjusted EFO* Margin 6.8 % 7.5 % 6.6 % 7.5 % 6.8 % GAAP Diluted EPS $1.62 $1.67 $0.97 $2.57 $0.74 GAAP Diluted EPS YoY 7 % 69 % 341 % 76 % (54) % Adjusted Diluted EPS* $2.67 $3.15 $2.88 $3.86 $3.59 Adjusted Diluted EPS* YoY 11 % 11 % 26 % 44 % 34 % Twelve Months Ended Q2-25 Q3-25 2025 Q1-26 Q2-26 Q3-26 Net Sales YoY (8) % (7) % (5) % (2) % 3 % 9 % Gross Margin 20.6 % 20.8 % 21.4 % 22.0 % 22.1 % 22.0 % GAAP EFO $304.2M $304.4M $334.9M $346.5M $390.9M $366.6M GAAP EFO YoY (33) % (33) % (14) % (1) % 29 % 20 % GAAP EFO Margin 3.6 % 3.7 % 4.1 % 4.2 % 4.6 % 4.1 % Adjusted EFO* $515.8M $521.7M $537.7M $567.7M $610.3M $641.9M Adjusted EFO* YoY (6) % (5) % — % 10 % 18 % 23 % Adjusted EFO* Margin 6.2 % 6.3 % 6.5 % 6.9 % 7.1 % 7.1 % GAAP Diluted EPS $4.21 $4.20 $4.86 $5.73 $6.81 $5.96 GAAP Diluted EPS YoY (48) % (47) % (26) % 12 % 62 % 42 % Adjusted Diluted EPS* $10.22 $10.48 $10.75 $11.37 $12.53 $13.47 Adjusted Diluted EPS* YoY (5) % (1) % 3 % 11 % 23 % 29 % Consolidated IEI Financial Metrics 19
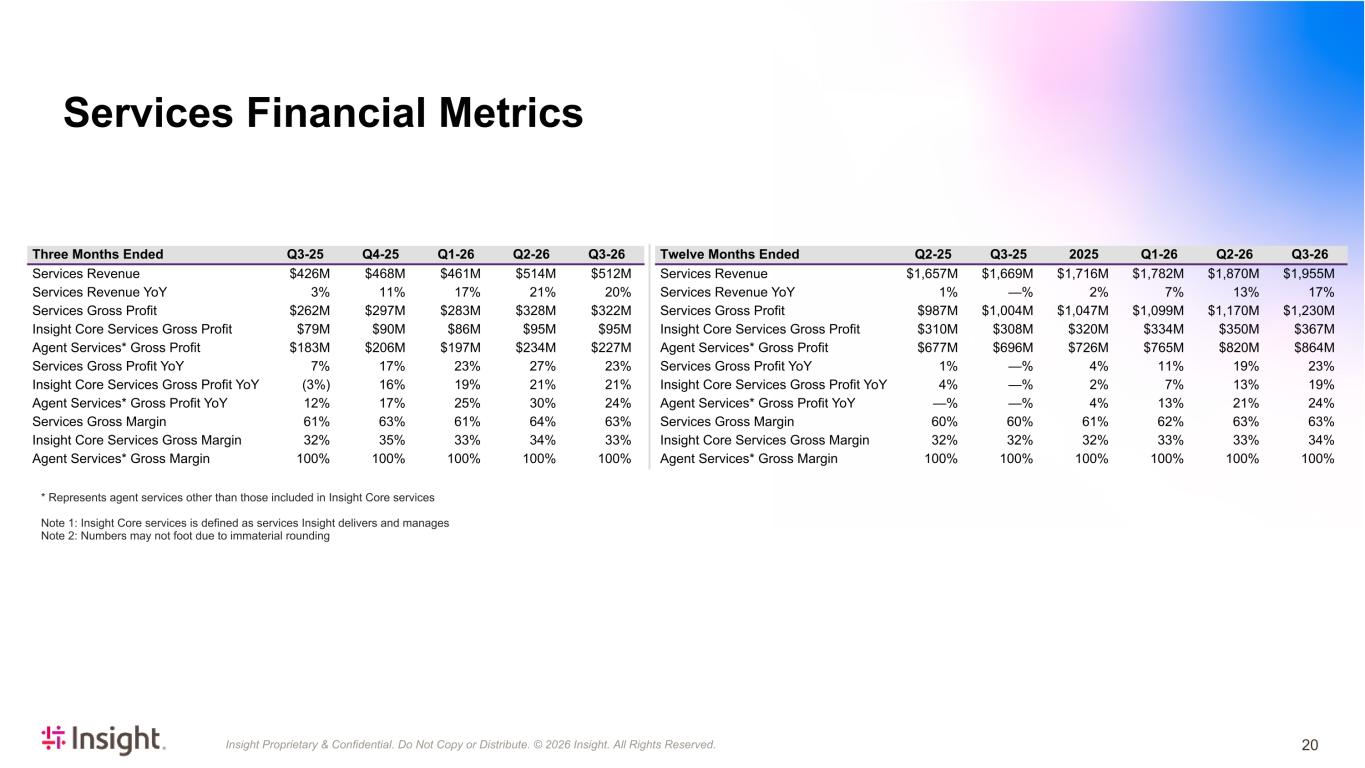
Insight Proprietary & Confidential. Do Not Copy or Distribute. © 2026 Insight. All Rights Reserved. Three Months Ended Q3-25 Q4-25 Q1-26 Q2-26 Q3-26 Services Revenue $426M $468M $461M $514M $512M Services Revenue YoY 3% 11% 17% 21% 20% Services Gross Profit $262M $297M $283M $328M $322M Insight Core Services Gross Profit $79M $90M $86M $95M $95M Agent Services* Gross Profit $183M $206M $197M $234M $227M Services Gross Profit YoY 7% 17% 23% 27% 23% Insight Core Services Gross Profit YoY (3%) 16% 19% 21% 21% Agent Services* Gross Profit YoY 12% 17% 25% 30% 24% Services Gross Margin 61% 63% 61% 64% 63% Insight Core Services Gross Margin 32% 35% 33% 34% 33% Agent Services* Gross Margin 100% 100% 100% 100% 100% Twelve Months Ended Q2-25 Q3-25 2025 Q1-26 Q2-26 Q3-26 Services Revenue $1,657M $1,669M $1,716M $1,782M $1,870M $1,955M Services Revenue YoY 1% —% 2% 7% 13% 17% Services Gross Profit $987M $1,004M $1,047M $1,099M $1,170M $1,230M Insight Core Services Gross Profit $310M $308M $320M $334M $350M $367M Agent Services* Gross Profit $677M $696M $726M $765M $820M $864M Services Gross Profit YoY 1% —% 4% 11% 19% 23% Insight Core Services Gross Profit YoY 4% —% 2% 7% 13% 19% Agent Services* Gross Profit YoY —% —% 4% 13% 21% 24% Services Gross Margin 60% 60% 61% 62% 63% 63% Insight Core Services Gross Margin 32% 32% 32% 33% 33% 34% Agent Services* Gross Margin 100% 100% 100% 100% 100% 100% * Represents agent services other than those included in Insight Core services Note 1: Insight Core services is defined as services Insight delivers and manages Note 2: Numbers may not foot due to immaterial rounding Services Financial Metrics 20
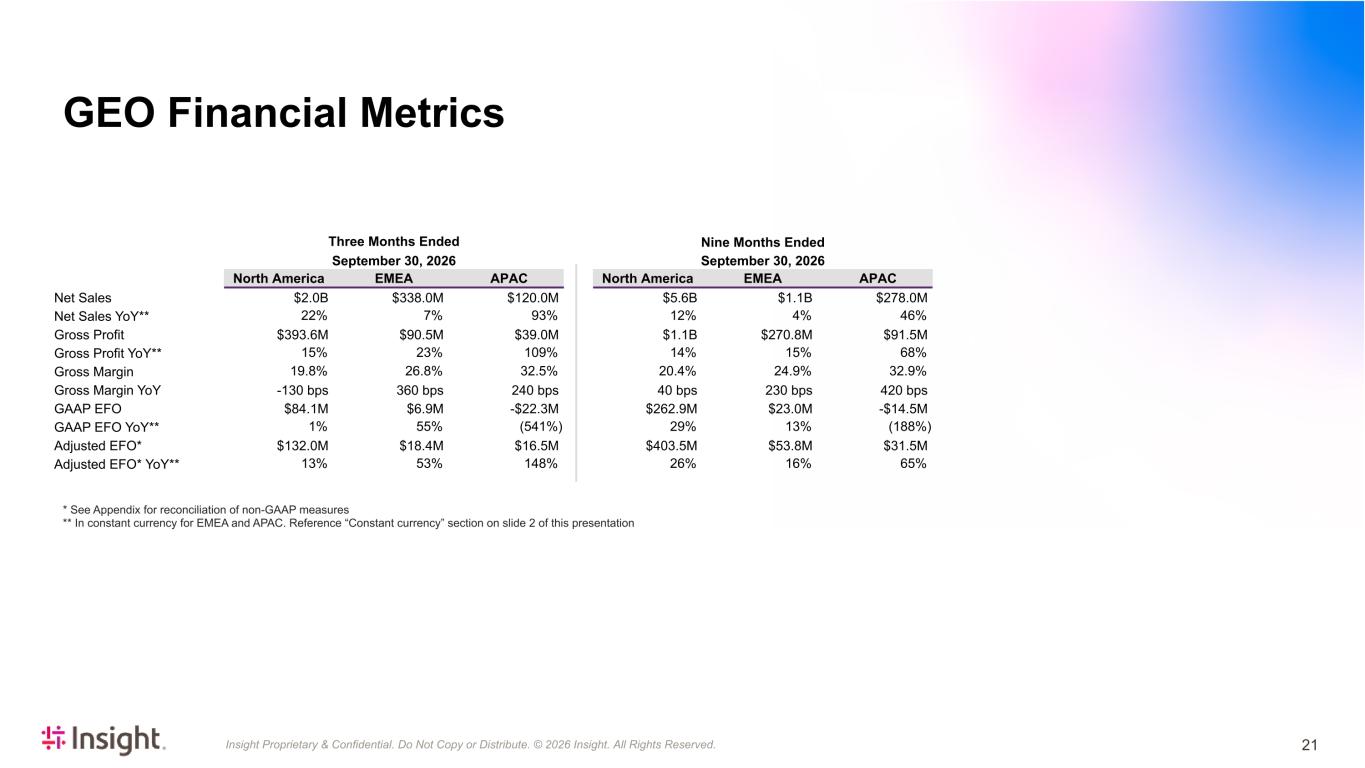
Insight Proprietary & Confidential. Do Not Copy or Distribute. © 2026 Insight. All Rights Reserved. * See Appendix for reconciliation of non-GAAP measures ** In constant currency for EMEA and APAC. Reference “Constant currency” section on slide 2 of this presentation Three Months Ended September 30, 2026 North America EMEA APAC Net Sales $2.0B $338.0M $120.0M Net Sales YoY** 22% 7% 93% Gross Profit $393.6M $90.5M $39.0M Gross Profit YoY** 15% 23% 109% Gross Margin 19.8% 26.8% 32.5% Gross Margin YoY -130 bps 360 bps 240 bps GAAP EFO $84.1M $6.9M -$22.3M GAAP EFO YoY** 1% 55% (541%) Adjusted EFO* $132.0M $18.4M $16.5M Adjusted EFO* YoY** 13% 53% 148% GEO Financial Metrics 21 Nine Months Ended September 30, 2026 North America EMEA APAC $5.6B $1.1B $278.0M 12% 4% 46% $1.1B $270.8M $91.5M 14% 15% 68% 20.4% 24.9% 32.9% 40 bps 230 bps 420 bps $262.9M $23.0M -$14.5M 29% 13% (188%) $403.5M $53.8M $31.5M 26% 16% 65%
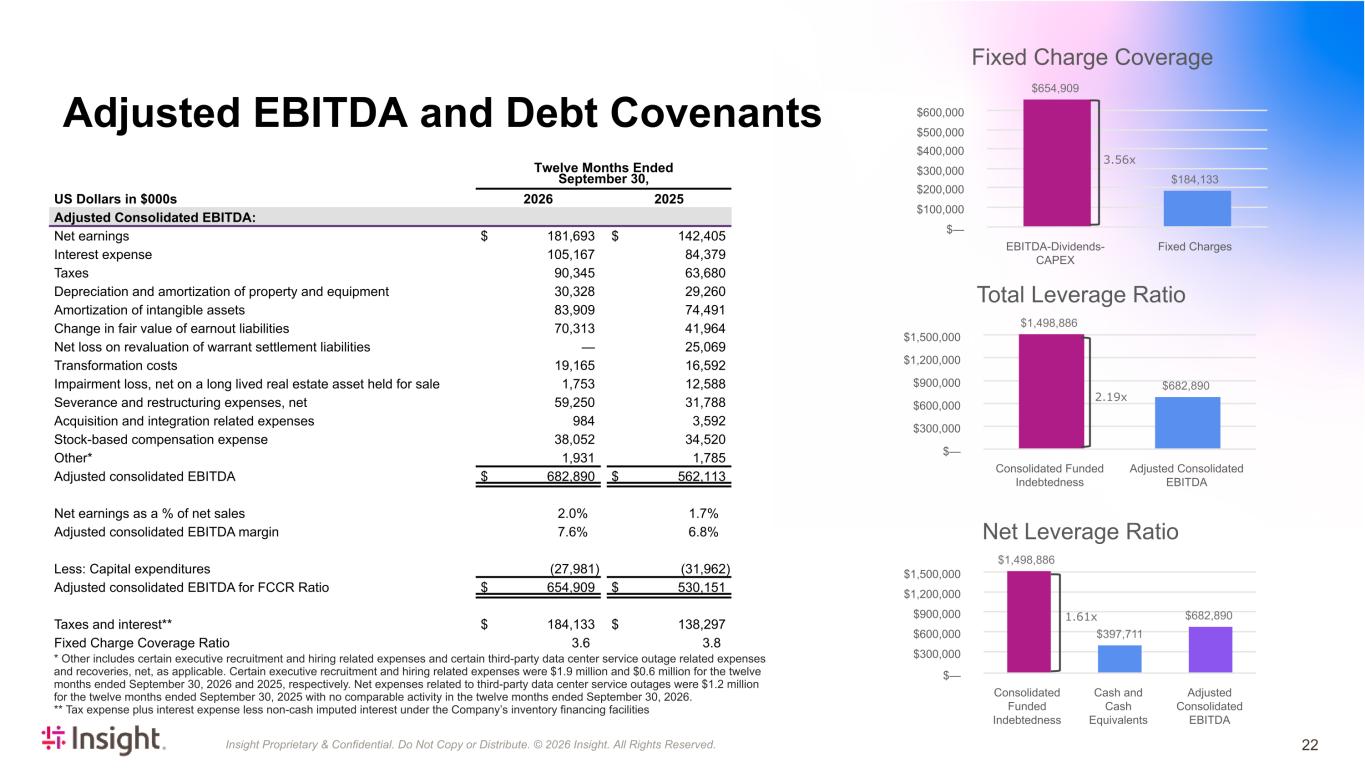
Insight Proprietary & Confidential. Do Not Copy or Distribute. © 2026 Insight. All Rights Reserved. Adjusted EBITDA and Debt Covenants Twelve Months Ended September 30, US Dollars in $000s 2026 2025 Adjusted Consolidated EBITDA: Net earnings $ 181,693 $ 142,405 Interest expense 105,167 84,379 Taxes 90,345 63,680 Depreciation and amortization of property and equipment 30,328 29,260 Amortization of intangible assets 83,909 74,491 Change in fair value of earnout liabilities 70,313 41,964 Net loss on revaluation of warrant settlement liabilities — 25,069 Transformation costs 19,165 16,592 Impairment loss, net on a long lived real estate asset held for sale 1,753 12,588 Severance and restructuring expenses, net 59,250 31,788 Acquisition and integration related expenses 984 3,592 Stock-based compensation expense 38,052 34,520 Other* 1,931 1,785 Adjusted consolidated EBITDA $ 682,890 $ 562,113 Net earnings as a % of net sales 2.0 % 1.7 % Adjusted consolidated EBITDA margin 7.6 % 6.8 % Less: Capital expenditures (27,981) (31,962) Adjusted consolidated EBITDA for FCCR Ratio $ 654,909 $ 530,151 Taxes and interest** $ 184,133 $ 138,297 Fixed Charge Coverage Ratio 3.6 3.8 Fixed Charge Coverage $654,909 $184,133 EBITDA-Dividends- CAPEX Fixed Charges $— $100,000 $200,000 $300,000 $400,000 $500,000 $600,000 Total Leverage Ratio $1,498,886 $682,890 Consolidated Funded Indebtedness Adjusted Consolidated EBITDA $— $300,000 $600,000 $900,000 $1,200,000 $1,500,000 * Other includes certain executive recruitment and hiring related expenses and certain third-party data center service outage related expenses and recoveries, net, as applicable. Certain executive recruitment and hiring related expenses were $1.9 million and $0.6 million for the twelve months ended September 30, 2026 and 2025, respectively. Net expenses related to third-party data center service outages were $1.2 million for the twelve months ended September 30, 2025 with no comparable activity in the twelve months ended September 30, 2026. ** Tax expense plus interest expense less non-cash imputed interest under the Company’s inventory financing facilities 3.56x 2.19x 22 Net Leverage Ratio $1,498,886 $397,711 $682,890 Consolidated Funded Indebtedness Cash and Cash Equivalents Adjusted Consolidated EBITDA $— $300,000 $600,000 $900,000 $1,200,000 $1,500,000 1.61x
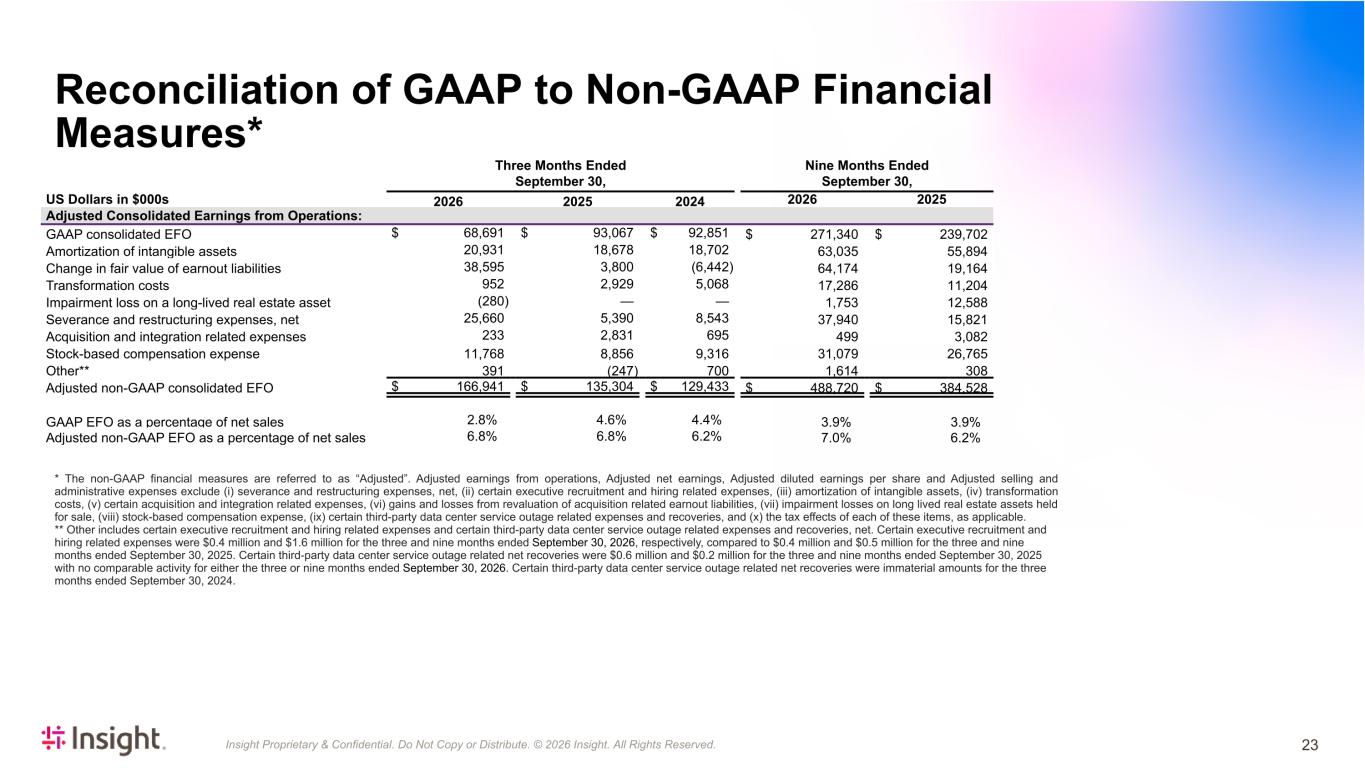
Insight Proprietary & Confidential. Do Not Copy or Distribute. © 2026 Insight. All Rights Reserved. Three Months Ended September 30, Nine Months Ended September 30, US Dollars in $000s 2026 2025 2024 2026 2025 Adjusted Consolidated Earnings from Operations: GAAP consolidated EFO $ 68,691 $ 93,067 $ 92,851 $ 271,340 $ 239,702 Amortization of intangible assets 20,931 18,678 18,702 63,035 55,894 Change in fair value of earnout liabilities 38,595 3,800 (6,442) 64,174 19,164 Transformation costs 952 2,929 5,068 17,286 11,204 Impairment loss on a long-lived real estate asset (280) — — 1,753 12,588 Severance and restructuring expenses, net 25,660 5,390 8,543 37,940 15,821 Acquisition and integration related expenses 233 2,831 695 499 3,082 Stock-based compensation expense 11,768 8,856 9,316 31,079 26,765 Other** 391 (247) 700 1,614 308 Adjusted non-GAAP consolidated EFO $ 166,941 $ 135,304 $ 129,433 $ 488,720 $ 384,528 GAAP EFO as a percentage of net sales 2.8 % 4.6 % 4.4 % 3.9 % 3.9 % Adjusted non-GAAP EFO as a percentage of net sales 6.8 % 6.8 % 6.2 % 7.0 % 6.2 % * The non-GAAP financial measures are referred to as “Adjusted”. Adjusted earnings from operations, Adjusted net earnings, Adjusted diluted earnings per share and Adjusted selling and administrative expenses exclude (i) severance and restructuring expenses, net, (ii) certain executive recruitment and hiring related expenses, (iii) amortization of intangible assets, (iv) transformation costs, (v) certain acquisition and integration related expenses, (vi) gains and losses from revaluation of acquisition related earnout liabilities, (vii) impairment losses on long lived real estate assets held for sale, (viii) stock-based compensation expense, (ix) certain third-party data center service outage related expenses and recoveries, and (x) the tax effects of each of these items, as applicable. ** Other includes certain executive recruitment and hiring related expenses and certain third-party data center service outage related expenses and recoveries, net. Certain executive recruitment and hiring related expenses were $0.4 million and $1.6 million for the three and nine months ended September 30, 2026, respectively, compared to $0.4 million and $0.5 million for the three and nine months ended September 30, 2025. Certain third-party data center service outage related net recoveries were $0.6 million and $0.2 million for the three and nine months ended September 30, 2025 with no comparable activity for either the three or nine months ended September 30, 2026. Certain third-party data center service outage related net recoveries were immaterial amounts for the three months ended September 30, 2024. Reconciliation of GAAP to Non-GAAP Financial Measures* 23
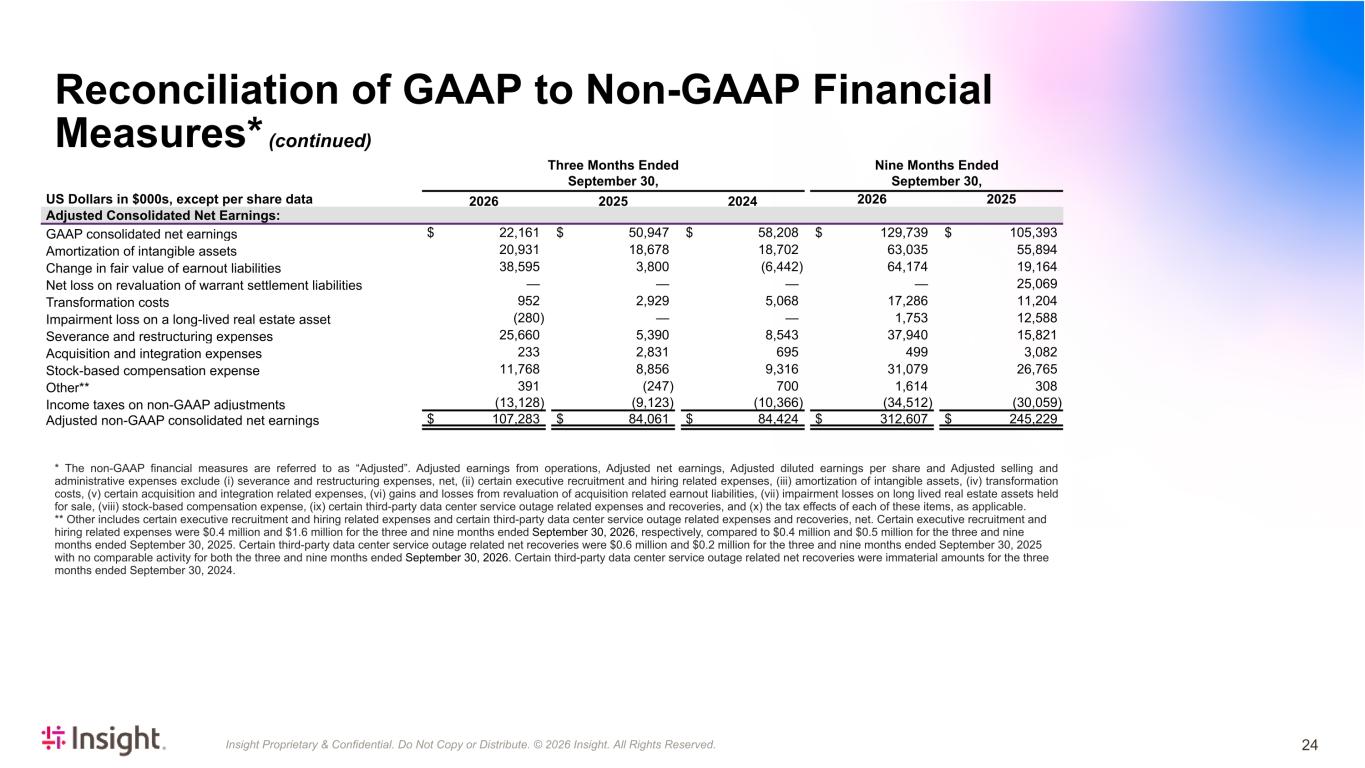
Insight Proprietary & Confidential. Do Not Copy or Distribute. © 2026 Insight. All Rights Reserved. Three Months Ended September 30, Nine Months Ended September 30, US Dollars in $000s, except per share data 2026 2025 2024 2026 2025 Adjusted Consolidated Net Earnings: GAAP consolidated net earnings $ 22,161 $ 50,947 $ 58,208 $ 129,739 $ 105,393 Amortization of intangible assets 20,931 18,678 18,702 63,035 55,894 Change in fair value of earnout liabilities 38,595 3,800 (6,442) 64,174 19,164 Net loss on revaluation of warrant settlement liabilities — — — — 25,069 Transformation costs 952 2,929 5,068 17,286 11,204 Impairment loss on a long-lived real estate asset (280) — — 1,753 12,588 Severance and restructuring expenses 25,660 5,390 8,543 37,940 15,821 Acquisition and integration expenses 233 2,831 695 499 3,082 Stock-based compensation expense 11,768 8,856 9,316 31,079 26,765 Other** 391 (247) 700 1,614 308 Income taxes on non-GAAP adjustments (13,128) (9,123) (10,366) (34,512) (30,059) Adjusted non-GAAP consolidated net earnings $ 107,283 $ 84,061 $ 84,424 $ 312,607 $ 245,229 * The non-GAAP financial measures are referred to as “Adjusted”. Adjusted earnings from operations, Adjusted net earnings, Adjusted diluted earnings per share and Adjusted selling and administrative expenses exclude (i) severance and restructuring expenses, net, (ii) certain executive recruitment and hiring related expenses, (iii) amortization of intangible assets, (iv) transformation costs, (v) certain acquisition and integration related expenses, (vi) gains and losses from revaluation of acquisition related earnout liabilities, (vii) impairment losses on long lived real estate assets held for sale, (viii) stock-based compensation expense, (ix) certain third-party data center service outage related expenses and recoveries, and (x) the tax effects of each of these items, as applicable. ** Other includes certain executive recruitment and hiring related expenses and certain third-party data center service outage related expenses and recoveries, net. Certain executive recruitment and hiring related expenses were $0.4 million and $1.6 million for the three and nine months ended September 30, 2026, respectively, compared to $0.4 million and $0.5 million for the three and nine months ended September 30, 2025. Certain third-party data center service outage related net recoveries were $0.6 million and $0.2 million for the three and nine months ended September 30, 2025 with no comparable activity for both the three and nine months ended September 30, 2026. Certain third-party data center service outage related net recoveries were immaterial amounts for the three months ended September 30, 2024. Reconciliation of GAAP to Non-GAAP Financial Measures* (continued) 24
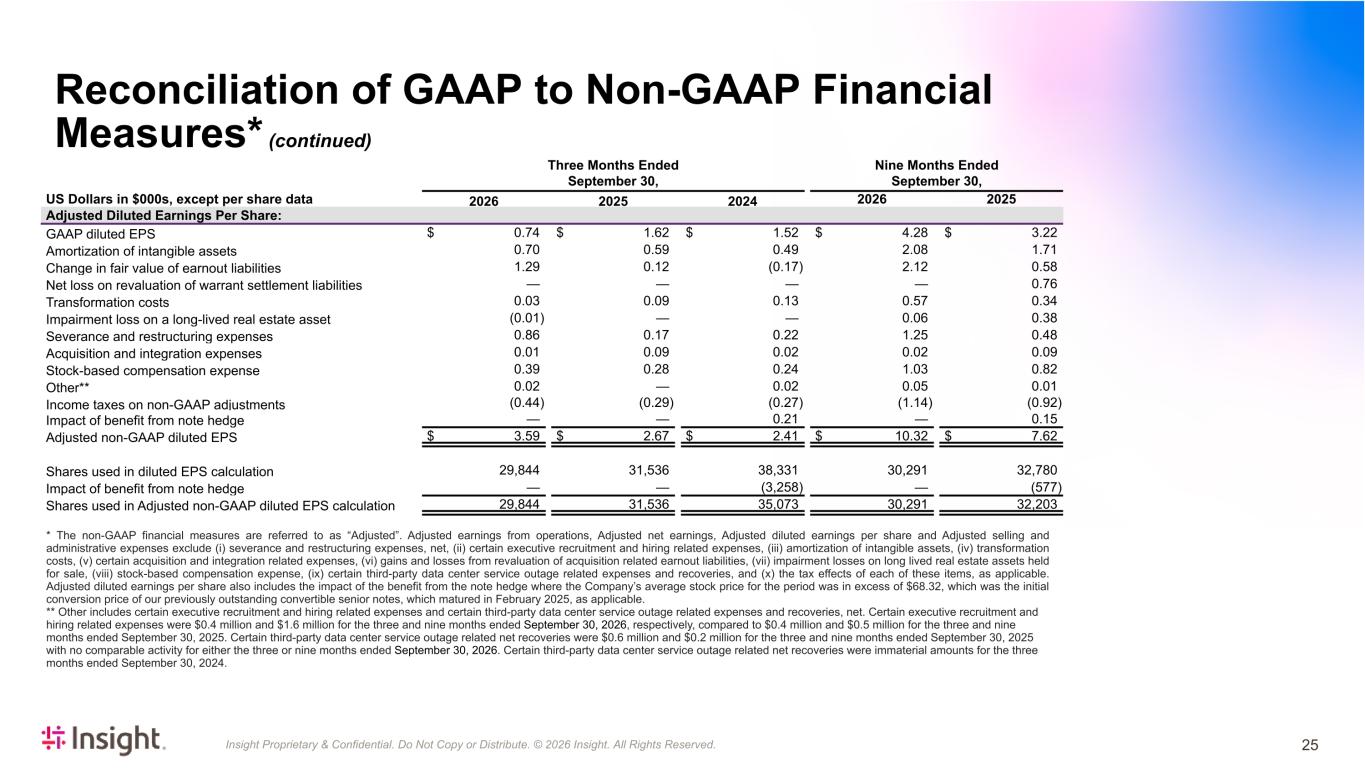
Insight Proprietary & Confidential. Do Not Copy or Distribute. © 2026 Insight. All Rights Reserved. Three Months Ended September 30, Nine Months Ended September 30, US Dollars in $000s, except per share data 2026 2025 2024 2026 2025 Adjusted Diluted Earnings Per Share: GAAP diluted EPS $ 0.74 $ 1.62 $ 1.52 $ 4.28 $ 3.22 Amortization of intangible assets 0.70 0.59 0.49 2.08 1.71 Change in fair value of earnout liabilities 1.29 0.12 (0.17) 2.12 0.58 Net loss on revaluation of warrant settlement liabilities — — — — 0.76 Transformation costs 0.03 0.09 0.13 0.57 0.34 Impairment loss on a long-lived real estate asset (0.01) — — 0.06 0.38 Severance and restructuring expenses 0.86 0.17 0.22 1.25 0.48 Acquisition and integration expenses 0.01 0.09 0.02 0.02 0.09 Stock-based compensation expense 0.39 0.28 0.24 1.03 0.82 Other** 0.02 — 0.02 0.05 0.01 Income taxes on non-GAAP adjustments (0.44) (0.29) (0.27) (1.14) (0.92) Impact of benefit from note hedge — — 0.21 — 0.15 Adjusted non-GAAP diluted EPS $ 3.59 $ 2.67 $ 2.41 $ 10.32 $ 7.62 Shares used in diluted EPS calculation 29,844 31,536 38,331 30,291 32,780 Impact of benefit from note hedge — — (3,258) — (577) Shares used in Adjusted non-GAAP diluted EPS calculation 29,844 31,536 35,073 30,291 32,203 * The non-GAAP financial measures are referred to as “Adjusted”. Adjusted earnings from operations, Adjusted net earnings, Adjusted diluted earnings per share and Adjusted selling and administrative expenses exclude (i) severance and restructuring expenses, net, (ii) certain executive recruitment and hiring related expenses, (iii) amortization of intangible assets, (iv) transformation costs, (v) certain acquisition and integration related expenses, (vi) gains and losses from revaluation of acquisition related earnout liabilities, (vii) impairment losses on long lived real estate assets held for sale, (viii) stock-based compensation expense, (ix) certain third-party data center service outage related expenses and recoveries, and (x) the tax effects of each of these items, as applicable. Adjusted diluted earnings per share also includes the impact of the benefit from the note hedge where the Company’s average stock price for the period was in excess of $68.32, which was the initial conversion price of our previously outstanding convertible senior notes, which matured in February 2025, as applicable. ** Other includes certain executive recruitment and hiring related expenses and certain third-party data center service outage related expenses and recoveries, net. Certain executive recruitment and hiring related expenses were $0.4 million and $1.6 million for the three and nine months ended September 30, 2026, respectively, compared to $0.4 million and $0.5 million for the three and nine months ended September 30, 2025. Certain third-party data center service outage related net recoveries were $0.6 million and $0.2 million for the three and nine months ended September 30, 2025 with no comparable activity for either the three or nine months ended September 30, 2026. Certain third-party data center service outage related net recoveries were immaterial amounts for the three months ended September 30, 2024. Reconciliation of GAAP to Non-GAAP Financial Measures* (continued) 25
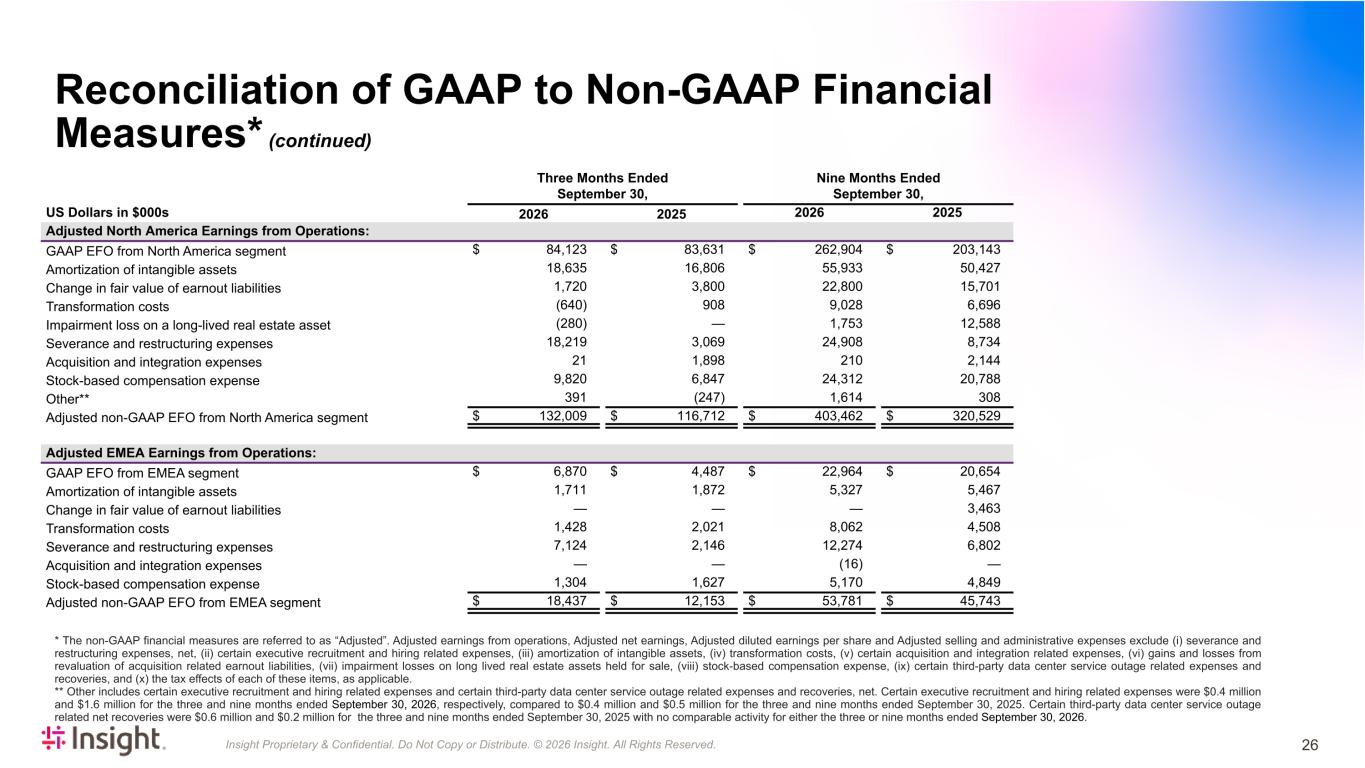
Insight Proprietary & Confidential. Do Not Copy or Distribute. © 2026 Insight. All Rights Reserved. Three Months Ended September 30, Nine Months Ended September 30, US Dollars in $000s 2026 2025 2026 2025 Adjusted North America Earnings from Operations: GAAP EFO from North America segment $ 84,123 $ 83,631 $ 262,904 $ 203,143 Amortization of intangible assets 18,635 16,806 55,933 50,427 Change in fair value of earnout liabilities 1,720 3,800 22,800 15,701 Transformation costs (640) 908 9,028 6,696 Impairment loss on a long-lived real estate asset (280) — 1,753 12,588 Severance and restructuring expenses 18,219 3,069 24,908 8,734 Acquisition and integration expenses 21 1,898 210 2,144 Stock-based compensation expense 9,820 6,847 24,312 20,788 Other** 391 (247) 1,614 308 Adjusted non-GAAP EFO from North America segment $ 132,009 $ 116,712 $ 403,462 $ 320,529 Adjusted EMEA Earnings from Operations: GAAP EFO from EMEA segment $ 6,870 $ 4,487 $ 22,964 $ 20,654 Amortization of intangible assets 1,711 1,872 5,327 5,467 Change in fair value of earnout liabilities — — — 3,463 Transformation costs 1,428 2,021 8,062 4,508 Severance and restructuring expenses 7,124 2,146 12,274 6,802 Acquisition and integration expenses — — (16) — Stock-based compensation expense 1,304 1,627 5,170 4,849 Adjusted non-GAAP EFO from EMEA segment $ 18,437 $ 12,153 $ 53,781 $ 45,743 Reconciliation of GAAP to Non-GAAP Financial Measures* (continued) * The non-GAAP financial measures are referred to as “Adjusted”. Adjusted earnings from operations, Adjusted net earnings, Adjusted diluted earnings per share and Adjusted selling and administrative expenses exclude (i) severance and restructuring expenses, net, (ii) certain executive recruitment and hiring related expenses, (iii) amortization of intangible assets, (iv) transformation costs, (v) certain acquisition and integration related expenses, (vi) gains and losses from revaluation of acquisition related earnout liabilities, (vii) impairment losses on long lived real estate assets held for sale, (viii) stock-based compensation expense, (ix) certain third-party data center service outage related expenses and recoveries, and (x) the tax effects of each of these items, as applicable. ** Other includes certain executive recruitment and hiring related expenses and certain third-party data center service outage related expenses and recoveries, net. Certain executive recruitment and hiring related expenses were $0.4 million and $1.6 million for the three and nine months ended September 30, 2026, respectively, compared to $0.4 million and $0.5 million for the three and nine months ended September 30, 2025. Certain third-party data center service outage related net recoveries were $0.6 million and $0.2 million for the three and nine months ended September 30, 2025 with no comparable activity for either the three or nine months ended September 30, 2026. 26
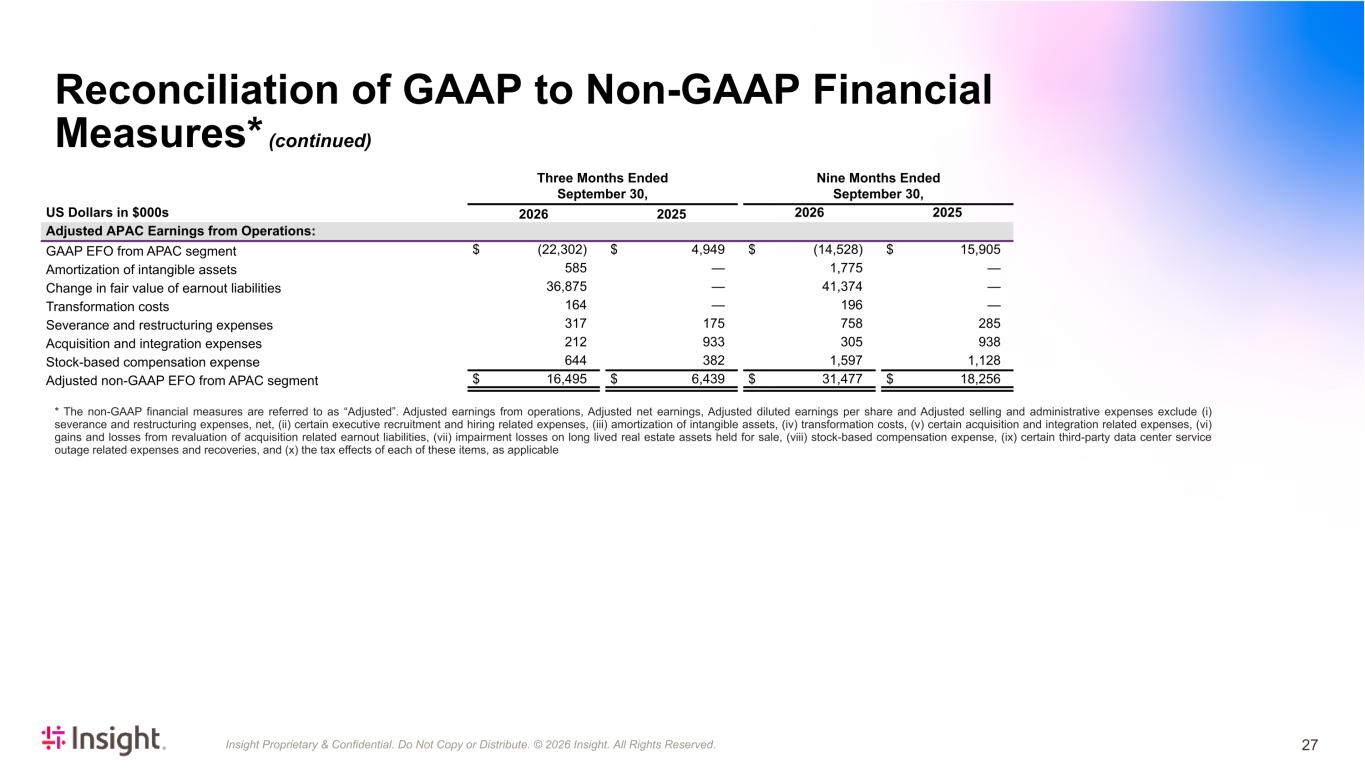
Insight Proprietary & Confidential. Do Not Copy or Distribute. © 2026 Insight. All Rights Reserved. Three Months Ended September 30, Nine Months Ended September 30, US Dollars in $000s 2026 2025 2026 2025 Adjusted APAC Earnings from Operations: GAAP EFO from APAC segment $ (22,302) $ 4,949 $ (14,528) $ 15,905 Amortization of intangible assets 585 — 1,775 — Change in fair value of earnout liabilities 36,875 — 41,374 — Transformation costs 164 — 196 — Severance and restructuring expenses 317 175 758 285 Acquisition and integration expenses 212 933 305 938 Stock-based compensation expense 644 382 1,597 1,128 Adjusted non-GAAP EFO from APAC segment $ 16,495 $ 6,439 $ 31,477 $ 18,256 * The non-GAAP financial measures are referred to as “Adjusted”. Adjusted earnings from operations, Adjusted net earnings, Adjusted diluted earnings per share and Adjusted selling and administrative expenses exclude (i) severance and restructuring expenses, net, (ii) certain executive recruitment and hiring related expenses, (iii) amortization of intangible assets, (iv) transformation costs, (v) certain acquisition and integration related expenses, (vi) gains and losses from revaluation of acquisition related earnout liabilities, (vii) impairment losses on long lived real estate assets held for sale, (viii) stock-based compensation expense, (ix) certain third-party data center service outage related expenses and recoveries, and (x) the tax effects of each of these items, as applicable Reconciliation of GAAP to Non-GAAP Financial Measures* (continued) 27
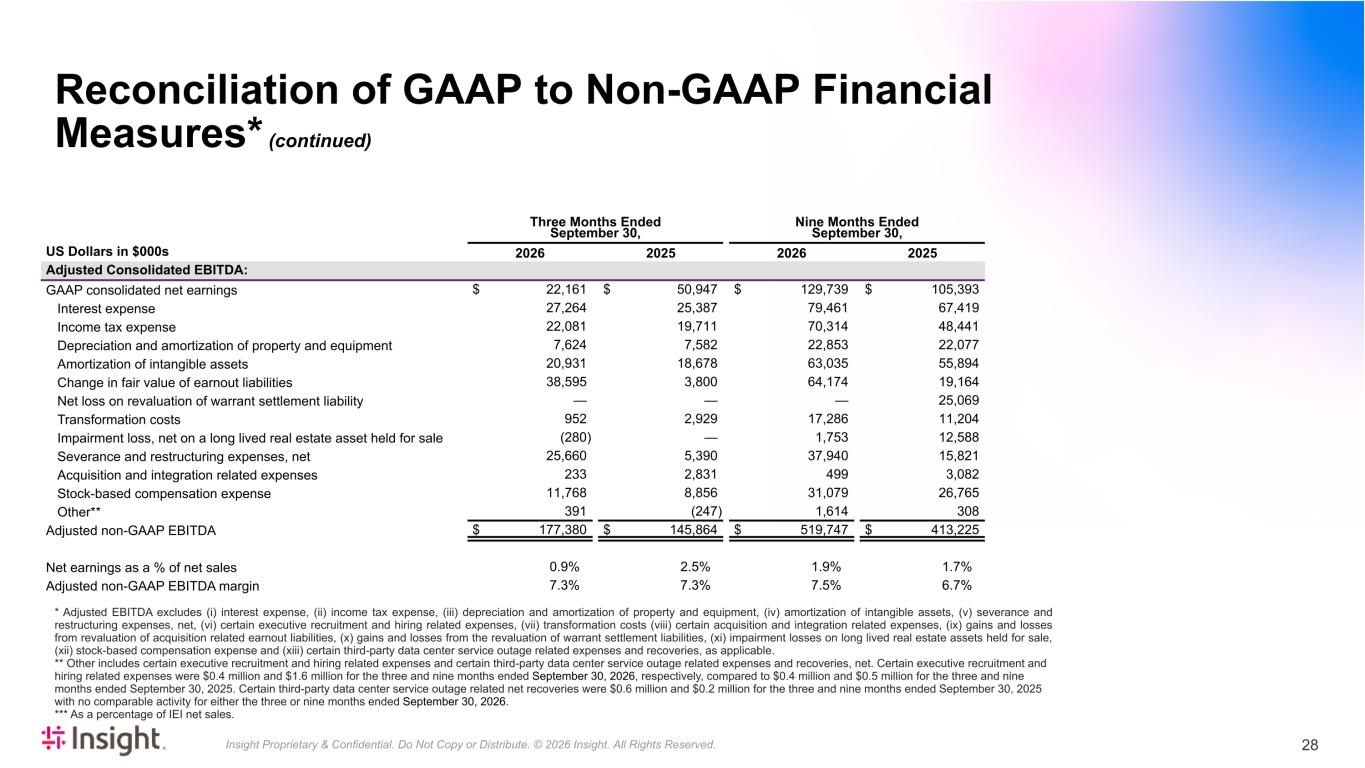
Insight Proprietary & Confidential. Do Not Copy or Distribute. © 2026 Insight. All Rights Reserved. Three Months Ended Nine Months Ended September 30, September 30, US Dollars in $000s 2026 2025 2026 2025 Adjusted Consolidated EBITDA: GAAP consolidated net earnings $ 22,161 $ 50,947 $ 129,739 $ 105,393 Interest expense 27,264 25,387 79,461 67,419 Income tax expense 22,081 19,711 70,314 48,441 Depreciation and amortization of property and equipment 7,624 7,582 22,853 22,077 Amortization of intangible assets 20,931 18,678 63,035 55,894 Change in fair value of earnout liabilities 38,595 3,800 64,174 19,164 Net loss on revaluation of warrant settlement liability — — — 25,069 Transformation costs 952 2,929 17,286 11,204 Impairment loss, net on a long lived real estate asset held for sale (280) — 1,753 12,588 Severance and restructuring expenses, net 25,660 5,390 37,940 15,821 Acquisition and integration related expenses 233 2,831 499 3,082 Stock-based compensation expense 11,768 8,856 31,079 26,765 Other** 391 (247) 1,614 308 Adjusted non-GAAP EBITDA $ 177,380 $ 145,864 $ 519,747 $ 413,225 Net earnings as a % of net sales 0.9 % 2.5 % 1.9 % 1.7 % Adjusted non-GAAP EBITDA margin 7.3 % 7.3 % 7.5 % 6.7 % Reconciliation of GAAP to Non-GAAP Financial Measures* (continued) 28 * Adjusted EBITDA excludes (i) interest expense, (ii) income tax expense, (iii) depreciation and amortization of property and equipment, (iv) amortization of intangible assets, (v) severance and restructuring expenses, net, (vi) certain executive recruitment and hiring related expenses, (vii) transformation costs (viii) certain acquisition and integration related expenses, (ix) gains and losses from revaluation of acquisition related earnout liabilities, (x) gains and losses from the revaluation of warrant settlement liabilities, (xi) impairment losses on long lived real estate assets held for sale, (xii) stock-based compensation expense and (xiii) certain third-party data center service outage related expenses and recoveries, as applicable. ** Other includes certain executive recruitment and hiring related expenses and certain third-party data center service outage related expenses and recoveries, net. Certain executive recruitment and hiring related expenses were $0.4 million and $1.6 million for the three and nine months ended September 30, 2026, respectively, compared to $0.4 million and $0.5 million for the three and nine months ended September 30, 2025. Certain third-party data center service outage related net recoveries were $0.6 million and $0.2 million for the three and nine months ended September 30, 2025 with no comparable activity for either the three or nine months ended September 30, 2026. *** As a percentage of IEI net sales.
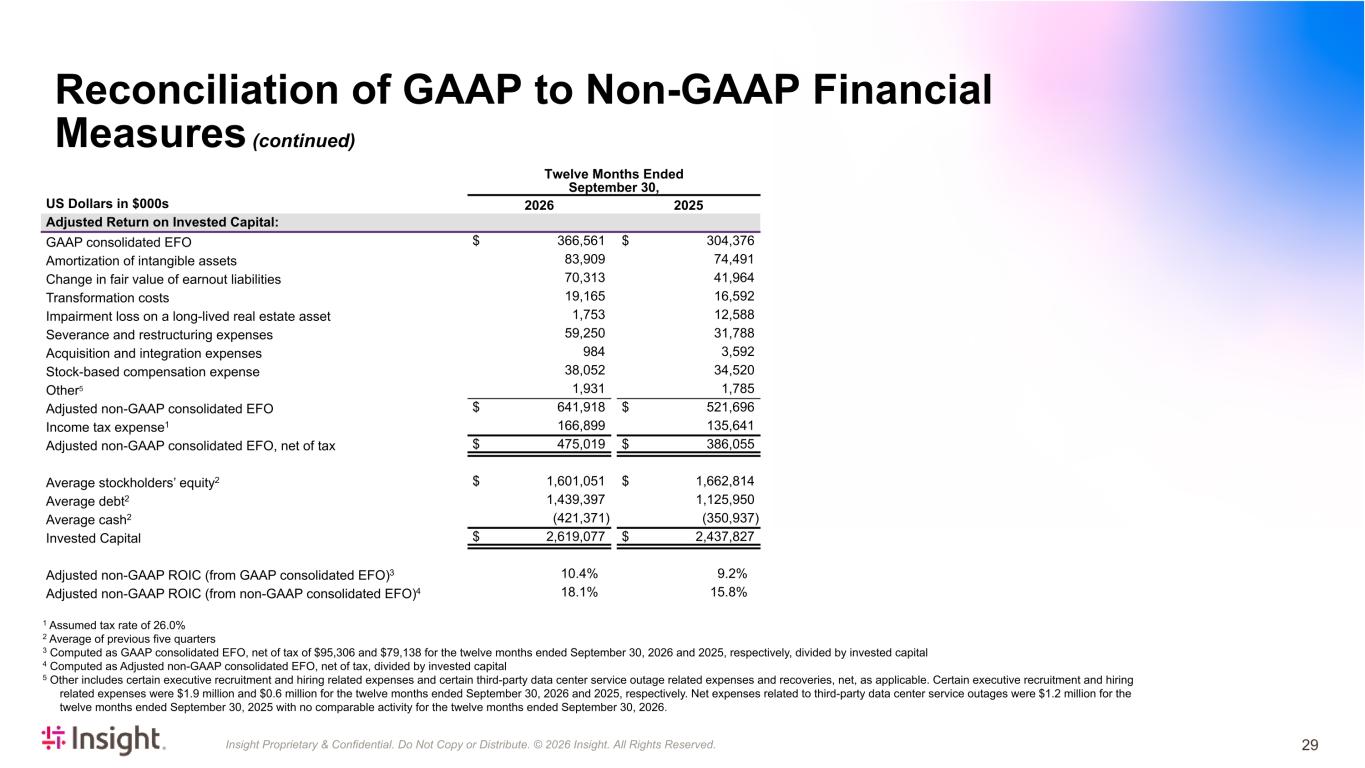
Insight Proprietary & Confidential. Do Not Copy or Distribute. © 2026 Insight. All Rights Reserved. 1 Assumed tax rate of 26.0% 2 Average of previous five quarters 3 Computed as GAAP consolidated EFO, net of tax of $95,306 and $79,138 for the twelve months ended September 30, 2026 and 2025, respectively, divided by invested capital 4 Computed as Adjusted non-GAAP consolidated EFO, net of tax, divided by invested capital 5 Other includes certain executive recruitment and hiring related expenses and certain third-party data center service outage related expenses and recoveries, net, as applicable. Certain executive recruitment and hiring related expenses were $1.9 million and $0.6 million for the twelve months ended September 30, 2026 and 2025, respectively. Net expenses related to third-party data center service outages were $1.2 million for the twelve months ended September 30, 2025 with no comparable activity for the twelve months ended September 30, 2026. Twelve Months Ended September 30, US Dollars in $000s 2026 2025 Adjusted Return on Invested Capital: GAAP consolidated EFO $ 366,561 $ 304,376 Amortization of intangible assets 83,909 74,491 Change in fair value of earnout liabilities 70,313 41,964 Transformation costs 19,165 16,592 Impairment loss on a long-lived real estate asset 1,753 12,588 Severance and restructuring expenses 59,250 31,788 Acquisition and integration expenses 984 3,592 Stock-based compensation expense 38,052 34,520 Other5 1,931 1,785 Adjusted non-GAAP consolidated EFO $ 641,918 $ 521,696 Income tax expense1 166,899 135,641 Adjusted non-GAAP consolidated EFO, net of tax $ 475,019 $ 386,055 Average stockholders’ equity2 $ 1,601,051 $ 1,662,814 Average debt2 1,439,397 1,125,950 Average cash2 (421,371) (350,937) Invested Capital $ 2,619,077 $ 2,437,827 Adjusted non-GAAP ROIC (from GAAP consolidated EFO)3 10.4 % 9.2 % Adjusted non-GAAP ROIC (from non-GAAP consolidated EFO)4 18.1 % 15.8 % Reconciliation of GAAP to Non-GAAP Financial Measures (continued) 29
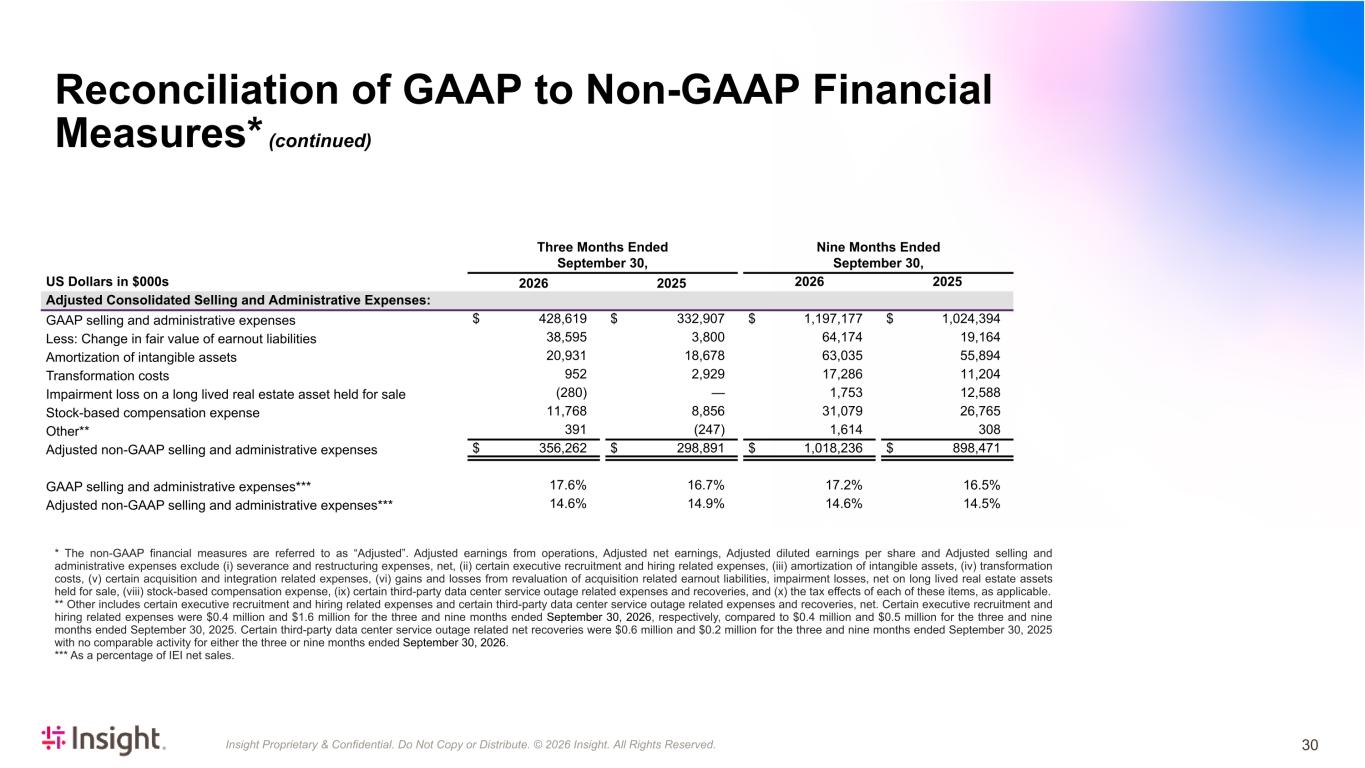
Insight Proprietary & Confidential. Do Not Copy or Distribute. © 2026 Insight. All Rights Reserved. Three Months Ended September 30, Nine Months Ended September 30, US Dollars in $000s 2026 2025 2026 2025 Adjusted Consolidated Selling and Administrative Expenses: GAAP selling and administrative expenses $ 428,619 $ 332,907 $ 1,197,177 $ 1,024,394 Less: Change in fair value of earnout liabilities 38,595 3,800 64,174 19,164 Amortization of intangible assets 20,931 18,678 63,035 55,894 Transformation costs 952 2,929 17,286 11,204 Impairment loss on a long lived real estate asset held for sale (280) — 1,753 12,588 Stock-based compensation expense 11,768 8,856 31,079 26,765 Other** 391 (247) 1,614 308 Adjusted non-GAAP selling and administrative expenses $ 356,262 $ 298,891 $ 1,018,236 $ 898,471 GAAP selling and administrative expenses*** 17.6 % 16.7 % 17.2 % 16.5 % Adjusted non-GAAP selling and administrative expenses*** 14.6 % 14.9 % 14.6 % 14.5 % $ 6,968,993 $ 6,198,883 * The non-GAAP financial measures are referred to as “Adjusted”. Adjusted earnings from operations, Adjusted net earnings, Adjusted diluted earnings per share and Adjusted selling and administrative expenses exclude (i) severance and restructuring expenses, net, (ii) certain executive recruitment and hiring related expenses, (iii) amortization of intangible assets, (iv) transformation costs, (v) certain acquisition and integration related expenses, (vi) gains and losses from revaluation of acquisition related earnout liabilities, impairment losses, net on long lived real estate assets held for sale, (viii) stock-based compensation expense, (ix) certain third-party data center service outage related expenses and recoveries, and (x) the tax effects of each of these items, as applicable. ** Other includes certain executive recruitment and hiring related expenses and certain third-party data center service outage related expenses and recoveries, net. Certain executive recruitment and hiring related expenses were $0.4 million and $1.6 million for the three and nine months ended September 30, 2026, respectively, compared to $0.4 million and $0.5 million for the three and nine months ended September 30, 2025. Certain third-party data center service outage related net recoveries were $0.6 million and $0.2 million for the three and nine months ended September 30, 2025 with no comparable activity for either the three or nine months ended September 30, 2026. *** As a percentage of IEI net sales. Reconciliation of GAAP to Non-GAAP Financial Measures* (continued) 30
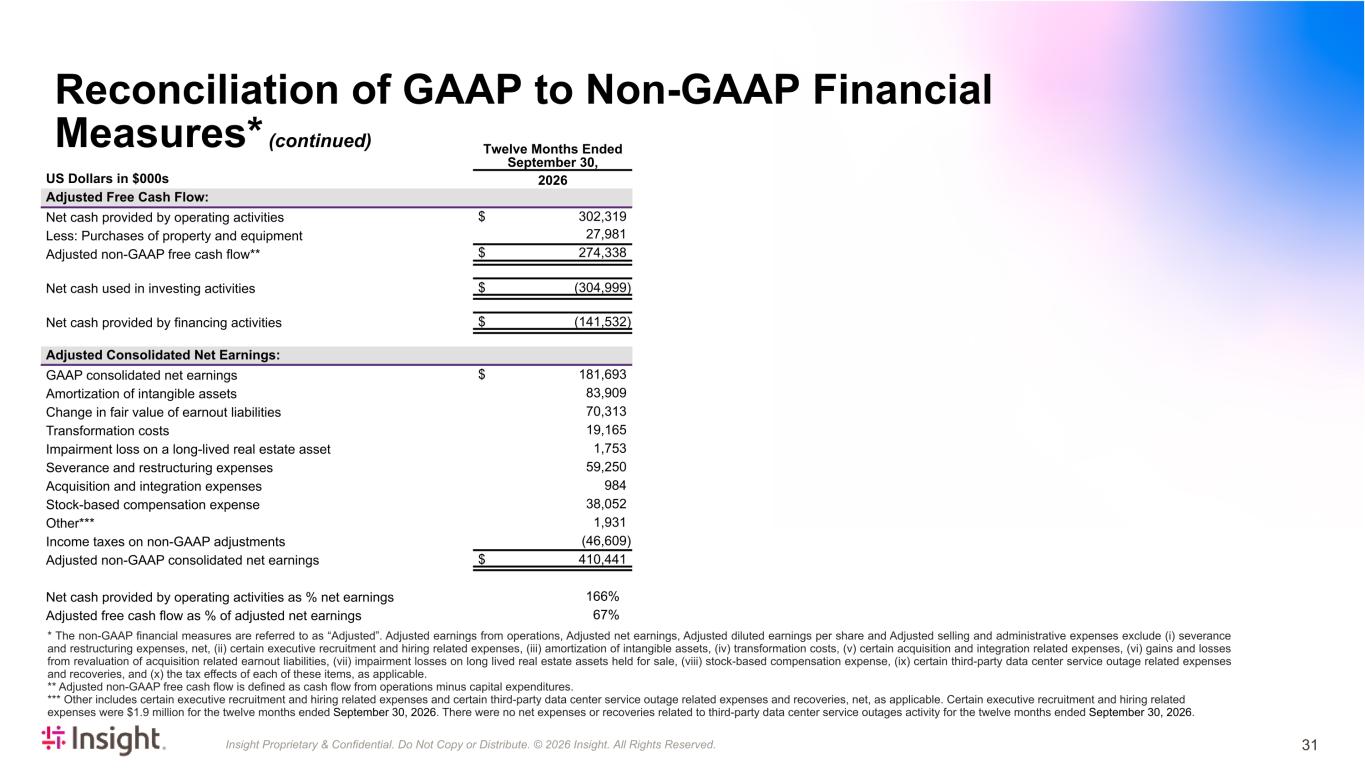
Insight Proprietary & Confidential. Do Not Copy or Distribute. © 2026 Insight. All Rights Reserved. Twelve Months Ended September 30, US Dollars in $000s 2026 Adjusted Free Cash Flow: Net cash provided by operating activities $ 302,319 Less: Purchases of property and equipment 27,981 Adjusted non-GAAP free cash flow** $ 274,338 Net cash used in investing activities $ (304,999) Net cash provided by financing activities $ (141,532) Adjusted Consolidated Net Earnings: GAAP consolidated net earnings $ 181,693 Amortization of intangible assets 83,909 Change in fair value of earnout liabilities 70,313 Transformation costs 19,165 Impairment loss on a long-lived real estate asset 1,753 Severance and restructuring expenses 59,250 Acquisition and integration expenses 984 Stock-based compensation expense 38,052 Other*** 1,931 Income taxes on non-GAAP adjustments (46,609) Adjusted non-GAAP consolidated net earnings $ 410,441 Net cash provided by operating activities as % net earnings 166 % Adjusted free cash flow as % of adjusted net earnings 67 % * The non-GAAP financial measures are referred to as “Adjusted”. Adjusted earnings from operations, Adjusted net earnings, Adjusted diluted earnings per share and Adjusted selling and administrative expenses exclude (i) severance and restructuring expenses, net, (ii) certain executive recruitment and hiring related expenses, (iii) amortization of intangible assets, (iv) transformation costs, (v) certain acquisition and integration related expenses, (vi) gains and losses from revaluation of acquisition related earnout liabilities, (vii) impairment losses on long lived real estate assets held for sale, (viii) stock-based compensation expense, (ix) certain third-party data center service outage related expenses and recoveries, and (x) the tax effects of each of these items, as applicable. ** Adjusted non-GAAP free cash flow is defined as cash flow from operations minus capital expenditures. *** Other includes certain executive recruitment and hiring related expenses and certain third-party data center service outage related expenses and recoveries, net, as applicable. Certain executive recruitment and hiring related expenses were $1.9 million for the twelve months ended September 30, 2026. There were no net expenses or recoveries related to third-party data center service outages activity for the twelve months ended September 30, 2026. Reconciliation of GAAP to Non-GAAP Financial Measures* (continued) 31
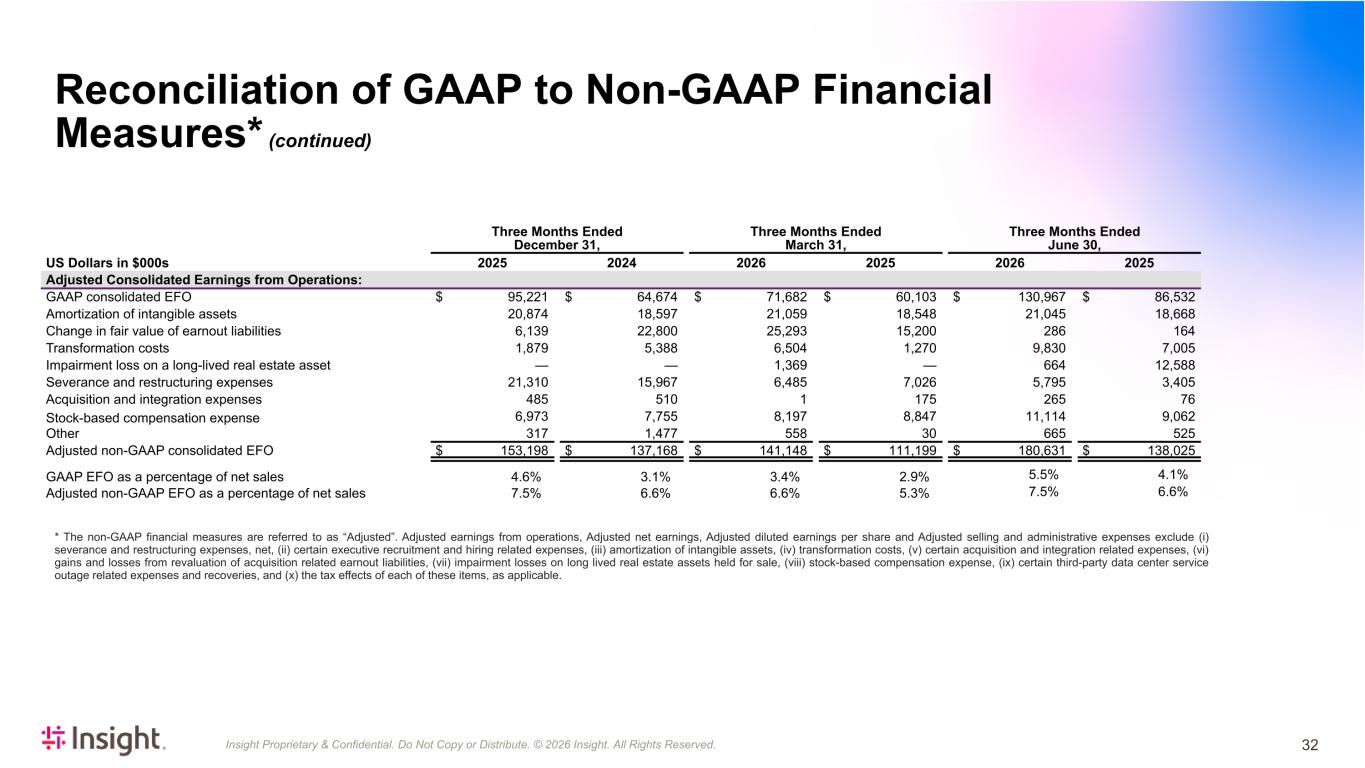
Insight Proprietary & Confidential. Do Not Copy or Distribute. © 2026 Insight. All Rights Reserved. Three Months Ended Three Months Ended Three Months Ended December 31, March 31, June 30, US Dollars in $000s 2025 2024 2026 2025 2026 2025 Adjusted Consolidated Earnings from Operations: GAAP consolidated EFO $ 95,221 $ 64,674 $ 71,682 $ 60,103 $ 130,967 $ 86,532 Amortization of intangible assets 20,874 18,597 21,059 18,548 21,045 18,668 Change in fair value of earnout liabilities 6,139 22,800 25,293 15,200 286 164 Transformation costs 1,879 5,388 6,504 1,270 9,830 7,005 Impairment loss on a long-lived real estate asset — — 1,369 — 664 12,588 Severance and restructuring expenses 21,310 15,967 6,485 7,026 5,795 3,405 Acquisition and integration expenses 485 510 1 175 265 76 Stock-based compensation expense 6,973 7,755 8,197 8,847 11,114 9,062 Other 317 1,477 558 30 665 525 Adjusted non-GAAP consolidated EFO $ 153,198 $ 137,168 $ 141,148 $ 111,199 $ 180,631 $ 138,025 GAAP EFO as a percentage of net sales 4.6 % 3.1 % 3.4 % 2.9 % 5.5% 4.1% Adjusted non-GAAP EFO as a percentage of net sales 7.5 % 6.6 % 6.6 % 5.3 % 7.5% 6.6% * The non-GAAP financial measures are referred to as “Adjusted”. Adjusted earnings from operations, Adjusted net earnings, Adjusted diluted earnings per share and Adjusted selling and administrative expenses exclude (i) severance and restructuring expenses, net, (ii) certain executive recruitment and hiring related expenses, (iii) amortization of intangible assets, (iv) transformation costs, (v) certain acquisition and integration related expenses, (vi) gains and losses from revaluation of acquisition related earnout liabilities, (vii) impairment losses on long lived real estate assets held for sale, (viii) stock-based compensation expense, (ix) certain third-party data center service outage related expenses and recoveries, and (x) the tax effects of each of these items, as applicable. Reconciliation of GAAP to Non-GAAP Financial Measures* (continued) 32
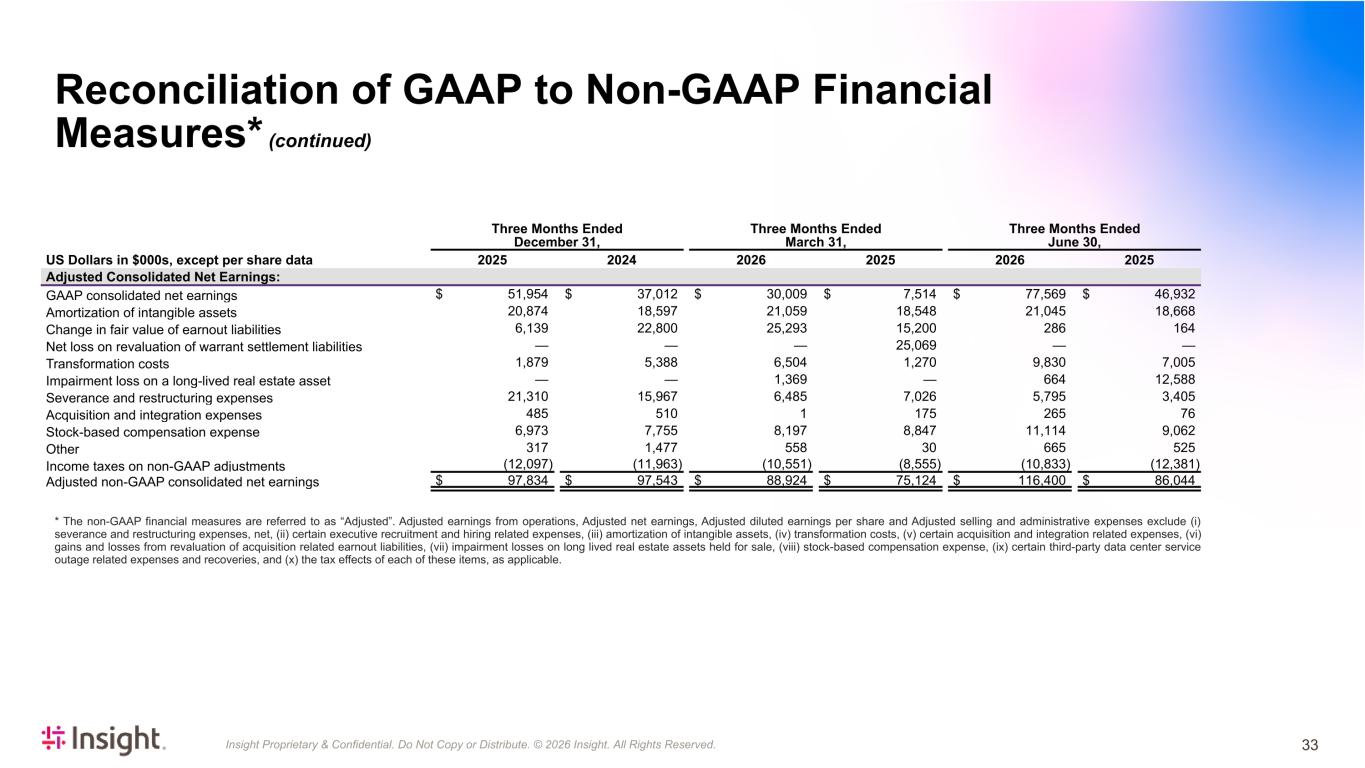
Insight Proprietary & Confidential. Do Not Copy or Distribute. © 2026 Insight. All Rights Reserved. Three Months Ended Three Months Ended Three Months Ended December 31, March 31, June 30, US Dollars in $000s, except per share data 2025 2024 2026 2025 2026 2025 Adjusted Consolidated Net Earnings: GAAP consolidated net earnings $ 51,954 $ 37,012 $ 30,009 $ 7,514 $ 77,569 $ 46,932 Amortization of intangible assets 20,874 18,597 21,059 18,548 21,045 18,668 Change in fair value of earnout liabilities 6,139 22,800 25,293 15,200 286 164 Net loss on revaluation of warrant settlement liabilities — — — 25,069 — — Transformation costs 1,879 5,388 6,504 1,270 9,830 7,005 Impairment loss on a long-lived real estate asset — — 1,369 — 664 12,588 Severance and restructuring expenses 21,310 15,967 6,485 7,026 5,795 3,405 Acquisition and integration expenses 485 510 1 175 265 76 Stock-based compensation expense 6,973 7,755 8,197 8,847 11,114 9,062 Other 317 1,477 558 30 665 525 Income taxes on non-GAAP adjustments (12,097) (11,963) (10,551) (8,555) (10,833) (12,381) Adjusted non-GAAP consolidated net earnings $ 97,834 $ 97,543 $ 88,924 $ 75,124 $ 116,400 $ 86,044 * The non-GAAP financial measures are referred to as “Adjusted”. Adjusted earnings from operations, Adjusted net earnings, Adjusted diluted earnings per share and Adjusted selling and administrative expenses exclude (i) severance and restructuring expenses, net, (ii) certain executive recruitment and hiring related expenses, (iii) amortization of intangible assets, (iv) transformation costs, (v) certain acquisition and integration related expenses, (vi) gains and losses from revaluation of acquisition related earnout liabilities, (vii) impairment losses on long lived real estate assets held for sale, (viii) stock-based compensation expense, (ix) certain third-party data center service outage related expenses and recoveries, and (x) the tax effects of each of these items, as applicable. Reconciliation of GAAP to Non-GAAP Financial Measures* (continued) 33
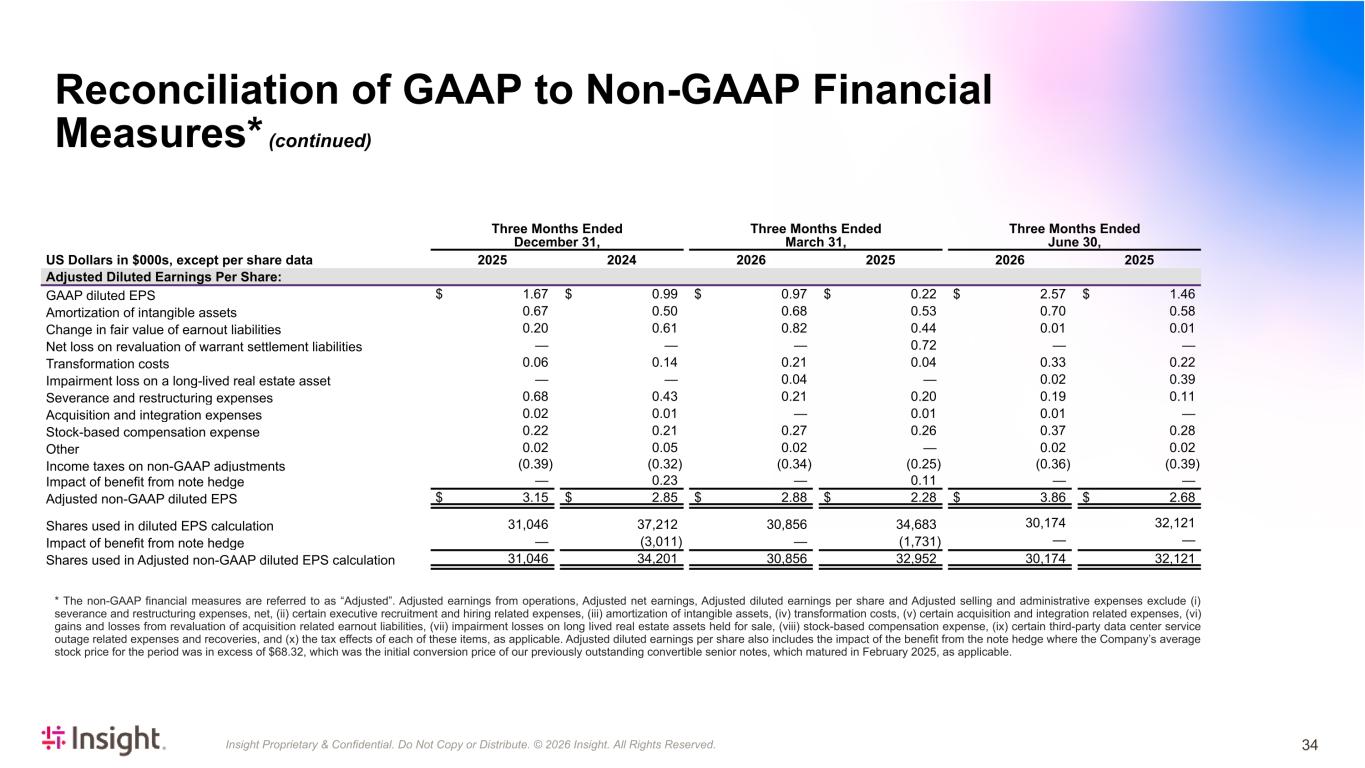
Insight Proprietary & Confidential. Do Not Copy or Distribute. © 2026 Insight. All Rights Reserved. Three Months Ended Three Months Ended Three Months Ended December 31, March 31, June 30, US Dollars in $000s, except per share data 2025 2024 2026 2025 2026 2025 Adjusted Diluted Earnings Per Share: GAAP diluted EPS $ 1.67 $ 0.99 $ 0.97 $ 0.22 $ 2.57 $ 1.46 Amortization of intangible assets 0.67 0.50 0.68 0.53 0.70 0.58 Change in fair value of earnout liabilities 0.20 0.61 0.82 0.44 0.01 0.01 Net loss on revaluation of warrant settlement liabilities — — — 0.72 — — Transformation costs 0.06 0.14 0.21 0.04 0.33 0.22 Impairment loss on a long-lived real estate asset — — 0.04 — 0.02 0.39 Severance and restructuring expenses 0.68 0.43 0.21 0.20 0.19 0.11 Acquisition and integration expenses 0.02 0.01 — 0.01 0.01 — Stock-based compensation expense 0.22 0.21 0.27 0.26 0.37 0.28 Other 0.02 0.05 0.02 — 0.02 0.02 Income taxes on non-GAAP adjustments (0.39) (0.32) (0.34) (0.25) (0.36) (0.39) Impact of benefit from note hedge — 0.23 — 0.11 — — Adjusted non-GAAP diluted EPS $ 3.15 $ 2.85 $ 2.88 $ 2.28 $ 3.86 $ 2.68 Shares used in diluted EPS calculation 31,046 37,212 30,856 34,683 30,174 32,121 Impact of benefit from note hedge — (3,011) — (1,731) — — Shares used in Adjusted non-GAAP diluted EPS calculation 31,046 34,201 30,856 32,952 30,174 32,121 * The non-GAAP financial measures are referred to as “Adjusted”. Adjusted earnings from operations, Adjusted net earnings, Adjusted diluted earnings per share and Adjusted selling and administrative expenses exclude (i) severance and restructuring expenses, net, (ii) certain executive recruitment and hiring related expenses, (iii) amortization of intangible assets, (iv) transformation costs, (v) certain acquisition and integration related expenses, (vi) gains and losses from revaluation of acquisition related earnout liabilities, (vii) impairment losses on long lived real estate assets held for sale, (viii) stock-based compensation expense, (ix) certain third-party data center service outage related expenses and recoveries, and (x) the tax effects of each of these items, as applicable. Adjusted diluted earnings per share also includes the impact of the benefit from the note hedge where the Company’s average stock price for the period was in excess of $68.32, which was the initial conversion price of our previously outstanding convertible senior notes, which matured in February 2025, as applicable. Reconciliation of GAAP to Non-GAAP Financial Measures* (continued) 34
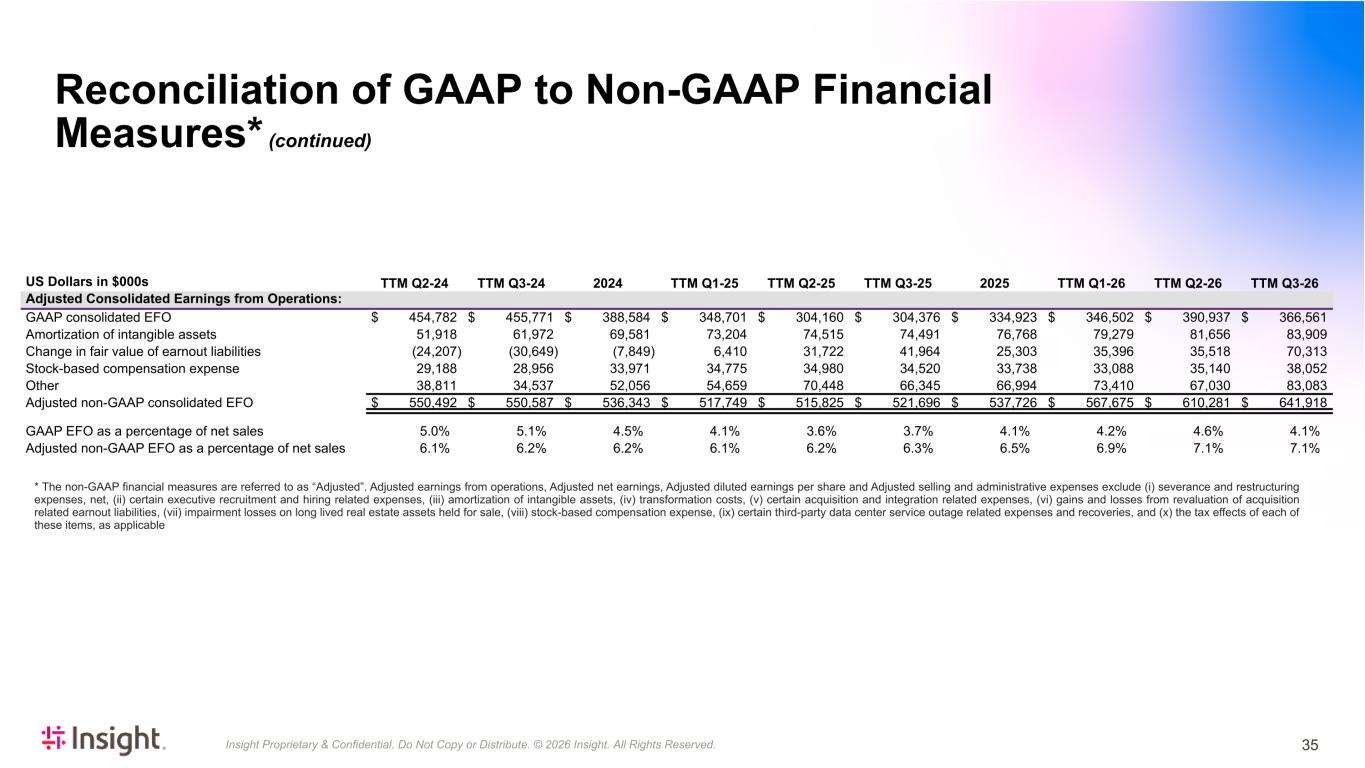
Insight Proprietary & Confidential. Do Not Copy or Distribute. © 2026 Insight. All Rights Reserved. * The non-GAAP financial measures are referred to as “Adjusted”. Adjusted earnings from operations, Adjusted net earnings, Adjusted diluted earnings per share and Adjusted selling and administrative expenses exclude (i) severance and restructuring expenses, net, (ii) certain executive recruitment and hiring related expenses, (iii) amortization of intangible assets, (iv) transformation costs, (v) certain acquisition and integration related expenses, (vi) gains and losses from revaluation of acquisition related earnout liabilities, (vii) impairment losses on long lived real estate assets held for sale, (viii) stock-based compensation expense, (ix) certain third-party data center service outage related expenses and recoveries, and (x) the tax effects of each of these items, as applicable US Dollars in $000s TTM Q2-24 TTM Q3-24 2024 TTM Q1-25 TTM Q2-25 TTM Q3-25 2025 TTM Q1-26 TTM Q2-26 TTM Q3-26 Adjusted Consolidated Earnings from Operations: GAAP consolidated EFO $ 454,782 $ 455,771 $ 388,584 $ 348,701 $ 304,160 $ 304,376 $ 334,923 $ 346,502 $ 390,937 $ 366,561 Amortization of intangible assets 51,918 61,972 69,581 73,204 74,515 74,491 76,768 79,279 81,656 83,909 Change in fair value of earnout liabilities (24,207) (30,649) (7,849) 6,410 31,722 41,964 25,303 35,396 35,518 70,313 Stock-based compensation expense 29,188 28,956 33,971 34,775 34,980 34,520 33,738 33,088 35,140 38,052 Other 38,811 34,537 52,056 54,659 70,448 66,345 66,994 73,410 67,030 83,083 Adjusted non-GAAP consolidated EFO $ 550,492 $ 550,587 $ 536,343 $ 517,749 $ 515,825 $ 521,696 $ 537,726 $ 567,675 $ 610,281 $ 641,918 GAAP EFO as a percentage of net sales 5.0 % 5.1 % 4.5 % 4.1 % 3.6 % 3.7 % 4.1 % 4.2 % 4.6 % 4.1 % Adjusted non-GAAP EFO as a percentage of net sales 6.1 % 6.2 % 6.2 % 6.1 % 6.2 % 6.3 % 6.5 % 6.9 % 7.1 % 7.1 % Reconciliation of GAAP to Non-GAAP Financial Measures* (continued) 35
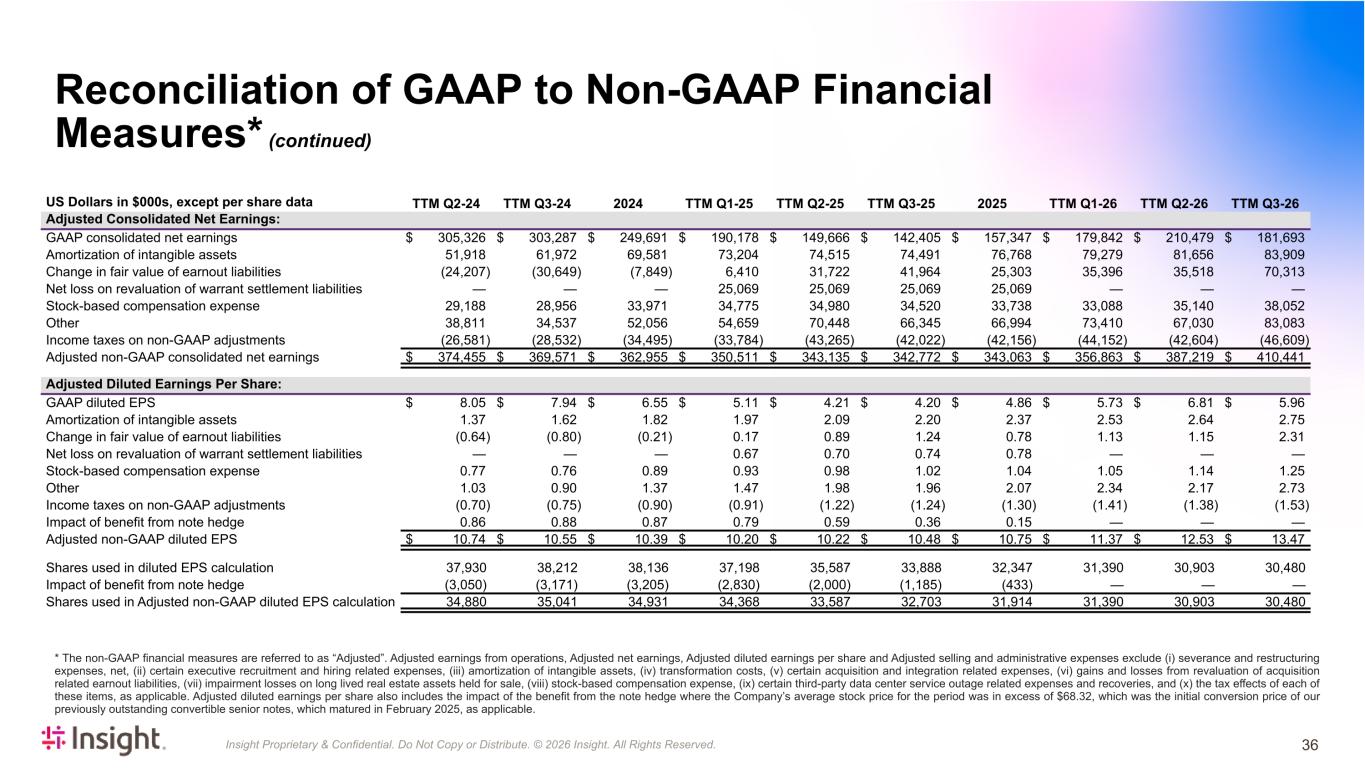
Insight Proprietary & Confidential. Do Not Copy or Distribute. © 2026 Insight. All Rights Reserved. * The non-GAAP financial measures are referred to as “Adjusted”. Adjusted earnings from operations, Adjusted net earnings, Adjusted diluted earnings per share and Adjusted selling and administrative expenses exclude (i) severance and restructuring expenses, net, (ii) certain executive recruitment and hiring related expenses, (iii) amortization of intangible assets, (iv) transformation costs, (v) certain acquisition and integration related expenses, (vi) gains and losses from revaluation of acquisition related earnout liabilities, (vii) impairment losses on long lived real estate assets held for sale, (viii) stock-based compensation expense, (ix) certain third-party data center service outage related expenses and recoveries, and (x) the tax effects of each of these items, as applicable. Adjusted diluted earnings per share also includes the impact of the benefit from the note hedge where the Company’s average stock price for the period was in excess of $68.32, which was the initial conversion price of our previously outstanding convertible senior notes, which matured in February 2025, as applicable. US Dollars in $000s, except per share data TTM Q2-24 TTM Q3-24 2024 TTM Q1-25 TTM Q2-25 TTM Q3-25 2025 TTM Q1-26 TTM Q2-26 TTM Q3-26 Adjusted Consolidated Net Earnings: GAAP consolidated net earnings $ 305,326 $ 303,287 $ 249,691 $ 190,178 $ 149,666 $ 142,405 $ 157,347 $ 179,842 $ 210,479 $ 181,693 Amortization of intangible assets 51,918 61,972 69,581 73,204 74,515 74,491 76,768 79,279 81,656 83,909 Change in fair value of earnout liabilities (24,207) (30,649) (7,849) 6,410 31,722 41,964 25,303 35,396 35,518 70,313 Net loss on revaluation of warrant settlement liabilities — — — 25,069 25,069 25,069 25,069 — — — Stock-based compensation expense 29,188 28,956 33,971 34,775 34,980 34,520 33,738 33,088 35,140 38,052 Other 38,811 34,537 52,056 54,659 70,448 66,345 66,994 73,410 67,030 83,083 Income taxes on non-GAAP adjustments (26,581) (28,532) (34,495) (33,784) (43,265) (42,022) (42,156) (44,152) (42,604) (46,609) Adjusted non-GAAP consolidated net earnings $ 374,455 $ 369,571 $ 362,955 $ 350,511 $ 343,135 $ 342,772 $ 343,063 $ 356,863 $ 387,219 $ 410,441 Adjusted Diluted Earnings Per Share: GAAP diluted EPS $ 8.05 $ 7.94 $ 6.55 $ 5.11 $ 4.21 $ 4.20 $ 4.86 $ 5.73 $ 6.81 $ 5.96 Amortization of intangible assets 1.37 1.62 1.82 1.97 2.09 2.20 2.37 2.53 2.64 2.75 Change in fair value of earnout liabilities (0.64) (0.80) (0.21) 0.17 0.89 1.24 0.78 1.13 1.15 2.31 Net loss on revaluation of warrant settlement liabilities — — — 0.67 0.70 0.74 0.78 — — — Stock-based compensation expense 0.77 0.76 0.89 0.93 0.98 1.02 1.04 1.05 1.14 1.25 Other 1.03 0.90 1.37 1.47 1.98 1.96 2.07 2.34 2.17 2.73 Income taxes on non-GAAP adjustments (0.70) (0.75) (0.90) (0.91) (1.22) (1.24) (1.30) (1.41) (1.38) (1.53) Impact of benefit from note hedge 0.86 0.88 0.87 0.79 0.59 0.36 0.15 — — — Adjusted non-GAAP diluted EPS $ 10.74 $ 10.55 $ 10.39 $ 10.20 $ 10.22 $ 10.48 $ 10.75 $ 11.37 $ 12.53 $ 13.47 Shares used in diluted EPS calculation 37,930 38,212 38,136 37,198 35,587 33,888 32,347 31,390 30,903 30,480 Impact of benefit from note hedge (3,050) (3,171) (3,205) (2,830) (2,000) (1,185) (433) — — — Shares used in Adjusted non-GAAP diluted EPS calculation 34,880 35,041 34,931 34,368 33,587 32,703 31,914 31,390 30,903 30,480 Reconciliation of GAAP to Non-GAAP Financial Measures* (continued) 36
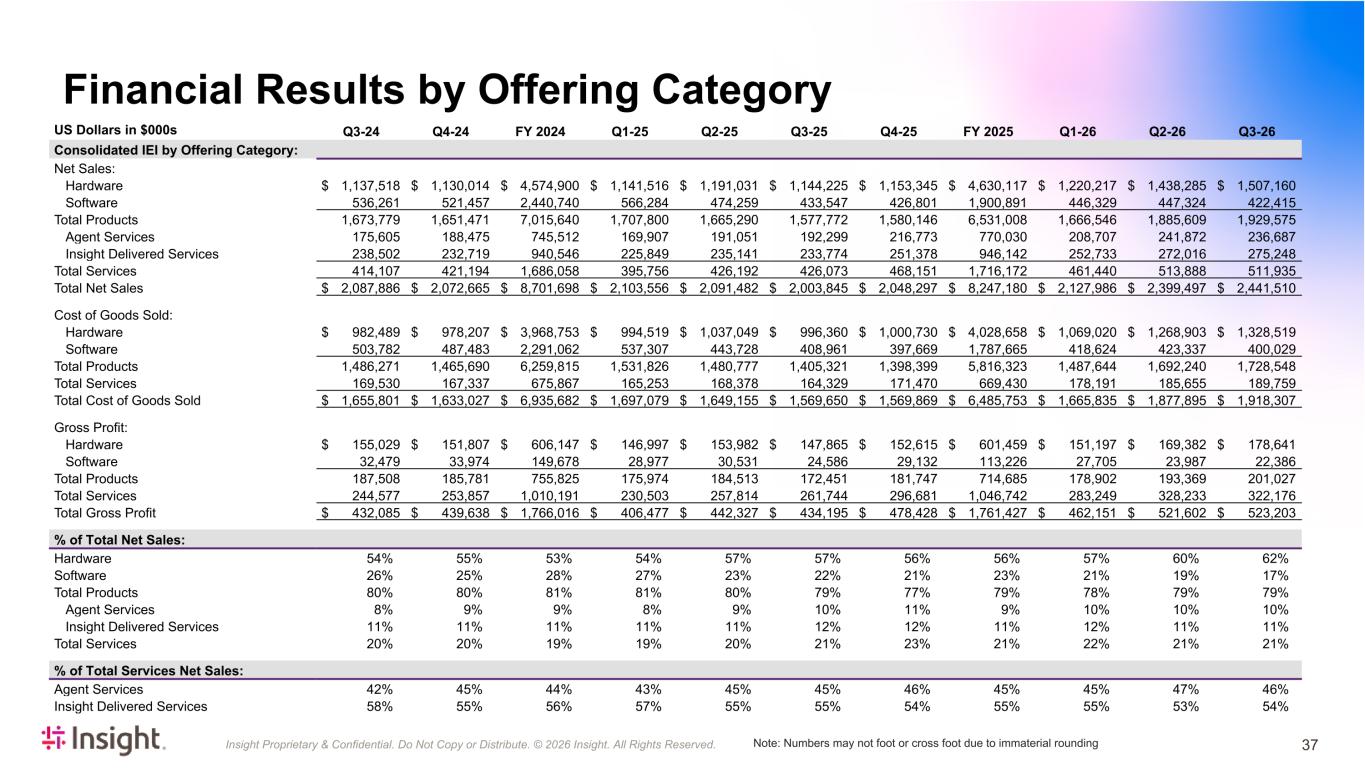
Insight Proprietary & Confidential. Do Not Copy or Distribute. © 2026 Insight. All Rights Reserved. Financial Results by Offering Category US Dollars in $000s Q3-24 Q4-24 FY 2024 Q1-25 Q2-25 Q3-25 Q4-25 FY 2025 Q1-26 Q2-26 Q3-26 Consolidated IEI by Offering Category: Net Sales: Hardware $ 1,137,518 $ 1,130,014 $ 4,574,900 $ 1,141,516 $ 1,191,031 $ 1,144,225 $ 1,153,345 $ 4,630,117 $ 1,220,217 $ 1,438,285 $ 1,507,160 Software 536,261 521,457 2,440,740 566,284 474,259 433,547 426,801 1,900,891 446,329 447,324 422,415 Total Products 1,673,779 1,651,471 7,015,640 1,707,800 1,665,290 1,577,772 1,580,146 6,531,008 1,666,546 1,885,609 1,929,575 Agent Services 175,605 188,475 745,512 169,907 191,051 192,299 216,773 770,030 208,707 241,872 236,687 Insight Delivered Services 238,502 232,719 940,546 225,849 235,141 233,774 251,378 946,142 252,733 272,016 275,248 Total Services 414,107 421,194 1,686,058 395,756 426,192 426,073 468,151 1,716,172 461,440 513,888 511,935 Total Net Sales $ 2,087,886 $ 2,072,665 $ 8,701,698 $ 2,103,556 $ 2,091,482 $ 2,003,845 $ 2,048,297 $ 8,247,180 $ 2,127,986 $ 2,399,497 $ 2,441,510 Cost of Goods Sold: Hardware $ 982,489 $ 978,207 $ 3,968,753 $ 994,519 $ 1,037,049 $ 996,360 $ 1,000,730 $ 4,028,658 $ 1,069,020 $ 1,268,903 $ 1,328,519 Software 503,782 487,483 2,291,062 537,307 443,728 408,961 397,669 1,787,665 418,624 423,337 400,029 Total Products 1,486,271 1,465,690 6,259,815 1,531,826 1,480,777 1,405,321 1,398,399 5,816,323 1,487,644 1,692,240 1,728,548 Total Services 169,530 167,337 675,867 165,253 168,378 164,329 171,470 669,430 178,191 185,655 189,759 Total Cost of Goods Sold $ 1,655,801 $ 1,633,027 $ 6,935,682 $ 1,697,079 $ 1,649,155 $ 1,569,650 $ 1,569,869 $ 6,485,753 $ 1,665,835 $ 1,877,895 $ 1,918,307 Gross Profit: Hardware $ 155,029 $ 151,807 $ 606,147 $ 146,997 $ 153,982 $ 147,865 $ 152,615 $ 601,459 $ 151,197 $ 169,382 $ 178,641 Software 32,479 33,974 149,678 28,977 30,531 24,586 29,132 113,226 27,705 23,987 22,386 Total Products 187,508 185,781 755,825 175,974 184,513 172,451 181,747 714,685 178,902 193,369 201,027 Total Services 244,577 253,857 1,010,191 230,503 257,814 261,744 296,681 1,046,742 283,249 328,233 322,176 Total Gross Profit $ 432,085 $ 439,638 $ 1,766,016 $ 406,477 $ 442,327 $ 434,195 $ 478,428 $ 1,761,427 $ 462,151 $ 521,602 $ 523,203 % of Total Net Sales: Hardware 54 % 55 % 53 % 54 % 57 % 57 % 56 % 56 % 57 % 60 % 62 % Software 26 % 25 % 28 % 27 % 23 % 22 % 21 % 23 % 21 % 19 % 17 % Total Products 80 % 80 % 81 % 81 % 80 % 79 % 77 % 79 % 78 % 79 % 79 % Agent Services 8 % 9 % 9 % 8 % 9 % 10 % 11 % 9 % 10 % 10 % 10 % Insight Delivered Services 11 % 11 % 11 % 11 % 11 % 12 % 12 % 11 % 12 % 11 % 11 % Total Services 20 % 20 % 19 % 19 % 20 % 21 % 23 % 21 % 22 % 21 % 21 % % of Total Services Net Sales: Agent Services 42 % 45 % 44 % 43 % 45 % 45 % 46 % 45 % 45 % 47 % 46 % Insight Delivered Services 58 % 55 % 56 % 57 % 55 % 55 % 54 % 55 % 55 % 53 % 54 % Note: Numbers may not foot or cross foot due to immaterial rounding 37