
Supplemental Macro Charts 3Q26 3Q26 Macro Charts Exhibit 99.3
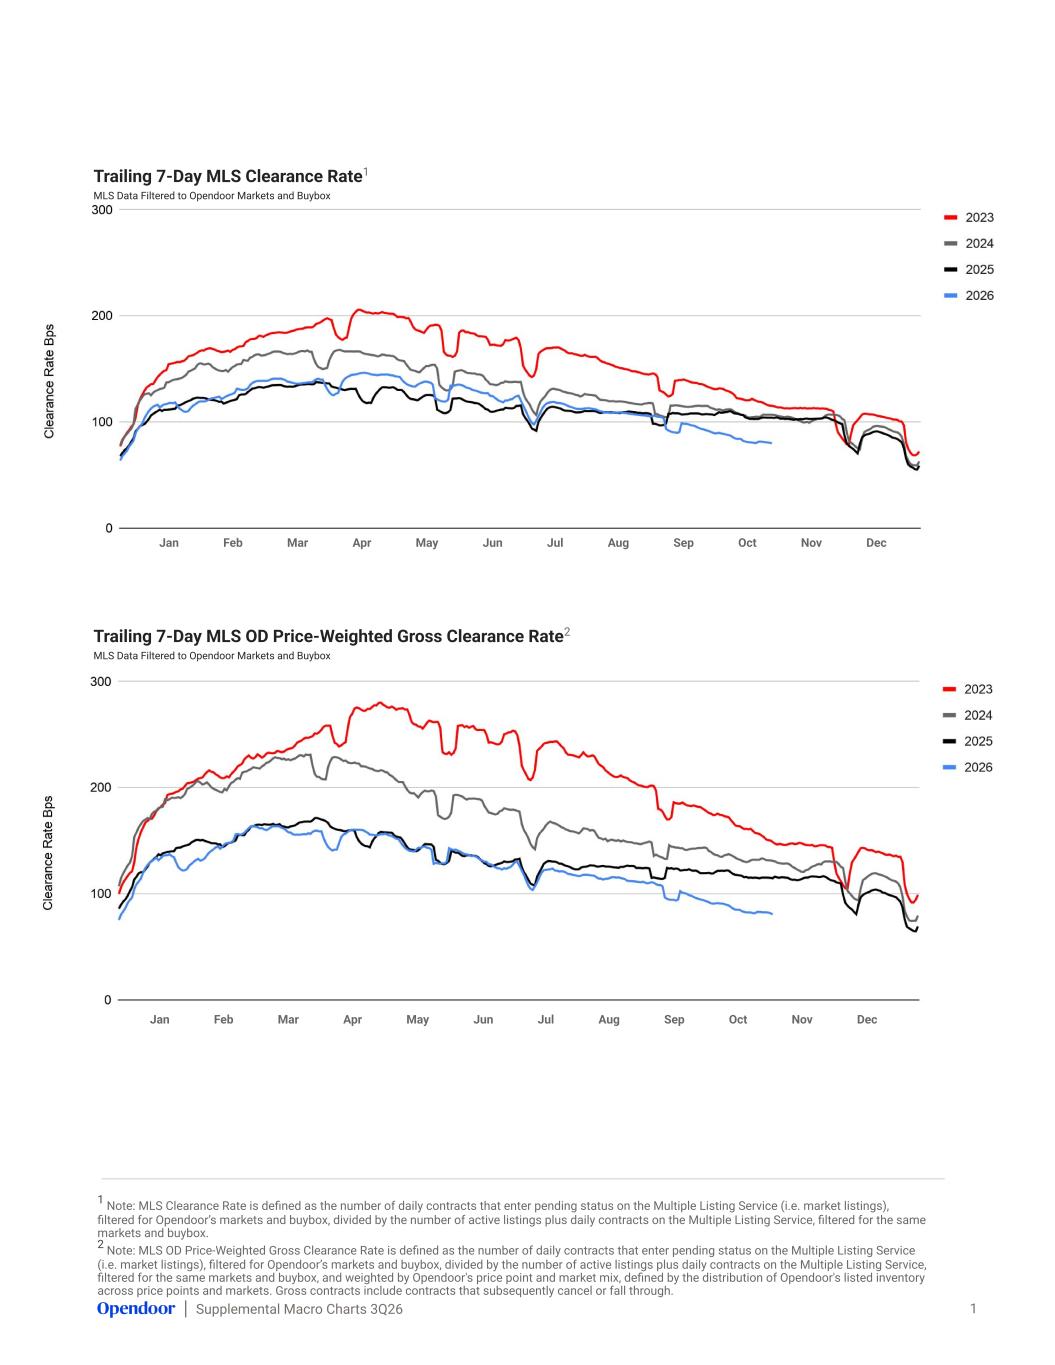
Supplemental Macro Charts 3Q26 Trailing 7-Day MLS Clearance Rate1 MLS Data Filtered to Opendoor Markets and Buybox 1 Trailing 7-Day MLS OD Price-Weighted Gross Clearance Rate2 MLS Data Filtered to Opendoor Markets and Buybox Jan Feb Mar Apr May Jun Jul Aug Sep Oct Nov Dec Jan Feb Mar Apr May Jun Jul Aug Sep Oct Nov Dec 1 Note: MLS Clearance Rate is defined as the number of daily contracts that enter pending status on the Multiple Listing Service (i.e. market listings), filtered for Opendoor’s markets and buybox, divided by the number of active listings plus daily contracts on the Multiple Listing Service, filtered for the same markets and buybox. 2 Note: MLS OD Price-Weighted Gross Clearance Rate is defined as the number of daily contracts that enter pending status on the Multiple Listing Service (i.e. market listings), filtered for Opendoor’s markets and buybox, divided by the number of active listings plus daily contracts on the Multiple Listing Service, filtered for the same markets and buybox, and weighted by Opendoor's price point and market mix, defined by the distribution of Opendoor's listed inventory across price points and markets. Gross contracts include contracts that subsequently cancel or fall through.
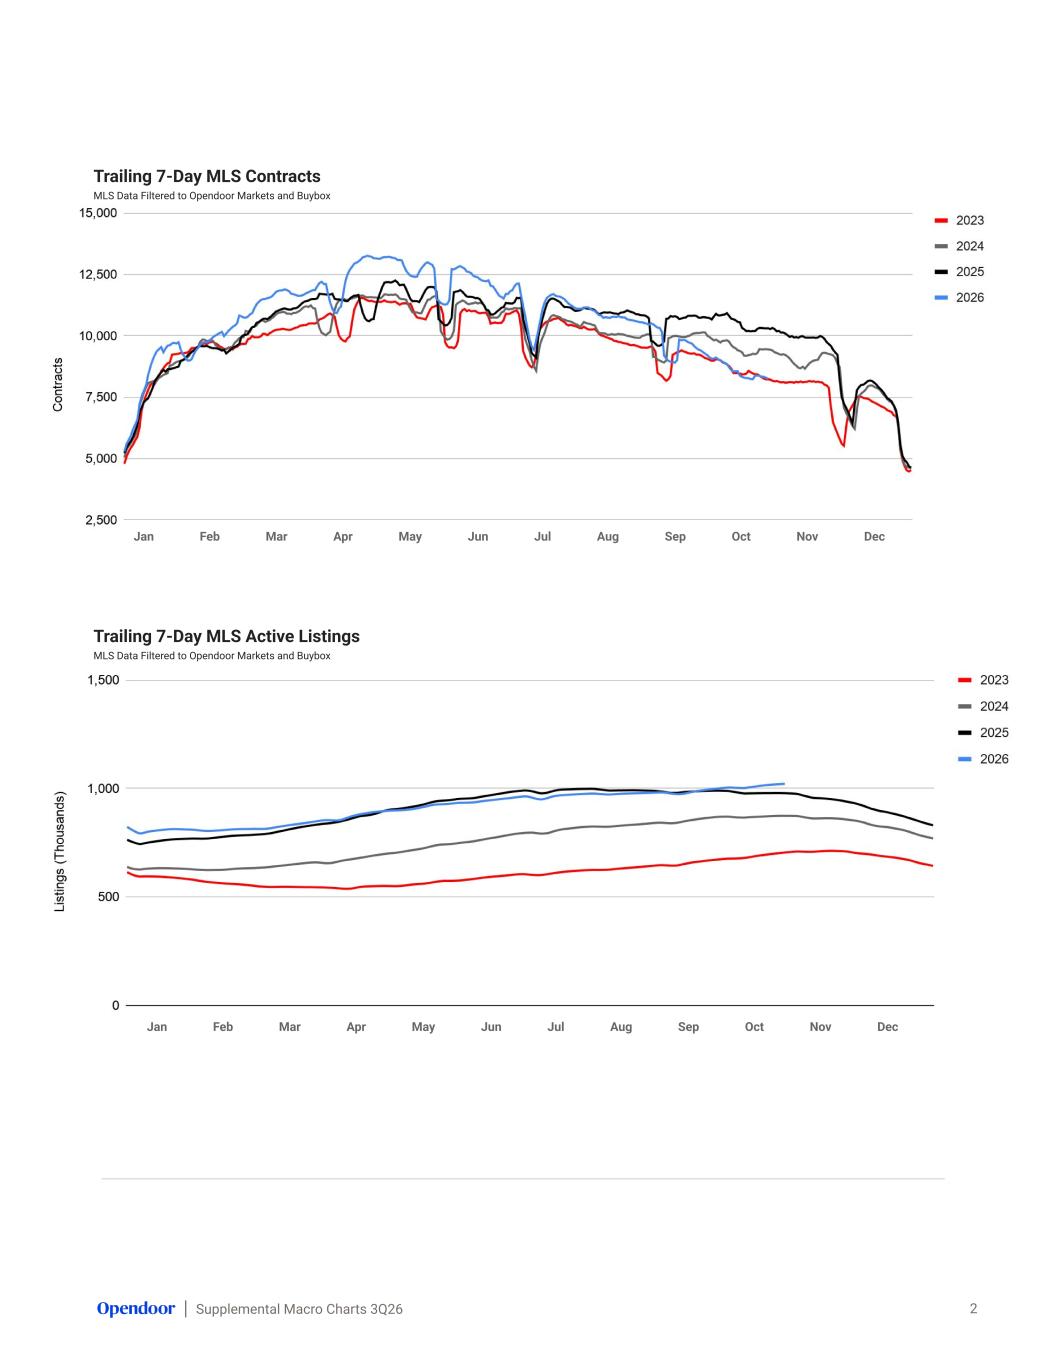
Supplemental Macro Charts 3Q26 Trailing 7-Day MLS Contracts MLS Data Filtered to Opendoor Markets and Buybox 2 Jan Feb Mar Apr May Jun Jul Aug Sep Oct Nov Dec Trailing 7-Day MLS Active Listings MLS Data Filtered to Opendoor Markets and Buybox Jan Feb Mar Apr May Jun Jul Aug Sep Oct Nov Dec
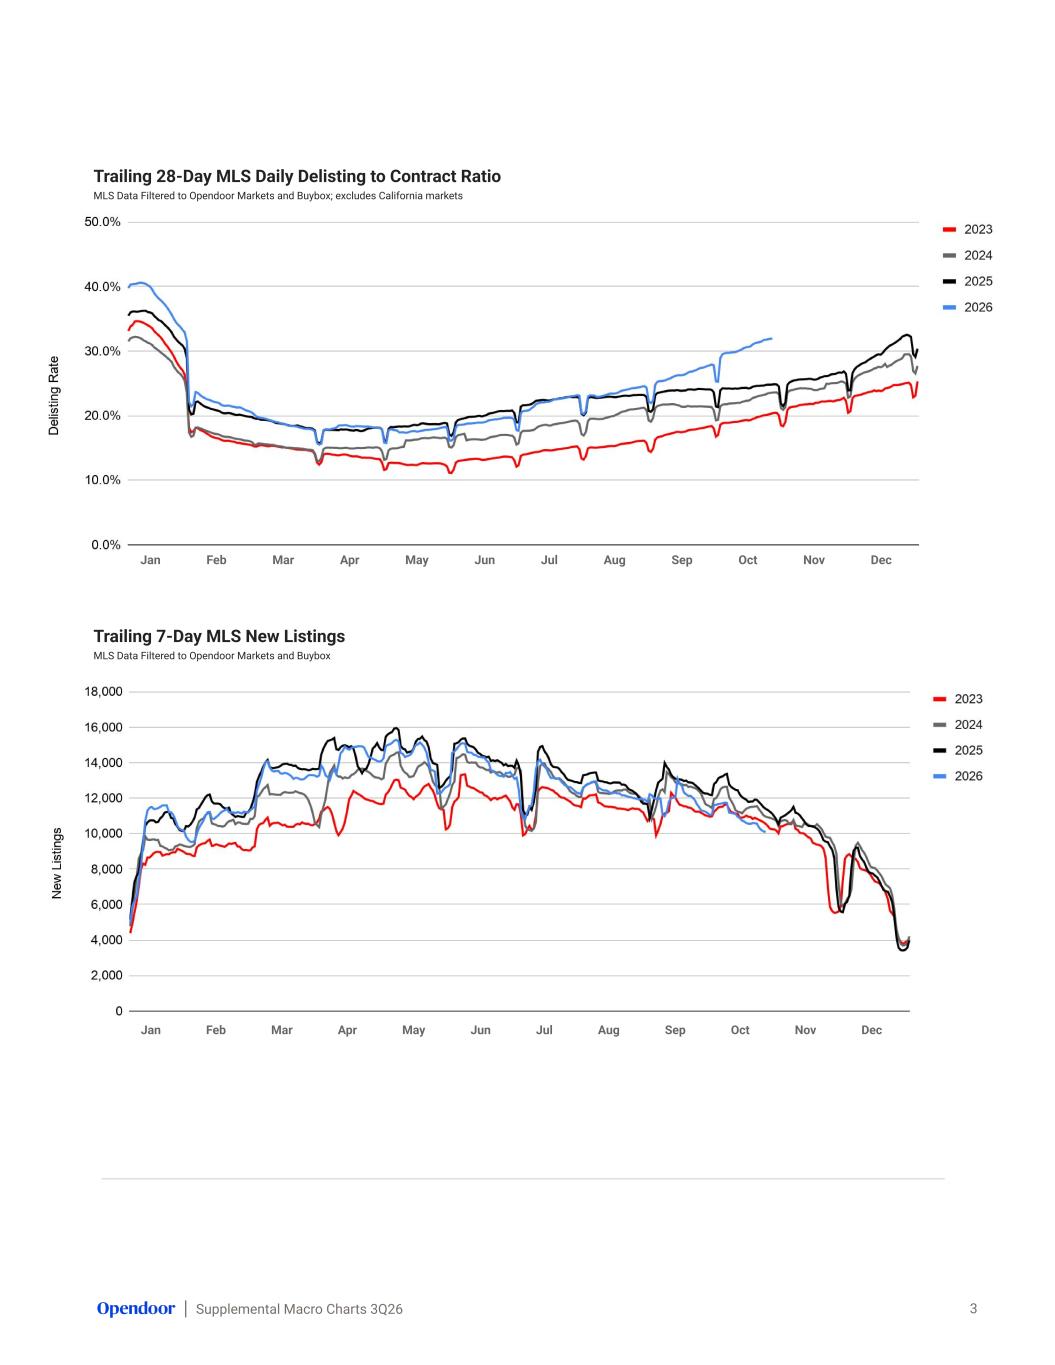
Supplemental Macro Charts 3Q26 Trailing 28-Day MLS Daily Delisting to Contract Ratio MLS Data Filtered to Opendoor Markets and Buybox; excludes California markets 3 Trailing 7-Day MLS New Listings MLS Data Filtered to Opendoor Markets and Buybox Jan Feb Mar Apr May Jun Jul Aug Sep Oct Nov Dec Jan Feb Mar Apr May Jun Jul Aug Sep Oct Nov Dec
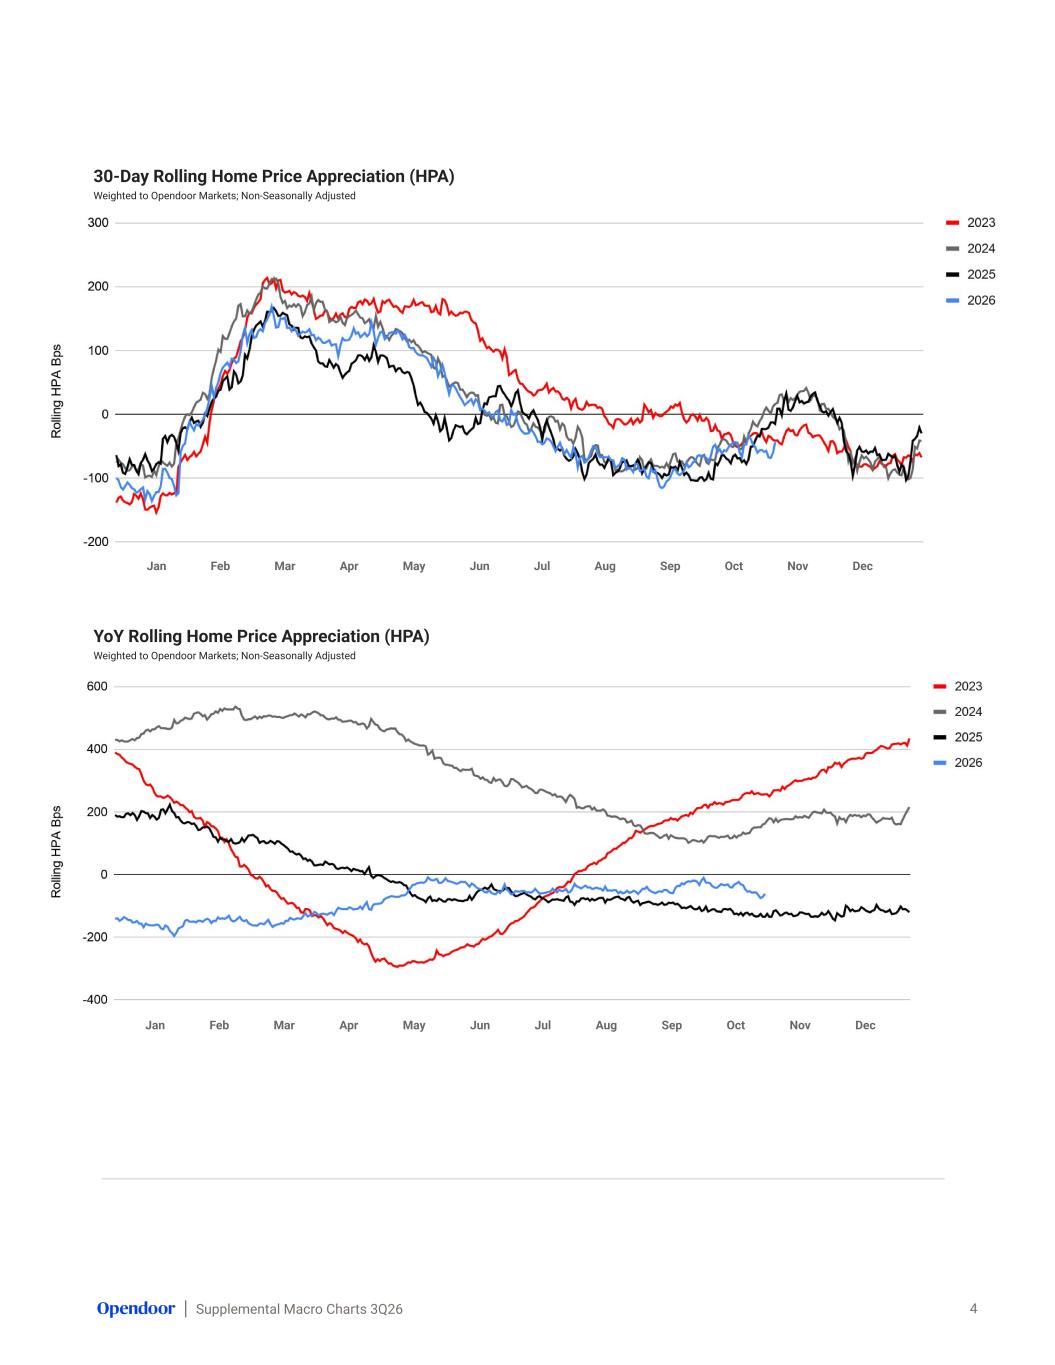
Supplemental Macro Charts 3Q26 30-Day Rolling Home Price Appreciation (HPA) Weighted to Opendoor Markets; Non-Seasonally Adjusted 4 YoY Rolling Home Price Appreciation (HPA) Weighted to Opendoor Markets; Non-Seasonally Adjusted Jan Feb Mar Apr May Jun Jul Aug Sep Oct Nov Dec Jan Feb Mar Apr May Jun Jul Aug Sep Oct Nov Dec
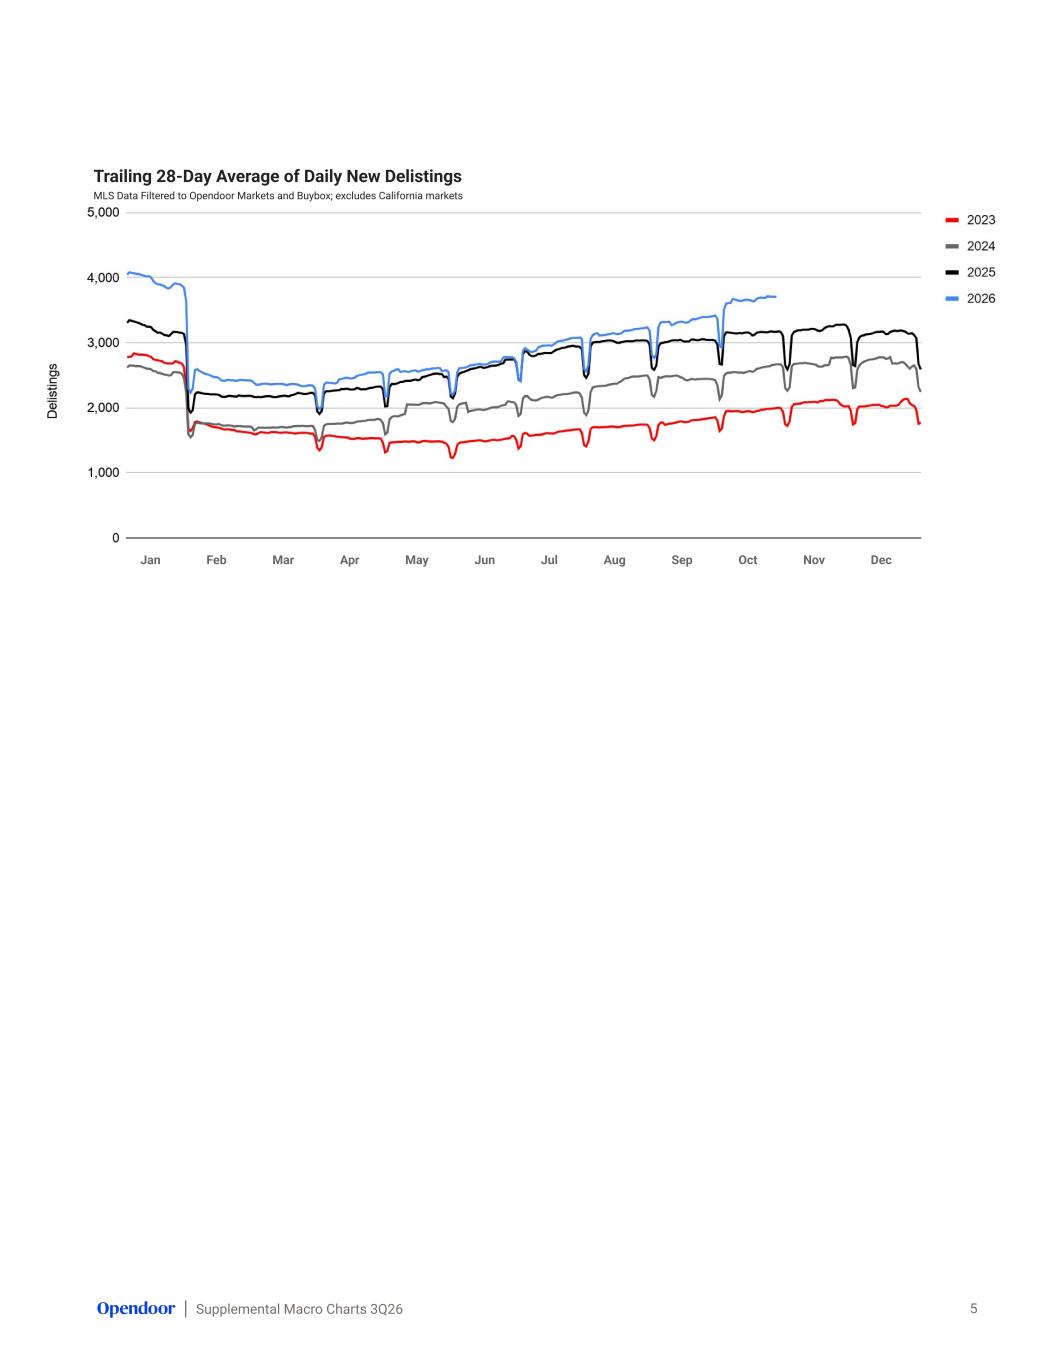
Supplemental Macro Charts 3Q26 Trailing 28-Day Average of Daily New Delistings MLS Data Filtered to Opendoor Markets and Buybox; excludes California markets 5 Jan Feb Mar Apr May Jun Jul Aug Sep Oct Nov Dec