Investor Presentation S O N I D A S E N I O R L I V I N G T h i r d Q u a r t e r 2 0 2 6 N o v e m b e r 5 , 2 0 2 6 SNDA | NYSE ListedThe Ashton at Anderson
Basis of Presentation I M P O R T A N T D I S C L O S U R E S The information in this investor presentation is current only as of its date and may have changed. We undertake no obligation to update this information in light of new information, future events or otherwise. Please refer to Appendix – Supplemental Information for definitions of certain capitalized terms used in this investor presentation. On March 11, 2026, we completed our previously announced acquisition of CNL Healthcare Properties, Inc. (“CHP”) through a series of steps ending with a forward merger of CHP with and into a subsidiary of the Company (the “CHP Merger”), with such subsidiary surviving the CHP Merger, as a result of which we now indirectly own all of the assets of CHP. For periods presented in which we did not own CHP during the full period, we present certain historical measures in this investor presentation on a “pro forma” basis as if the CHP Merger was consummated on the first day of the applicable period presented, as we believe such historical pro forma information provides investors with useful information about the combined business and a meaningful method of comparing the performance of the combined business over historical periods. The historical pro forma information is being presented for informational purposes only and does not reflect the actual results we would have achieved had the CHP Merger occurred on the first day of the applicable period and may not be predictive of future results. The historical CHP information used to prepare the historical pro forma information included herein is based on CHP’s books and records and, in certain cases, has been adjusted to conform to the Company’s presentation of certain metrics. For example, for NOI, NOI Margin and Adjusted EBITDA, we have included pro forma adjustments representing the impact of CHP as if we acquired CHP on the first day of the applicable period. These pro forma adjustments were calculated on the same basis as the Company calculates NOI, NOI Margin and Adjusted EBITDA. Accordingly, to the extent standalone CHP information is presented herein for historical periods it may not conform to similar information previously disclosed by CHP in its SEC filings prior to the consummation of the CHP Merger. We believe that the historical pro forma information represents a reasonable estimate of the results of the combined business for the periods preceding the consummation of the CHP Merger; however, the pro forma information has not been audited. Further, the historical pro forma information does not reflect the cost of any integration activities or benefits from the CHP Merger that may be derived, both of which may have a material effect on our consolidated results in periods following completion of the CHP Merger. As a result, there can be no assurance that the historical pro forma information accurately reflects the actual results of the combined business for the periods preceding the consummation of the CHP Merger. The historical “pro forma” information presented herein should not be viewed as a substitute for consolidated financial results presented in accordance with United States generally accepted accounting principles (“GAAP”) or pro forma financial statements prepared in accordance with Article 11 of Regulation S-X. Please refer to our consolidated financial statements in our Form 10-Q filed with the SEC on November 5, 2026 for our actual historical results presented in accordance with GAAP for the quarter ended September 30, 2026 and our Current Report on Form 8-K filed with the SEC on August 17, 2026 for our actual pro forma combined results prepared in accordance with Article 11 of Regulation S-X for the year ended December 31, 2025 and the six months ended June 30, 2026. Our independent registered public accounting firm has not audited, reviewed, compiled or applied agreed-upon procedures with respect to the historical combined information included herein and does not express an opinion or any other form of assurance with respect thereto. 2
Forward-Looking Statements I M P O R T A N T D I S C L O S U R E S This investor presentation contains “forward-looking statements” within the meaning of the federal securities laws. All statements other than statements of historical fact in this investor presentation are forward-looking statements, including those relating to the Company’s expectations and beliefs, the industry in which the Company operates, the CHP Merger and its expected financial and other benefits, including expected accretion and synergies, certain 2026 estimates and the Company’s future business prospects and strategies, financial results, working capital, liquidity, capital needs and expenditures. Forward-looking statements are subject to certain risks and uncertainties that could cause our actual results and financial condition to differ materially from those indicated in the forward-looking statements, including, among others, the risks, uncertainties and factors set forth under “Item 1A. Risk Factors” in our Annual Report on Form 10-K for the year ended December 31, 2025, filed with the Securities and Exchange Commission (the “SEC”) on March 12, 2026, as such factors may be updated from time to time in the Company’s other filings with the SEC, and include the following: the Company’s ability to generate sufficient cash flows from operations, proceeds from equity issuances and debt financings, and proceeds from the sale of assets to satisfy its short and long-term debt obligations and to fund the Company’s acquisitions and capital improvement projects to expand, redevelop, and/or reposition its senior living communities; increased competition for, or a shortage of, skilled workers, including due to general labor market conditions, along with wage pressures resulting from such increased competition, low unemployment levels, use of contract labor, minimum wage increases and/or changes in immigration or overtime laws; elevated market interest rates that increase the cost of certain of our debt obligations; the Company’s ability to obtain additional capital on terms acceptable to it; the Company’s ability to extend or refinance its existing debt as such debt matures; the Company’s compliance with its debt agreements, including certain financial covenants and the risk of cross-default in the event such non-compliance occurs; the Company’s ability to complete acquisitions and dispositions upon favorable terms or at all, including the possibility that the expected benefits and the Company’s projections related to such acquisitions may not materialize as expected; our ability to integrate our business with CHP successfully, and to achieve the anticipated benefits; the possibility that companies that the Company has acquired (including CHP) or may acquire could have undiscovered liabilities, or that companies or assets that the Company has acquired (including CHP) or may acquire could involve other unexpected costs or may strain the Company’s management capabilities; potential adverse reactions or changes to business relationships resulting from the CHP Merger; the risk of oversupply and increased competition in the markets in which the Company operates; the Company’s ability to maintain internal controls over financial reporting; the cost and difficulty of complying with applicable licensure requirements, legislative oversight, or regulatory changes; risks associated with current global economic conditions and general economic factors such as elevated labor costs due to shortages of medical and non-medical staff, competition in the labor market, increased costs of salaries, wages and benefits, and immigration laws, the consumer price index, commodity costs, fuel and other energy costs, supply chain disruptions, increased insurance costs, tariffs, elevated interest rates and tax rates; the impact from or the potential emergence and effects of a future epidemic, pandemic, outbreak of infectious disease or other health crisis; the Company’s ability to maintain the security and functionality of its information systems, to prevent a cybersecurity attack or breach, and to comply with applicable privacy and consumer protection laws, including HIPAA; and changes in accounting principles and interpretations. We caution you that the risks, uncertainties and other factors referenced above may not contain all of the risks, uncertainties and other factors that are important to you. In addition, we cannot assure you that we will realize the results, benefits or outcomes that we expect or anticipate or, even if substantially realized, that they will result in the consequences or affect us or our business in the way expected. All forward-looking statements herein are expressly qualified in their entirety by the cautionary statements set forth herein. Forward-looking statements speak only as of the date of they are made, and the Company does not undertake or assume any obligation to update publicly any of these statements to reflect actual results, new information or future events, changes in assumptions or changes in other factors affecting forward-looking statements, except to the extent required by applicable law. 3
Executive Summary I N V E S T O R P R E S E N T A T I O N The Ashton at Mayfield 4
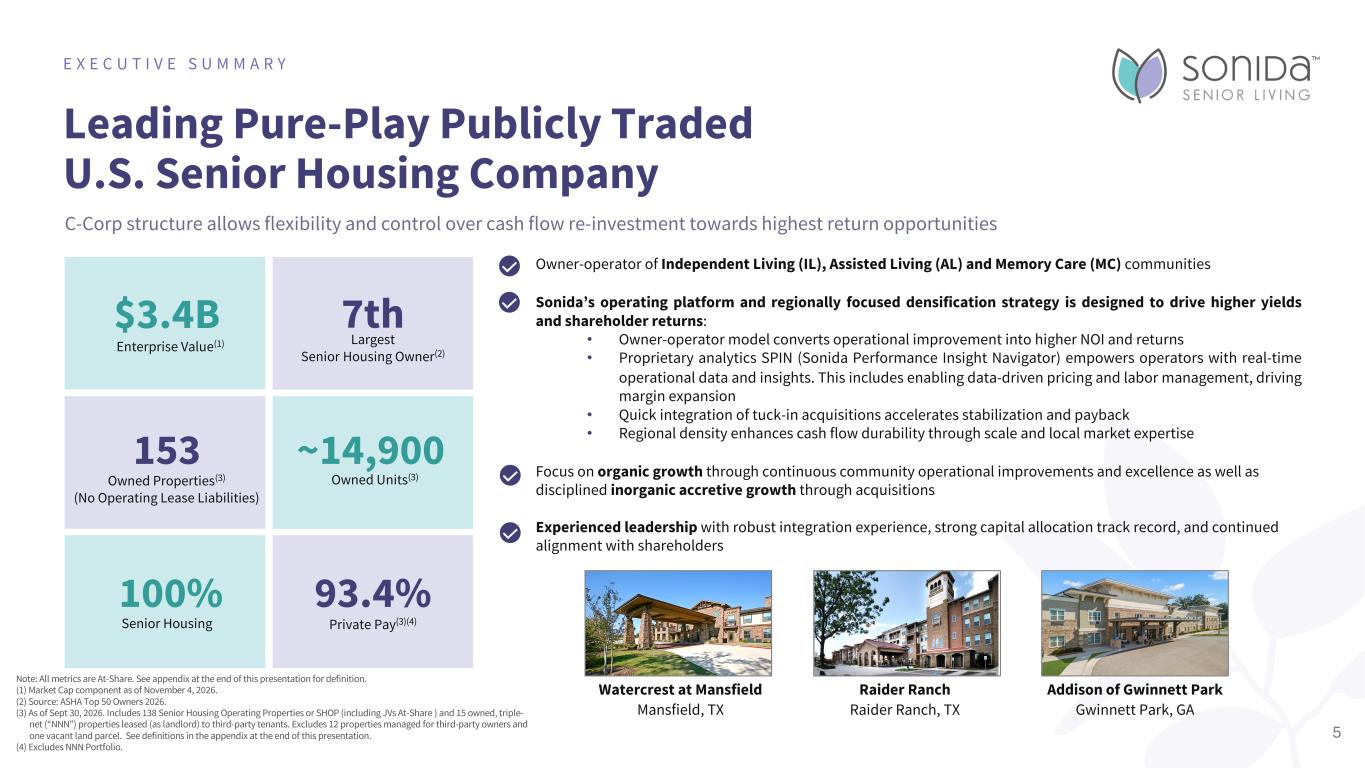
Leading Pure-Play Publicly Traded U.S. Senior Housing Company E X E C U T I V E S U M M A R Y $3.4B Enterprise Value(1) 7th Largest Senior Housing Owner(2) 153 ~14,900 100% Senior Housing 93.4% Private Pay(3)(4) Owned Properties(3) (No Operating Lease Liabilities) Owned Units(3) Owner-operator of Independent Living (IL), Assisted Living (AL) and Memory Care (MC) communities Sonida’s operating platform and regionally focused densification strategy is designed to drive higher yields and shareholder returns: • Owner-operator model converts operational improvement into higher NOI and returns • Proprietary analytics SPIN (Sonida Performance Insight Navigator) empowers operators with real-time operational data and insights. This includes enabling data-driven pricing and labor management, driving margin expansion • Quick integration of tuck-in acquisitions accelerates stabilization and payback • Regional density enhances cash flow durability through scale and local market expertise Focus on organic growth through continuous community operational improvements and excellence as well as disciplined inorganic accretive growth through acquisitions Experienced leadership with robust integration experience, strong capital allocation track record, and continued alignment with shareholders Watercrest at Mansfield Mansfield, TX Raider Ranch Raider Ranch, TX Addison of Gwinnett Park Gwinnett Park, GA Note: All metrics are At-Share. See appendix at the end of this presentation for definition. (1) Market Cap component as of November 4, 2026. (2) Source: ASHA Top 50 Owners 2026. (3) As of Sept 30, 2026. Includes 138 Senior Housing Operating Properties or SHOP (including JVs At-Share ) and 15 owned, triple- net (“NNN”) properties leased (as landlord) to third-party tenants. Excludes 12 properties managed for third-party owners and one vacant land parcel. See definitions in the appendix at the end of this presentation. (4) Excludes NNN Portfolio. 5 C-Corp structure allows flexibility and control over cash flow re-investment towards highest return opportunities
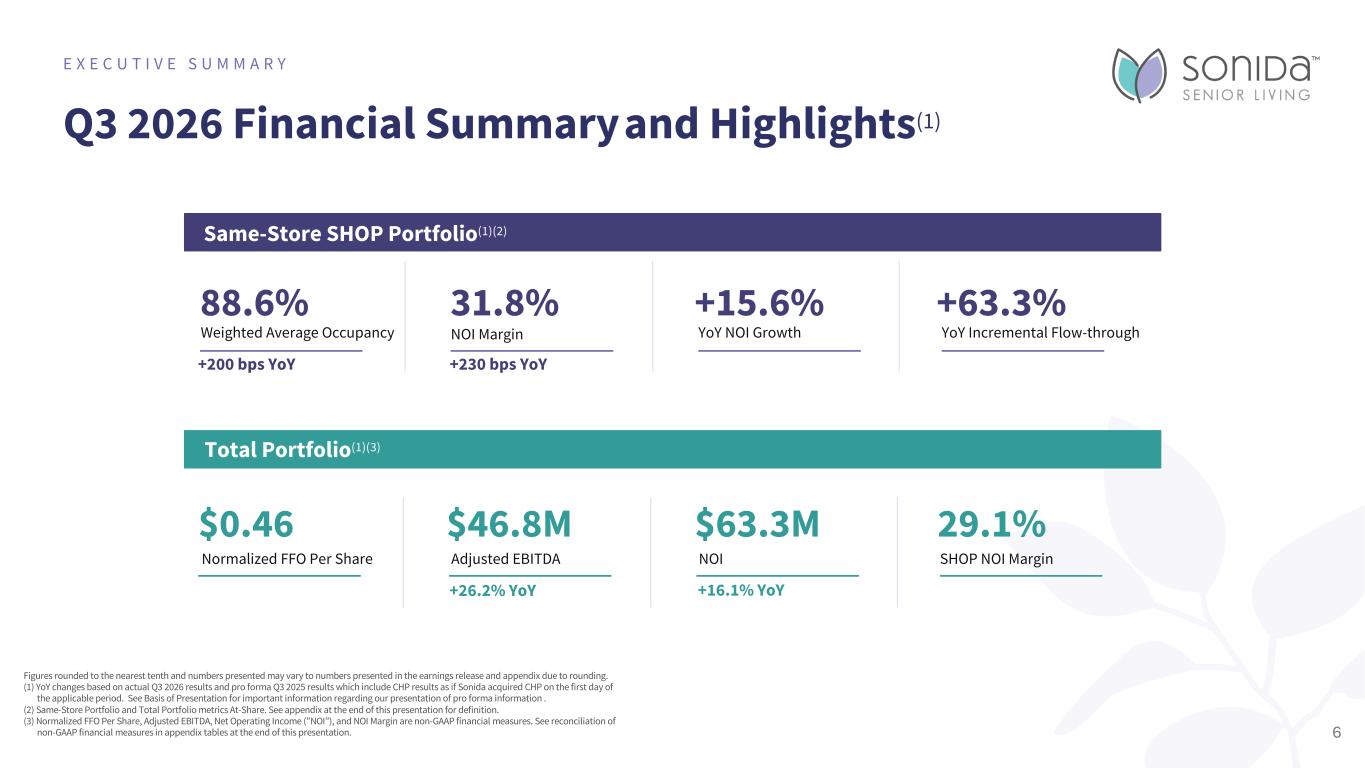
E X E C U T I V E S U M M A R Y 6 Q3 2026 Financial Summary and Highlights(1) Figures rounded to the nearest tenth and numbers presented may vary to numbers presented in the earnings release and appendix due to rounding. (1) YoY changes based on actual Q3 2026 results and pro forma Q3 2025 results which include CHP results as if Sonida acquired CHP on the first day of the applicable period. See Basis of Presentation for important information regarding our presentation of pro forma information . (2) Same-Store Portfolio and Total Portfolio metrics At-Share. See appendix at the end of this presentation for definition. (3) Normalized FFO Per Share, Adjusted EBITDA, Net Operating Income (”NOI”), and NOI Margin are non-GAAP financial measures. See reconciliation of non-GAAP financial measures in appendix tables at the end of this presentation. Same-Store SHOP Portfolio(1)(2) 88.6% Weighted Average Occupancy 31.8% +15.6% YoY NOI Growth +63.3% YoY Incremental Flow-through Total Portfolio(1)(3) $0.46 Normalized FFO Per Share $46.8M Adjusted EBITDA $63.3M NOI 29.1% SHOP NOI Margin NOI Margin +200 bps YoY +230 bps YoY +26.2% YoY +16.1% YoY
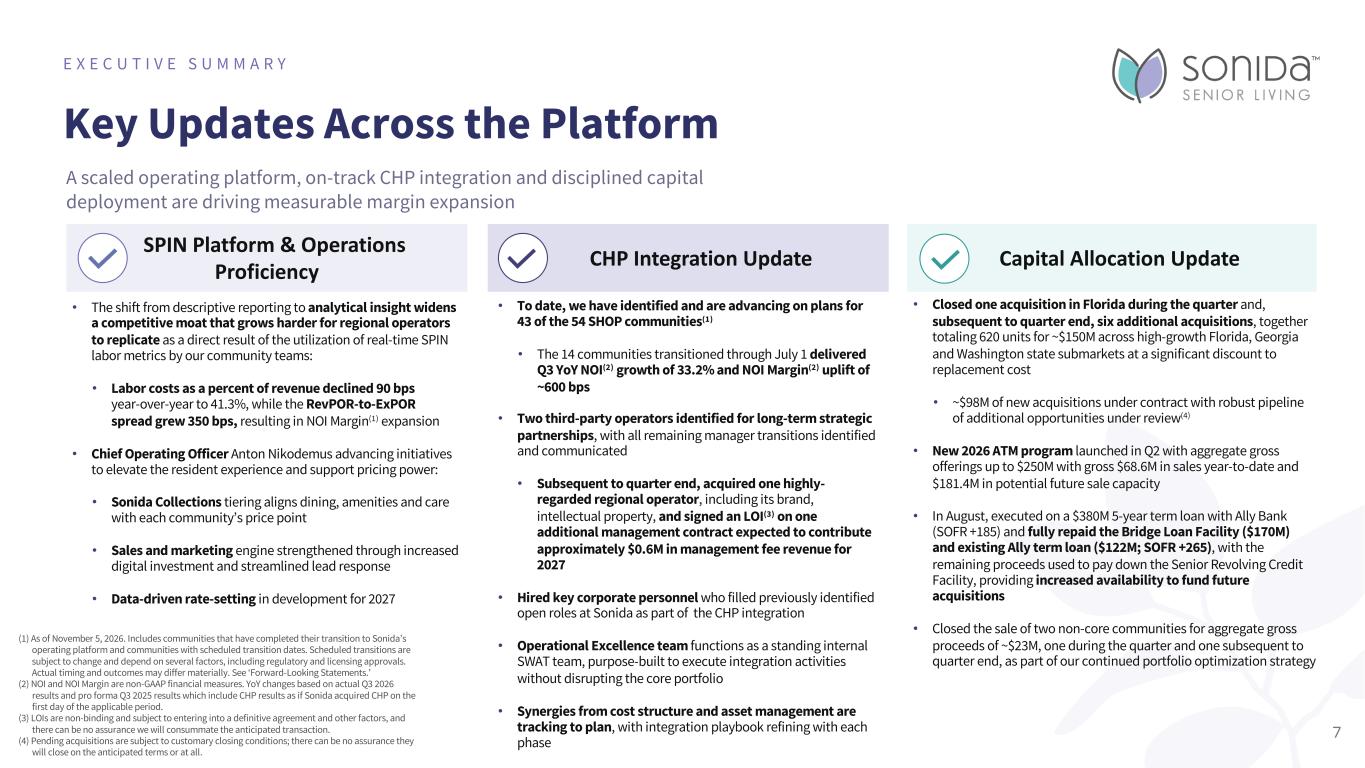
Key Updates Across the Platform E X E C U T I V E S U M M A R Y CHP Integration Update • The shift from descriptive reporting to analytical insight widens a competitive moat that grows harder for regional operators to replicate as a direct result of the utilization of real-time SPIN labor metrics by our community teams: • Labor costs as a percent of revenue declined 90 bps year-over-year to 41.3%, while the RevPOR-to-ExPOR spread grew 350 bps, resulting in NOI Margin(1) expansion • Chief Operating Officer Anton Nikodemus advancing initiatives to elevate the resident experience and support pricing power: • Sonida Collections tiering aligns dining, amenities and care with each community’s price point • Sales and marketing engine strengthened through increased digital investment and streamlined lead response • Data-driven rate-setting in development for 2027 SPIN Platform & Operations Proficiency • To date, we have identified and are advancing on plans for 43 of the 54 SHOP communities(1) • The 14 communities transitioned through July 1 delivered Q3 YoY NOI(2) growth of 33.2% and NOI Margin(2) uplift of ~600 bps • Two third-party operators identified for long-term strategic partnerships, with all remaining manager transitions identified and communicated • Subsequent to quarter end, acquired one highly- regarded regional operator, including its brand, intellectual property, and signed an LOI(3) on one additional management contract expected to contribute approximately $0.6M in management fee revenue for 2027 • Hired key corporate personnel who filled previously identified open roles at Sonida as part of the CHP integration • Operational Excellence team functions as a standing internal SWAT team, purpose-built to execute integration activities without disrupting the core portfolio • Synergies from cost structure and asset management are tracking to plan, with integration playbook refining with each phase Capital Allocation Update • Closed one acquisition in Florida during the quarter and, subsequent to quarter end, six additional acquisitions, together totaling 620 units for ~$150M across high-growth Florida, Georgia and Washington state submarkets at a significant discount to replacement cost • ~$98M of new acquisitions under contract with robust pipeline of additional opportunities under review(4) • New 2026 ATM program launched in Q2 with aggregate gross offerings up to $250M with gross $68.6M in sales year-to-date and $181.4M in potential future sale capacity • In August, executed on a $380M 5-year term loan with Ally Bank (SOFR +185) and fully repaid the Bridge Loan Facility ($170M) and existing Ally term loan ($122M; SOFR +265), with the remaining proceeds used to pay down the Senior Revolving Credit Facility, providing increased availability to fund future acquisitions • Closed the sale of two non-core communities for aggregate gross proceeds of ~$23M, one during the quarter and one subsequent to quarter end, as part of our continued portfolio optimization strategy A scaled operating platform, on-track CHP integration and disciplined capital deployment are driving measurable margin expansion (1) As of November 5, 2026. Includes communities that have completed their transition to Sonida’s operating platform and communities with scheduled transition dates. Scheduled transitions are subject to change and depend on several factors, including regulatory and licensing approvals. Actual timing and outcomes may differ materially. See ‘Forward-Looking Statements.’ (2) NOI and NOI Margin are non-GAAP financial measures. YoY changes based on actual Q3 2026 results and pro forma Q3 2025 results which include CHP results as if Sonida acquired CHP on the first day of the applicable period. (3) LOIs are non-binding and subject to entering into a definitive agreement and other factors, and there can be no assurance we will consummate the anticipated transaction. (4) Pending acquisitions are subject to customary closing conditions; there can be no assurance they will close on the anticipated terms or at all. 7
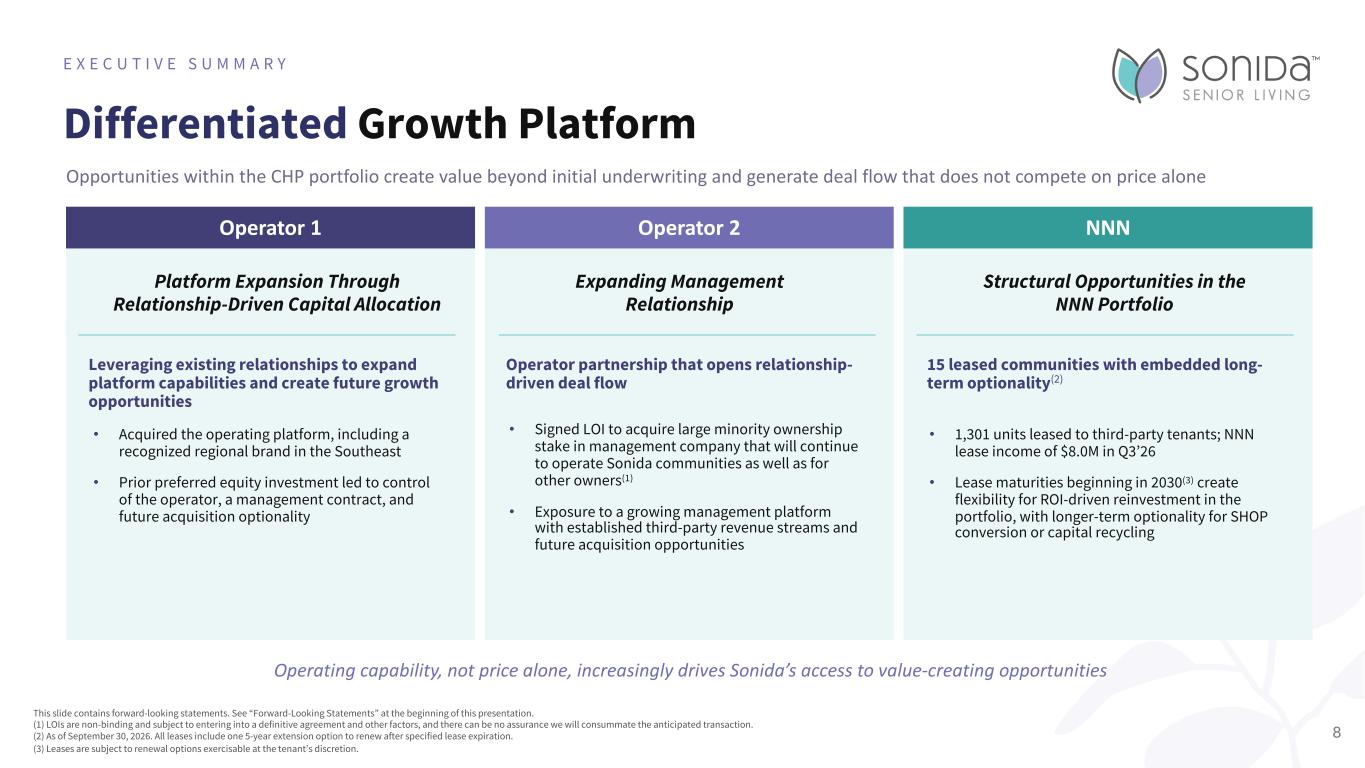
Differentiated Growth Platform E X E C U T I V E S U M M A R Y Opportunities within the CHP portfolio create value beyond initial underwriting and generate deal flow that does not compete on price alone • Acquired the operating platform, including a recognized regional brand in the Southeast • Prior preferred equity investment led to control of the operator, a management contract, and future acquisition optionality 8 Platform Expansion Through Relationship-Driven Capital Allocation Expanding Management Relationship Operator 1 Operator 2 NNN Structural Opportunities in the NNN Portfolio • Signed LOI to acquire large minority ownership stake in management company that will continue to operate Sonida communities as well as for other owners(1) • Exposure to a growing management platform with established third-party revenue streams and future acquisition opportunities • 1,301 units leased to third-party tenants; NNN lease income of $8.0M in Q3’26 • Lease maturities beginning in 2030(3) create flexibility for ROI-driven reinvestment in the portfolio, with longer-term optionality for SHOP conversion or capital recycling Leveraging existing relationships to expand platform capabilities and create future growth opportunities Operator partnership that opens relationship- driven deal flow 15 leased communities with embedded long- term optionality(2) Operating capability, not price alone, increasingly drives Sonida’s access to value-creating opportunities This slide contains forward-looking statements. See “Forward-Looking Statements” at the beginning of this presentation. (1) LOIs are non-binding and subject to entering into a definitive agreement and other factors, and there can be no assurance we will consummate the anticipated transaction. (2) As of September 30, 2026. All leases include one 5-year extension option to renew after specified lease expiration. (3) Leases are subject to renewal options exercisable at the tenant’s discretion.
Overview I N V E S T O R P R E S E N T A T I O N 9Dogwood Forest of Grayson
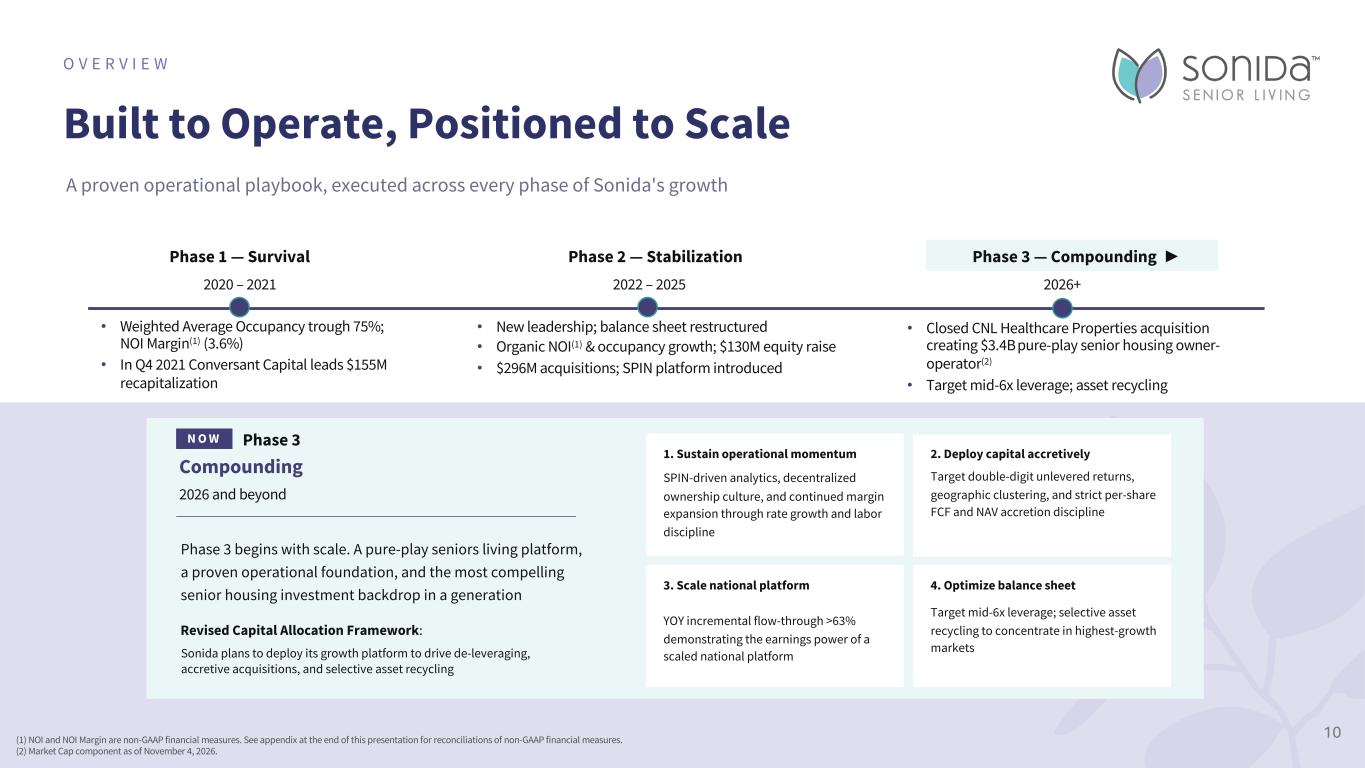
Built to Operate, Positioned to Scale O V E R V I E W N O W Phase 3 Compounding 2026 and beyond Phase 3 begins with scale. A pure-play seniors living platform, a proven operational foundation, and the most compelling senior housing investment backdrop in a generation 1. Sustain operational momentum SPIN-driven analytics, decentralized ownership culture, and continued margin expansion through rate growth and labor discipline 2. Deploy capital accretively Target double-digit unlevered returns, geographic clustering, and strict per-share FCF and NAV accretion discipline 3. Scale national platform YOY incremental flow-through >63% demonstrating the earnings power of a scaled national platform 4. Optimize balance sheet Target mid-6x leverage; selective asset recycling to concentrate in highest-growth markets • Weighted Average Occupancy trough 75%; NOI Margin(1) (3.6%) • In Q4 2021 Conversant Capital leads $155M recapitalization • New leadership; balance sheet restructured • Organic NOI(1) & occupancy growth; $130M equity raise • $296M acquisitions; SPIN platform introduced • Closed CNL Healthcare Properties acquisition creating $3.4B pure-play senior housing owner- operator(2) • Target mid-6x leverage; asset recycling Phase 1 — Survival 2020 – 2021 Phase 2 — Stabilization 2022 – 2025 Phase 3 — Compounding ► 2026+ Revised Capital Allocation Framework: Sonida plans to deploy its growth platform to drive de-leveraging, accretive acquisitions, and selective asset recycling A proven operational playbook, executed across every phase of Sonida's growth (1) NOI and NOI Margin are non-GAAP financial measures. See appendix at the end of this presentation for reconciliations of non-GAAP financial measures. (2) Market Cap component as of November 4, 2026. 10
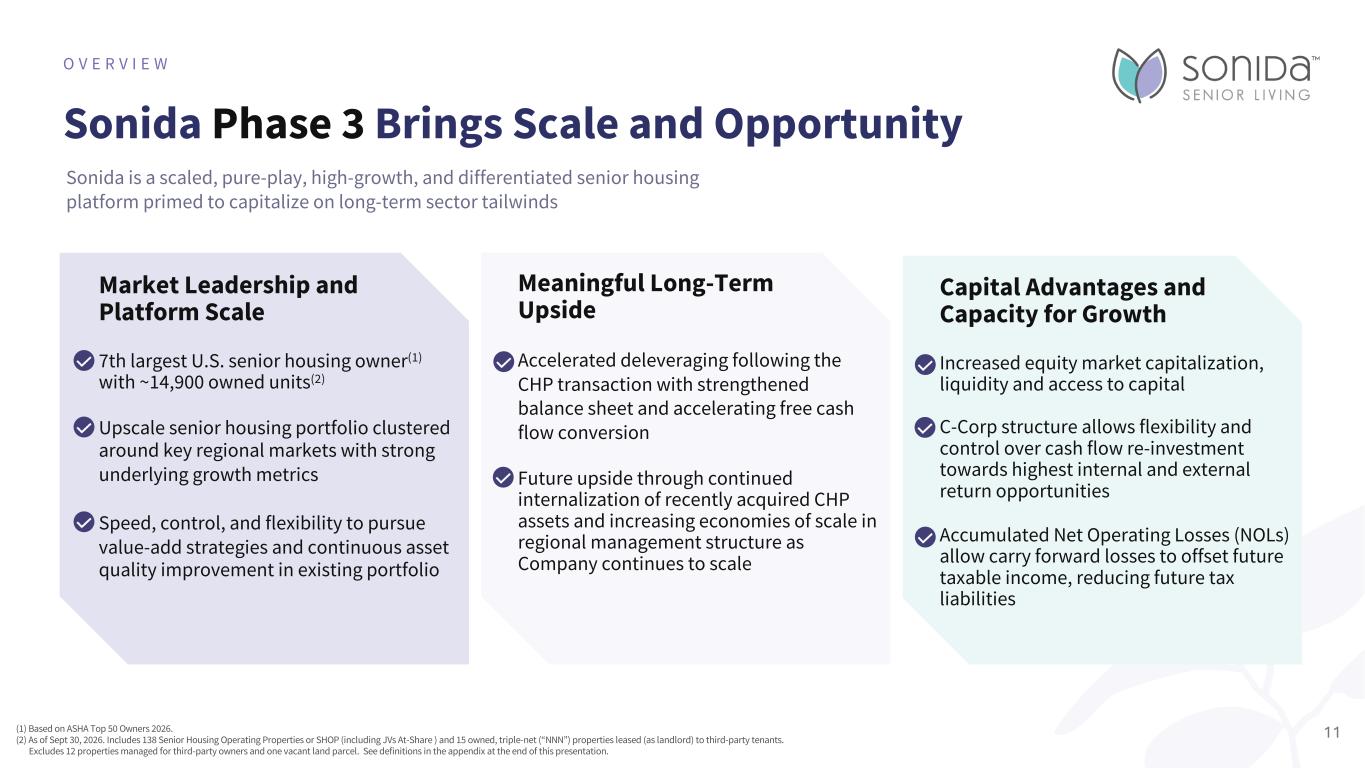
Sonida Phase 3 Brings Scale and Opportunity O V E R V I E W (1) Based on ASHA Top 50 Owners 2026. (2) As of Sept 30, 2026. Includes 138 Senior Housing Operating Properties or SHOP (including JVs At-Share ) and 15 owned, triple-net (“NNN”) properties leased (as landlord) to third-party tenants. Excludes 12 properties managed for third-party owners and one vacant land parcel. See definitions in the appendix at the end of this presentation. Market Leadership and Platform Scale 7th largest U.S. senior housing owner(1) with ~14,900 owned units(2) Upscale senior housing portfolio clustered around key regional markets with strong underlying growth metrics Speed, control, and flexibility to pursue value-add strategies and continuous asset quality improvement in existing portfolio Meaningful Long-Term Upside Accelerated deleveraging following the CHP transaction with strengthened balance sheet and accelerating free cash flow conversion Future upside through continued internalization of recently acquired CHP assets and increasing economies of scale in regional management structure as Company continues to scale Capital Advantages and Capacity for Growth Increased equity market capitalization, liquidity and access to capital C-Corp structure allows flexibility and control over cash flow re-investment towards highest internal and external return opportunities Accumulated Net Operating Losses (NOLs) allow carry forward losses to offset future taxable income, reducing future tax liabilities Sonida is a scaled, pure-play, high-growth, and differentiated senior housing platform primed to capitalize on long-term sector tailwinds 11
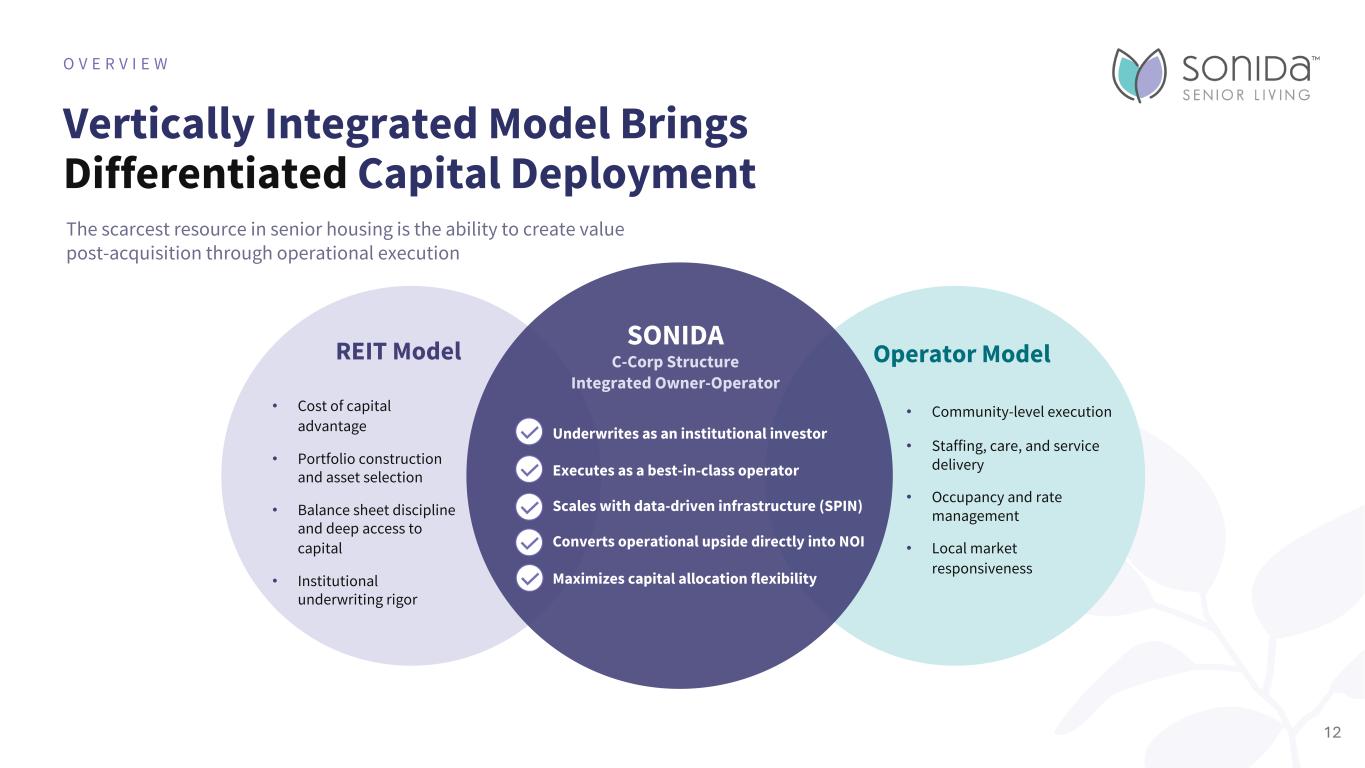
Vertically Integrated Model Brings Differentiated Capital Deployment O V E R V I E W The scarcest resource in senior housing is the ability to create value post-acquisition through operational execution REIT Model • Cost of capital advantage • Portfolio construction and asset selection • Balance sheet discipline and deep access to capital • Institutional underwriting rigor SONIDA C-Corp Structure Integrated Owner-Operator Underwrites as an institutional investor Executes as a best-in-class operator Scales with data-driven infrastructure (SPIN) Converts operational upside directly into NOI Maximizes capital allocation flexibility Operator Model • Community-level execution • Staffing, care, and service delivery • Occupancy and rate management • Local market responsiveness 12
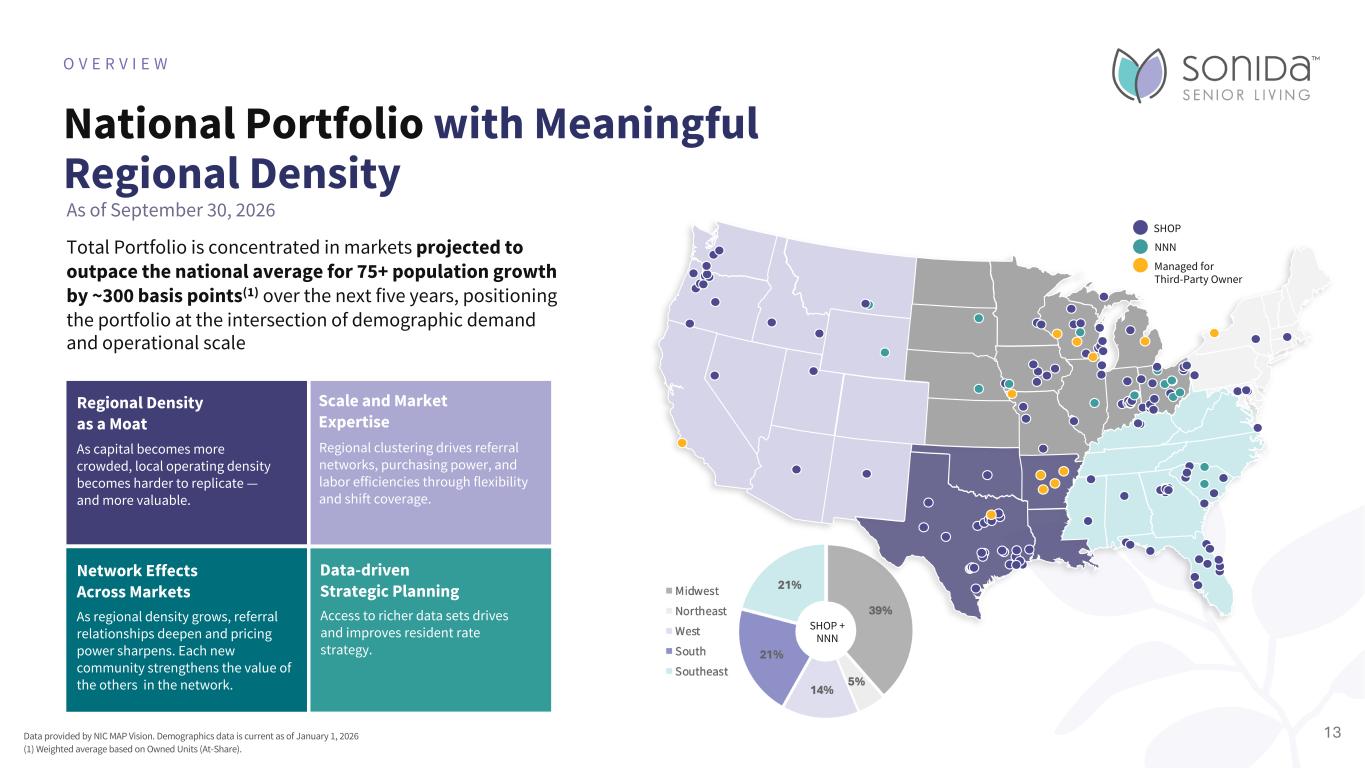
National Portfolio with Meaningful Regional Density O V E R V I E W Managed for Third-Party Owner SHOP NNN 13Data provided by NIC MAP Vision. Demographics data is current as of January 1, 2026 (1) Weighted average based on Owned Units (At-Share). Regional Density as a Moat As capital becomes more crowded, local operating density becomes harder to replicate — and more valuable. Scale and Market Expertise As regional density grows, referral relationships deepen and pricing power sharpens. Each new community strengthens the value of the others in the network. Network Effects Across Markets Regional clustering drives referral networks, purchasing power, and labor efficiencies through flexibility and shift coverage. Data-driven Strategic Planning Access to richer data sets drives and improves resident rate strategy. Total Portfolio is concentrated in markets projected to outpace the national average for 75+ population growth by ~300 basis points(1) over the next five years, positioning the portfolio at the intersection of demographic demand and operational scale SHOP + NNN As of September 30, 2026
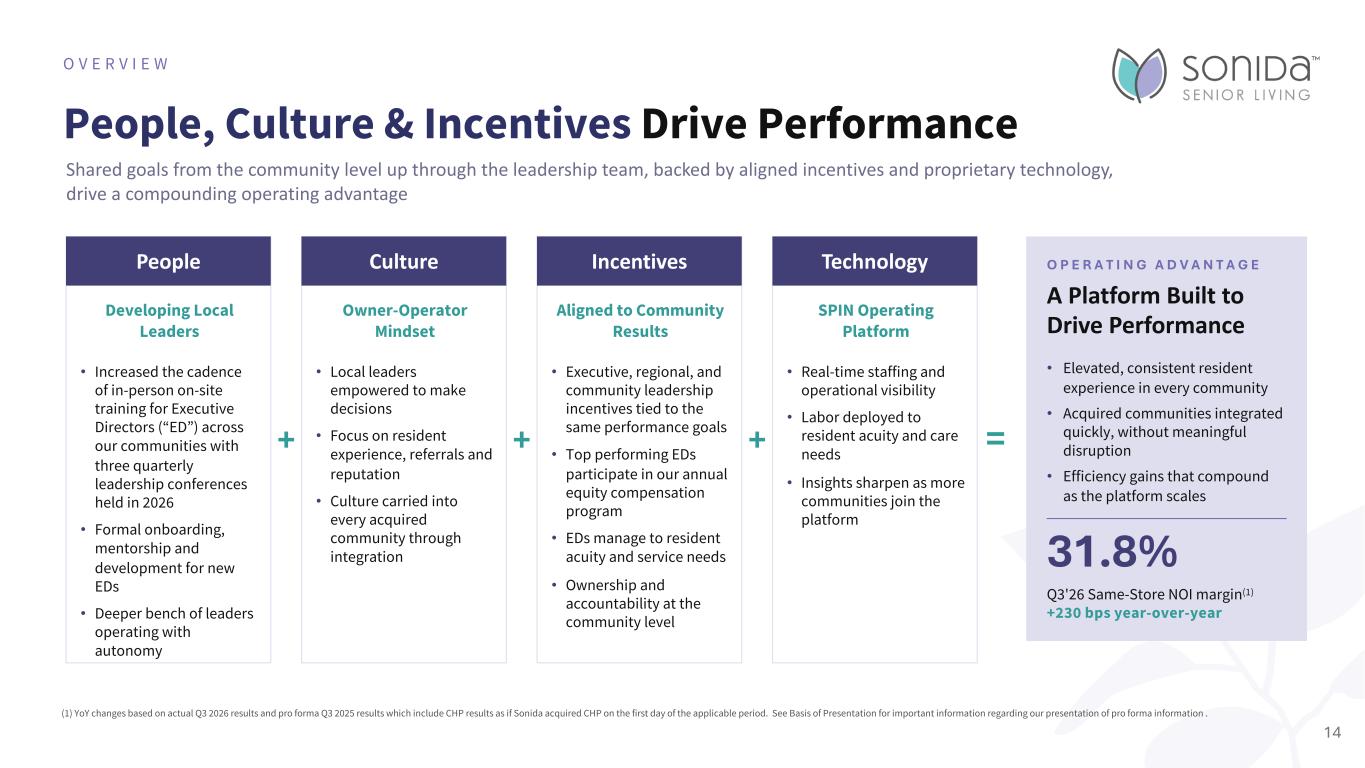
People, Culture & Incentives Drive Performance O V E R V I E W Shared goals from the community level up through the leadership team, backed by aligned incentives and proprietary technology, drive a compounding operating advantage 14 (1) YoY changes based on actual Q3 2026 results and pro forma Q3 2025 results which include CHP results as if Sonida acquired CHP on the first day of the applicable period. See Basis of Presentation for important information regarding our presentation of pro forma information . People Developing Local Leaders • Increased the cadence of in-person on-site training for Executive Directors (“ED”) across our communities with three quarterly leadership conferences held in 2026 • Formal onboarding, mentorship and development for new EDs • Deeper bench of leaders operating with autonomy + Culture Owner-Operator Mindset • Local leaders empowered to make decisions • Focus on resident experience, referrals and reputation • Culture carried into every acquired community through integration + Incentives Aligned to Community Results • Executive, regional, and community leadership incentives tied to the same performance goals • Top performing EDs participate in our annual equity compensation program • EDs manage to resident acuity and service needs • Ownership and accountability at the community level + Technology SPIN Operating Platform • Real-time staffing and operational visibility • Labor deployed to resident acuity and care needs • Insights sharpen as more communities join the platform = O P E R A T I N G A D V A N T A G E A Platform Built to Drive Performance • Elevated, consistent resident experience in every community • Acquired communities integrated quickly, without meaningful disruption • Efficiency gains that compound as the platform scales 31.8% Q3'26 Same-Store NOI margin(1) +230 bps year-over-year
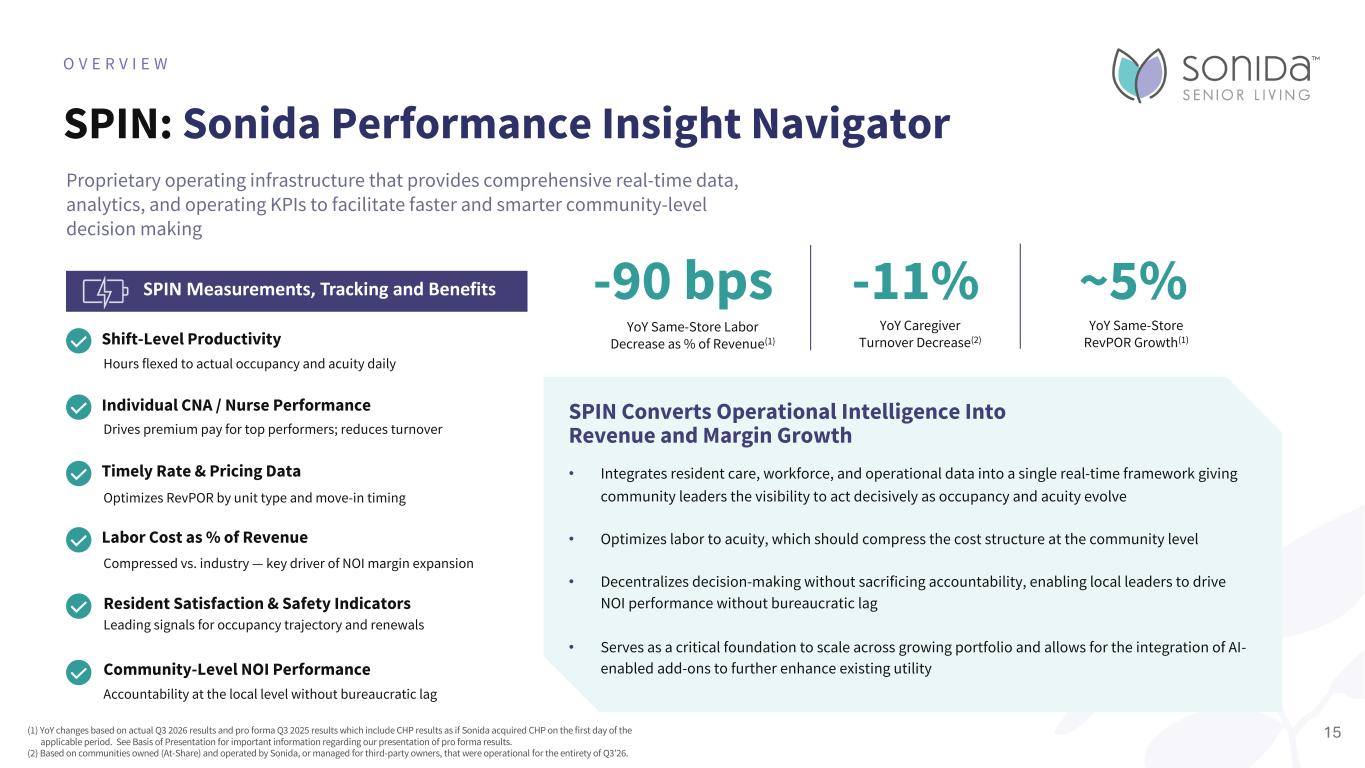
15 SPIN: Sonida Performance Insight Navigator O V E R V I E W Proprietary operating infrastructure that provides comprehensive real-time data, analytics, and operating KPIs to facilitate faster and smarter community-level decision making SPIN Measurements, Tracking and Benefits Shift-Level Productivity Hours flexed to actual occupancy and acuity daily Individual CNA / Nurse Performance Drives premium pay for top performers; reduces turnover Timely Rate & Pricing Data Optimizes RevPOR by unit type and move-in timing Labor Cost as % of Revenue Compressed vs. industry — key driver of NOI margin expansion Resident Satisfaction & Safety Indicators Leading signals for occupancy trajectory and renewals Community-Level NOI Performance Accountability at the local level without bureaucratic lag • Integrates resident care, workforce, and operational data into a single real-time framework giving community leaders the visibility to act decisively as occupancy and acuity evolve • Optimizes labor to acuity, which should compress the cost structure at the community level • Decentralizes decision-making without sacrificing accountability, enabling local leaders to drive NOI performance without bureaucratic lag • Serves as a critical foundation to scale across growing portfolio and allows for the integration of AI- enabled add-ons to further enhance existing utility SPIN Converts Operational Intelligence Into Revenue and Margin Growth -90 bps YoY Same-Store Labor Decrease as % of Revenue(1) -11% YoY Caregiver Turnover Decrease(2) ~5% YoY Same-Store RevPOR Growth(1) (1) YoY changes based on actual Q3 2026 results and pro forma Q3 2025 results which include CHP results as if Sonida acquired CHP on the first day of the applicable period. See Basis of Presentation for important information regarding our presentation of pro forma results. (2) Based on communities owned (At-Share) and operated by Sonida, or managed for third-party owners, that were operational for the entirety of Q3’26.
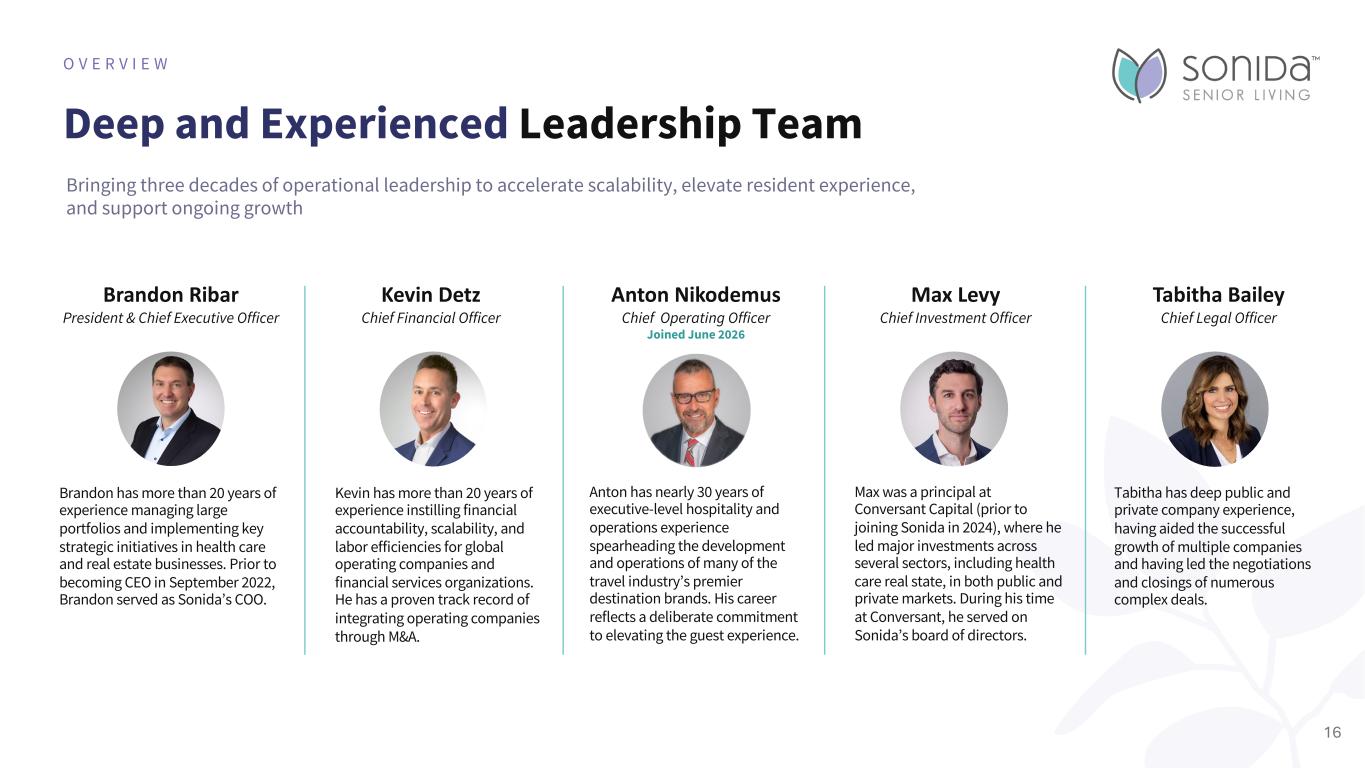
Deep and Experienced Leadership Team O V E R V I E W Brandon Ribar President & Chief Executive Officer Kevin Detz Chief Financial Officer Max Levy Chief Investment Officer Tabitha Bailey Chief Legal Officer Brandon has more than 20 years of experience managing large portfolios and implementing key strategic initiatives in health care and real estate businesses. Prior to becoming CEO in September 2022, Brandon served as Sonida’s COO. Kevin has more than 20 years of experience instilling financial accountability, scalability, and labor efficiencies for global operating companies and financial services organizations. He has a proven track record of integrating operating companies through M&A. Max was a principal at Conversant Capital (prior to joining Sonida in 2024), where he led major investments across several sectors, including health care real state, in both public and private markets. During his time at Conversant, he served on Sonida’s board of directors. Tabitha has deep public and private company experience, having aided the successful growth of multiple companies and having led the negotiations and closings of numerous complex deals. 16 Anton Nikodemus Chief Operating Officer Joined June 2026 Anton has nearly 30 years of executive-level hospitality and operations experience spearheading the development and operations of many of the travel industry’s premier destination brands. His career reflects a deliberate commitment to elevating the guest experience. Bringing three decades of operational leadership to accelerate scalability, elevate resident experience, and support ongoing growth
Financial Performance I N V E S T O R P R E S E N T A T I O N 17Heritage at The Plains at Parish Homestead
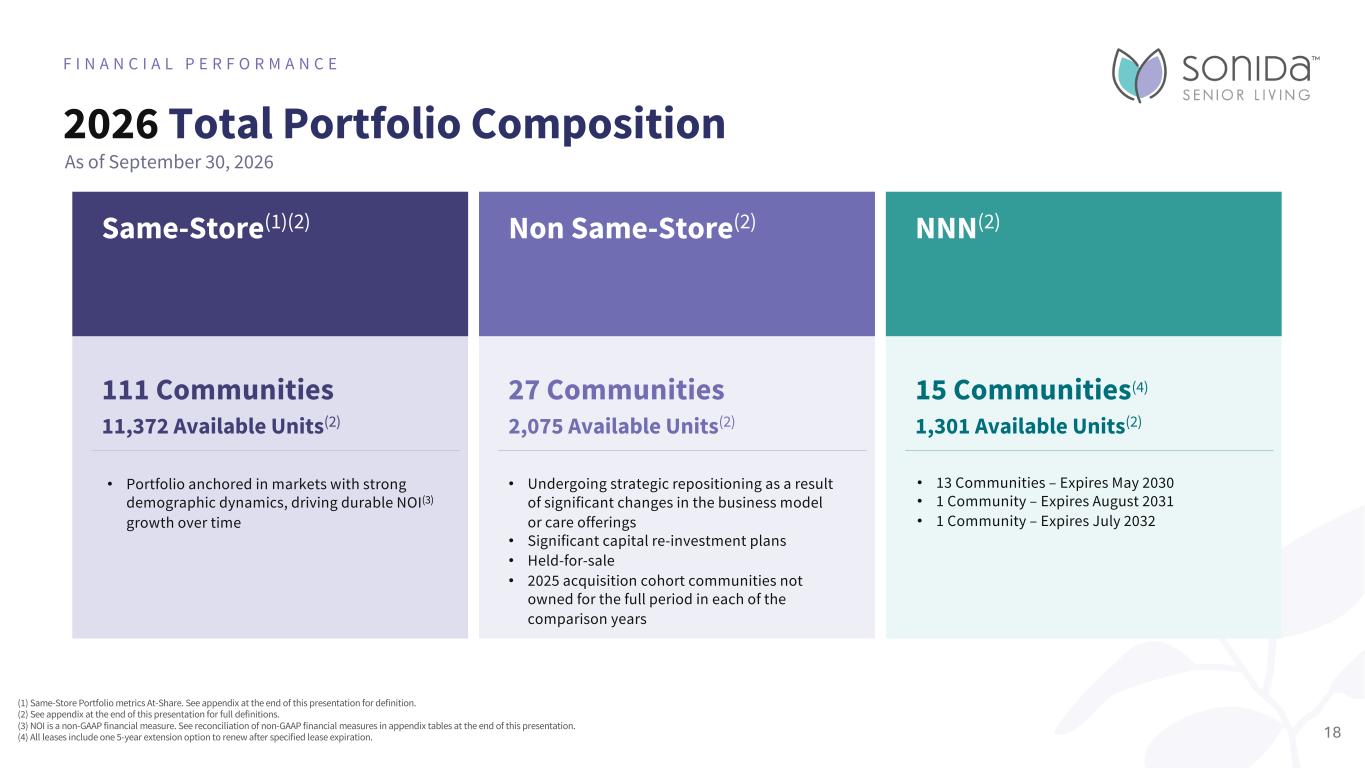
2026 Total Portfolio Composition F I N A N C I A L P E R F O R M A N C E (1) Same-Store Portfolio metrics At-Share. See appendix at the end of this presentation for definition. (2) See appendix at the end of this presentation for full definitions. (3) NOI is a non-GAAP financial measure. See reconciliation of non-GAAP financial measures in appendix tables at the end of this presentation. (4) All leases include one 5-year extension option to renew after specified lease expiration. Same-Store(1)(2) 111 Communities 11,372 Available Units(2) • Portfolio anchored in markets with strong demographic dynamics, driving durable NOI(3) growth over time Non Same-Store(2) 27 Communities 2,075 Available Units(2) • Undergoing strategic repositioning as a result of significant changes in the business model or care offerings • Significant capital re-investment plans • Held-for-sale • 2025 acquisition cohort communities not owned for the full period in each of the comparison years NNN(2) 15 Communities(4) 1,301 Available Units(2) • 13 Communities – Expires May 2030 • 1 Community – Expires August 2031 • 1 Community – Expires July 2032 18 As of September 30, 2026
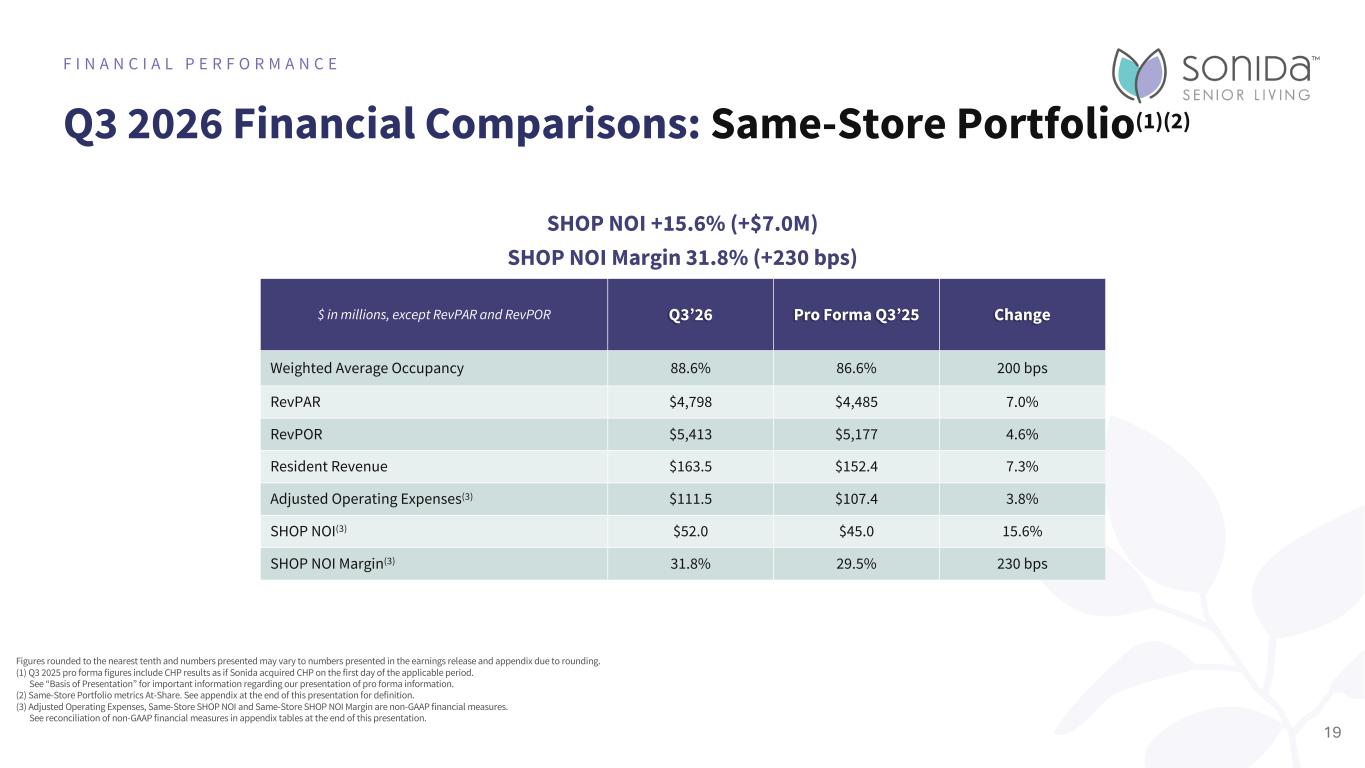
Q3 2026 Financial Comparisons: Same-Store Portfolio(1)(2) F I N A N C I A L P E R F O R M A N C E Figures rounded to the nearest tenth and numbers presented may vary to numbers presented in the earnings release and appendix due to rounding. (1) Q3 2025 pro forma figures include CHP results as if Sonida acquired CHP on the first day of the applicable period. See “Basis of Presentation” for important information regarding our presentation of pro forma information. (2) Same-Store Portfolio metrics At-Share. See appendix at the end of this presentation for definition. (3) Adjusted Operating Expenses, Same-Store SHOP NOI and Same-Store SHOP NOI Margin are non-GAAP financial measures. See reconciliation of non-GAAP financial measures in appendix tables at the end of this presentation. $ in millions, except RevPAR and RevPOR Q3’26 Pro Forma Q3’25 Change Weighted Average Occupancy 88.6% 86.6% 200 bps RevPAR $4,798 $4,485 7.0% RevPOR $5,413 $5,177 4.6% Resident Revenue $163.5 $152.4 7.3% Adjusted Operating Expenses(3) $111.5 $107.4 3.8% SHOP NOI(3) $52.0 $45.0 15.6% SHOP NOI Margin(3) 31.8% 29.5% 230 bps SHOP NOI +15.6% (+$7.0M) SHOP NOI Margin 31.8% (+230 bps) 19
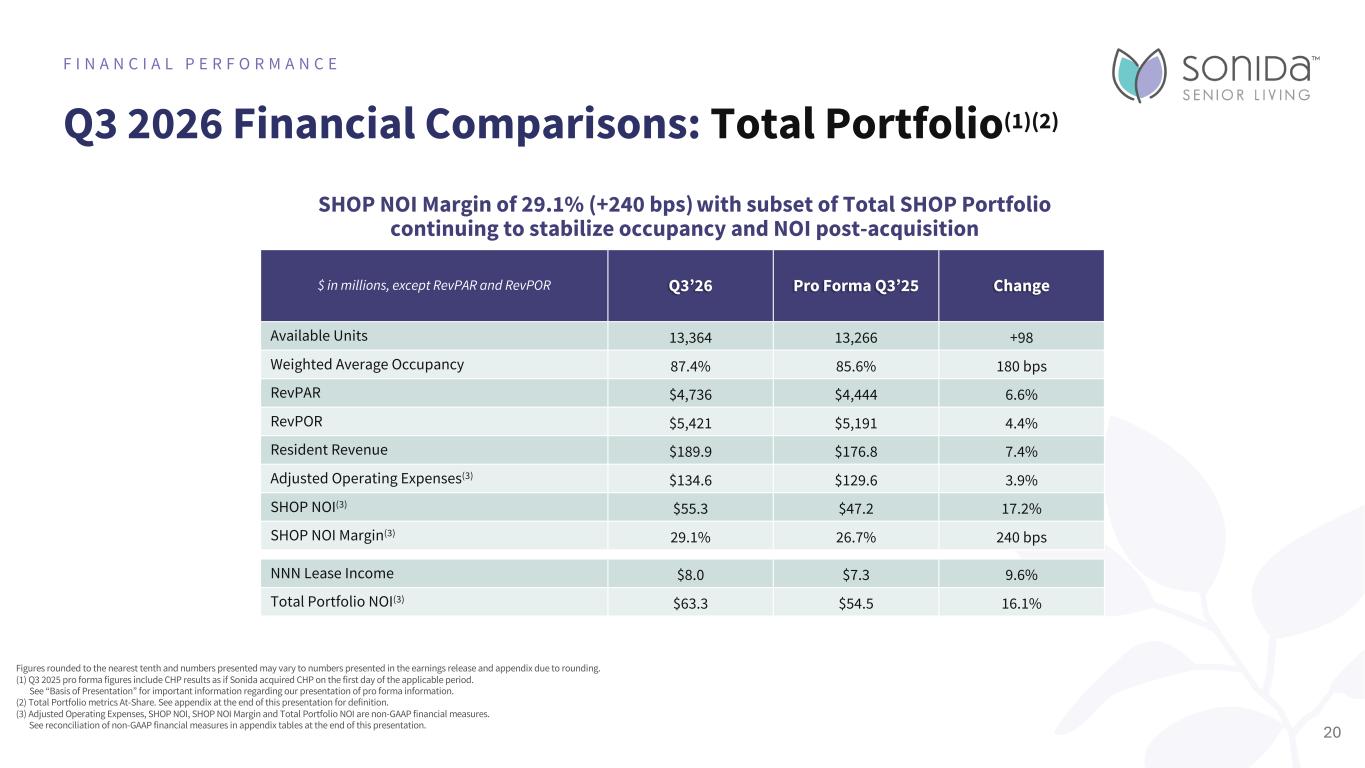
NNN Lease Income $8.0 $7.3 9.6% Total Portfolio NOI(3) $63.3 $54.5 16.1% Q3 2026 Financial Comparisons: Total Portfolio(1)(2) F I N A N C I A L P E R F O R M A N C E Figures rounded to the nearest tenth and numbers presented may vary to numbers presented in the earnings release and appendix due to rounding. (1) Q3 2025 pro forma figures include CHP results as if Sonida acquired CHP on the first day of the applicable period. See “Basis of Presentation” for important information regarding our presentation of pro forma information. (2) Total Portfolio metrics At-Share. See appendix at the end of this presentation for definition. (3) Adjusted Operating Expenses, SHOP NOI, SHOP NOI Margin and Total Portfolio NOI are non-GAAP financial measures. See reconciliation of non-GAAP financial measures in appendix tables at the end of this presentation. SHOP NOI Margin of 29.1% (+240 bps) with subset of Total SHOP Portfolio continuing to stabilize occupancy and NOI post-acquisition $ in millions, except RevPAR and RevPOR Q3’26 Pro Forma Q3’25 Change Available Units 13,364 13,266 +98 Weighted Average Occupancy 87.4% 85.6% 180 bps RevPAR $4,736 $4,444 6.6% RevPOR $5,421 $5,191 4.4% Resident Revenue $189.9 $176.8 7.4% Adjusted Operating Expenses(3) $134.6 $129.6 3.9% SHOP NOI(3) $55.3 $47.2 17.2% SHOP NOI Margin(3) 29.1% 26.7% 240 bps 20
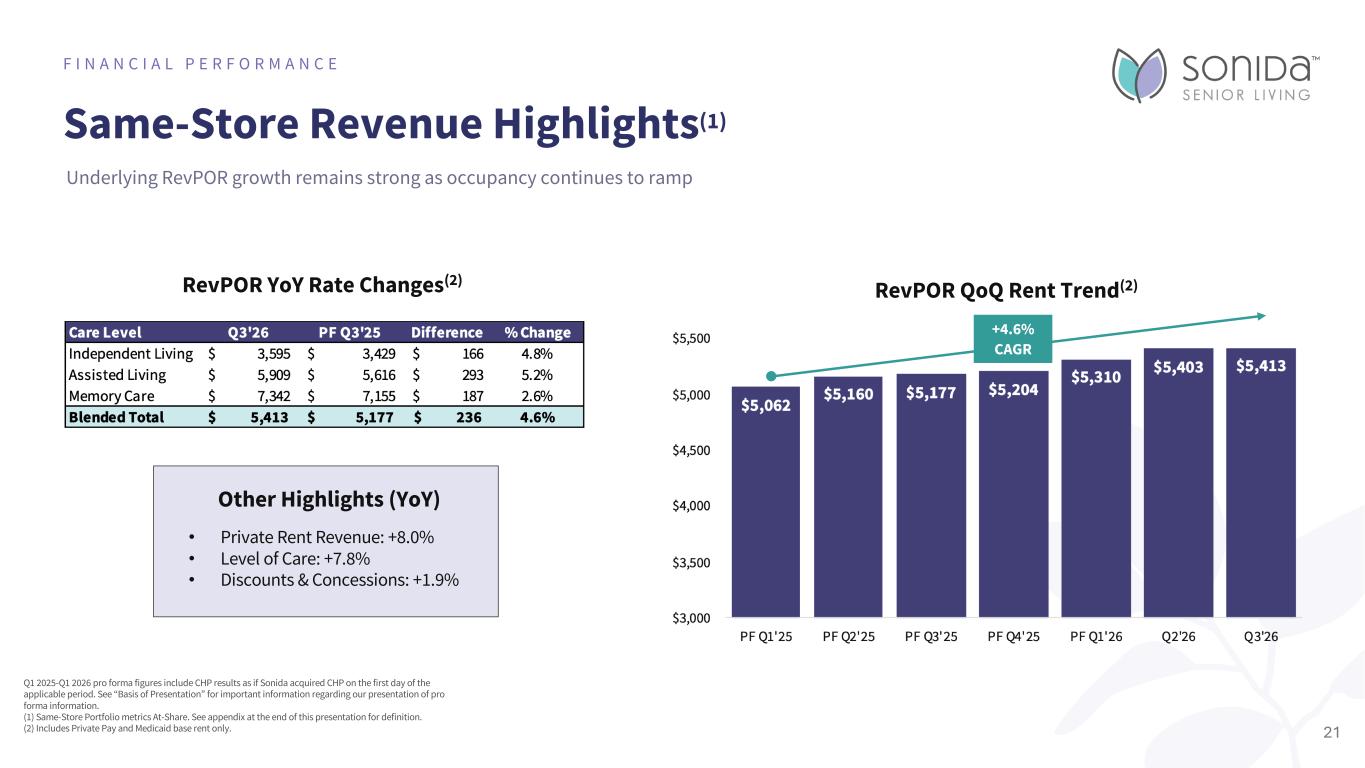
Same-Store Revenue Highlights(1) F I N A N C I A L P E R F O R M A N C E Q1 2025-Q1 2026 pro forma figures include CHP results as if Sonida acquired CHP on the first day of the applicable period. See “Basis of Presentation” for important information regarding our presentation of pro forma information. (1) Same-Store Portfolio metrics At-Share. See appendix at the end of this presentation for definition. (2) Includes Private Pay and Medicaid base rent only. RevPOR YoY Rate Changes(2) RevPOR QoQ Rent Trend(2) Other Highlights (YoY) • Private Rent Revenue: +8.0% • Level of Care: +7.8% • Discounts & Concessions: +1.9% 21 Underlying RevPOR growth remains strong as occupancy continues to ramp +4.6% CAGR
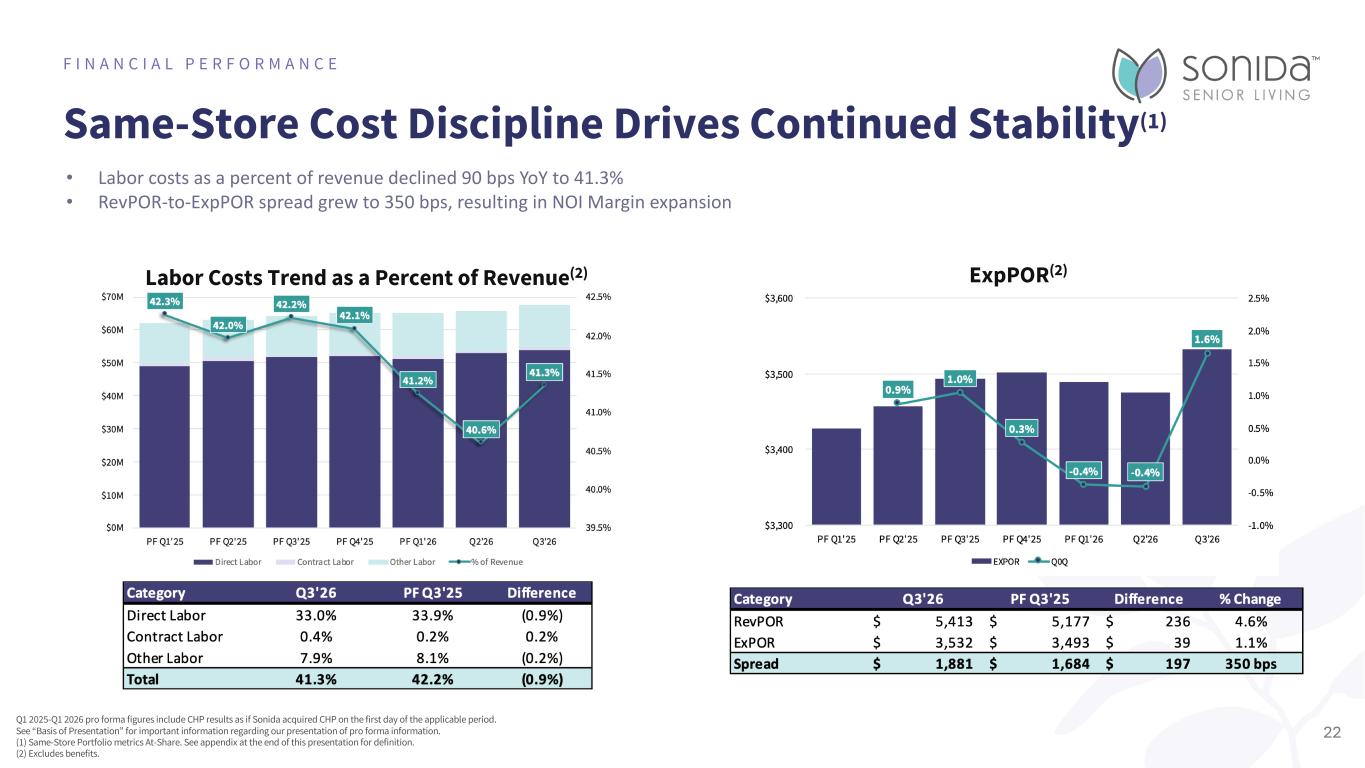
Same-Store Cost Discipline Drives Continued Stability(1) F I N A N C I A L P E R F O R M A N C E Q1 2025-Q1 2026 pro forma figures include CHP results as if Sonida acquired CHP on the first day of the applicable period. See “Basis of Presentation” for important information regarding our presentation of pro forma information. (1) Same-Store Portfolio metrics At-Share. See appendix at the end of this presentation for definition. (2) Excludes benefits. • Labor costs as a percent of revenue declined 90 bps YoY to 41.3% • RevPOR-to-ExpPOR spread grew to 350 bps, resulting in NOI Margin expansion 22 Labor Costs Trend as a Percent of Revenue(2) ExpPOR(2)
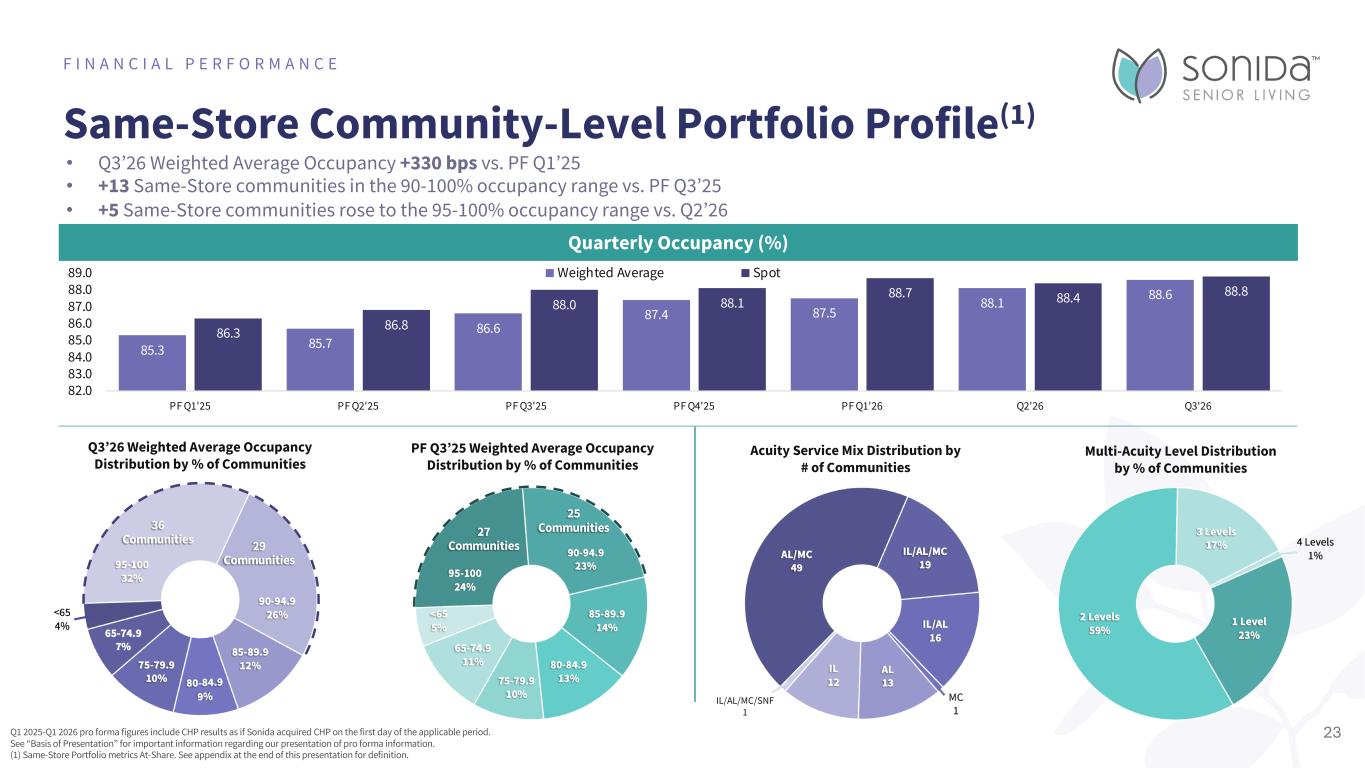
Same-Store Community-Level Portfolio Profile(1) F I N A N C I A L P E R F O R M A N C E 85.3 85.7 86.6 87.4 87.5 88.1 88.6 86.3 86.8 88.0 88.1 88.7 88.4 88.8 82.0 83.0 84.0 85.0 86.0 87.0 88.0 89.0 PF Q1'25 PF Q2'25 PF Q3'25 PF Q4'25 PF Q1'26 Q2'26 Q3'26 Weighted Average Spot Quarterly Occupancy (%) Acuity Service Mix Distribution by # of Communities Multi-Acuity Level Distribution by % of Communities 23 • Q3’26 Weighted Average Occupancy +330 bps vs. PF Q1’25 Q3’26 Weighted Average Occupancy Distribution by % of Communities PF Q3’25 Weighted Average Occupancy Distribution by % of Communities Q1 2025-Q1 2026 pro forma figures include CHP results as if Sonida acquired CHP on the first day of the applicable period. See “Basis of Presentation” for important information regarding our presentation of pro forma information. (1) Same-Store Portfolio metrics At-Share. See appendix at the end of this presentation for definition. • +13 Same-Store communities in the 90-100% occupancy range vs. PF Q3’25 • +5 Same-Store communities rose to the 95-100% occupancy range vs. Q2’26 36 Communities 29 Communities 27 Communities 25 Communities IL/AL/MC/SNF 1
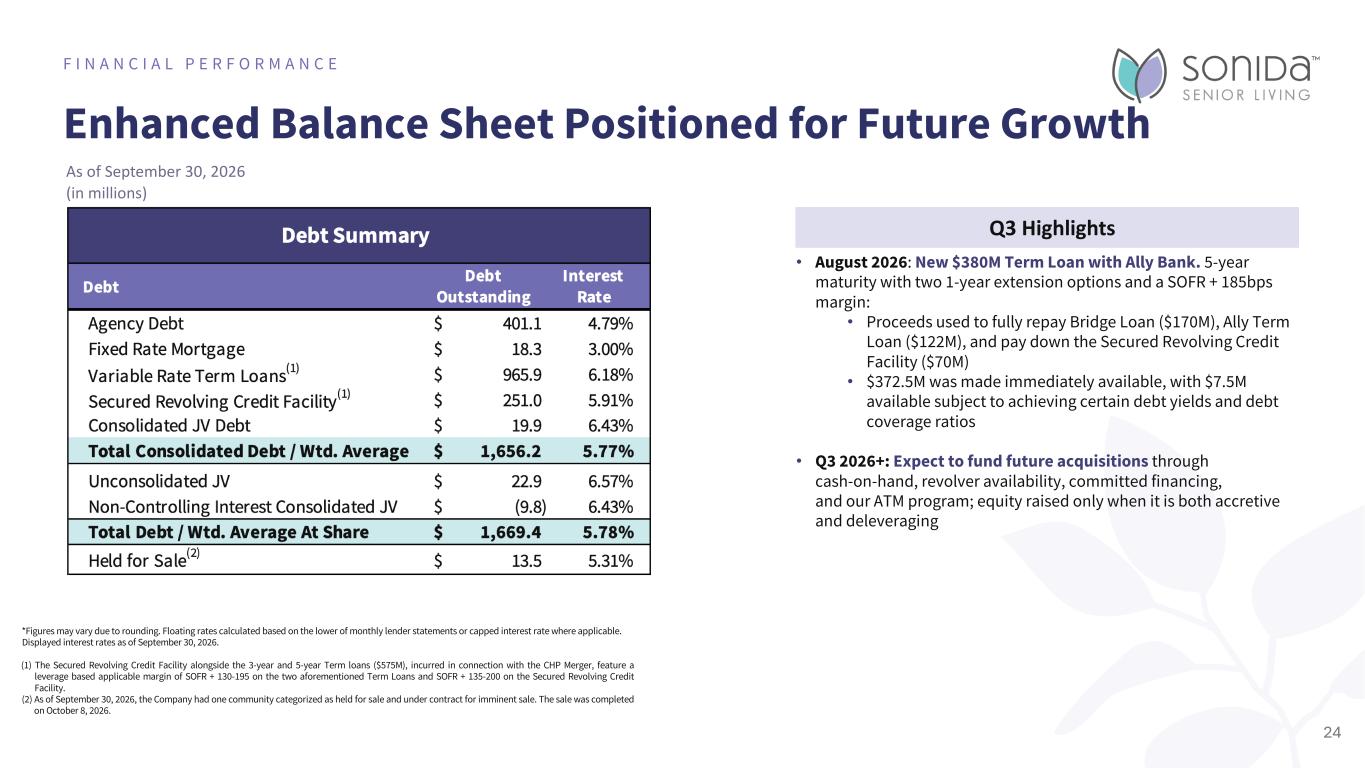
Enhanced Balance Sheet Positioned for Future Growth F I N A N C I A L P E R F O R M A N C E As of September 30, 2026 (in millions) 24 *Figures may vary due to rounding. Floating rates calculated based on the lower of monthly lender statements or capped interest rate where applicable. Displayed interest rates as of September 30, 2026. (1) The Secured Revolving Credit Facility alongside the 3-year and 5-year Term loans ($575M), incurred in connection with the CHP Merger, feature a leverage based applicable margin of SOFR + 130-195 on the two aforementioned Term Loans and SOFR + 135-200 on the Secured Revolving Credit Facility. (2) As of September 30, 2026, the Company had one community categorized as held for sale and under contract for imminent sale. The sale was completed on October 8, 2026. Q3 Highlights • August 2026: New $380M Term Loan with Ally Bank. 5-year maturity with two 1-year extension options and a SOFR + 185bps margin: • Proceeds used to fully repay Bridge Loan ($170M), Ally Term Loan ($122M), and pay down the Secured Revolving Credit Facility ($70M) • $372.5M was made immediately available, with $7.5M available subject to achieving certain debt yields and debt coverage ratios • Q3 2026+: Expect to fund future acquisitions through cash-on-hand, revolver availability, committed financing, and our ATM program; equity raised only when it is both accretive and deleveraging
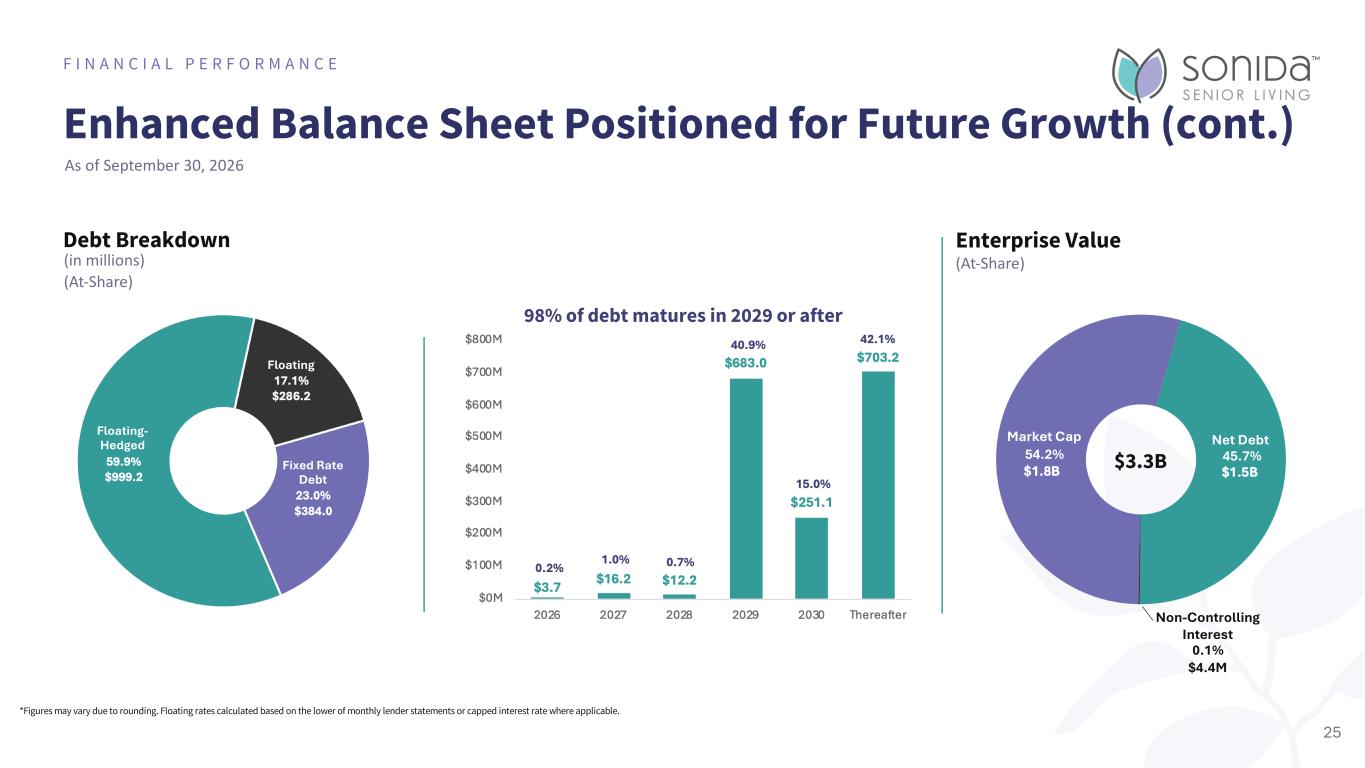
Enhanced Balance Sheet Positioned for Future Growth (cont.) F I N A N C I A L P E R F O R M A N C E 25 Debt Breakdown 98% of debt matures in 2029 or after $3.3B 0.1% Enterprise Value (At-Share) *Figures may vary due to rounding. Floating rates calculated based on the lower of monthly lender statements or capped interest rate where applicable. (in millions) (At-Share) 45.7%54.2% As of September 30, 2026 Fixed Rate Debt Floating- Hedged Floating Market Cap Net Debt Non-Controlling Interest $4.4M

Capital Allocation Strategy I N V E S T O R P R E S E N T A T I O N 26The Ashton on Dorsey
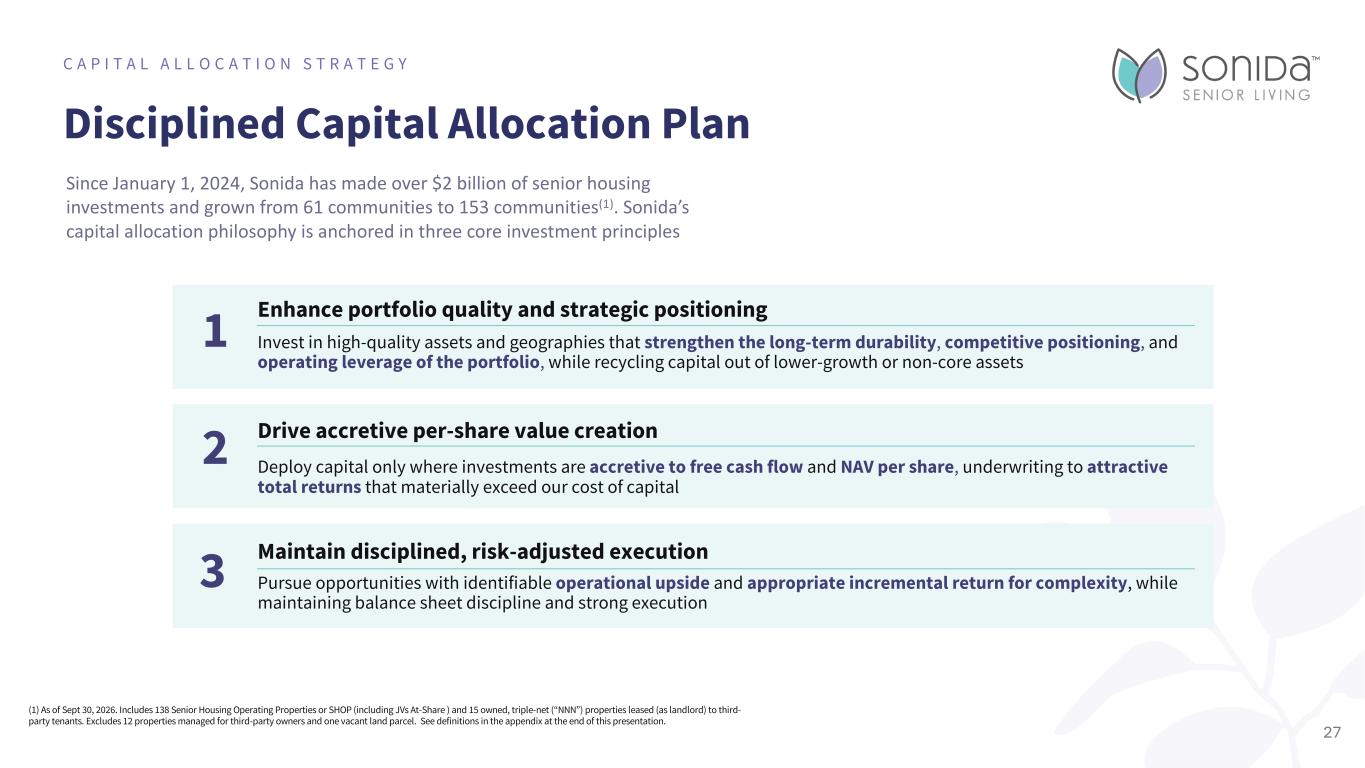
Disciplined Capital Allocation Plan C A P I T A L A L L O C A T I O N S T R A T E G Y Since January 1, 2024, Sonida has made over $2 billion of senior housing investments and grown from 61 communities to 153 communities(1). Sonida’s capital allocation philosophy is anchored in three core investment principles Enhance portfolio quality and strategic positioning Invest in high-quality assets and geographies that strengthen the long-term durability, competitive positioning, and operating leverage of the portfolio, while recycling capital out of lower-growth or non-core assets Drive accretive per-share value creation Deploy capital only where investments are accretive to free cash flow and NAV per share, underwriting to attractive total returns that materially exceed our cost of capital Maintain disciplined, risk-adjusted execution Pursue opportunities with identifiable operational upside and appropriate incremental return for complexity, while maintaining balance sheet discipline and strong execution 1 2 3 27 (1) As of Sept 30, 2026. Includes 138 Senior Housing Operating Properties or SHOP (including JVs At-Share ) and 15 owned, triple-net (“NNN”) properties leased (as landlord) to third- party tenants. Excludes 12 properties managed for third-party owners and one vacant land parcel. See definitions in the appendix at the end of this presentation.
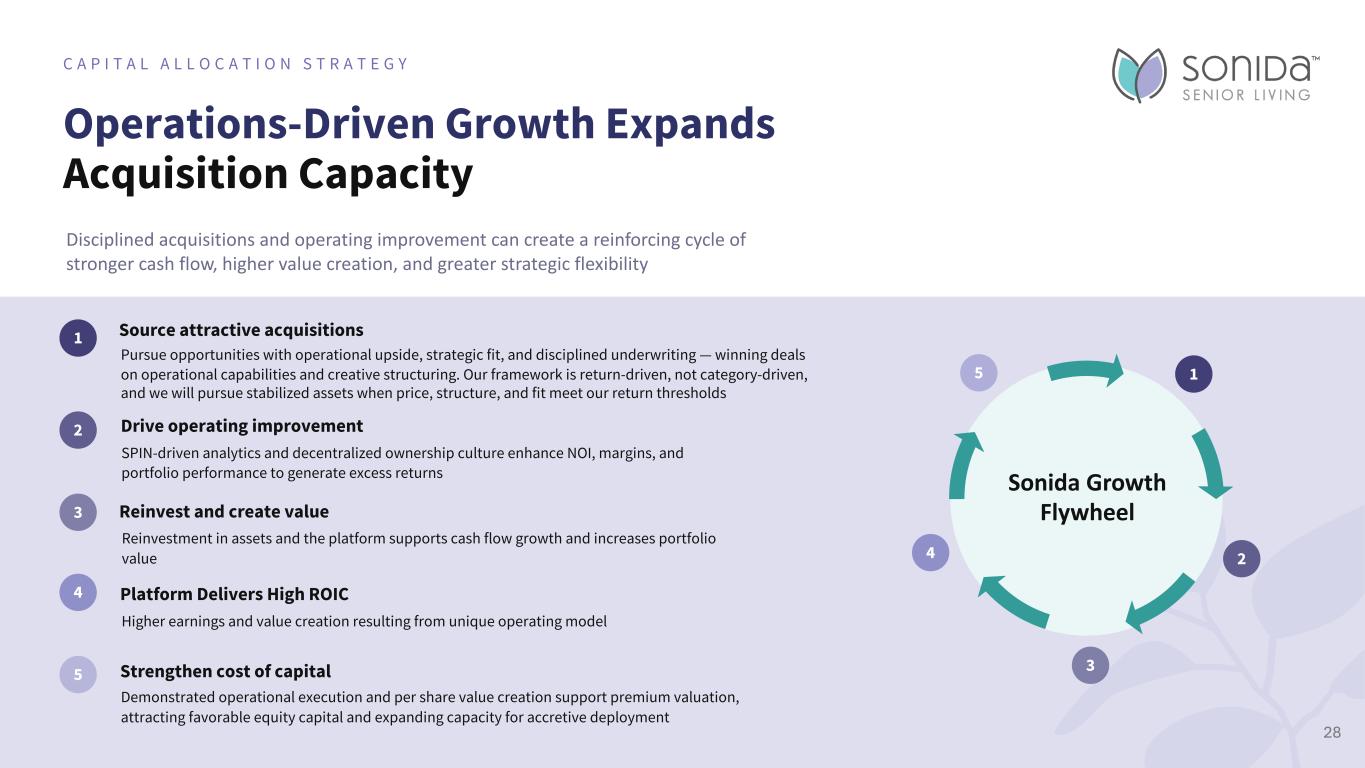
Operations-Driven Growth Expands Acquisition Capacity C A P I T A L A L L O C A T I O N S T R A T E G Y Disciplined acquisitions and operating improvement can create a reinforcing cycle of stronger cash flow, higher value creation, and greater strategic flexibility X X X X Strengthen cost of capital Demonstrated operational execution and per share value creation support premium valuation, attracting favorable equity capital and expanding capacity for accretive deployment 1 Source attractive acquisitions Pursue opportunities with operational upside, strategic fit, and disciplined underwriting — winning deals on operational capabilities and creative structuring. Our framework is return-driven, not category-driven, and we will pursue stabilized assets when price, structure, and fit meet our return thresholds 2 Drive operating improvement SPIN-driven analytics and decentralized ownership culture enhance NOI, margins, and portfolio performance to generate excess returns 3 Reinvest and create value Reinvestment in assets and the platform supports cash flow growth and increases portfolio value 5 Sonida Growth Flywheel Platform Delivers High ROIC Higher earnings and value creation resulting from unique operating model 4 1 2 3 4 5 28
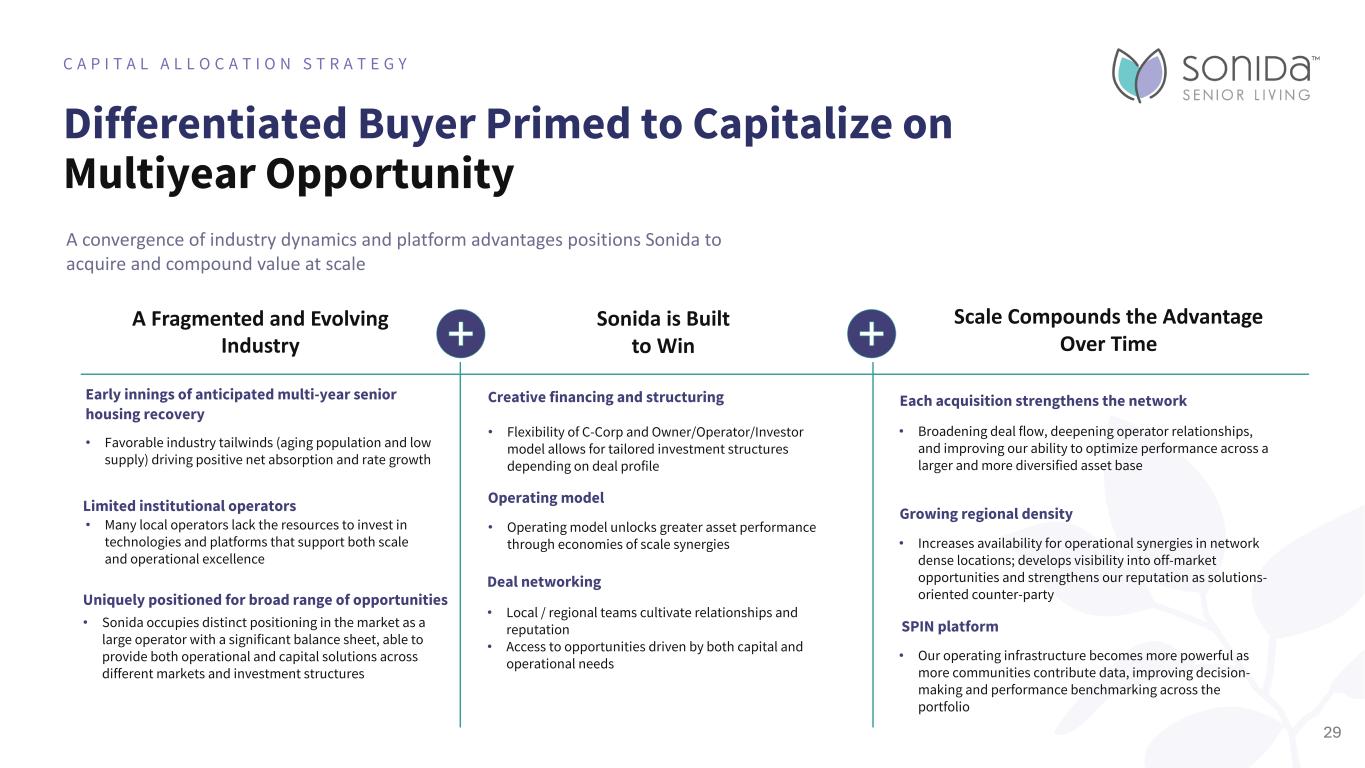
Differentiated Buyer Primed to Capitalize on Multiyear Opportunity C A P I T A L A L L O C A T I O N S T R A T E G Y A Fragmented and Evolving Industry Sonida is Built to Win Limited institutional operators • Many local operators lack the resources to invest in technologies and platforms that support both scale and operational excellence Early innings of anticipated multi-year senior housing recovery • Favorable industry tailwinds (aging population and low supply) driving positive net absorption and rate growth Creative financing and structuring Operating model Deal networking • Flexibility of C-Corp and Owner/Operator/Investor model allows for tailored investment structures depending on deal profile • Local / regional teams cultivate relationships and reputation • Access to opportunities driven by both capital and operational needs • Operating model unlocks greater asset performance through economies of scale synergies Scale Compounds the Advantage Over Time • Broadening deal flow, deepening operator relationships, and improving our ability to optimize performance across a larger and more diversified asset base • Increases availability for operational synergies in network dense locations; develops visibility into off-market opportunities and strengthens our reputation as solutions- oriented counter-party • Our operating infrastructure becomes more powerful as more communities contribute data, improving decision- making and performance benchmarking across the portfolio Uniquely positioned for broad range of opportunities • Sonida occupies distinct positioning in the market as a large operator with a significant balance sheet, able to provide both operational and capital solutions across different markets and investment structures Each acquisition strengthens the network Growing regional density SPIN platform A convergence of industry dynamics and platform advantages positions Sonida to acquire and compound value at scale 29
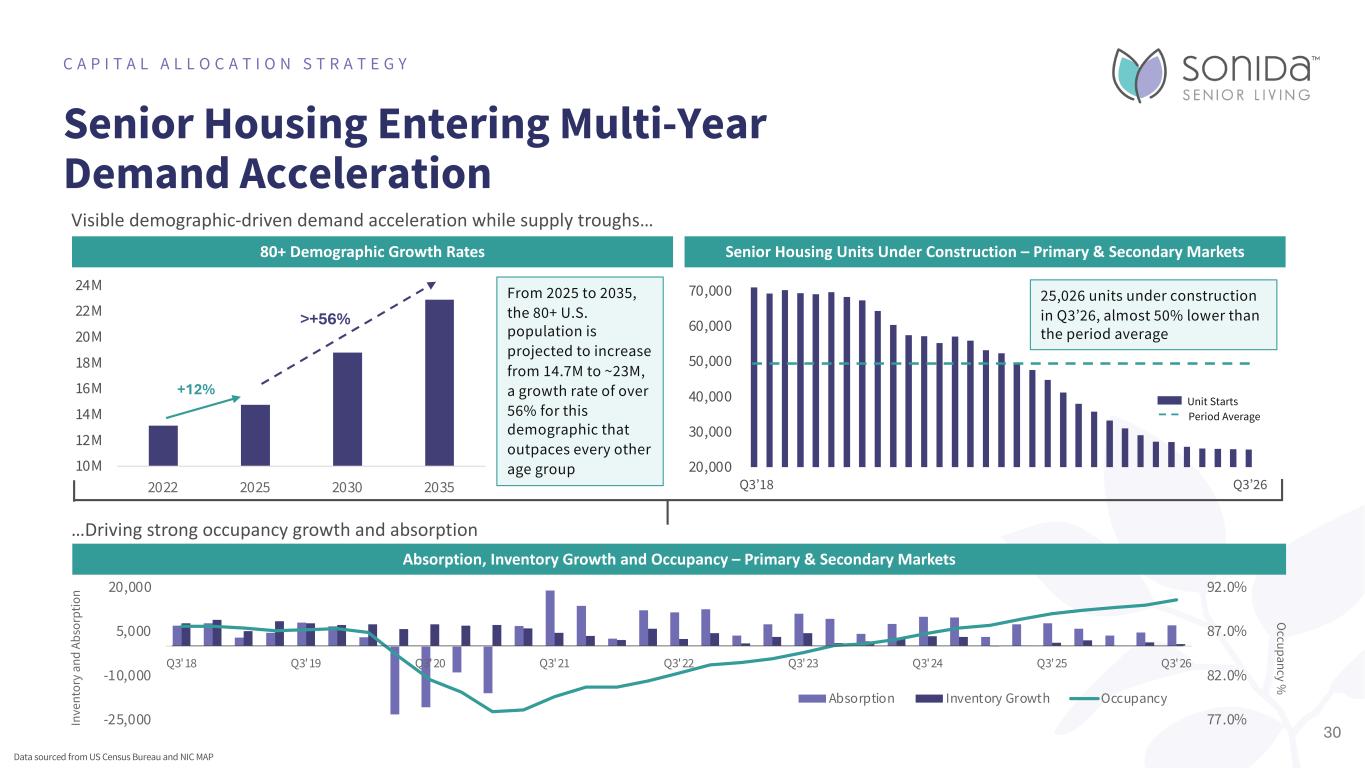
Senior Housing Entering Multi-Year Demand Acceleration C A P I T A L A L L O C A T I O N S T R A T E G Y Visible demographic-driven demand acceleration while supply troughs… Data sourced from US Census Bureau and NIC MAP 80+ Demographic Growth Rates Senior Housing Units Under Construction – Primary & Secondary Markets 20,000 30,000 40,000 50,000 60,000 70,000 Unit Starts Period Average Q3’18 Q3’26 Absorption, Inventory Growth and Occupancy – Primary & Secondary Markets In ve nt or y an d Ab so rp tio n …Driving strong occupancy growth and absorption O ccupancy % 30 10M 12M 14M 16M 18M 20M 22M 24M 2022 2025 2030 2035 +12% >+56% From 2025 to 2035, the 80+ U.S. population is projected to increase from 14.7M to ~23M, a growth rate of over 56% for this demographic that outpaces every other age group 25,026 units under construction in Q3’26, almost 50% lower than the period average 77.0% 82.0% 87.0% 92.0% -25,000 -10,000 5,000 20,000 Q3'18 Q3'19 Q3'20 Q3'21 Q3'22 Q3'23 Q3'24 Q3'25 Q3'26 Absorption Inventory Growth Occupancy
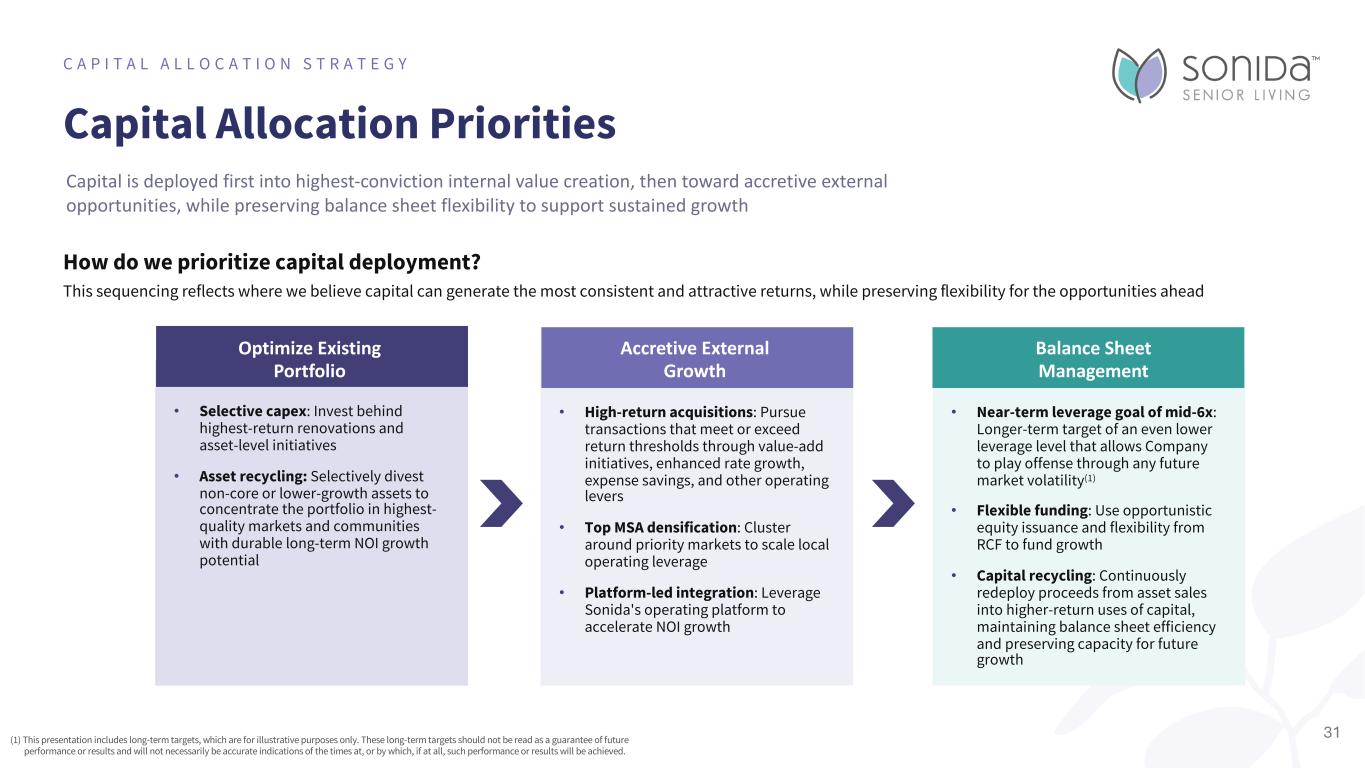
Capital Allocation Priorities C A P I T A L A L L O C A T I O N S T R A T E G Y (1) This presentation includes long-term targets, which are for illustrative purposes only. These long-term targets should not be read as a guarantee of future performance or results and will not necessarily be accurate indications of the times at, or by which, if at all, such performance or results will be achieved. Optimize Existing Portfolio • Selective capex: Invest behind highest-return renovations and asset-level initiatives • Asset recycling: Selectively divest non-core or lower-growth assets to concentrate the portfolio in highest- quality markets and communities with durable long-term NOI growth potential Accretive External Growth • High-return acquisitions: Pursue transactions that meet or exceed return thresholds through value-add initiatives, enhanced rate growth, expense savings, and other operating levers • Top MSA densification: Cluster around priority markets to scale local operating leverage • Platform-led integration: Leverage Sonida's operating platform to accelerate NOI growth Balance Sheet Management • Near-term leverage goal of mid-6x: Longer-term target of an even lower leverage level that allows Company to play offense through any future market volatility(1) • Flexible funding: Use opportunistic equity issuance and flexibility from RCF to fund growth • Capital recycling: Continuously redeploy proceeds from asset sales into higher-return uses of capital, maintaining balance sheet efficiency and preserving capacity for future growth Capital is deployed first into highest-conviction internal value creation, then toward accretive external opportunities, while preserving balance sheet flexibility to support sustained growth How do we prioritize capital deployment? This sequencing reflects where we believe capital can generate the most consistent and attractive returns, while preserving flexibility for the opportunities ahead 31
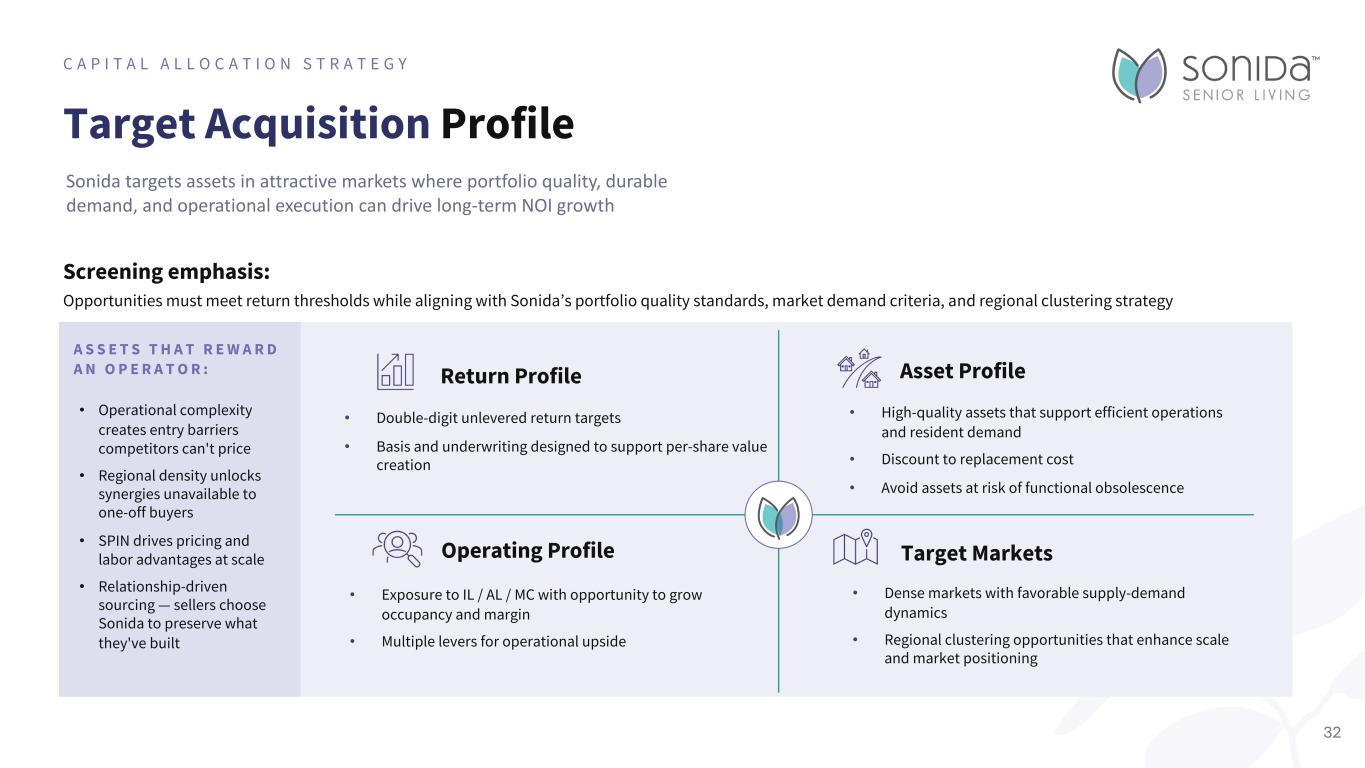
Target Acquisition Profile C A P I T A L A L L O C A T I O N S T R A T E G Y Sonida targets assets in attractive markets where portfolio quality, durable demand, and operational execution can drive long-term NOI growth • Double-digit unlevered return targets • Basis and underwriting designed to support per-share value creation • High-quality assets that support efficient operations and resident demand • Discount to replacement cost • Avoid assets at risk of functional obsolescence • Exposure to IL / AL / MC with opportunity to grow occupancy and margin • Multiple levers for operational upside • Dense markets with favorable supply-demand dynamics • Regional clustering opportunities that enhance scale and market positioning Return Profile Operating Profile Asset Profile Target Markets Screening emphasis: Opportunities must meet return thresholds while aligning with Sonida’s portfolio quality standards, market demand criteria, and regional clustering strategy 32 A S S E T S T H A T R E W A R D A N O P E R A T O R : • Operational complexity creates entry barriers competitors can't price • Regional density unlocks synergies unavailable to one-off buyers • SPIN drives pricing and labor advantages at scale • Relationship-driven sourcing — sellers choose Sonida to preserve what they've built
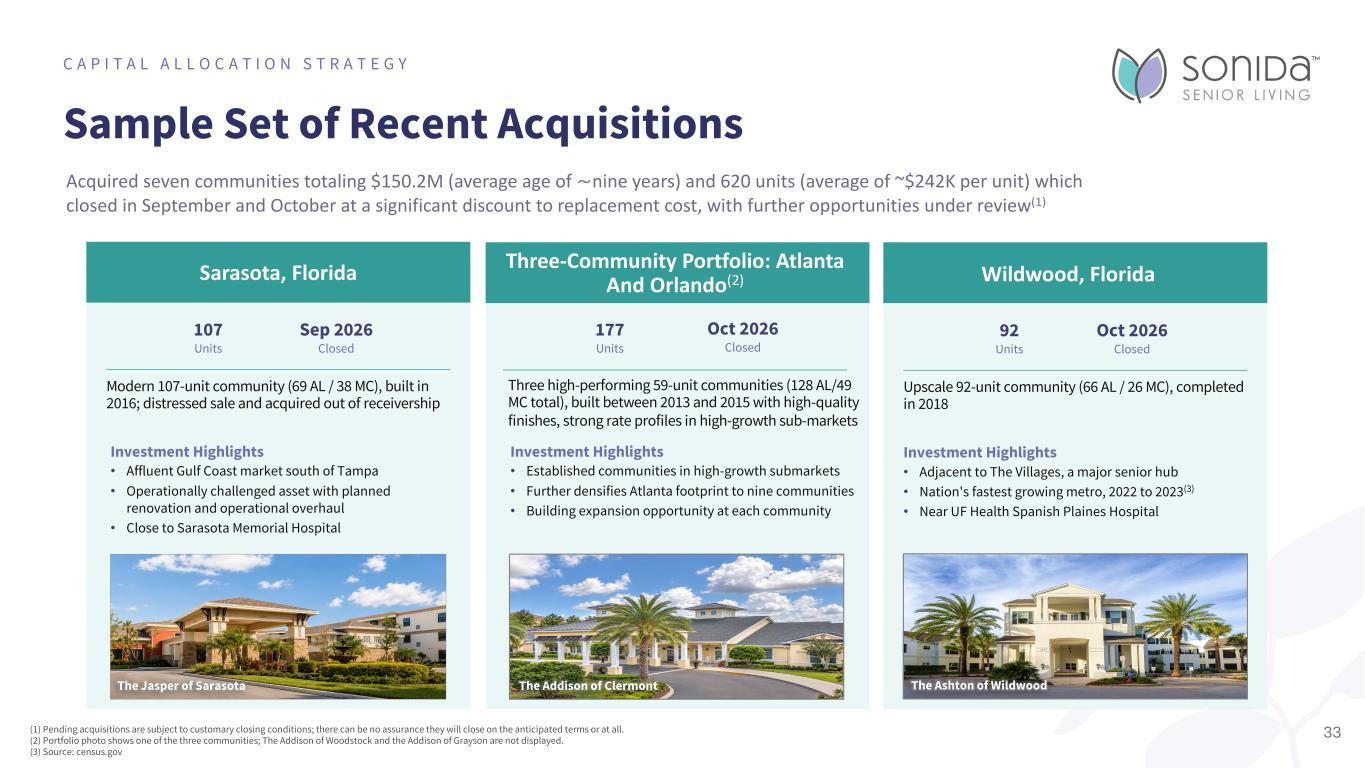
SARASOTA, FLORIDA Sample Set of Recent Acquisitions C A P I T A L A L L O C A T I O N S T R A T E G Y Acquired seven communities totaling $150.2M (average age of ⁓nine years) and 620 units (average of ~$242K per unit) which closed in September and October at a significant discount to replacement cost, with further opportunities under review(1) 33 107 Units Sep 2026 Closed Modern 107-unit community (69 AL / 38 MC), built in 2016; distressed sale and acquired out of receivership Investment Highlights • Affluent Gulf Coast market south of Tampa • Operationally challenged asset with planned renovation and operational overhaul • Close to Sarasota Memorial Hospital 177 Units Oct 2026 Closed Three high-performing 59-unit communities (128 AL/49 MC total), built between 2013 and 2015 with high-quality finishes, strong rate profiles in high-growth sub-markets Investment Highlights • Established communities in high-growth submarkets • Further densifies Atlanta footprint to nine communities • Building expansion opportunity at each community 92 Units Oct 2026 Closed Upscale 92-unit community (66 AL / 26 MC), completed in 2018 Investment Highlights • Adjacent to The Villages, a major senior hub • Nation's fastest growing metro, 2022 to 2023(3) • Near UF Health Spanish Plaines Hospital (1) Pending acquisitions are subject to customary closing conditions; there can be no assurance they will close on the anticipated terms or at all. (2) Portfolio photo shows one of the three communities; The Addison of Woodstock and the Addison of Grayson are not displayed. (3) Source: census.gov SARASOTA, FLORIDA WILDWOOD, FLORIDA The Jasper of Sarasota The Addison of Clermont The Ashton of Wildwood Sarasota, Florida Three-Community Portfolio: Atlanta And Orlando(2) Wildwood, Florida
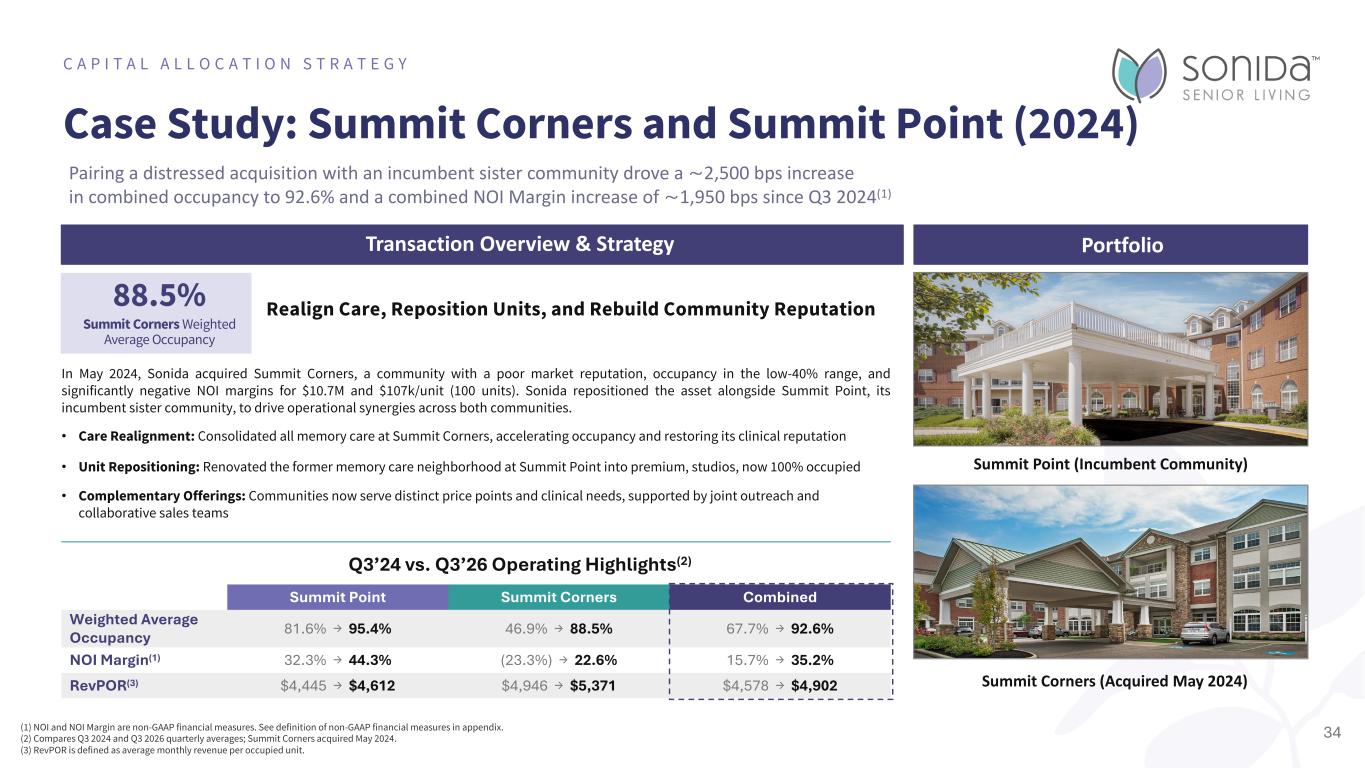
Case Study: Summit Corners and Summit Point (2024) C A P I T A L A L L O C A T I O N S T R A T E G Y 34 Pairing a distressed acquisition with an incumbent sister community drove a ⁓2,500 bps increase in combined occupancy to 92.6% and a combined NOI Margin increase of ⁓1,950 bps since Q3 2024(1) Transaction Overview & Strategy Portfolio 88.5% Summit Corners Weighted Average Occupancy Realign Care, Reposition Units, and Rebuild Community Reputation In May 2024, Sonida acquired Summit Corners, a community with a poor market reputation, occupancy in the low-40% range, and significantly negative NOI margins for $10.7M and $107k/unit (100 units). Sonida repositioned the asset alongside Summit Point, its incumbent sister community, to drive operational synergies across both communities. • Care Realignment: Consolidated all memory care at Summit Corners, accelerating occupancy and restoring its clinical reputation • Unit Repositioning: Renovated the former memory care neighborhood at Summit Point into premium, studios, now 100% occupied • Complementary Offerings: Communities now serve distinct price points and clinical needs, supported by joint outreach and collaborative sales teams Summit Point (Incumbent Community) Summit Corners (Acquired May 2024) (1) NOI and NOI Margin are non-GAAP financial measures. See definition of non-GAAP financial measures in appendix. (2) Compares Q3 2024 and Q3 2026 quarterly averages; Summit Corners acquired May 2024. (3) RevPOR is defined as average monthly revenue per occupied unit. Q3’24 vs. Q3’26 Operating Highlights(2) Summit Point Summit Corners Combined Weighted Average Occupancy 81.6% → 95.4% 46.9% → 88.5% 67.7% → 92.6% NOI Margin(1) 32.3% → 44.3% (23.3%) → 22.6% 15.7% → 35.2% RevPOR(3) $4,445 → $4,612 $4,946 → $5,371 $4,578 → $4,902
CHP Integration Update I N V E S T O R P R E S E N T A T I O N The Ashton on Dorsey 35Park Place at Winghaven
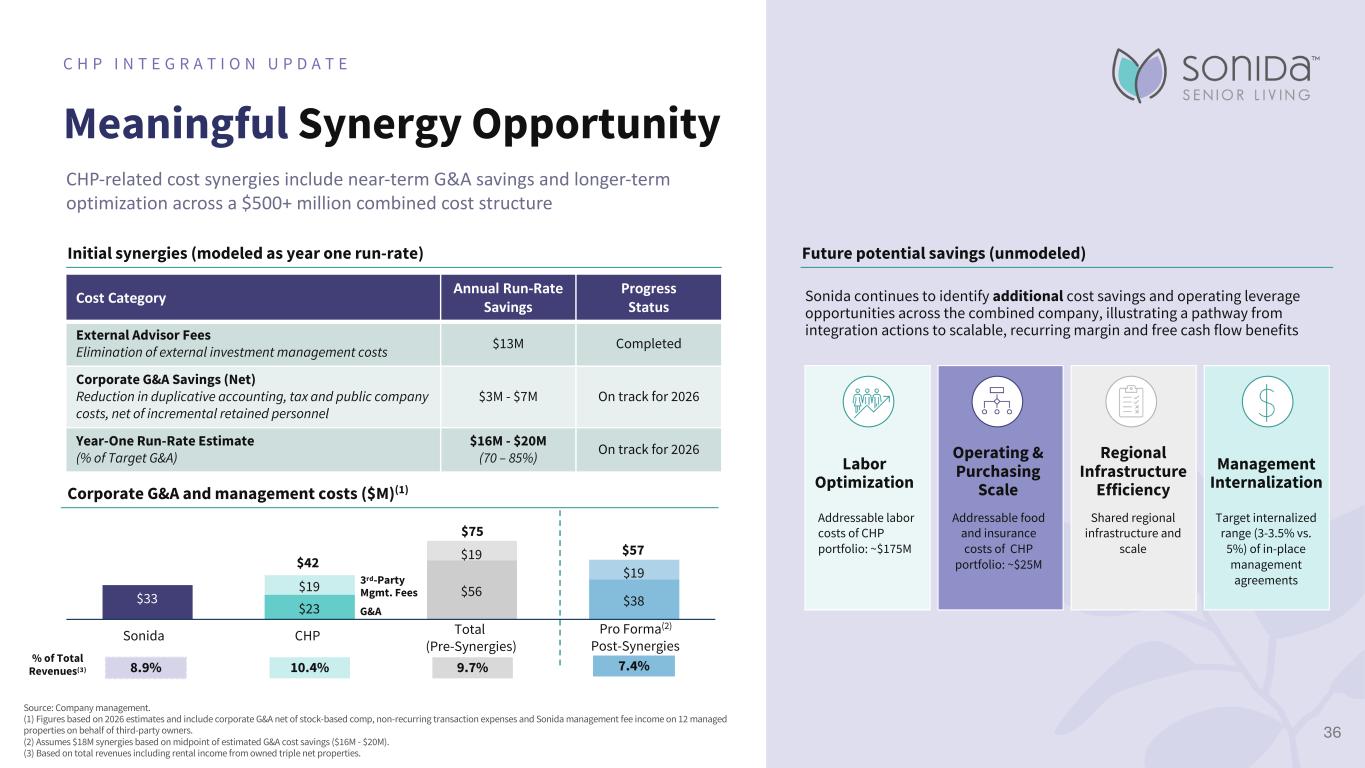
Meaningful Synergy Opportunity C H P I N T E G R A T I O N U P D A T E Source: Company management. (1) Figures based on 2026 estimates and include corporate G&A net of stock-based comp, non-recurring transaction expenses and Sonida management fee income on 12 managed properties on behalf of third-party owners. (2) Assumes $18M synergies based on midpoint of estimated G&A cost savings ($16M - $20M). (3) Based on total revenues including rental income from owned triple net properties. CHP-related cost synergies include near-term G&A savings and longer-term optimization across a $500+ million combined cost structure Cost Category Annual Run-Rate Savings Progress Status External Advisor Fees Elimination of external investment management costs $13M Completed Corporate G&A Savings (Net) Reduction in duplicative accounting, tax and public company costs, net of incremental retained personnel $3M - $7M On track for 2026 Year-One Run-Rate Estimate (% of Target G&A) $16M - $20M (70 – 85%) On track for 2026 Initial synergies (modeled as year one run-rate) 3rd-Party Mgmt. Fees 8.9% 10.4% 9.7% 7.4%% of Total Revenues(3) G&A$23 $56 $38$33 $19 $19 $19 Sonida CHP Total (Pre-Synergies) Pro Forma(2) Post-Synergies $75 $57 $42 Corporate G&A and management costs ($M)(1) Future potential savings (unmodeled) Sonida continues to identify additional cost savings and operating leverage opportunities across the combined company, illustrating a pathway from integration actions to scalable, recurring margin and free cash flow benefits Labor Optimization Operating & Purchasing Scale Regional Infrastructure Efficiency Management Internalization Addressable labor costs of CHP portfolio: ~$175M Addressable food and insurance costs of CHP portfolio: ~$25M Shared regional infrastructure and scale Target internalized range (3-3.5% vs. 5%) of in-place management agreements 36
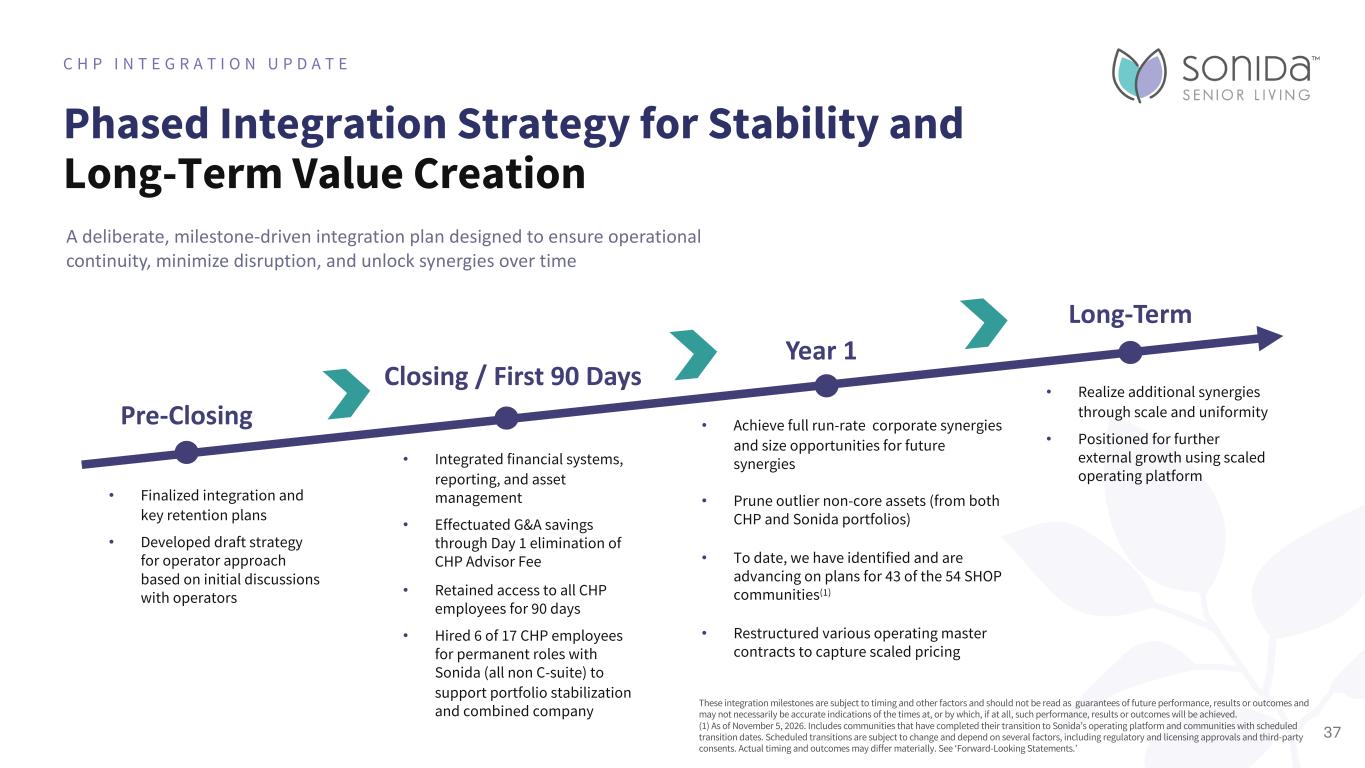
Pre-Closing Closing / First 90 Days Year 1 Long-Term • Finalized integration and key retention plans • Developed draft strategy for operator approach based on initial discussions with operators • Integrated financial systems, reporting, and asset management • Effectuated G&A savings through Day 1 elimination of CHP Advisor Fee • Retained access to all CHP employees for 90 days • Hired 6 of 17 CHP employees for permanent roles with Sonida (all non C-suite) to support portfolio stabilization and combined company • Realize additional synergies through scale and uniformity • Positioned for further external growth using scaled operating platform Phased Integration Strategy for Stability and Long-Term Value Creation C H P I N T E G R A T I O N U P D A T E A deliberate, milestone-driven integration plan designed to ensure operational continuity, minimize disruption, and unlock synergies over time These integration milestones are subject to timing and other factors and should not be read as guarantees of future performance, results or outcomes and may not necessarily be accurate indications of the times at, or by which, if at all, such performance, results or outcomes will be achieved. (1) As of November 5, 2026. Includes communities that have completed their transition to Sonida’s operating platform and communities with scheduled transition dates. Scheduled transitions are subject to change and depend on several factors, including regulatory and licensing approvals and third-party consents. Actual timing and outcomes may differ materially. See ‘Forward-Looking Statements.’ • Achieve full run-rate corporate synergies and size opportunities for future synergies • Prune outlier non-core assets (from both CHP and Sonida portfolios) • To date, we have identified and are advancing on plans for 43 of the 54 SHOP communities(1) • Restructured various operating master contracts to capture scaled pricing 37
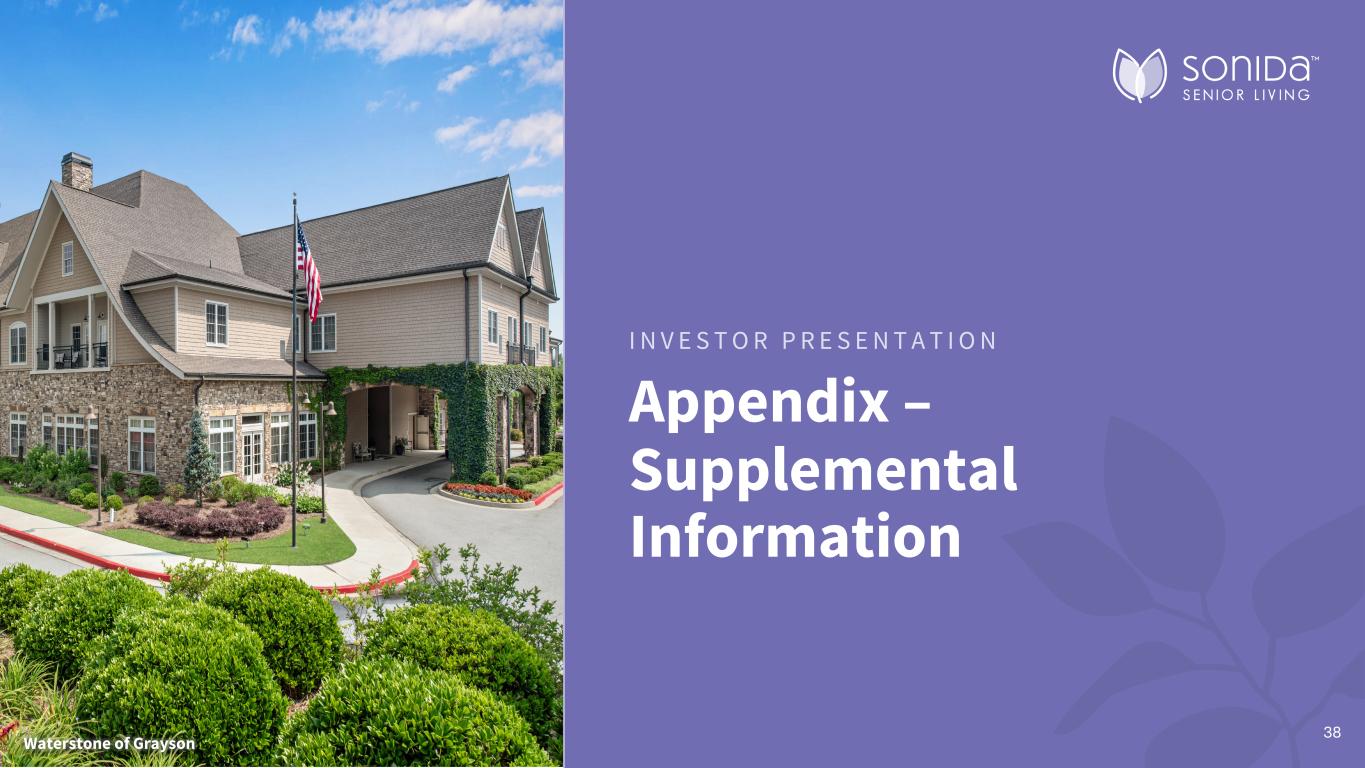
Appendix – Supplemental Information I N V E S T O R P R E S E N T A T I O N The Ashton on Dorsey 38Waterst e of G ayson
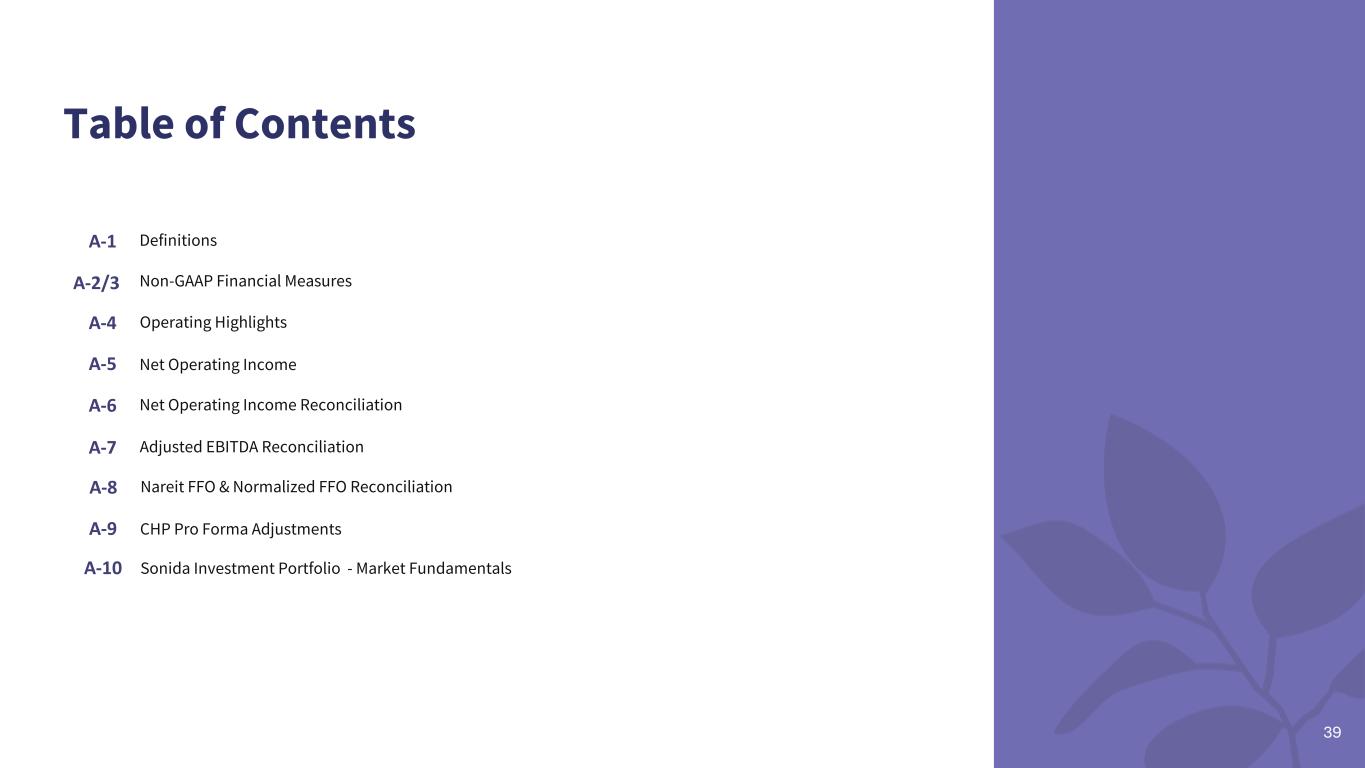
39 Table of Contents Net Operating Income Reconciliation Definitions Non-GAAP Financial Measures A-1 Operating Highlights Net Operating Income Adjusted EBITDA Reconciliation A-2/3 A-4 A-5 A-6 A-7 Nareit FFO & Normalized FFO Reconciliation A-8 CHP Pro Forma AdjustmentsA-9 Sonida Investment Portfolio - Market FundamentalsA-10
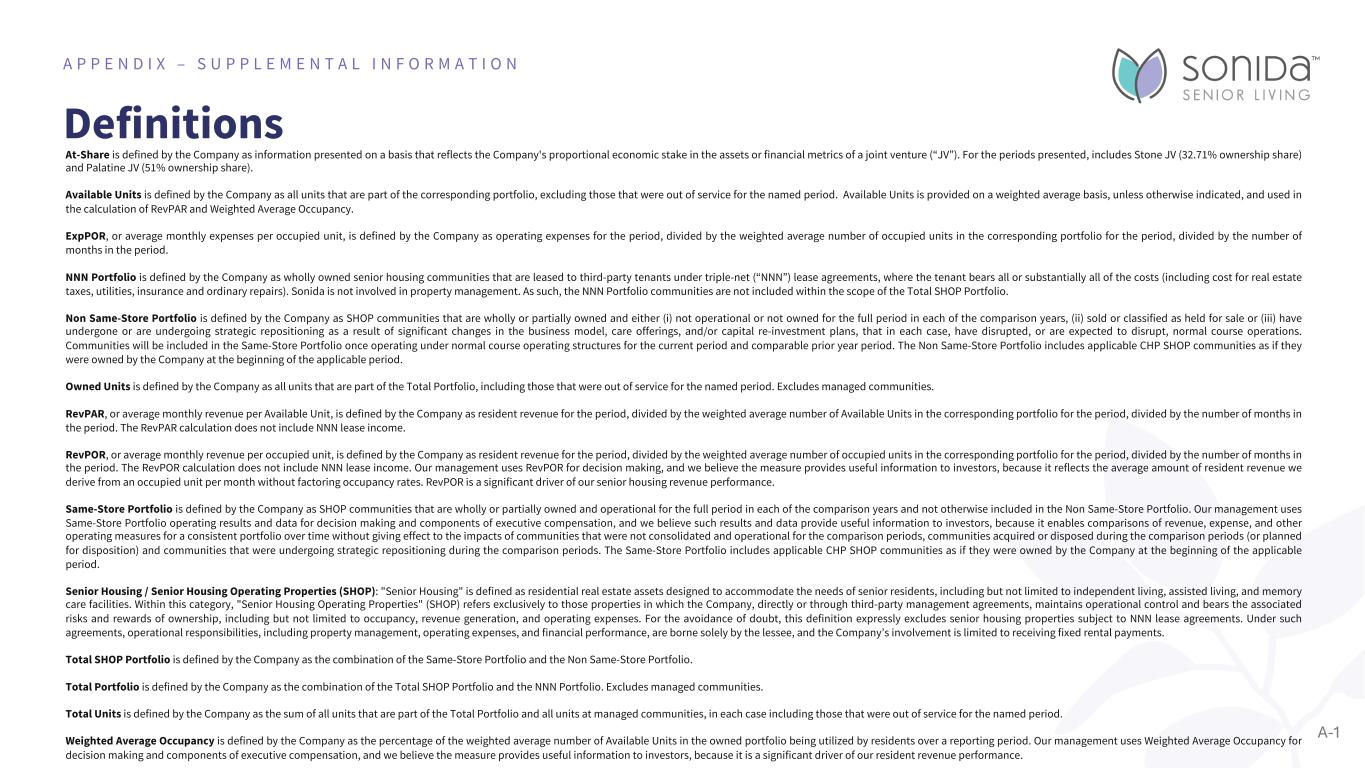
Definitions A P P E N D I X – S U P P L E M E N T A L I N F O R M A T I O N At-Share is defined by the Company as information presented on a basis that reflects the Company's proportional economic stake in the assets or financial metrics of a joint venture (“JV”). For the periods presented, includes Stone JV (32.71% ownership share) and Palatine JV (51% ownership share). Available Units is defined by the Company as all units that are part of the corresponding portfolio, excluding those that were out of service for the named period. Available Units is provided on a weighted average basis, unless otherwise indicated, and used in the calculation of RevPAR and Weighted Average Occupancy. ExpPOR, or average monthly expenses per occupied unit, is defined by the Company as operating expenses for the period, divided by the weighted average number of occupied units in the corresponding portfolio for the period, divided by the number of months in the period. NNN Portfolio is defined by the Company as wholly owned senior housing communities that are leased to third-party tenants under triple-net (“NNN”) lease agreements, where the tenant bears all or substantially all of the costs (including cost for real estate taxes, utilities, insurance and ordinary repairs). Sonida is not involved in property management. As such, the NNN Portfolio communities are not included within the scope of the Total SHOP Portfolio. Non Same-Store Portfolio is defined by the Company as SHOP communities that are wholly or partially owned and either (i) not operational or not owned for the full period in each of the comparison years, (ii) sold or classified as held for sale or (iii) have undergone or are undergoing strategic repositioning as a result of significant changes in the business model, care offerings, and/or capital re-investment plans, that in each case, have disrupted, or are expected to disrupt, normal course operations. Communities will be included in the Same-Store Portfolio once operating under normal course operating structures for the current period and comparable prior year period. The Non Same-Store Portfolio includes applicable CHP SHOP communities as if they were owned by the Company at the beginning of the applicable period. Owned Units is defined by the Company as all units that are part of the Total Portfolio, including those that were out of service for the named period. Excludes managed communities. RevPAR, or average monthly revenue per Available Unit, is defined by the Company as resident revenue for the period, divided by the weighted average number of Available Units in the corresponding portfolio for the period, divided by the number of months in the period. The RevPAR calculation does not include NNN lease income. RevPOR, or average monthly revenue per occupied unit, is defined by the Company as resident revenue for the period, divided by the weighted average number of occupied units in the corresponding portfolio for the period, divided by the number of months in the period. The RevPOR calculation does not include NNN lease income. Our management uses RevPOR for decision making, and we believe the measure provides useful information to investors, because it reflects the average amount of resident revenue we derive from an occupied unit per month without factoring occupancy rates. RevPOR is a significant driver of our senior housing revenue performance. Same-Store Portfolio is defined by the Company as SHOP communities that are wholly or partially owned and operational for the full period in each of the comparison years and not otherwise included in the Non Same-Store Portfolio. Our management uses Same-Store Portfolio operating results and data for decision making and components of executive compensation, and we believe such results and data provide useful information to investors, because it enables comparisons of revenue, expense, and other operating measures for a consistent portfolio over time without giving effect to the impacts of communities that were not consolidated and operational for the comparison periods, communities acquired or disposed during the comparison periods (or planned for disposition) and communities that were undergoing strategic repositioning during the comparison periods. The Same-Store Portfolio includes applicable CHP SHOP communities as if they were owned by the Company at the beginning of the applicable period. Senior Housing / Senior Housing Operating Properties (SHOP): "Senior Housing" is defined as residential real estate assets designed to accommodate the needs of senior residents, including but not limited to independent living, assisted living, and memory care facilities. Within this category, "Senior Housing Operating Properties" (SHOP) refers exclusively to those properties in which the Company, directly or through third-party management agreements, maintains operational control and bears the associated risks and rewards of ownership, including but not limited to occupancy, revenue generation, and operating expenses. For the avoidance of doubt, this definition expressly excludes senior housing properties subject to NNN lease agreements. Under such agreements, operational responsibilities, including property management, operating expenses, and financial performance, are borne solely by the lessee, and the Company’s involvement is limited to receiving fixed rental payments. Total SHOP Portfolio is defined by the Company as the combination of the Same-Store Portfolio and the Non Same-Store Portfolio. Total Portfolio is defined by the Company as the combination of the Total SHOP Portfolio and the NNN Portfolio. Excludes managed communities. Total Units is defined by the Company as the sum of all units that are part of the Total Portfolio and all units at managed communities, in each case including those that were out of service for the named period. Weighted Average Occupancy is defined by the Company as the percentage of the weighted average number of Available Units in the owned portfolio being utilized by residents over a reporting period. Our management uses Weighted Average Occupancy for decision making and components of executive compensation, and we believe the measure provides useful information to investors, because it is a significant driver of our resident revenue performance. A-1
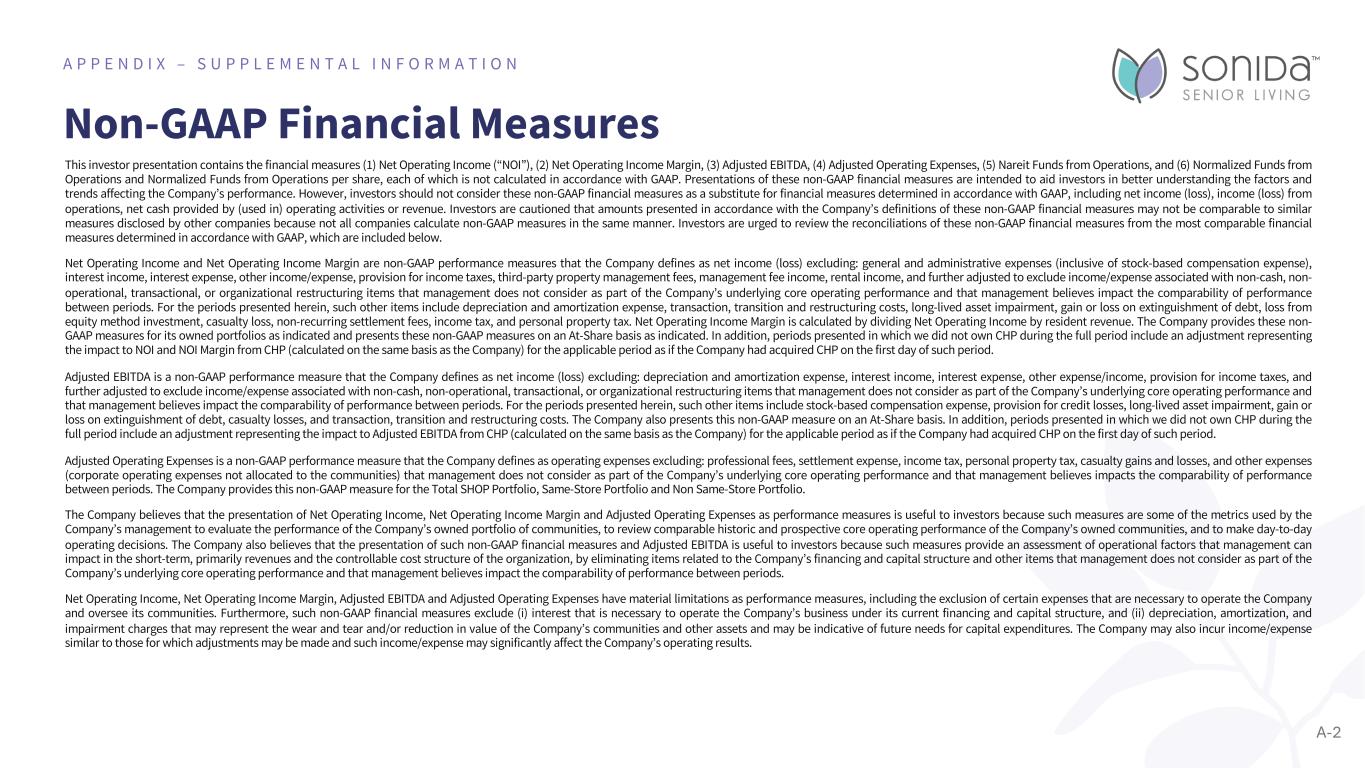
Non-GAAP Financial Measures A P P E N D I X – S U P P L E M E N T A L I N F O R M A T I O N This investor presentation contains the financial measures (1) Net Operating Income (“NOI”), (2) Net Operating Income Margin, (3) Adjusted EBITDA, (4) Adjusted Operating Expenses, (5) Nareit Funds from Operations, and (6) Normalized Funds from Operations and Normalized Funds from Operations per share, each of which is not calculated in accordance with GAAP. Presentations of these non-GAAP financial measures are intended to aid investors in better understanding the factors and trends affecting the Company’s performance. However, investors should not consider these non-GAAP financial measures as a substitute for financial measures determined in accordance with GAAP, including net income (loss), income (loss) from operations, net cash provided by (used in) operating activities or revenue. Investors are cautioned that amounts presented in accordance with the Company’s definitions of these non-GAAP financial measures may not be comparable to similar measures disclosed by other companies because not all companies calculate non-GAAP measures in the same manner. Investors are urged to review the reconciliations of these non-GAAP financial measures from the most comparable financial measures determined in accordance with GAAP, which are included below. Net Operating Income and Net Operating Income Margin are non-GAAP performance measures that the Company defines as net income (loss) excluding: general and administrative expenses (inclusive of stock-based compensation expense), interest income, interest expense, other income/expense, provision for income taxes, third-party property management fees, management fee income, rental income, and further adjusted to exclude income/expense associated with non-cash, non- operational, transactional, or organizational restructuring items that management does not consider as part of the Company’s underlying core operating performance and that management believes impact the comparability of performance between periods. For the periods presented herein, such other items include depreciation and amortization expense, transaction, transition and restructuring costs, long-lived asset impairment, gain or loss on extinguishment of debt, loss from equity method investment, casualty loss, non-recurring settlement fees, income tax, and personal property tax. Net Operating Income Margin is calculated by dividing Net Operating Income by resident revenue. The Company provides these non- GAAP measures for its owned portfolios as indicated and presents these non-GAAP measures on an At-Share basis as indicated. In addition, periods presented in which we did not own CHP during the full period include an adjustment representing the impact to NOI and NOI Margin from CHP (calculated on the same basis as the Company) for the applicable period as if the Company had acquired CHP on the first day of such period. Adjusted EBITDA is a non-GAAP performance measure that the Company defines as net income (loss) excluding: depreciation and amortization expense, interest income, interest expense, other expense/income, provision for income taxes, and further adjusted to exclude income/expense associated with non-cash, non-operational, transactional, or organizational restructuring items that management does not consider as part of the Company’s underlying core operating performance and that management believes impact the comparability of performance between periods. For the periods presented herein, such other items include stock-based compensation expense, provision for credit losses, long-lived asset impairment, gain or loss on extinguishment of debt, casualty losses, and transaction, transition and restructuring costs. The Company also presents this non-GAAP measure on an At-Share basis. In addition, periods presented in which we did not own CHP during the full period include an adjustment representing the impact to Adjusted EBITDA from CHP (calculated on the same basis as the Company) for the applicable period as if the Company had acquired CHP on the first day of such period. Adjusted Operating Expenses is a non-GAAP performance measure that the Company defines as operating expenses excluding: professional fees, settlement expense, income tax, personal property tax, casualty gains and losses, and other expenses (corporate operating expenses not allocated to the communities) that management does not consider as part of the Company’s underlying core operating performance and that management believes impacts the comparability of performance between periods. The Company provides this non-GAAP measure for the Total SHOP Portfolio, Same-Store Portfolio and Non Same-Store Portfolio. The Company believes that the presentation of Net Operating Income, Net Operating Income Margin and Adjusted Operating Expenses as performance measures is useful to investors because such measures are some of the metrics used by the Company’s management to evaluate the performance of the Company’s owned portfolio of communities, to review comparable historic and prospective core operating performance of the Company’s owned communities, and to make day-to-day operating decisions. The Company also believes that the presentation of such non-GAAP financial measures and Adjusted EBITDA is useful to investors because such measures provide an assessment of operational factors that management can impact in the short-term, primarily revenues and the controllable cost structure of the organization, by eliminating items related to the Company’s financing and capital structure and other items that management does not consider as part of the Company’s underlying core operating performance and that management believes impact the comparability of performance between periods. Net Operating Income, Net Operating Income Margin, Adjusted EBITDA and Adjusted Operating Expenses have material limitations as performance measures, including the exclusion of certain expenses that are necessary to operate the Company and oversee its communities. Furthermore, such non-GAAP financial measures exclude (i) interest that is necessary to operate the Company’s business under its current financing and capital structure, and (ii) depreciation, amortization, and impairment charges that may represent the wear and tear and/or reduction in value of the Company’s communities and other assets and may be indicative of future needs for capital expenditures. The Company may also incur income/expense similar to those for which adjustments may be made and such income/expense may significantly affect the Company’s operating results. A-2
Non-GAAP Financial Measures (cont.) A P P E N D I X – S U P P L E M E N T A L I N F O R M A T I O N A-3 Funds from operations, established by the National Association of Real Estate Investment Trusts (“Nareit” and “Nareit FFO”), is a non-GAAP performance measure the Company uses which is defined as net income (loss) attributable to common shareholders (calculated in accordance with GAAP) excluding depreciation and amortization related to real estate, gains and losses from the sale of certain real estate assets, gains and losses from change in control, impairment write-downs of certain real estate assets and investments in entities when the impairment is directly attributable to decreases in the value of depreciable real estate held by the entity, and after adjustments for noncontrolling interests and unconsolidated entities following the same approach. Normalized FFO is a non-GAAP performance measure that, for the periods presented herein, the Company defines as Nareit FFO excluding other income/expense, transaction, transition and restructuring costs, stock-based compensation expense related to CHP merger, casualty losses, non-recurring settlement fees, gain or loss on extinguishment of debt, gains and losses on derivatives, non-cash interest expense, certain other normalized items, and after adjustments for noncontrolling interests and unconsolidated entities following the same approach. Normalized FFO per share is calculated by dividing Normalized FFO by total weighted average diluted shares outstanding. Historical cost accounting for real estate assets implicitly assumes that the value of real estate assets diminish predictably over time. However, since real estate values historically have risen or fallen with market conditions, many industry investors deem presentations of operating results for real estate companies that use historical cost accounting to be insufficient by themselves. For that reason, the Company considers Nareit FFO and Normalized FFO to be appropriate supplemental measures of operating performance. Nareit FFO and Normalized Funds from Operations have material limitations as performance measures, including the exclusion of depreciation, amortization and impairment charges that may represent the wear and tear and/or reduction in value of the Company’s communities and other assets and may be indicative of future needs for capital expenditures. The Company may incur income/expense similar to those for which adjustments are made, and such income/expense may significantly affect our operating results.
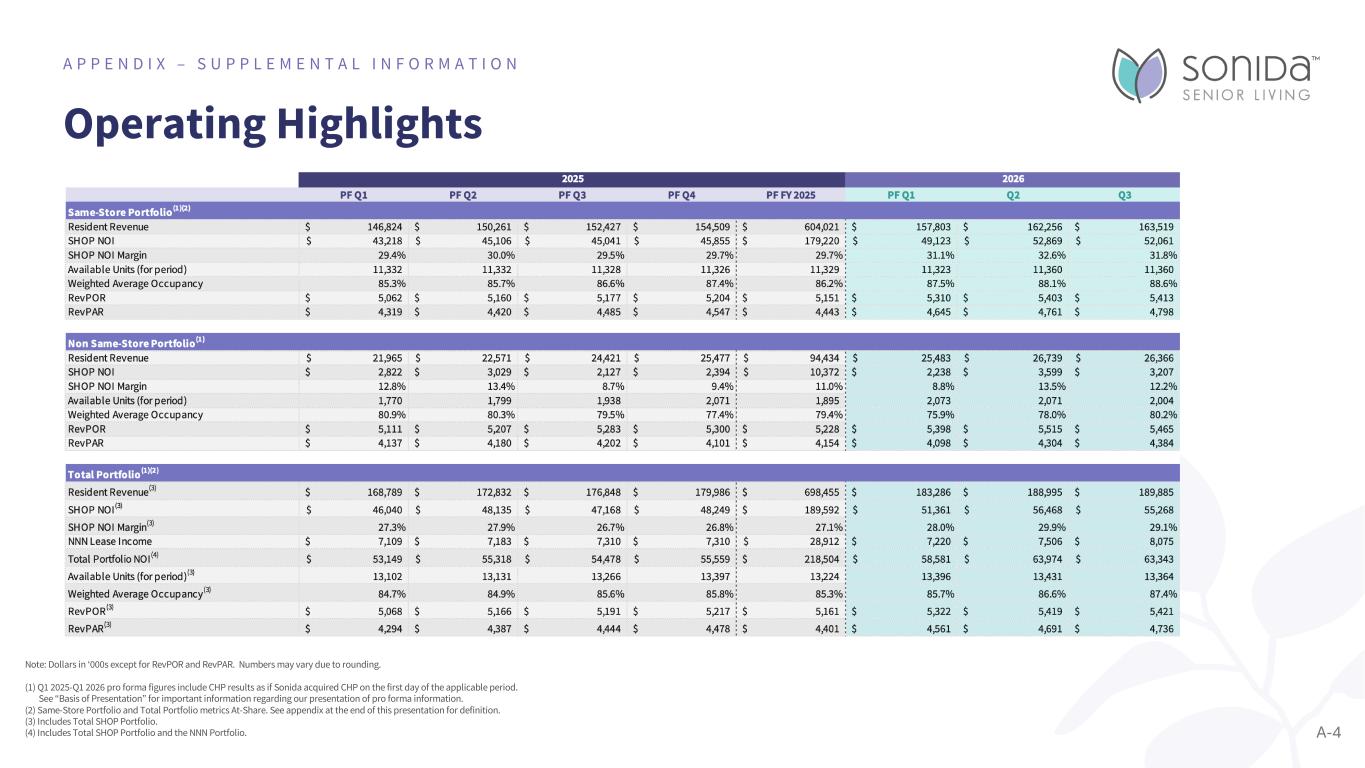
Operating Highlights A P P E N D I X – S U P P L E M E N T A L I N F O R M A T I O N Note: Dollars in ‘000s except for RevPOR and RevPAR. Numbers may vary due to rounding. (1) Q1 2025-Q1 2026 pro forma figures include CHP results as if Sonida acquired CHP on the first day of the applicable period. See “Basis of Presentation” for important information regarding our presentation of pro forma information. (2) Same-Store Portfolio and Total Portfolio metrics At-Share. See appendix at the end of this presentation for definition. (3) Includes Total SHOP Portfolio. (4) Includes Total SHOP Portfolio and the NNN Portfolio. A-4
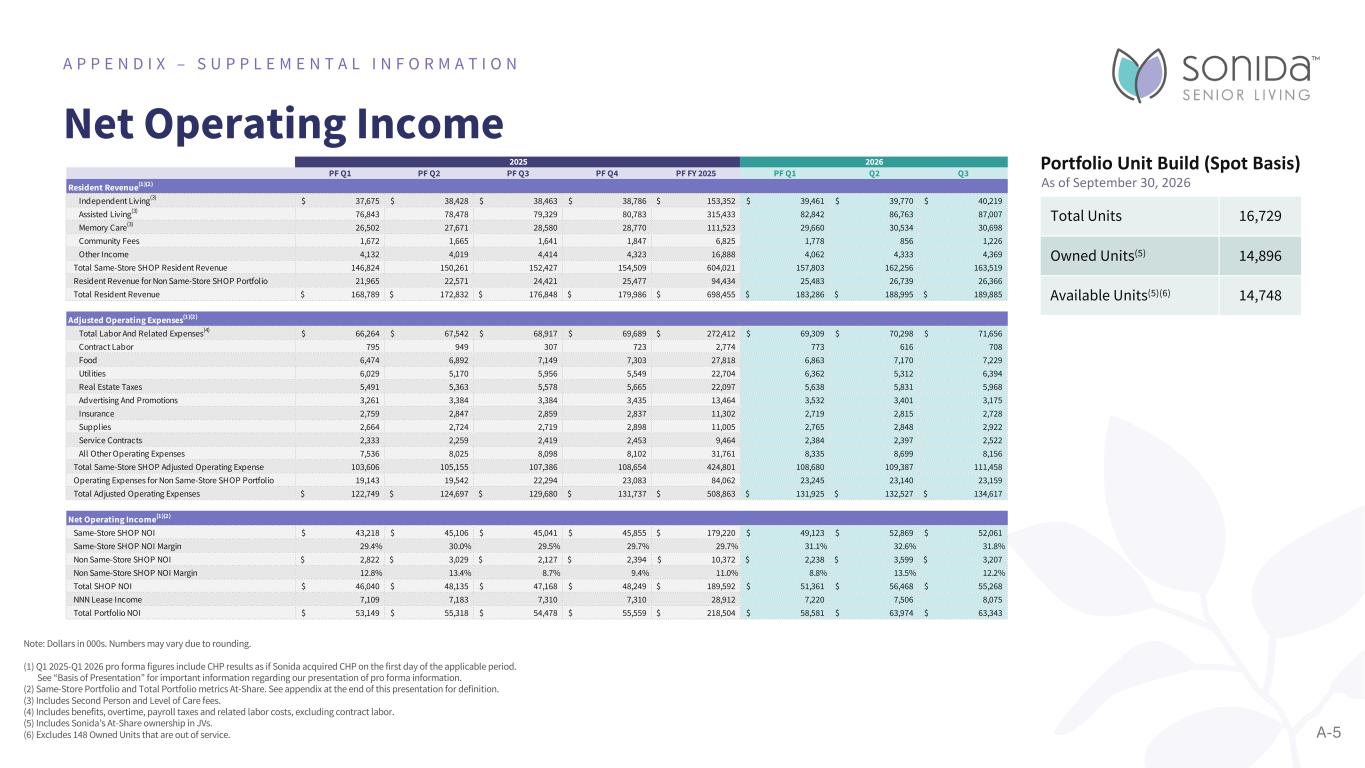
Net Operating Income A P P E N D I X – S U P P L E M E N T A L I N F O R M A T I O N Note: Dollars in 000s. Numbers may vary due to rounding. (1) Q1 2025-Q1 2026 pro forma figures include CHP results as if Sonida acquired CHP on the first day of the applicable period. See “Basis of Presentation” for important information regarding our presentation of pro forma information. (2) Same-Store Portfolio and Total Portfolio metrics At-Share. See appendix at the end of this presentation for definition. (3) Includes Second Person and Level of Care fees. (4) Includes benefits, overtime, payroll taxes and related labor costs, excluding contract labor. (5) Includes Sonida’s At-Share ownership in JVs. (6) Excludes 148 Owned Units that are out of service. Total Units 16,729 Owned Units(5) 14,896 Available Units(5)(6) 14,748 Portfolio Unit Build (Spot Basis) A-5 As of September 30, 2026 PF Q1 PF Q2 PF Q3 PF Q4 PF FY 2025 PF Q1 Q2 Q3 Resident Revenue(1)(2) Independent Living(3) 37,675$ 38,428$ 38,463$ 38,786$ 153,352$ 39,461$ 39,770$ 40,219$ Assisted Living(3) 76,843 78,478 79,329 80,783 315,433 82,842 86,763 87,007 Memory Care(3) 26,502 27,671 28,580 28,770 111,523 29,660 30,534 30,698 Community Fees 1,672 1,665 1,641 1,847 6,825 1,778 856 1,226 Other Income 4,132 4,019 4,414 4,323 16,888 4,062 4,333 4,369 Total Same-Store SHOP Resident Revenue 146,824 150,261 152,427 154,509 604,021 157,803 162,256 163,519 Resident Revenue for Non Same-Store SHOP Portfolio 21,965 22,571 24,421 25,477 94,434 25,483 26,739 26,366 Total Resident Revenue 168,789$ 172,832$ 176,848$ 179,986$ 698,455$ 183,286$ 188,995$ 189,885$ Adjusted Operating Expenses(1)(2) Total Labor And Related Expenses(4) 66,264$ 67,542$ 68,917$ 69,689$ 272,412$ 69,309$ 70,298$ 71,656$ Contract Labor 795 949 307 723 2,774 773 616 708 Food 6,474 6,892 7,149 7,303 27,818 6,863 7,170 7,229 Utilities 6,029 5,170 5,956 5,549 22,704 6,362 5,312 6,394 Real Estate Taxes 5,491 5,363 5,578 5,665 22,097 5,638 5,831 5,968 Advertising And Promotions 3,261 3,384 3,384 3,435 13,464 3,532 3,401 3,175 Insurance 2,759 2,847 2,859 2,837 11,302 2,719 2,815 2,728 Supplies 2,664 2,724 2,719 2,898 11,005 2,765 2,848 2,922 Service Contracts 2,333 2,259 2,419 2,453 9,464 2,384 2,397 2,522 All Other Operating Expenses 7,536 8,025 8,098 8,102 31,761 8,335 8,699 8,156 Total Same-Store SHOP Adjusted Operating Expense 103,606 105,155 107,386 108,654 424,801 108,680 109,387 111,458 Operating Expenses for Non Same-Store SHOP Portfolio 19,143 19,542 22,294 23,083 84,062 23,245 23,140 23,159 Total Adjusted Operating Expenses 122,749$ 124,697$ 129,680$ 131,737$ 508,863$ 131,925$ 132,527$ 134,617$ Net Operating Income(1)(2) Same-Store SHOP NOI 43,218$ 45,106$ 45,041$ 45,855$ 179,220$ 49,123$ 52,869$ 52,061$ Same-Store SHOP NOI Margin 29.4% 30.0% 29.5% 29.7% 29.7% 31.1% 32.6% 31.8% Non Same-Store SHOP NOI 2,822$ 3,029$ 2,127$ 2,394$ 10,372$ 2,238$ 3,599$ 3,207$ Non Same-Store SHOP NOI Margin 12.8% 13.4% 8.7% 9.4% 11.0% 8.8% 13.5% 12.2% Total SHOP NOI 46,040$ 48,135$ 47,168$ 48,249$ 189,592$ 51,361$ 56,468$ 55,268$ NNN Lease Income 7,109 7,183 7,310 7,310 28,912 7,220 7,506 8,075 Total Portfolio NOI 53,149$ 55,318$ 54,478$ 55,559$ 218,504$ 58,581$ 63,974$ 63,343$ 2025 2026
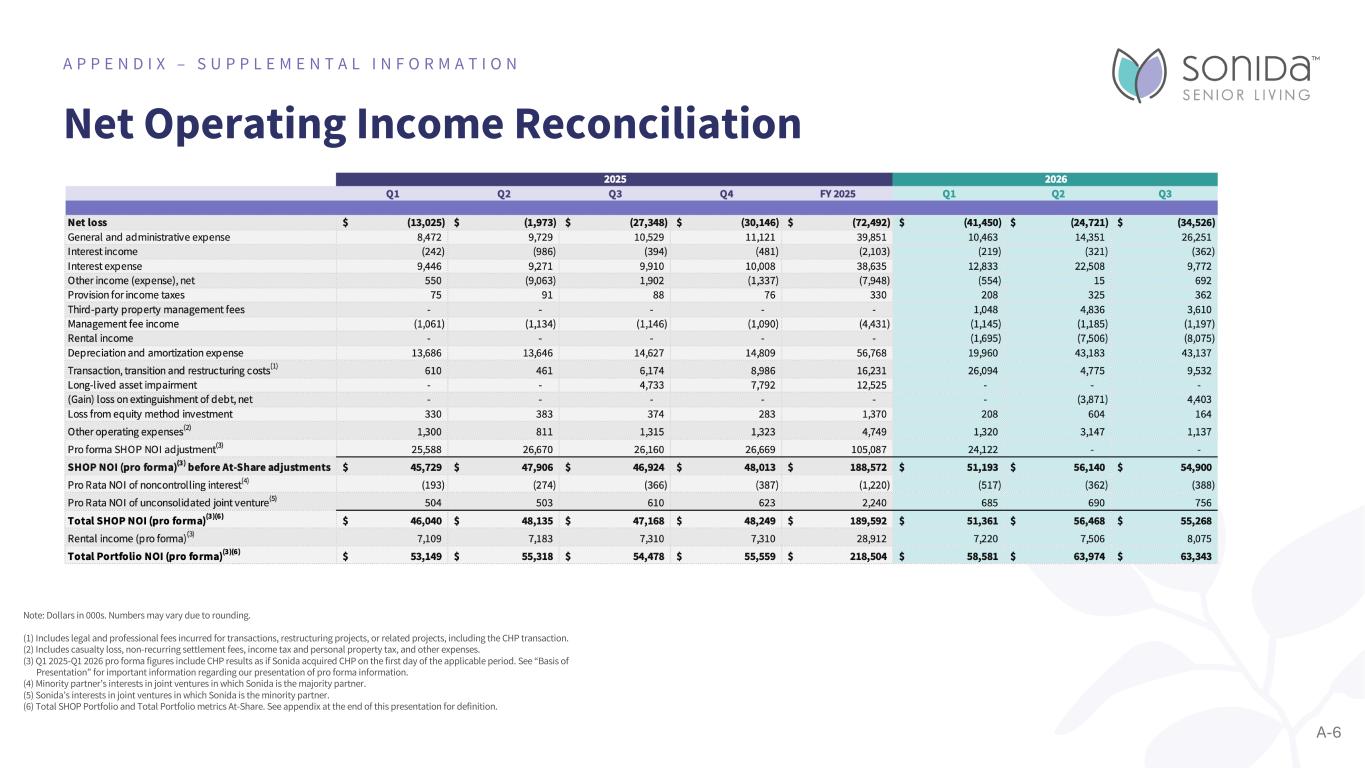
Net Operating Income Reconciliation A P P E N D I X – S U P P L E M E N T A L I N F O R M A T I O N Note: Dollars in 000s. Numbers may vary due to rounding. (1) Includes legal and professional fees incurred for transactions, restructuring projects, or related projects, including the CHP transaction. (2) Includes casualty loss, non-recurring settlement fees, income tax and personal property tax, and other expenses. (3) Q1 2025-Q1 2026 pro forma figures include CHP results as if Sonida acquired CHP on the first day of the applicable period. See “Basis of Presentation” for important information regarding our presentation of pro forma information. (4) Minority partner’s interests in joint ventures in which Sonida is the majority partner. (5) Sonida’s interests in joint ventures in which Sonida is the minority partner. (6) Total SHOP Portfolio and Total Portfolio metrics At-Share. See appendix at the end of this presentation for definition. A-6
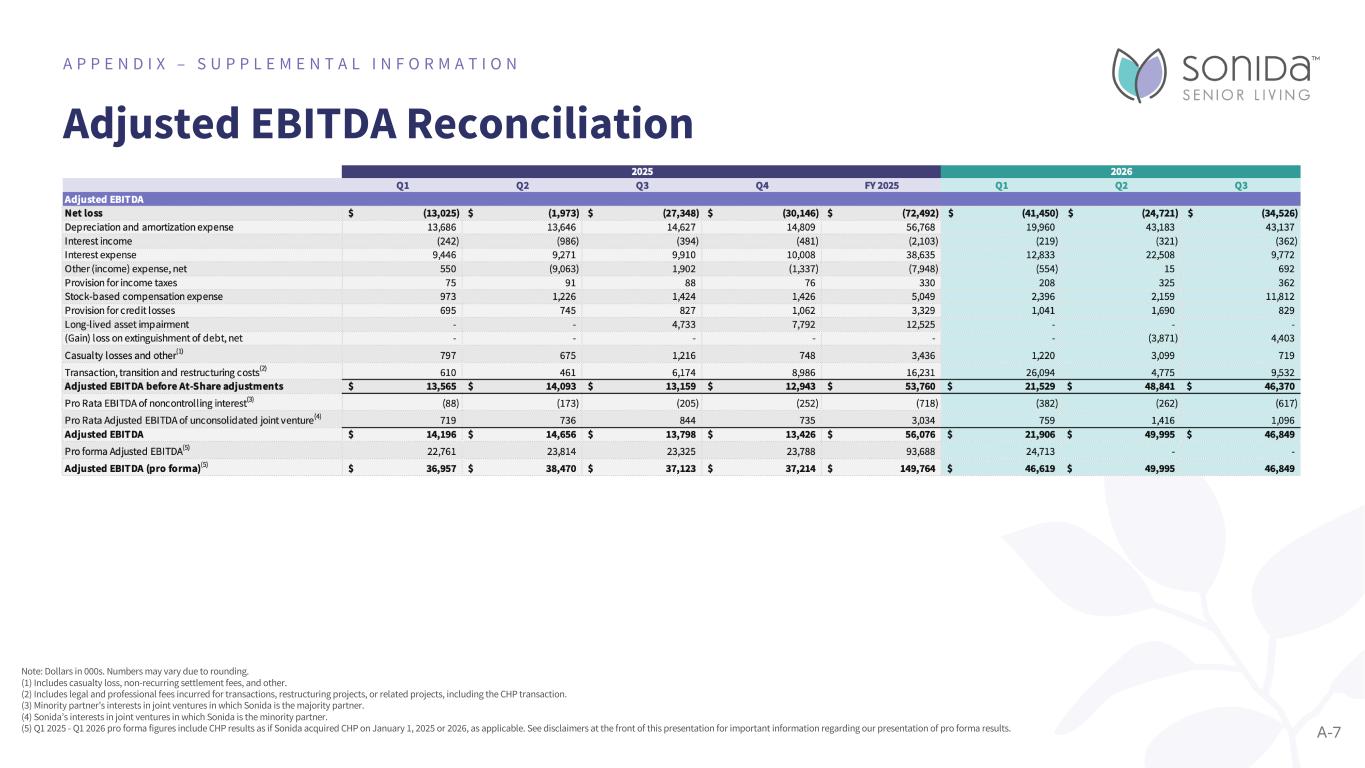
Adjusted EBITDA Reconciliation A P P E N D I X – S U P P L E M E N T A L I N F O R M A T I O N Note: Dollars in 000s. Numbers may vary due to rounding. (1) Includes casualty loss, non-recurring settlement fees, and other. (2) Includes legal and professional fees incurred for transactions, restructuring projects, or related projects, including the CHP transaction. (3) Minority partner’s interests in joint ventures in which Sonida is the majority partner. (4) Sonida’s interests in joint ventures in which Sonida is the minority partner. (5) Q1 2025 - Q1 2026 pro forma figures include CHP results as if Sonida acquired CHP on January 1, 2025 or 2026, as applicable. See disclaimers at the front of this presentation for important information regarding our presentation of pro forma results. A-7
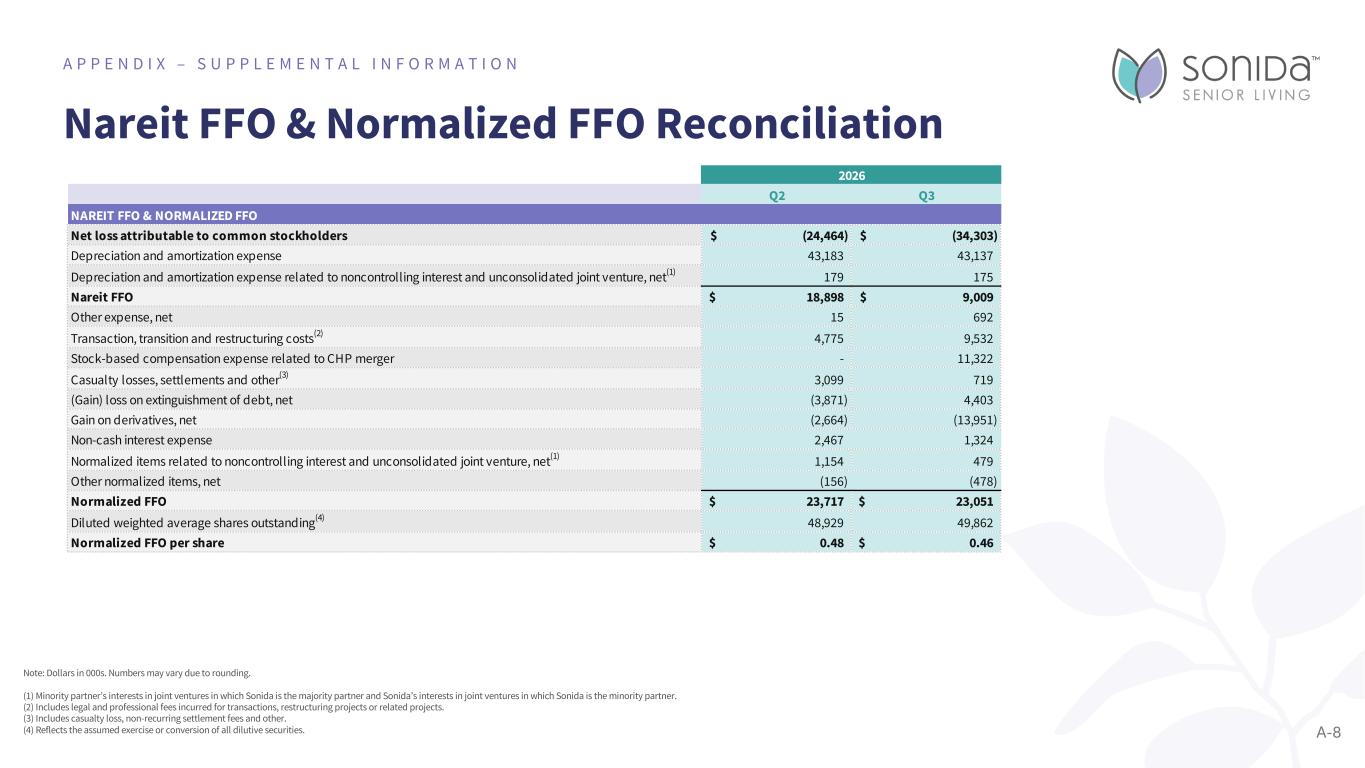
Nareit FFO & Normalized FFO Reconciliation A P P E N D I X – S U P P L E M E N T A L I N F O R M A T I O N A-8 Note: Dollars in 000s. Numbers may vary due to rounding. (1) Minority partner’s interests in joint ventures in which Sonida is the majority partner and Sonida’s interests in joint ventures in which Sonida is the minority partner. (2) Includes legal and professional fees incurred for transactions, restructuring projects or related projects. (3) Includes casualty loss, non-recurring settlement fees and other. (4) Reflects the assumed exercise or conversion of all dilutive securities. 2026 Q2 Q3 NAREIT FFO & NORMALIZED FFO Net loss attributable to common stockholders (24,464)$ (34,303)$ Depreciation and amortization expense 43,183 43,137 Depreciation and amortization expense related to noncontrolling interest and unconsolidated joint venture, net(1) 179 175 Nareit FFO 18,898$ 9,009$ Other expense, net 15 692 Transaction, transition and restructuring costs(2) 4,775 9,532 Stock-based compensation expense related to CHP merger - 11,322 Casualty losses, settlements and other(3) 3,099 719 (Gain) loss on extinguishment of debt, net (3,871) 4,403 Gain on derivatives, net (2,664) (13,951) Non-cash interest expense 2,467 1,324 Normalized items related to noncontrolling interest and unconsolidated joint venture, net(1) 1,154 479 Other normalized items, net (156) (478) Normalized FFO 23,717$ 23,051$ Diluted weighted average shares outstanding(4) 48,929 49,862 Normalized FFO per share 0.48$ 0.46$
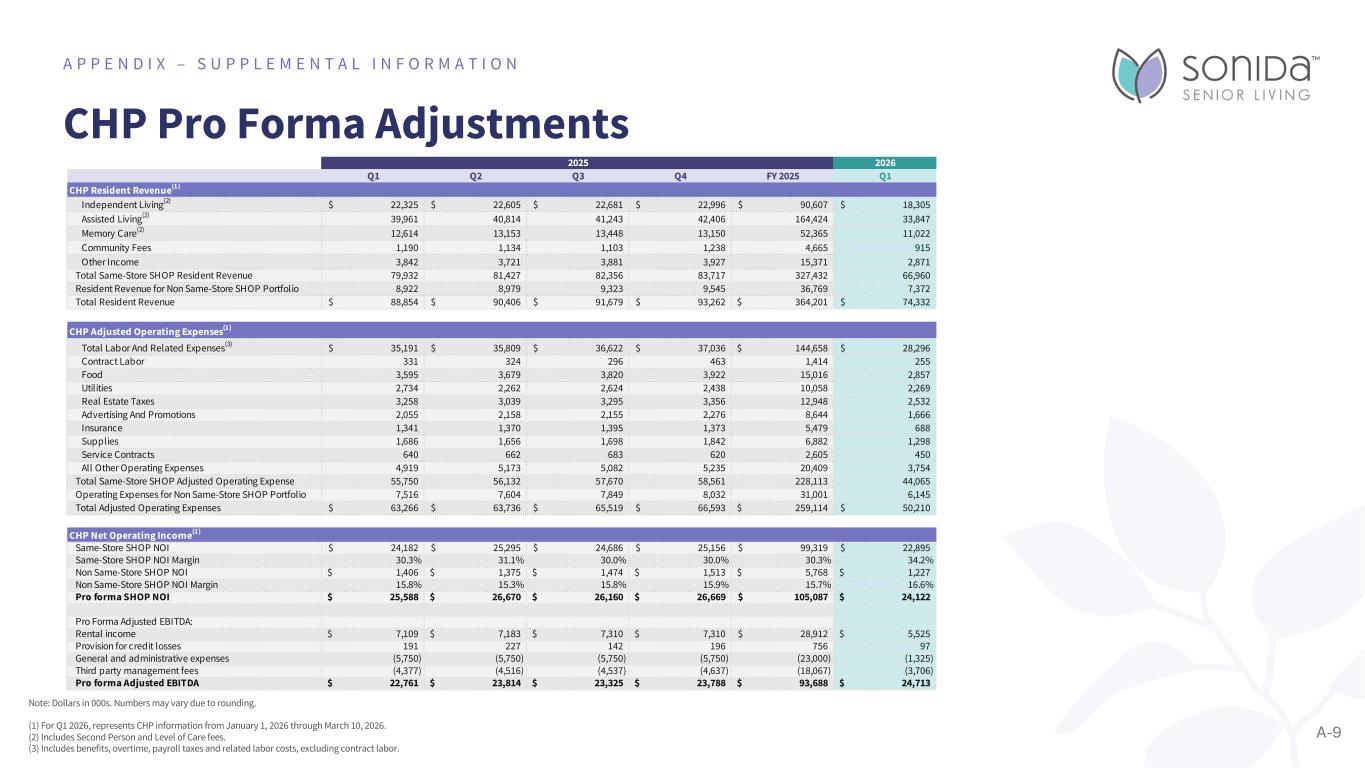
CHP Pro Forma Adjustments A P P E N D I X – S U P P L E M E N T A L I N F O R M A T I O N Note: Dollars in 000s. Numbers may vary due to rounding. (1) For Q1 2026, represents CHP information from January 1, 2026 through March 10, 2026. (2) Includes Second Person and Level of Care fees. (3) Includes benefits, overtime, payroll taxes and related labor costs, excluding contract labor. A-9 2026 Q1 Q2 Q3 Q4 FY 2025 Q1 CHP Resident Revenue(1) Independent Living(2) 22,325$ 22,605$ 22,681$ 22,996$ 90,607$ 18,305$ Assisted Living(2) 39,961 40,814 41,243 42,406 164,424 33,847 Memory Care(2) 12,614 13,153 13,448 13,150 52,365 11,022 Community Fees 1,190 1,134 1,103 1,238 4,665 915 Other Income 3,842 3,721 3,881 3,927 15,371 2,871 Total Same-Store SHOP Resident Revenue 79,932 81,427 82,356 83,717 327,432 66,960 Resident Revenue for Non Same-Store SHOP Portfolio 8,922 8,979 9,323 9,545 36,769 7,372 Total Resident Revenue 88,854$ 90,406$ 91,679$ 93,262$ 364,201$ 74,332$ CHP Adjusted Operating Expenses(1) Total Labor And Related Expenses(3) 35,191$ 35,809$ 36,622$ 37,036$ 144,658$ 28,296$ Contract Labor 331 324 296 463 1,414 255 Food 3,595 3,679 3,820 3,922 15,016 2,857 Utilities 2,734 2,262 2,624 2,438 10,058 2,269 Real Estate Taxes 3,258 3,039 3,295 3,356 12,948 2,532 Advertising And Promotions 2,055 2,158 2,155 2,276 8,644 1,666 Insurance 1,341 1,370 1,395 1,373 5,479 688 Supplies 1,686 1,656 1,698 1,842 6,882 1,298 Service Contracts 640 662 683 620 2,605 450 All Other Operating Expenses 4,919 5,173 5,082 5,235 20,409 3,754 Total Same-Store SHOP Adjusted Operating Expense 55,750 56,132 57,670 58,561 228,113 44,065 Operating Expenses for Non Same-Store SHOP Portfolio 7,516 7,604 7,849 8,032 31,001 6,145 Total Adjusted Operating Expenses 63,266$ 63,736$ 65,519$ 66,593$ 259,114$ 50,210$ CHP Net Operating Income(1) Same-Store SHOP NOI 24,182$ 25,295$ 24,686$ 25,156$ 99,319$ 22,895$ Same-Store SHOP NOI Margin 30.3% 31.1% 30.0% 30.0% 30.3% 34.2% Non Same-Store SHOP NOI 1,406$ 1,375$ 1,474$ 1,513$ 5,768$ 1,227$ Non Same-Store SHOP NOI Margin 15.8% 15.3% 15.8% 15.9% 15.7% 16.6% Pro forma SHOP NOI 25,588$ 26,670$ 26,160$ 26,669$ 105,087$ 24,122$ Pro Forma Adjusted EBITDA: Rental income 7,109$ 7,183$ 7,310$ 7,310$ 28,912$ 5,525$ Provision for credit losses 191 227 142 196 756 97 General and administrative expenses (5,750) (5,750) (5,750) (5,750) (23,000) (1,325) Third party management fees (4,377) (4,516) (4,537) (4,637) (18,067) (3,706) Pro forma Adjusted EBITDA 22,761$ 23,814$ 23,325$ 23,788$ 93,688$ 24,713$ 2025
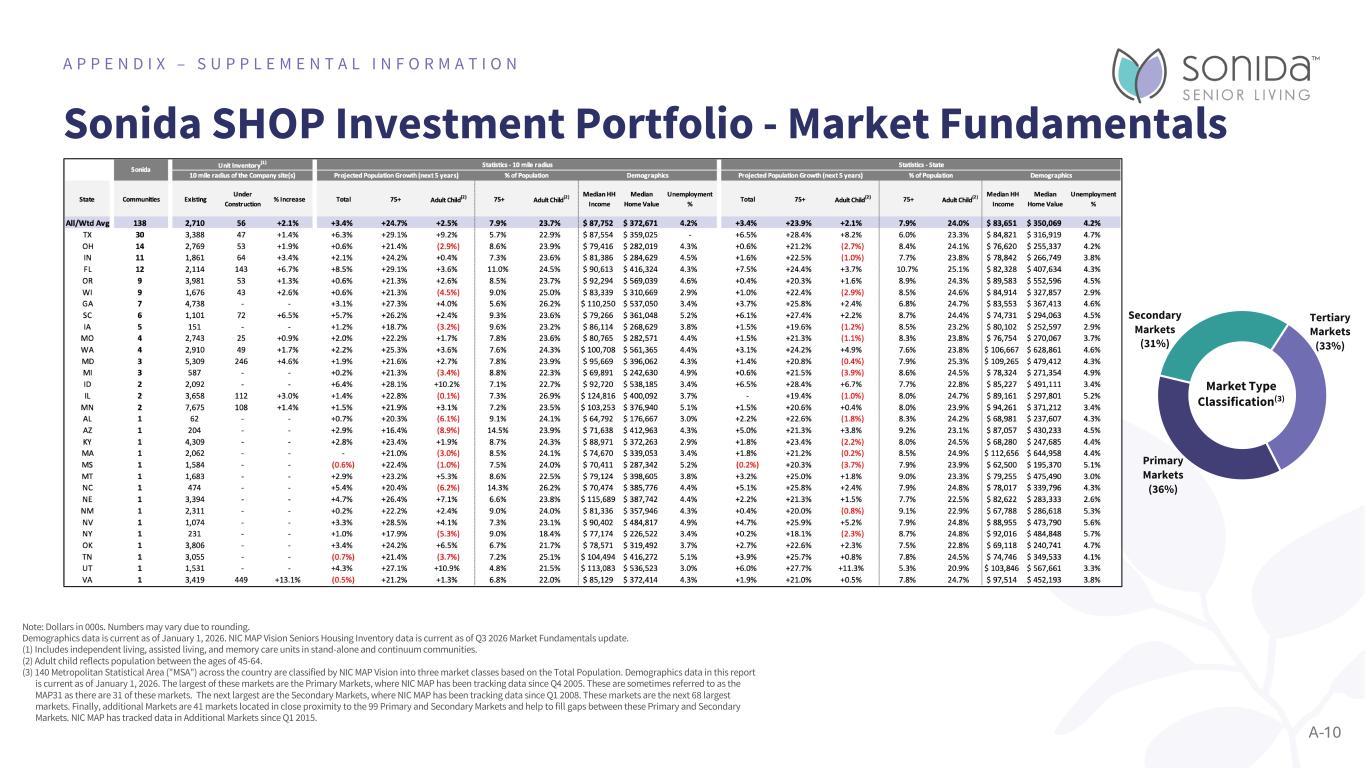
Sonida SHOP Investment Portfolio - Market Fundamentals A P P E N D I X – S U P P L E M E N T A L I N F O R M A T I O N Note: Dollars in 000s. Numbers may vary due to rounding. Demographics data is current as of January 1, 2026. NIC MAP Vision Seniors Housing Inventory data is current as of Q3 2026 Market Fundamentals update. (1) Includes independent living, assisted living, and memory care units in stand-alone and continuum communities. (2) Adult child reflects population between the ages of 45-64. (3) 140 Metropolitan Statistical Area ("MSA") across the country are classified by NIC MAP Vision into three market classes based on the Total Population. Demographics data in this report is current as of January 1, 2026. The largest of these markets are the Primary Markets, where NIC MAP has been tracking data since Q4 2005. These are sometimes referred to as the MAP31 as there are 31 of these markets. The next largest are the Secondary Markets, where NIC MAP has been tracking data since Q1 2008. These markets are the next 68 largest markets. Finally, additional Markets are 41 markets located in close proximity to the 99 Primary and Secondary Markets and help to fill gaps between these Primary and Secondary Markets. NIC MAP has tracked data in Additional Markets since Q1 2015. A-10 Primary Markets (36%) Secondary Markets (31%) Tertiary Markets (33%) Market Type Classification(3)