Shareholder Report
|
|
12 Months Ended |
Sep. 01, 2025 |
Aug. 31, 2026
USD ($)
Holding
|
| Shareholder Report [Line Items] |
|
|
|
| Document Type |
|
|
N-CSR
|
| Amendment Flag |
|
|
false
|
| Registrant Name |
|
|
DBX ETF TRUST
|
| Entity Central Index Key |
|
|
0001503123
|
| Entity Investment Company Type |
|
|
N-1A
|
| Document Period End Date |
|
|
Aug. 31, 2026
|
| Shareholder Report Annual or Semi-Annual |
|
|
Annual Shareholder Report
|
| C000191729 |
|
|
|
| Shareholder Report [Line Items] |
|
|
|
| Fund Name |
|
|
Xtrackers High Beta High Yield Bond ETF
|
| Class Name |
|
|
Xtrackers High Beta High Yield Bond ETF
|
| Trading Symbol |
|
|
HYUP
|
| Security Exchange Name |
|
|
NYSEArca
|
| Annual or Semi-Annual Statement [Text Block] |
|
|
This annual shareholder report contains important information about the Xtrackers High Beta High Yield Bond ETF (the "Fund") for the period September 1, 2025 to August 31, 2026.
|
| Additional Information [Text Block] |
|
|
You can find additional information about the Fund at dws.com/etfreports. You can also request this information by contacting us at (844) 851‐4255.
|
| Additional Information Phone Number |
|
|
(844) 851‐4255
|
| Additional Information Website |
|
|
dws.com/etfreports
|
| Expenses [Text Block] |
|
|
What were the Fund costs for the last year?(Based on a hypothetical $10,000 investment)
Table Summary
Fund |
Costs of a $10,000 investment |
Costs paid as a percentage of a $10,000 investment |
HYUP |
$20 |
0.20% | Gross expense ratio as of the latest prospectus: 0.20%. See prospectus for any contractual or voluntary waivers; without a waiver, costs would have been higher. |
| Expenses Paid, Amount |
|
|
$ 20
|
| Expense Ratio, Percent |
|
|
0.20%
|
| Factors Affecting Performance [Text Block] |
|
|
How did the fund perform last year and what affected its performance?The Fund seeks investment results that correspond generally to the performance, before fees and expenses, of the Solactive USD High Yield Corporates Total Market High Beta Index (the Underlying Index). The Underlying Index is designed to track the performance of the segment of the US dollar-denominated high yield corporate bond market that exhibits higher overall beta to the broader high yield corporate fixed income market. The Fund returned 4.78% for the period ended August 31, 2026. The Fund's underlying index returned 4.91% and the Fund's broad-based index the Bloomberg U.S. Universal Bond Index returned 2.23% during the same period, while the Fund's additional, more narrowly based index, the Solactive USD High Yield Corporates Total Market Index, returned 4.87%. The majority of sectors contributed positively to performance during the period with the greatest contribution coming from Consumer Cyclical, Energy and Consumer Non-Cyclical. The Transportation, Capital Goods and Utility Other sectors detracted from performance. |
| Line Graph [Table Text Block] |
|
|
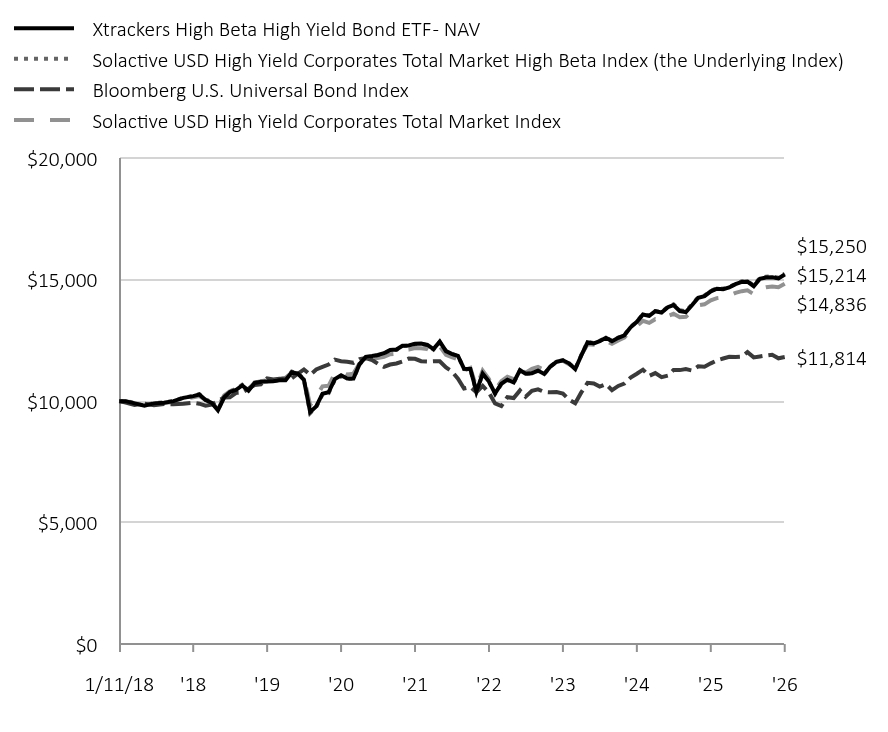
Table Summary
|
Xtrackers High Beta High Yield Bond ETF - NAV |
Solactive USD High Yield Corporates Total Market High Beta Index (the Underlying Index) |
Bloomberg U.S. Universal Bond Index |
Solactive USD High Yield Corporates Total Market Index |
1/11/18 |
$10,000 |
$10,000 |
$10,000 |
$10,000 |
1/31/18 |
$10,000 |
$10,011 |
$9,939 |
$9,994 |
2/28/18 |
$9,905 |
$9,914 |
$9,845 |
$9,906 |
3/31/18 |
$9,808 |
$9,821 |
$9,895 |
$9,846 |
4/30/18 |
$9,908 |
$9,921 |
$9,829 |
$9,914 |
5/31/18 |
$9,934 |
$9,944 |
$9,882 |
$9,928 |
6/30/18 |
$10,000 |
$10,008 |
$9,868 |
$9,966 |
7/31/18 |
$10,134 |
$10,147 |
$9,889 |
$10,087 |
8/31/18 |
$10,206 |
$10,214 |
$9,937 |
$10,157 |
9/30/18 |
$10,275 |
$10,288 |
$9,895 |
$10,212 |
10/31/18 |
$10,045 |
$10,064 |
$9,812 |
$10,053 |
11/30/18 |
$9,932 |
$9,949 |
$9,856 |
$9,993 |
12/31/18 |
$9,621 |
$9,643 |
$10,010 |
$9,774 |
1/31/19 |
$10,158 |
$10,183 |
$10,148 |
$10,237 |
2/28/19 |
$10,373 |
$10,394 |
$10,159 |
$10,406 |
3/31/19 |
$10,467 |
$10,490 |
$10,343 |
$10,506 |
4/30/19 |
$10,646 |
$10,669 |
$10,357 |
$10,637 |
5/31/19 |
$10,433 |
$10,457 |
$10,516 |
$10,497 |
6/30/19 |
$10,744 |
$10,761 |
$10,665 |
$10,766 |
7/31/19 |
$10,800 |
$10,820 |
$10,696 |
$10,818 |
8/31/19 |
$10,805 |
$10,814 |
$10,939 |
$10,866 |
9/30/19 |
$10,820 |
$10,836 |
$10,891 |
$10,888 |
10/31/19 |
$10,855 |
$10,867 |
$10,926 |
$10,926 |
11/30/19 |
$10,858 |
$10,884 |
$10,924 |
$10,958 |
12/31/19 |
$11,190 |
$11,215 |
$10,940 |
$11,175 |
1/31/20 |
$11,125 |
$11,148 |
$11,137 |
$11,146 |
2/29/20 |
$10,877 |
$10,897 |
$11,304 |
$10,960 |
3/31/20 |
$9,552 |
$9,510 |
$11,083 |
$9,840 |
4/30/20 |
$9,785 |
$9,759 |
$11,305 |
$10,185 |
5/31/20 |
$10,307 |
$10,278 |
$11,410 |
$10,610 |
6/30/20 |
$10,363 |
$10,329 |
$11,506 |
$10,630 |
7/31/20 |
$10,906 |
$10,871 |
$11,708 |
$11,142 |
8/31/20 |
$11,063 |
$11,028 |
$11,640 |
$11,223 |
9/30/20 |
$10,929 |
$10,904 |
$11,619 |
$11,099 |
10/31/20 |
$10,933 |
$10,923 |
$11,578 |
$11,132 |
11/30/20 |
$11,521 |
$11,510 |
$11,729 |
$11,551 |
12/31/20 |
$11,824 |
$11,800 |
$11,769 |
$11,752 |
1/31/21 |
$11,856 |
$11,834 |
$11,695 |
$11,765 |
2/28/21 |
$11,902 |
$11,882 |
$11,544 |
$11,775 |
3/31/21 |
$11,973 |
$11,960 |
$11,410 |
$11,822 |
4/30/21 |
$12,108 |
$12,090 |
$11,506 |
$11,932 |
5/31/21 |
$12,129 |
$12,106 |
$11,550 |
$11,953 |
6/30/21 |
$12,283 |
$12,269 |
$11,634 |
$12,094 |
7/31/21 |
$12,292 |
$12,278 |
$11,751 |
$12,120 |
8/31/21 |
$12,358 |
$12,352 |
$11,743 |
$12,189 |
9/30/21 |
$12,371 |
$12,362 |
$11,643 |
$12,181 |
10/31/21 |
$12,313 |
$12,303 |
$11,633 |
$12,142 |
11/30/21 |
$12,140 |
$12,126 |
$11,647 |
$12,011 |
12/31/21 |
$12,449 |
$12,438 |
$11,639 |
$12,258 |
1/31/22 |
$12,059 |
$12,048 |
$11,384 |
$11,910 |
2/28/22 |
$11,948 |
$11,941 |
$11,229 |
$11,813 |
3/31/22 |
$11,859 |
$11,855 |
$10,928 |
$11,724 |
4/30/22 |
$11,331 |
$11,318 |
$10,520 |
$11,269 |
5/31/22 |
$11,322 |
$11,307 |
$10,578 |
$11,366 |
6/30/22 |
$10,394 |
$10,375 |
$10,367 |
$10,561 |
7/31/22 |
$11,131 |
$11,116 |
$10,627 |
$11,256 |
8/31/22 |
$10,805 |
$10,802 |
$10,351 |
$10,904 |
9/30/22 |
$10,315 |
$10,297 |
$9,905 |
$10,471 |
10/31/22 |
$10,715 |
$10,697 |
$9,796 |
$10,820 |
11/30/22 |
$10,882 |
$10,872 |
$10,162 |
$11,003 |
12/31/22 |
$10,768 |
$10,748 |
$10,127 |
$10,910 |
1/31/23 |
$11,274 |
$11,267 |
$10,441 |
$11,338 |
2/28/23 |
$11,130 |
$11,127 |
$10,185 |
$11,168 |
3/31/23 |
$11,151 |
$11,147 |
$10,424 |
$11,327 |
4/30/23 |
$11,257 |
$11,253 |
$10,487 |
$11,407 |
5/31/23 |
$11,118 |
$11,118 |
$10,379 |
$11,279 |
6/30/23 |
$11,424 |
$11,421 |
$10,362 |
$11,476 |
7/31/23 |
$11,622 |
$11,627 |
$10,373 |
$11,628 |
8/31/23 |
$11,681 |
$11,687 |
$10,310 |
$11,659 |
9/30/23 |
$11,558 |
$11,561 |
$10,064 |
$11,519 |
10/31/23 |
$11,319 |
$11,331 |
$9,913 |
$11,379 |
11/30/23 |
$11,879 |
$11,893 |
$10,359 |
$11,900 |
12/31/23 |
$12,426 |
$12,436 |
$10,752 |
$12,342 |
1/31/24 |
$12,379 |
$12,392 |
$10,727 |
$12,317 |
2/29/24 |
$12,467 |
$12,483 |
$10,598 |
$12,349 |
3/31/24 |
$12,612 |
$12,621 |
$10,702 |
$12,485 |
4/30/24 |
$12,470 |
$12,481 |
$10,452 |
$12,359 |
5/31/24 |
$12,608 |
$12,617 |
$10,625 |
$12,501 |
6/30/24 |
$12,712 |
$12,720 |
$10,722 |
$12,619 |
7/31/24 |
$13,041 |
$13,058 |
$10,966 |
$12,881 |
8/31/24 |
$13,266 |
$13,271 |
$11,127 |
$13,087 |
9/30/24 |
$13,570 |
$13,581 |
$11,294 |
$13,309 |
10/31/24 |
$13,511 |
$13,525 |
$11,037 |
$13,223 |
11/30/24 |
$13,704 |
$13,711 |
$11,154 |
$13,372 |
12/31/24 |
$13,648 |
$13,665 |
$10,985 |
$13,313 |
1/31/25 |
$13,866 |
$13,884 |
$11,051 |
$13,505 |
2/28/25 |
$13,956 |
$13,981 |
$11,280 |
$13,596 |
3/31/25 |
$13,710 |
$13,744 |
$11,277 |
$13,458 |
4/30/25 |
$13,662 |
$13,698 |
$11,317 |
$13,477 |
5/31/25 |
$13,955 |
$13,993 |
$11,260 |
$13,701 |
6/30/25 |
$14,258 |
$14,280 |
$11,435 |
$13,945 |
7/31/25 |
$14,322 |
$14,347 |
$11,419 |
$13,985 |
8/31/25 |
$14,520 |
$14,536 |
$11,556 |
$14,147 |
9/30/25 |
$14,628 |
$14,652 |
$11,678 |
$14,241 |
10/31/25 |
$14,611 |
$14,626 |
$11,755 |
$14,270 |
11/30/25 |
$14,679 |
$14,693 |
$11,826 |
$14,351 |
12/31/25 |
$14,816 |
$14,835 |
$11,818 |
$14,461 |
1/31/26 |
$14,909 |
$14,934 |
$11,836 |
$14,528 |
2/28/26 |
$14,920 |
$14,942 |
$12,016 |
$14,561 |
3/31/26 |
$14,733 |
$14,767 |
$11,801 |
$14,404 |
4/30/26 |
$15,033 |
$15,070 |
$11,837 |
$14,638 |
5/31/26 |
$15,090 |
$15,122 |
$11,879 |
$14,693 |
6/30/26 |
$15,096 |
$15,133 |
$11,910 |
$14,722 |
7/31/26 |
$15,051 |
$15,080 |
$11,764 |
$14,689 |
8/31/26 |
$15,214 |
$15,250 |
$11,814 |
$14,836 |
|
| Average Annual Return [Table Text Block] |
|
|
Table Summary
Fund/Index |
1-Year |
5-Year |
Since Inception 1/11/18 |
Xtrackers High Beta High Yield Bond ETF - NAV |
4.78% |
4.24% |
4.98% |
Solactive USD High Yield Corporates Total Market High Beta Index |
4.91% |
4.31% |
5.00% |
Bloomberg U.S. Universal Bond Index |
2.23% |
0.10% |
1.95% |
Solactive USD High Yield Corporates Total Market Index |
4.87% |
4.01% |
4.67% | |
| AssetsNet |
|
|
$ 47,602,269
|
| Holdings Count | Holding |
|
|
690
|
| Advisory Fees Paid, Amount |
|
|
$ 70,910
|
| InvestmentCompanyPortfolioTurnover |
|
|
60.00%
|
| Additional Fund Statistics [Text Block] |
|
|
Table Summary
Net Assets ($) |
47,602,269 |
Number of Portfolio Holdings |
690 |
Portfolio Turnover Rate (%) |
60 |
Total Net Advisory Fees Paid ($) |
70,910 |
Modified duration to worst |
3.4 years | Modified duration to worst is the measure of sensitivity of the prices of bonds held by the Fund to a change in interest rates, computed using each bond's nearest call or maturity date. |
| Holdings [Text Block] |
|
|
Table Summary
Sector |
% of Net Assets |
Communications |
21% |
Consumer, Cyclical |
16% |
Consumer, Non-cyclical |
15% |
Financial |
14% |
Energy |
10% |
Basic Materials |
6% |
Technology |
6% |
Industrial |
5% |
Utilities |
5% |
Diversified |
0% | Geographical Diversification
Table Summary
Country |
% of Net Assets |
United States |
82% |
Canada |
4% |
United Kingdom |
3% |
Luxembourg |
2% |
Other |
6% | |
| Largest Holdings [Text Block] |
|
|
Table Summary
Credit Rating |
% of Net Assets |
BBB |
4% |
BB |
53% |
B |
32% |
CCC |
10% |
CC |
0% | |
| Material Fund Change [Text Block] |
|
|
|
| Updated Prospectus Phone Number |
|
|
(844) 851-4255
|
| Updated Prospectus Web Address |
|
|
dws.com/en-us/resources/proxy-voting
|
| C000194565 |
|
|
|
| Shareholder Report [Line Items] |
|
|
|
| Fund Name |
|
|
Xtrackers Low Beta High Yield Bond ETF
|
| Class Name |
|
|
Xtrackers Low Beta High Yield Bond ETF
|
| Trading Symbol |
|
|
HYDW
|
| Security Exchange Name |
|
|
NYSEArca
|
| Annual or Semi-Annual Statement [Text Block] |
|
|
This annual shareholder report contains important information about the Xtrackers Low Beta High Yield Bond ETF (the "Fund") for the period September 1, 2025 to August 31, 2026.
|
| Additional Information [Text Block] |
|
|
You can find additional information about the Fund at dws.com/etfreports. You can also request this information by contacting us at (844) 851‐4255.
|
| Additional Information Phone Number |
|
|
(844) 851‐4255
|
| Additional Information Website |
|
|
dws.com/etfreports
|
| Expenses [Text Block] |
|
|
What were the Fund costs for the last year?(Based on a hypothetical $10,000 investment)
Table Summary
Fund |
Costs of a $10,000 investment |
Costs paid as a percentage of a $10,000 investment |
HYDW |
$20 |
0.20% | Gross expense ratio as of the latest prospectus: 0.20%. See prospectus for any contractual or voluntary waivers; without a waiver, costs would have been higher. |
| Expenses Paid, Amount |
|
|
$ 20
|
| Expense Ratio, Percent |
|
|
0.20%
|
| Factors Affecting Performance [Text Block] |
|
|
How did the fund perform last year and what affected its performance?The Fund seeks investment results that correspond generally to the performance, before fees and expenses, of the Solactive USD High Yield Corporates Total Market Low Beta Index (the Underlying Index). The Underlying Index is designed to track the performance of the segment of the U.S. dollar denominated high yield corporate bond market that exhibits lower overall beta to the broader high yield corporate fixed income market. The Fund returned 4.54% for the period ended August 31, 2026. The Fund's underlying index returned 4.73% and the Fund's broad-based index the Bloomberg U.S. Universal Bond Index returned 2.23% during the same period, while the Fund's additional, more narrowly based index, the Solactive USD High Yield Corporates Total Market Index, returned 4.87%. All sectors contributed positively to performance during the period with the greatest contribution coming from Consumer Cyclical, Capital Goods and Consumer Non-Cyclical. |
| Line Graph [Table Text Block] |
|
|
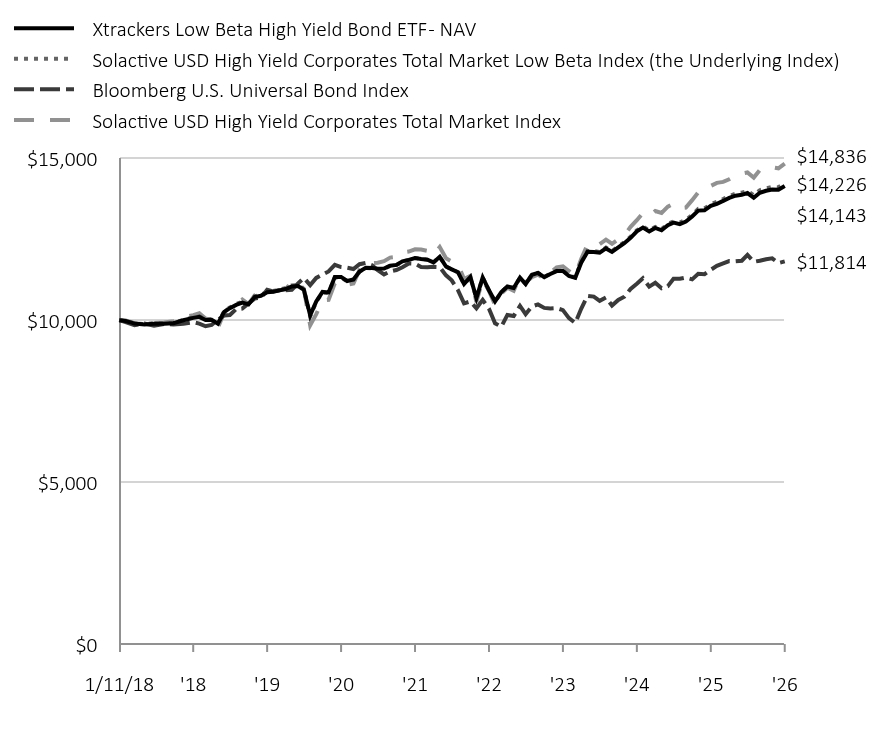
Table Summary
|
Xtrackers Low Beta High Yield Bond ETF - NAV |
Solactive USD High Yield Corporates Total Market Low Beta Index (the Underlying Index) |
Bloomberg U.S. Universal Bond Index |
Solactive USD High Yield Corporates Total Market Index |
1/11/18 |
$10,000 |
$10,000 |
$10,000 |
$10,000 |
1/31/18 |
$9,972 |
$9,980 |
$9,939 |
$9,994 |
2/28/18 |
$9,894 |
$9,899 |
$9,845 |
$9,906 |
3/31/18 |
$9,867 |
$9,877 |
$9,895 |
$9,846 |
4/30/18 |
$9,892 |
$9,905 |
$9,829 |
$9,914 |
5/31/18 |
$9,892 |
$9,906 |
$9,882 |
$9,928 |
6/30/18 |
$9,905 |
$9,913 |
$9,868 |
$9,966 |
7/31/18 |
$9,998 |
$10,011 |
$9,889 |
$10,087 |
8/31/18 |
$10,072 |
$10,083 |
$9,937 |
$10,157 |
9/30/18 |
$10,103 |
$10,115 |
$9,895 |
$10,212 |
10/31/18 |
$10,006 |
$10,027 |
$9,812 |
$10,053 |
11/30/18 |
$10,012 |
$10,029 |
$9,856 |
$9,993 |
12/31/18 |
$9,894 |
$9,912 |
$10,010 |
$9,774 |
1/31/19 |
$10,256 |
$10,278 |
$10,148 |
$10,237 |
2/28/19 |
$10,371 |
$10,394 |
$10,159 |
$10,406 |
3/31/19 |
$10,473 |
$10,497 |
$10,343 |
$10,506 |
4/30/19 |
$10,543 |
$10,569 |
$10,357 |
$10,637 |
5/31/19 |
$10,490 |
$10,513 |
$10,516 |
$10,497 |
6/30/19 |
$10,713 |
$10,737 |
$10,665 |
$10,766 |
7/31/19 |
$10,752 |
$10,779 |
$10,696 |
$10,818 |
8/31/19 |
$10,863 |
$10,882 |
$10,939 |
$10,866 |
9/30/19 |
$10,879 |
$10,901 |
$10,891 |
$10,888 |
10/31/19 |
$10,921 |
$10,944 |
$10,926 |
$10,926 |
11/30/19 |
$10,962 |
$10,988 |
$10,924 |
$10,958 |
12/31/19 |
$11,041 |
$11,073 |
$10,940 |
$11,175 |
1/31/20 |
$11,053 |
$11,082 |
$11,137 |
$11,146 |
2/29/20 |
$10,934 |
$10,959 |
$11,304 |
$10,960 |
3/31/20 |
$10,148 |
$10,121 |
$11,083 |
$9,840 |
4/30/20 |
$10,578 |
$10,564 |
$11,305 |
$10,185 |
5/31/20 |
$10,876 |
$10,853 |
$11,410 |
$10,610 |
6/30/20 |
$10,857 |
$10,838 |
$11,506 |
$10,630 |
7/31/20 |
$11,332 |
$11,316 |
$11,708 |
$11,142 |
8/31/20 |
$11,336 |
$11,324 |
$11,640 |
$11,223 |
9/30/20 |
$11,209 |
$11,195 |
$11,619 |
$11,099 |
10/31/20 |
$11,254 |
$11,240 |
$11,578 |
$11,132 |
11/30/20 |
$11,502 |
$11,494 |
$11,729 |
$11,551 |
12/31/20 |
$11,620 |
$11,609 |
$11,769 |
$11,752 |
1/31/21 |
$11,611 |
$11,601 |
$11,695 |
$11,765 |
2/28/21 |
$11,585 |
$11,574 |
$11,544 |
$11,775 |
3/31/21 |
$11,593 |
$11,590 |
$11,410 |
$11,822 |
4/30/21 |
$11,682 |
$11,677 |
$11,506 |
$11,932 |
5/31/21 |
$11,706 |
$11,699 |
$11,550 |
$11,953 |
6/30/21 |
$11,819 |
$11,815 |
$11,634 |
$12,094 |
7/31/21 |
$11,863 |
$11,857 |
$11,751 |
$12,120 |
8/31/21 |
$11,917 |
$11,920 |
$11,743 |
$12,189 |
9/30/21 |
$11,888 |
$11,891 |
$11,643 |
$12,181 |
10/31/21 |
$11,868 |
$11,870 |
$11,633 |
$12,142 |
11/30/21 |
$11,783 |
$11,783 |
$11,647 |
$12,011 |
12/31/21 |
$11,956 |
$11,957 |
$11,639 |
$12,258 |
1/31/22 |
$11,656 |
$11,658 |
$11,384 |
$11,910 |
2/28/22 |
$11,570 |
$11,570 |
$11,229 |
$11,813 |
3/31/22 |
$11,480 |
$11,482 |
$10,928 |
$11,724 |
4/30/22 |
$11,114 |
$11,114 |
$10,520 |
$11,269 |
5/31/22 |
$11,332 |
$11,332 |
$10,578 |
$11,366 |
6/30/22 |
$10,681 |
$10,676 |
$10,367 |
$10,561 |
7/31/22 |
$11,319 |
$11,312 |
$10,627 |
$11,256 |
8/31/22 |
$10,922 |
$10,922 |
$10,351 |
$10,904 |
9/30/22 |
$10,577 |
$10,568 |
$9,905 |
$10,471 |
10/31/22 |
$10,865 |
$10,861 |
$9,796 |
$10,820 |
11/30/22 |
$11,042 |
$11,045 |
$10,162 |
$11,003 |
12/31/22 |
$10,996 |
$10,986 |
$10,127 |
$10,910 |
1/31/23 |
$11,313 |
$11,314 |
$10,441 |
$11,338 |
2/28/23 |
$11,114 |
$11,117 |
$10,185 |
$11,168 |
3/31/23 |
$11,401 |
$11,406 |
$10,424 |
$11,327 |
4/30/23 |
$11,458 |
$11,462 |
$10,487 |
$11,407 |
5/31/23 |
$11,331 |
$11,341 |
$10,379 |
$11,279 |
6/30/23 |
$11,426 |
$11,435 |
$10,362 |
$11,476 |
7/31/23 |
$11,515 |
$11,529 |
$10,373 |
$11,628 |
8/31/23 |
$11,517 |
$11,531 |
$10,310 |
$11,659 |
9/30/23 |
$11,366 |
$11,375 |
$10,064 |
$11,519 |
10/31/23 |
$11,307 |
$11,322 |
$9,913 |
$11,379 |
11/30/23 |
$11,782 |
$11,803 |
$10,359 |
$11,900 |
12/31/23 |
$12,115 |
$12,134 |
$10,752 |
$12,342 |
1/31/24 |
$12,106 |
$12,131 |
$10,727 |
$12,317 |
2/29/24 |
$12,082 |
$12,107 |
$10,598 |
$12,349 |
3/31/24 |
$12,215 |
$12,240 |
$10,702 |
$12,485 |
4/30/24 |
$12,106 |
$12,133 |
$10,452 |
$12,359 |
5/31/24 |
$12,247 |
$12,276 |
$10,625 |
$12,501 |
6/30/24 |
$12,378 |
$12,407 |
$10,722 |
$12,619 |
7/31/24 |
$12,542 |
$12,577 |
$10,966 |
$12,881 |
8/31/24 |
$12,746 |
$12,773 |
$11,127 |
$13,087 |
9/30/24 |
$12,858 |
$12,893 |
$11,294 |
$13,309 |
10/31/24 |
$12,738 |
$12,775 |
$11,037 |
$13,222 |
11/30/24 |
$12,848 |
$12,881 |
$11,154 |
$13,372 |
12/31/24 |
$12,774 |
$12,809 |
$10,985 |
$13,313 |
1/31/25 |
$12,932 |
$12,970 |
$11,051 |
$13,505 |
2/28/25 |
$13,012 |
$13,052 |
$11,280 |
$13,596 |
3/31/25 |
$12,967 |
$13,015 |
$11,277 |
$13,458 |
4/30/25 |
$13,048 |
$13,096 |
$11,317 |
$13,477 |
5/31/25 |
$13,201 |
$13,252 |
$11,260 |
$13,706 |
6/30/25 |
$13,383 |
$13,438 |
$11,435 |
$13,945 |
7/31/25 |
$13,393 |
$13,450 |
$11,419 |
$13,985 |
8/31/25 |
$13,530 |
$13,584 |
$11,556 |
$14,147 |
9/30/25 |
$13,594 |
$13,654 |
$11,678 |
$14,241 |
10/31/25 |
$13,682 |
$13,740 |
$11,755 |
$14,270 |
11/30/25 |
$13,775 |
$13,834 |
$11,826 |
$14,351 |
12/31/25 |
$13,845 |
$13,906 |
$11,818 |
$14,461 |
1/31/26 |
$13,871 |
$13,937 |
$11,836 |
$14,528 |
2/28/26 |
$13,925 |
$13,992 |
$12,016 |
$14,561 |
3/31/26 |
$13,780 |
$13,856 |
$11,801 |
$14,404 |
4/30/26 |
$13,936 |
$14,014 |
$11,837 |
$14,638 |
5/31/26 |
$13,996 |
$14,070 |
$11,879 |
$14,693 |
6/30/26 |
$14,036 |
$14,116 |
$11,910 |
$14,722 |
7/31/26 |
$14,030 |
$14,106 |
$11,764 |
$14,689 |
8/31/26 |
$14,143 |
$14,226 |
$11,814 |
$14,836 |
|
| Average Annual Return [Table Text Block] |
|
|
Table Summary
Fund/Index |
1-Year |
5-Year |
Since Inception 1/11/18 |
Xtrackers Low Beta High Yield Bond ETF - NAV |
4.54% |
3.48% |
4.09% |
Solactive USD High Yield Corporates Total Market Low Beta Index |
4.73% |
3.60% |
4.16% |
Bloomberg U.S. Universal Bond Index |
2.23% |
0.10% |
1.95% |
Solactive USD High Yield Corporates Total Market Index |
4.87% |
4.01% |
4.67% | |
| AssetsNet |
|
|
$ 63,084,389
|
| Holdings Count | Holding |
|
|
583
|
| Advisory Fees Paid, Amount |
|
|
$ 177,970
|
| InvestmentCompanyPortfolioTurnover |
|
|
54.00%
|
| Additional Fund Statistics [Text Block] |
|
|
Table Summary
Net Assets ($) |
63,084,389 |
Number of Portfolio Holdings |
583 |
Portfolio Turnover Rate (%) |
54 |
Total Net Advisory Fees Paid ($) |
177,970 |
Modified duration to worst |
2.5 years | Modified duration to worst is the measure of sensitivity of the prices of bonds held by the Fund to a change in interest rates, computed using each bond's nearest call or maturity date. |
| Holdings [Text Block] |
|
|
Table Summary
Sector |
% of Net Assets |
Consumer, Non-cyclical |
22% |
Consumer, Cyclical |
17% |
Industrial |
15% |
Financial |
13% |
Energy |
11% |
Communications |
9% |
Basic Materials |
4% |
Technology |
4% |
Utilities |
2% | Geographical Diversification
Table Summary
Country |
% of Net Assets |
United States |
86% |
Canada |
4% |
Other |
7% | |
| Largest Holdings [Text Block] |
|
|
Table Summary
Credit Rating |
% of Net Assets |
BBB |
13% |
BB |
75% |
B |
11% |
CCC |
0% | |
| Material Fund Change [Text Block] |
|
|
|
| Updated Prospectus Phone Number |
|
|
(844) 851-4255
|
| Updated Prospectus Web Address |
|
|
dws.com/en-us/resources/proxy-voting
|
| C000191727 |
|
|
|
| Shareholder Report [Line Items] |
|
|
|
| Fund Name |
|
|
Xtrackers Short Duration High Yield Bond ETF
|
| Class Name |
|
|
Xtrackers Short Duration High Yield Bond ETF
|
| Trading Symbol |
|
|
SHYL
|
| Security Exchange Name |
|
|
NYSEArca
|
| Annual or Semi-Annual Statement [Text Block] |
|
|
This annual shareholder report contains important information about the Xtrackers Short Duration High Yield Bond ETF (the "Fund") for the period September 1, 2025 to August 31, 2026.
|
| Additional Information [Text Block] |
|
|
You can find additional information about the Fund at dws.com/etfreports. You can also request this information by contacting us at (844) 851‐4255.
|
| Additional Information Phone Number |
|
|
(844) 851‐4255
|
| Additional Information Website |
|
|
dws.com/etfreports
|
| Expenses [Text Block] |
|
|
What were the Fund costs for the last year?(Based on a hypothetical $10,000 investment)
Table Summary
Fund |
Costs of a $10,000 investment |
Costs paid as a percentage of a $10,000 investment |
SHYL |
$20 |
0.20% | Gross expense ratio as of the latest prospectus: 0.20%. See prospectus for any contractual or voluntary waivers; without a waiver, costs would have been higher. |
| Expenses Paid, Amount |
|
|
$ 20
|
| Expense Ratio, Percent |
|
|
0.20%
|
| Factors Affecting Performance [Text Block] |
|
|
How did the fund perform last year and what affected its performance?The Fund seeks investment results that correspond generally to the performance, before fees and expenses, of the Solactive USD High Yield Corporates Total Market 0-5 Year Index (the Underlying Index). The Underlying Index is designed to track the performance of short-term publicly issued US dollar denominated below investment grade corporate debt. The Fund returned 4.32% for the period ended August 31, 2026. The Fund's underlying index returned 4.50% and the Fund's broad-based index the Bloomberg U.S. Universal Bond Index returned 2.23% during the same period, while the Fund's additional, more narrowly based index, the Solactive USD High Yield Corporates Total Market Index, returned 4.87%. The majority of sectors contributed positively to performance during the period with the greatest contribution coming from Consumer Cyclical, Consumer Non-Cyclical and Energy. The Transportation and Utility Other sectors detracted from performance. |
| Line Graph [Table Text Block] |
|
|
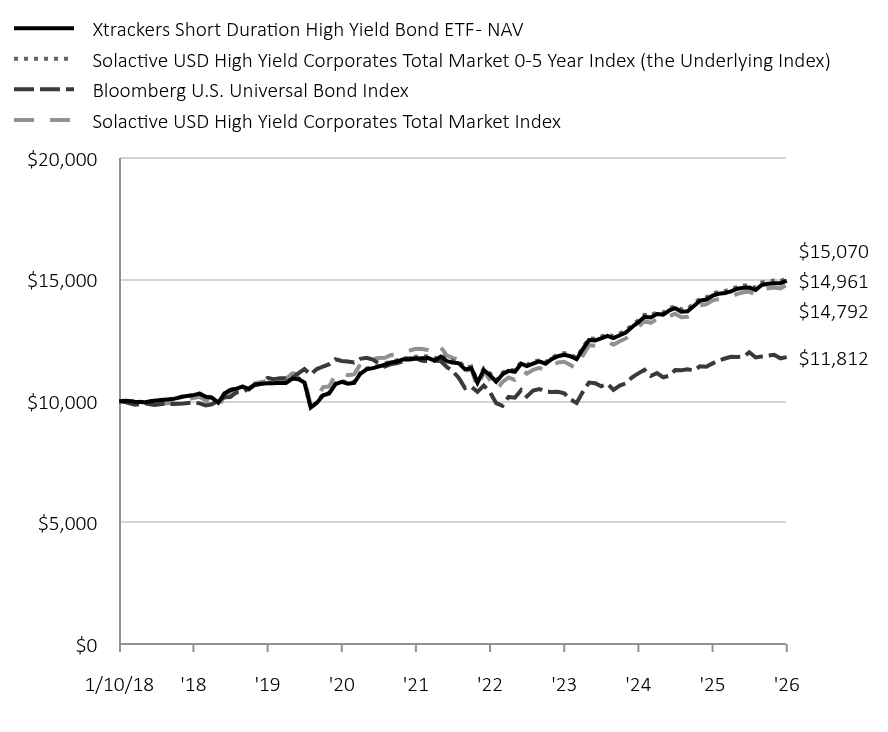
Table Summary
|
Xtrackers Short Duration High Yield Bond ETF - NAV |
Solactive USD High Yield Corporates Total Market 0-5 Year Index (the Underlying Index) |
Bloomberg U.S. Universal Bond Index |
Solactive USD High Yield Corporates Total Market Index |
1/10/18 |
$10,000 |
$10,000 |
$10,000 |
$10,000 |
1/31/18 |
$10,019 |
$10,025 |
$9,952 |
$9,965 |
2/28/18 |
$9,978 |
$9,986 |
$9,857 |
$9,876 |
3/31/18 |
$9,954 |
$9,957 |
$9,907 |
$9,817 |
4/30/18 |
$10,016 |
$10,028 |
$9,841 |
$9,884 |
5/31/18 |
$10,055 |
$10,065 |
$9,895 |
$9,898 |
6/30/18 |
$10,093 |
$10,098 |
$9,880 |
$9,936 |
7/31/18 |
$10,188 |
$10,198 |
$9,901 |
$10,057 |
8/31/18 |
$10,247 |
$10,249 |
$9,950 |
$10,126 |
9/30/18 |
$10,308 |
$10,311 |
$9,907 |
$10,181 |
10/31/18 |
$10,177 |
$10,192 |
$9,824 |
$10,023 |
11/30/18 |
$10,140 |
$10,147 |
$9,868 |
$9,963 |
12/31/18 |
$9,939 |
$9,948 |
$10,023 |
$9,745 |
1/31/19 |
$10,315 |
$10,320 |
$10,161 |
$10,206 |
2/28/19 |
$10,458 |
$10,463 |
$10,172 |
$10,374 |
3/31/19 |
$10,514 |
$10,519 |
$10,356 |
$10,475 |
4/30/19 |
$10,597 |
$10,601 |
$10,370 |
$10,606 |
5/31/19 |
$10,504 |
$10,503 |
$10,529 |
$10,465 |
6/30/19 |
$10,676 |
$10,680 |
$10,678 |
$10,734 |
7/31/19 |
$10,714 |
$10,719 |
$10,710 |
$10,786 |
8/31/19 |
$10,735 |
$10,734 |
$10,952 |
$10,833 |
9/30/19 |
$10,741 |
$10,747 |
$10,905 |
$10,856 |
10/31/19 |
$10,761 |
$10,770 |
$10,940 |
$10,894 |
11/30/19 |
$10,747 |
$10,772 |
$10,938 |
$10,925 |
12/31/19 |
$10,931 |
$10,966 |
$10,954 |
$11,141 |
1/31/20 |
$10,905 |
$10,940 |
$11,151 |
$11,113 |
2/29/20 |
$10,763 |
$10,804 |
$11,318 |
$10,927 |
3/31/20 |
$9,732 |
$9,700 |
$11,097 |
$9,810 |
4/30/20 |
$9,926 |
$9,970 |
$11,319 |
$10,154 |
5/31/20 |
$10,241 |
$10,278 |
$11,425 |
$10,578 |
6/30/20 |
$10,314 |
$10,352 |
$11,520 |
$10,598 |
7/31/20 |
$10,699 |
$10,734 |
$11,722 |
$11,109 |
8/31/20 |
$10,796 |
$10,832 |
$11,655 |
$11,190 |
9/30/20 |
$10,721 |
$10,759 |
$11,634 |
$11,065 |
10/31/20 |
$10,753 |
$10,789 |
$11,592 |
$11,099 |
11/30/20 |
$11,119 |
$11,160 |
$11,743 |
$11,516 |
12/31/20 |
$11,308 |
$11,345 |
$11,784 |
$11,717 |
1/31/21 |
$11,357 |
$11,393 |
$11,710 |
$11,730 |
2/28/21 |
$11,420 |
$11,457 |
$11,559 |
$11,775 |
3/31/21 |
$11,499 |
$11,546 |
$11,424 |
$11,787 |
4/30/21 |
$11,594 |
$11,641 |
$11,520 |
$11,896 |
5/31/21 |
$11,634 |
$11,679 |
$11,564 |
$11,917 |
6/30/21 |
$11,721 |
$11,775 |
$11,648 |
$12,057 |
7/31/21 |
$11,715 |
$11,769 |
$11,765 |
$12,084 |
8/31/21 |
$11,753 |
$11,823 |
$11,758 |
$12,153 |
9/30/21 |
$11,768 |
$11,839 |
$11,657 |
$12,144 |
10/31/21 |
$11,773 |
$11,846 |
$11,648 |
$12,106 |
11/30/21 |
$11,673 |
$11,744 |
$11,662 |
$11,975 |
12/31/21 |
$11,832 |
$11,911 |
$11,654 |
$12,221 |
1/31/22 |
$11,644 |
$11,721 |
$11,398 |
$11,874 |
2/28/22 |
$11,586 |
$11,658 |
$11,243 |
$11,778 |
3/31/22 |
$11,556 |
$11,630 |
$10,941 |
$11,689 |
4/30/22 |
$11,308 |
$11,375 |
$10,533 |
$11,235 |
5/31/22 |
$11,355 |
$11,422 |
$10,591 |
$11,332 |
6/30/22 |
$10,759 |
$10,815 |
$10,380 |
$10,530 |
7/31/22 |
$11,280 |
$11,348 |
$10,641 |
$11,222 |
8/31/22 |
$11,065 |
$11,143 |
$10,364 |
$10,871 |
9/30/22 |
$10,795 |
$10,861 |
$9,917 |
$10,440 |
10/31/22 |
$11,101 |
$11,166 |
$9,809 |
$10,788 |
11/30/22 |
$11,245 |
$11,309 |
$10,174 |
$10,970 |
12/31/22 |
$11,205 |
$11,261 |
$10,140 |
$10,877 |
1/31/23 |
$11,541 |
$11,609 |
$10,454 |
$11,304 |
2/28/23 |
$11,445 |
$11,506 |
$10,197 |
$11,134 |
3/31/23 |
$11,544 |
$11,601 |
$10,437 |
$11,293 |
4/30/23 |
$11,634 |
$11,689 |
$10,500 |
$11,373 |
5/31/23 |
$11,539 |
$11,602 |
$10,392 |
$11,245 |
6/30/23 |
$11,731 |
$11,791 |
$10,375 |
$11,442 |
7/31/23 |
$11,848 |
$11,914 |
$10,386 |
$11,593 |
8/31/23 |
$11,910 |
$11,975 |
$10,323 |
$11,624 |
9/30/23 |
$11,850 |
$11,909 |
$10,077 |
$11,485 |
10/31/23 |
$11,724 |
$11,787 |
$9,925 |
$11,345 |
11/30/23 |
$12,132 |
$12,200 |
$10,372 |
$11,864 |
12/31/23 |
$12,512 |
$12,579 |
$10,766 |
$12,305 |
1/31/24 |
$12,501 |
$12,572 |
$10,740 |
$12,281 |
2/29/24 |
$12,580 |
$12,654 |
$10,611 |
$12,312 |
3/31/24 |
$12,683 |
$12,753 |
$10,715 |
$12,448 |
4/30/24 |
$12,594 |
$12,667 |
$10,465 |
$12,322 |
5/31/24 |
$12,714 |
$12,790 |
$10,638 |
$12,464 |
6/30/24 |
$12,823 |
$12,899 |
$10,736 |
$12,581 |
7/31/24 |
$13,055 |
$13,138 |
$10,979 |
$12,842 |
8/31/24 |
$13,250 |
$13,324 |
$11,141 |
$13,048 |
9/30/24 |
$13,474 |
$13,557 |
$11,292 |
$13,309 |
10/31/24 |
$13,442 |
$13,527 |
$11,036 |
$13,223 |
11/30/24 |
$13,587 |
$13,665 |
$11,152 |
$13,372 |
12/31/24 |
$13,563 |
$13,640 |
$10,984 |
$13,313 |
1/31/25 |
$13,742 |
$13,822 |
$11,050 |
$13,505 |
2/28/25 |
$13,825 |
$13,912 |
$11,278 |
$13,596 |
3/31/25 |
$13,681 |
$13,775 |
$11,276 |
$13,458 |
4/30/25 |
$13,701 |
$13,794 |
$11,315 |
$13,477 |
5/31/25 |
$13,918 |
$14,014 |
$11,258 |
$13,701 |
6/30/25 |
$14,134 |
$14,216 |
$11,433 |
$13,945 |
7/31/25 |
$14,183 |
$14,267 |
$11,417 |
$13,985 |
8/31/25 |
$14,342 |
$14,422 |
$11,554 |
$14,147 |
9/30/25 |
$14,418 |
$14,505 |
$11,677 |
$14,199 |
10/31/25 |
$14,455 |
$14,537 |
$11,754 |
$14,227 |
11/30/25 |
$14,517 |
$14,599 |
$11,825 |
$14,308 |
12/31/25 |
$14,627 |
$14,709 |
$11,816 |
$14,417 |
1/31/26 |
$14,665 |
$14,758 |
$11,834 |
$14,485 |
2/28/26 |
$14,679 |
$14,771 |
$12,014 |
$14,517 |
3/31/26 |
$14,578 |
$14,678 |
$11,799 |
$14,361 |
4/30/26 |
$14,783 |
$14,888 |
$11,835 |
$14,594 |
5/31/26 |
$14,834 |
$14,935 |
$11,877 |
$14,649 |
6/30/26 |
$14,858 |
$14,964 |
$11,908 |
$14,677 |
7/31/26 |
$14,855 |
$14,943 |
$11,762 |
$14,645 |
8/31/26 |
$14,961 |
$15,070 |
$11,812 |
$14,792 |
|
| Average Annual Return [Table Text Block] |
|
|
Table Summary
Fund/Index |
1-Year |
5-Year |
Since Inception 1/10/18 |
Xtrackers Short Duration High Yield Bond ETF - NAV |
4.32% |
4.94% |
4.77% |
Solactive USD High Yield Corporates Total Market 0-5 Year Index |
4.50% |
4.97% |
4.86% |
Bloomberg U.S. Universal Bond Index |
2.23% |
0.10% |
1.95% |
Solactive USD High Yield Corporates Total Market Index |
4.87% |
4.01% |
4.63% | |
| AssetsNet |
|
|
$ 267,263,118
|
| Holdings Count | Holding |
|
|
831
|
| Advisory Fees Paid, Amount |
|
|
$ 503,302
|
| InvestmentCompanyPortfolioTurnover |
|
|
46.00%
|
| Additional Fund Statistics [Text Block] |
|
|
Table Summary
Net Assets ($) |
267,263,118 |
Number of Portfolio Holdings |
831 |
Portfolio Turnover Rate (%) |
46 |
Total Net Advisory Fees Paid ($) |
503,302 |
Modified duration to worst |
2.2 years | Modified duration to worst is the measure of sensitivity of the prices of bonds held by the Fund to a change in interest rates, computed using each bond's nearest call or maturity date. |
| Holdings [Text Block] |
|
|
Table Summary
Sector |
% of Net Assets |
Consumer, Cyclical |
19% |
Consumer, Non-cyclical |
18% |
Communications |
16% |
Financial |
15% |
Industrial |
9% |
Energy |
9% |
Technology |
5% |
Basic Materials |
5% |
Utilities |
2% |
Diversified |
0% | Geographical Diversification
Table Summary
Country |
% of Net Assets |
United States |
83% |
Canada |
5% |
Luxembourg |
2% |
United Kingdom |
2% |
Japan |
2% |
Other |
4% | |
| Largest Holdings [Text Block] |
|
|
Table Summary
Credit Rating |
% of Net Assets |
BBB |
8% |
BB |
62% |
B |
22% |
CCC |
7% |
CC |
0% | |
| Material Fund Change [Text Block] |
|
|
|
| Updated Prospectus Phone Number |
|
|
(844) 851-4255
|
| Updated Prospectus Web Address |
|
|
dws.com/en-us/resources/proxy-voting
|
| C000245668 |
|
|
|
| Shareholder Report [Line Items] |
|
|
|
| Fund Name |
|
|
Xtrackers USD High Yield BB-B ex Financials ETF
|
| Class Name |
|
|
Xtrackers USD High Yield BB-B ex Financials ETF
|
| Trading Symbol |
|
|
BHYB
|
| Security Exchange Name |
|
|
CboeBZX
|
| Annual or Semi-Annual Statement [Text Block] |
|
|
This annual shareholder report contains important information about the Xtrackers USD High Yield BB-B ex Financials ETF (the "Fund") for the period September 1, 2025 to August 31, 2026.
|
| Additional Information [Text Block] |
|
|
You can find additional information about the Fund at dws.com/etfreports. You can also request this information by contacting us at (844) 851‐4255.
|
| Additional Information Phone Number |
|
|
(844) 851‐4255
|
| Additional Information Website |
|
|
dws.com/etfreports
|
| Expenses [Text Block] |
|
|
What were the Fund costs for the last year?(Based on a hypothetical $10,000 investment)
Table Summary
Fund |
Costs of a $10,000 investment |
Costs paid as a percentage of a $10,000 investment |
BHYB |
$21 |
0.20% | Gross expense ratio as of the latest prospectus: 0.20%. See prospectus for any contractual or voluntary waivers; without a waiver, costs would have been higher. |
| Expenses Paid, Amount |
|
|
$ 21
|
| Expense Ratio, Percent |
|
|
0.20%
|
| Factors Affecting Performance [Text Block] |
|
|
How did the fund perform last year and what affected its performance?The Fund seeks investment results that correspond generally to the performance, before fees and expenses, of the ICE BofA BB-B Non-FNCL Non-Distressed US HY Constrained Index (the Underlying Index). The Underlying Index is a subset of the ICE BofA US High Yield Index which is designed to track the performance of US dollar denominated below investment grade corporate debt publicly issued in the US domestic market. The Fund returned 5.34% for the period ended August 31, 2026. The Fund's underlying index returned 5.45% and the Fund's broad-based index the Bloomberg U.S. Universal Bond Index returned 2.23% during the same period. All sectors contributed positively to performance during the period with the greatest contribution coming from Consumer Cyclical, Energy and Communications. |
| Line Graph [Table Text Block] |
|
|
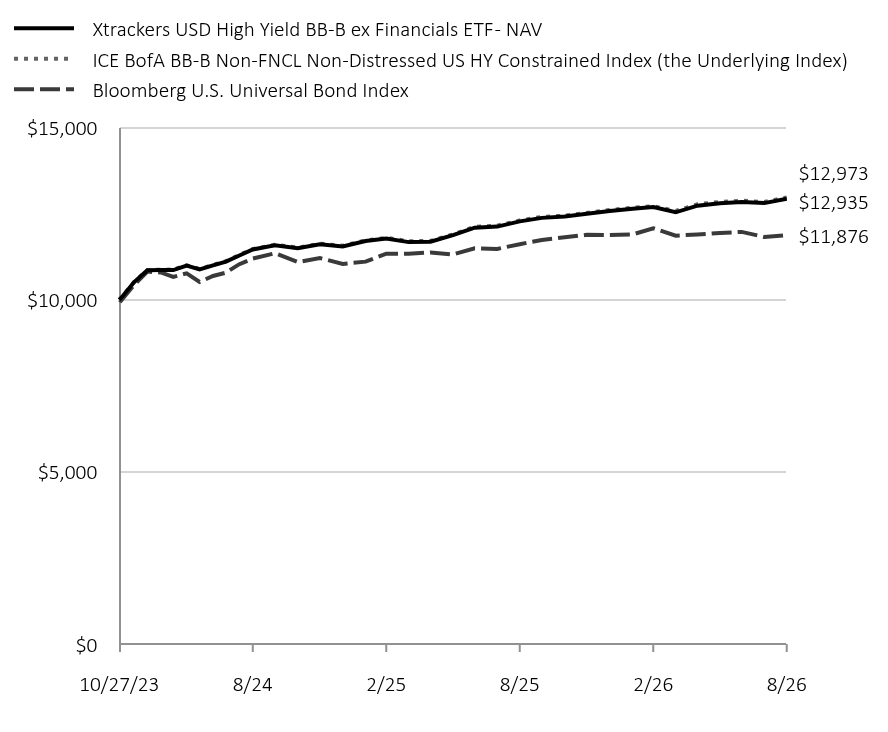
Table Summary
|
Xtrackers USD High Yield BB-B ex Financials ETF - NAV |
ICE BofA BB-B Non-FNCL Non-Distressed US HY Constrained Index (the Underlying Index) |
Bloomberg U.S. Universal Bond Index |
10/27/23 |
$10,000 |
$10,000 |
$10,000 |
10/31/23 |
$10,047 |
$10,052 |
$9,975 |
11/30/23 |
$10,507 |
$10,515 |
$10,424 |
12/31/23 |
$10,856 |
$10,862 |
$10,820 |
1/31/24 |
$10,867 |
$10,876 |
$10,794 |
2/29/24 |
$10,864 |
$10,877 |
$10,665 |
3/31/24 |
$10,991 |
$11,002 |
$10,769 |
4/30/24 |
$10,883 |
$10,897 |
$10,518 |
5/31/24 |
$11,001 |
$11,012 |
$10,692 |
6/30/24 |
$11,108 |
$11,119 |
$10,790 |
7/31/24 |
$11,287 |
$11,302 |
$11,035 |
8/31/24 |
$11,462 |
$11,474 |
$11,197 |
9/30/24 |
$11,582 |
$11,600 |
$11,353 |
10/31/24 |
$11,495 |
$11,513 |
$11,095 |
11/30/24 |
$11,614 |
$11,631 |
$11,212 |
12/31/24 |
$11,552 |
$11,569 |
$11,043 |
1/31/25 |
$11,709 |
$11,723 |
$11,109 |
2/28/25 |
$11,781 |
$11,802 |
$11,339 |
3/31/25 |
$11,676 |
$11,700 |
$11,336 |
4/30/25 |
$11,686 |
$11,711 |
$11,376 |
5/31/25 |
$11,878 |
$11,898 |
$11,318 |
6/30/25 |
$12,095 |
$12,122 |
$11,495 |
7/31/25 |
$12,127 |
$12,155 |
$11,478 |
8/31/25 |
$12,279 |
$12,302 |
$11,616 |
9/30/25 |
$12,380 |
$12,408 |
$11,739 |
10/31/25 |
$12,420 |
$12,445 |
$11,817 |
11/30/25 |
$12,499 |
$12,525 |
$11,888 |
12/31/25 |
$12,577 |
$12,606 |
$11,880 |
1/31/26 |
$12,645 |
$12,672 |
$11,898 |
2/28/26 |
$12,693 |
$12,723 |
$12,079 |
3/31/26 |
$12,542 |
$12,579 |
$11,863 |
4/30/26 |
$12,734 |
$12,774 |
$11,899 |
5/31/26 |
$12,806 |
$12,844 |
$11,941 |
6/30/26 |
$12,842 |
$12,879 |
$11,972 |
7/31/26 |
$12,809 |
$12,841 |
$11,825 |
8/31/26 |
$12,935 |
$12,973 |
$11,876 |
|
| Average Annual Return [Table Text Block] |
|
|
Table Summary
Fund/Index |
1-Year |
Since Inception 10/27/23 |
Xtrackers USD High Yield BB-B ex Financials ETF - NAV |
5.34% |
9.45% |
ICE BofA BB-B Non-FNCL Non-Distressed US HY Constrained Index |
5.45% |
9.56% |
Bloomberg U.S. Universal Bond Index |
2.23% |
6.22% | |
| AssetsNet |
|
|
$ 3,118,831,814
|
| Holdings Count | Holding |
|
|
1,471
|
| Advisory Fees Paid, Amount |
|
|
$ 3,777,295
|
| InvestmentCompanyPortfolioTurnover |
|
|
37.00%
|
| Additional Fund Statistics [Text Block] |
|
|
Table Summary
Net Assets ($) |
3,118,831,814 |
Number of Portfolio Holdings |
1,471 |
Portfolio Turnover Rate (%) |
37 |
Total Net Advisory Fees Paid ($) |
3,777,295 |
Modified duration to worst |
3.1 years | Modified duration to worst is the measure of sensitivity of the prices of bonds held by the Fund to a change in interest rates, computed using each bond's nearest call or maturity date. |
| Holdings [Text Block] |
|
|
Table Summary
Sector |
% of Net Assets |
Consumer, Cyclical |
20% |
Communications |
18% |
Consumer, Non-cyclical |
17% |
Energy |
13% |
Industrial |
11% |
Basic Materials |
6% |
Technology |
5% |
Financial |
4% |
Utilities |
4% |
Diversified |
0% | Geographical Diversification
Table Summary
Country |
% of Net Assets |
United States |
85% |
Canada |
4% |
United Kingdom |
2% |
Other |
7% | |
| Largest Holdings [Text Block] |
|
|
Table Summary
Credit Rating |
% of Net Assets |
BBB |
8% |
BB |
69% |
B |
23% | |
| Material Fund Change [Text Block] |
|
|
|
| Updated Prospectus Phone Number |
|
|
(844) 851-4255
|
| Updated Prospectus Web Address |
|
|
dws.com/en-us/resources/proxy-voting
|
| C000138373 |
|
|
|
| Shareholder Report [Line Items] |
|
|
|
| Fund Name |
|
|
Xtrackers USD High Yield Corporate Bond ETF
|
| Class Name |
|
|
Xtrackers USD High Yield Corporate Bond ETF
|
| Trading Symbol |
|
|
HYLB
|
| Security Exchange Name |
|
|
NYSEArca
|
| Annual or Semi-Annual Statement [Text Block] |
|
|
This annual shareholder report contains important information about the Xtrackers USD High Yield Corporate Bond ETF (the "Fund") for the period September 1, 2025 to August 31, 2026.
|
| Additional Information [Text Block] |
|
|
You can find additional information about the Fund at dws.com/etfreports. You can also request this information by contacting us at (844) 851‐4255.
|
| Additional Information Phone Number |
|
|
(844) 851‐4255
|
| Additional Information Website |
|
|
dws.com/etfreports
|
| Expenses [Text Block] |
|
|
What were the Fund costs for the last year?(Based on a hypothetical $10,000 investment)
Table Summary
Fund |
Costs of a $10,000 investment |
Costs paid as a percentage of a $10,000 investment |
HYLB |
$5 |
0.05% | Gross expense ratio as of the latest prospectus: 0.05%. See prospectus for any contractual or voluntary waivers; without a waiver, costs would have been higher. |
| Expenses Paid, Amount |
|
|
$ 5
|
| Expense Ratio, Percent |
|
|
0.05%
|
| Factors Affecting Performance [Text Block] |
|
|
How did the fund perform last year and what affected its performance?The Fund seeks investment results that correspond generally to the performance, before fees and expenses, of the Solactive USD High Yield Corporates Total Market Index (the Underlying Index). The Underlying Index is designed to track the performance of a basket of U.S. dollar-denominated high yield liquid corporate bonds. The Fund returned 4.86% for the period ended August 31, 2026. The Fund's underlying index returned 4.87% and the Fund's broad-based index the Bloomberg U.S. Universal Bond Index returned 2.23% during the same period, while the Fund's additional, more narrowly based index, the iBoxx USD Liquid High Yield Index, returned 4.72%. The majority of sectors contributed positively to performance during the period with the greatest contribution coming from Consumer Cyclical, Energy and Consumer Non-Cyclical. The Transportation and Utility Other sectors detracted from performance. |
| Line Graph [Table Text Block] |
|
|
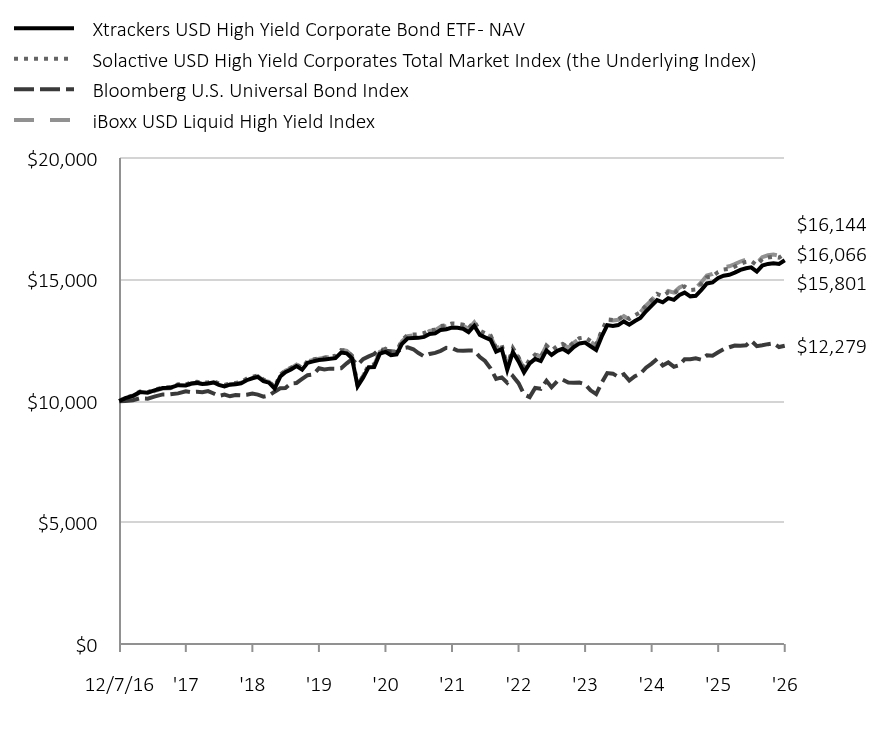
Table Summary
|
Xtrackers USD High Yield Corporate Bond ETF - NAV |
Solactive USD High Yield Corporates Total Market Index (the Underlying Index) |
Bloomberg U.S. Universal Bond Index |
iBoxx USD Liquid High Yield Index |
12/7/16 |
$10,000 |
$10,000 |
$10,000 |
$10,000 |
12/31/16 |
$10,121 |
$10,132 |
$10,005 |
$10,086 |
1/31/17 |
$10,216 |
$10,243 |
$10,040 |
$10,195 |
2/28/17 |
$10,371 |
$10,396 |
$10,118 |
$10,348 |
3/31/17 |
$10,347 |
$10,374 |
$10,103 |
$10,320 |
4/30/17 |
$10,451 |
$10,474 |
$10,198 |
$10,422 |
5/31/17 |
$10,541 |
$10,568 |
$10,277 |
$10,523 |
6/30/17 |
$10,550 |
$10,578 |
$10,281 |
$10,534 |
7/31/17 |
$10,656 |
$10,693 |
$10,319 |
$10,647 |
8/31/17 |
$10,644 |
$10,684 |
$10,408 |
$10,630 |
9/30/17 |
$10,726 |
$10,762 |
$10,371 |
$10,713 |
10/31/17 |
$10,751 |
$10,795 |
$10,384 |
$10,745 |
11/30/17 |
$10,705 |
$10,753 |
$10,368 |
$10,703 |
12/31/17 |
$10,725 |
$10,771 |
$10,414 |
$10,723 |
1/31/18 |
$10,770 |
$10,823 |
$10,314 |
$10,771 |
2/28/18 |
$10,672 |
$10,727 |
$10,216 |
$10,671 |
3/31/18 |
$10,608 |
$10,663 |
$10,268 |
$10,612 |
4/30/18 |
$10,678 |
$10,736 |
$10,199 |
$10,694 |
5/31/18 |
$10,691 |
$10,751 |
$10,255 |
$10,713 |
6/30/18 |
$10,736 |
$10,792 |
$10,240 |
$10,759 |
7/31/18 |
$10,861 |
$10,923 |
$10,261 |
$10,888 |
8/31/18 |
$10,942 |
$10,999 |
$10,312 |
$10,969 |
9/30/18 |
$11,000 |
$11,059 |
$10,268 |
$11,028 |
10/31/18 |
$10,821 |
$10,887 |
$10,182 |
$10,850 |
11/30/18 |
$10,759 |
$10,822 |
$10,228 |
$10,797 |
12/31/18 |
$10,520 |
$10,584 |
$10,388 |
$10,564 |
1/31/19 |
$11,013 |
$11,086 |
$10,531 |
$11,069 |
2/28/19 |
$11,193 |
$11,268 |
$10,542 |
$11,248 |
3/31/19 |
$11,301 |
$11,377 |
$10,733 |
$11,356 |
4/30/19 |
$11,440 |
$11,519 |
$10,748 |
$11,502 |
5/31/19 |
$11,294 |
$11,367 |
$10,912 |
$11,343 |
6/30/19 |
$11,583 |
$11,658 |
$11,067 |
$11,631 |
7/31/19 |
$11,635 |
$11,715 |
$11,100 |
$11,698 |
8/31/19 |
$11,692 |
$11,767 |
$11,351 |
$11,750 |
9/30/19 |
$11,710 |
$11,791 |
$11,302 |
$11,785 |
10/31/19 |
$11,748 |
$11,832 |
$11,338 |
$11,831 |
11/30/19 |
$11,770 |
$11,866 |
$11,336 |
$11,880 |
12/31/19 |
$11,999 |
$12,101 |
$11,353 |
$12,112 |
1/31/20 |
$11,969 |
$12,070 |
$11,556 |
$12,071 |
2/29/20 |
$11,767 |
$11,868 |
$11,729 |
$11,872 |
3/31/20 |
$10,616 |
$10,656 |
$11,500 |
$10,659 |
4/30/20 |
$10,966 |
$11,029 |
$11,731 |
$11,038 |
5/31/20 |
$11,400 |
$11,489 |
$11,840 |
$11,502 |
6/30/20 |
$11,407 |
$11,511 |
$11,939 |
$11,485 |
7/31/20 |
$11,952 |
$12,066 |
$12,149 |
$12,035 |
8/31/20 |
$12,028 |
$12,154 |
$12,079 |
$12,126 |
9/30/20 |
$11,891 |
$12,019 |
$12,057 |
$11,974 |
10/31/20 |
$11,925 |
$12,055 |
$12,014 |
$12,015 |
11/30/20 |
$12,366 |
$12,508 |
$12,171 |
$12,467 |
12/31/20 |
$12,584 |
$12,726 |
$12,213 |
$12,677 |
1/31/21 |
$12,595 |
$12,740 |
$12,136 |
$12,706 |
2/28/21 |
$12,605 |
$12,752 |
$11,979 |
$12,713 |
3/31/21 |
$12,645 |
$12,802 |
$11,840 |
$12,763 |
4/30/21 |
$12,765 |
$12,921 |
$11,939 |
$12,889 |
5/31/21 |
$12,788 |
$12,944 |
$11,985 |
$12,917 |
6/30/21 |
$12,932 |
$13,096 |
$12,072 |
$13,062 |
7/31/21 |
$12,963 |
$13,125 |
$12,194 |
$13,087 |
8/31/21 |
$13,027 |
$13,200 |
$12,185 |
$13,170 |
9/30/21 |
$13,018 |
$13,190 |
$12,081 |
$13,148 |
10/31/21 |
$12,979 |
$13,149 |
$12,072 |
$13,111 |
11/30/21 |
$12,841 |
$13,007 |
$12,086 |
$12,969 |
12/31/21 |
$13,102 |
$13,274 |
$12,078 |
$13,244 |
1/31/22 |
$12,729 |
$12,897 |
$11,813 |
$12,865 |
2/28/22 |
$12,624 |
$12,792 |
$11,652 |
$12,777 |
3/31/22 |
$12,525 |
$12,696 |
$11,340 |
$12,664 |
4/30/22 |
$12,041 |
$12,203 |
$10,917 |
$12,167 |
5/31/22 |
$12,143 |
$12,308 |
$10,977 |
$12,285 |
6/30/22 |
$11,286 |
$11,437 |
$10,757 |
$11,412 |
7/31/22 |
$12,023 |
$12,189 |
$11,028 |
$12,194 |
8/31/22 |
$11,636 |
$11,808 |
$10,741 |
$11,772 |
9/30/22 |
$11,184 |
$11,340 |
$10,278 |
$11,333 |
10/31/22 |
$11,552 |
$11,717 |
$10,166 |
$11,689 |
11/30/22 |
$11,739 |
$11,915 |
$10,545 |
$11,950 |
12/31/22 |
$11,649 |
$11,814 |
$10,509 |
$11,824 |
1/31/23 |
$12,090 |
$12,278 |
$10,835 |
$12,292 |
2/28/23 |
$11,903 |
$12,094 |
$10,569 |
$12,092 |
3/31/23 |
$12,071 |
$12,266 |
$10,816 |
$12,253 |
4/30/23 |
$12,154 |
$12,353 |
$10,883 |
$12,352 |
5/31/23 |
$12,011 |
$12,214 |
$10,770 |
$12,196 |
6/30/23 |
$12,223 |
$12,428 |
$10,753 |
$12,403 |
7/31/23 |
$12,376 |
$12,592 |
$10,764 |
$12,575 |
8/31/23 |
$12,410 |
$12,626 |
$10,699 |
$12,602 |
9/30/23 |
$12,261 |
$12,474 |
$10,444 |
$12,450 |
10/31/23 |
$12,105 |
$12,322 |
$10,287 |
$12,286 |
11/30/23 |
$12,656 |
$12,887 |
$10,750 |
$12,856 |
12/31/23 |
$13,132 |
$13,366 |
$11,157 |
$13,350 |
1/31/24 |
$13,099 |
$13,339 |
$11,131 |
$13,317 |
2/29/24 |
$13,132 |
$13,373 |
$10,997 |
$13,349 |
3/31/24 |
$13,282 |
$13,521 |
$11,105 |
$13,503 |
4/30/24 |
$13,146 |
$13,384 |
$10,846 |
$13,360 |
5/31/24 |
$13,299 |
$13,538 |
$11,026 |
$13,521 |
6/30/24 |
$13,428 |
$13,665 |
$11,126 |
$13,654 |
7/31/24 |
$13,699 |
$13,948 |
$11,379 |
$13,936 |
8/31/24 |
$13,931 |
$14,172 |
$11,546 |
$14,154 |
9/30/24 |
$14,161 |
$14,413 |
$11,738 |
$14,447 |
10/31/24 |
$14,068 |
$14,319 |
$11,471 |
$14,366 |
11/30/24 |
$14,238 |
$14,481 |
$11,592 |
$14,535 |
12/31/24 |
$14,170 |
$14,417 |
$11,417 |
$14,469 |
1/31/25 |
$14,373 |
$14,625 |
$11,486 |
$14,677 |
2/28/25 |
$14,469 |
$14,723 |
$11,723 |
$14,774 |
3/31/25 |
$14,315 |
$14,574 |
$11,721 |
$14,635 |
4/30/25 |
$14,337 |
$14,594 |
$11,762 |
$14,648 |
5/31/25 |
$14,580 |
$14,842 |
$11,702 |
$14,898 |
6/30/25 |
$14,845 |
$15,101 |
$11,885 |
$15,174 |
7/31/25 |
$14,886 |
$15,144 |
$11,868 |
$15,236 |
8/31/25 |
$15,069 |
$15,320 |
$12,010 |
$15,416 |
9/30/25 |
$15,164 |
$15,422 |
$12,137 |
$15,518 |
10/31/25 |
$15,202 |
$15,453 |
$12,218 |
$15,552 |
11/30/25 |
$15,291 |
$15,541 |
$12,291 |
$15,641 |
12/31/25 |
$15,406 |
$15,660 |
$12,283 |
$15,747 |
1/31/26 |
$15,472 |
$15,733 |
$12,301 |
$15,824 |
2/28/26 |
$15,511 |
$15,768 |
$12,488 |
$15,843 |
3/31/26 |
$15,334 |
$15,598 |
$12,265 |
$15,678 |
4/30/26 |
$15,583 |
$15,852 |
$12,302 |
$15,926 |
5/31/26 |
$15,649 |
$15,911 |
$12,346 |
$16,005 |
6/30/26 |
$15,676 |
$15,942 |
$12,378 |
$16,038 |
7/31/26 |
$15,649 |
$15,907 |
$12,226 |
$15,989 |
8/31/26 |
$15,801 |
$16,066 |
$12,279 |
$16,144 |
|
| Average Annual Return [Table Text Block] |
|
|
Table Summary
Fund/Index |
1-Year |
5-Year |
Since Inception 12/7/16 |
Xtrackers USD High Yield Corporate Bond ETF - NAV |
4.86% |
3.94% |
4.81% |
Solactive USD High Yield Corporates Total Market Index |
4.87% |
4.01% |
4.99% |
Bloomberg U.S. Universal Bond Index |
2.23% |
0.10% |
2.13% |
iBoxx USD Liquid High Yield Index |
4.72% |
4.06% |
5.04% | |
| AssetsNet |
|
|
$ 3,563,836,789
|
| Holdings Count | Holding |
|
|
1,271
|
| Advisory Fees Paid, Amount |
|
|
$ 1,793,602
|
| InvestmentCompanyPortfolioTurnover |
|
|
30.00%
|
| Additional Fund Statistics [Text Block] |
|
|
Table Summary
Net Assets ($) |
3,563,836,789 |
Number of Portfolio Holdings |
1,271 |
Portfolio Turnover Rate (%) |
30 |
Total Net Advisory Fees Paid ($) |
1,793,602 |
Modified duration to worst |
3.0 years | Modified duration to worst is the measure of sensitivity of the prices of bonds held by the Fund to a change in interest rates, computed using each bond's nearest call or maturity date. |
| Holdings [Text Block] |
|
|
Table Summary
Sector |
% of Net Assets |
Consumer, Non-cyclical |
18% |
Consumer, Cyclical |
17% |
Communications |
16% |
Financial |
13% |
Energy |
11% |
Industrial |
10% |
Basic Materials |
5% |
Technology |
5% |
Utilities |
4% |
Diversified |
0% | Geographical Diversification
Table Summary
Country |
% of Net Assets |
United States |
84% |
Canada |
4% |
United Kingdom |
2% |
Luxembourg |
2% |
Other |
5% | |
| Largest Holdings [Text Block] |
|
|
Table Summary
Credit Rating |
% of Net Assets |
BBB |
8% |
BB |
63% |
B |
23% |
CCC |
6% |
CC |
0% | |
| Material Fund Change [Text Block] |
|
|
|
| Updated Prospectus Phone Number |
|
|
(844) 851-4255
|
| Updated Prospectus Web Address |
|
|
dws.com/en-us/resources/proxy-voting
|
| C000237218 |
|
|
|
| Shareholder Report [Line Items] |
|
|
|
| Fund Name |
|
|
Xtrackers S&P 100 Ex Top 20 ETF
|
| Class Name |
|
|
Xtrackers S&P 100 Ex Top 20 ETF
|
| Trading Symbol |
|
|
XOEX
|
| Security Exchange Name |
|
|
CboeBZX
|
| Annual or Semi-Annual Statement [Text Block] |
|
|
This annual shareholder report contains important information about the Xtrackers S&P 100 Ex Top 20 ETF (formerly, Xtrackers S&P 500 Value Scored & Screened ETF) (the "Fund") for the period September 1, 2025 to August 31, 2026.
|
| Additional Information [Text Block] |
|
|
You can find additional information about the Fund at dws.com/etfreports. You can also request this information by contacting us at (844) 851‐4255.
|
| Additional Information Phone Number |
|
|
(844) 851‐4255
|
| Additional Information Website |
|
|
dws.com/etfreports
|
| Expenses [Text Block] |
|
|
What were the Fund costs for the last year?(Based on a hypothetical $10,000 investment)
Table Summary
Fund |
Costs of a $10,000 investment |
Costs paid as a percentage of a $10,000 investment |
XOEX |
$17 |
0.15% | Gross expense ratio as of the latest prospectus: 0.15%. See prospectus for any contractual or voluntary waivers; without a waiver, costs would have been higher. |
| Expenses Paid, Amount |
|
|
$ 17
|
| Expense Ratio, Percent |
|
|
0.15%
|
| Factors Affecting Performance [Text Block] |
|
|
How did the fund perform last year and what affected its performance?The Fund seeks investment results that correspond generally to the performance, before fees and expenses, of the S&P 100 Ex-Top 20 Select Index (the Underlying Index). The Underlying Index is designed to measure the capped market capitalization weighted performance of the companies in the S&P 100 Index excluding the 20 largest companies as measured by float-adjusted market capitalization. The Fund returned 23.27% for the period ended August 31, 2026. The Fund's underlying index returned 23.49% and the Fund's broad-based index the S&P 500® Index returned 20.38% during the same period. The majority of sectors contributed positively to performance during the period with the greatest contribution coming from Information Technology, Health Care and Financials. Consumer Discretionary is the only sector detracted from performance. |
| Average Annual Return [Table Text Block] |
|
|
Table Summary
Fund/Index |
1-Year |
Since Inception 11/9/22 |
Xtrackers S&P 100 Ex Top 20 ETF - NAV |
23.27% |
16.45% |
S&P 100 Ex Top 20 Select Index |
23.49% |
16.64% |
S&P 500® Index |
20.38% |
21.75% |
S&P 500® Value Scored & Screened Index |
24.02% |
16.77% | Average Annual Total ReturnsPrior to December 19, 2025, the Fund operated with a different investment strategy, including tracking a different underlying index. Performance may have been different if the Fund’s current investment strategy had been in effect. Index and Fund returns prior to December 19, 2025 reflect that of the prior underlying index and investment strategy, respectively. Performance shown is historical. The Fund's past performance is not a good predictor or guarantee of the Fund's future performance. Investment returns and principal value of an investment will fluctuate so that an investor's shares, when redeemed, may be worth more or less than their original cost. Current performance may be lower or higher than the performance data quoted. The performance graph and returns table do not reflect the deduction of taxes that a shareholder would pay on Fund distributions or the sale of Fund shares. Shares are bought and sold at market price (closing price) not net asset value (NAV) and are not individually redeemed from the Fund. To obtain the most recent month-end performance data visit etf.dws.com/en-us/etf-products or call (844) 851-4255. |
| Material Change Date |
|
Sep. 01, 2025
|
|
| AssetsNet |
|
|
$ 274,603,832
|
| Holdings Count | Holding |
|
|
83
|
| Advisory Fees Paid, Amount |
|
|
$ 164,035
|
| InvestmentCompanyPortfolioTurnover |
|
|
41.00%
|
| Additional Fund Statistics [Text Block] |
|
|
Table Summary
Net Assets ($) |
274,603,832 |
Number of Portfolio Holdings |
83 |
Portfolio Turnover Rate (%) |
41 |
Total Net Advisory Fees Paid ($) |
164,035 | |
| Largest Holdings [Text Block] |
|
|
Ten Largest Equity Holdings
Table Summary
Holdings |
25.3% of Net Assets |
Mastercard, Inc. |
3.0% |
AbbVie, Inc. |
2.9% |
Palantir Technologies, Inc. |
2.7% |
Bank of America Corp. |
2.6% |
Chevron Corp. |
2.5% |
Lam Research Corp. |
2.4% |
Caterpillar, Inc. |
2.3% |
Merck & Co., Inc. |
2.3% |
Applied Materials, Inc. |
2.3% |
UnitedHealth Group, Inc. |
2.3% | |
| Material Fund Change Name [Text Block] |
|
|
Effective December 19, 2025, the Fund changed its name from Xtrackers S&P 500 Value Scored & Screened ETF to Xtrackers S&P 100 Ex Top 20 ETF. The Fund also changed its 80% investment policy to reflect the Fund's investment of at least 80% of its total assets in component securities of its new underlying index, the S&P 100 Ex-Top 20 Select Index. The Fund changed from a non-diversified fund to a diversified fund.
|
| Updated Prospectus Phone Number |
|
|
(844) 851-4255
|
| Updated Prospectus Web Address |
|
|
dws.com/en-us/resources/proxy-voting
|
| C000261436 |
|
|
|
| Shareholder Report [Line Items] |
|
|
|
| Fund Name |
|
|
Xtrackers S&P 500 Diversified Sector Weight ETF
|
| Class Name |
|
|
Xtrackers S&P 500 Diversified Sector Weight ETF
|
| Trading Symbol |
|
|
SPXD
|
| Security Exchange Name |
|
|
NASDAQ
|
| Annual or Semi-Annual Statement [Text Block] |
|
|
This annual shareholder report contains important information about the Xtrackers S&P 500 Diversified Sector Weight ETF (the "Fund") for the period September 1, 2025 to August 31, 2026.
|
| Additional Information [Text Block] |
|
|
You can find additional information about the Fund at dws.com/etfreports. You can also request this information by contacting us at (844) 851‐4255.
|
| Additional Information Phone Number |
|
|
(844) 851‐4255
|
| Additional Information Website |
|
|
dws.com/etfreports
|
| Expenses [Text Block] |
|
|
What were the Fund costs for the last year?(Based on a hypothetical $10,000 investment)
Table Summary
Fund |
Costs of a $10,000 investment |
Costs paid as a percentage of a $10,000 investment |
SPXD |
$10 |
0.09% | Gross expense ratio as of the latest prospectus: 0.09%. See prospectus for any contractual or voluntary waivers; without a waiver, costs would have been higher. |
| Expenses Paid, Amount |
|
|
$ 10
|
| Expense Ratio, Percent |
|
|
0.09%
|
| Factors Affecting Performance [Text Block] |
|
|
How did the fund perform last year and what affected its performance?The Fund seeks investment results that correspond generally to the performance, before fees and expenses, of the S&P 500® Diversified Sector Weight Index (the Underlying Index). The Underlying Index is designed to track the performance of the constituent securities of the S&P 500® Index reweighted to mitigate concentration risk and address sector imbalances. The S&P 500® Diversified Sector Weight Index’s reweighting approach is intended to provide a return more representative of all the business opportunities inherent to the S&P 500®, rather than a return tied principally to the business opportunities represented by the S&P 500’s® largest constituent companies. The Fund returned 19.33% for the period ended August 31, 2026. The Fund's underlying index returned 19.43% and the Fund's broad-based index the S&P 500® Index returned 20.38% during the same period. The majority of sectors contributed positively to performance during the period with the greatest contribution coming from Information Technology, Health Care and Energy. The Consumer Discretionary and Utilities sectors detracted from performance. |
| Average Annual Return [Table Text Block] |
|
|
Table Summary
Fund/Index |
1-Year |
Since Inception 7/24/25 |
Xtrackers S&P 500 Diversified Sector Weight ETF - NAV |
19.33% |
18.25% |
S&P 500® Diversified Sector Weight Index |
19.43% |
18.37% |
S&P 500® Index |
20.38% |
20.09% | Average Annual Total Returns Performance shown is historical. The Fund's past performance is not a good predictor or guarantee of the Fund's future performance. Investment returns and principal value of an investment will fluctuate so that an investor's shares, when redeemed, may be worth more or less than their original cost. Current performance may be lower or higher than the performance data quoted. The performance graph and returns table do not reflect the deduction of taxes that a shareholder would pay on Fund distributions or the sale of Fund shares. Shares are bought and sold at market price (closing price) not net asset value (NAV) and are not individually redeemed from the Fund. To obtain the most recent month-end performance data visit etf.dws.com/en-us/etf-products or call (844) 851-4255. |
| AssetsNet |
|
|
$ 7,114,974
|
| Holdings Count | Holding |
|
|
504
|
| Advisory Fees Paid, Amount |
|
|
$ 5,821
|
| InvestmentCompanyPortfolioTurnover |
|
|
25.00%
|
| Additional Fund Statistics [Text Block] |
|
|
Table Summary
Net Assets ($) |
7,114,974 |
Number of Portfolio Holdings |
504 |
Portfolio Turnover Rate (%) |
25 |
Total Net Advisory Fees Paid ($) |
5,821 | |
| Largest Holdings [Text Block] |
|
|
Ten Largest Equity Holdings
Table Summary
Holdings |
16.4% of Net Assets |
Berkshire Hathaway, Inc. |
3.8% |
Abbott Laboratories |
2.2% |
Moderna, Inc. |
1.7% |
Procter & Gamble Co. |
1.4% |
Walt Disney Co. |
1.3% |
Regeneron Pharmaceuticals, Inc. |
1.3% |
Microsoft Corp. |
1.2% |
Phillips 66 |
1.2% |
Costco Wholesale Corp. |
1.2% |
Sysco Corp. |
1.1% | |
| Updated Prospectus Phone Number |
|
|
(844) 851-4255
|
| Updated Prospectus Web Address |
|
|
dws.com/en-us/resources/proxy-voting
|
| C000237217 |
|
|
|
| Shareholder Report [Line Items] |
|
|
|
| Fund Name |
|
|
Xtrackers S&P 500 Growth Scored & Screened ETF
|
| Class Name |
|
|
Xtrackers S&P 500 Growth Scored & Screened ETF
|
| Trading Symbol |
|
|
SNPG
|
| Security Exchange Name |
|
|
CboeBZX
|
| Annual or Semi-Annual Statement [Text Block] |
|
|
This annual shareholder report contains important information about the Xtrackers S&P 500 Growth Scored & Screened ETF (the "Fund") for the period September 1, 2025 to August 31, 2026.
|
| Additional Information Phone Number |
|
|
(844) 851‐4255
|
| Additional Information Website |
|
|
dws.com/etfreports
|
| Expenses [Text Block] |
|
|
What were the Fund costs for the last year?(Based on a hypothetical $10,000 investment)
Table Summary
Fund |
Costs of a $10,000 investment |
Costs paid as a percentage of a $10,000 investment |
SNPG |
$16 |
0.15% | Gross expense ratio as of the latest prospectus: 0.15%. See prospectus for any contractual or voluntary waivers; without a waiver, costs would have been higher. |
| Expenses Paid, Amount |
|
|
$ 16
|
| Expense Ratio, Percent |
|
|
0.15%
|
| Factors Affecting Performance [Text Block] |
|
|
How did the fund perform last year and what affected its performance?The Fund seeks investment results that correspond generally to the performance, before fees and expenses, of the S&P 500® Growth Scored & Screened Index (the Underlying Index). The Underlying Index is a market capitalization weighted index that provides exposure to companies with high environmental, social and governance (“ESG”) performance relative to their sector peers, while maintaining similar overall industry group weights as the S&P 500® Growth Index. The Fund returned 19.36% for the period ended August 31, 2026. The Fund's underlying index returned 19.52% and the Fund's broad-based index the S&P 500® Index returned 20.38% during the same period. The majority of sectors contributed positively to performance during the period with the greatest contribution coming from Information Technology, Health Care and Communication Services. The Consumer Discretionary and Utilities sectors detracted from performance. |
| Average Annual Return [Table Text Block] |
|
|
Table Summary
Fund/Index |
1-Year |
Since Inception 11/9/22 |
Xtrackers S&P 500 Growth Scored & Screened ETF - NAV |
19.36% |
26.32% |
S&P 500® Growth Scored & Screened Index |
19.52% |
26.50% |
S&P 500® Index |
20.38% |
21.75% | Average Annual Total Returns Performance shown is historical. The Fund's past performance is not a good predictor or guarantee of the Fund's future performance. Investment returns and principal value of an investment will fluctuate so that an investor's shares, when redeemed, may be worth more or less than their original cost. Current performance may be lower or higher than the performance data quoted. The performance graph and returns table do not reflect the deduction of taxes that a shareholder would pay on Fund distributions or the sale of Fund shares. Shares are bought and sold at market price (closing price) not net asset value (NAV) and are not individually redeemed from the Fund. To obtain the most recent month-end performance data visit etf.dws.com/en-us/etf-products or call (844) 851-4255. |
| AssetsNet |
|
|
$ 14,244,068
|
| Holdings Count | Holding |
|
|
85
|
| Advisory Fees Paid, Amount |
|
|
$ 20,212
|
| InvestmentCompanyPortfolioTurnover |
|
|
67.00%
|
| Additional Fund Statistics [Text Block] |
|
|
Table Summary
Net Assets ($) |
14,244,068 |
Number of Portfolio Holdings |
85 |
Portfolio Turnover Rate (%) |
67 |
Total Net Advisory Fees Paid ($) |
20,212 | |
| Largest Holdings [Text Block] |
|
|
Ten Largest Equity Holdings
Table Summary
Holdings |
57.9% of Net Assets |
Microsoft Corp. |
11.3% |
NVIDIA Corp. |
9.1% |
Alphabet, Inc. |
8.6% |
Micron Technology, Inc. |
8.2% |
Eli Lilly & Co. |
7.0% |
Lam Research Corp. |
2.9% |
Caterpillar, Inc. |
2.8% |
Applied Materials, Inc. |
2.8% |
Visa, Inc. |
2.6% |
Netflix, Inc. |
2.6% | |
| Updated Prospectus Phone Number |
|
|
(844) 851-4255
|
| Updated Prospectus Web Address |
|
|
dws.com/en-us/resources/proxy-voting
|
| C000211086 |
|
|
|
| Shareholder Report [Line Items] |
|
|
|
| Fund Name |
|
|
Xtrackers S&P 500 Scored & Screened ETF
|
| Class Name |
|
|
Xtrackers S&P 500 Scored & Screened ETF
|
| Trading Symbol |
|
|
SNPE
|
| Security Exchange Name |
|
|
NYSEArca
|
| Annual or Semi-Annual Statement [Text Block] |
|
|
This annual shareholder report contains important information about the Xtrackers S&P 500 Scored & Screened ETF (the "Fund") for the period September 1, 2025 to August 31, 2026.
|
| Additional Information Phone Number |
|
|
(844) 851‐4255
|
| Additional Information Website |
|
|
dws.com/etfreports
|
| Expenses [Text Block] |
|
|
What were the Fund costs for the last year?(Based on a hypothetical $10,000 investment)
Table Summary
Fund |
Costs of a $10,000 investment |
Costs paid as a percentage of a $10,000 investment |
SNPE |
$11 |
0.10% | Gross expense ratio as of the latest prospectus: 0.10%. See prospectus for any contractual or voluntary waivers; without a waiver, costs would have been higher. |
| Expenses Paid, Amount |
|
|
$ 11
|
| Expense Ratio, Percent |
|
|
0.10%
|
| Factors Affecting Performance [Text Block] |
|
|
How did the fund perform last year and what affected its performance?The Fund seeks investment results that correspond generally to the performance, before fees and expenses, of the S&P 500® Scored & Screened Index (the Underlying Index). The Underlying Index is a market capitalization weighted index that is designed to measure the performance of companies meeting environmental, social and governance (ESG) criteria, while maintaining similar overall industry group weights as the S&P 500® Index. The Fund returned 23.18% for the period ended August 31, 2026. The Fund's underlying index returned 23.30% and the Fund's broad-based index the S&P 500® Index returned 20.38% during the same period. The majority of sectors contributed positively to performance during the period with the greatest contribution coming from Information Technology, Health Care and Communication Services. The Consumer Discretionary and Utilities sectors detracted from performance. |
| Average Annual Return [Table Text Block] |
|
|
Table Summary
Fund/Index |
1-Year |
5-Year |
Since Inception 6/26/19 |
Xtrackers S&P 500 Scored & Screened ETF - NAV |
23.18% |
13.60% |
17.23% |
S&P 500® Scored & Screened Index |
23.30% |
13.72% |
17.35% |
S&P 500® Index |
20.38% |
12.79% |
16.18% | Average Annual Total Returns Performance shown is historical. The Fund's past performance is not a good predictor or guarantee of the Fund's future performance. Investment returns and principal value of an investment will fluctuate so that an investor's shares, when redeemed, may be worth more or less than their original cost. Current performance may be lower or higher than the performance data quoted. The performance graph and returns table do not reflect the deduction of taxes that a shareholder would pay on Fund distributions or the sale of Fund shares. Shares are bought and sold at market price (closing price) not net asset value (NAV) and are not individually redeemed from the Fund. To obtain the most recent month-end performance data visit etf.dws.com/en-us/etf-products or call (844) 851-4255. |
| AssetsNet |
|
|
$ 2,948,823,569
|
| Holdings Count | Holding |
|
|
328
|
| Advisory Fees Paid, Amount |
|
|
$ 2,430,760
|
| InvestmentCompanyPortfolioTurnover |
|
|
10.00%
|
| Additional Fund Statistics [Text Block] |
|
|
Table Summary
Net Assets ($) |
2,948,823,569 |
Number of Portfolio Holdings |
328 |
Portfolio Turnover Rate (%) |
10 |
Total Net Advisory Fees Paid ($) |
2,430,760 | |
| Largest Holdings [Text Block] |
|
|
Ten Largest Equity Holdings
Table Summary
Holdings |
41.7% of Net Assets |
NVIDIA Corp. |
13.0% |
Microsoft Corp. |
9.2% |
Alphabet, Inc. |
8.7% |
Micron Technology, Inc. |
2.6% |
Eli Lilly & Co. |
2.2% |
Visa, Inc. |
1.5% |
Mastercard, Inc. |
1.2% |
Walmart, Inc. |
1.1% |
AbbVie, Inc. |
1.1% |
Intel Corp. |
1.1% | |
| Updated Prospectus Phone Number |
|
|
(844) 851-4255
|
| Updated Prospectus Web Address |
|
|
dws.com/en-us/resources/proxy-voting
|
| C000238398 |
|
|
|
| Shareholder Report [Line Items] |
|
|
|
| Fund Name |
|
|
Xtrackers S&P Dividend Aristocrats Screened ETF
|
| Class Name |
|
|
Xtrackers S&P Dividend Aristocrats Screened ETF
|
| Trading Symbol |
|
|
SNPD
|
| Security Exchange Name |
|
|
CboeBZX
|
| Annual or Semi-Annual Statement [Text Block] |
|
|
This annual shareholder report contains important information about the Xtrackers S&P Dividend Aristocrats Screened ETF (the "Fund") for the period September 1, 2025 to August 31, 2026.
|
| Additional Information Phone Number |
|
|
(844) 851‐4255
|
| Additional Information Website |
|
|
dws.com/etfreports
|
| Expenses [Text Block] |
|
|
What were the Fund costs for the last year?(Based on a hypothetical $10,000 investment)
Table Summary
Fund |
Costs of a $10,000 investment |
Costs paid as a percentage of a $10,000 investment |
SNPD |
$16 |
0.15% | Gross expense ratio as of the latest prospectus: 0.15%. See prospectus for any contractual or voluntary waivers; without a waiver, costs would have been higher. |
| Expenses Paid, Amount |
|
|
$ 16
|
| Expense Ratio, Percent |
|
|
0.15%
|
| Factors Affecting Performance [Text Block] |
|
|
How did the fund perform last year and what affected its performance?The Fund seeks investment results that correspond generally to the performance, before fees and expenses, of the S&P High Yield Dividend Aristocrats Screened® Index (the Underlying Index). The Underlying Index is designed to measure the performance of constituents from the S&P High Yield Dividend Aristocrats® Index that meet certain environmental, social and governance (“ESG”) criteria. The S&P High Yield Dividend Aristocrats® Index measures the performance of companies within the S&P Composite 1500® Index that have followed a policy of consistently increasing dividends every year for at least 20 years. The Fund returned 16.21% for the period ended August 31, 2026. The Fund's underlying index returned 16.42% and the Fund's broad-based index the S&P Composite 1500® Index returned 20.31% during the same period. The majority of sectors contributed positively to performance during the period with the greatest contribution coming from Industrials, Materials and Financials. Consumer Discretionary is the only sector that detracted from performance. |
| Average Annual Return [Table Text Block] |
|
|
Table Summary
Fund/Index |
1-Year |
Since Inception 11/9/22 |
Xtrackers S&P Dividend Aristocrats Screened ETF - NAV |
16.21% |
8.45% |
S&P High Yield Dividend Aristocrats Screened® Index |
16.42% |
8.60% |
S&P Composite 1500® Index |
20.31% |
21.09% | Average Annual Total Returns Performance shown is historical. The Fund's past performance is not a good predictor or guarantee of the Fund's future performance. Investment returns and principal value of an investment will fluctuate so that an investor's shares, when redeemed, may be worth more or less than their original cost. Current performance may be lower or higher than the performance data quoted. The performance graph and returns table do not reflect the deduction of taxes that a shareholder would pay on Fund distributions or the sale of Fund shares. Shares are bought and sold at market price (closing price) not net asset value (NAV) and are not individually redeemed from the Fund. To obtain the most recent month-end performance data visit etf.dws.com/en-us/etf-products or call (844) 851-4255. |
| Material Change Date |
|
Sep. 01, 2025
|
|
| AssetsNet |
|
|
$ 3,059,002
|
| Holdings Count | Holding |
|
|
107
|
| Advisory Fees Paid, Amount |
|
|
$ 6,209
|
| InvestmentCompanyPortfolioTurnover |
|
|
28.00%
|
| Additional Fund Statistics [Text Block] |
|
|
Table Summary
Net Assets ($) |
3,059,002 |
Number of Portfolio Holdings |
107 |
Portfolio Turnover Rate (%) |
28 |
Total Net Advisory Fees Paid ($) |
6,209 | |
| Largest Holdings [Text Block] |
|
|
Ten Largest Equity Holdings
Table Summary
Holdings |
24.7% of Net Assets |
Robert Half, Inc. |
3.8% |
Verizon Communications, Inc. |
3.4% |
Best Buy Co., Inc. |
2.4% |
Amcor PLC |
2.4% |
Target Corp. |
2.3% |
Franklin Templeton, Inc. |
2.3% |
J M Smucker Co. |
2.1% |
Edison International |
2.0% |
Realty Income Corp. |
2.0% |
Kimberly-Clark Corp. |
2.0% | |
| Material Fund Change Name [Text Block] |
|
|
The Fund changed from a non-diversified fund to a diversified fund.
|
| Updated Prospectus Phone Number |
|
|
(844) 851-4255
|
| Updated Prospectus Web Address |
|
|
dws.com/en-us/resources/proxy-voting
|
| C000223768 |
|
|
|
| Shareholder Report [Line Items] |
|
|
|
| Fund Name |
|
|
Xtrackers S&P MidCap 400 Scored & Screened ETF
|
| Class Name |
|
|
Xtrackers S&P MidCap 400 Scored & Screened ETF
|
| Trading Symbol |
|
|
MIDE
|
| Security Exchange Name |
|
|
NYSEArca
|
| Annual or Semi-Annual Statement [Text Block] |
|
|
This annual shareholder report contains important information about the Xtrackers S&P MidCap 400 Scored & Screened ETF (the "Fund") for the period September 1, 2025 to August 31, 2026.
|
| Additional Information Phone Number |
|
|
(844) 851‐4255
|
| Additional Information Website |
|
|
dws.com/etfreports
|
| Expenses [Text Block] |
|
|
What were the Fund costs for the last year?(Based on a hypothetical $10,000 investment)
Table Summary
Fund |
Costs of a $10,000 investment |
Costs paid as a percentage of a $10,000 investment |
MIDE |
$16 |
0.15% | Gross expense ratio as of the latest prospectus: 0.15%. See prospectus for any contractual or voluntary waivers; without a waiver, costs would have been higher. |
| Expenses Paid, Amount |
|
|
$ 16
|
| Expense Ratio, Percent |
|
|
0.15%
|
| Factors Affecting Performance [Text Block] |
|
|
How did the fund perform last year and what affected its performance?The Fund seeks investment results that correspond generally to the performance, before fees and expenses, of the S&P MidCap 400® Scored & Screened Index (the Underlying Index). The Underlying Index is a market capitalization weighted index that is designed to measure the performance of companies meeting environmental, social and governance (ESG) criteria, while maintaining similar overall industry group weights as the S&P MidCap 400® Index. The Fund returned 18.85% for the period ended August 31, 2026. The Fund's underlying index returned 19.12% and the Fund's broad-based index the S&P Composite 1500® Index returned 20.31% during the same period, while the Fund's additional, more narrowly based index, the S&P MidCap 400® Index, returned 17.13%. The majority of sectors contributed positively to performance during the period with the greatest contribution coming from Information Technology, Health Care and Industrials. The Consumer Discretionary and Consumer Staples sectors detracted from performance. |
| Average Annual Return [Table Text Block] |
|
|
Table Summary
Fund/Index |
1-Year |
5-Year |
Since Inception 2/24/21 |
Xtrackers S&P MidCap 400 Scored & Screened ETF - NAV |
18.85% |
8.17% |
9.23% |
S&P MidCap 400® Scored & Screened Index |
19.12% |
8.37% |
9.43% |
S&P Composite 1500® Index |
20.31% |
12.39% |
14.30% |
S&P MidCap 400® Index |
17.13% |
8.08% |
9.07% | Average Annual Total Returns Performance shown is historical. The Fund's past performance is not a good predictor or guarantee of the Fund's future performance. Investment returns and principal value of an investment will fluctuate so that an investor's shares, when redeemed, may be worth more or less than their original cost. Current performance may be lower or higher than the performance data quoted. The performance graph and returns table do not reflect the deduction of taxes that a shareholder would pay on Fund distributions or the sale of Fund shares. Shares are bought and sold at market price (closing price) not net asset value (NAV) and are not individually redeemed from the Fund. To obtain the most recent month-end performance data visit etf.dws.com/en-us/etf-products or call (844) 851-4255. |
| AssetsNet |
|
|
$ 3,404,955
|
| Holdings Count | Holding |
|
|
270
|
| Advisory Fees Paid, Amount |
|
|
$ 5,680
|
| InvestmentCompanyPortfolioTurnover |
|
|
34.00%
|
| Additional Fund Statistics [Text Block] |
|
|
Table Summary
Net Assets ($) |
3,404,955 |
Number of Portfolio Holdings |
270 |
Portfolio Turnover Rate (%) |
34 |
Total Net Advisory Fees Paid ($) |
5,680 | |
| Largest Holdings [Text Block] |
|
|
Ten Largest Equity Holdings
Table Summary
Holdings |
11.3% of Net Assets |
Twilio, Inc. |
1.5% |
Illumina, Inc. |
1.3% |
TechnipFMC PLC |
1.3% |
Everpure, Inc. |
1.2% |
Okta, Inc. |
1.2% |
nVent Electric PLC |
1.0% |
Carpenter Technology Corp. |
1.0% |
US Foods Holding Corp. |
1.0% |
United Therapeutics Corp. |
0.9% |
Royal Gold, Inc. |
0.9% | |
| Updated Prospectus Phone Number |
|
|
(844) 851-4255
|
| Updated Prospectus Web Address |
|
|
dws.com/en-us/resources/proxy-voting
|
| C000270610 |
|
|
|
| Shareholder Report [Line Items] |
|
|
|
| Fund Name |
|
|
Xtrackers Europe Defense Technologies ETF
|
| Class Name |
|
|
Xtrackers Europe Defense Technologies ETF
|
| Trading Symbol |
|
|
XDEF
|
| Security Exchange Name |
|
|
NASDAQ
|
| Annual or Semi-Annual Statement [Text Block] |
|
|
This annual shareholder report contains important information about the Xtrackers Europe Defense Technologies ETF (the "Fund") for the period February 19, 2026 (commencement of operations) to August 31, 2026.
|
| Additional Information [Text Block] |
|
|
You can find additional information about the Fund at dws.com/etfreports. You can also request this information by contacting us at (844) 851‐4255.
|
| Additional Information Phone Number |
|
|
(844) 851‐4255
|
| Additional Information Website |
|
|
dws.com/etfreports
|
| Expenses [Text Block] |
|
|
What were the Fund costs for the reporting period?(Based on a hypothetical $10,000 investment)
Table Summary
Fund |
Costs of a $10,000 investment |
Costs paid as a percentage of a $10,000 investment |
XDEF |
$18Footnote Reference(a) |
0.35%Footnote Reference(b) |
| Footnote |
Description |
Footnote(a) |
Based on the period February 19, 2026 (commencement of operations) through August 31, 2026. Expenses would have been higher if the Fund had been in existence for the full reporting period. |
Footnote(b) |
Annualized. | Gross expense ratio as of the latest prospectus: 0.35%. See prospectus for any contractual or voluntary waivers; without a waiver, costs would have been higher. |
| Expenses Paid, Amount |
[1] |
|
$ 18
|
| Expense Ratio, Percent |
[2] |
|
0.35%
|
| Factors Affecting Performance [Text Block] |
|
|
How did the fund perform last year and what affected its performance?The Fund seeks investment results that correspond generally to the performance, before fees and expenses, of the STOXX Europe Total Market Defense, Space and Cybersecurity Innovation 50-25 Index (the Underlying Index). The Underlying Index seeks to capture the performance of European listed equity securities with established revenue and/or patent exposures to the defense, space and cybersecurity sectors. The Fund returned -7.25% for the period ended August 31, 2026. The Fund's underlying index returned -7.12% and the Fund's broad-based index the MSCI Europe Index returned 3.87% during the same period. The majority of sectors contributed negatively to performance during the period with the greatest detractors coming from Aerospace & Defense, Construction Machinery & Heavy Transportation Equipment and Air Freight & Logistics. IT Consulting & Other Services, Electrical Components & Equipment and Systems Software contributed positively to performance. From a geographical perspective, the majority of countries contributed negatively to performance during the period with the greatest detractors coming from Germany, France and the United Kingdom while Spain, Netherlands and Finland contributed positively to performance. |
| Line Graph [Table Text Block] |
|
|
Table Summary
|
Xtrackers Europe Defense Technologies ETF - NAV |
STOXX Europe Total Market Defence, Space and Cybersecurity Innovation 50-25 Index (the Underlying Index) |
MSCI Europe Index |
2/19/26 |
$10,000 |
$10,000 |
$10,000 |
2/26 |
$9,712 |
$9,717 |
$10,084 |
3/26 |
$8,701 |
$8,708 |
$9,086 |
4/26 |
$8,773 |
$8,782 |
$9,730 |
5/26 |
$9,229 |
$9,239 |
$9,986 |
6/26 |
$8,435 |
$8,439 |
$10,079 |
7/26 |
$9,117 |
$9,126 |
$10,241 |
8/26 |
$9,275 |
$9,288 |
$10,387 |
|
| Average Annual Return [Table Text Block] |
|
|
Table Summary
Fund/Index |
Since Inception 2/19/26 |
Xtrackers Europe Defense Technologies ETF - NAV |
-7.25% |
STOXX Europe Total Market Defence, Space and Cybersecurity Innovation 50-25 Index |
-7.12% |
MSCI Europe Index |
3.87% | |
| AssetsNet |
|
|
$ 4,568,881
|
| Holdings Count | Holding |
|
|
36
|
| Advisory Fees Paid, Amount |
|
|
$ 8,377
|
| InvestmentCompanyPortfolioTurnover |
|
|
18.00%
|
| Additional Fund Statistics [Text Block] |
|
|
Table Summary
Net Assets ($) |
4,568,881 |
Number of Portfolio Holdings |
36 |
Portfolio Turnover Rate (%) |
18 |
Total Net Advisory Fees Paid ($) |
8,377 | |
| Holdings [Text Block] |
|
|
Table Summary
Sector |
% of Net Assets |
Aerospace & Defense |
69% |
Industrial Conglomerates |
7% |
IT Consulting & Other Services |
4% |
Diversified Support Services |
4% |
Contstruction Machinery & Heavy Transportation Equipment |
2% |
Environmental & Facilities Services |
2% |
Cable & Satellite |
2% |
Systems Software |
1% |
Industrial Machinery |
1% |
Electronic Equipment & Instruments |
1% |
Other |
7% | Geographical Diversification
Table Summary
Country |
% of Net Assets |
United Kingdom |
32% |
Germany |
19% |
France |
17% |
Netherlands |
8% |
Sweden |
5% |
Norway |
5% |
Italy |
5% |
Spain |
4% |
Czech Republic |
2% |
Other |
3% | |
| Largest Holdings [Text Block] |
|
|
Ten Largest Equity Holdings
Table Summary
Holdings |
64.0% of Net Assets |
Rolls-Royce Holdings PLC (United Kingdom) |
9.2% |
Safran SA (France) |
8.5% |
Airbus SE (Netherlands) |
8.4% |
BAE Systems PLC (United Kingdom) |
7.9% |
Rheinmetall AG (Germany) |
6.8% |
Saab AB (Sweden) |
4.9% |
MTU Aero Engines AG (Germany) |
4.8% |
Melrose Industries PLC (United Kingdom) |
4.7% |
Kongsberg Gruppen ASA (Norway) |
4.5% |
Thales SA (France) |
4.3% | |
| Material Fund Change [Text Block] |
|
|
|
| Updated Prospectus Phone Number |
|
|
(844) 851-4255
|
| Updated Prospectus Web Address |
|
|
dws.com/en-us/resources/proxy-voting
|
| C000267035 |
|
|
|
| Shareholder Report [Line Items] |
|
|
|
| Fund Name |
|
|
Xtrackers Europe Market Leaders ETF
|
| Class Name |
|
|
Xtrackers Europe Market Leaders ETF
|
| Trading Symbol |
|
|
XEML
|
| Security Exchange Name |
|
|
CboeBZX
|
| Annual or Semi-Annual Statement [Text Block] |
|
|
This annual shareholder report contains important information about the Xtrackers Europe Market Leaders ETF (the "Fund") for the period December 23, 2025 (commencement of operations) to August 31, 2026.
|
| Additional Information [Text Block] |
|
|
You can find additional information about the Fund at dws.com/etfreports. You can also request this information by contacting us at (844) 851‐4255.
|
| Additional Information Phone Number |
|
|
(844) 851‐4255
|
| Additional Information Website |
|
|
dws.com/etfreports
|
| Expenses [Text Block] |
|
|
What were the Fund costs for the reporting period?(Based on a hypothetical $10,000 investment)
Table Summary
Fund |
Costs of a $10,000 investment |
Costs paid as a percentage of a $10,000 investment |
XEML |
$25Footnote Reference(a) |
0.35%Footnote Reference(b) |
| Footnote |
Description |
Footnote(a) |
Based on the period December 23, 2025 (commencement of operations) through August 31, 2026. Expenses would have been higher if the Fund had been in existence for the full reporting period. |
Footnote(b) |
Annualized. | Gross expense ratio as of the latest prospectus: 0.35%. See prospectus for any contractual or voluntary waivers; without a waiver, costs would have been higher. |
| Expenses Paid, Amount |
[3] |
|
$ 25
|
| Expense Ratio, Percent |
[4] |
|
0.35%
|
| Factors Affecting Performance [Text Block] |
|
|
How did the fund perform last year and what affected its performance?The Fund seeks investment results that correspond generally to the performance, before fees and expenses, of the STOXX ®Europe Total Market Leaders Index (the Underlying Index). The Underlying Index seeks to capture the performance of European companies that are considered to be global leaders in their respective market segments as determined by the Underlying Index’s methodology. The Fund returned 6.09% for the period ended August 31, 2026. The Fund's underlying index returned 6.11% and the Fund's broad-based index the MSCI Europe Index returned 11.97% during the same period. The majority of sectors contributed positively to performance during the period with the greatest contribution coming from Industrials, Information Technology and Utilities. Health Care and the Consumer Discretionary sectors detracted from performance. From a geographical perspective, the majority of the countries contributed positively to performance during the period with the greatest contribution coming from Switzerland, Netherlands and Germany while France contributed negatively to performance. |
| Line Graph [Table Text Block] |
|
|
Table Summary
|
Xtrackers Europe Market Leaders ETF - NAV |
STOXX Europe Total Market Leaders Index (the Underlying Index) |
MSCI Europe Index |
12/23/25 |
$10,000 |
$10,000 |
$10,000 |
12/25 |
$10,066 |
$10,091 |
$10,078 |
1/26 |
$10,414 |
$10,441 |
$10,526 |
2/26 |
$10,935 |
$10,944 |
$10,870 |
3/26 |
$9,595 |
$9,596 |
$9,794 |
4/26 |
$10,088 |
$10,079 |
$10,489 |
5/26 |
$10,388 |
$10,378 |
$10,764 |
6/26 |
$10,477 |
$10,472 |
$10,865 |
7/26 |
$10,557 |
$10,555 |
$11,040 |
8/26 |
$10,609 |
$10,611 |
$11,197 |
|
| Average Annual Return [Table Text Block] |
|
|
Table Summary
Fund/Index |
Since Inception 12/23/25 |
Xtrackers Europe Market Leaders ETF - NAV |
6.09% |
STOXX Europe Total Market Leaders Index |
6.11% |
MSCI Europe Index |
11.97% | |
| AssetsNet |
|
|
$ 5,210,373
|
| Holdings Count | Holding |
|
|
43
|
| Advisory Fees Paid, Amount |
|
|
$ 12,397
|
| InvestmentCompanyPortfolioTurnover |
|
|
14.00%
|
| Additional Fund Statistics [Text Block] |
|
|
Table Summary
Net Assets ($) |
5,210,373 |
Number of Portfolio Holdings |
43 |
Portfolio Turnover Rate (%) |
14 |
Total Net Advisory Fees Paid ($) |
12,397 | |
| Holdings [Text Block] |
|
|
Table Summary
Sector |
% of Net Assets |
Health Care |
30% |
Industrials |
25% |
Consumer Discretionary |
13% |
Consumer Staples |
10% |
Information Technology |
10% |
Utilities |
6% |
Communication Services |
4% |
Energy |
1% |
Other |
1% | Geographical Diversification
Table Summary
Country |
% of Net Assets |
France |
34% |
Switzerland |
22% |
Germany |
15% |
United Kingdom |
9% |
Denmark |
5% |
Netherlands |
4% |
Spain |
4% |
Sweden |
3% |
United States |
2% |
Other |
1% | |
| Largest Holdings [Text Block] |
|
|
Ten Largest Equity Holdings
Table Summary
Holdings |
47.4% of Net Assets |
SAP SE (Germany) |
5.9% |
Safran SA (France) |
5.0% |
Schneider Electric SE (France) |
4.9% |
Cie Financiere Richemont SA (Switzerland) |
4.7% |
Roche Holding AG (Switzerland) |
4.7% |
Novo Nordisk A/S (Denmark) |
4.5% |
Deutsche Telekom AG (Germany) |
4.5% |
Sanofi SA (France) |
4.4% |
L'Oreal SA (France) |
4.4% |
Novartis AG (Switzerland) |
4.4% | |
| Material Fund Change [Text Block] |
|
|
|
| Updated Prospectus Phone Number |
|
|
(844) 851-4255
|
| Updated Prospectus Web Address |
|
|
dws.com/en-us/resources/proxy-voting
|
| C000152993 |
|
|
|
| Shareholder Report [Line Items] |
|
|
|
| Fund Name |
|
|
Xtrackers FTSE Developed ex US Multifactor ETF
|
| Class Name |
|
|
Xtrackers FTSE Developed ex US Multifactor ETF
|
| Trading Symbol |
|
|
DEEF
|
| Security Exchange Name |
|
|
NYSEArca
|
| Annual or Semi-Annual Statement [Text Block] |
|
|
This annual shareholder report contains important information about the Xtrackers FTSE Developed ex US Multifactor ETF (the "Fund") for the period September 1, 2025 to August 31, 2026.
|
| Additional Information [Text Block] |
|
|
You can find additional information about the Fund at dws.com/etfreports. You can also request this information by contacting us at (844) 851‐4255.
|
| Additional Information Phone Number |
|
|
(844) 851‐4255
|
| Additional Information Website |
|
|
dws.com/etfreports
|
| Expenses [Text Block] |
|
|
What were the Fund costs for the last year?(Based on a hypothetical $10,000 investment)
Table Summary
Fund |
Costs of a $10,000 investment |
Costs paid as a percentage of a $10,000 investment |
DEEF |
$26 |
0.24% | Gross expense ratio as of the latest prospectus: 0.24%. See prospectus for any contractual or voluntary waivers; without a waiver, costs would have been higher. |
| Expenses Paid, Amount |
|
|
$ 26
|
| Expense Ratio, Percent |
|
|
0.24%
|
| Factors Affecting Performance [Text Block] |
|
|
How did the fund perform last year and what affected its performance?The Fund seeks investment results that correspond generally to the performance, before fees and expenses, of the FTSE Developed ex US Comprehensive Factor Index (the Underlying Index). The Underlying Index is designed to track the equity market performance of companies in developed countries (except the United States) selected on the investment style criteria (“factors”) of value, momentum, quality, low volatility and size. The companies eligible for the Underlying Index are derived from its starting universe, the FTSE Developed ex US Index, which is comprised of large- and mid-capitalization equity securities from developed markets (except the United States). The Fund returned 20.63% for the period ended August 31, 2026. The Fund's underlying index returned 20.96% and the Fund's broad-based index the FTSE Developed ex US Index returned 28.74% during the same period. All sectors contributed positively to performance during the period with the greatest contribution coming from Industrials, Financials and Materials. From a geographical perspective, most of the countries contributed positively to performance during the period with the greatest contribution coming from Japan, Korea and the United Kingdom while Switzerland contributed negatively to performance. |
| Line Graph [Table Text Block] |
|
|
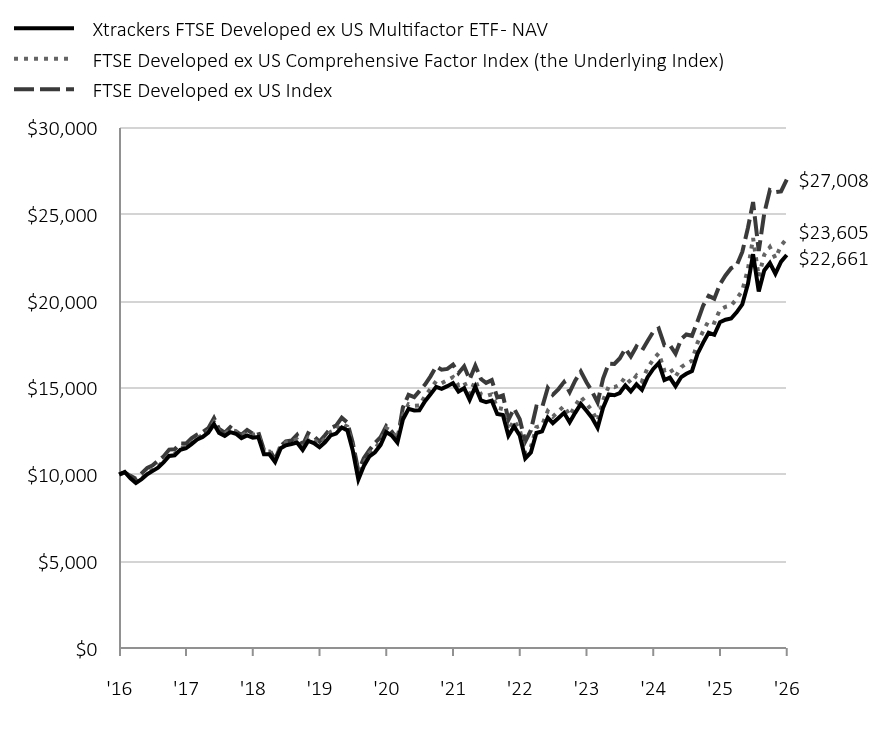
Table Summary
|
Xtrackers FTSE Developed ex US Multifactor ETF - NAV |
FTSE Developed ex US Comprehensive Factor Index (the Underlying Index) |
FTSE Developed ex US Index |
'16 |
$10,000 |
$10,000 |
$10,000 |
'16 |
$10,154 |
$10,188 |
$10,127 |
'16 |
$9,786 |
$9,827 |
$9,925 |
'16 |
$9,509 |
$9,553 |
$9,755 |
'16 |
$9,730 |
$9,776 |
$10,067 |
'17 |
$10,020 |
$10,070 |
$10,382 |
'17 |
$10,198 |
$10,260 |
$10,525 |
'17 |
$10,392 |
$10,460 |
$10,802 |
'17 |
$10,704 |
$10,775 |
$11,043 |
'17 |
$11,074 |
$11,151 |
$11,440 |
'17 |
$11,115 |
$11,190 |
$11,456 |
'17 |
$11,425 |
$11,506 |
$11,797 |
'17 |
$11,518 |
$11,599 |
$11,785 |
'17 |
$11,759 |
$11,837 |
$12,090 |
'17 |
$12,028 |
$12,120 |
$12,306 |
'17 |
$12,170 |
$12,273 |
$12,442 |
'17 |
$12,413 |
$12,512 |
$12,677 |
'18 |
$12,904 |
$13,027 |
$13,259 |
'18 |
$12,399 |
$12,527 |
$12,627 |
'18 |
$12,224 |
$12,363 |
$12,421 |
'18 |
$12,443 |
$12,592 |
$12,731 |
'18 |
$12,350 |
$12,505 |
$12,477 |
'18 |
$12,099 |
$12,254 |
$12,301 |
'18 |
$12,258 |
$12,419 |
$12,577 |
'18 |
$12,129 |
$12,290 |
$12,364 |
'18 |
$12,170 |
$12,336 |
$12,462 |
'18 |
$11,171 |
$11,326 |
$11,424 |
'18 |
$11,172 |
$11,330 |
$11,435 |
'18 |
$10,724 |
$10,874 |
$10,861 |
'19 |
$11,521 |
$11,687 |
$11,645 |
'19 |
$11,686 |
$11,856 |
$11,913 |
'19 |
$11,760 |
$11,939 |
$11,960 |
'19 |
$11,850 |
$12,029 |
$12,285 |
'19 |
$11,421 |
$11,596 |
$11,681 |
'19 |
$11,940 |
$12,122 |
$12,380 |
'19 |
$11,814 |
$12,002 |
$12,213 |
'19 |
$11,582 |
$11,771 |
$11,902 |
'19 |
$11,862 |
$12,060 |
$12,266 |
'19 |
$12,254 |
$12,461 |
$12,683 |
'19 |
$12,363 |
$12,576 |
$12,823 |
'19 |
$12,720 |
$12,941 |
$13,279 |
'20 |
$12,543 |
$12,765 |
$12,992 |
'20 |
$11,403 |
$11,604 |
$11,847 |
'20 |
$9,721 |
$9,893 |
$10,208 |
'20 |
$10,499 |
$10,690 |
$10,936 |
'20 |
$11,054 |
$11,261 |
$11,421 |
'20 |
$11,286 |
$11,492 |
$11,826 |
'20 |
$11,713 |
$11,929 |
$12,157 |
'20 |
$12,448 |
$12,680 |
$12,789 |
'20 |
$12,255 |
$12,492 |
$12,480 |
'20 |
$11,841 |
$12,070 |
$12,013 |
'20 |
$13,173 |
$13,429 |
$13,871 |
'20 |
$13,786 |
$14,057 |
$14,599 |
'21 |
$13,692 |
$13,965 |
$14,472 |
'21 |
$13,703 |
$13,977 |
$14,814 |
'21 |
$14,230 |
$14,526 |
$15,188 |
'21 |
$14,626 |
$14,937 |
$15,663 |
'21 |
$15,059 |
$15,386 |
$16,234 |
'21 |
$14,940 |
$15,266 |
$16,044 |
'21 |
$15,097 |
$15,441 |
$16,092 |
'21 |
$15,273 |
$15,621 |
$16,336 |
'21 |
$14,789 |
$15,139 |
$15,846 |
'21 |
$14,981 |
$15,336 |
$16,246 |
'21 |
$14,308 |
$14,648 |
$15,480 |
'21 |
$15,066 |
$15,434 |
$16,277 |
'22 |
$14,271 |
$14,621 |
$15,511 |
'22 |
$14,174 |
$14,530 |
$15,289 |
'22 |
$14,261 |
$14,627 |
$15,448 |
'22 |
$13,497 |
$13,854 |
$14,451 |
'22 |
$13,430 |
$13,782 |
$14,569 |
'22 |
$12,238 |
$12,562 |
$13,158 |
'22 |
$12,781 |
$13,121 |
$13,810 |
'22 |
$12,256 |
$12,588 |
$13,193 |
'22 |
$10,929 |
$11,230 |
$11,905 |
'22 |
$11,277 |
$11,589 |
$12,556 |
'22 |
$12,398 |
$12,738 |
$13,924 |
'22 |
$12,489 |
$12,838 |
$13,860 |
'23 |
$13,288 |
$13,659 |
$14,995 |
'23 |
$12,969 |
$13,338 |
$14,604 |
'23 |
$13,266 |
$13,654 |
$14,930 |
'23 |
$13,559 |
$13,953 |
$15,333 |
'23 |
$13,016 |
$13,400 |
$14,754 |
'23 |
$13,559 |
$13,958 |
$15,415 |
'23 |
$14,075 |
$14,492 |
$15,945 |
'23 |
$13,676 |
$14,088 |
$15,321 |
'23 |
$13,277 |
$13,691 |
$14,801 |
'23 |
$12,696 |
$13,093 |
$14,164 |
'23 |
$13,853 |
$14,288 |
$15,536 |
'23 |
$14,624 |
$15,087 |
$16,400 |
'24 |
$14,574 |
$15,037 |
$16,375 |
'24 |
$14,702 |
$15,171 |
$16,694 |
'24 |
$15,140 |
$15,634 |
$17,263 |
'24 |
$14,793 |
$15,283 |
$16,803 |
'24 |
$15,201 |
$15,706 |
$17,383 |
'24 |
$14,885 |
$15,385 |
$17,150 |
'24 |
$15,618 |
$16,151 |
$17,704 |
'24 |
$16,090 |
$16,640 |
$18,228 |
'24 |
$16,429 |
$16,997 |
$18,426 |
'24 |
$15,452 |
$15,997 |
$17,463 |
'24 |
$15,591 |
$16,149 |
$17,462 |
'24 |
$15,095 |
$15,643 |
$16,975 |
'25 |
$15,622 |
$16,191 |
$17,810 |
'25 |
$15,815 |
$16,393 |
$18,079 |
'25 |
$15,974 |
$16,567 |
$18,000 |
'25 |
$16,960 |
$17,597 |
$18,829 |
'25 |
$17,610 |
$18,273 |
$19,738 |
'25 |
$18,175 |
$18,867 |
$20,303 |
'25 |
$18,056 |
$18,755 |
$20,143 |
'25 |
$18,786 |
$19,515 |
$20,978 |
'25 |
$18,928 |
$19,669 |
$21,477 |
'25 |
$18,999 |
$19,750 |
$21,900 |
'25 |
$19,355 |
$20,131 |
$22,056 |
'25 |
$19,813 |
$20,613 |
$22,834 |
'26 |
$21,000 |
$21,852 |
$24,233 |
'26 |
$22,705 |
$23,633 |
$25,711 |
'26 |
$20,558 |
$21,410 |
$22,887 |
'26 |
$21,769 |
$22,672 |
$25,052 |
'26 |
$22,200 |
$23,120 |
$26,406 |
'26 |
$21,580 |
$22,471 |
$26,280 |
'26 |
$22,273 |
$23,203 |
$26,326 |
'26 |
$22,661 |
$23,605 |
$27,008 |
|
| Average Annual Return [Table Text Block] |
|
|
Table Summary
Fund/Index |
1-Year |
5-Year |
10-Year |
Xtrackers FTSE Developed ex US Multifactor ETF - NAV |
20.63% |
8.21% |
8.52% |
FTSE Developed ex US Comprehensive Factor Index |
20.96% |
8.61% |
8.97% |
FTSE Developed ex US Index |
28.74% |
10.58% |
10.45% | |
| AssetsNet |
|
|
$ 56,703,906
|
| Holdings Count | Holding |
|
|
1,240
|
| Advisory Fees Paid, Amount |
|
|
$ 130,518
|
| InvestmentCompanyPortfolioTurnover |
|
|
48.00%
|
| Additional Fund Statistics [Text Block] |
|
|
Table Summary
Net Assets ($) |
56,703,906 |
Number of Portfolio Holdings |
1,240 |
Portfolio Turnover Rate (%) |
48 |
Total Net Advisory Fees Paid ($) |
130,518 | |
| Holdings [Text Block] |
|
|
Table Summary
Sector |
% of Net Assets |
Industrials |
24% |
Financials |
15% |
Consumer Staples |
10% |
Consumer Discretionary |
10% |
Materials |
10% |
Utilities |
7% |
Energy |
5% |
Real Estate |
5% |
Information Technology |
4% |
Communication Services |
4% |
Health Care |
4% | Geographical Diversification
Table Summary
Country |
% of Net Assets |
Japan |
30% |
United Kingdom |
9% |
Australia |
8% |
South Korea |
7% |
Canada |
7% |
France |
4% |
Sweden |
4% |
Singapore |
3% |
Germany |
3% |
Hong Kong |
3% |
Israel |
3% |
Other |
15% | |
| Largest Holdings [Text Block] |
|
|
Ten Largest Equity Holdings
Table Summary
Holdings |
6.1% of Net Assets |
Tesco PLC (United Kingdom) |
0.9% |
Magna International, Inc. (Canada) |
0.8% |
RWE AG (Germany) |
0.7% |
Industrivarden AB (Sweden) |
0.6% |
Repsol SA (Spain) |
0.6% |
ACS Actividades de Construccion y Servicios SA (Spain) |
0.5% |
J Sainsbury PLC (United Kingdom) |
0.5% |
ENEOS Holdings, Inc. (Japan) |
0.5% |
CK Hutchison Holdings Ltd. (Hong Kong) |
0.5% |
ORLEN SA (Poland) |
0.5% | |
| Material Fund Change [Text Block] |
|
|
|
| Updated Prospectus Phone Number |
|
|
(844) 851-4255
|
| Updated Prospectus Web Address |
|
|
dws.com/en-us/resources/proxy-voting
|
| C000217052 |
|
|
|
| Shareholder Report [Line Items] |
|
|
|
| Fund Name |
|
|
Xtrackers MSCI Kokusai Equity ETF
|
| Class Name |
|
|
Xtrackers MSCI Kokusai Equity ETF
|
| Trading Symbol |
|
|
KOKU
|
| Security Exchange Name |
|
|
NYSEArca
|
| Annual or Semi-Annual Statement [Text Block] |
|
|
This annual shareholder report contains important information about the Xtrackers MSCI Kokusai Equity ETF (the "Fund") for the period September 1, 2025 to August 31, 2026.
|
| Additional Information [Text Block] |
|
|
You can find additional information about the Fund at dws.com/etfreports. You can also request this information by contacting us at (844) 851‐4255.
|
| Additional Information Phone Number |
|
|
(844) 851‐4255
|
| Additional Information Website |
|
|
dws.com/etfreports
|
| Expenses [Text Block] |
|
|
What were the Fund costs for the last year?(Based on a hypothetical $10,000 investment)
Table Summary
Fund |
Costs of a $10,000 investment |
Costs paid as a percentage of a $10,000 investment |
KOKU |
$10 |
0.09% | Gross expense ratio as of the latest prospectus: 0.09%. See prospectus for any contractual or voluntary waivers; without a waiver, costs would have been higher. |
| Expenses Paid, Amount |
|
|
$ 10
|
| Expense Ratio, Percent |
|
|
0.09%
|
| Factors Affecting Performance [Text Block] |
|
|
How did the fund perform last year and what affected its performance?The Fund seeks investment results that correspond generally to the performance, before fees and expenses, of the MSCI Kokusai Index (the Underlying Index). The Underlying Index is designed to track the performance of equity markets in developed markets (excluding Japan). The Underlying Index is also known as the MSCI World ex Japan Index. The Fund returned 20.19% for the period ended August 31, 2026. The Fund's underlying index returned 19.94% and the Fund's broad-based index the MSCI World Index returned 20.37% during the same period. All sectors contributed positively to performance during the period with the greatest contribution coming from Information Technology, Financials and Health Care. From a geographical perspective, all countries contributed positively to performance during the period with the greatest contribution coming from the United States, Canada and the United Kingdom. |
| Line Graph [Table Text Block] |
|
|
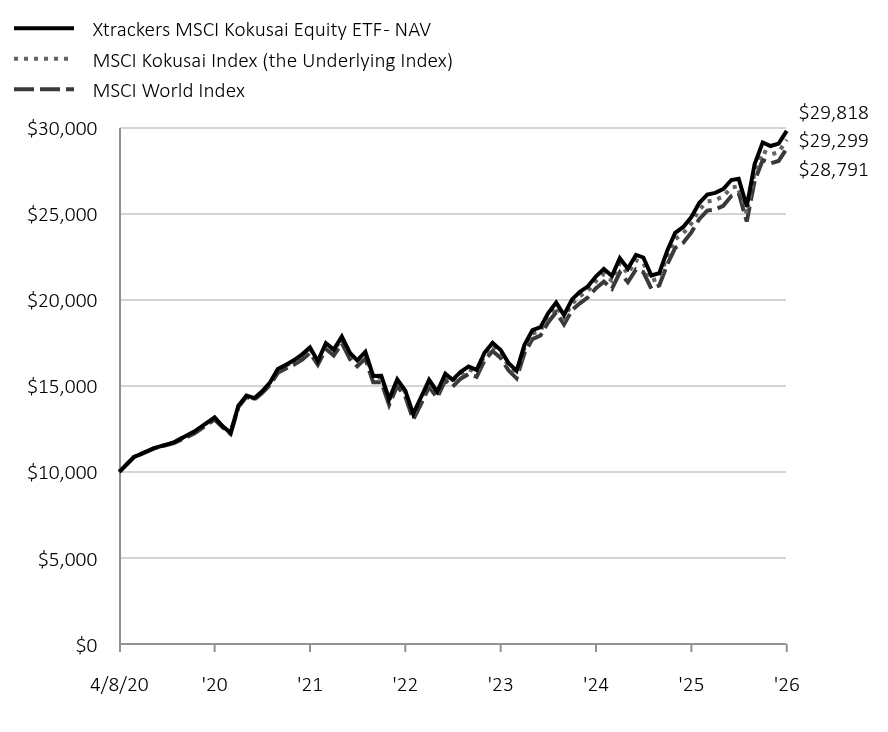
Table Summary
|
Xtrackers MSCI Kokusai Equity ETF - NAV |
MSCI Kokusai Index (the Underlying Index) |
MSCI World Index |
4/8/20 |
$10,000 |
$10,000 |
$10,000 |
4/30/20 |
$10,860 |
$10,866 |
$10,843 |
5/31/20 |
$11,384 |
$11,381 |
$11,367 |
6/30/20 |
$11,716 |
$11,709 |
$11,668 |
7/31/20 |
$12,345 |
$12,333 |
$12,226 |
8/31/20 |
$13,166 |
$13,148 |
$13,043 |
9/30/20 |
$12,666 |
$12,647 |
$12,593 |
10/31/20 |
$12,267 |
$12,243 |
$12,207 |
11/30/20 |
$13,841 |
$13,812 |
$13,767 |
12/31/20 |
$14,432 |
$14,399 |
$14,351 |
1/31/21 |
$14,290 |
$14,256 |
$14,208 |
2/28/21 |
$14,672 |
$14,634 |
$14,572 |
3/31/21 |
$15,193 |
$15,148 |
$15,057 |
4/30/21 |
$15,982 |
$15,929 |
$15,758 |
5/31/21 |
$16,229 |
$16,170 |
$16,004 |
6/30/21 |
$16,480 |
$16,420 |
$16,223 |
7/31/21 |
$16,816 |
$16,750 |
$16,514 |
8/31/21 |
$17,231 |
$17,160 |
$16,925 |
9/30/21 |
$16,436 |
$16,364 |
$16,222 |
10/31/21 |
$17,481 |
$17,403 |
$17,141 |
11/30/21 |
$17,104 |
$17,025 |
$16,765 |
12/31/21 |
$17,867 |
$17,780 |
$17,482 |
1/31/22 |
$16,921 |
$16,837 |
$16,557 |
2/28/22 |
$16,482 |
$16,395 |
$16,138 |
3/31/22 |
$16,980 |
$16,882 |
$16,581 |
4/30/22 |
$15,576 |
$15,485 |
$15,204 |
5/31/22 |
$15,580 |
$15,481 |
$15,215 |
6/30/22 |
$14,227 |
$14,132 |
$13,897 |
7/31/22 |
$15,380 |
$15,275 |
$15,001 |
8/31/22 |
$14,723 |
$14,620 |
$14,374 |
9/30/22 |
$13,368 |
$13,271 |
$13,037 |
10/31/22 |
$14,366 |
$14,260 |
$13,974 |
11/30/22 |
$15,350 |
$15,228 |
$14,945 |
12/31/22 |
$14,659 |
$14,537 |
$14,311 |
1/31/23 |
$15,707 |
$15,574 |
$15,323 |
2/28/23 |
$15,348 |
$15,215 |
$14,955 |
3/31/23 |
$15,821 |
$15,676 |
$15,417 |
4/30/23 |
$16,118 |
$15,965 |
$15,687 |
5/31/23 |
$15,931 |
$15,776 |
$15,530 |
6/30/23 |
$16,920 |
$16,751 |
$16,470 |
7/31/23 |
$17,495 |
$17,318 |
$17,023 |
8/31/23 |
$17,082 |
$16,904 |
$16,616 |
9/30/23 |
$16,324 |
$16,151 |
$15,900 |
10/31/23 |
$15,871 |
$15,699 |
$15,438 |
11/30/23 |
$17,369 |
$17,179 |
$16,886 |
12/31/23 |
$18,232 |
$18,029 |
$17,715 |
1/31/24 |
$18,414 |
$18,205 |
$17,927 |
2/29/24 |
$19,215 |
$18,992 |
$18,687 |
3/31/24 |
$19,839 |
$19,605 |
$19,282 |
4/30/24 |
$19,119 |
$18,892 |
$18,571 |
5/31/24 |
$20,021 |
$19,773 |
$19,401 |
6/30/24 |
$20,467 |
$20,209 |
$19,795 |
7/31/24 |
$20,782 |
$20,516 |
$20,144 |
8/31/24 |
$21,364 |
$21,086 |
$20,677 |
9/30/24 |
$21,790 |
$21,503 |
$21,055 |
10/31/24 |
$21,386 |
$21,101 |
$20,638 |
11/30/24 |
$22,419 |
$22,117 |
$21,585 |
12/31/24 |
$21,812 |
$21,513 |
$21,022 |
1/31/25 |
$22,609 |
$22,296 |
$21,764 |
2/28/25 |
$22,459 |
$22,144 |
$21,607 |
3/31/25 |
$21,410 |
$21,102 |
$20,645 |
4/30/25 |
$21,553 |
$21,237 |
$20,829 |
5/31/25 |
$22,861 |
$22,518 |
$22,062 |
6/30/25 |
$23,888 |
$23,524 |
$23,014 |
7/31/25 |
$24,231 |
$23,863 |
$23,310 |
8/31/25 |
$24,809 |
$24,428 |
$23,918 |
9/30/25 |
$25,621 |
$25,224 |
$24,687 |
10/31/25 |
$26,115 |
$25,709 |
$25,181 |
11/30/25 |
$26,210 |
$25,797 |
$25,252 |
12/31/25 |
$26,432 |
$26,009 |
$25,456 |
1/31/26 |
$26,960 |
$26,526 |
$26,026 |
2/28/26 |
$27,035 |
$26,594 |
$26,217 |
3/31/26 |
$25,426 |
$25,005 |
$24,547 |
4/30/26 |
$27,876 |
$27,411 |
$26,901 |
5/31/26 |
$29,147 |
$28,651 |
$28,126 |
6/30/26 |
$28,935 |
$28,439 |
$27,924 |
7/31/26 |
$29,077 |
$28,576 |
$28,067 |
8/31/26 |
$29,818 |
$29,299 |
$28,791 |
|
| Average Annual Return [Table Text Block] |
|
|
Table Summary
Fund/Index |
1-Year |
5-Year |
Since Inception 4/8/20 |
Xtrackers MSCI Kokusai Equity ETF - NAV |
20.19% |
11.59% |
18.61% |
MSCI Kokusai Index |
19.94% |
11.29% |
18.28% |
MSCI World Index |
20.37% |
11.21% |
17.96% | |
| AssetsNet |
|
|
$ 812,669,228
|
| Holdings Count | Holding |
|
|
1,089
|
| Advisory Fees Paid, Amount |
|
|
$ 662,386
|
| InvestmentCompanyPortfolioTurnover |
|
|
4.00%
|
| Additional Fund Statistics [Text Block] |
|
|
Table Summary
Net Assets ($) |
812,669,228 |
Number of Portfolio Holdings |
1,089 |
Portfolio Turnover Rate (%) |
4 |
Total Net Advisory Fees Paid ($) |
662,386 | |
| Holdings [Text Block] |
|
|
Table Summary
Sector |
% of Net Assets |
Information Technology |
31% |
Financials |
16% |
Industrials |
10% |
Health Care |
9% |
Consumer Discretionary |
8% |
Communication Services |
8% |
Consumer Staples |
5% |
Energy |
4% |
Materials |
3% |
Utilities |
2% |
Real Estate |
2% | Geographical Diversification
Table Summary
Country |
% of Net Assets |
United States |
75% |
United Kingdom |
4% |
Canada |
4% |
Switzerland |
3% |
Germany |
2% |
France |
2% |
Australia |
2% |
Netherlands |
2% |
Other |
6% | |
| Largest Holdings [Text Block] |
|
|
Ten Largest Equity Holdings
Table Summary
Holdings |
29.4% of Net Assets |
NVIDIA Corp. (United States) |
5.9% |
Apple, Inc. (United States) |
5.4% |
Microsoft Corp. (United States) |
4.1% |
Alphabet, Inc. (United States) |
4.1% |
Amazon.com, Inc. (United States) |
2.9% |
Broadcom, Inc. (United States) |
1.9% |
Meta Platforms, Inc. (United States) |
1.5% |
Micron Technology, Inc. (United States) |
1.3% |
Tesla, Inc. (United States) |
1.2% |
JPMorgan Chase & Co. (United States) |
1.1% | |
| Material Fund Change [Text Block] |
|
|
|
| Updated Prospectus Phone Number |
|
|
(844) 851-4255
|
| Updated Prospectus Web Address |
|
|
dws.com/en-us/resources/proxy-voting
|
| C000196640 |
|
|
|
| Shareholder Report [Line Items] |
|
|
|
| Fund Name |
|
|
Xtrackers Russell 1000 US Quality at a Reasonable Price ETF
|
| Class Name |
|
|
Xtrackers Russell 1000 US Quality at a Reasonable Price ETF
|
| Trading Symbol |
|
|
QARP
|
| Security Exchange Name |
|
|
NYSEArca
|
| Annual or Semi-Annual Statement [Text Block] |
|
|
This annual shareholder report contains important information about the Xtrackers Russell 1000 US Quality at a Reasonable Price ETF (the "Fund") for the period September 1, 2025 to August 31, 2026.
|
| Additional Information [Text Block] |
|
|
You can find additional information about the Fund at dws.com/etfreports. You can also request this information by contacting us at (844) 851‐4255.
|
| Additional Information Phone Number |
|
|
(844) 851‐4255
|
| Additional Information Website |
|
|
dws.com/etfreports
|
| Expenses [Text Block] |
|
|
What were the Fund costs for the last year?(Based on a hypothetical $10,000 investment)
Table Summary
Fund |
Costs of a $10,000 investment |
Costs paid as a percentage of a $10,000 investment |
QARP |
$21 |
0.19% | Gross expense ratio as of the latest prospectus: 0.19%. See prospectus for any contractual or voluntary waivers; without a waiver, costs would have been higher. |
| Expenses Paid, Amount |
|
|
$ 21
|
| Expense Ratio, Percent |
|
|
0.19%
|
| Factors Affecting Performance [Text Block] |
|
|
How did the fund perform last year and what affected its performance?The Fund seeks investment results that correspond generally to the performance, before fees and expenses, of the Russell 1000® 2Qual/Val 5% Capped Factor Index (the Underlying Index). The Underlying Index is designed to track the equity market performance of companies in the United States selected on the investment style criteria (“factors”) of quality and value. The companies eligible for the Underlying Index are derived from its starting universe, the Russell 1000® Index, which is comprised of large-cap equity securities from issuers in the United States. The Fund returned 22.69% for the period ended August 31, 2026. The Fund's underlying index returned 22.91% and the Fund's broad-based index the Russell 1000® Index returned 19.77% during the same period. The majority of sectors contributed positively to performance during the period with the greatest contribution coming from Information Technology, Health Care and Energy. Utilities was the sole detractor to performance. |
| Average Annual Return [Table Text Block] |
|
|
Table Summary
Fund/Index |
1-Year |
5-Year |
Since Inception 4/5/18 |
Xtrackers Russell 1000 US QARP ETF - NAV |
22.69% |
11.75% |
14.39% |
Russell 1000® 2Qual/Val 5% Capped Factor Index |
22.91% |
11.96% |
14.62% |
Russell 1000® Index |
19.77% |
12.10% |
15.06% | Average Annual Total Returns Performance shown is historical. The Fund's past performance is not a good predictor or guarantee of the Fund's future performance. Investment returns and principal value of an investment will fluctuate so that an investor's shares, when redeemed, may be worth more or less than their original cost. Current performance may be lower or higher than the performance data quoted. The performance graph and returns table do not reflect the deduction of taxes that a shareholder would pay on Fund distributions or the sale of Fund shares. Shares are bought and sold at market price (closing price) not net asset value (NAV) and are not individually redeemed from the Fund. To obtain the most recent month-end performance data visit etf.dws.com/en-us/etf-products or call (844) 851-4255. |
| AssetsNet |
|
|
$ 78,204,170
|
| Holdings Count | Holding |
|
|
415
|
| Advisory Fees Paid, Amount |
|
|
$ 143,370
|
| InvestmentCompanyPortfolioTurnover |
|
|
19.00%
|
| Additional Fund Statistics [Text Block] |
|
|
Table Summary
Net Assets ($) |
78,204,170 |
Number of Portfolio Holdings |
415 |
Portfolio Turnover Rate (%) |
19 |
Total Net Advisory Fees Paid ($) |
143,370 | |
| Largest Holdings [Text Block] |
|
|
Ten Largest Equity Holdings
Table Summary
Holdings |
31.8% of Net Assets |
Apple, Inc. |
5.1% |
Microsoft Corp. |
4.9% |
Meta Platforms, Inc. |
3.7% |
Alphabet, Inc. |
3.4% |
Berkshire Hathaway, Inc. |
3.0% |
NVIDIA Corp. |
2.7% |
ExxonMobil Holdings Corp. |
2.5% |
Johnson & Johnson |
2.2% |
Amazon.com, Inc. |
2.2% |
Visa, Inc. |
2.1% | |
| Updated Prospectus Phone Number |
|
|
(844) 851-4255
|
| Updated Prospectus Web Address |
|
|
dws.com/en-us/resources/proxy-voting
|
| C000152991 |
|
|
|
| Shareholder Report [Line Items] |
|
|
|
| Fund Name |
|
|
Xtrackers Russell US Multifactor ETF
|
| Class Name |
|
|
Xtrackers Russell US Multifactor ETF
|
| Trading Symbol |
|
|
DEUS
|
| Security Exchange Name |
|
|
NYSEArca
|
| Annual or Semi-Annual Statement [Text Block] |
|
|
This annual shareholder report contains important information about the Xtrackers Russell US Multifactor ETF (the "Fund") for the period September 1, 2025 to August 31, 2026.
|
| Additional Information [Text Block] |
|
|
You can find additional information about the Fund at dws.com/etfreports. You can also request this information by contacting us at (844) 851‐4255.
|
| Additional Information Phone Number |
|
|
(844) 851‐4255
|
| Additional Information Website |
|
|
dws.com/etfreports
|
| Expenses [Text Block] |
|
|
What were the Fund costs for the last year?(Based on a hypothetical $10,000 investment)
Table Summary
Fund |
Costs of a $10,000 investment |
Costs paid as a percentage of a $10,000 investment |
DEUS |
$18 |
0.17% | Gross expense ratio as of the latest prospectus: 0.17%. See prospectus for any contractual or voluntary waivers; without a waiver, costs would have been higher. |
| Expenses Paid, Amount |
|
|
$ 18
|
| Expense Ratio, Percent |
|
|
0.17%
|
| Factors Affecting Performance [Text Block] |
|
|
How did the fund perform last year and what affected its performance?The Fund seeks investment results that correspond generally to the performance, before fees and expenses, of the Russell 1000® Comprehensive Factor Index (the Underlying Index). The Underlying Index is designed to track the equity market performance of companies in the United States selected on the investment style criteria (“factors”) of value, momentum, quality, low volatility and size. The companies eligible for the Underlying Index are derived from its starting universe, the Russell 1000® Index, which is comprised of large-cap equity securities from issuers in the United States. The Fund returned 17.31% for the period ended August 31, 2026. The Fund's underlying index returned 17.53% and the Fund's broad-based index the Russell 1000® Index returned 19.77% during the same period. All sectors contributed positively to performance during the period with the greatest contribution coming from Information Technology, Health Care and Energy. |
| Average Annual Return [Table Text Block] |
|
|
Table Summary
Fund/Index |
1-Year |
5-Year |
10-Year |
Xtrackers Russell US Multifactor ETF - NAV |
17.31% |
9.33% |
11.46% |
Russell 1000® Comprehensive Factor Index |
17.53% |
9.49% |
11.62% |
Russell 1000® Index |
19.77% |
12.10% |
15.13% | Average Annual Total Returns Performance shown is historical. The Fund's past performance is not a good predictor or guarantee of the Fund's future performance. Investment returns and principal value of an investment will fluctuate so that an investor's shares, when redeemed, may be worth more or less than their original cost. Current performance may be lower or higher than the performance data quoted. The performance graph and returns table do not reflect the deduction of taxes that a shareholder would pay on Fund distributions or the sale of Fund shares. Shares are bought and sold at market price (closing price) not net asset value (NAV) and are not individually redeemed from the Fund. To obtain the most recent month-end performance data visit etf.dws.com/en-us/etf-products or call (844) 851-4255. |
| AssetsNet |
|
|
$ 301,148,990
|
| Holdings Count | Holding |
|
|
864
|
| Advisory Fees Paid, Amount |
|
|
$ 389,378
|
| InvestmentCompanyPortfolioTurnover |
|
|
42.00%
|
| Additional Fund Statistics [Text Block] |
|
|
Table Summary
Net Assets ($) |
301,148,990 |
Number of Portfolio Holdings |
864 |
Portfolio Turnover Rate (%) |
42 |
Total Net Advisory Fees Paid ($) |
389,378 | |
| Largest Holdings [Text Block] |
|
|
Ten Largest Equity Holdings
Table Summary
Holdings |
6.7% of Net Assets |
Allstate Corp. |
1.0% |
Archer-Daniels-Midland Co. |
0.9% |
McKesson Corp. |
0.8% |
Regeneron Pharmaceuticals, Inc. |
0.7% |
CF Industries Holdings, Inc. |
0.6% |
T. Rowe Price Group, Inc. |
0.6% |
Simon Property Group, Inc. |
0.6% |
Incyte Corp. |
0.5% |
Travelers Cos., Inc. |
0.5% |
Newmont Corp. |
0.5% | |
| Updated Prospectus Phone Number |
|
|
(844) 851-4255
|
| Updated Prospectus Web Address |
|
|
dws.com/en-us/resources/proxy-voting
|
| C000196639 |
|
|
|
| Shareholder Report [Line Items] |
|
|
|
| Fund Name |
|
|
Xtrackers Emerging Markets Carbon Reduction and Climate Improvers ETF
|
| Class Name |
|
|
Xtrackers Emerging Markets Carbon Reduction and Climate Improvers ETF
|
| Trading Symbol |
|
|
EMCR
|
| Security Exchange Name |
|
|
NYSEArca
|
| Annual or Semi-Annual Statement [Text Block] |
|
|
This annual shareholder report contains important information about the Xtrackers Emerging Markets Carbon Reduction and Climate Improvers ETF (the "Fund") for the period September 1, 2025 to August 31, 2026.
|
| Additional Information [Text Block] |
|
|
You can find additional information about the Fund at dws.com/etfreports. You can also request this information by contacting us at (844) 851‐4255.
|
| Additional Information Phone Number |
|
|
(844) 851‐4255
|
| Additional Information Website |
|
|
dws.com/etfreports
|
| Expenses [Text Block] |
|
|
What were the Fund costs for the last year?(Based on a hypothetical $10,000 investment)
Table Summary
Fund |
Costs of a $10,000 investment |
Costs paid as a percentage of a $10,000 investment |
EMCR |
$17 |
0.15% | Gross expense ratio as of the latest prospectus: 0.15%. See prospectus for any contractual or voluntary waivers; without a waiver, costs would have been higher. |
| Expenses Paid, Amount |
|
|
$ 17
|
| Expense Ratio, Percent |
|
|
0.15%
|
| Factors Affecting Performance [Text Block] |
|
|
How did the fund perform last year and what affected its performance?The Fund seeks investment results that correspond generally to the performance, before fees and expenses, of the Solactive ISS Emerging Markets Carbon Reduction & Climate Improvers Index NTR (the Underlying Index). The Underlying Index is comprised of large and mid-capitalization companies in emerging markets countries that meet certain environmental, social and governance (“ESG”) criteria and/or have committed to greenhouse gas emissions reduction targets. The Underlying Index is then weighted in such a manner seeking to align its constituent companies’ greenhouse gas emissions with the long-term global warming target of the Paris Climate Agreement. The Fund returned 32.39% for the period ended August 31, 2026. The Fund's underlying index returned 32.51% and the Fund's broad-based index the MSCI Emerging Markets Index returned 39.25% during the same period. The majority of sectors contributed positively to performance during the period with the greatest contribution coming from Information Technology, Financials and Industrials. The Communication Services, Consumer Discretionary and Consumer Staples sectors detracted from performance. From a geographical perspective, most of the countries contributed positively to performance during the period with the greatest contribution coming from Taiwan, South Korea and Brazil while Hong Kong, India and Indonesia contributed negatively to performance. |
| Line Graph [Table Text Block] |
|
|
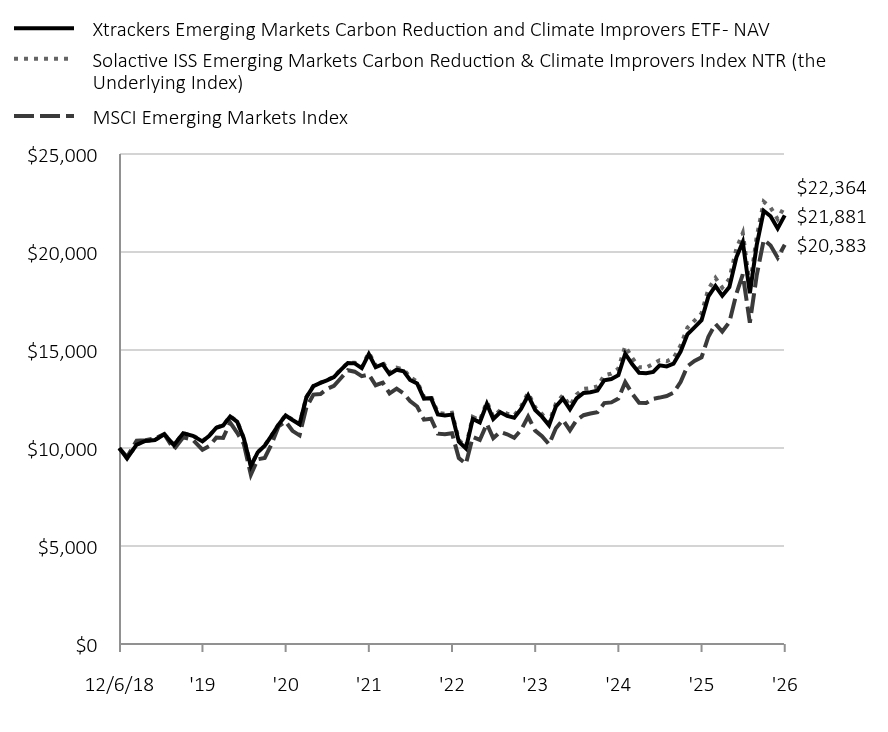
Table Summary
|
Xtrackers Emerging Markets Carbon Reduction and Climate Improvers ETF - NAV |
Solactive ISS Emerging Markets Carbon Reduction & Climate Improvers Index NTR (the Underlying Index) |
MSCI Emerging Markets Index |
12/6/18 |
$10,000 |
$10,000 |
$10,000 |
12/31/18 |
$9,478 |
$9,481 |
$9,546 |
1/31/19 |
$10,176 |
$10,179 |
$10,383 |
2/28/19 |
$10,363 |
$10,366 |
$10,406 |
3/31/19 |
$10,414 |
$10,413 |
$10,494 |
4/30/19 |
$10,708 |
$10,713 |
$10,715 |
5/31/19 |
$10,156 |
$10,164 |
$9,937 |
6/30/19 |
$10,754 |
$10,763 |
$10,557 |
7/31/19 |
$10,629 |
$10,640 |
$10,428 |
8/31/19 |
$10,344 |
$10,356 |
$9,920 |
9/30/19 |
$10,623 |
$10,633 |
$10,109 |
10/31/19 |
$11,039 |
$11,052 |
$10,535 |
11/30/19 |
$11,154 |
$11,172 |
$10,521 |
12/31/19 |
$11,614 |
$11,634 |
$11,306 |
1/31/20 |
$11,341 |
$11,368 |
$10,779 |
2/29/20 |
$10,494 |
$10,516 |
$10,210 |
3/31/20 |
$9,073 |
$9,087 |
$8,638 |
4/30/20 |
$9,779 |
$9,794 |
$9,429 |
5/31/20 |
$10,126 |
$10,142 |
$9,501 |
6/30/20 |
$10,636 |
$10,650 |
$10,200 |
7/31/20 |
$11,198 |
$11,215 |
$11,111 |
8/31/20 |
$11,663 |
$11,685 |
$11,357 |
9/30/20 |
$11,433 |
$11,450 |
$10,883 |
10/31/20 |
$11,214 |
$11,229 |
$10,649 |
11/30/20 |
$12,588 |
$12,602 |
$12,081 |
12/31/20 |
$13,166 |
$13,180 |
$12,734 |
1/31/21 |
$13,326 |
$13,344 |
$12,762 |
2/28/21 |
$13,457 |
$13,478 |
$13,015 |
3/31/21 |
$13,624 |
$13,646 |
$13,179 |
4/30/21 |
$13,996 |
$14,015 |
$13,567 |
5/31/21 |
$14,337 |
$14,359 |
$13,977 |
6/30/21 |
$14,326 |
$14,360 |
$13,901 |
7/31/21 |
$14,085 |
$14,123 |
$13,672 |
8/31/21 |
$14,794 |
$14,878 |
$13,755 |
9/30/21 |
$14,125 |
$14,223 |
$13,209 |
10/31/21 |
$14,280 |
$14,377 |
$13,339 |
11/30/21 |
$13,776 |
$13,871 |
$12,795 |
12/31/21 |
$14,000 |
$14,104 |
$13,035 |
1/31/22 |
$13,922 |
$14,022 |
$12,789 |
2/28/22 |
$13,479 |
$13,617 |
$12,406 |
3/31/22 |
$13,305 |
$13,400 |
$12,126 |
4/30/22 |
$12,527 |
$12,620 |
$11,452 |
5/31/22 |
$12,549 |
$12,647 |
$11,502 |
6/30/22 |
$11,713 |
$11,803 |
$10,738 |
7/31/22 |
$11,661 |
$11,750 |
$10,711 |
8/31/22 |
$11,709 |
$11,806 |
$10,756 |
9/30/22 |
$10,331 |
$10,417 |
$9,495 |
10/31/22 |
$9,987 |
$10,070 |
$9,200 |
11/30/22 |
$11,489 |
$11,590 |
$10,565 |
12/31/22 |
$11,313 |
$11,416 |
$10,416 |
1/31/23 |
$12,258 |
$12,369 |
$11,239 |
2/28/23 |
$11,487 |
$11,594 |
$10,510 |
3/31/23 |
$11,830 |
$11,941 |
$10,829 |
4/30/23 |
$11,640 |
$11,750 |
$10,706 |
5/31/23 |
$11,554 |
$11,669 |
$10,526 |
6/30/23 |
$12,000 |
$12,122 |
$10,926 |
7/31/23 |
$12,687 |
$12,822 |
$11,606 |
8/31/23 |
$11,946 |
$12,074 |
$10,891 |
9/30/23 |
$11,605 |
$11,734 |
$10,606 |
10/31/23 |
$11,163 |
$11,284 |
$10,194 |
11/30/23 |
$12,124 |
$12,270 |
$11,010 |
12/31/23 |
$12,526 |
$12,704 |
$11,440 |
1/31/24 |
$11,978 |
$12,158 |
$10,909 |
2/29/24 |
$12,537 |
$12,738 |
$11,428 |
3/31/24 |
$12,816 |
$13,022 |
$11,679 |
4/30/24 |
$12,851 |
$13,059 |
$11,764 |
5/31/24 |
$12,935 |
$13,143 |
$11,830 |
6/30/24 |
$13,463 |
$13,719 |
$12,297 |
7/31/24 |
$13,529 |
$13,804 |
$12,333 |
8/31/24 |
$13,724 |
$14,059 |
$12,532 |
9/30/24 |
$14,818 |
$15,205 |
$13,369 |
10/31/24 |
$14,274 |
$14,601 |
$12,775 |
11/30/24 |
$13,849 |
$14,130 |
$12,316 |
12/31/24 |
$13,825 |
$14,114 |
$12,299 |
1/31/25 |
$13,887 |
$14,299 |
$12,518 |
2/28/25 |
$14,222 |
$14,483 |
$12,579 |
3/31/25 |
$14,167 |
$14,431 |
$12,659 |
4/30/25 |
$14,309 |
$14,592 |
$12,825 |
5/31/25 |
$14,927 |
$15,238 |
$13,372 |
6/30/25 |
$15,806 |
$16,149 |
$14,176 |
7/31/25 |
$16,163 |
$16,506 |
$14,453 |
8/31/25 |
$16,528 |
$16,878 |
$14,638 |
9/30/25 |
$17,740 |
$18,120 |
$15,685 |
10/31/25 |
$18,276 |
$18,689 |
$16,341 |
11/30/25 |
$17,782 |
$18,191 |
$15,950 |
12/31/25 |
$18,217 |
$18,635 |
$16,427 |
1/31/26 |
$19,742 |
$20,180 |
$17,881 |
2/28/26 |
$20,523 |
$20,981 |
$18,864 |
3/31/26 |
$17,907 |
$18,267 |
$16,400 |
4/30/26 |
$20,361 |
$20,771 |
$18,812 |
5/31/26 |
$22,116 |
$22,577 |
$20,635 |
6/30/26 |
$21,834 |
$22,280 |
$20,344 |
7/31/26 |
$21,216 |
$21,685 |
$19,719 |
8/31/26 |
$21,881 |
$22,364 |
$20,383 |
|
| Average Annual Return [Table Text Block] |
|
|
Table Summary
Fund/Index |
1-Year |
5-Year |
Since Inception 12/6/18 |
Xtrackers Emerging Markets Carbon Reduction and Climate Improvers ETF - NAV |
32.39% |
8.14% |
10.65% |
Solactive ISS Emerging Markets Carbon Reduction & Climate Improvers Index NTR |
32.51% |
8.49% |
10.95% |
MSCI Emerging Markets Index |
39.25% |
8.18% |
9.63% | |
| AssetsNet |
|
|
$ 61,574,242
|
| Holdings Count | Holding |
|
|
1,531
|
| Advisory Fees Paid, Amount |
|
|
$ 80,470
|
| InvestmentCompanyPortfolioTurnover |
|
|
27.00%
|
| Additional Fund Statistics [Text Block] |
|
|
Table Summary
Net Assets ($) |
61,574,242 |
Number of Portfolio Holdings |
1,531 |
Portfolio Turnover Rate (%) |
27 |
Total Net Advisory Fees Paid ($) |
80,470 | |
| Holdings [Text Block] |
|
|
Table Summary
Sector |
% of Net Assets |
Information Technology |
37% |
Financials |
21% |
Consumer Discretionary |
9% |
Communication Services |
9% |
Industrials |
6% |
Health Care |
5% |
Materials |
5% |
Consumer Staples |
3% |
Real Estate |
2% |
Utilities |
1% |
Energy |
0% | Geographical Diversification
Table Summary
Country |
% of Net Assets |
Taiwan |
25% |
China |
23% |
South Korea |
17% |
India |
11% |
Hong Kong |
3% |
Brazil |
3% |
South Africa |
3% |
Saudi Arabia |
2% |
Mexico |
2% |
United Arab Emirates |
2% |
Other |
9% | |
| Largest Holdings [Text Block] |
|
|
Ten Largest Equity Holdings
Table Summary
Holdings |
31.0% of Net Assets |
Taiwan Semiconductor Manufacturing Co. Ltd. (Taiwan) |
9.6% |
Samsung Electronics Co. Ltd. (South Korea) |
5.4% |
Tencent Holdings Ltd. (China) |
4.3% |
SK hynix, Inc. (South Korea) |
4.2% |
Alibaba Group Holding Ltd. (Hong Kong) |
2.7% |
Delta Electronics, Inc. (Taiwan) |
1.3% |
MediaTek, Inc. (Taiwan) |
1.1% |
Hon Hai Precision Industry Co. Ltd. (Taiwan) |
1.0% |
China Construction Bank Corp. (China) |
0.7% |
ASE Technology Holding Co. Ltd. (Taiwan) |
0.7% | |
| Material Fund Change [Text Block] |
|
|
|
| Updated Prospectus Phone Number |
|
|
(844) 851-4255
|
| Updated Prospectus Web Address |
|
|
dws.com/en-us/resources/proxy-voting
|
| C000196638 |
|
|
|
| Shareholder Report [Line Items] |
|
|
|
| Fund Name |
|
|
Xtrackers MSCI EAFE Selection Equity ETF
|
| Class Name |
|
|
Xtrackers MSCI EAFE Selection Equity ETF
|
| Trading Symbol |
|
|
EASG
|
| Security Exchange Name |
|
|
NYSEArca
|
| Annual or Semi-Annual Statement [Text Block] |
|
|
This annual shareholder report contains important information about the Xtrackers MSCI EAFE Selection Equity ETF (the "Fund") for the period September 1, 2025 to August 31, 2026.
|
| Additional Information Phone Number |
|
|
(844) 851‐4255
|
| Additional Information Website |
|
|
dws.com/etfreports
|
| Expenses [Text Block] |
|
|
What were the Fund costs for the last year?(Based on a hypothetical $10,000 investment)
Table Summary
Fund |
Costs of a $10,000 investment |
Costs paid as a percentage of a $10,000 investment |
EASG |
$15 |
0.14% | Gross expense ratio as of the latest prospectus: 0.14%. See prospectus for any contractual or voluntary waivers; without a waiver, costs would have been higher. |
| Expenses Paid, Amount |
|
|
$ 15
|
| Expense Ratio, Percent |
|
|
0.14%
|
| Factors Affecting Performance [Text Block] |
|
|
How did the fund perform last year and what affected its performance?The Fund seeks investment results that correspond generally to the performance, before fees and expenses, of the MSCI EAFE Selection Index (the Underlying Index). The Underlying Index is a capitalization weighted index that provides exposure to companies with high environmental, social and governance (“ESG”) performance relative to their sector peers and consists of large- and medium-capitalization companies across developed markets countries, excluding Canada and the United States. The Fund returned 20.41% for the period ended August 31, 2026. The Fund's underlying index returned 20.40% and the Fund's broad-based index the MSCI EAFE Index returned 21.62% during the same period. The majority of sectors contributed positively to performance during the period with the greatest contribution coming from Financials, Information Technology and Industrials. The Communication Services, Consumer Discretionary and Health Care sectors detracted from performance. From a geographical perspective, the majority of countries contributed positively to performance during the period with the greatest contribution coming from Japan, the Netherlands and the United Kingdom while the United States, Denmark and Israel contributed negatively to performance. |
| Line Graph [Table Text Block] |
|
|
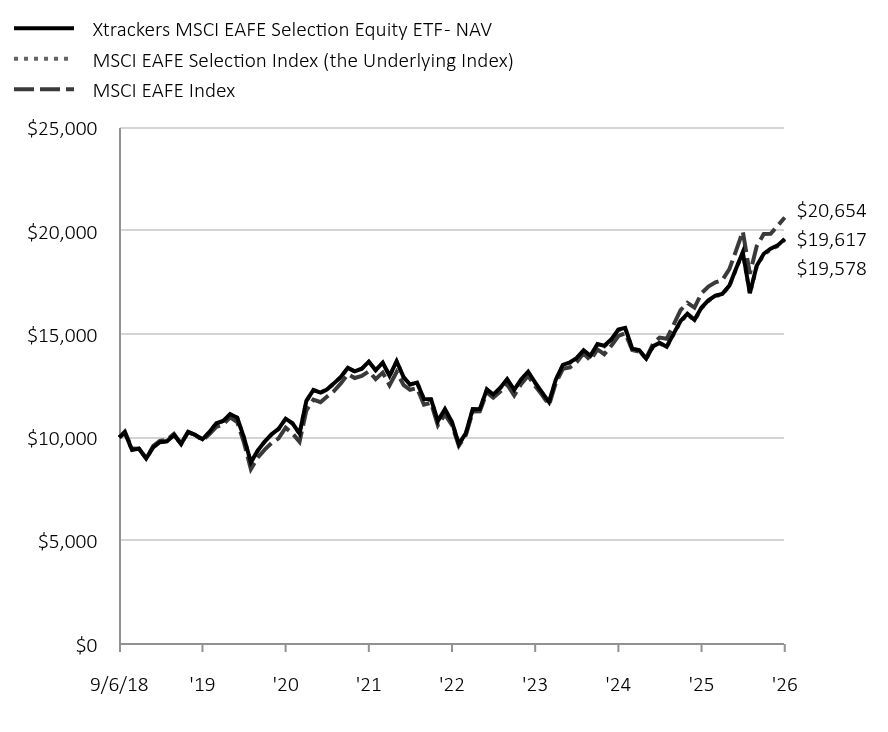
Table Summary
|
Xtrackers MSCI EAFE Selection Equity ETF - NAV |
MSCI EAFE Selection Index (the Underlying Index) |
MSCI EAFE Index |
9/6/18 |
$10,000 |
$10,000 |
$10,000 |
9/30/18 |
$10,245 |
$10,245 |
$10,287 |
10/31/18 |
$9,399 |
$9,396 |
$9,468 |
11/30/18 |
$9,461 |
$9,461 |
$9,457 |
12/31/18 |
$8,988 |
$8,984 |
$8,998 |
1/31/19 |
$9,532 |
$9,533 |
$9,589 |
2/28/19 |
$9,773 |
$9,776 |
$9,833 |
3/31/19 |
$9,817 |
$9,820 |
$9,895 |
4/30/19 |
$10,120 |
$10,113 |
$10,173 |
5/31/19 |
$9,691 |
$9,681 |
$9,685 |
6/30/19 |
$10,274 |
$10,265 |
$10,259 |
7/31/19 |
$10,121 |
$10,115 |
$10,129 |
8/31/19 |
$9,911 |
$9,905 |
$9,867 |
9/30/19 |
$10,256 |
$10,249 |
$10,149 |
10/31/19 |
$10,687 |
$10,681 |
$10,514 |
11/30/19 |
$10,797 |
$10,792 |
$10,633 |
12/31/19 |
$11,134 |
$11,130 |
$10,978 |
1/31/20 |
$10,964 |
$10,960 |
$10,749 |
2/29/20 |
$10,016 |
$10,014 |
$9,777 |
3/31/20 |
$8,799 |
$8,792 |
$8,472 |
4/30/20 |
$9,363 |
$9,355 |
$9,020 |
5/31/20 |
$9,802 |
$9,796 |
$9,412 |
6/30/20 |
$10,152 |
$10,146 |
$9,733 |
7/31/20 |
$10,413 |
$10,406 |
$9,960 |
8/31/20 |
$10,911 |
$10,903 |
$10,472 |
9/30/20 |
$10,687 |
$10,677 |
$10,200 |
10/31/20 |
$10,190 |
$10,183 |
$9,792 |
11/30/20 |
$11,774 |
$11,767 |
$11,310 |
12/31/20 |
$12,298 |
$12,293 |
$11,836 |
1/31/21 |
$12,174 |
$12,170 |
$11,710 |
2/28/21 |
$12,322 |
$12,316 |
$11,973 |
3/31/21 |
$12,620 |
$12,608 |
$12,248 |
4/30/21 |
$12,931 |
$12,917 |
$12,617 |
5/31/21 |
$13,371 |
$13,356 |
$13,069 |
6/30/21 |
$13,200 |
$13,195 |
$12,881 |
7/31/21 |
$13,331 |
$13,326 |
$12,978 |
8/31/21 |
$13,672 |
$13,669 |
$13,207 |
9/30/21 |
$13,262 |
$13,252 |
$12,824 |
10/31/21 |
$13,619 |
$13,610 |
$13,139 |
11/30/21 |
$12,987 |
$12,978 |
$12,528 |
12/31/21 |
$13,689 |
$13,681 |
$13,169 |
1/31/22 |
$12,913 |
$12,907 |
$12,533 |
2/28/22 |
$12,567 |
$12,566 |
$12,311 |
3/31/22 |
$12,654 |
$12,648 |
$12,391 |
4/30/22 |
$11,856 |
$11,846 |
$11,589 |
5/31/22 |
$11,849 |
$11,831 |
$11,676 |
6/30/22 |
$10,797 |
$10,781 |
$10,592 |
7/31/22 |
$11,372 |
$11,356 |
$11,120 |
8/31/22 |
$10,743 |
$10,731 |
$10,592 |
9/30/22 |
$9,683 |
$9,668 |
$9,601 |
10/31/22 |
$10,210 |
$10,194 |
$10,118 |
11/30/22 |
$11,376 |
$11,358 |
$11,257 |
12/31/22 |
$11,371 |
$11,356 |
$11,266 |
1/31/23 |
$12,332 |
$12,316 |
$12,178 |
2/28/23 |
$12,078 |
$12,063 |
$11,924 |
3/31/23 |
$12,409 |
$12,388 |
$12,220 |
4/30/23 |
$12,824 |
$12,803 |
$12,565 |
5/31/23 |
$12,310 |
$12,285 |
$12,033 |
6/30/23 |
$12,813 |
$12,784 |
$12,581 |
7/31/23 |
$13,184 |
$13,155 |
$12,988 |
8/31/23 |
$12,657 |
$12,629 |
$12,490 |
9/30/23 |
$12,183 |
$12,156 |
$12,064 |
10/31/23 |
$11,713 |
$11,686 |
$11,575 |
11/30/23 |
$12,814 |
$12,787 |
$12,649 |
12/31/23 |
$13,521 |
$13,494 |
$13,321 |
1/31/24 |
$13,642 |
$13,614 |
$13,398 |
2/29/24 |
$13,839 |
$13,812 |
$13,643 |
3/31/24 |
$14,219 |
$14,187 |
$14,076 |
4/30/24 |
$13,952 |
$13,917 |
$13,731 |
5/31/24 |
$14,527 |
$14,493 |
$14,262 |
6/30/24 |
$14,439 |
$14,407 |
$14,032 |
7/31/24 |
$14,752 |
$14,719 |
$14,444 |
8/31/24 |
$15,230 |
$15,199 |
$14,914 |
9/30/24 |
$15,310 |
$15,278 |
$15,051 |
10/31/24 |
$14,300 |
$14,272 |
$14,233 |
11/30/24 |
$14,235 |
$14,210 |
$14,152 |
12/31/24 |
$13,821 |
$13,797 |
$13,830 |
1/31/25 |
$14,425 |
$14,400 |
$14,557 |
2/28/25 |
$14,582 |
$14,557 |
$14,839 |
3/31/25 |
$14,395 |
$14,363 |
$14,779 |
4/30/25 |
$15,019 |
$14,982 |
$15,456 |
5/31/25 |
$15,642 |
$15,603 |
$16,164 |
6/30/25 |
$15,989 |
$15,952 |
$16,520 |
7/31/25 |
$15,695 |
$15,662 |
$16,288 |
8/31/25 |
$16,291 |
$16,260 |
$16,982 |
9/30/25 |
$16,641 |
$16,608 |
$17,307 |
10/31/25 |
$16,873 |
$16,842 |
$17,511 |
11/30/25 |
$16,953 |
$16,926 |
$17,620 |
12/31/25 |
$17,353 |
$17,324 |
$18,148 |
1/31/26 |
$18,221 |
$18,195 |
$19,095 |
2/28/26 |
$18,974 |
$18,945 |
$19,979 |
3/31/26 |
$16,983 |
$16,951 |
$17,923 |
4/30/26 |
$18,313 |
$18,274 |
$19,258 |
5/31/26 |
$18,896 |
$18,853 |
$19,849 |
6/30/26 |
$19,142 |
$19,098 |
$19,862 |
7/31/26 |
$19,303 |
$19,262 |
$20,251 |
8/31/26 |
$19,617 |
$19,578 |
$20,654 |
|
| Average Annual Return [Table Text Block] |
|
|
Table Summary
Fund/Index |
1-Year |
5-Year |
Since Inception 9/6/18 |
Xtrackers MSCI EAFE Selection Equity ETF - NAV |
20.41% |
7.49% |
8.80% |
MSCI EAFE Selection Index |
20.40% |
7.45% |
8.77% |
MSCI EAFE Index |
21.62% |
9.35% |
9.50% | |
| Material Change Date |
|
Sep. 01, 2025
|
|
| AssetsNet |
|
|
$ 68,724,099
|
| Holdings Count | Holding |
|
|
349
|
| Advisory Fees Paid, Amount |
|
|
$ 91,696
|
| InvestmentCompanyPortfolioTurnover |
|
|
15.00%
|
| Additional Fund Statistics [Text Block] |
|
|
Table Summary
Net Assets ($) |
68,724,099 |
Number of Portfolio Holdings |
349 |
Portfolio Turnover Rate (%) |
15 |
Total Net Advisory Fees Paid ($) |
91,696 | |
| Holdings [Text Block] |
|
|
Table Summary
Sector |
% of Net Assets |
Financials |
26% |
Industrials |
19% |
Information Technology |
11% |
Health Care |
10% |
Consumer Discretionary |
8% |
Consumer Staples |
6% |
Materials |
6% |
Communication Services |
4% |
Utilities |
4% |
Energy |
3% |
Real Estate |
1% | Geographical Diversification
Table Summary
Country |
% of Net Assets |
Japan |
25% |
United Kingdom |
14% |
France |
12% |
Switzerland |
9% |
Netherlands |
9% |
Australia |
6% |
Germany |
5% |
Sweden |
4% |
Spain |
3% |
Denmark |
3% |
Hong Kong |
2% |
Other |
5% | |
| Largest Holdings [Text Block] |
|
|
Ten Largest Equity Holdings
Table Summary
Holdings |
22.4% of Net Assets |
ASML Holding NV (Netherlands) |
5.7% |
HSBC Holdings PLC (United Kingdom) |
3.0% |
Novartis AG (Switzerland) |
2.4% |
AstraZeneca PLC (United Kingdom) |
2.1% |
Allianz SE (Germany) |
1.7% |
Commonwealth Bank of Australia (Australia) |
1.7% |
Schneider Electric SE (France) |
1.6% |
TotalEnergies SE (France) |
1.5% |
Sumitomo Mitsui Financial Group, Inc. (Japan) |
1.4% |
Tokyo Electron Ltd. (Japan) |
1.3% | |
| Material Fund Change [Text Block] |
|
|
This is a summary of certain changes of the Fund since September 1, 2025. For more information, review the Fund's current prospectus at dws.com/etfreports, or by calling (844) 851-4255. Effective September 14, 2026 the Fund changed its name from Xtrackers MSCI EAFE Selection Equity ETF to Xtrackers Bloomberg Developed Markets ex US Equity ETF, and its ticker symbol changed from EASG to DMXU. In addition, the Fund's underlying index changed from the MSCI EAFE Selection Index to the Bloomberg Developed Markets ex US Core Markets Index. In addition, to be consistent with the repurposed Fund’s new name, one of the Fund’s 80% investment policy was changed to the following: “Under normal circumstances, the Fund will invest at least 80% of its net assets, plus the amount of any borrowings for investment purposes, in equity securities of issuers from developed markets countries other than the United States as determined in accordance with the Underlying Index’s methodology." Also, effective September 14, 2026 the Fund's unitary advisory fee was reduced from 0.14% to 0.03% of the Fund's average daily net assets. |
| Material Fund Change Name [Text Block] |
|
|
Effective September 14, 2026 the Fund changed its name from Xtrackers MSCI EAFE Selection Equity ETF to Xtrackers Bloomberg Developed Markets ex US Equity ETF, and its ticker symbol changed from EASG to DMXU. In addition, the Fund's underlying index changed from the MSCI EAFE Selection Index to the Bloomberg Developed Markets ex US Core Markets Index. In addition, to be consistent with the repurposed Fund’s new name, one of the Fund’s 80% investment policy was changed to the following: “Under normal circumstances, the Fund will invest at least 80% of its net assets, plus the amount of any borrowings for investment purposes, in equity securities of issuers from developed markets countries other than the United States as determined in accordance with the Underlying Index’s methodology." Also, effective September 14, 2026 the Fund's unitary advisory fee was reduced from 0.14% to 0.03% of the Fund's average daily net assets.
|
| Updated Prospectus Phone Number |
|
|
(844) 851-4255
|
| Updated Prospectus Web Address |
|
|
dws.com/en-us/resources/proxy-voting
|
| C000196637 |
|
|
|
| Shareholder Report [Line Items] |
|
|
|
| Fund Name |
|
|
Xtrackers MSCI Emerging Markets Select ETF
|
| Class Name |
|
|
Xtrackers MSCI Emerging Markets Select ETF
|
| Trading Symbol |
|
|
EMCS
|
| Security Exchange Name |
|
|
NYSEArca
|
| Annual or Semi-Annual Statement [Text Block] |
|
|
This annual shareholder report contains important information about the Xtrackers MSCI Emerging Markets Select ETF (formerly Xtrackers MSCI Emerging Markets Climate Selection ETF) (the "Fund") for the period September 1, 2025 to August 31, 2026.
|
| Additional Information Phone Number |
|
|
(844) 851‐4255
|
| Additional Information Website |
|
|
dws.com/etfreports
|
| Expenses [Text Block] |
|
|
What were the Fund costs for the last year?(Based on a hypothetical $10,000 investment)
Table Summary
Fund |
Costs of a $10,000 investment |
Costs paid as a percentage of a $10,000 investment |
EMCS |
$19 |
0.15% | Gross expense ratio as of the latest prospectus: 0.15%. See prospectus for any contractual or voluntary waivers; without a waiver, costs would have been higher. |
| Expenses Paid, Amount |
|
|
$ 19
|
| Expense Ratio, Percent |
|
|
0.15%
|
| Factors Affecting Performance [Text Block] |
|
|
How did the fund perform last year and what affected its performance?The Fund seeks investment results that correspond generally to the performance, before fees and expenses, of the MSCI Global Select 500 - Emerging Markets Subset Index (the Underlying Index). The Underlying Index consists of large- and medium-capitalization companies across emerging markets countries that meet certain environmental, social and governance ("ESG") criteria, as defined by the index provider. The Fund returned 48.60% for the period ended August 31, 2026. The Fund's underlying index returned 49.09% and the Fund's broad-based index the MSCI Emerging Markets Index returned 39.25% during the same period. The majority of sectors contributed positively to performance during the period with the greatest contribution coming from Information Technology, Financials and Materials. Consumer Discretionary, Communication Services and Energy sectors detracted from performance. From a geographical perspective, the majority of countries contributed positively to performance during the period with the greatest contribution coming from Taiwan, Korea and the United States. Hong Kong, India and Russia contributed negatively to performance. |
| Line Graph [Table Text Block] |
|
|
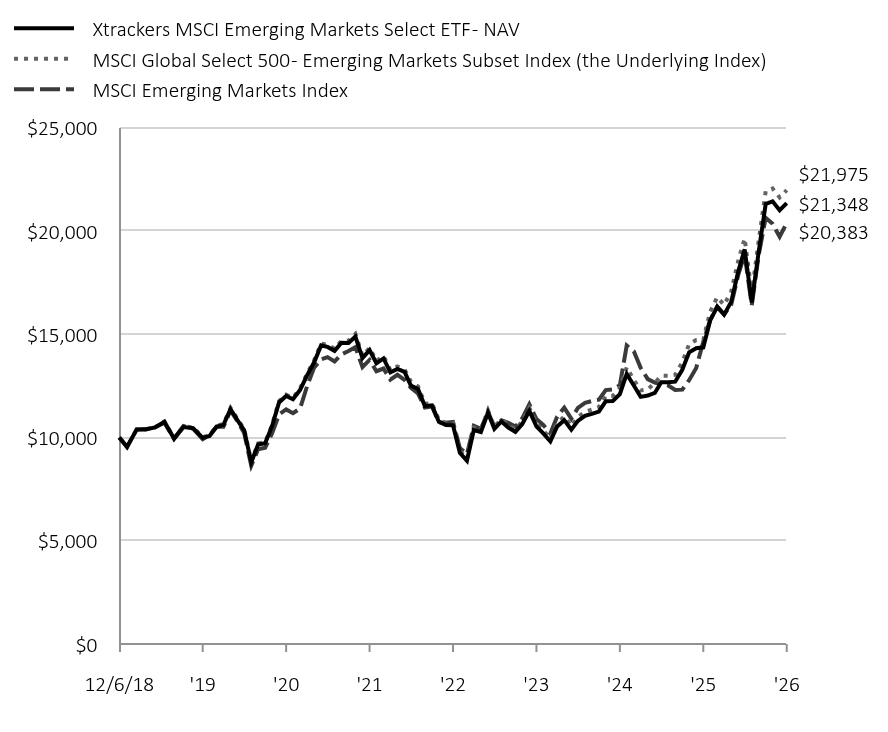
Table Summary
|
Xtrackers MSCI Emerging Markets Select ETF - NAV |
MSCI Global Select 500 - Emerging Markets Subset Index (the Underlying Index) |
MSCI Emerging Markets Index |
12/6/18 |
$10,000 |
$10,000 |
$10,000 |
12/31/18 |
$9,543 |
$9,542 |
$9,546 |
1/31/19 |
$10,391 |
$10,390 |
$10,383 |
2/28/19 |
$10,386 |
$10,384 |
$10,406 |
3/31/19 |
$10,487 |
$10,494 |
$10,494 |
4/30/19 |
$10,756 |
$10,768 |
$10,715 |
5/31/19 |
$9,945 |
$9,969 |
$9,937 |
6/30/19 |
$10,501 |
$10,533 |
$10,557 |
7/31/19 |
$10,452 |
$10,491 |
$10,428 |
8/31/19 |
$9,983 |
$10,018 |
$9,920 |
9/30/19 |
$10,070 |
$10,107 |
$10,109 |
10/31/19 |
$10,522 |
$10,565 |
$10,535 |
11/30/19 |
$10,608 |
$10,660 |
$10,521 |
12/31/19 |
$11,367 |
$11,427 |
$11,306 |
1/31/20 |
$10,827 |
$10,893 |
$10,779 |
2/29/20 |
$10,343 |
$10,395 |
$10,210 |
3/31/20 |
$8,797 |
$8,839 |
$8,638 |
4/30/20 |
$9,664 |
$9,712 |
$9,429 |
5/31/20 |
$9,726 |
$9,771 |
$9,501 |
6/30/20 |
$10,546 |
$10,598 |
$10,200 |
7/31/20 |
$11,695 |
$11,759 |
$11,111 |
8/31/20 |
$12,009 |
$12,076 |
$11,357 |
9/30/20 |
$11,851 |
$11,918 |
$11,174 |
10/31/20 |
$12,296 |
$12,372 |
$11,405 |
11/30/20 |
$12,999 |
$13,078 |
$12,459 |
12/31/20 |
$13,629 |
$13,723 |
$13,375 |
1/31/21 |
$14,457 |
$14,551 |
$13,785 |
2/28/21 |
$14,386 |
$14,490 |
$13,891 |
3/31/21 |
$14,195 |
$14,295 |
$13,681 |
4/30/21 |
$14,586 |
$14,688 |
$14,022 |
5/31/21 |
$14,576 |
$14,683 |
$14,183 |
6/30/21 |
$14,889 |
$15,009 |
$14,372 |
7/31/21 |
$13,847 |
$13,956 |
$13,404 |
8/31/21 |
$14,230 |
$14,340 |
$13,755 |
9/30/21 |
$13,586 |
$13,709 |
$13,209 |
10/31/21 |
$13,827 |
$13,948 |
$13,339 |
11/30/21 |
$13,152 |
$13,262 |
$12,795 |
12/31/21 |
$13,321 |
$13,440 |
$13,035 |
1/31/22 |
$13,180 |
$13,292 |
$12,789 |
2/28/22 |
$12,508 |
$12,704 |
$12,406 |
3/31/22 |
$12,353 |
$12,472 |
$12,126 |
4/30/22 |
$11,523 |
$11,638 |
$11,452 |
5/31/22 |
$11,558 |
$11,659 |
$11,502 |
6/30/22 |
$10,764 |
$10,853 |
$10,738 |
7/31/22 |
$10,607 |
$10,706 |
$10,711 |
8/31/22 |
$10,595 |
$10,714 |
$10,756 |
9/30/22 |
$9,263 |
$9,356 |
$9,495 |
10/31/22 |
$8,871 |
$8,967 |
$9,200 |
11/30/22 |
$10,359 |
$10,482 |
$10,565 |
12/31/22 |
$10,260 |
$10,376 |
$10,416 |
1/31/23 |
$11,198 |
$11,313 |
$11,239 |
2/28/23 |
$10,413 |
$10,522 |
$10,510 |
3/31/23 |
$10,777 |
$10,891 |
$10,829 |
4/30/23 |
$10,481 |
$10,591 |
$10,706 |
5/31/23 |
$10,273 |
$10,398 |
$10,526 |
6/30/23 |
$10,652 |
$10,785 |
$10,926 |
7/31/23 |
$11,283 |
$11,429 |
$11,606 |
8/31/23 |
$10,539 |
$10,682 |
$10,891 |
9/30/23 |
$10,194 |
$10,335 |
$10,606 |
10/31/23 |
$9,814 |
$9,948 |
$10,194 |
11/30/23 |
$10,530 |
$10,686 |
$11,010 |
12/31/23 |
$10,838 |
$11,015 |
$11,440 |
1/31/24 |
$10,374 |
$10,549 |
$10,909 |
2/29/24 |
$10,804 |
$10,995 |
$11,428 |
3/31/24 |
$11,043 |
$11,239 |
$11,679 |
4/30/24 |
$11,140 |
$11,346 |
$11,764 |
5/31/24 |
$11,257 |
$11,473 |
$11,830 |
6/30/24 |
$11,752 |
$11,995 |
$12,297 |
7/31/24 |
$11,767 |
$12,016 |
$12,333 |
8/31/24 |
$12,093 |
$12,376 |
$12,532 |
9/30/24 |
$13,076 |
$13,400 |
$14,453 |
10/31/24 |
$12,516 |
$12,784 |
$14,176 |
11/30/24 |
$11,967 |
$12,277 |
$13,372 |
12/31/24 |
$12,032 |
$12,328 |
$12,825 |
1/31/25 |
$12,158 |
$12,642 |
$12,659 |
2/28/25 |
$12,679 |
$12,994 |
$12,579 |
3/31/25 |
$12,679 |
$12,992 |
$12,518 |
4/30/25 |
$12,703 |
$13,038 |
$12,299 |
5/31/25 |
$13,278 |
$13,640 |
$12,316 |
6/30/25 |
$14,121 |
$14,521 |
$12,775 |
7/31/25 |
$14,325 |
$14,716 |
$13,369 |
8/31/25 |
$14,366 |
$14,726 |
$14,638 |
9/30/25 |
$15,668 |
$16,085 |
$15,685 |
10/31/25 |
$16,327 |
$16,794 |
$16,341 |
11/30/25 |
$15,947 |
$16,417 |
$15,950 |
12/31/25 |
$16,567 |
$17,060 |
$16,427 |
1/31/26 |
$18,043 |
$18,560 |
$17,881 |
2/28/26 |
$19,107 |
$19,640 |
$18,864 |
3/31/26 |
$16,532 |
$16,992 |
$16,400 |
4/30/26 |
$18,974 |
$19,504 |
$18,812 |
5/31/26 |
$21,308 |
$21,920 |
$20,635 |
6/30/26 |
$21,436 |
$22,060 |
$20,344 |
7/31/26 |
$21,003 |
$21,624 |
$19,719 |
8/31/26 |
$21,348 |
$21,975 |
$20,383 |
|
| Average Annual Return [Table Text Block] |
|
|
Table Summary
Fund/Index |
1-Year |
5-Year |
Since Inception 12/6/18 |
Xtrackers MSCI Emerging Markets Select ETF - NAV |
48.60% |
8.45% |
10.29% |
MSCI Global Select 500 - Emerging Markets Subset Index |
49.09% |
8.89% |
10.70% |
MSCI Emerging Markets Index |
39.25% |
8.18% |
9.63% | |
| Material Change Date |
|
Sep. 01, 2025
|
|
| AssetsNet |
|
|
$ 1,027,891,918
|
| Holdings Count | Holding |
|
|
66
|
| Advisory Fees Paid, Amount |
|
|
$ 1,264,179
|
| InvestmentCompanyPortfolioTurnover |
|
|
57.00%
|
| Additional Fund Statistics [Text Block] |
|
|
Table Summary
Net Assets ($) |
1,027,891,918 |
Number of Portfolio Holdings |
66 |
Portfolio Turnover Rate (%) |
57 |
Total Net Advisory Fees Paid ($) |
1,264,179 | |
| Holdings [Text Block] |
|
|
Table Summary
Sector |
% of Net Assets |
Information Technology |
45% |
Financials |
31% |
Consumer Discretionary |
8% |
Communication Services |
8% |
Materials |
3% |
Real Estate |
2% |
Industrials |
1% |
Energy |
1% | Geographical Diversification
Table Summary
Country |
% of Net Assets |
Taiwan |
39% |
South Korea |
22% |
China |
14% |
India |
7% |
Brazil |
4% |
United States |
3% |
Hong Kong |
3% |
Mexico |
2% |
Other |
5% | |
| Largest Holdings [Text Block] |
|
|
Ten Largest Equity Holdings
Table Summary
Holdings |
53.1% of Net Assets |
Taiwan Semiconductor Manufacturing Co. Ltd. (Taiwan) |
19.4% |
Samsung Electronics Co. Ltd. (South Korea) |
10.3% |
SK hynix, Inc. (South Korea) |
7.3% |
Tencent Holdings Ltd. (China) |
4.7% |
Alibaba Group Holding Ltd. (Hong Kong) |
2.8% |
MediaTek, Inc. (Taiwan) |
2.2% |
Delta Electronics, Inc. (Taiwan) |
1.7% |
Southern Copper Corp. (United States) |
1.6% |
China Construction Bank Corp. (China) |
1.6% |
HDFC Bank Ltd. (India) |
1.5% | |
| Material Fund Change [Text Block] |
|
|
This is a summary of certain changes of the Fund since September 1, 2025. For more information, review the Fund's current prospectus at dws.com/etfreports, or by calling (844) 851-4255. Effective June 1, 2026, the Fund changed its name from Xtrackers MSCI Emerging Markets Climate Selection ETF to Xtrackers MSCI Emerging Markets Select ETF. In addition, the Fund's underlying index changed its name from MSCI Global Climate 500 Emerging Markets Selection Index to the MSCI Global Select 500 - Emerging Markets Subset Index, resulting from changes to the screening methodology of the Underlying Index’s parent index, the MSCI ACWI Select Climate 500 Index. |
| Summary of Change Legend [Text Block] |
|
|
This is a summary of certain changes of the Fund since September 1, 2025.
|
| Updated Prospectus Phone Number |
|
|
(844) 851-4255
|
| Updated Prospectus Web Address |
|
|
dws.com/en-us/resources/proxy-voting
|
| C000241385 |
|
|
|
| Shareholder Report [Line Items] |
|
|
|
| Fund Name |
|
|
Xtrackers MSCI USA Climate Action Equity ETF
|
| Class Name |
|
|
Xtrackers MSCI USA Climate Action Equity ETF
|
| Trading Symbol |
|
|
USCA
|
| Security Exchange Name |
|
|
NYSEArca
|
| Annual or Semi-Annual Statement [Text Block] |
|
|
This annual shareholder report contains important information about the Xtrackers MSCI USA Climate Action Equity ETF (the "Fund") for the period September 1, 2025 to August 31, 2026.
|
| Additional Information [Text Block] |
|
|
You can find additional information about the Fund at dws.com/etfreports. You can also request this information by contacting us at (844) 851‐4255.
|
| Additional Information Phone Number |
|
|
(844) 851‐4255
|
| Additional Information Website |
|
|
dws.com/etfreports
|
| Expenses [Text Block] |
|
|
What were the Fund costs for the last year?(Based on a hypothetical $10,000 investment)
Table Summary
Fund |
Costs of a $10,000 investment |
Costs paid as a percentage of a $10,000 investment |
USCA |
$8 |
0.07% | Gross expense ratio as of the latest prospectus: 0.07%. See prospectus for any contractual or voluntary waivers; without a waiver, costs would have been higher. |
| Expenses Paid, Amount |
|
|
$ 8
|
| Expense Ratio, Percent |
|
|
0.07%
|
| Factors Affecting Performance [Text Block] |
|
|
How did the fund perform last year and what affected its performance?The Fund seeks investment results that correspond generally to the performance, before fees and expenses, of the MSCI USA Climate Action Index (the Underlying Index) which is comprised of large and mid-capitalization companies in the United States that the Underlying Index’s methodology assesses as leading their sector peers in taking action relating to a climate transition. The Fund returned 15.02% for the period ended August 31, 2026. The Fund's underlying index returned 15.08% and the Fund's broad-based index the MSCI USA Index returned 20.02% during the same period. All sectors contributed positively to performance during the period with the greatest contribution coming from Information Technology, Health Care and Communication Services. |
| Average Annual Return [Table Text Block] |
|
|
Table Summary
Fund/Index |
1-Year |
Since Inception 4/4/23 |
Xtrackers MSCI USA Climate Action Equity ETF - NAV |
15.02% |
20.71% |
MSCI USA Climate Action Index |
15.08% |
20.77% |
MSCI USA Index |
20.02% |
21.75% | Average Annual Total Returns Performance shown is historical. The Fund's past performance is not a good predictor or guarantee of the Fund's future performance. Investment returns and principal value of an investment will fluctuate so that an investor's shares, when redeemed, may be worth more or less than their original cost. Current performance may be lower or higher than the performance data quoted. The performance graph and returns table do not reflect the deduction of taxes that a shareholder would pay on Fund distributions or the sale of Fund shares. Shares are bought and sold at market price (closing price) not net asset value (NAV) and are not individually redeemed from the Fund. To obtain the most recent month-end performance data visit etf.dws.com/en-us/etf-products or call (844) 851-4255. |
| AssetsNet |
|
|
$ 3,520,741,192
|
| Holdings Count | Holding |
|
|
392
|
| Advisory Fees Paid, Amount |
|
|
$ 2,169,341
|
| InvestmentCompanyPortfolioTurnover |
|
|
35.00%
|
| Additional Fund Statistics [Text Block] |
|
|
Table Summary
Net Assets ($) |
3,520,741,192 |
Number of Portfolio Holdings |
392 |
Portfolio Turnover Rate (%) |
35 |
Total Net Advisory Fees Paid ($) |
2,169,341 | |
| Largest Holdings [Text Block] |
|
|
Ten Largest Equity Holdings
Table Summary
Holdings |
46.2% of Net Assets |
NVIDIA Corp. |
9.4% |
Apple, Inc. |
8.6% |
Microsoft Corp. |
6.6% |
Alphabet, Inc. |
6.6% |
Amazon.com, Inc. |
4.6% |
Broadcom, Inc. |
3.1% |
Meta Platforms, Inc. |
2.3% |
Tesla, Inc. |
1.9% |
Eli Lilly & Co. |
1.7% |
Advanced Micro Devices, Inc. |
1.4% | |
| Updated Prospectus Phone Number |
|
|
(844) 851-4255
|
| Updated Prospectus Web Address |
|
|
dws.com/en-us/resources/proxy-voting
|
| C000210444 |
|
|
|
| Shareholder Report [Line Items] |
|
|
|
| Fund Name |
|
|
Xtrackers MSCI USA Selection Equity ETF
|
| Class Name |
|
|
Xtrackers MSCI USA Selection Equity ETF
|
| Trading Symbol |
|
|
USSG
|
| Security Exchange Name |
|
|
NYSEArca
|
| Annual or Semi-Annual Statement [Text Block] |
|
|
This annual shareholder report contains important information about the Xtrackers MSCI USA Selection Equity ETF (the "Fund") for the period September 1, 2025 to August 31, 2026.
|
| Additional Information Phone Number |
|
|
(844) 851‐4255
|
| Additional Information Website |
|
|
dws.com/etfreports
|
| Expenses [Text Block] |
|
|
What were the Fund costs for the last year?(Based on a hypothetical $10,000 investment)
Table Summary
Fund |
Costs of a $10,000 investment |
Costs paid as a percentage of a $10,000 investment |
USSG |
$10 |
0.09% | Gross expense ratio as of the latest prospectus: 0.09%. See prospectus for any contractual or voluntary waivers; without a waiver, costs would have been higher. |
| Expenses Paid, Amount |
|
|
$ 10
|
| Expense Ratio, Percent |
|
|
0.09%
|
| Factors Affecting Performance [Text Block] |
|
|
How did the fund perform last year and what affected its performance?The Fund seeks investment results that correspond generally to the performance, before fees and expenses, of the MSCI USA Selection Index (the Underlying Index). The Underlying Index is a capitalization weighted index that provides exposure to companies with high environmental, social and governance (“ESG”) performance relative to their sector peers and consists of large- and medium-capitalization companies in the U.S. market. The Fund returned 23.03% for the period ended August 31, 2026. The Fund's underlying index returned 23.17% and the Fund's broad-based index the MSCI USA Index returned 20.02% during the same period. The majority of sectors contributed positively to performance during the period with the greatest contribution coming from Information Technology, Communication Services and Health Care. Consumer Discretionary is the only sector that detracted from the performance. |
| Average Annual Return [Table Text Block] |
|
|
Table Summary
Fund/Index |
1-Year |
5-Year |
Since Inception 3/7/19 |
Xtrackers MSCI USA Selection Equity ETF - NAV |
23.03% |
12.94% |
16.77% |
MSCI USA Selection Index |
23.17% |
13.04% |
16.86% |
MSCI USA Index |
20.02% |
12.32% |
16.34% | Average Annual Total Returns Performance shown is historical. The Fund's past performance is not a good predictor or guarantee of the Fund's future performance. Investment returns and principal value of an investment will fluctuate so that an investor's shares, when redeemed, may be worth more or less than their original cost. Current performance may be lower or higher than the performance data quoted. The performance graph and returns table do not reflect the deduction of taxes that a shareholder would pay on Fund distributions or the sale of Fund shares. Shares are bought and sold at market price (closing price) not net asset value (NAV) and are not individually redeemed from the Fund. To obtain the most recent month-end performance data visit etf.dws.com/en-us/etf-products or call (844) 851-4255. |
| AssetsNet |
|
|
$ 590,838,849
|
| Holdings Count | Holding |
|
|
252
|
| Advisory Fees Paid, Amount |
|
|
$ 487,132
|
| InvestmentCompanyPortfolioTurnover |
|
|
7.00%
|
| Additional Fund Statistics [Text Block] |
|
|
Table Summary
Net Assets ($) |
590,838,849 |
Number of Portfolio Holdings |
252 |
Portfolio Turnover Rate (%) |
7 |
Total Net Advisory Fees Paid ($) |
487,132 | |
| Largest Holdings [Text Block] |
|
|
Ten Largest Equity Holdings
Table Summary
Holdings |
48.9% of Net Assets |
NVIDIA Corp. |
14.5% |
Microsoft Corp. |
10.2% |
Alphabet, Inc. |
10.2% |
Tesla, Inc. |
3.0% |
Eli Lilly & Co. |
2.6% |
Advanced Micro Devices, Inc. |
2.2% |
Johnson & Johnson |
1.8% |
Visa, Inc. |
1.8% |
Mastercard, Inc. |
1.4% |
Costco Wholesale Corp. |
1.2% | |
| Updated Prospectus Phone Number |
|
|
(844) 851-4255
|
| Updated Prospectus Web Address |
|
|
dws.com/en-us/resources/proxy-voting
|
| C000236536 |
|
|
|
| Shareholder Report [Line Items] |
|
|
|
| Fund Name |
|
|
Xtrackers Net Zero Pathway Paris Aligned US Equity ETF
|
| Class Name |
|
|
Xtrackers Net Zero Pathway Paris Aligned US Equity ETF
|
| Trading Symbol |
|
|
USNZ
|
| Security Exchange Name |
|
|
NYSEArca
|
| Annual or Semi-Annual Statement [Text Block] |
|
|
This annual shareholder report contains important information about the Xtrackers Net Zero Pathway Paris Aligned US Equity ETF (the "Fund") for the period September 1, 2025 to August 31, 2026.
|
| Additional Information [Text Block] |
|
|
You can find additional information about the Fund at dws.com/etfreports. You can also request this information by contacting us at (844) 851‐4255.
|
| Additional Information Phone Number |
|
|
(844) 851‐4255
|
| Additional Information Website |
|
|
dws.com/etfreports
|
| Expenses [Text Block] |
|
|
What were the Fund costs for the last year?(Based on a hypothetical $10,000 investment)
Table Summary
Fund |
Costs of a $10,000 investment |
Costs paid as a percentage of a $10,000 investment |
USNZ |
$11 |
0.10% | Gross expense ratio as of the latest prospectus: 0.10%. See prospectus for any contractual or voluntary waivers; without a waiver, costs would have been higher. |
| Expenses Paid, Amount |
|
|
$ 11
|
| Expense Ratio, Percent |
|
|
0.10%
|
| Factors Affecting Performance [Text Block] |
|
|
How did the fund perform last year and what affected its performance?The Fund seeks investment results that correspond generally to the performance, before fees and expenses, of the Solactive ISS ESG United States Net Zero Pathway Enhanced PAB Index (the Underlying Index), which is comprised of large and mid-capitalization companies in the United States that meet certain environmental, social and governance (“ ESG “) criteria. The constituents of the Underlying Index are weighted in such a manner seeking to comply with the European Union Paris-aligned Benchmark standards, while incorporating recommendations of the Net Zero Investment Framework published, from time to time, by the Institutional Investors Group on Climate Change. The Fund returned 20.54% for the period ended August 31, 2026. The Fund's underlying index returned 20.65% and the Fund's broad-based index the S&P 500® Index returned 20.38% during the same period. All sectors contributed positively to performance during the period with the greatest contribution coming from Information Technology, Health Care and Financials. |
| Average Annual Return [Table Text Block] |
|
|
Table Summary
Fund/Index |
1-Year |
Since Inception 6/28/22 |
Xtrackers Net Zero Pathway Paris Aligned US Equity ETF - NAV |
20.54% |
18.66% |
Solactive ISS ESG United States Net Zero Pathway Enhanced PAB Index |
20.65% |
18.75% |
S&P 500® Index |
20.38% |
19.30% | Average Annual Total Returns Performance shown is historical. The Fund's past performance is not a good predictor or guarantee of the Fund's future performance. Investment returns and principal value of an investment will fluctuate so that an investor's shares, when redeemed, may be worth more or less than their original cost. Current performance may be lower or higher than the performance data quoted. The performance graph and returns table do not reflect the deduction of taxes that a shareholder would pay on Fund distributions or the sale of Fund shares. Shares are bought and sold at market price (closing price) not net asset value (NAV) and are not individually redeemed from the Fund. To obtain the most recent month-end performance data visit etf.dws.com/en-us/etf-products or call (844) 851-4255. |
| AssetsNet |
|
|
$ 299,394,906
|
| Holdings Count | Holding |
|
|
298
|
| Advisory Fees Paid, Amount |
|
|
$ 281,714
|
| InvestmentCompanyPortfolioTurnover |
|
|
8.00%
|
| Additional Fund Statistics [Text Block] |
|
|
Table Summary
Net Assets ($) |
299,394,906 |
Number of Portfolio Holdings |
298 |
Portfolio Turnover Rate (%) |
8 |
Total Net Advisory Fees Paid ($) |
281,714 | |
| Largest Holdings [Text Block] |
|
|
Ten Largest Equity Holdings
Table Summary
Holdings |
46.0% of Net Assets |
NVIDIA Corp. |
9.8% |
Apple, Inc. |
8.6% |
Microsoft Corp. |
6.8% |
Alphabet, Inc. |
6.5% |
Amazon.com, Inc. |
4.0% |
Broadcom, Inc. |
3.0% |
Meta Platforms, Inc. |
2.1% |
Tesla, Inc. |
1.8% |
Micron Technology, Inc. |
1.8% |
Eli Lilly & Co. |
1.6% | |
| Updated Prospectus Phone Number |
|
|
(844) 851-4255
|
| Updated Prospectus Web Address |
|
|
dws.com/en-us/resources/proxy-voting
|
| C000247939 |
|
|
|
| Shareholder Report [Line Items] |
|
|
|
| Fund Name |
|
|
Xtrackers RREEF Global Natural Resources ETF
|
| Class Name |
|
|
Xtrackers RREEF Global Natural Resources ETF
|
| Trading Symbol |
|
|
NRES
|
| Security Exchange Name |
|
|
NASDAQ
|
| Annual or Semi-Annual Statement [Text Block] |
|
|
This annual shareholder report contains important information about the Xtrackers RREEF Global Natural Resources ETF (the "Fund") for the period September 1, 2025 to August 31, 2026.
|
| Additional Information [Text Block] |
|
|
You can find additional information about the Fund at dws.com/etfreports. You can also request this information by contacting us at (844) 851‐4255.
|
| Additional Information Phone Number |
|
|
(844) 851‐4255
|
| Additional Information Website |
|
|
dws.com/etfreports
|
| Expenses [Text Block] |
|
|
What were the Fund costs for the last year?(Based on a hypothetical $10,000 investment)
Table Summary
Fund |
Costs of a $10,000 investment |
Costs paid as a percentage of a $10,000 investment |
NRES |
$53 |
0.45% | Gross expense ratio as of the latest prospectus: 0.45%. See prospectus for any contractual or voluntary waivers; without a waiver, costs would have been higher. |
| Expenses Paid, Amount |
|
|
$ 53
|
| Expense Ratio, Percent |
|
|
0.45%
|
| Factors Affecting Performance [Text Block] |
|
|
How did the fund perform last year and what affected its performance?The Fund seeks total return from both capital appreciation and current income. The Fund is an actively-managed exchange-traded fund (“ETF”) that does not seek to replicate the performance of a specific index. Under normal circumstances, the Fund will invest at least 80% of its net assets, plus the amount of any borrowings for investment purposes, in securities of companies in the natural resources sector. The Fund returned 36.73% for the period ended August 31, 2026. The Fund's broad-based index, the MSCI World Index, returned 20.37% for the same period, while the Fund's additional, more narrowly based index, S&P Global Natural Resources Net TR index returned 38.00%. The majority of sectors contributed positively to performance during the period with the greatest contribution coming from the Gold, Integrated Oil & Gas and Diversified Metals & Mining sectors. Paper Products, Forest Products and Specialty Chemicals sectors detracted from performance. From a geographical perspective, the majority of countries contributed positively to performance during the period with the greatest contribution coming from the United States, Canada and the United Kingdom while Switzerland, Sweden and Finland contributed negatively to performance. |
| Line Graph [Table Text Block] |
|
|
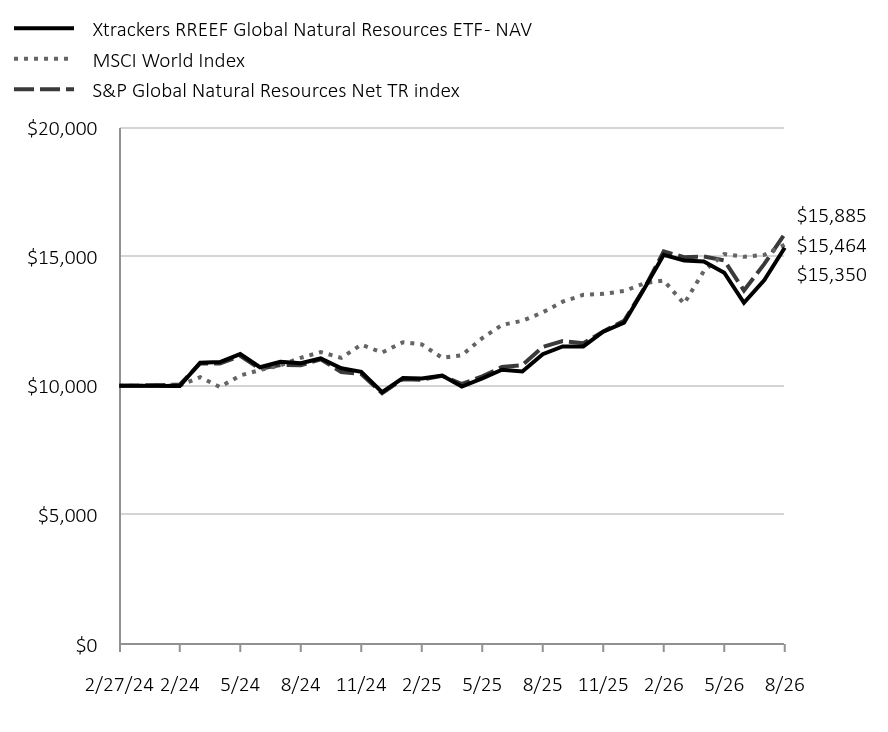
Table Summary
|
Xtrackers RREEF Global Natural Resources ETF - NAV |
MSCI World Index |
S&P Global Natural Resources Net TR index |
2/27/24 |
$10,000 |
$10,000 |
$10,000 |
2/29/24 |
$9,993 |
$10,018 |
$10,046 |
3/31/24 |
$10,893 |
$10,337 |
$10,872 |
4/30/24 |
$10,919 |
$9,956 |
$10,865 |
5/31/24 |
$11,231 |
$10,401 |
$11,159 |
6/30/24 |
$10,721 |
$10,612 |
$10,664 |
7/31/24 |
$10,935 |
$10,799 |
$10,811 |
8/31/24 |
$10,875 |
$11,085 |
$10,794 |
9/30/24 |
$11,060 |
$11,309 |
$11,028 |
10/31/24 |
$10,678 |
$11,084 |
$10,534 |
11/30/24 |
$10,543 |
$11,593 |
$10,455 |
12/31/24 |
$9,755 |
$11,291 |
$9,716 |
1/31/25 |
$10,301 |
$11,689 |
$10,259 |
2/28/25 |
$10,289 |
$11,605 |
$10,238 |
3/31/25 |
$10,399 |
$11,089 |
$10,390 |
4/30/25 |
$9,971 |
$11,187 |
$10,072 |
5/31/25 |
$10,292 |
$11,849 |
$10,366 |
6/30/25 |
$10,626 |
$12,361 |
$10,729 |
7/31/25 |
$10,555 |
$12,520 |
$10,806 |
8/31/25 |
$11,227 |
$12,846 |
$11,511 |
9/30/25 |
$11,528 |
$13,259 |
$11,733 |
10/31/25 |
$11,528 |
$13,525 |
$11,648 |
11/30/25 |
$12,100 |
$13,563 |
$12,108 |
12/31/25 |
$12,447 |
$13,673 |
$12,521 |
1/31/26 |
$13,807 |
$13,979 |
$13,817 |
2/28/26 |
$15,075 |
$14,081 |
$15,207 |
3/31/26 |
$14,857 |
$13,184 |
$14,984 |
4/30/26 |
$14,814 |
$14,449 |
$15,008 |
5/31/26 |
$14,384 |
$15,107 |
$14,862 |
6/30/26 |
$13,216 |
$14,998 |
$13,696 |
7/31/26 |
$14,097 |
$15,075 |
$14,722 |
8/31/26 |
$15,350 |
$15,464 |
$15,885 |
|
| Average Annual Return [Table Text Block] |
|
|
Table Summary
Fund/Index |
1-Year |
Since Inception 2/27/24 |
Xtrackers RREEF Global Natural Resources ETF - NAV |
36.73% |
18.60% |
MSCI World Index |
20.37% |
18.95% |
S&P Global Natural Resources Net TR index |
38.00% |
20.23% | |
| AssetsNet |
|
|
$ 37,401,322
|
| Holdings Count | Holding |
|
|
60
|
| Advisory Fees Paid, Amount |
|
|
$ 157,798
|
| InvestmentCompanyPortfolioTurnover |
|
|
142.00%
|
| Additional Fund Statistics [Text Block] |
|
|
Table Summary
Net Assets ($) |
37,401,322 |
Number of Portfolio Holdings |
60 |
Portfolio Turnover Rate (%) |
142 |
Total Net Advisory Fees Paid ($) |
157,798 | |
| Holdings [Text Block] |
|
|
Table Summary
Industry |
% of Net Assets |
Metals & Mining |
32% |
Oil, Gas & Consumable Fuels |
31% |
Chemicals |
13% |
Containers & Packaging |
12% |
Food Products |
6% |
Paper & Forest Products |
4% |
Energy Equipment & Services |
1% |
Specialized REITs |
1% | Geographical Diversification
Table Summary
Country |
% of Net Assets |
United States |
44% |
Canada |
22% |
United Kingdom |
11% |
Switzerland |
4% |
South Africa |
3% |
Brazil |
3% |
Ireland |
3% |
Finland |
2% |
Netherlands |
2% |
Other |
6% | |
| Largest Holdings [Text Block] |
|
|
Ten Largest Equity Holdings
Table Summary
Holdings |
38.3% of Net Assets |
Shell PLC (United Kingdom) |
5.6% |
Nutrien Ltd. (Canada) |
5.6% |
Newmont Corp. (United States) |
4.3% |
Glencore PLC (Switzerland) |
3.8% |
ExxonMobil Holdings Corp. (United States) |
3.8% |
Gold Fields Ltd. (South Africa) |
3.5% |
Chevron Corp. (United States) |
3.1% |
Anglogold Ashanti PLC (United States) |
3.0% |
Corteva, Inc. (United States) |
2.9% |
Smurfit Westrock PLC (Ireland) |
2.7% | |
| Material Fund Change [Text Block] |
|
|
|
| Updated Prospectus Phone Number |
|
|
(844) 851-4255
|
| Updated Prospectus Web Address |
|
|
dws.com/en-us/resources/proxy-voting
|
|
|