Shareholder Report
Aug. 31, 2026
USD ($)
Holding
This report describes changes to the Fund that occurred during the reporting period.
What were the Fund's costs for the last 12 months ?
(Based on a hypothetical $10,000 investment)
| Class | Costs of a $10,000 investment | Costs paid as a percentage of a $10,000 investment1 |
| Institutional Class | $63 | 0.61% |
| 1 | Costs paid as a percentage of a $10,000 investment would have been 0.55% if distressed investment expenses and non-recurring expenses were not included. |
Management's discussion of Fund performance
Performance highlights
Nomura Tax-Free USA Fund (Institutional Class) returned 6.03% (excluding sales charge) for the 12 months ended August 31, 2026. During the same period, the Bloomberg Municipal Bond Index, the Fund's broad-based securities market index (benchmark), returned 4.12%.
Market highlights
During the reporting period, monetary policy and geopolitical uncertainty impacted the municipal bond market. US Federal Reserve (Fed) cuts in 4Q25 and legislative clarity contributed to performance. However, the US-Iran conflict and subsequent inflation concerns applied pressure to the market. Additionally, market technicals impacted performance.
Supply was elevated but met with strong demand as municipal mutual funds took in a near record amount in the first eight months of 2026. More importantly, the flows were evenly distributed between open-ended funds and exchange-traded funds (ETFs) in calendar year 2026.
Municipal bond yields rose on the front end of the curve and fell in the intermediate and long segments. For example, the MMD AAA 2-year yield rose 33 basis points (bps) while the 20-year yield fell 15 bps and the 30-year yield fell 1 bp (a basis point equals one-hundredth of a percentage point). As a result, the 2-year/30-year curve flattened, starting the period at 241 bps and ending the period at 207 bps.
The long end of the curve outperformed as did lower investment grade BBB-rated and below-investment-grade securities during the reporting period, in part, driven by the strong fund flows into long mutual funds. For example, the Bloomberg Municipal Bond Index returned 4.12% while the long segment (22+ years) returned 6.45%; BBB-rated and below‑investment‑grade securities returned 6.08% and 6.66%, respectively. Conversely, the front end of the curve detracted from performance for the period with the Bloomberg Municipal Bond Index’s 1-year (1-2 years) segment only up 2.36%.
Top contributors to performance:
An overweight to the long end of the curve contributed to performance.
An overweight to BBB-rated securities, in addition to a full out-of-benchmark allocation to below-investment-grade bonds, also contributed.
Top detractors from performance:
A modest out-of-benchmark allocation to the front end of the curve (0-1 years) was a drag on performance as this part of the curve lagged the overall market.
The transportation sector was a detractor, underperforming the benchmark’s transportation return of 4.86%.
Fund performance
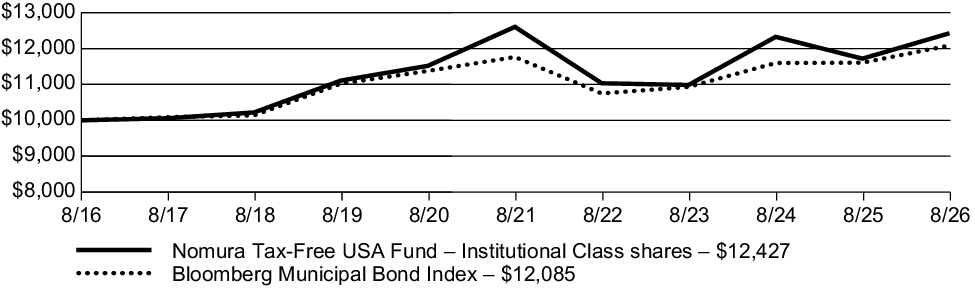
The following graph compares the initial and subsequent account values at the end of each of the most recently completed 10 fiscal years of the Class. It also assumes a $10,000 initial investment at the beginning of the first full fiscal year in a broad-based securities market index for the same period.
Growth of $10,000 investment
For the period August 31, 2016, through August 31, 2026
| Average annual total returns (as of August 31, 2026) | 1 year | 5 year | 10 year | |||
| Nomura Tax-Free USA Fund (Institutional Class) – including sales charge | 6.03 | % | -0.29 | % | 2.20 | % |
| Nomura Tax-Free USA Fund (Institutional Class) – excluding sales charge | 6.03 | % | -0.29 | % | 2.20 | % |
| Bloomberg Municipal Bond Index | 4.12 | % | 0.54 | % | 1.91 | % |
Fund statistics (as of August 31, 2026)
| Fund net assets | $1,067,747,417 |
| Total number of portfolio holdings* | 327 |
| Total net advisory fees paid (during reporting period) | $4,751,222 |
| Portfolio turnover rate | 25% |
| * |
Excludes cash and cash equivalents. |
Fund holdings (as of August 31, 2026)
The tables below show the investment makeup of the Fund, with each category representing a percentage of the total net assets of the Fund.
Sector allocation
| Special Tax Revenue Bonds | 15.63% |
| Industrial Development Revenue/Pollution Control Revenue Bonds |
14.99% |
| Transportation Revenue Bonds | 13.60% |
| Education Revenue Bonds | 11.87% |
| Healthcare Revenue Bonds | 11.48% |
| Lease Revenue Bonds | 8.52% |
| State General Obligation Bonds | 8.40% |
| Local General Obligation Bonds | 4.36% |
| Electric Revenue Bonds | 3.26% |
| Water & Sewer Revenue Bonds | 2.37% |
State and territory allocation
| Puerto Rico | 14.00% |
| California | 10.02% |
| Illinois | 9.90% |
| New York | 9.55% |
| Florida | 5.95% |
| Texas | 5.91% |
| Arizona | 4.58% |
| Alabama | 3.69% |
| New Jersey | 3.56% |
| Wisconsin | 3.52% |
Material Fund changes
Effective December 1, 2025, the Fund was renamed Nomura Tax-Free USA Fund.
This is a summary of certain changes to the Fund that occurred during the reporting period. For more complete information, you may review the Fund's next prospectus, which we expect to be available by December 30, 2026, at nomuraassetmanagement.com/literature or upon request at 800 523-1918, weekdays from 8:30am to 6:00pm ET.
Effective December 1, 2025, the Fund was renamed Nomura Tax-Free USA Fund.
This is a summary of certain changes to the Fund that occurred during the reporting period. For more complete information, you may review the Fund's next prospectus, which we expect to be available by December 30, 2026, at nomuraassetmanagement.com/literature or upon request at 800 523-1918, weekdays from 8:30am to 6:00pm ET.
Changes in and disagreements with accountants
During the reporting period, there was a change in the Fund’s independent registered public accounting firm. On May 20, 2026, the Fund’s Board of Trustees, upon the recommendation of its Audit Committee, approved the appointment of Cohen & Company, Ltd. as the independent registered public accounting firm for the Fund, effectively dismissing PricewaterhouseCoopers LLP (PwC) as the Fund’s independent registered public accounting firm. There were no disagreements with PwC during the Fund’s two most recent fiscal years or the subsequent interim period through May 20, 2026.
This report describes changes to the Fund that occurred during the reporting period.
What were the Fund's costs for the last 12 months ?
(Based on a hypothetical $10,000 investment)
| Class | Costs of a $10,000 investment | Costs paid as a percentage of a $10,000 investment1 |
| Class C | $165 | 1.61% |
| 1 | Costs paid as a percentage of a $10,000 investment would have been 1.55% if distressed investment expenses and non-recurring expenses were not included. |
Management's discussion of Fund performance
Performance highlights
Nomura Tax-Free USA Fund (Class C) returned 4.99% (excluding sales charge) for the 12 months ended August 31, 2026. During the same period, the Bloomberg Municipal Bond Index, the Fund's broad-based securities market index (benchmark), returned 4.12%.
Market highlights
During the reporting period, monetary policy and geopolitical uncertainty impacted the municipal bond market. US Federal Reserve (Fed) cuts in 4Q25 and legislative clarity contributed to performance. However, the US-Iran conflict and subsequent inflation concerns applied pressure to the market. Additionally, market technicals impacted performance.
Supply was elevated but met with strong demand as municipal mutual funds took in a near record amount in the first eight months of 2026. More importantly, the flows were evenly distributed between open-ended funds and exchange-traded funds (ETFs) in calendar year 2026.
Municipal bond yields rose on the front end of the curve and fell in the intermediate and long segments. For example, the MMD AAA 2-year yield rose 33 basis points (bps) while the 20-year yield fell 15 bps and the 30-year yield fell 1 bp (a basis point equals one-hundredth of a percentage point). As a result, the 2-year/30-year curve flattened, starting the period at 241 bps and ending the period at 207 bps.
The long end of the curve outperformed as did lower investment grade BBB-rated and below-investment-grade securities during the reporting period, in part, driven by the strong fund flows into long mutual funds. For example, the Bloomberg Municipal Bond Index returned 4.12% while the long segment (22+ years) returned 6.45%; BBB-rated and below‑investment‑grade securities returned 6.08% and 6.66%, respectively. Conversely, the front end of the curve detracted from performance for the period with the Bloomberg Municipal Bond Index’s 1-year (1-2 years) segment only up 2.36%.
Top contributors to performance:
An overweight to the long end of the curve contributed to performance.
An overweight to BBB-rated securities, in addition to a full out-of-benchmark allocation to below-investment-grade bonds, also contributed.
Top detractors from performance:
A modest out-of-benchmark allocation to the front end of the curve (0-1 years) was a drag on performance as this part of the curve lagged the overall market.
The transportation sector was a detractor, underperforming the benchmark’s transportation return of 4.86%.
Fund performance
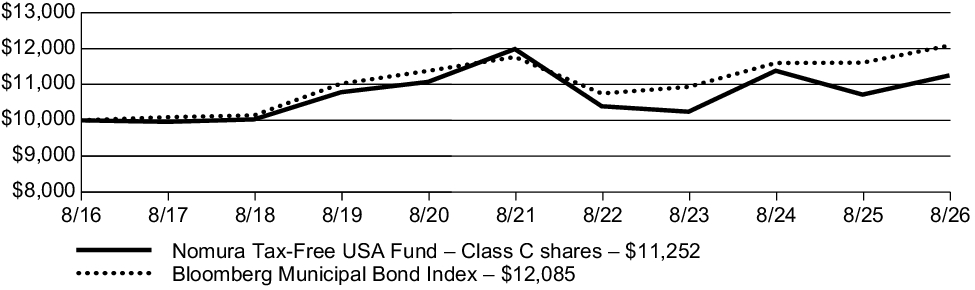
The following graph compares the initial and subsequent account values at the end of each of the most recently completed 10 fiscal years of the Class. It also assumes a $10,000 initial investment at the beginning of the first full fiscal year in a broad-based securities market index for the same period.
Growth of $10,000 investment
For the period August 31, 2016, through August 31, 2026
| Average annual total returns (as of August 31, 2026) | 1 year | 5 year | 10 year | |||
| Nomura Tax-Free USA Fund (Class C) – including sales charge | 3.99 | % | -1.26 | % | 1.19 | % |
| Nomura Tax-Free USA Fund (Class C) – excluding sales charge | 4.99 | % | -1.26 | % | 1.19 | % |
| Bloomberg Municipal Bond Index | 4.12 | % | 0.54 | % | 1.91 | % |
Fund statistics (as of August 31, 2026)
| Fund net assets | $1,067,747,417 |
| Total number of portfolio holdings* | 327 |
| Total net advisory fees paid (during reporting period) | $4,751,222 |
| Portfolio turnover rate | 25% |
| * |
Excludes cash and cash equivalents. |
Fund holdings (as of August 31, 2026)
The tables below show the investment makeup of the Fund, with each category representing a percentage of the total net assets of the Fund.
Sector allocation
| Special Tax Revenue Bonds | 15.63% |
| Industrial Development Revenue/Pollution Control Revenue Bonds |
14.99% |
| Transportation Revenue Bonds | 13.60% |
| Education Revenue Bonds | 11.87% |
| Healthcare Revenue Bonds | 11.48% |
| Lease Revenue Bonds | 8.52% |
| State General Obligation Bonds | 8.40% |
| Local General Obligation Bonds | 4.36% |
| Electric Revenue Bonds | 3.26% |
| Water & Sewer Revenue Bonds | 2.37% |
State and territory allocation
| Puerto Rico | 14.00% |
| California | 10.02% |
| Illinois | 9.90% |
| New York | 9.55% |
| Florida | 5.95% |
| Texas | 5.91% |
| Arizona | 4.58% |
| Alabama | 3.69% |
| New Jersey | 3.56% |
| Wisconsin | 3.52% |
Material Fund changes
Effective December 1, 2025, the Fund was renamed Nomura Tax-Free USA Fund.
This is a summary of certain changes to the Fund that occurred during the reporting period. For more complete information, you may review the Fund's next prospectus, which we expect to be available by December 30, 2026, at nomuraassetmanagement.com/literature or upon request at 800 523-1918, weekdays from 8:30am to 6:00pm ET.
Effective December 1, 2025, the Fund was renamed Nomura Tax-Free USA Fund.
This is a summary of certain changes to the Fund that occurred during the reporting period. For more complete information, you may review the Fund's next prospectus, which we expect to be available by December 30, 2026, at nomuraassetmanagement.com/literature or upon request at 800 523-1918, weekdays from 8:30am to 6:00pm ET.
Changes in and disagreements with accountants
During the reporting period, there was a change in the Fund’s independent registered public accounting firm. On May 20, 2026, the Fund’s Board of Trustees, upon the recommendation of its Audit Committee, approved the appointment of Cohen & Company, Ltd. as the independent registered public accounting firm for the Fund, effectively dismissing PricewaterhouseCoopers LLP (PwC) as the Fund’s independent registered public accounting firm. There were no disagreements with PwC during the Fund’s two most recent fiscal years or the subsequent interim period through May 20, 2026.
This report describes changes to the Fund that occurred during the reporting period.
What were the Fund's costs for the last 12 months ?
(Based on a hypothetical $10,000 investment)
| Class | Costs of a $10,000 investment | Costs paid as a percentage of a $10,000 investment1 |
| Class A | $88 | 0.86% |
| 1 | Costs paid as a percentage of a $10,000 investment would have been 0.80% if distressed investment expenses and non-recurring expenses were not included. |
Management's discussion of Fund performance
Performance highlights
Nomura Tax-Free USA Fund (Class A) returned 5.78% (excluding sales charge) for the 12 months ended August 31, 2026. During the same period, the Bloomberg Municipal Bond Index, the Fund's broad-based securities market index (benchmark), returned 4.12%.
Market highlights
During the reporting period, monetary policy and geopolitical uncertainty impacted the municipal bond market. US Federal Reserve (Fed) cuts in 4Q25 and legislative clarity contributed to performance. However, the US-Iran conflict and subsequent inflation concerns applied pressure to the market. Additionally, market technicals impacted performance.
Supply was elevated but met with strong demand as municipal mutual funds took in a near record amount in the first eight months of 2026. More importantly, the flows were evenly distributed between open-ended funds and exchange-traded funds (ETFs) in calendar year 2026.
Municipal bond yields rose on the front end of the curve and fell in the intermediate and long segments. For example, the MMD AAA 2-year yield rose 33 basis points (bps) while the 20-year yield fell 15 bps and the 30-year yield fell 1 bp (a basis point equals one-hundredth of a percentage point). As a result, the 2-year/30-year curve flattened, starting the period at 241 bps and ending the period at 207 bps.
The long end of the curve outperformed as did lower investment grade BBB-rated and below-investment-grade securities during the reporting period, in part, driven by the strong fund flows into long mutual funds. For example, the Bloomberg Municipal Bond Index returned 4.12% while the long segment (22+ years) returned 6.45%; BBB-rated and below‑investment‑grade securities returned 6.08% and 6.66%, respectively. Conversely, the front end of the curve detracted from performance for the period with the Bloomberg Municipal Bond Index’s 1-year (1-2 years) segment only up 2.36%.
Top contributors to performance:
An overweight to the long end of the curve contributed to performance.
An overweight to BBB-rated securities, in addition to a full out-of-benchmark allocation to below-investment-grade bonds, also contributed.
Top detractors from performance:
A modest out-of-benchmark allocation to the front end of the curve (0-1 years) was a drag on performance as this part of the curve lagged the overall market.
The transportation sector was a detractor, underperforming the benchmark’s transportation return of 4.86%.
Fund performance
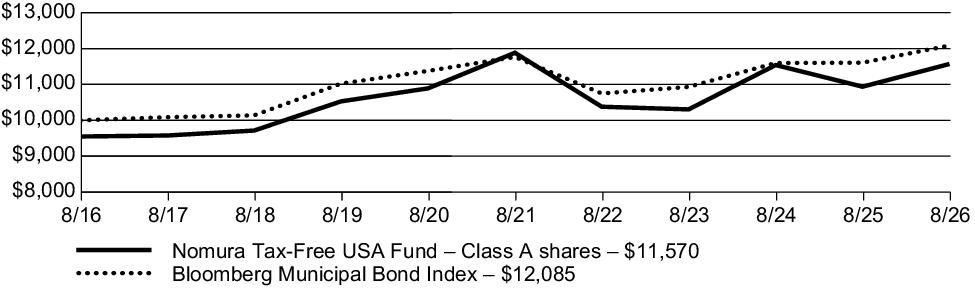
The following graph compares the initial and subsequent account values at the end of each of the most recently completed 10 fiscal years of the Class. It also assumes a $10,000 initial investment at the beginning of the first full fiscal year in a broad-based securities market index for the same period and the deduction of the maximum applicable sales charge for Class A shares.
Growth of $10,000 investment
For the period August 31, 2016, through August 31, 2026
| Average annual total returns (as of August 31, 2026) | 1 year | 5 year | 10 year | |||
| Nomura Tax-Free USA Fund (Class A) – including sales charge | 1.03 | % | -1.44 | % | 1.47 | % |
| Nomura Tax-Free USA Fund (Class A) – excluding sales charge | 5.78 | % | -0.53 | % | 1.94 | % |
| Bloomberg Municipal Bond Index | 4.12 | % | 0.54 | % | 1.91 | % |
Fund statistics (as of August 31, 2026)
| Fund net assets | $1,067,747,417 |
| Total number of portfolio holdings* | 327 |
| Total net advisory fees paid (during reporting period) | $4,751,222 |
| Portfolio turnover rate | 25% |
| * |
Excludes cash and cash equivalents. |
Fund holdings (as of August 31, 2026)
The tables below show the investment makeup of the Fund, with each category representing a percentage of the total net assets of the Fund.
Sector allocation
| Special Tax Revenue Bonds | 15.63% |
| Industrial Development Revenue/Pollution Control Revenue Bonds |
14.99% |
| Transportation Revenue Bonds | 13.60% |
| Education Revenue Bonds | 11.87% |
| Healthcare Revenue Bonds | 11.48% |
| Lease Revenue Bonds | 8.52% |
| State General Obligation Bonds | 8.40% |
| Local General Obligation Bonds | 4.36% |
| Electric Revenue Bonds | 3.26% |
| Water & Sewer Revenue Bonds | 2.37% |
State and territory allocation
| Puerto Rico | 14.00% |
| California | 10.02% |
| Illinois | 9.90% |
| New York | 9.55% |
| Florida | 5.95% |
| Texas | 5.91% |
| Arizona | 4.58% |
| Alabama | 3.69% |
| New Jersey | 3.56% |
| Wisconsin | 3.52% |
Material Fund changes
Effective December 1, 2025, the Fund was renamed Nomura Tax-Free USA Fund.
This is a summary of certain changes to the Fund that occurred during the reporting period. For more complete information, you may review the Fund's next prospectus, which we expect to be available by December 30, 2026, at nomuraassetmanagement.com/literature or upon request at 800 523-1918, weekdays from 8:30am to 6:00pm ET.
Effective December 1, 2025, the Fund was renamed Nomura Tax-Free USA Fund.
This is a summary of certain changes to the Fund that occurred during the reporting period. For more complete information, you may review the Fund's next prospectus, which we expect to be available by December 30, 2026, at nomuraassetmanagement.com/literature or upon request at 800 523-1918, weekdays from 8:30am to 6:00pm ET.
Changes in and disagreements with accountants
During the reporting period, there was a change in the Fund’s independent registered public accounting firm. On May 20, 2026, the Fund’s Board of Trustees, upon the recommendation of its Audit Committee, approved the appointment of Cohen & Company, Ltd. as the independent registered public accounting firm for the Fund, effectively dismissing PricewaterhouseCoopers LLP (PwC) as the Fund’s independent registered public accounting firm. There were no disagreements with PwC during the Fund’s two most recent fiscal years or the subsequent interim period through May 20, 2026.
This report describes changes to the Fund that occurred during the reporting period.
What were the Fund's costs for the last 12 months ?
(Based on a hypothetical $10,000 investment)
| Class | Costs of a $10,000 investment | Costs paid as a percentage of a $10,000 investment1 |
| Class A | $79 | 0.77% |
| 1 | Costs paid as a percentage of a $10,000 investment would have been 0.75% if distressed investment expenses were not included. |
Management's discussion of Fund performance
Performance highlights
Nomura Tax-Free USA Intermediate Fund (Class A) returned 4.26% (excluding sales charge) for the 12 months ended August 31, 2026. During the same period, the Bloomberg Municipal Bond Index, the Fund's broad-based securities market index, returned 4.12%, while the Bloomberg 3-15 Year Blend Municipal Bond Index, the Fund's narrowly based securities market index (benchmark), returned 2.93%.
Market highlights
During the reporting period, monetary policy and geopolitical uncertainty impacted the municipal bond market. US Federal Reserve (Fed) cuts in 4Q25 and legislative clarity contributed to performance. However, the US-Iran conflict and subsequent inflation concerns applied pressure to the market. Additionally, market technicals impacted performance.
Supply was elevated but met with strong demand as municipal mutual funds took in a near record amount in the first eight months of 2026. More importantly, the flows were evenly distributed between open-ended funds and exchange-traded funds (ETFs) in calendar year 2026.
Municipal bond yields rose on the front end of the curve and fell in the intermediate and long segments. For example, the MMD AAA 2-year yield rose 33 basis points (bps) while the 20-year yield fell 15 bps and the 30-year yield fell 1 bp (a basis point equals one-hundredth of a percentage point). As a result, the 2-year/30-year curve flattened, starting the period at 241 bps and ending the period at 207 bps.
The long end of the curve outperformed as did lower investment grade BBB-rated and below-investment-grade securities during the reporting period, in part, driven by the strong fund flows into long mutual funds. For example, the Bloomberg Municipal Bond Index returned 4.12% while the long segment (22+ years) returned 6.45%; BBB-rated and below-investment-grade securities returned 6.08% and 6.66%, respectively. Conversely, the front end of the curve detracted from performance for the period with the Bloomberg Municipal Bond Index’s 1-year (1-2 years) segment only up 2.36%.
Top contributors to performance:
An out-of-benchmark allocation to the long end of the curve contributed to performance.
An overweight to BBB-rated securities contributed to performance for the period.
Top detractors from performance:
A modest out-of-benchmark allocation to the front end of the curve (0-2 years) was a drag on performance as this part of the curve lagged the overall market.
The Industrial Development Revenue (IDR)/Pollution Control Revenue (PCR) sector was a detractor for the period. This allocation underperformed the benchmark’s IDR/PCR return as well as the overall benchmark return.
Fund performance
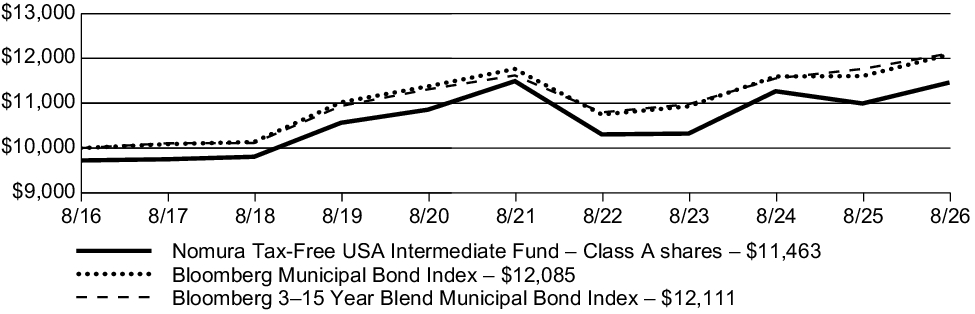
The following graph compares the initial and subsequent account values at the end of each of the most recently completed 10 fiscal years of the Class. It also assumes a $10,000 initial investment at the beginning of the first full fiscal year in a broad-based securities market index and an additional narrowly based securities market index for the same period and the deduction of the maximum applicable sales charge for Class A shares.
Growth of $10,000 investment
For the period August 31, 2016, through August 31, 2026
| Average annual total returns (as of August 31, 2026) | 1 year | 5 year | 10 year | |||
| Nomura Tax-Free USA Intermediate Fund (Class A) – including sales charge | 1.38 | % | -0.61 | % | 1.37 | % |
| Nomura Tax-Free USA Intermediate Fund (Class A) – excluding sales charge | 4.26 | % | -0.05 | % | 1.66 | % |
| Bloomberg Municipal Bond Index | 4.12 | % | 0.54 | % | 1.91 | % |
| Bloomberg 3–15 Year Blend Municipal Bond Index | 2.93 | % | 0.83 | % | 1.93 | % |
Fund statistics (as of August 31, 2026)
| Fund net assets | $811,257,515 |
| Total number of portfolio holdings* | 324 |
| Total net advisory fees paid (during reporting period) | $3,163,684 |
| Portfolio turnover rate | 7% |
| * |
Excludes cash and cash equivalents. |
Fund holdings (as of August 31, 2026)
The tables below show the investment makeup of the Fund, with each category representing a percentage of the total net assets of the Fund.
Sector allocation
| Industrial Development Revenue/Pollution Control Revenue Bonds |
22.56% |
| Transportation Revenue Bonds | 15.58% |
| Special Tax Revenue Bonds | 15.09% |
| Healthcare Revenue Bonds | 8.28% |
| Education Revenue Bonds | 7.58% |
| Lease Revenue Bonds | 6.75% |
| State General Obligation Bonds | 6.58% |
| Housing Revenue Bonds | 5.99% |
| Electric Revenue Bonds | 3.98% |
| Local General Obligation Bonds | 2.58% |
State and territory allocation
| New York | 14.07% |
| Puerto Rico | 11.20% |
| California | 10.27% |
| Illinois | 9.16% |
| Florida | 7.91% |
| Alabama | 4.67% |
| Colorado | 4.48% |
| Pennsylvania | 3.88% |
| New Jersey | 3.40% |
| Texas | 2.82% |
Material Fund changes
Effective December 1, 2025, the Fund was renamed Nomura Tax-Free USA Intermediate Fund.
This is a summary of certain changes to the Fund that occurred during the reporting period. For more complete information, you may review the Fund's next prospectus, which we expect to be available by December 30, 2026, at nomuraassetmanagement.com/literature or upon request at 800 523-1918, weekdays from 8:30am to 6:00pm ET.
Effective December 1, 2025, the Fund was renamed Nomura Tax-Free USA Intermediate Fund.
This is a summary of certain changes to the Fund that occurred during the reporting period. For more complete information, you may review the Fund's next prospectus, which we expect to be available by December 30, 2026, at nomuraassetmanagement.com/literature or upon request at 800 523-1918, weekdays from 8:30am to 6:00pm ET.
Changes in and disagreements with accountants
During the reporting period, there was a change in the Fund’s independent registered public accounting firm. On May 20, 2026, the Fund’s Board of Trustees, upon the recommendation of its Audit Committee, approved the appointment of Cohen & Company, Ltd. as the independent registered public accounting firm for the Fund, effectively dismissing PricewaterhouseCoopers LLP (PwC) as the Fund’s independent registered public accounting firm. There were no disagreements with PwC during the Fund’s two most recent fiscal years or the subsequent interim period through May 20, 2026.
This report describes changes to the Fund that occurred during the reporting period.
What were the Fund's costs for the last 12 months ?
(Based on a hypothetical $10,000 investment)
| Class | Costs of a $10,000 investment | Costs paid as a percentage of a $10,000 investment1 |
| Class C | $155 | 1.52% |
| 1 | Costs paid as a percentage of a $10,000 investment would have been 1.50% if distressed investment expenses were not included. |
Management's discussion of Fund performance
Performance highlights
Nomura Tax-Free USA Intermediate Fund (Class C) returned 3.48% (excluding sales charge) for the 12 months ended August 31, 2026. During the same period, the Bloomberg Municipal Bond Index, the Fund's broad-based securities market index, returned 4.12%, while the Bloomberg 3-15 Year Blend Municipal Bond Index, the Fund's narrowly based securities market index (benchmark), returned 2.93%.
Market highlights
During the reporting period, monetary policy and geopolitical uncertainty impacted the municipal bond market. US Federal Reserve (Fed) cuts in 4Q25 and legislative clarity contributed to performance. However, the US-Iran conflict and subsequent inflation concerns applied pressure to the market. Additionally, market technicals impacted performance.
Supply was elevated but met with strong demand as municipal mutual funds took in a near record amount in the first eight months of 2026. More importantly, the flows were evenly distributed between open-ended funds and exchange-traded funds (ETFs) in calendar year 2026.
Municipal bond yields rose on the front end of the curve and fell in the intermediate and long segments. For example, the MMD AAA 2-year yield rose 33 basis points (bps) while the 20-year yield fell 15 bps and the 30-year yield fell 1 bp (a basis point equals one-hundredth of a percentage point). As a result, the 2-year/30-year curve flattened, starting the period at 241 bps and ending the period at 207 bps.
The long end of the curve outperformed as did lower investment grade BBB-rated and below-investment-grade securities during the reporting period, in part, driven by the strong fund flows into long mutual funds. For example, the Bloomberg Municipal Bond Index returned 4.12% while the long segment (22+ years) returned 6.45%; BBB-rated and below-investment-grade securities returned 6.08% and 6.66%, respectively. Conversely, the front end of the curve detracted from performance for the period with the Bloomberg Municipal Bond Index’s 1-year (1-2 years) segment only up 2.36%.
Top contributors to performance:
An out-of-benchmark allocation to the long end of the curve contributed to performance.
An overweight to BBB-rated securities contributed to performance for the period.
Top detractors from performance:
A modest out-of-benchmark allocation to the front end of the curve (0-2 years) was a drag on performance as this part of the curve lagged the overall market.
The Industrial Development Revenue (IDR)/Pollution Control Revenue (PCR) sector was a detractor for the period. This allocation underperformed the benchmark’s IDR/PCR return as well as the overall benchmark return.
Fund performance
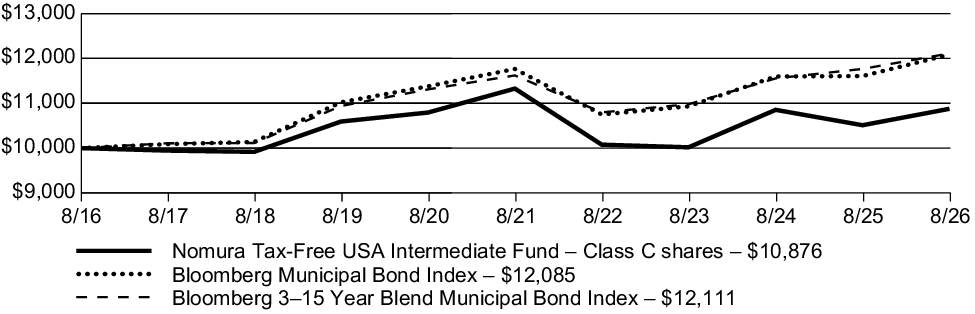
The following graph compares the initial and subsequent account values at the end of each of the most recently completed 10 fiscal years of the Class. It also assumes a $10,000 initial investment at the beginning of the first full fiscal year in a broad-based securities market index and an additional narrowly based securities market index for the same period.
Growth of $10,000 investment
For the period August 31, 2016, through August 31, 2026
| Average annual total returns (as of August 31, 2026) | 1 year | 5 year | 10 year | |||
| Nomura Tax-Free USA Intermediate Fund (Class C) – including sales charge | 2.48 | % | -0.81 | % | 0.84 | % |
| Nomura Tax-Free USA Intermediate Fund (Class C) – excluding sales charge | 3.48 | % | -0.81 | % | 0.84 | % |
| Bloomberg Municipal Bond Index | 4.12 | % | 0.54 | % | 1.91 | % |
| Bloomberg 3–15 Year Blend Municipal Bond Index | 2.93 | % | 0.83 | % | 1.93 | % |
Fund statistics (as of August 31, 2026)
| Fund net assets | $811,257,515 |
| Total number of portfolio holdings* | 324 |
| Total net advisory fees paid (during reporting period) | $3,163,684 |
| Portfolio turnover rate | 7% |
| * |
Excludes cash and cash equivalents. |
Fund holdings (as of August 31, 2026)
The tables below show the investment makeup of the Fund, with each category representing a percentage of the total net assets of the Fund.
Sector allocation
| Industrial Development Revenue/Pollution Control Revenue Bonds |
22.56% |
| Transportation Revenue Bonds | 15.58% |
| Special Tax Revenue Bonds | 15.09% |
| Healthcare Revenue Bonds | 8.28% |
| Education Revenue Bonds | 7.58% |
| Lease Revenue Bonds | 6.75% |
| State General Obligation Bonds | 6.58% |
| Housing Revenue Bonds | 5.99% |
| Electric Revenue Bonds | 3.98% |
| Local General Obligation Bonds | 2.58% |
State and territory allocation
| New York | 14.07% |
| Puerto Rico | 11.20% |
| California | 10.27% |
| Illinois | 9.16% |
| Florida | 7.91% |
| Alabama | 4.67% |
| Colorado | 4.48% |
| Pennsylvania | 3.88% |
| New Jersey | 3.40% |
| Texas | 2.82% |
Material Fund changes
Effective December 1, 2025, the Fund was renamed Nomura Tax-Free USA Intermediate Fund.
This is a summary of certain changes to the Fund that occurred during the reporting period. For more complete information, you may review the Fund's next prospectus, which we expect to be available by December 30, 2026, at nomuraassetmanagement.com/literature or upon request at 800 523-1918, weekdays from 8:30am to 6:00pm ET.
Effective December 1, 2025, the Fund was renamed Nomura Tax-Free USA Intermediate Fund.
This is a summary of certain changes to the Fund that occurred during the reporting period. For more complete information, you may review the Fund's next prospectus, which we expect to be available by December 30, 2026, at nomuraassetmanagement.com/literature or upon request at 800 523-1918, weekdays from 8:30am to 6:00pm ET.
Changes in and disagreements with accountants
During the reporting period, there was a change in the Fund’s independent registered public accounting firm. On May 20, 2026, the Fund’s Board of Trustees, upon the recommendation of its Audit Committee, approved the appointment of Cohen & Company, Ltd. as the independent registered public accounting firm for the Fund, effectively dismissing PricewaterhouseCoopers LLP (PwC) as the Fund’s independent registered public accounting firm. There were no disagreements with PwC during the Fund’s two most recent fiscal years or the subsequent interim period through May 20, 2026.
This report describes changes to the Fund that occurred during the reporting period.
What were the Fund's costs for the last 12 months ?
(Based on a hypothetical $10,000 investment)
| Class | Costs of a $10,000 investment | Costs paid as a percentage of a $10,000 investment1 |
| Institutional Class | $53 | 0.52% |
| 1 | Costs paid as a percentage of a $10,000 investment would have been 0.50% if distressed investment expenses were not included. |
Management's discussion of Fund performance
Performance highlights
Nomura Tax-Free USA Intermediate Fund (Institutional Class) returned 4.52% (excluding sales charge) for the 12 months ended August 31, 2026. During the same period, the Bloomberg Municipal Bond Index, the Fund's broad-based securities market index, returned 4.12%, while the Bloomberg 3-15 Year Blend Municipal Bond Index, the Fund's narrowly based securities market index (benchmark), returned 2.93%.
Market highlights
During the reporting period, monetary policy and geopolitical uncertainty impacted the municipal bond market. US Federal Reserve (Fed) cuts in 4Q25 and legislative clarity contributed to performance. However, the US-Iran conflict and subsequent inflation concerns applied pressure to the market. Additionally, market technicals impacted performance.
Supply was elevated but met with strong demand as municipal mutual funds took in a near record amount in the first eight months of 2026. More importantly, the flows were evenly distributed between open-ended funds and exchange-traded funds (ETFs) in calendar year 2026.
Municipal bond yields rose on the front end of the curve and fell in the intermediate and long segments. For example, the MMD AAA 2-year yield rose 33 basis points (bps) while the 20-year yield fell 15 bps and the 30-year yield fell 1 bp (a basis point equals one-hundredth of a percentage point). As a result, the 2-year/30-year curve flattened, starting the period at 241 bps and ending the period at 207 bps.
The long end of the curve outperformed as did lower investment grade BBB-rated and below-investment-grade securities during the reporting period, in part, driven by the strong fund flows into long mutual funds. For example, the Bloomberg Municipal Bond Index returned 4.12% while the long segment (22+ years) returned 6.45%; BBB-rated and below-investment-grade securities returned 6.08% and 6.66%, respectively. Conversely, the front end of the curve detracted from performance for the period with the Bloomberg Municipal Bond Index’s 1-year (1-2 years) segment only up 2.36%.
Top contributors to performance:
An out-of-benchmark allocation to the long end of the curve contributed to performance.
An overweight to BBB-rated securities contributed to performance for the period.
Top detractors from performance:
A modest out-of-benchmark allocation to the front end of the curve (0-2 years) was a drag on performance as this part of the curve lagged the overall market.
The Industrial Development Revenue (IDR)/Pollution Control Revenue (PCR) sector was a detractor for the period. This allocation underperformed the benchmark’s IDR/PCR return as well as the overall benchmark return.
Fund performance
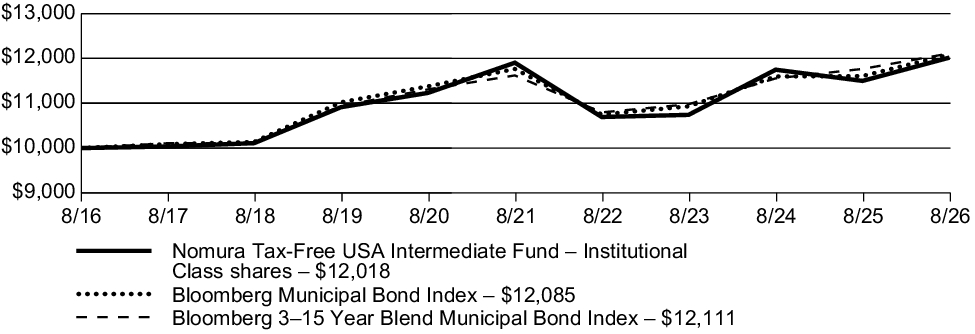
The following graph compares the initial and subsequent account values at the end of each of the most recently completed 10 fiscal years of the Class. It also assumes a $10,000 initial investment at the beginning of the first full fiscal year in a broad-based securities market index and an additional narrowly based securities market index for the same period.
Growth of $10,000 investment
For the period August 31, 2016, through August 31, 2026
| Average annual total returns (as of August 31, 2026) | 1 year | 5 year | 10 year | |||
| Nomura Tax-Free USA Intermediate Fund (Institutional Class) – including sales charge | 4.52 | % | 0.19 | % | 1.86 | % |
| Nomura Tax-Free USA Intermediate Fund (Institutional Class) – excluding sales charge | 4.52 | % | 0.19 | % | 1.86 | % |
| Bloomberg Municipal Bond Index | 4.12 | % | 0.54 | % | 1.91 | % |
| Bloomberg 3–15 Year Blend Municipal Bond Index | 2.93 | % | 0.83 | % | 1.93 | % |
Fund statistics (as of August 31, 2026)
| Fund net assets | $811,257,515 |
| Total number of portfolio holdings* | 324 |
| Total net advisory fees paid (during reporting period) | $3,163,684 |
| Portfolio turnover rate | 7% |
| * |
Excludes cash and cash equivalents. |
Fund holdings (as of August 31, 2026)
The tables below show the investment makeup of the Fund, with each category representing a percentage of the total net assets of the Fund.
Sector allocation
| Industrial Development Revenue/Pollution Control Revenue Bonds |
22.56% |
| Transportation Revenue Bonds | 15.58% |
| Special Tax Revenue Bonds | 15.09% |
| Healthcare Revenue Bonds | 8.28% |
| Education Revenue Bonds | 7.58% |
| Lease Revenue Bonds | 6.75% |
| State General Obligation Bonds | 6.58% |
| Housing Revenue Bonds | 5.99% |
| Electric Revenue Bonds | 3.98% |
| Local General Obligation Bonds | 2.58% |
State and territory allocation
| New York | 14.07% |
| Puerto Rico | 11.20% |
| California | 10.27% |
| Illinois | 9.16% |
| Florida | 7.91% |
| Alabama | 4.67% |
| Colorado | 4.48% |
| Pennsylvania | 3.88% |
| New Jersey | 3.40% |
| Texas | 2.82% |
Material Fund changes
Effective December 1, 2025, the Fund was renamed Nomura Tax-Free USA Intermediate Fund.
This is a summary of certain changes to the Fund that occurred during the reporting period. For more complete information, you may review the Fund's next prospectus, which we expect to be available by December 30, 2026, at nomuraassetmanagement.com/literature or upon request at 800 523-1918, weekdays from 8:30am to 6:00pm ET.
Effective December 1, 2025, the Fund was renamed Nomura Tax-Free USA Intermediate Fund.
This is a summary of certain changes to the Fund that occurred during the reporting period. For more complete information, you may review the Fund's next prospectus, which we expect to be available by December 30, 2026, at nomuraassetmanagement.com/literature or upon request at 800 523-1918, weekdays from 8:30am to 6:00pm ET.
Changes in and disagreements with accountants
During the reporting period, there was a change in the Fund’s independent registered public accounting firm. On May 20, 2026, the Fund’s Board of Trustees, upon the recommendation of its Audit Committee, approved the appointment of Cohen & Company, Ltd. as the independent registered public accounting firm for the Fund, effectively dismissing PricewaterhouseCoopers LLP (PwC) as the Fund’s independent registered public accounting firm. There were no disagreements with PwC during the Fund’s two most recent fiscal years or the subsequent interim period through May 20, 2026.
| [1] | Costs paid as a percentage of a $10,000 investment would have been 0.55% if distressed investment expenses and non-recurring expenses were not included. |
| [2] | Excludes cash and cash equivalents. |
| [3] | Costs paid as a percentage of a $10,000 investment would have been 1.55% if distressed investment expenses and non-recurring expenses were not included. |
| [4] | Excludes cash and cash equivalents. |
| [5] | Costs paid as a percentage of a $10,000 investment would have been 0.80% if distressed investment expenses and non-recurring expenses were not included. |
| [6] | Excludes cash and cash equivalents. |
| [7] | Costs paid as a percentage of a $10,000 investment would have been 0.75% if distressed investment expenses were not included. |
| [8] | Excludes cash and cash equivalents. |
| [9] | Costs paid as a percentage of a $10,000 investment would have been 1.50% if distressed investment expenses were not included. |
| [10] | Excludes cash and cash equivalents. |
| [11] | Costs paid as a percentage of a $10,000 investment would have been 0.50% if distressed investment expenses were not included. |
| [12] | Excludes cash and cash equivalents. |