
Q3’26 Earnings November 4, 2026
Disclaimer Forward-Looking Statements Advantage Solutions Inc. (the “Company”) is a provider of outsourced solutions to consumer packaged goods (“CPG”) brands and retailers. The Company’s Class A common stock is listed on the Nasdaq Global Select Market under the symbol “ADV.” Certain statements in this presentation may be considered forward-looking statements within the meaning of the federal securities laws, including statements regarding the expected future performance of Advantage's business and projected financial results. Forward-looking statements generally relate to future events or Advantage’s future financial or operating performance. These forward-looking statements generally are identified by the words “may”, “should”, “expect”, “intend”, “will”, “would”, “could”, “estimate”, “anticipate”, “believe”, “predict”, “confident”, “potential”, “guidance”, or “continue”, or the negatives of these terms or variations of them or similar terminology. Such forward-looking statements are predictions, projections, and other statements about future events that are based on current expectations and assumptions and, as a result, are subject to risks, uncertainties, and other factors which could cause actual results to differ materially from those expressed or implied by such forward-looking statements. These forward-looking statements are based upon estimates and assumptions that, while considered reasonable by Advantage and its management at the time of such statements, are inherently uncertain. Factors that may cause actual results to differ materially from current expectations include, but are not limited to, market-driven wage changes or changes to labor laws or wage or job classification regulations, including minimum wage; developments with respect to retailers that are out of our control; the impact from tariffs; future potential pandemics or health epidemics; Advantage’s ability to continue to generate significant operating cash flow; client procurement strategies and consolidation of Advantage’s clients’ industries creating pressure on the nature and pricing of its services; consumer goods manufacturers and retailers reviewing and changing their sales, retail, marketing and technology programs and relationships; Advantage’s ability to successfully develop and maintain relevant omni-channel services for our clients in an evolving industry and to otherwise adapt to significant technological change; Advantage’s ability to maintain proper and effective internal control over financial reporting in the future; Advantage’s substantial indebtedness and our ability to refinance at favorable rates; and other risks and uncertainties set forth in the section titled “Risk Factors” in the Annual Report on Form 10-K filed by the Company with the Securities and Exchange Commission (the “SEC”) on March 3, 2026, and in its other filings made from time to time with the SEC. These filings identify and address other important risks and uncertainties that could cause actual events and results to differ materially from those contained in the forward-looking statements. Forward-looking statements speak only as of the date they are made. Readers are cautioned not to put undue reliance on forward-looking statements, and Advantage assumes no obligation and does not intend to update or revise these forward-looking statements, whether as a result of new information, future events or otherwise, except as required by law. Non-GAAP Financial Measures and Related Information This presentation includes certain financial measures not presented in accordance with generally accepted accounting principles (“GAAP”), including Adjusted EBITDA, Adjusted EBITDA by Segment, Adjusted EBITDA margin, Revenues net of reimbursable expenses (“net revenues”), Net Debt, Adjusted Unlevered Free Cash Flow and Net Debt as a percentage of Last Twelve Months (“LTM”). These are not measures of financial performance calculated in accordance with GAAP and may exclude items that are significant in understanding and assessing Advantage’s financial results. Therefore, the measures are in addition to, and not a substitute for or superior to, measures of financial performance prepared in accordance with GAAP, and should not be considered in isolation or as an alternative to net income, cash flows from operations or other measures of profitability, liquidity or performance under GAAP. You should be aware that Advantage’s presentation of these measures may not be comparable to similarly titled measures used by other companies. Reconciliations of historical non-GAAP measures to their most directly comparable GAAP counterparts are included below. Advantage believes these non-GAAP measures provide useful information to management and investors regarding certain financial and business trends relating to Advantage’s financial condition and results of operations. Advantage believes that the use of Adjusted EBITDA, Adjusted EBITDA by Segment, Adjusted EBITDA margin, Revenues net of reimbursable expenses (“net revenues”), Net Debt, Adjusted Unlevered Free Cash Flow, Net Debt as a percentage of Last Twelve Months (“LTM”) provide an additional tool for investors to use in evaluating ongoing operating results and trends and in comparing Advantage’s financial measures with other similar companies, many of which present similar non-GAAP financial measures to investors. Non-GAAP financial measures are subject to inherent limitations as they reflect the exercise of judgments by management about which expense and income are excluded or included in determining these non-GAAP financial measures. Additionally, other companies may calculate non-GAAP measures differently, or may use other measures to calculate their financial performance, and therefore the Company's non-GAAP measures may not be directly comparable to similarly titled measures of other companies. Adjusted EBITDA consists of net loss before interest, taxes, depreciation and amortization, further adjusted for (i) non-operating income or expense and (ii) the impact of certain non-cash, nonrecurring or other items included in net (loss) income that we do not consider indicative of our ongoing operating performance, which may include acquisition and divestiture related expenses, gains and losses; stock-based compensation expenses; litigation expenses, net of recoveries on matters not representative of our ongoing business; impairments; incremental expenses on restructuring and reorganization activities associated with certain transformation programs. A full listing of adjustments to net loss are provided elsewhere in this document. Adjusted EBITDA by Segment consists of operating (loss) income by segment before interest, taxes, depreciation and amortization, further adjusted for the impact of certain non-cash, nonrecurring or other items included in net (loss) income that we do not consider indicative of our ongoing operating performance, which may include acquisition and divestiture related expenses, gains and losses; stock-based compensation expenses; litigation expenses, net of recoveries on matters not representative of our ongoing business; impairments; incremental expenses on restructuring and reorganization activities associated with certain transformation programs. A full listing of adjustments to operating income (loss) are provided elsewhere in this document. Adjusted EBITDA Margin means Adjusted EBITDA divided by net revenues. Revenues net of reimbursable expenses ("net revenues") and by segment means revenues less reimbursable expenses that are paid by Advantage's clients, including media, product samples, retailer fees, and other marketing and production costs. Net Debt represents the sum of current portion of long-term debt and long-term debt, less cash and cash equivalents. With respect to Net Debt, cash and cash equivalents are subtracted from the GAAP measure, total debt, because they could be used to reduce the debt obligations. We present Net Debt because we believe this non-GAAP measure provides useful information to management and investors regarding certain financial and business trends relating to the Company’s financial condition and to evaluate changes to the Company's capital structure and credit quality assessment. Adjusted Unlevered Free Cash Flow represents net cash provided by (used in) operating activities less purchase of property and equipment as disclosed in the Statements of Cash Flows further adjusted by (i) cash payments for interest, (ii) cash received from interest rate derivatives, (iii) cash paid for income taxes; (iv) cash paid for acquisition and divestiture related expenses, (v) cash paid for restructuring expenses, (vi) cash paid for reorganization expenses, including debt financing costs, (vii) cash paid for contingent earnout payments included in operating cash flow, (viii) COVID-19 benefits received, (ix) net effect of foreign currency fluctuations on cash, and (x) other adjustments that management believes are helpful in evaluating our operating performance. Adjusted Unlevered Free Cash Flow as a percentage of Adjusted EBITDA means Adjusted Unlevered Free Cash Flow divided by Adjusted EBITDA. Due to rounding, numbers presented throughout this document may not add up precisely to the totals provided and percentages may not precisely reflect the absolute figures. 2
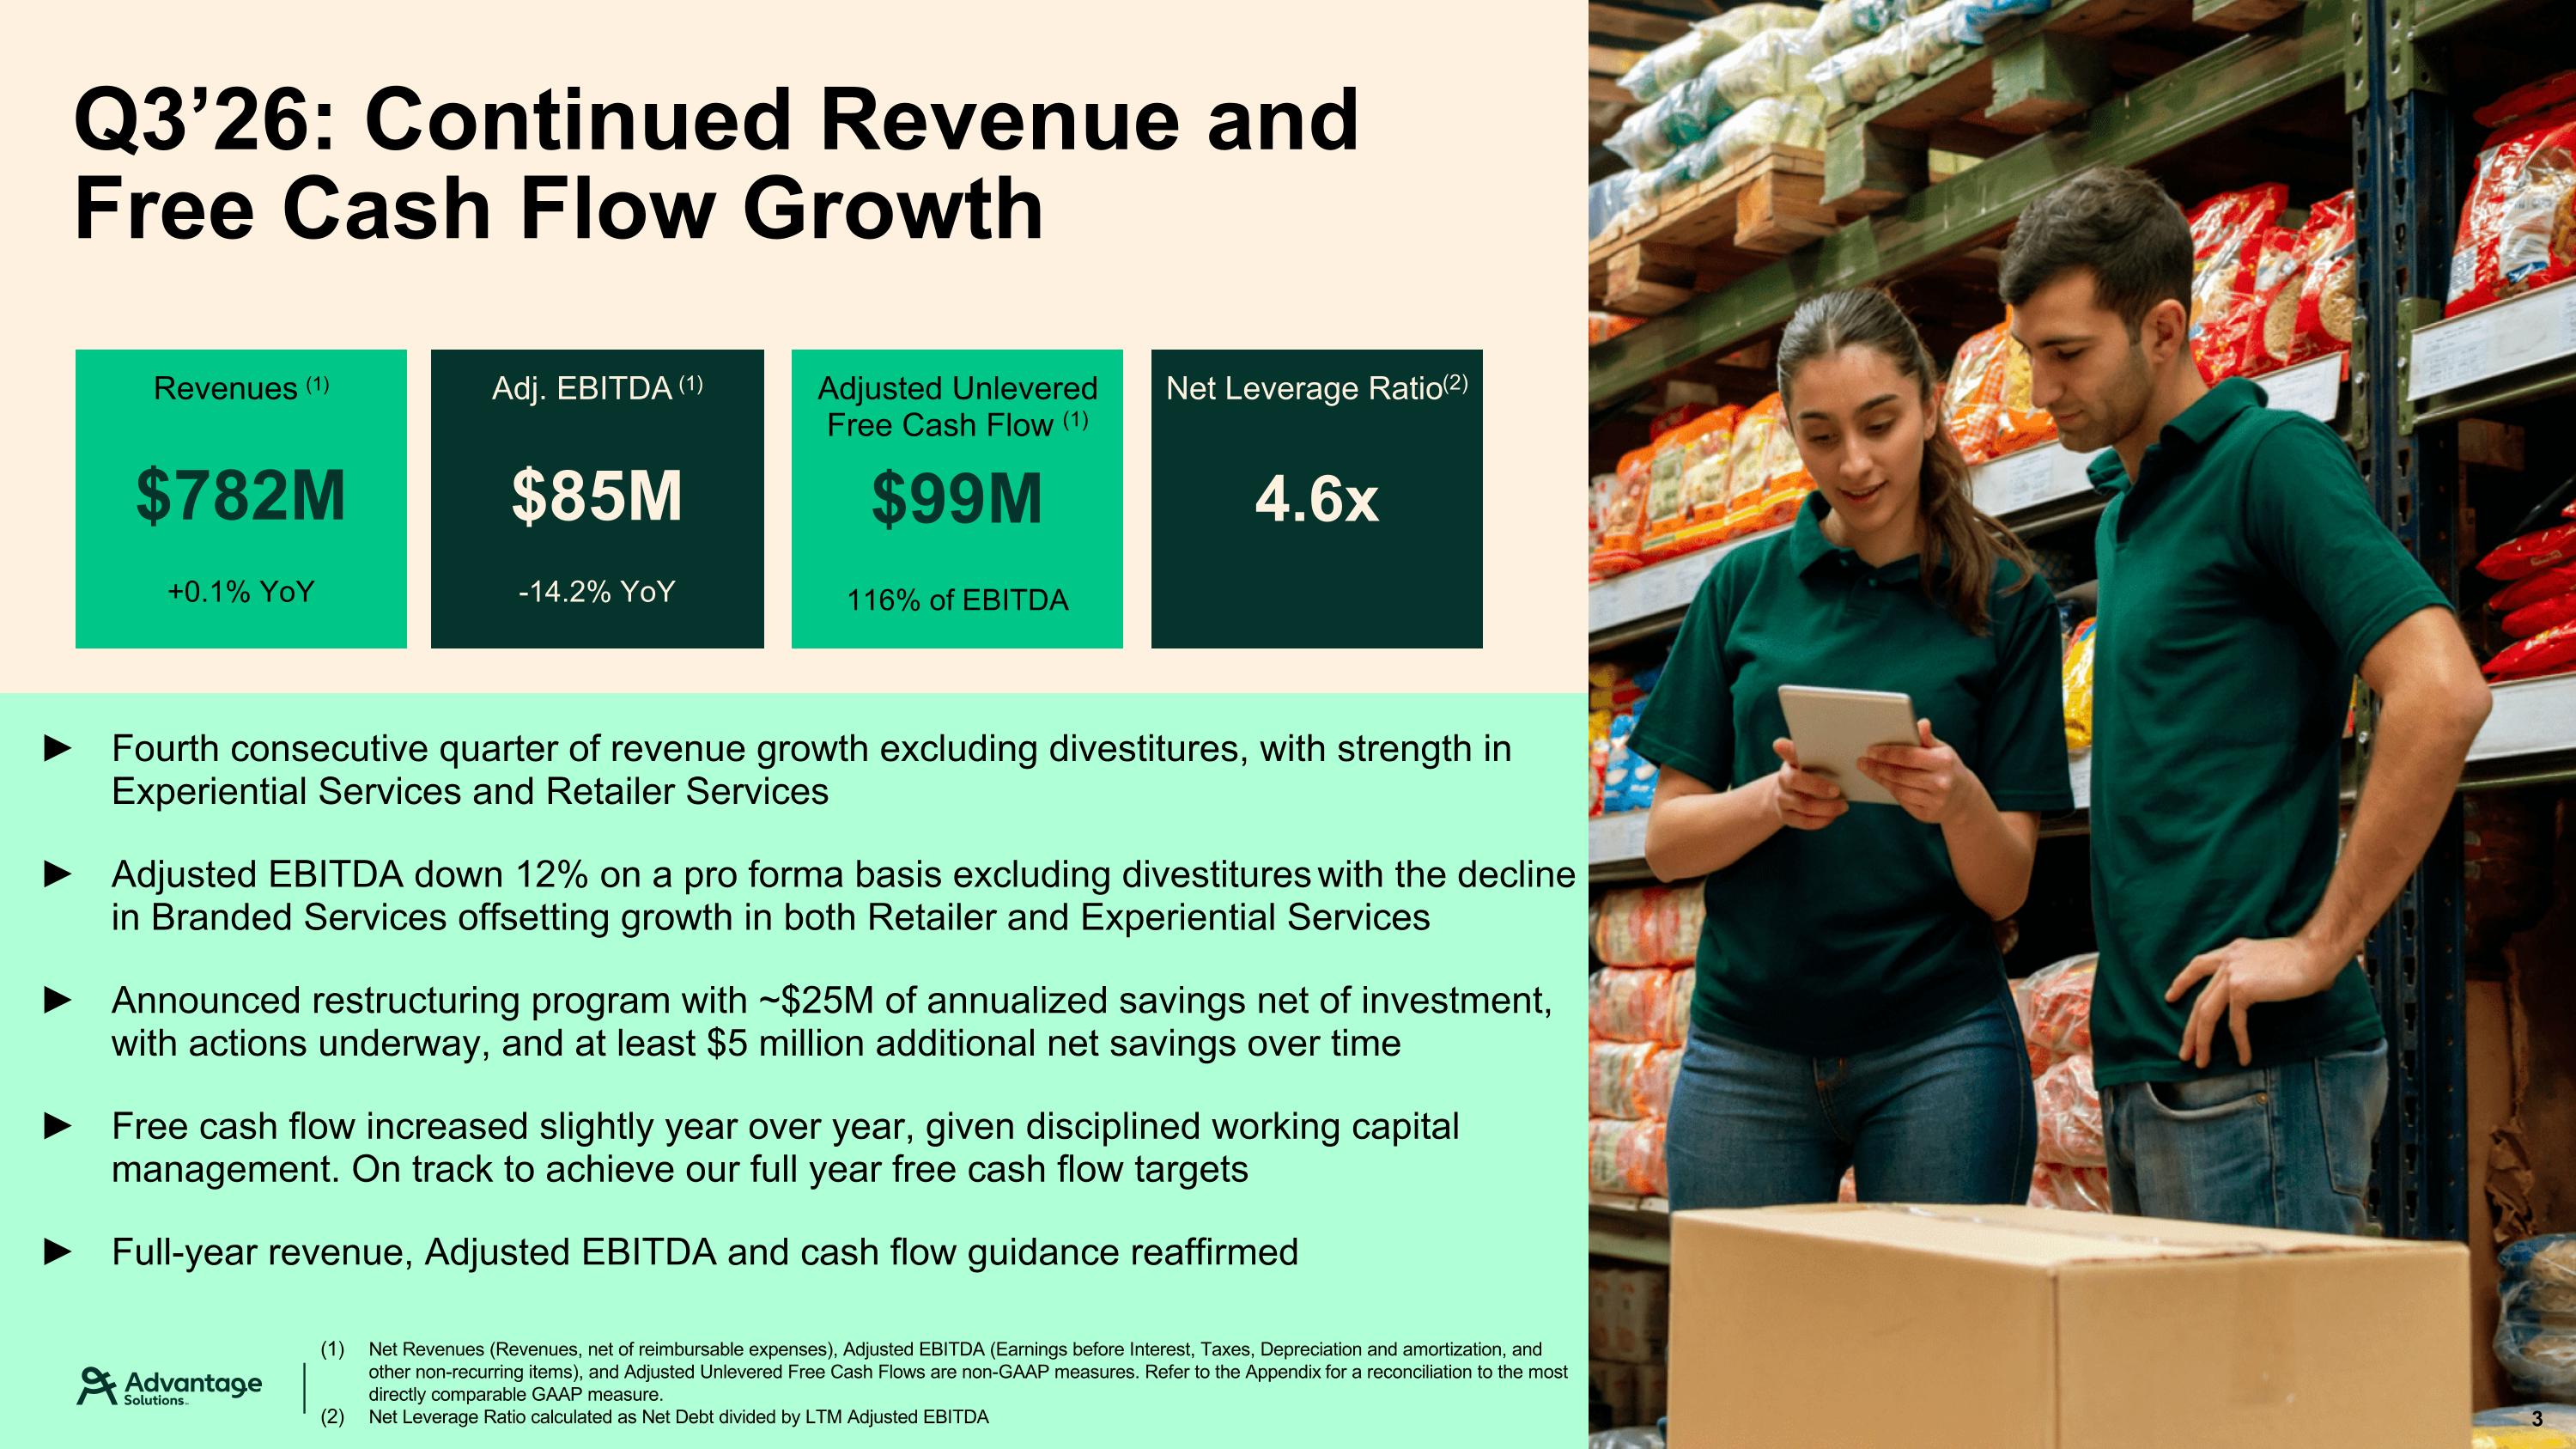
Q3’26: Continued Revenue and Free Cash Flow Growth Fourth consecutive quarter of revenue growth excluding divestitures, with strength in Experiential Services and Retailer Services Adjusted EBITDA down 12% on a pro forma basis excluding divestitures with the decline in Branded Services offsetting growth in both Retailer and Experiential Services Announced restructuring program with ~$25M of annualized savings net of investment, with actions underway, and at least $5 million additional net savings over time Free cash flow increased slightly year over year, given disciplined working capital management. On track to achieve our full year free cash flow targets Full-year revenue, Adjusted EBITDA and cash flow guidance reaffirmed Revenues (1) +0.1% YoY $782M Adj. EBITDA (1) -14.2% YoY $85M Adjusted Unlevered Free Cash Flow (1) 116% of EBITDA $99M Net Leverage Ratio(2) 4.6x Net Revenues (Revenues, net of reimbursable expenses), Adjusted EBITDA (Earnings before Interest, Taxes, Depreciation and amortization, and other non-recurring items), and Adjusted Unlevered Free Cash Flows are non-GAAP measures. Refer to the Appendix for a reconciliation to the most directly comparable GAAP measure. Net Leverage Ratio calculated as Net Debt divided by LTM Adjusted EBITDA 3
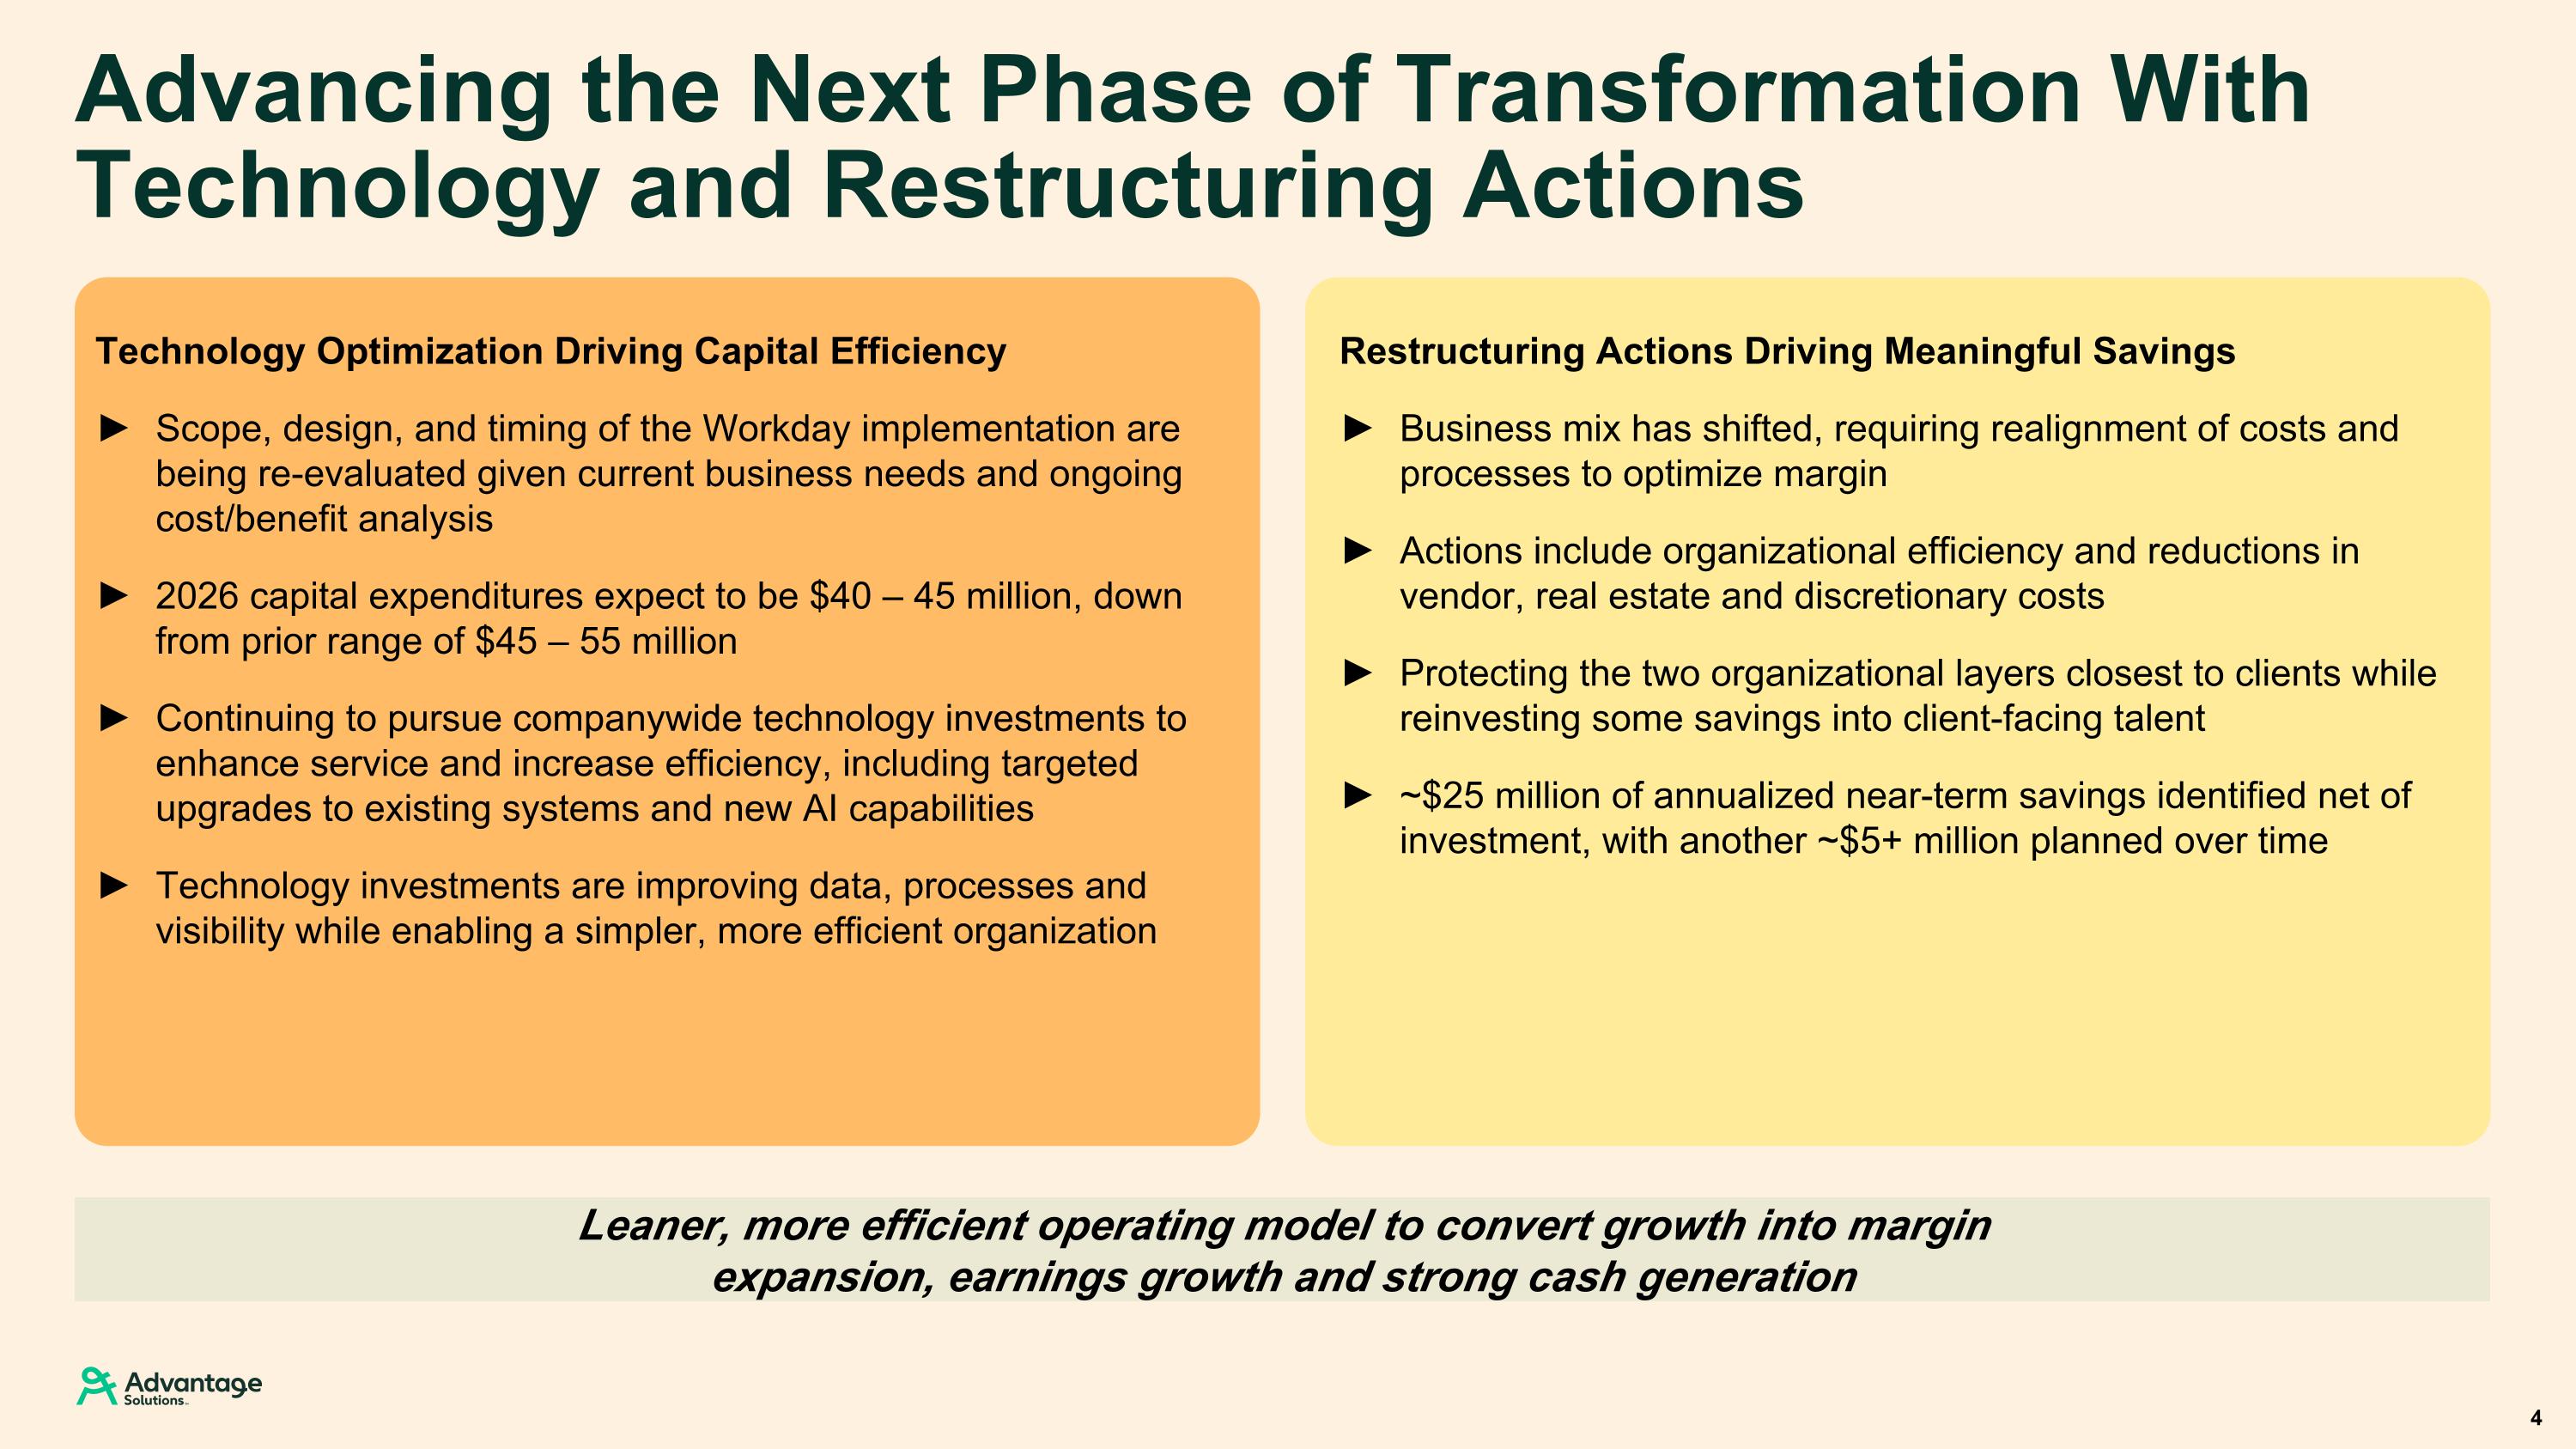
Leaner, more efficient operating model to convert growth into margin expansion, earnings growth and strong cash generation Advancing the Next Phase of Transformation With Technology and Restructuring Actions 4 Technology Optimization Driving Capital Efficiency Scope, design, and timing of the Workday implementation are being re-evaluated given current business needs and ongoing cost/benefit analysis 2026 capital expenditures expect to be $40 – 45 million, down from prior range of $45 – 55 million Continuing to pursue companywide technology investments to enhance service and increase efficiency, including targeted upgrades to existing systems and new AI capabilities Technology investments are improving data, processes and visibility while enabling a simpler, more efficient organization Restructuring Actions Driving Meaningful Savings Business mix has shifted, requiring realignment of costs and processes to optimize margin Actions include organizational efficiency and reductions in vendor, real estate and discretionary costs Protecting the two organizational layers closest to clients while reinvesting some savings into client-facing talent ~$25 million of annualized near-term savings identified net of investment, with another ~$5+ million planned over time
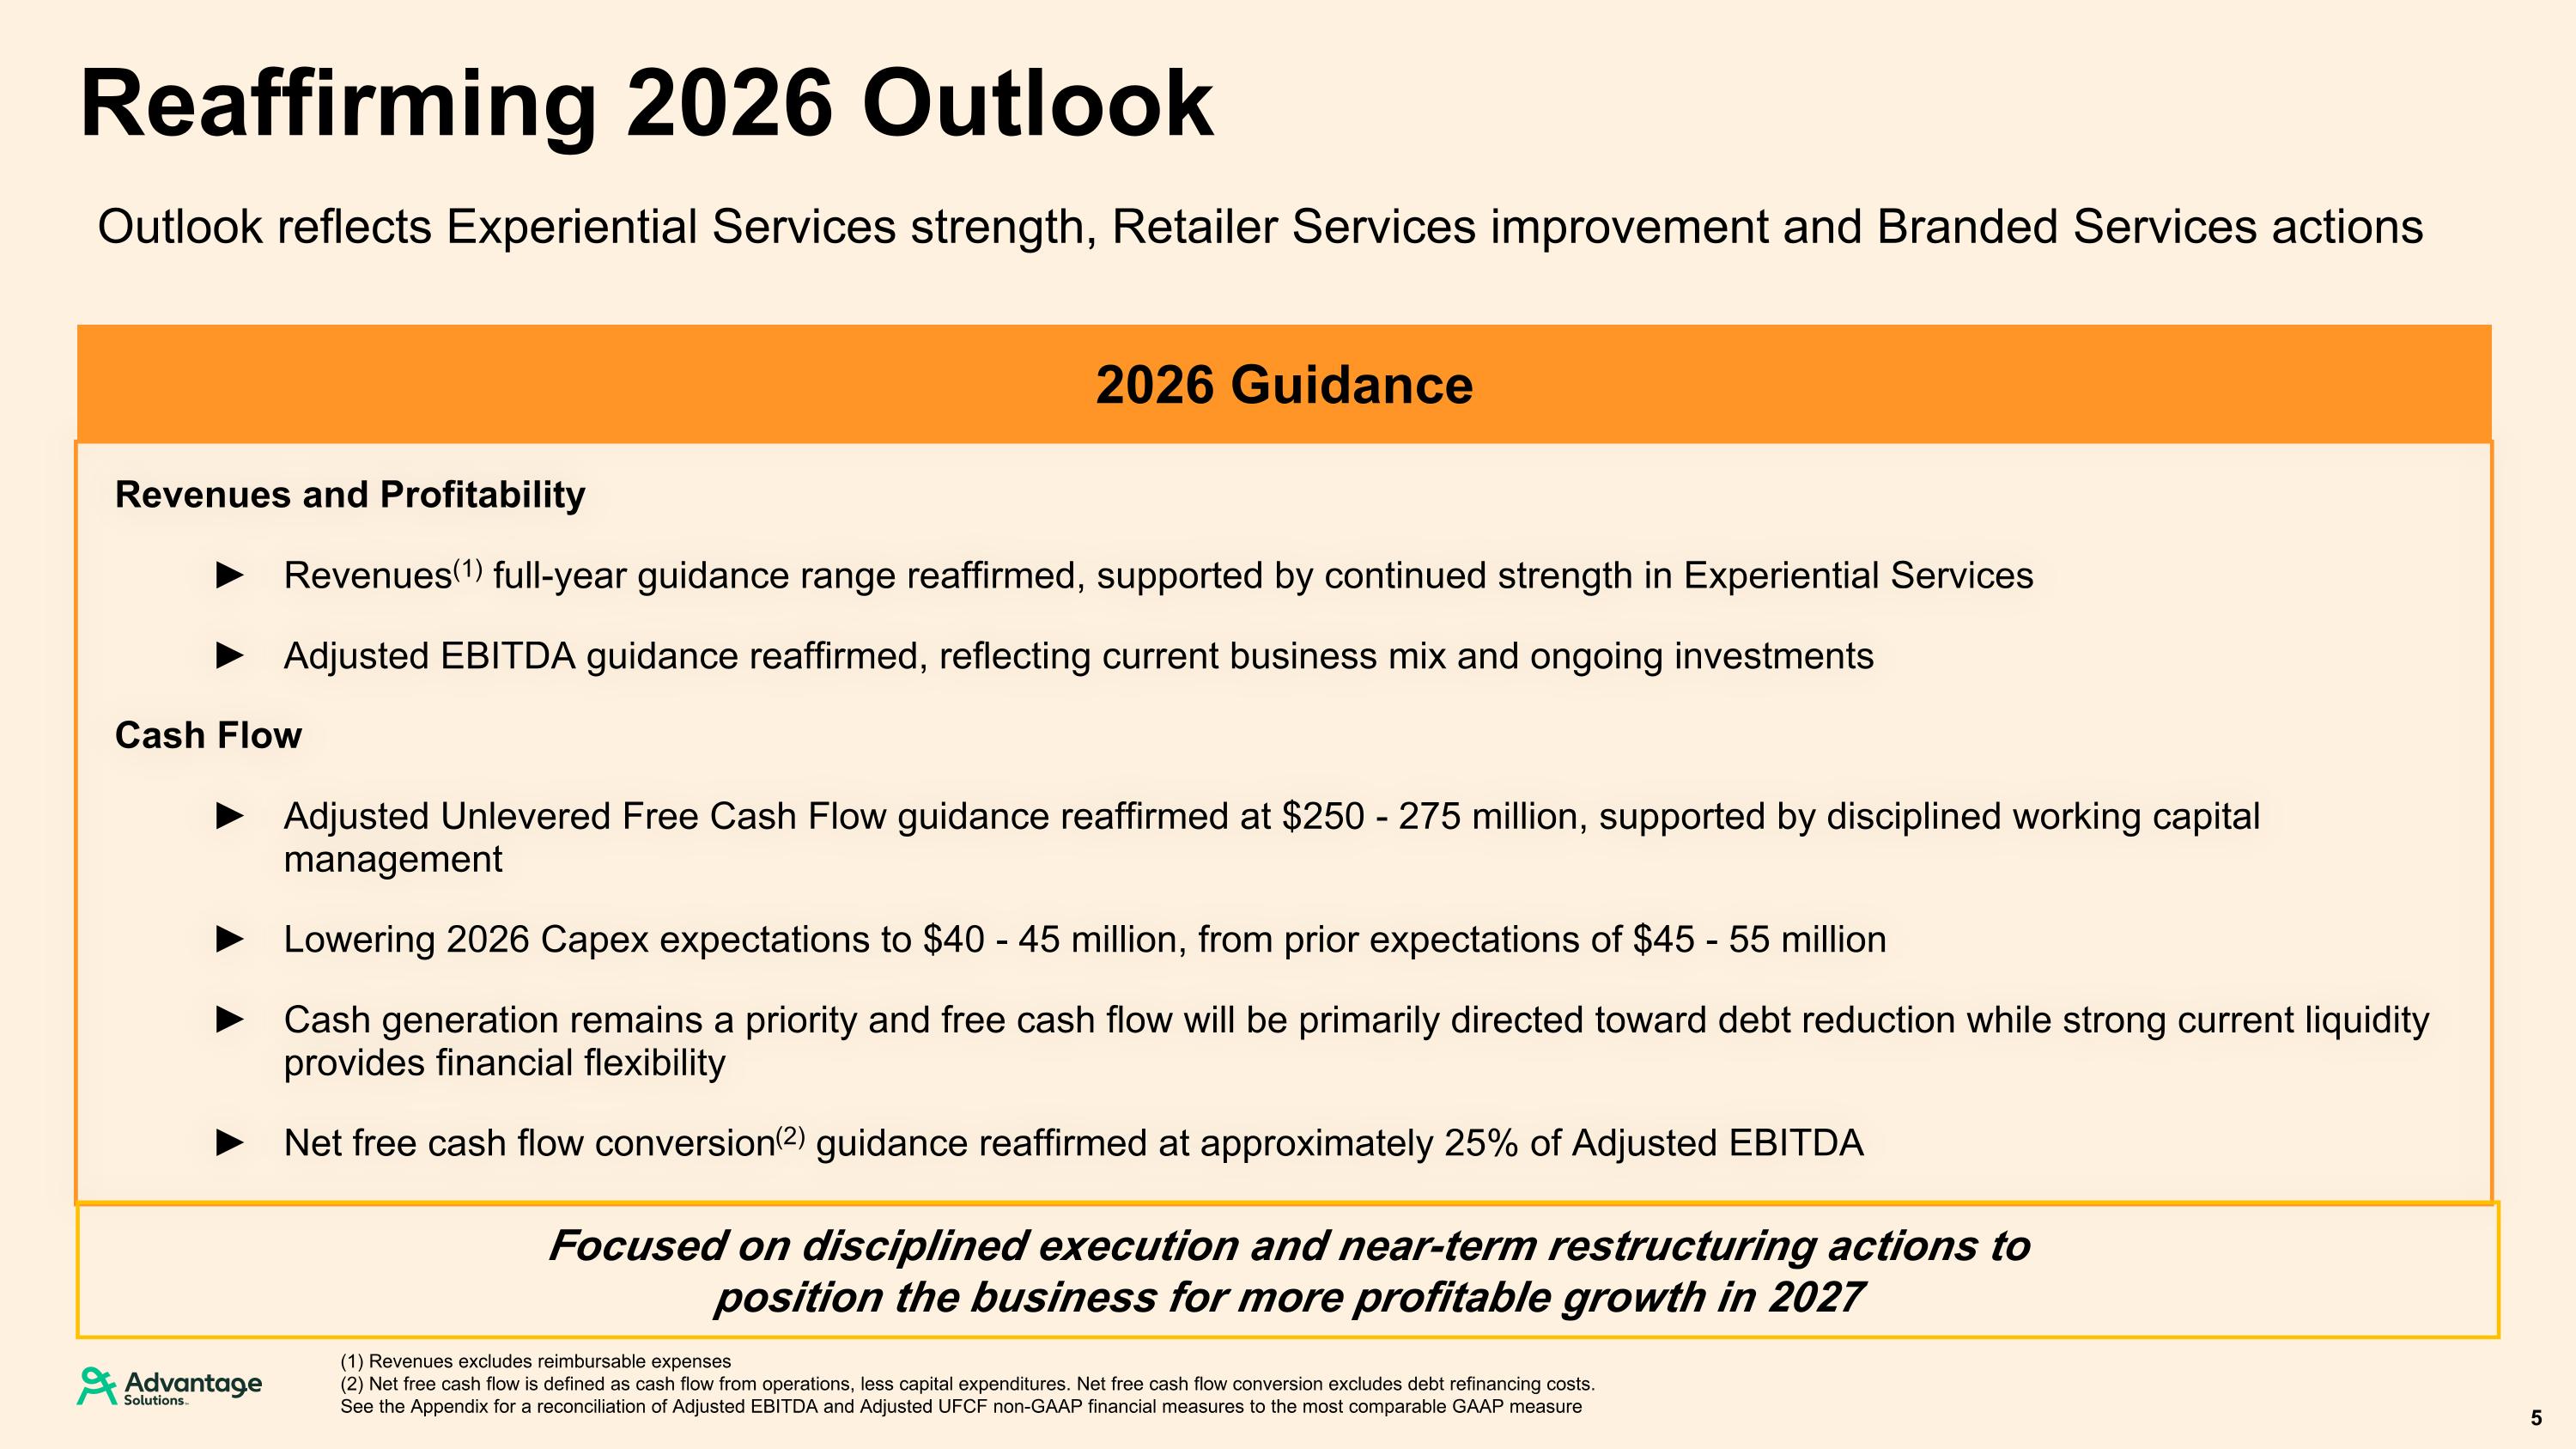
Reaffirming 2026 Outlook 5 (1) Revenues excludes reimbursable expenses (2) Net free cash flow is defined as cash flow from operations, less capital expenditures. Net free cash flow conversion excludes debt refinancing costs. See the Appendix for a reconciliation of Adjusted EBITDA and Adjusted UFCF non-GAAP financial measures to the most comparable GAAP measure Revenues and Profitability Revenues(1) full-year guidance range reaffirmed, supported by continued strength in Experiential Services Adjusted EBITDA guidance reaffirmed, reflecting current business mix and ongoing investments Cash Flow Adjusted Unlevered Free Cash Flow guidance reaffirmed at $250 - 275 million, supported by disciplined working capital management Lowering 2026 Capex expectations to $40 - 45 million, from prior expectations of $45 - 55 million Cash generation remains a priority and free cash flow will be primarily directed toward debt reduction while strong current liquidity provides financial flexibility Net free cash flow conversion(2) guidance reaffirmed at approximately 25% of Adjusted EBITDA 2026 Guidance Outlook reflects Experiential Services strength, Retailer Services improvement and Branded Services actions Focused on disciplined execution and near-term restructuring actions to position the business for more profitable growth in 2027
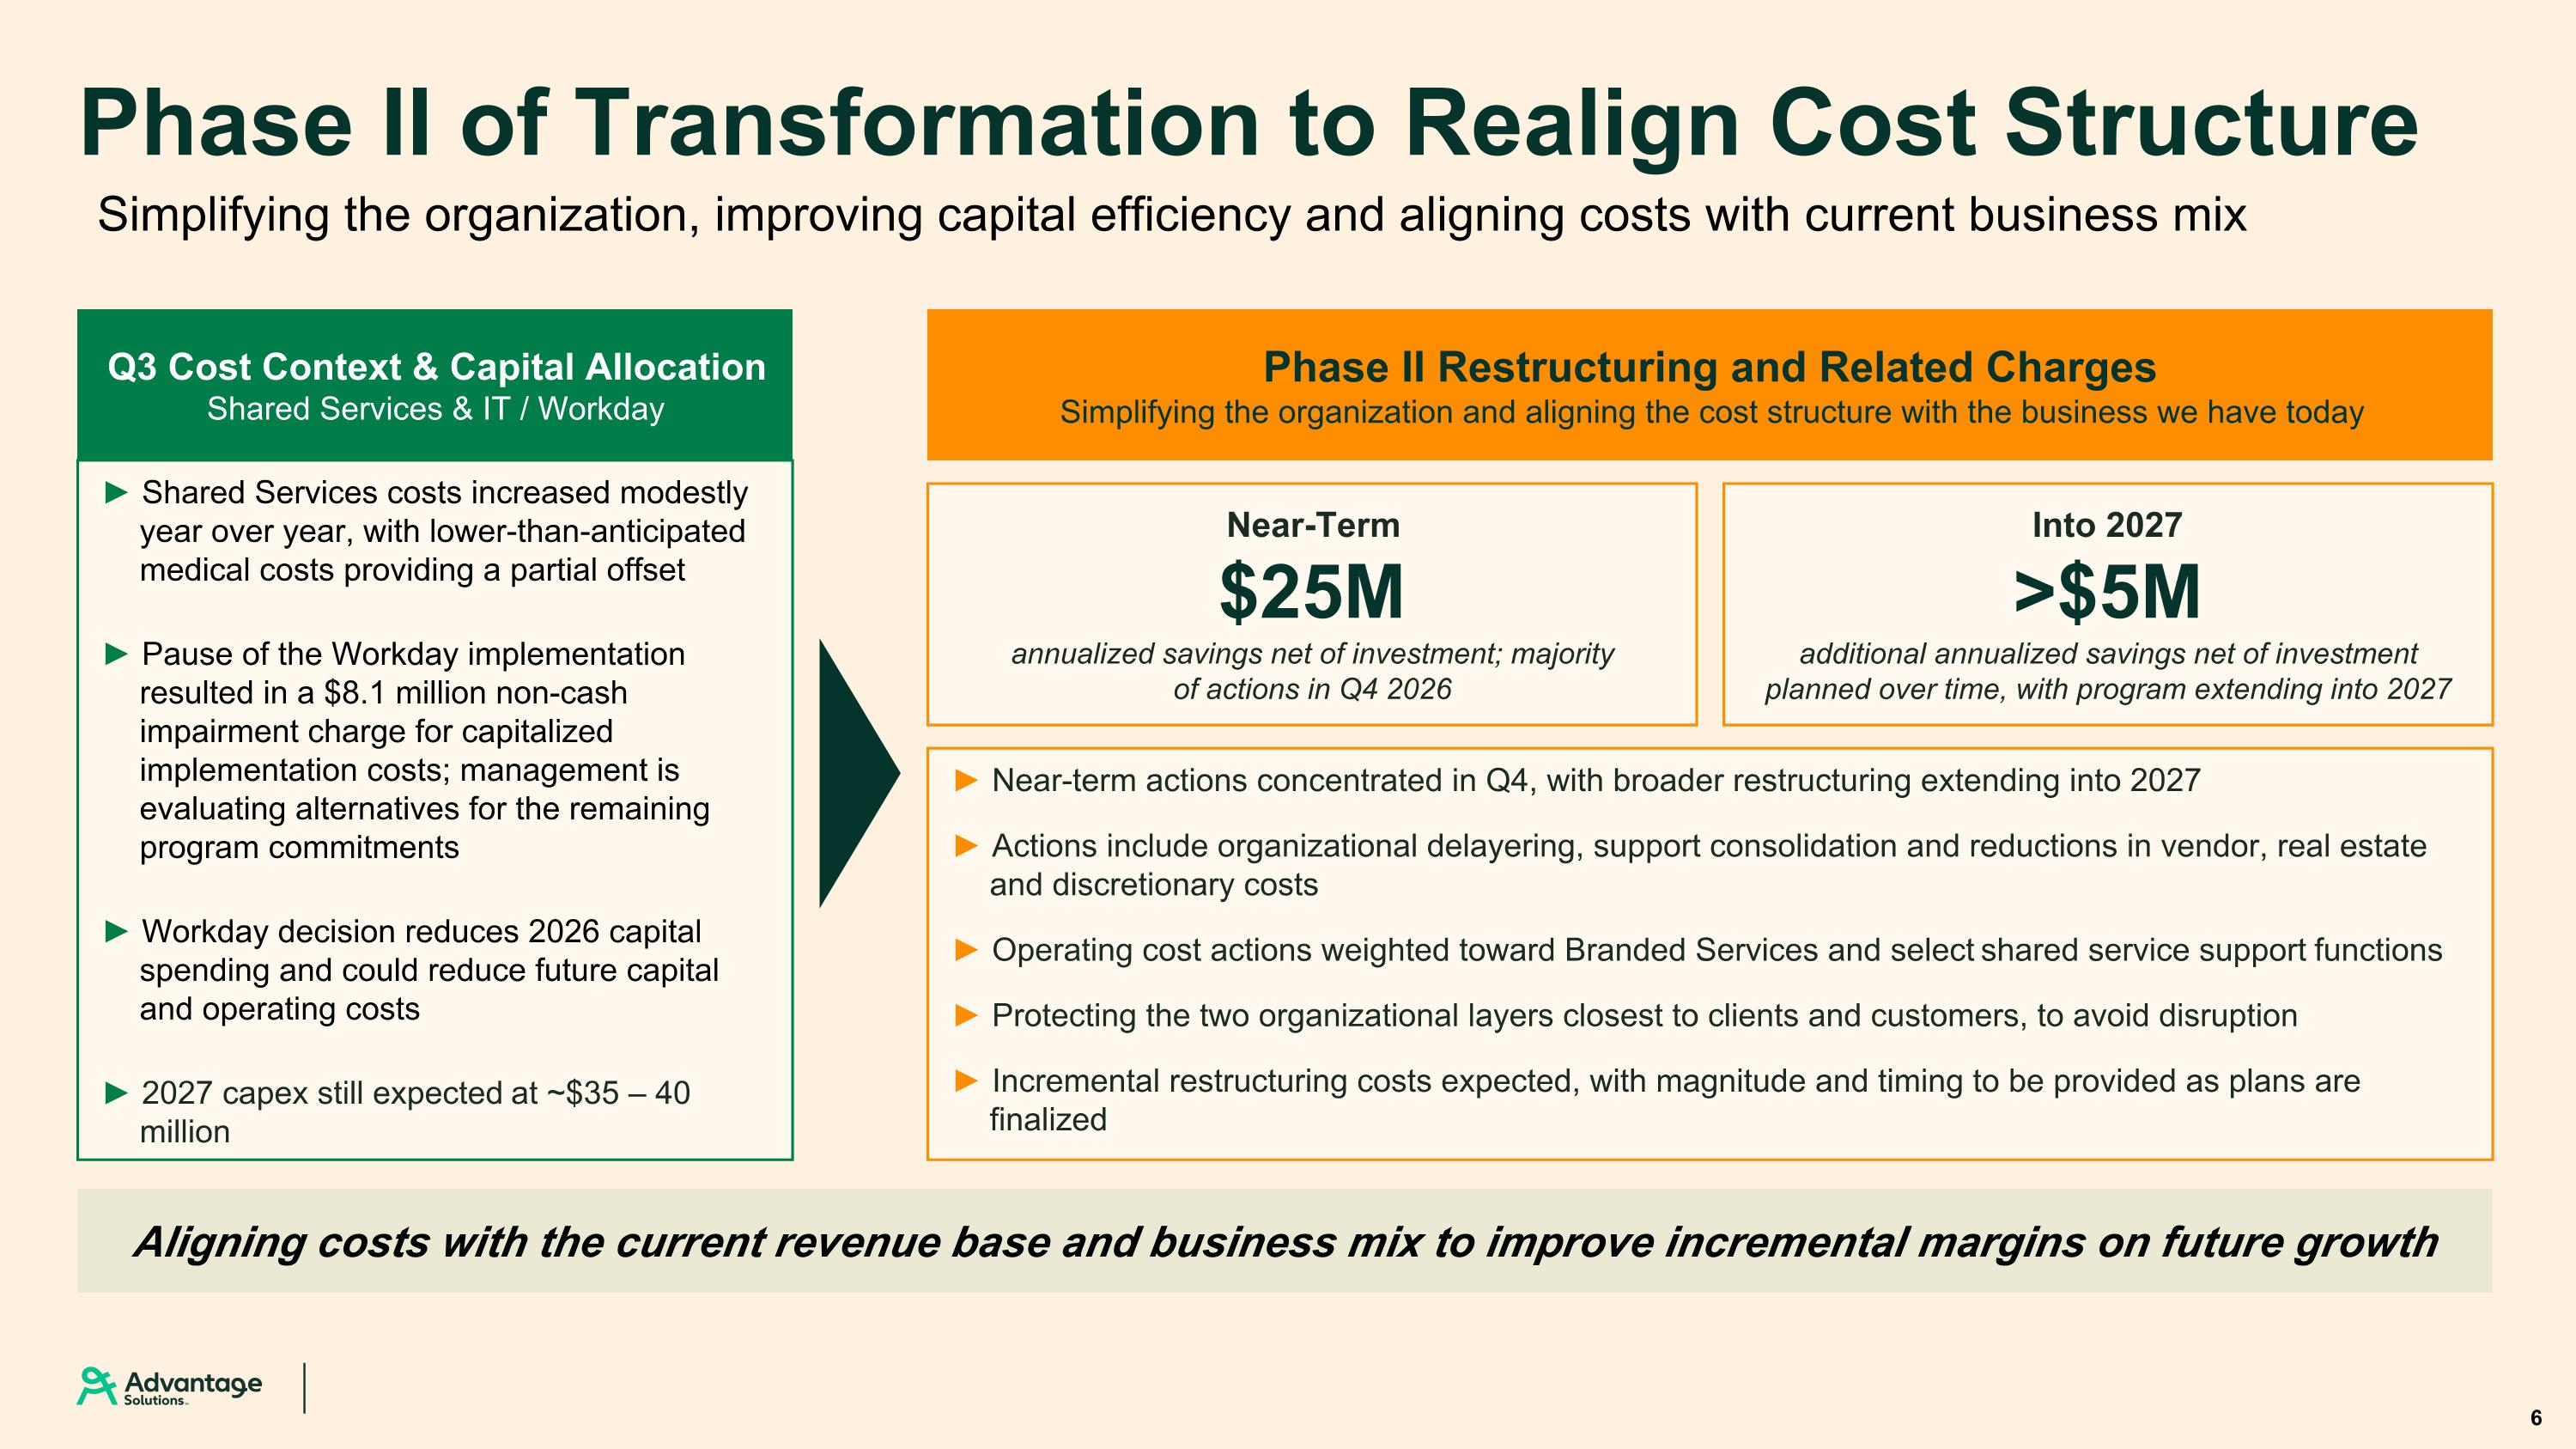
Phase II of Transformation to Realign Cost Structure 6 Simplifying the organization, improving capital efficiency and aligning costs with current business mix Q3 Cost Context & Capital Allocation Shared Services & IT / Workday ► Shared Services costs increased modestly year over year, with lower-than-anticipated medical costs providing a partial offset ► Pause of the Workday implementation resulted in a $8.1 million non-cash impairment charge for capitalized implementation costs; management is evaluating alternatives for the remaining program commitments ► Workday decision reduces 2026 capital spending and could reduce future capital and operating costs ► 2027 capex still expected at ~$35 – 40 million Phase II Restructuring and Related Charges Simplifying the organization and aligning the cost structure with the business we have today Near-Term $25M annualized savings net of investment; majority of actions in Q4 2026 Into 2027 >$5M additional annualized savings net of investment planned over time, with program extending into 2027 ► Near-term actions concentrated in Q4, with broader restructuring extending into 2027 ► Actions include organizational delayering, support consolidation and reductions in vendor, real estate and discretionary costs ► Operating cost actions weighted toward Branded Services and select shared service support functions ► Protecting the two organizational layers closest to clients and customers, to avoid disruption ► Incremental restructuring costs expected, with magnitude and timing to be provided as plans are finalized Aligning costs with the current revenue base and business mix to improve incremental margins on future growth
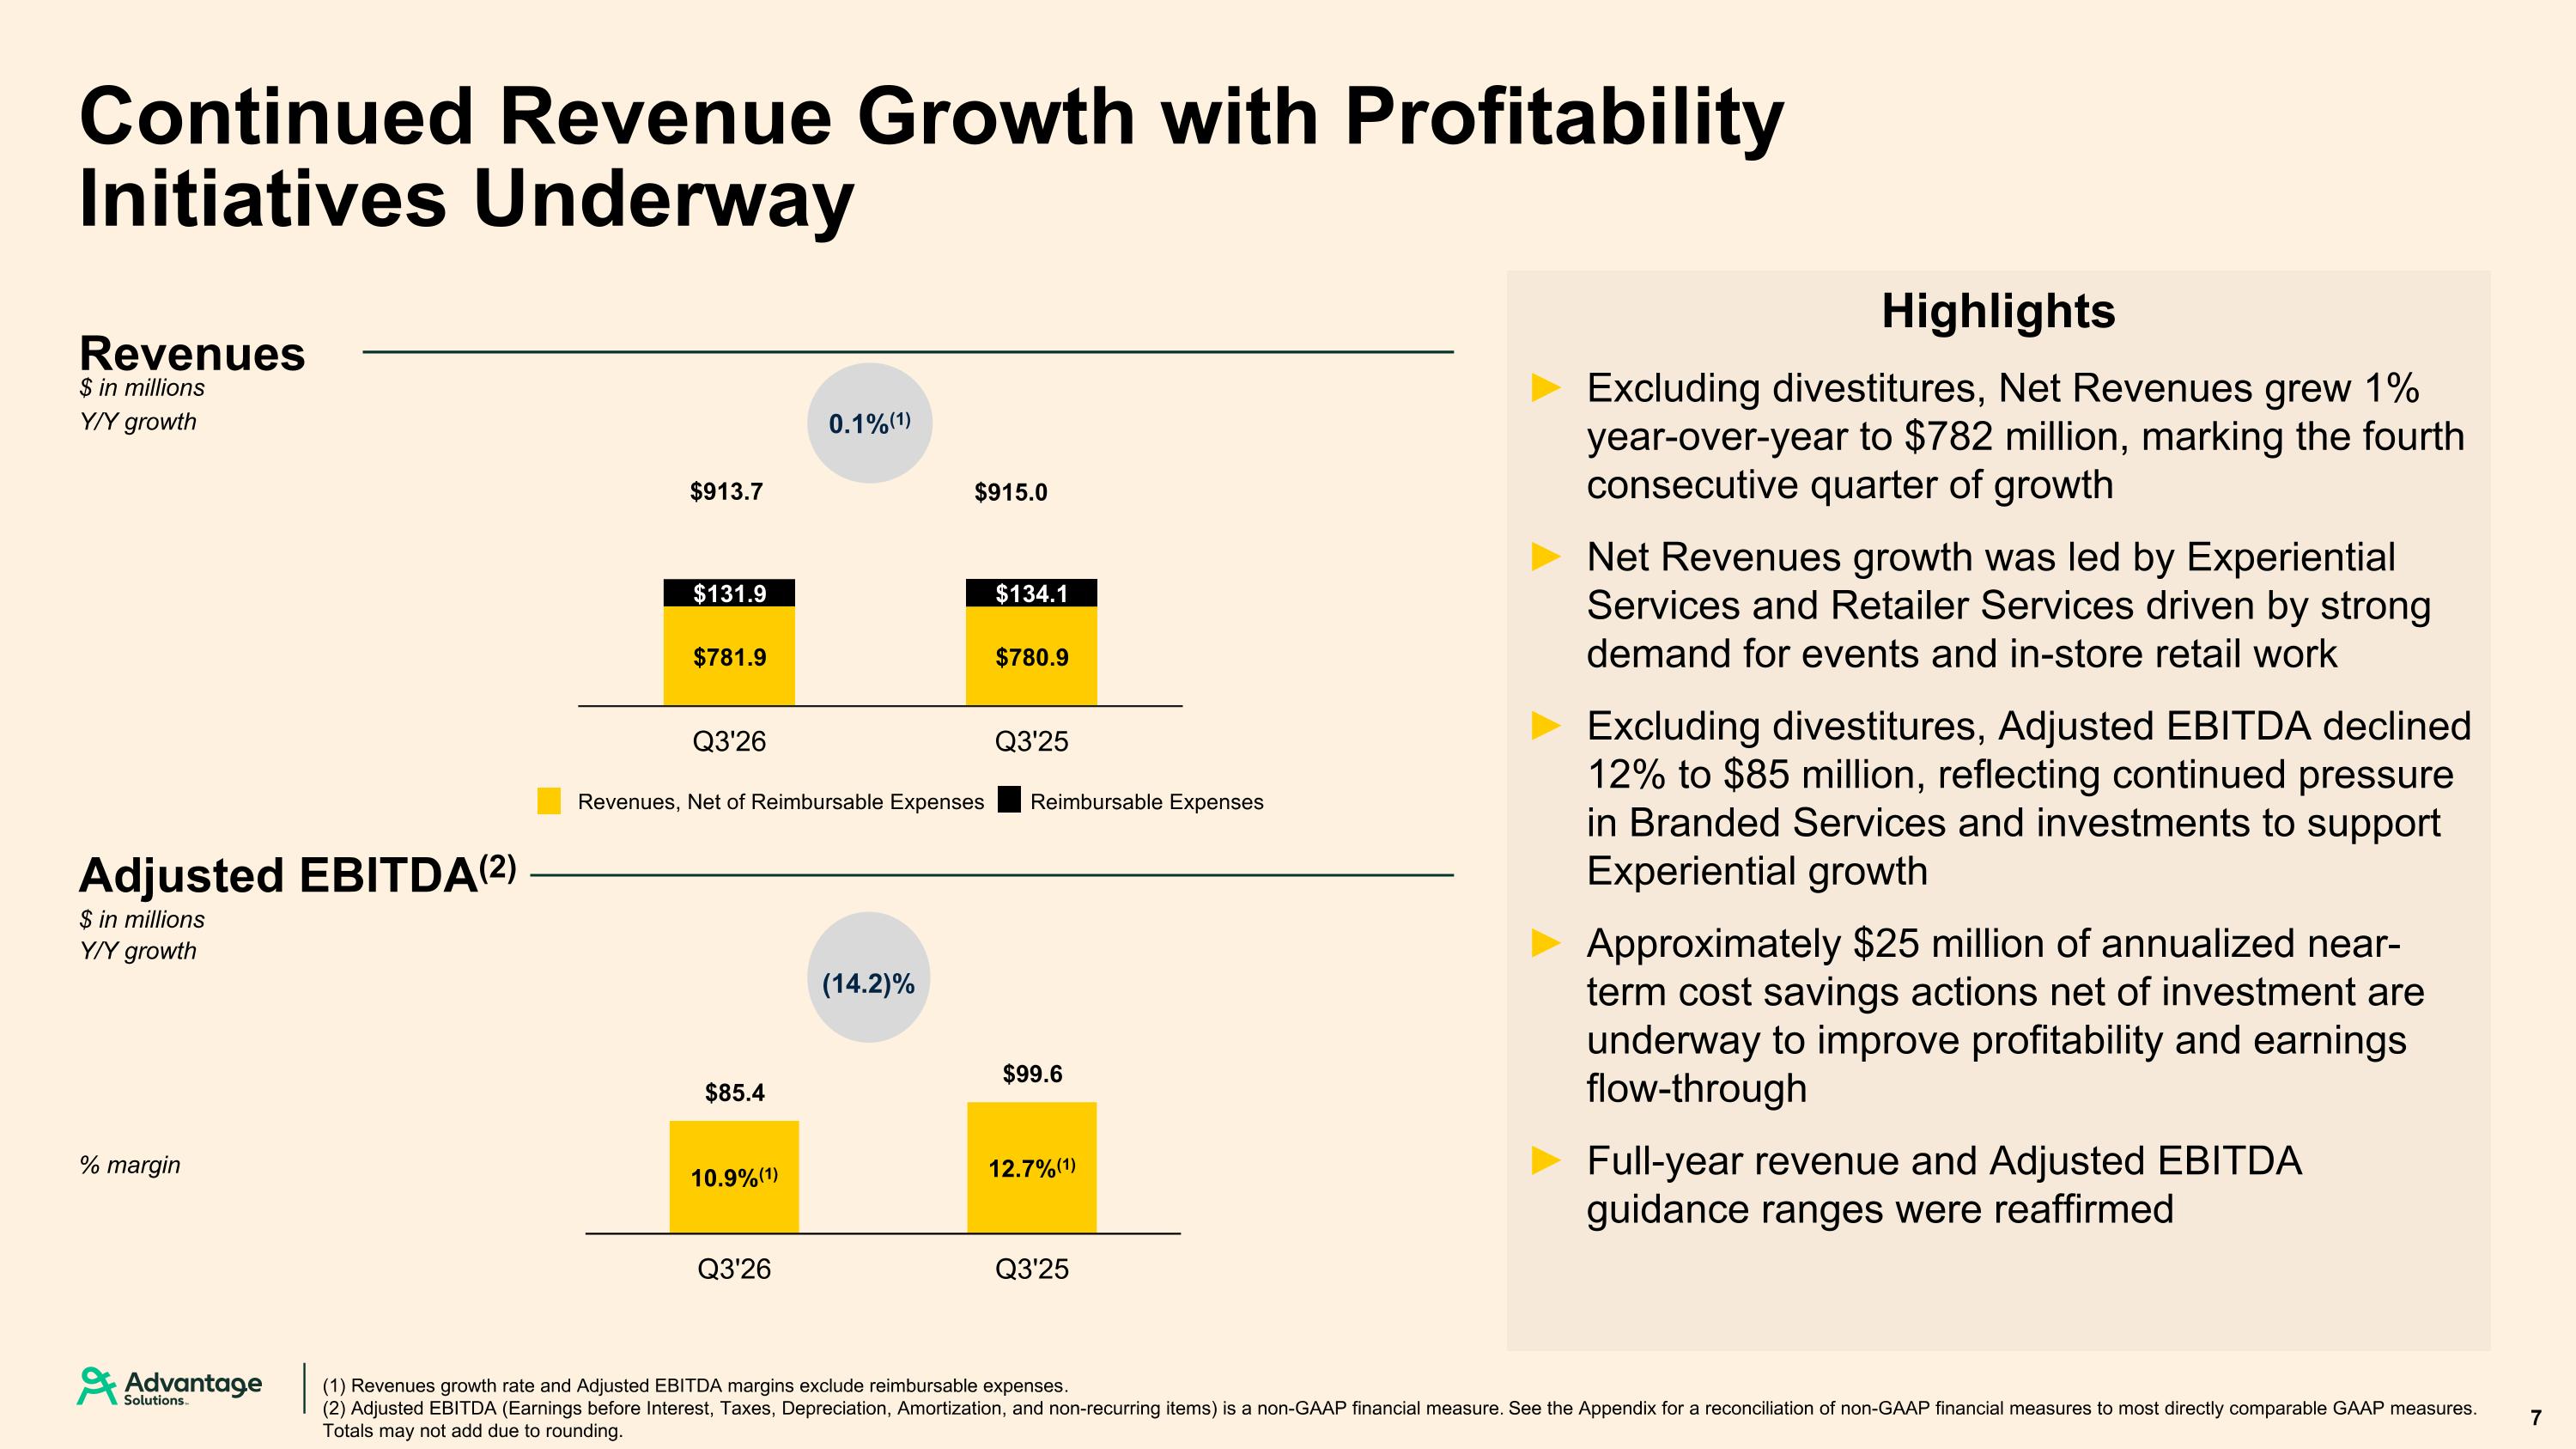
$915.0 Highlights Excluding divestitures, Net Revenues grew 1% year-over-year to $782 million, marking the fourth consecutive quarter of growth Net Revenues growth was led by Experiential Services and Retailer Services driven by strong demand for events and in-store retail work Excluding divestitures, Adjusted EBITDA declined 12% to $85 million, reflecting continued pressure in Branded Services and investments to support Experiential growth Approximately $25 million of annualized near-term cost savings actions net of investment are underway to improve profitability and earnings flow-through Full-year revenue and Adjusted EBITDA guidance ranges were reaffirmed Continued Revenue Growth with Profitability Initiatives Underway (1) Revenues growth rate and Adjusted EBITDA margins exclude reimbursable expenses. (2) Adjusted EBITDA (Earnings before Interest, Taxes, Depreciation, Amortization, and non-recurring items) is a non-GAAP financial measure. See the Appendix for a reconciliation of non-GAAP financial measures to most directly comparable GAAP measures. Totals may not add due to rounding. (14.2)% Revenues, Net of Reimbursable Expenses Reimbursable Expenses 7 0.1%(1) Revenues $ in millions Y/Y growth % margin $ in millions Y/Y growth Adjusted EBITDA(2) $913.7 10.9%(1) 12.7%(1)
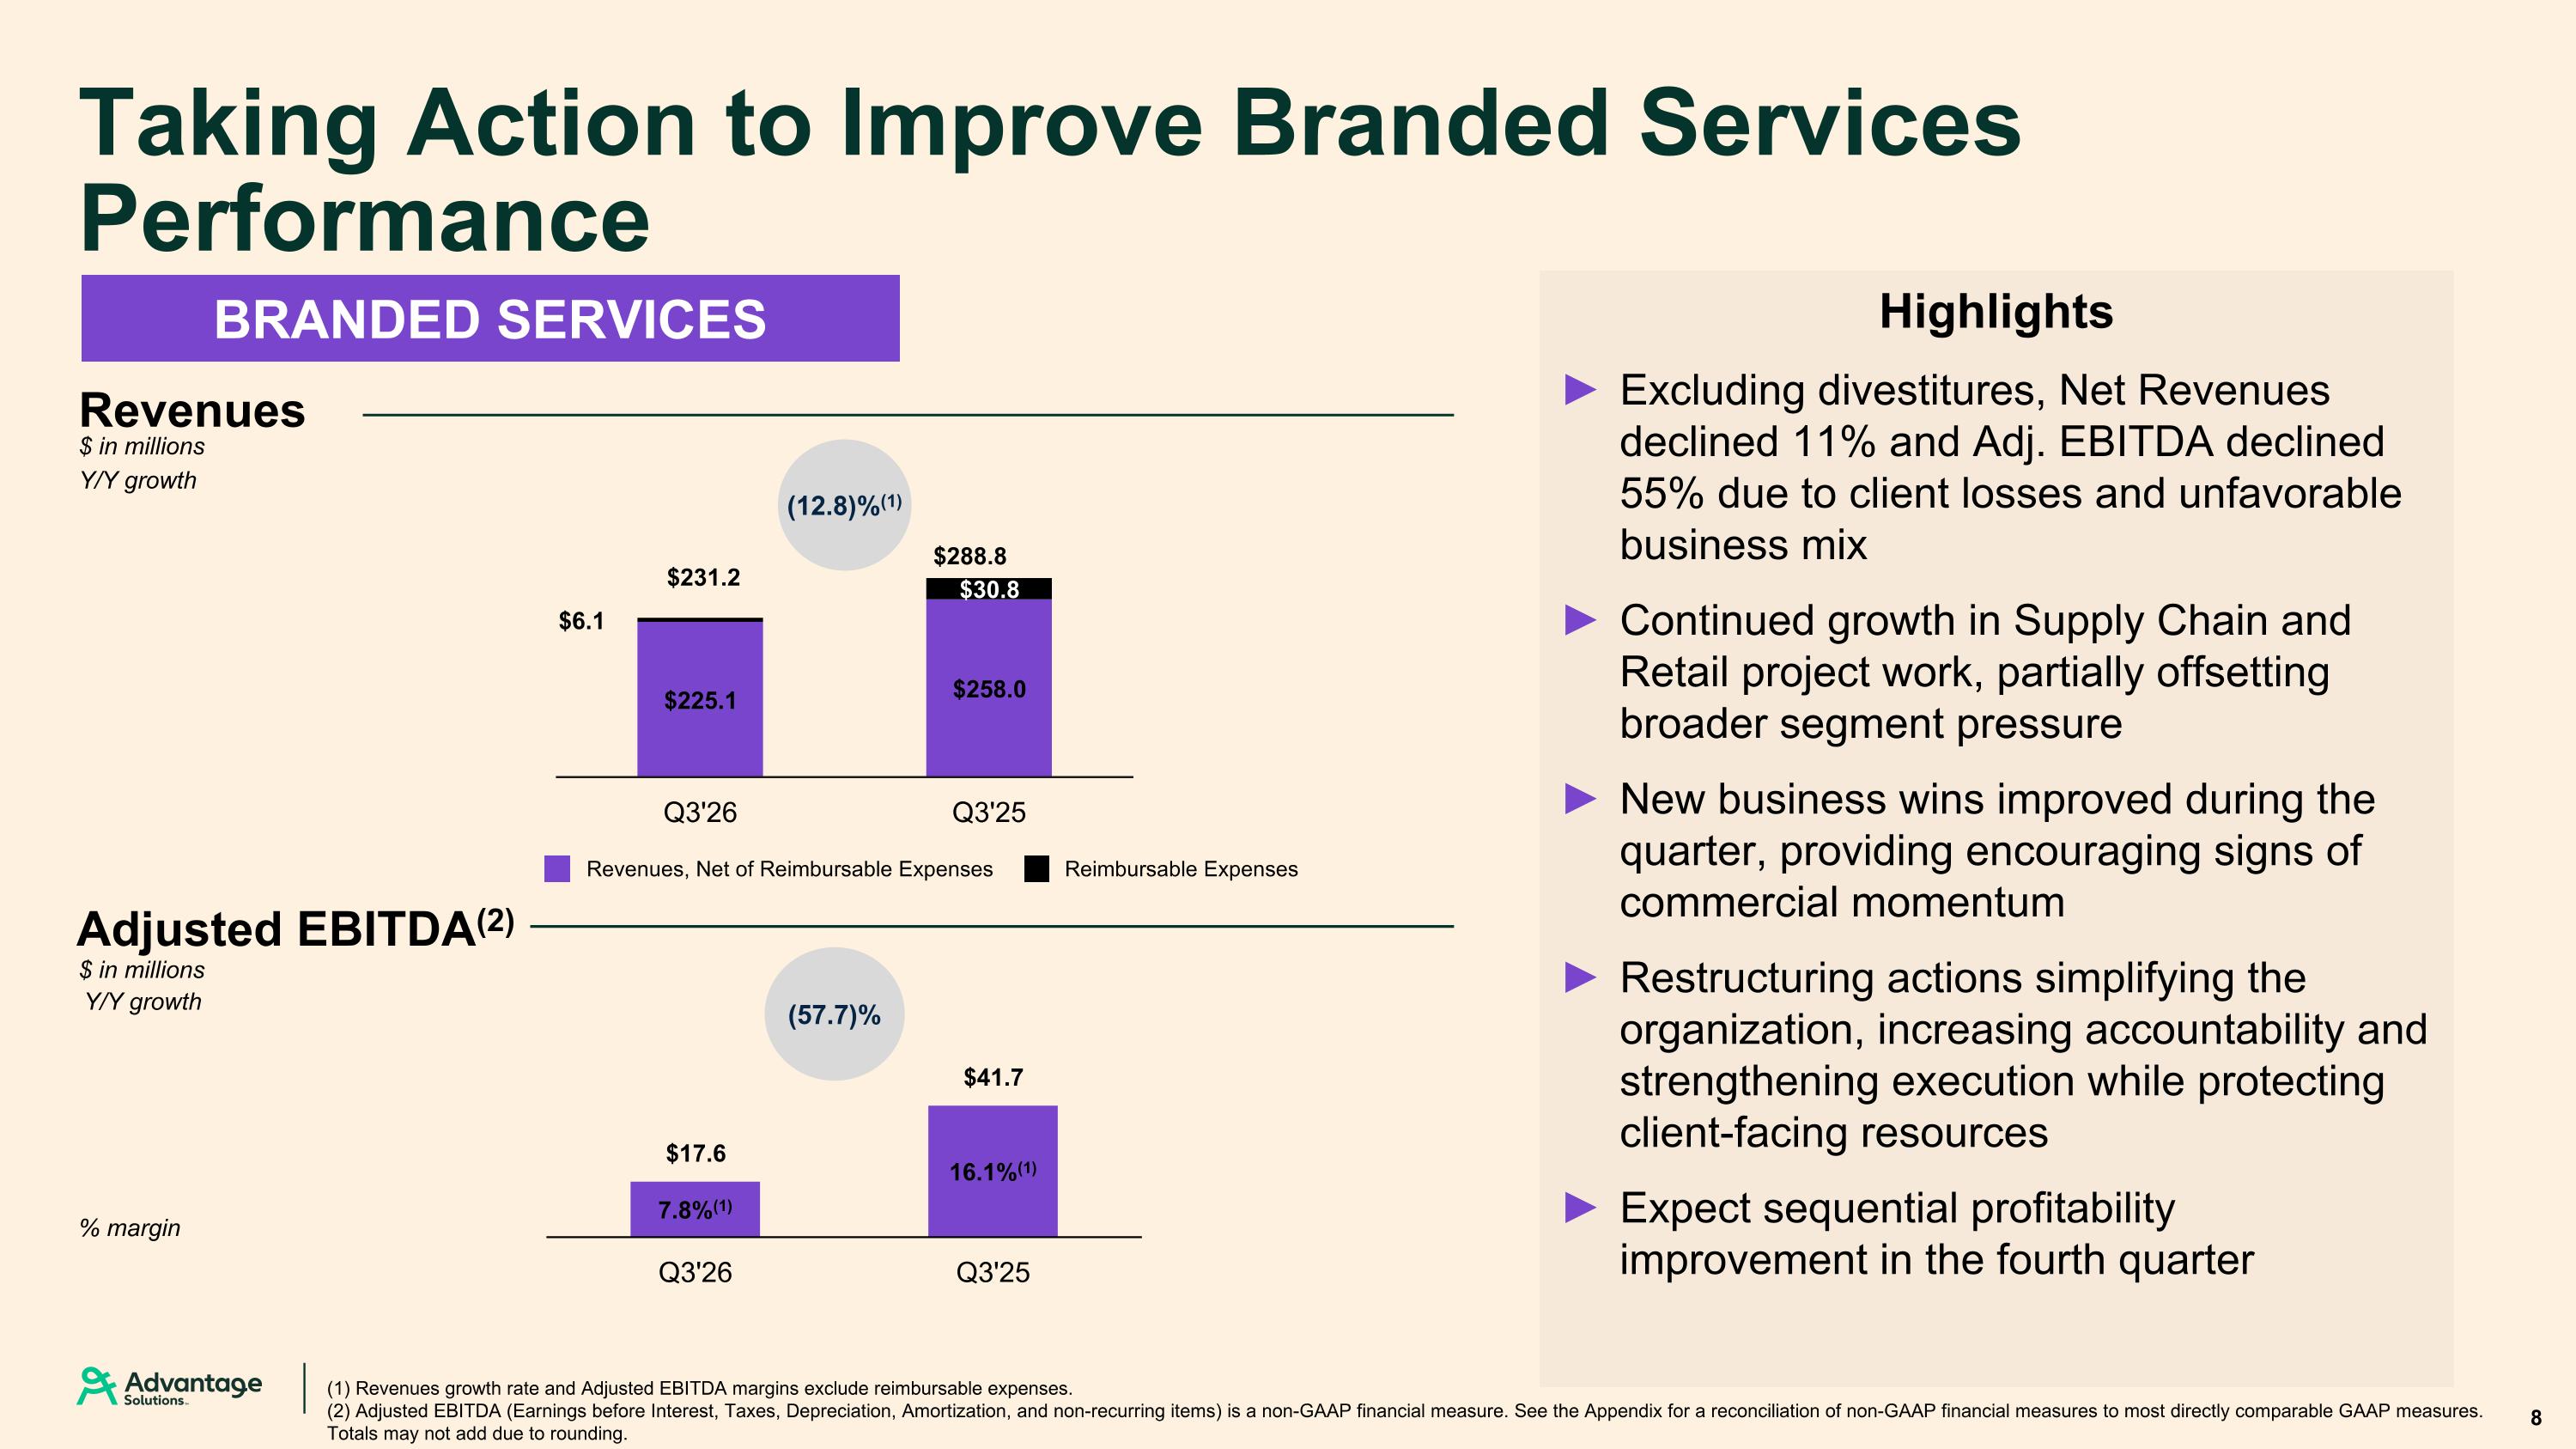
$288.8 (1) Revenues growth rate and Adjusted EBITDA margins exclude reimbursable expenses. (2) Adjusted EBITDA (Earnings before Interest, Taxes, Depreciation, Amortization, and non-recurring items) is a non-GAAP financial measure. See the Appendix for a reconciliation of non-GAAP financial measures to most directly comparable GAAP measures. Totals may not add due to rounding. (57.7)% % margin Taking Action to Improve Branded Services Performance $ in millions Y/Y growth Adjusted EBITDA(2) BRANDED SERVICES $ in millions Y/Y growth 8 Revenues Revenues, Net of Reimbursable Expenses Reimbursable Expenses (12.8)%(1) $231.2 7.8%(1) 16.1%(1) Highlights Excluding divestitures, Net Revenues declined 11% and Adj. EBITDA declined 55% due to client losses and unfavorable business mix Continued growth in Supply Chain and Retail project work, partially offsetting broader segment pressure New business wins improved during the quarter, providing encouraging signs of commercial momentum Restructuring actions simplifying the organization, increasing accountability and strengthening execution while protecting client-facing resources Expect sequential profitability improvement in the fourth quarter
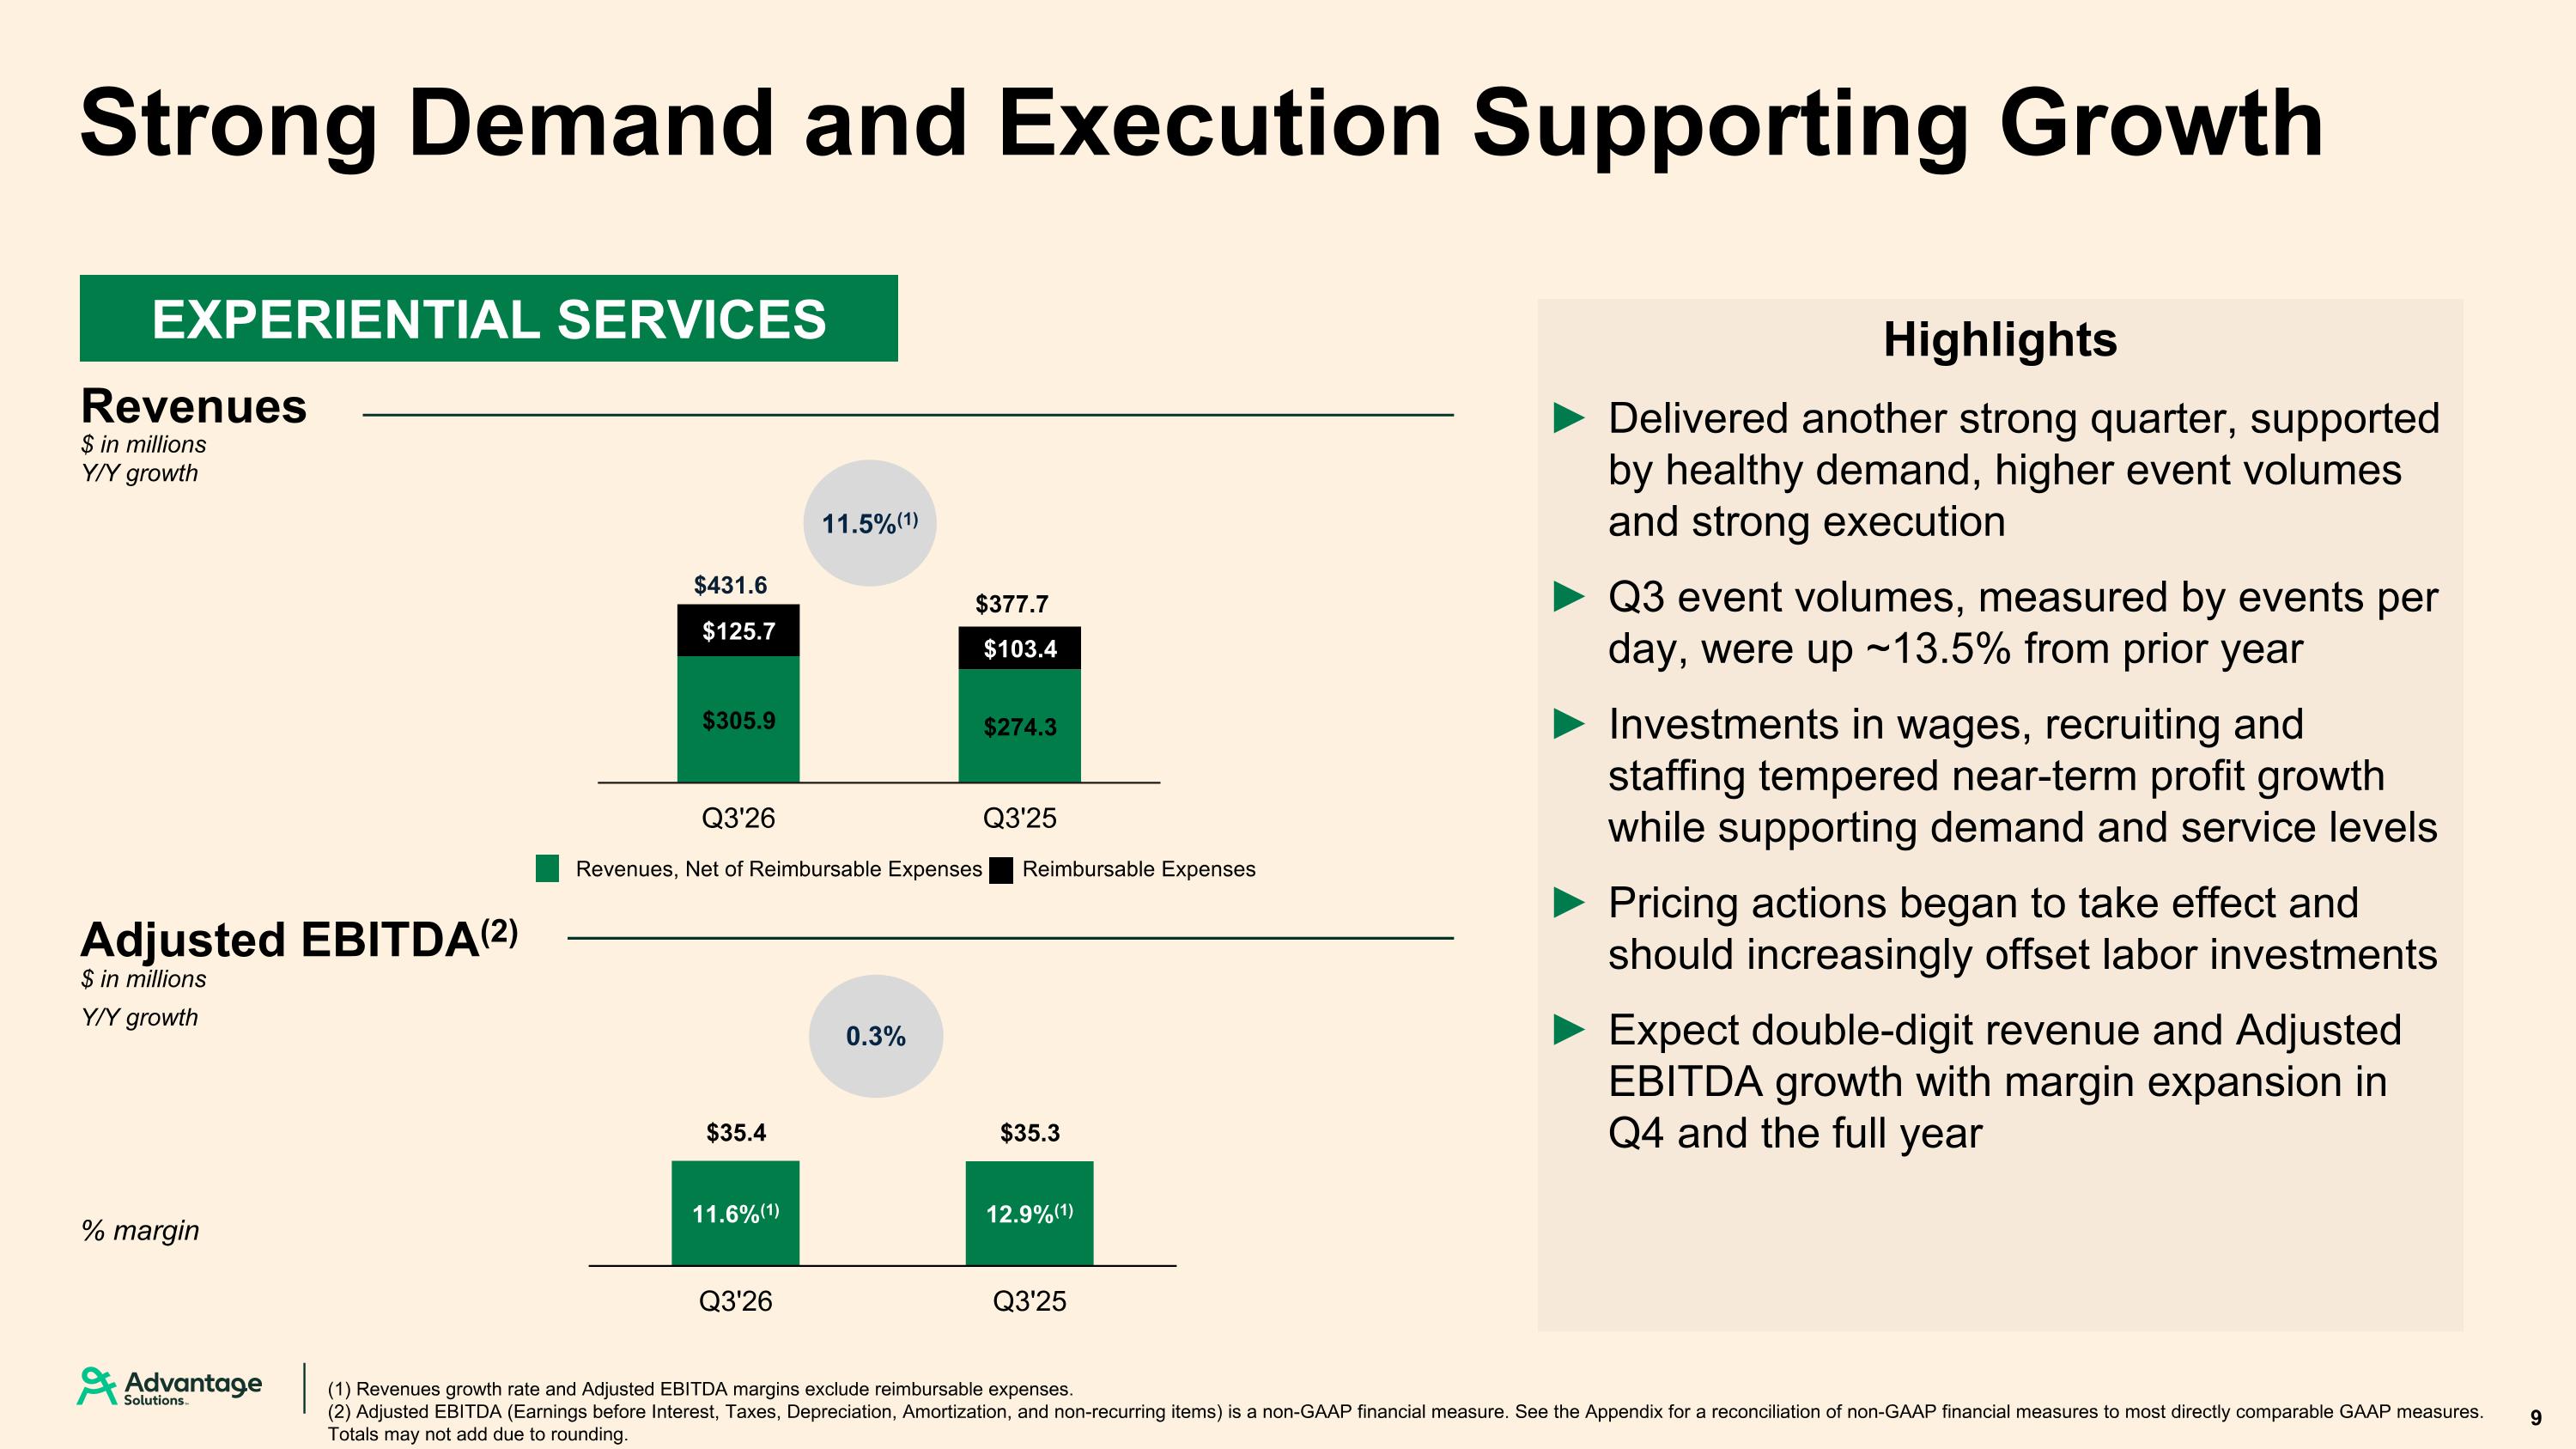
$377.7 (1) Revenues growth rate and Adjusted EBITDA margins exclude reimbursable expenses. (2) Adjusted EBITDA (Earnings before Interest, Taxes, Depreciation, Amortization, and non-recurring items) is a non-GAAP financial measure. See the Appendix for a reconciliation of non-GAAP financial measures to most directly comparable GAAP measures. Totals may not add due to rounding. % margin Strong Demand and Execution Supporting Growth Adjusted EBITDA(2) $ in millions Y/Y growth $ in millions Y/Y growth 9 EXPERIENTIAL SERVICES Revenues Revenues, Net of Reimbursable Expenses Reimbursable Expenses 11.5%(1) 0.3% $431.6 11.6%(1) 12.9%(1) Highlights Delivered another strong quarter, supported by healthy demand, higher event volumes and strong execution Q3 event volumes, measured by events per day, were up ~13.5% from prior year Investments in wages, recruiting and staffing tempered near-term profit growth while supporting demand and service levels Pricing actions began to take effect and should increasingly offset labor investments Expect double-digit revenue and Adjusted EBITDA growth with margin expansion in Q4 and the full year
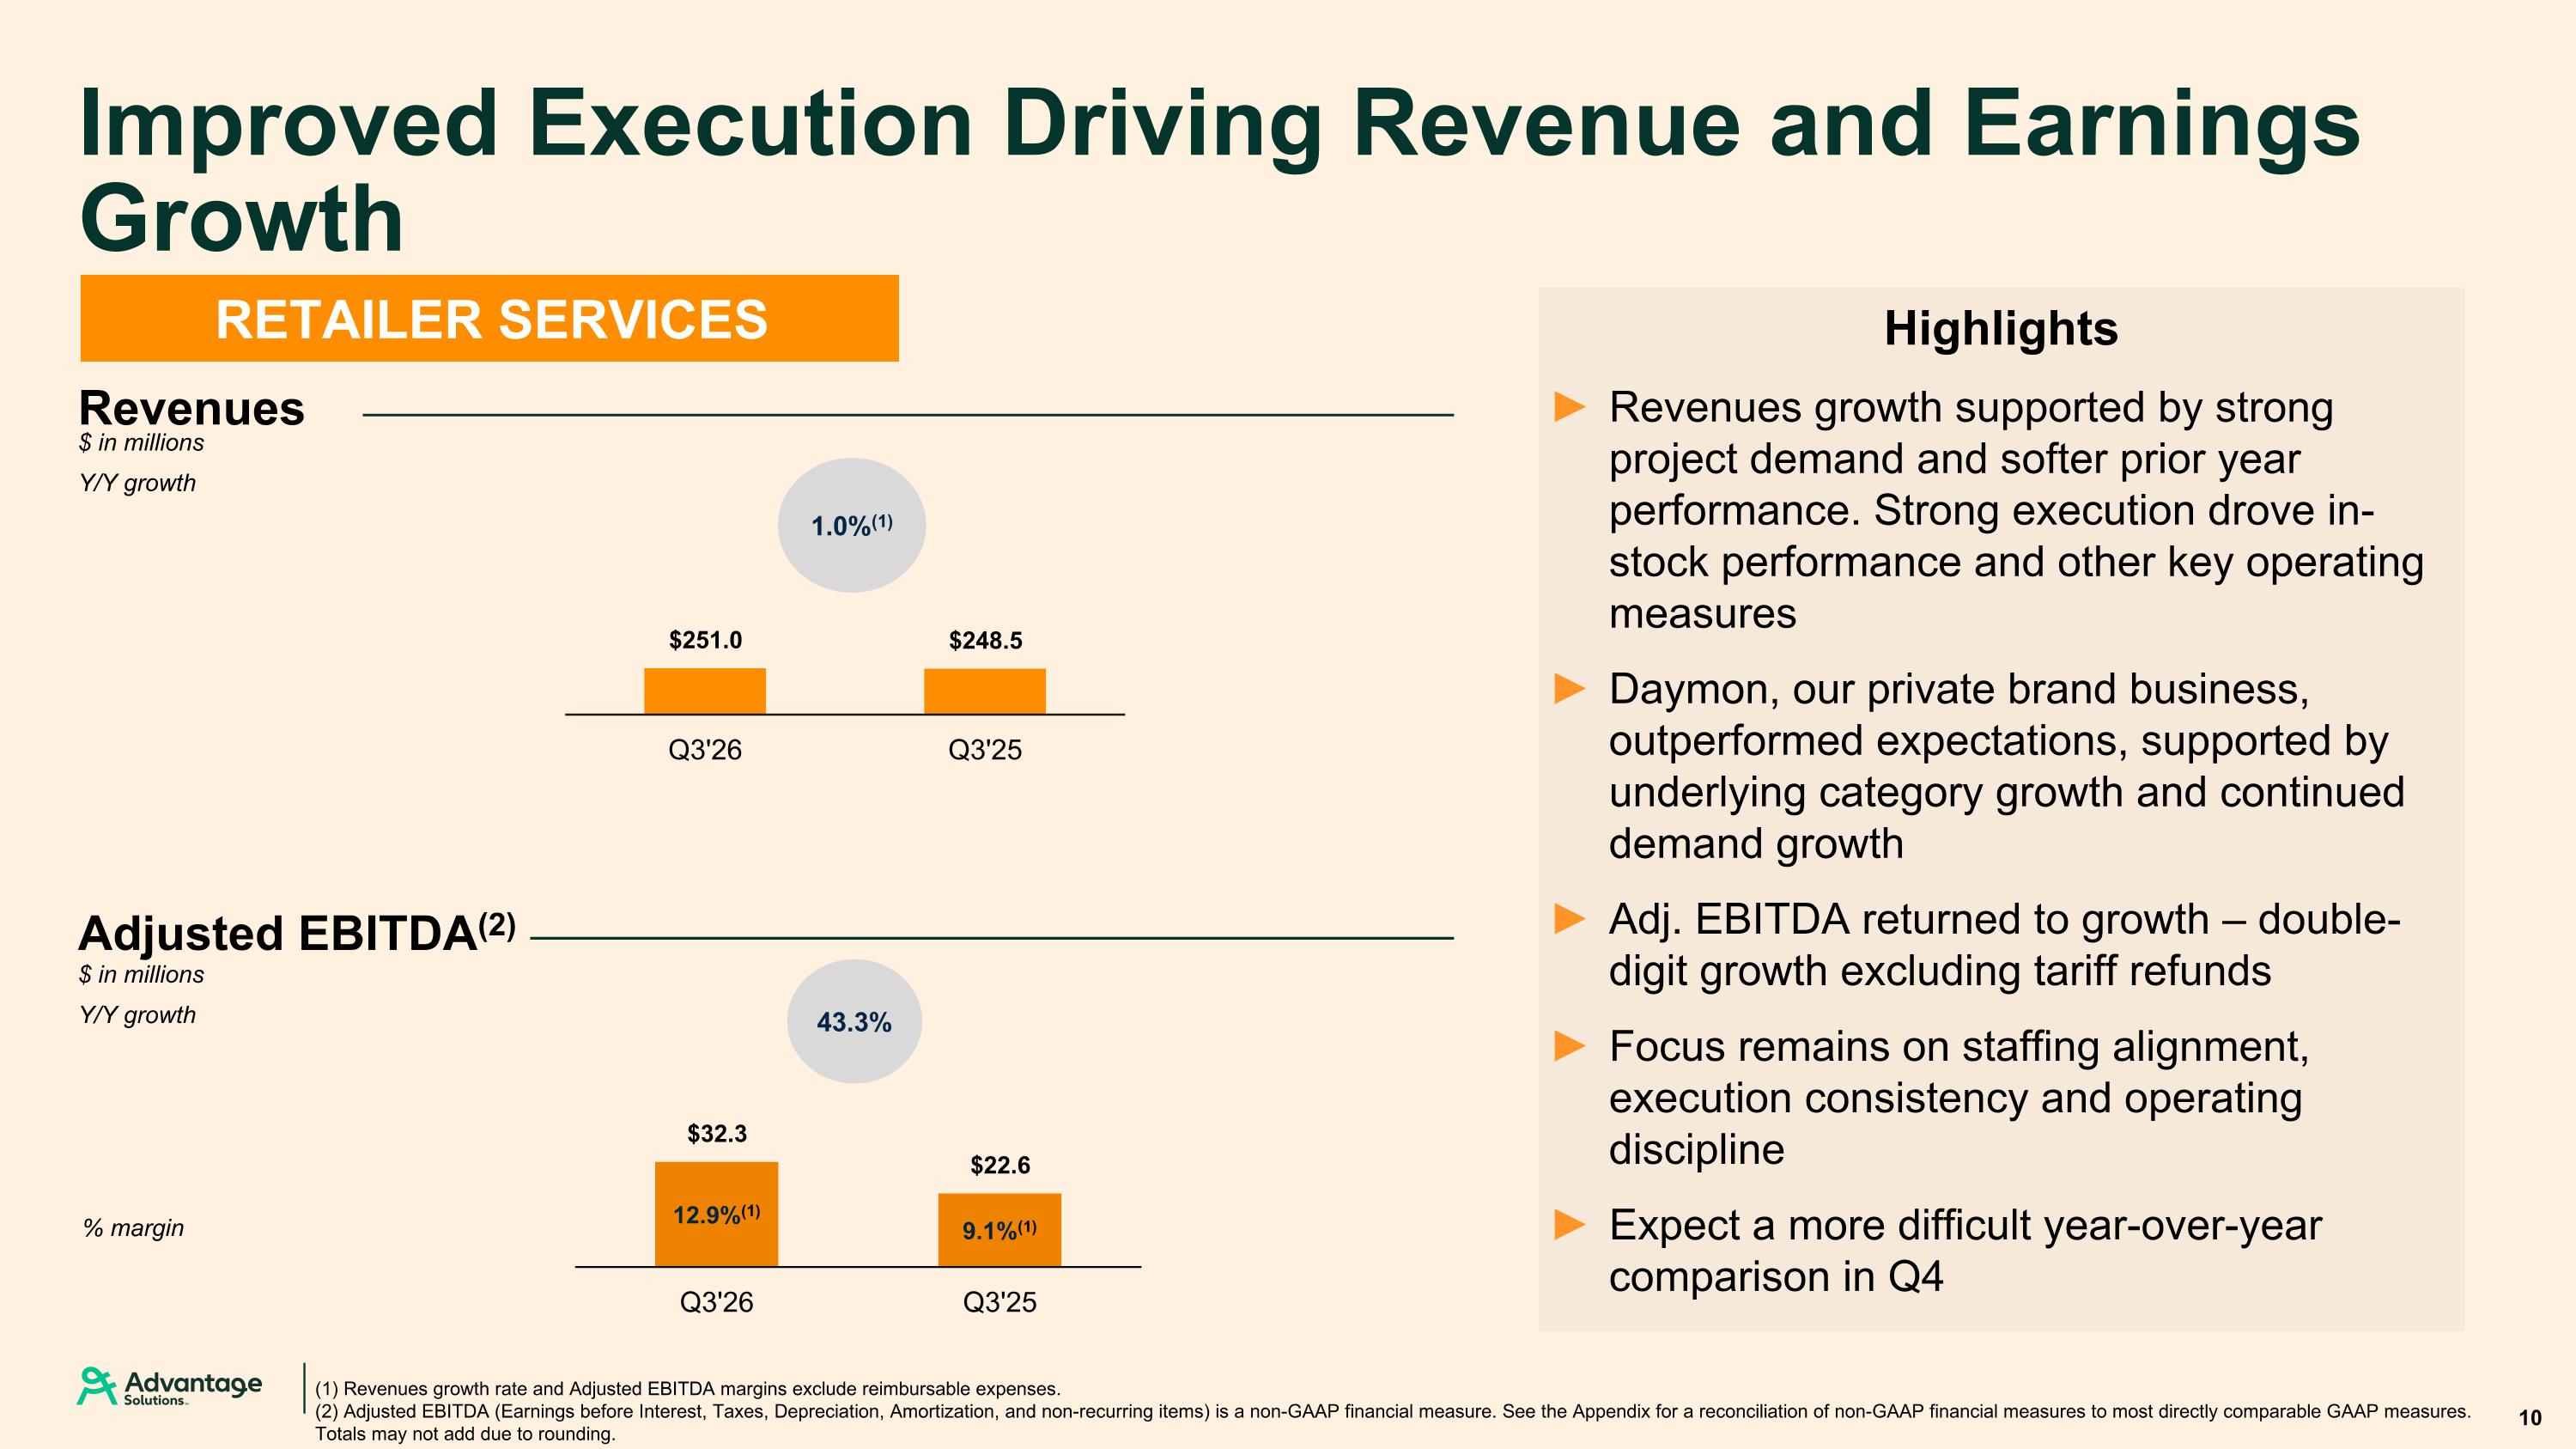
(1) Revenues growth rate and Adjusted EBITDA margins exclude reimbursable expenses. (2) Adjusted EBITDA (Earnings before Interest, Taxes, Depreciation, Amortization, and non-recurring items) is a non-GAAP financial measure. See the Appendix for a reconciliation of non-GAAP financial measures to most directly comparable GAAP measures. Totals may not add due to rounding. 1.0%(1) % margin Improved Execution Driving Revenue and Earnings Growth Adjusted EBITDA(2) 10 $ in millions Y/Y growth $ in millions Y/Y growth RETAILER SERVICES Revenues 43.3% 12.9%(1) 9.1%(1) Highlights Revenues growth supported by strong project demand and softer prior year performance. Strong execution drove in-stock performance and other key operating measures Daymon, our private brand business, outperformed expectations, supported by underlying category growth and continued demand growth Adj. EBITDA returned to growth – double-digit growth excluding tariff refunds Focus remains on staffing alignment, execution consistency and operating discipline Expect a more difficult year-over-year comparison in Q4
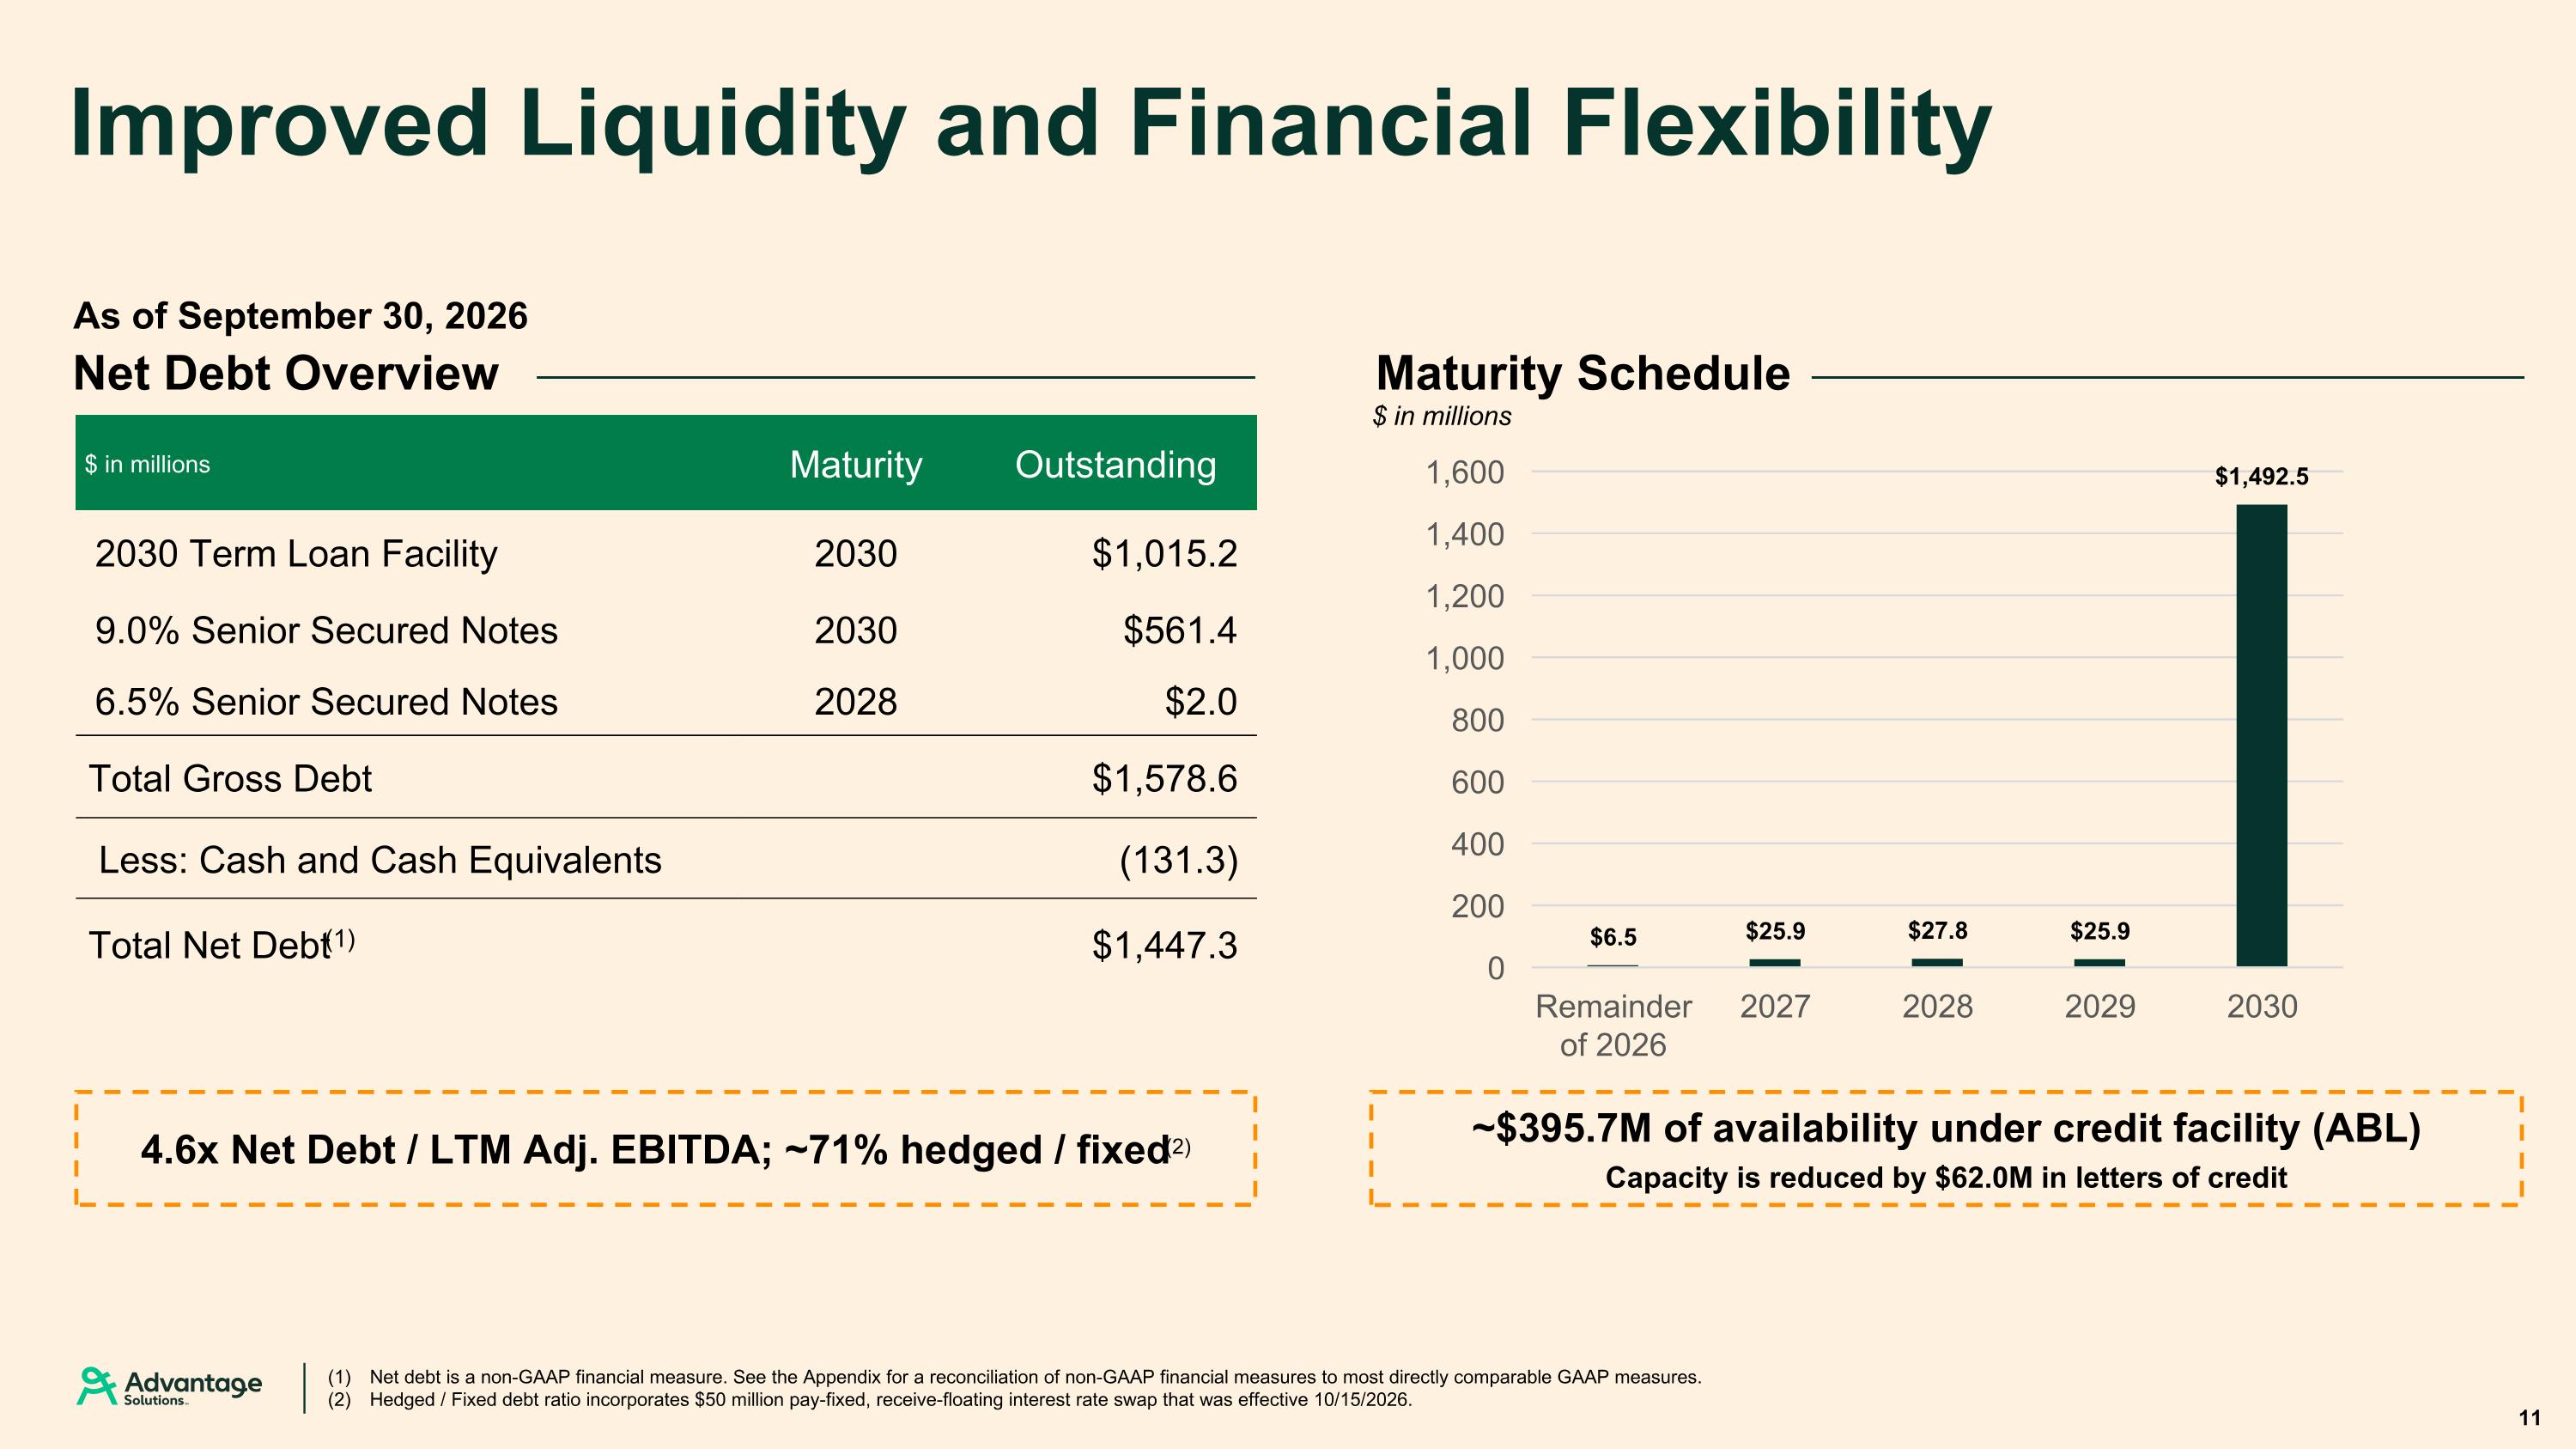
Improved Liquidity and Financial Flexibility As of September 30, 2026 $ in millions Maturity Outstanding 2030 Term Loan Facility 2030 $1,015.2 9.0% Senior Secured Notes 2030 $561.4 6.5% Senior Secured Notes 2028 $2.0 Total Gross Debt $1,578.6 Less: Cash and Cash Equivalents (131.3) Total Net Debt(1) $1,447.3 Net Debt Overview Maturity Schedule (1) Net debt is a non-GAAP financial measure. See the Appendix for a reconciliation of non-GAAP financial measures to most directly comparable GAAP measures. (2) Hedged / Fixed debt ratio incorporates $50 million pay-fixed, receive-floating interest rate swap that was effective 10/15/2026. 11 ~$395.7M of availability under credit facility (ABL) Capacity is reduced by $62.0M in letters of credit 4.6x Net Debt / LTM Adj. EBITDA; ~71% hedged / fixed(2) $ in millions
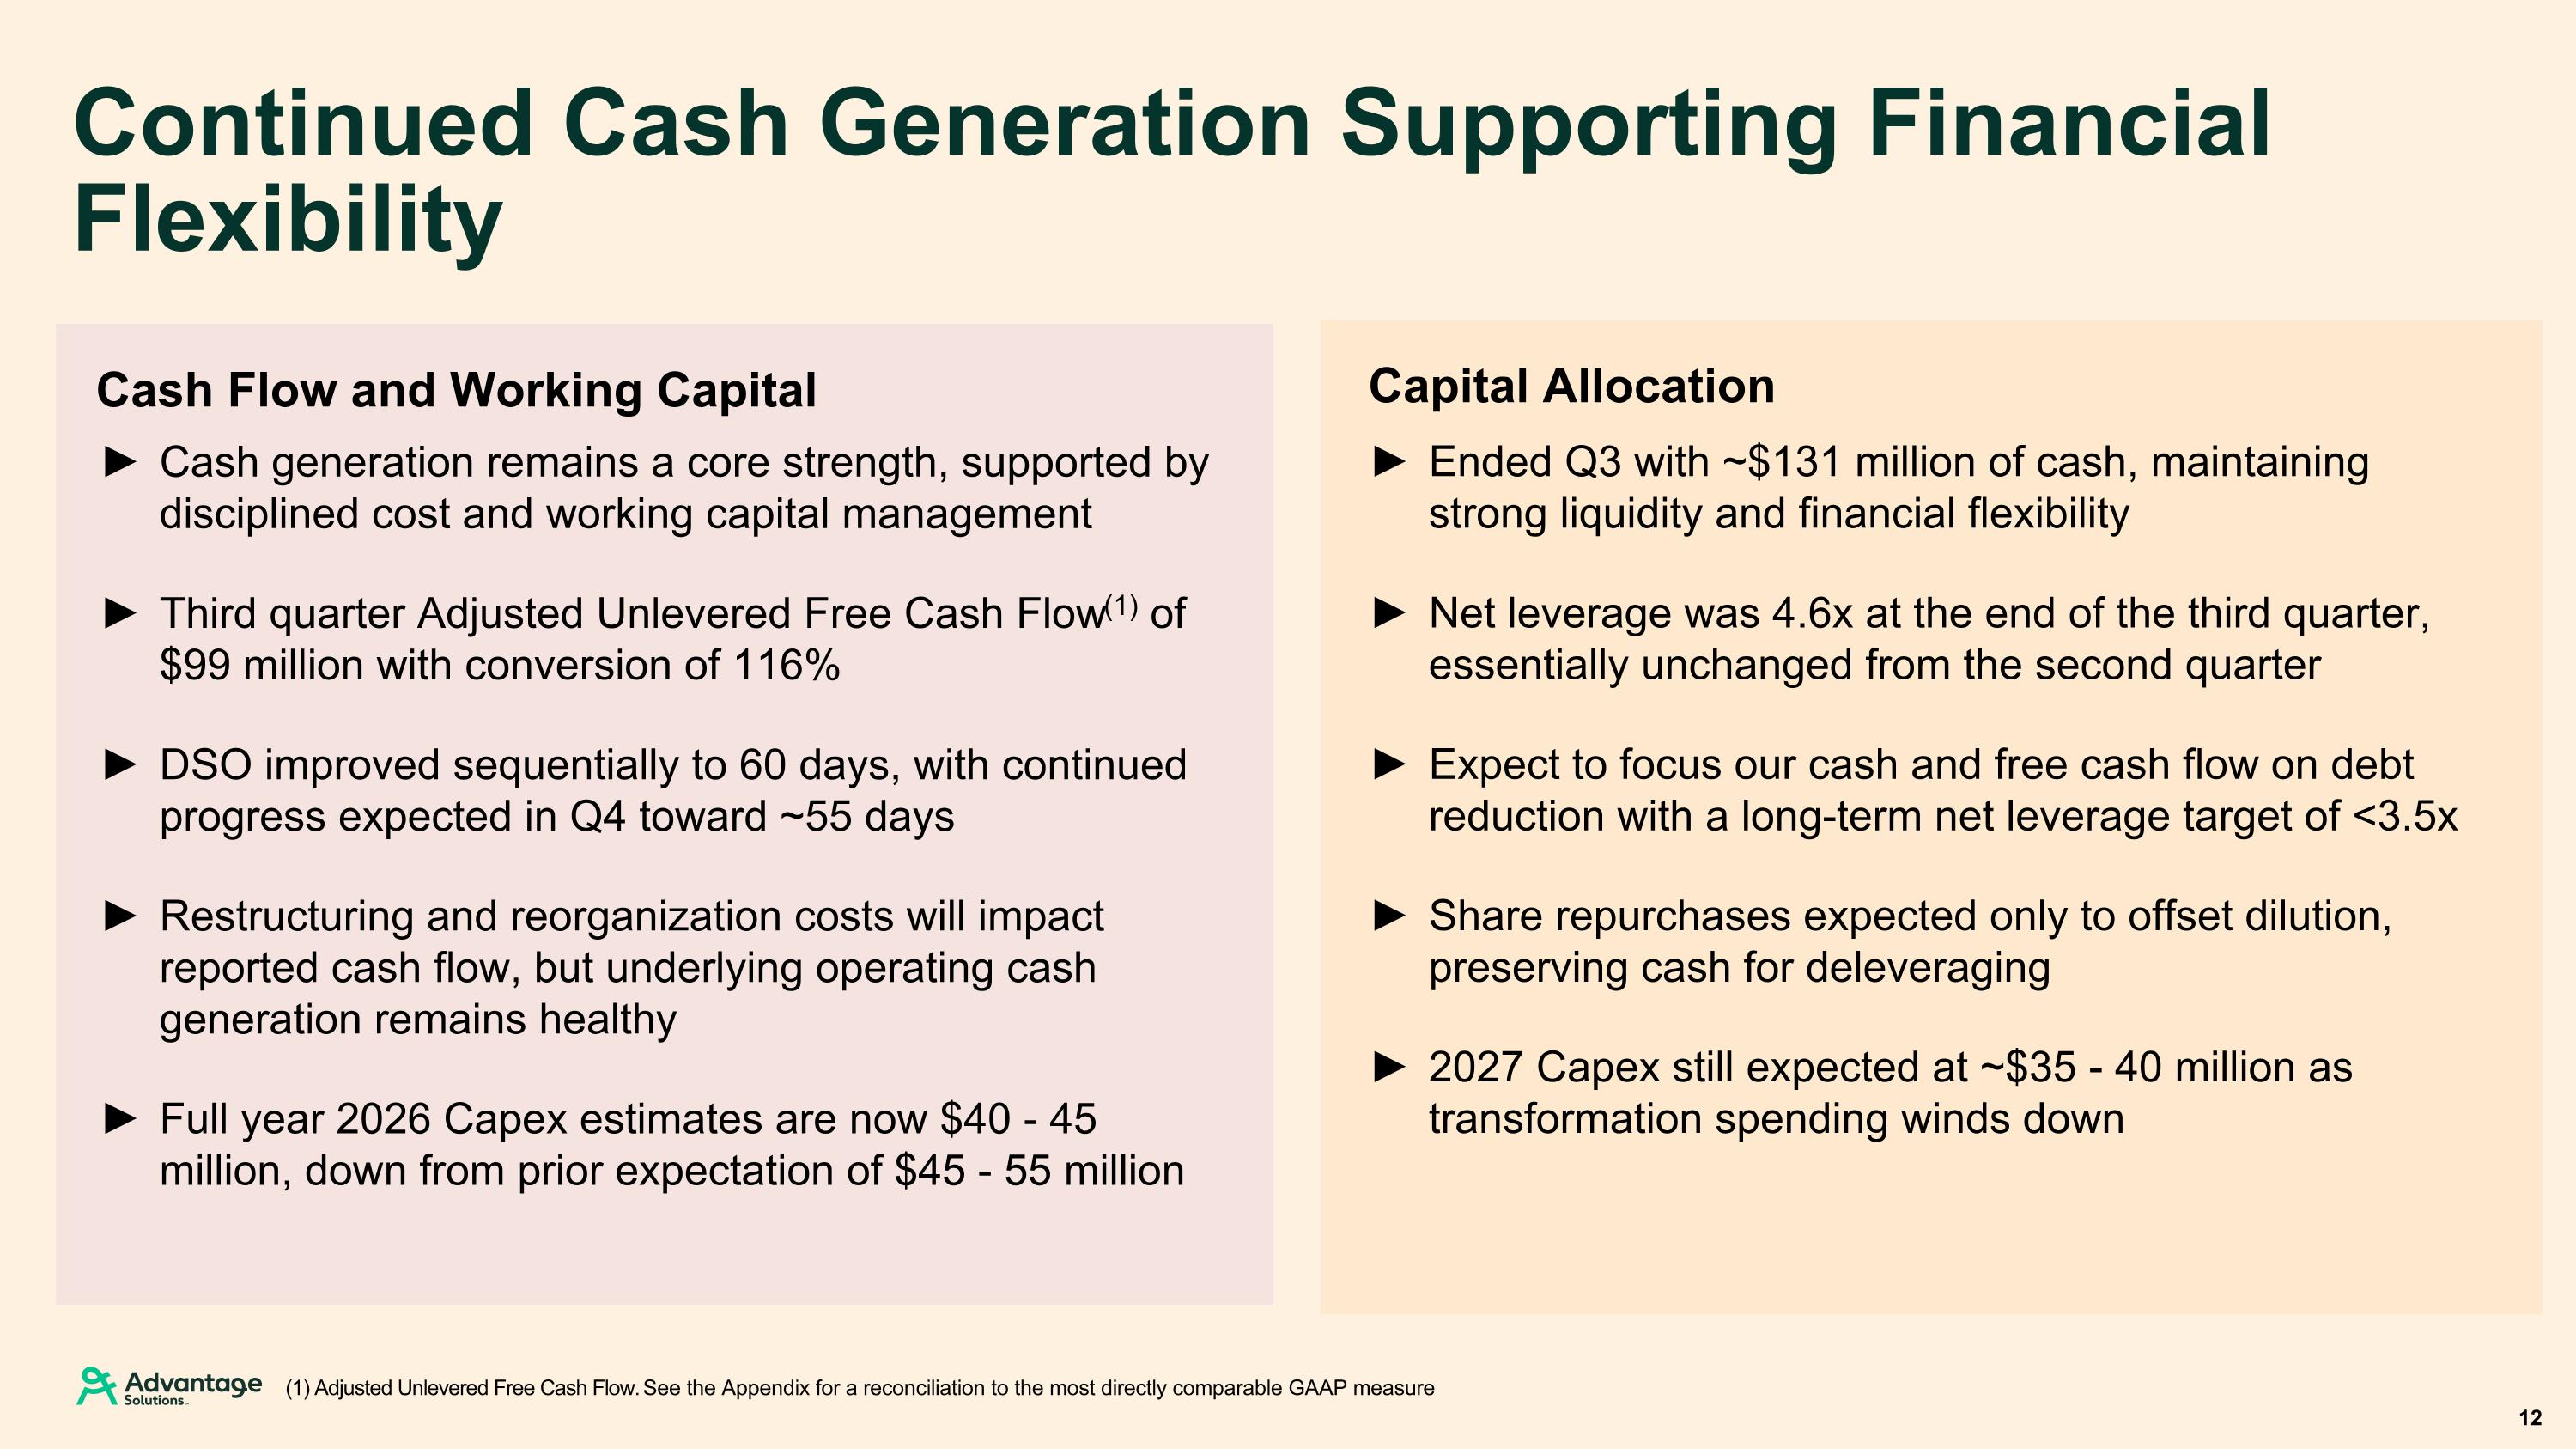
Continued Cash Generation Supporting Financial Flexibility Capital Allocation Cash Flow and Working Capital 12 (1) Adjusted Unlevered Free Cash Flow. See the Appendix for a reconciliation to the most directly comparable GAAP measure Ended Q3 with ~$131 million of cash, maintaining strong liquidity and financial flexibility Net leverage was 4.6x at the end of the third quarter, essentially unchanged from the second quarter Expect to focus our cash and free cash flow on debt reduction with a long-term net leverage target of <3.5x Share repurchases expected only to offset dilution, preserving cash for deleveraging 2027 Capex still expected at ~$35 - 40 million as transformation spending winds down Cash generation remains a core strength, supported by disciplined cost and working capital management Third quarter Adjusted Unlevered Free Cash Flow(1) of $99 million with conversion of 116% DSO improved sequentially to 60 days, with continued progress expected in Q4 toward ~55 days Restructuring and reorganization costs will impact reported cash flow, but underlying operating cash generation remains healthy Full year 2026 Capex estimates are now $40 - 45 million, down from prior expectation of $45 - 55 million
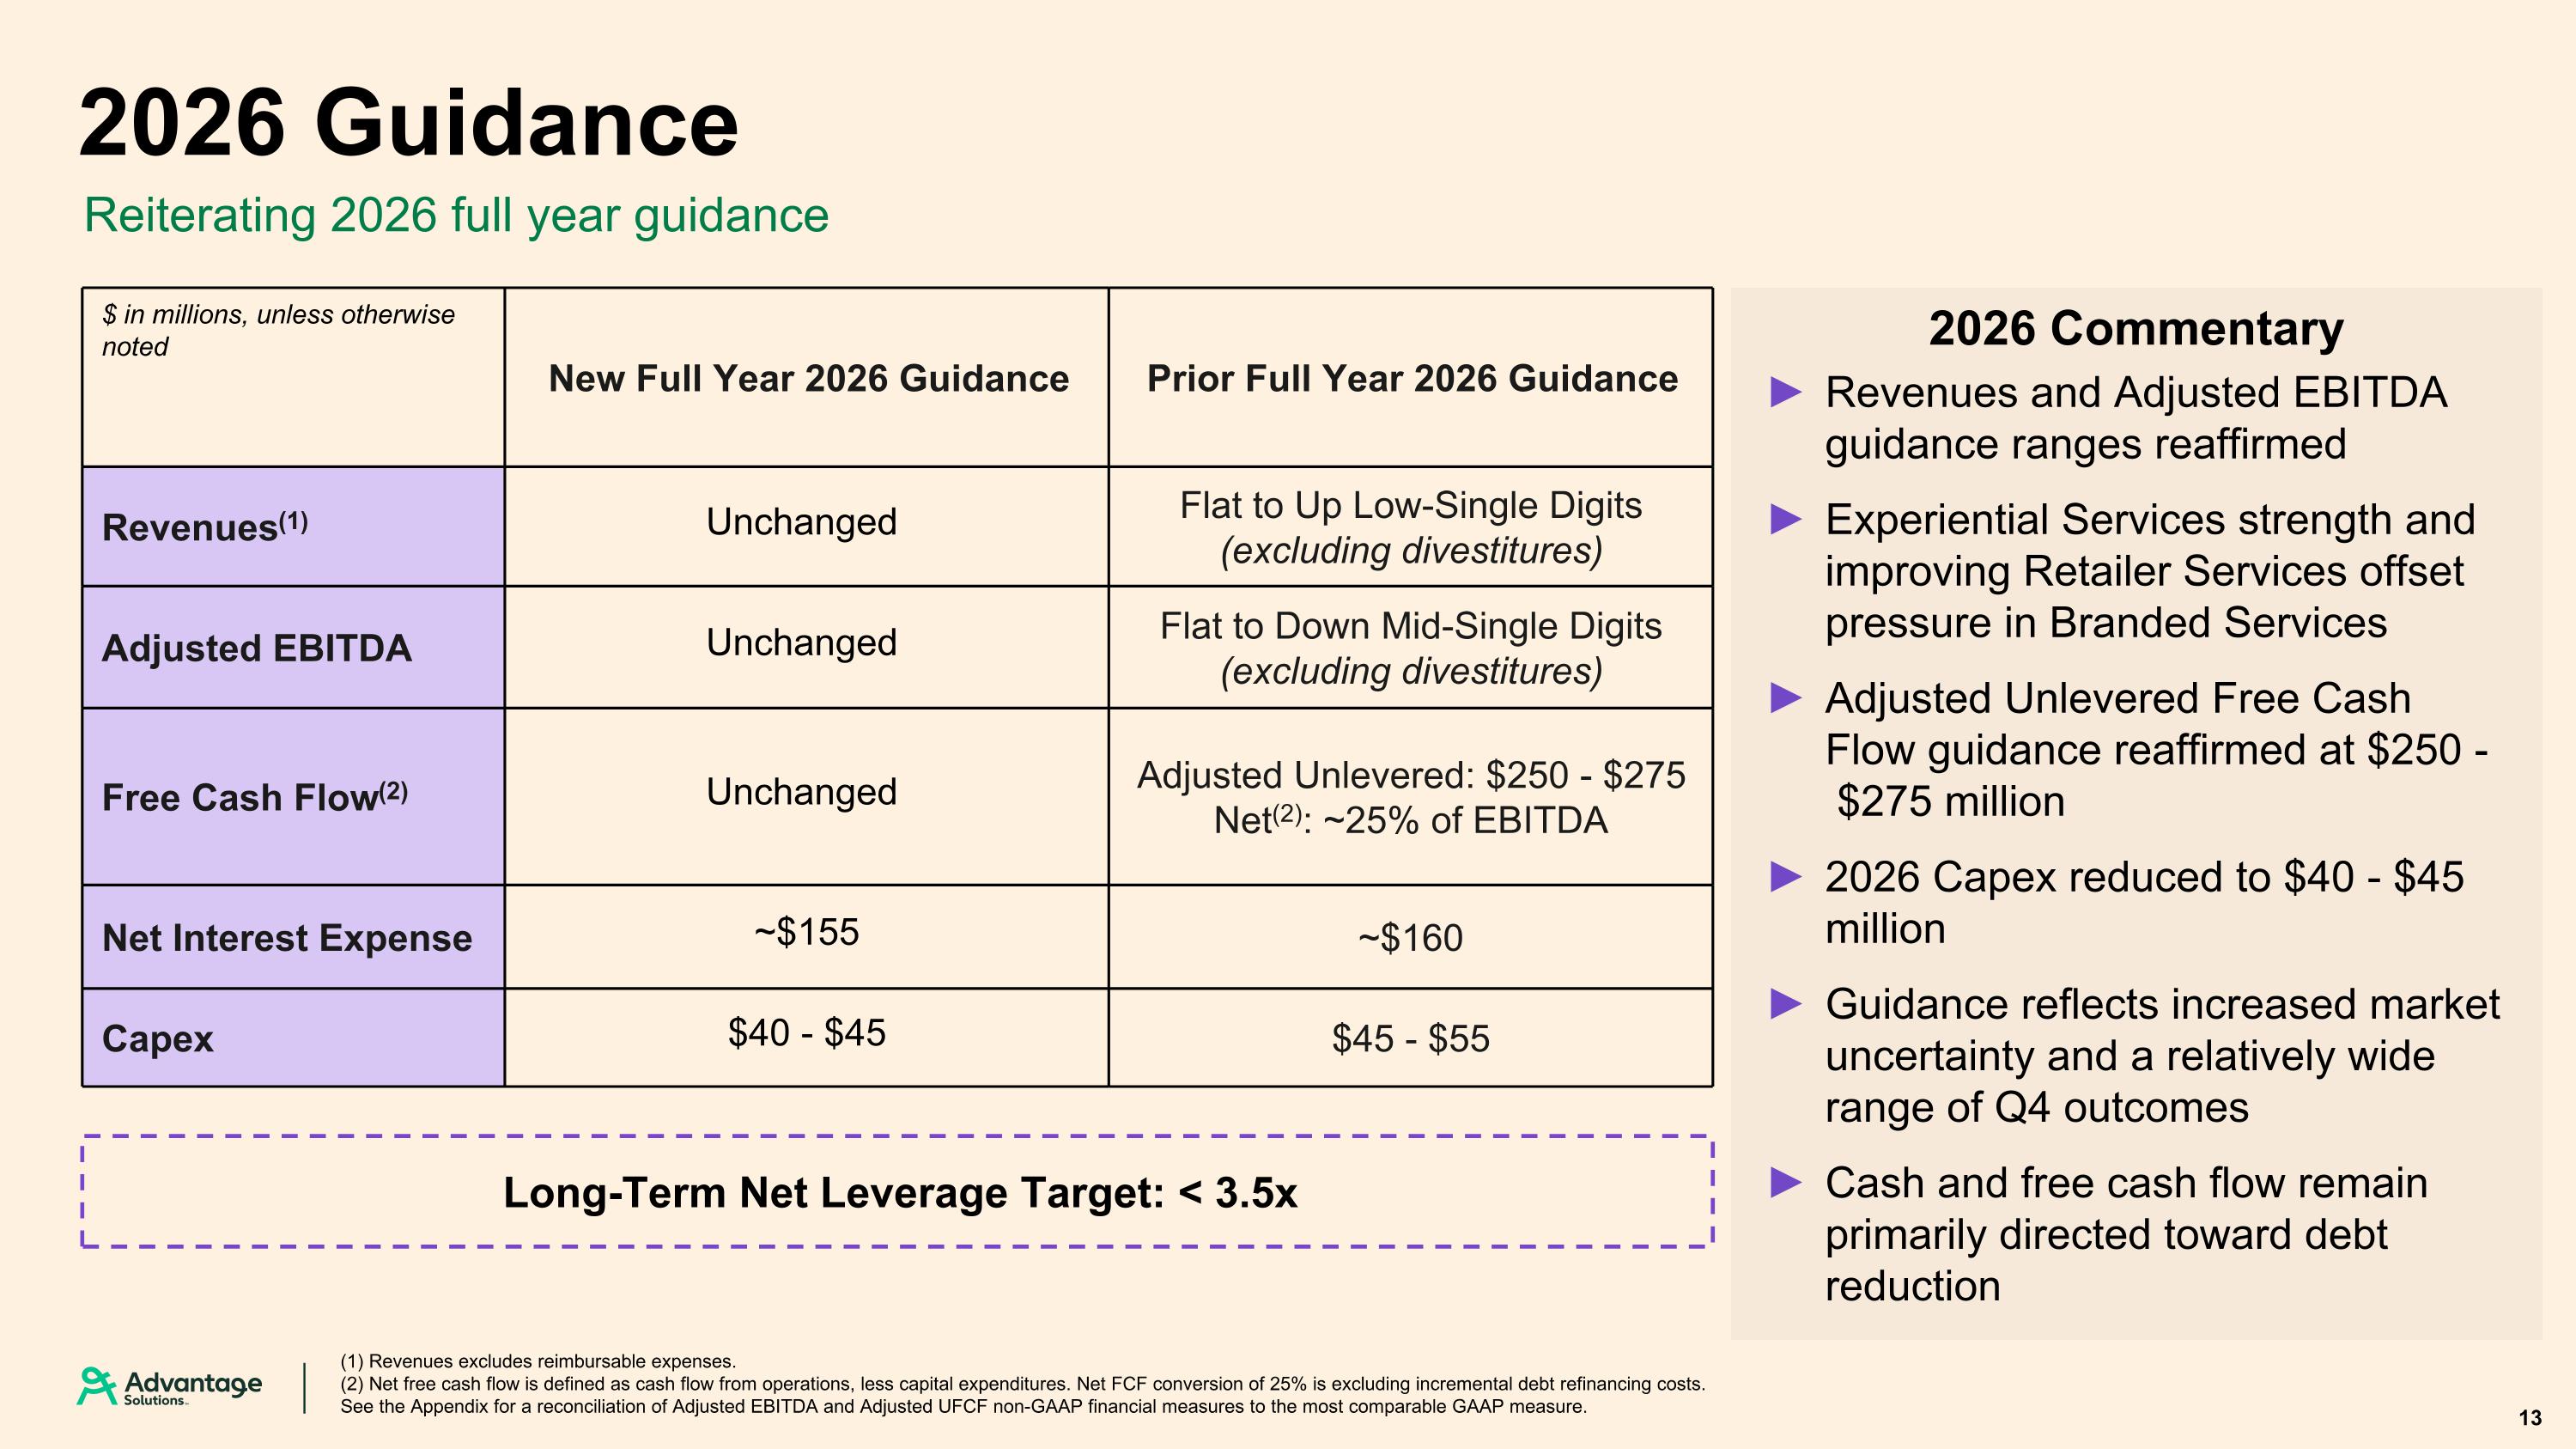
2026 Guidance Reiterating 2026 full year guidance $ in millions, unless otherwise noted New Full Year 2026 Guidance Prior Full Year 2026 Guidance Revenues(1) Unchanged Flat to Up Low-Single Digits (excluding divestitures) Adjusted EBITDA Unchanged Flat to Down Mid-Single Digits (excluding divestitures) Free Cash Flow(2) Unchanged Adjusted Unlevered: $250 - $275 Net(2): ~25% of EBITDA Net Interest Expense ~$155 ~$160 Capex $40 - $45 $45 - $55 (1) Revenues excludes reimbursable expenses. (2) Net free cash flow is defined as cash flow from operations, less capital expenditures. Net FCF conversion of 25% is excluding incremental debt refinancing costs. See the Appendix for a reconciliation of Adjusted EBITDA and Adjusted UFCF non-GAAP financial measures to the most comparable GAAP measure. 13 Long-Term Net Leverage Target: < 3.5x 2026 Commentary Revenues and Adjusted EBITDA guidance ranges reaffirmed Experiential Services strength and improving Retailer Services offset pressure in Branded Services Adjusted Unlevered Free Cash Flow guidance reaffirmed at $250 - $275 million 2026 Capex reduced to $40 - $45 million Guidance reflects increased market uncertainty and a relatively wide range of Q4 outcomes Cash and free cash flow remain primarily directed toward debt reduction

Appendix 14
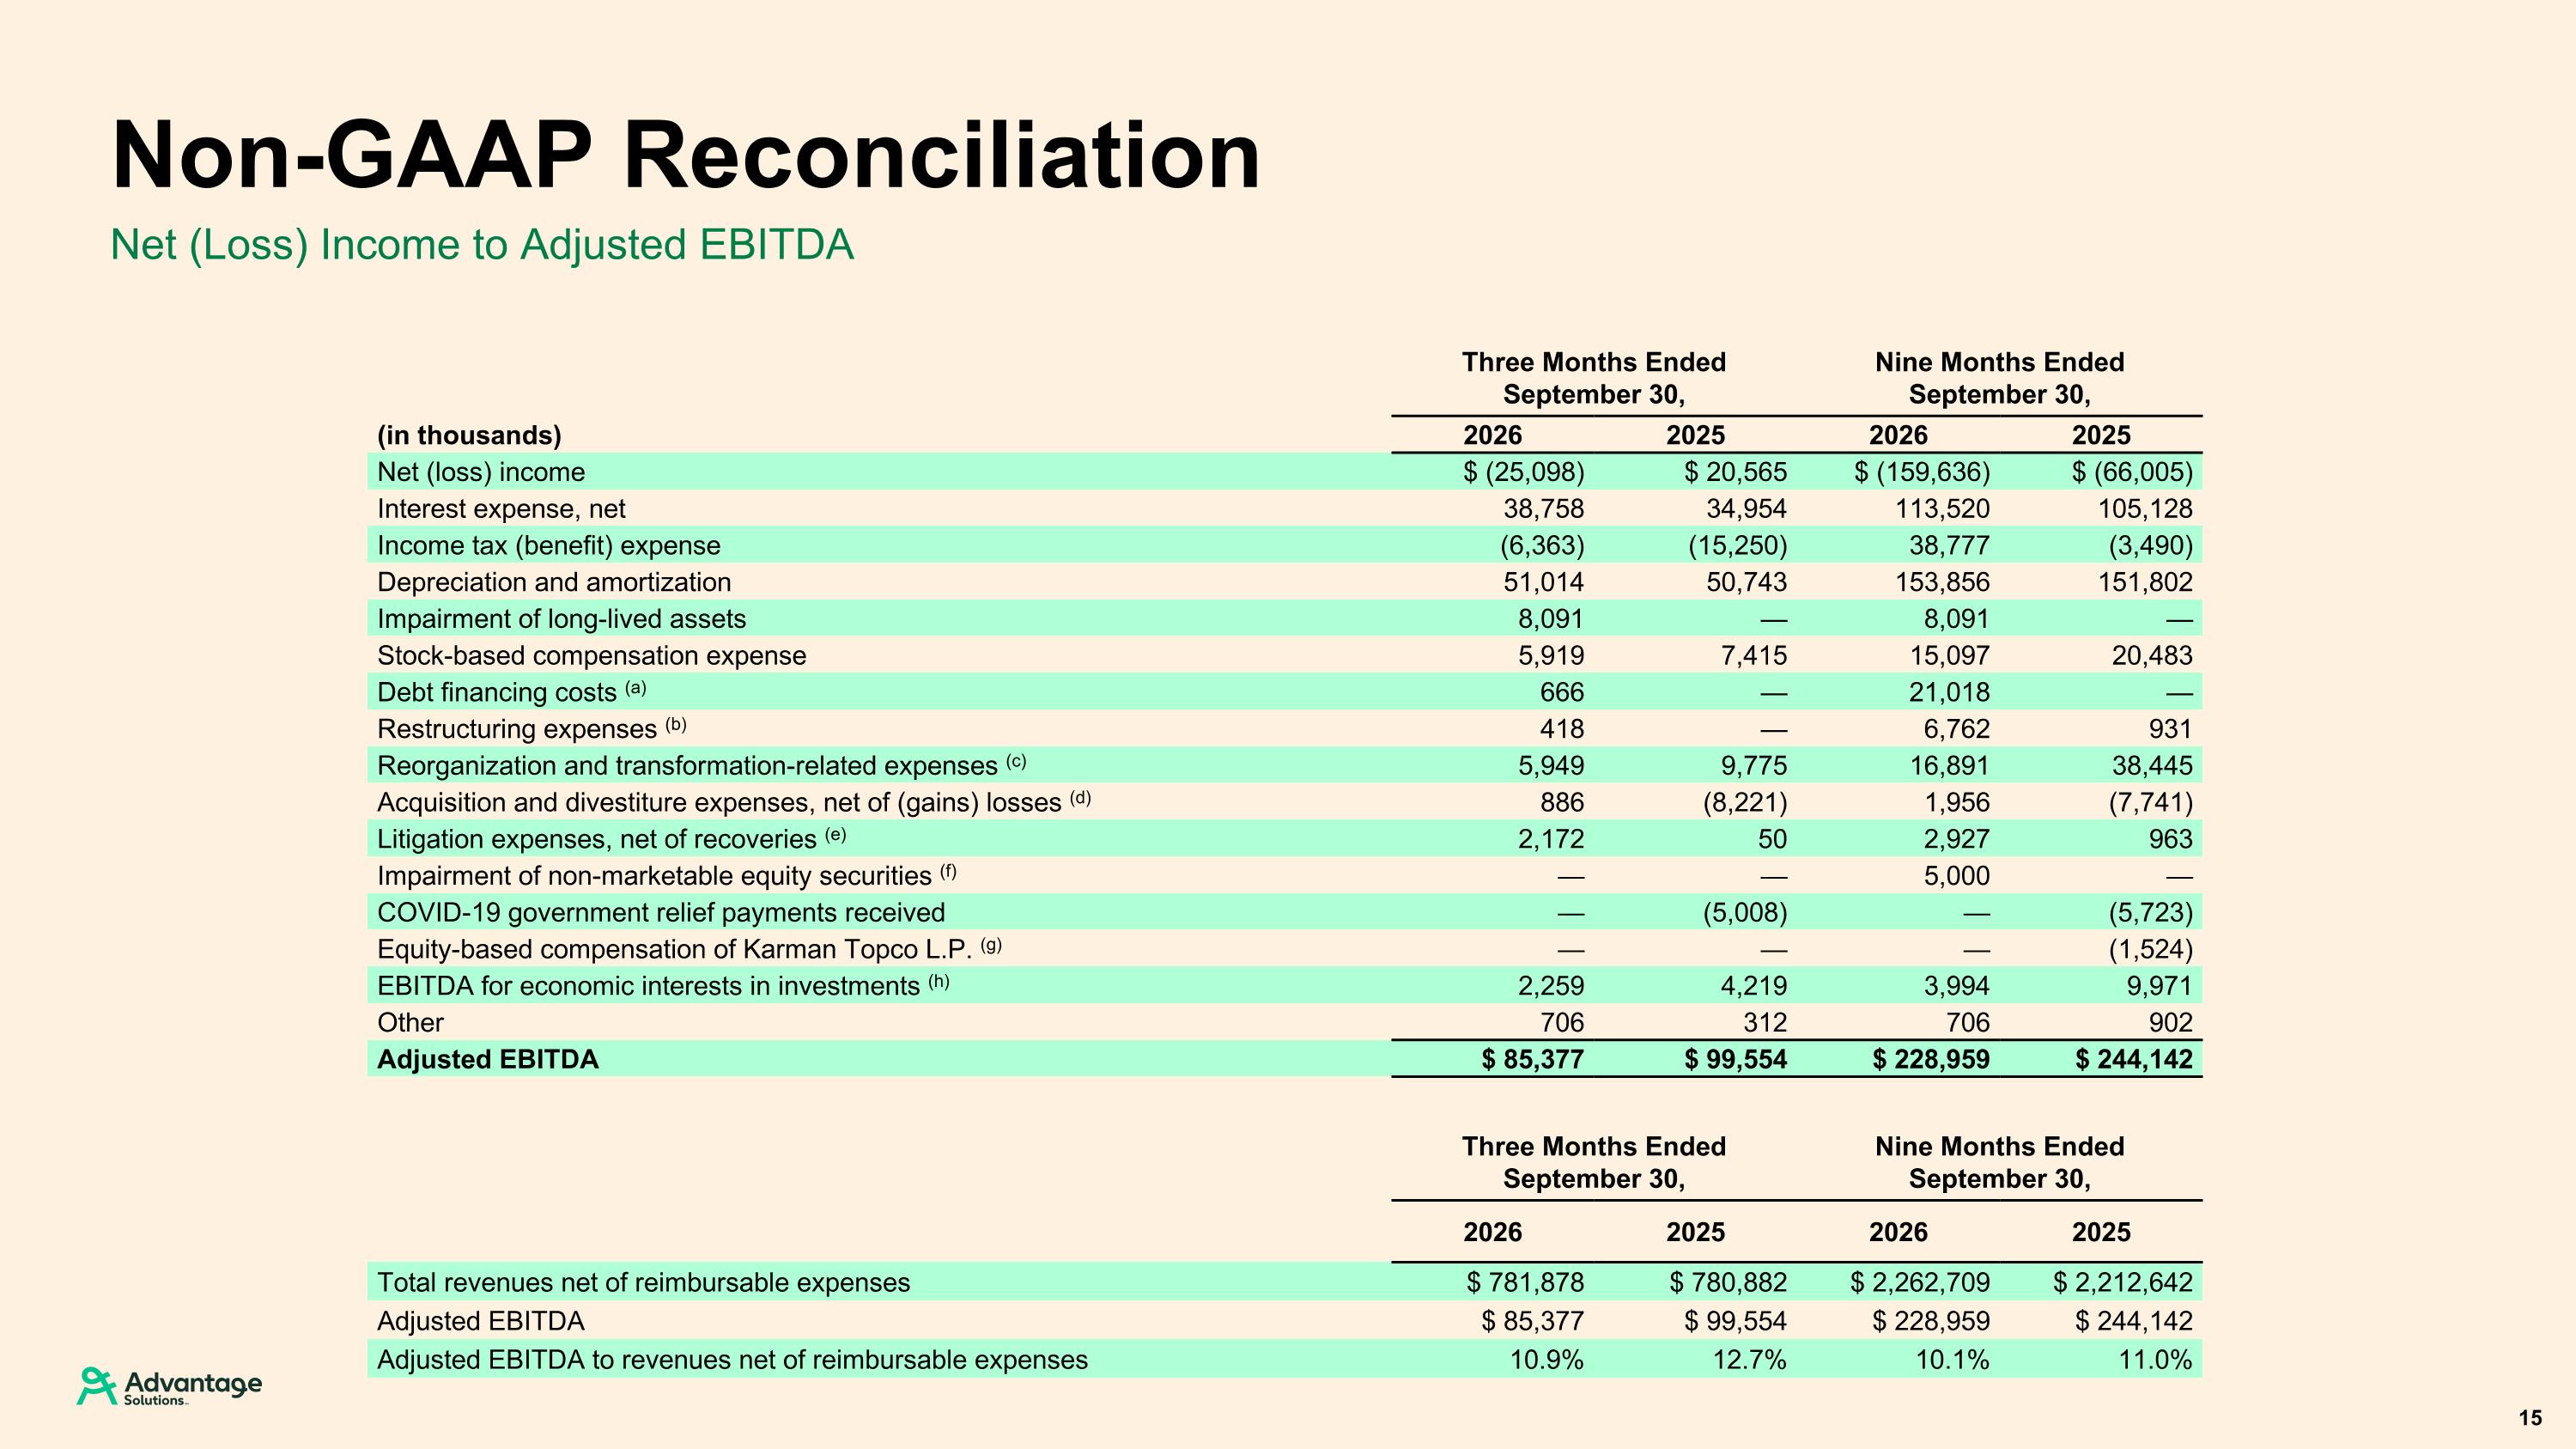
Net (Loss) Income to Adjusted EBITDA Non-GAAP Reconciliation 15 Three Months Ended September 30, Nine Months Ended September 30, (in thousands) 2026 2025 2026 2025 Net (loss) income $ (25,098) $ 20,565 $ (159,636) $ (66,005) Interest expense, net 38,758 34,954 113,520 105,128 Income tax (benefit) expense (6,363) (15,250) 38,777 (3,490) Depreciation and amortization 51,014 50,743 153,856 151,802 Impairment of long-lived assets 8,091 — 8,091 — Stock-based compensation expense 5,919 7,415 15,097 20,483 Debt financing costs (a) 666 — 21,018 — Restructuring expenses (b) 418 — 6,762 931 Reorganization and transformation-related expenses (c) 5,949 9,775 16,891 38,445 Acquisition and divestiture expenses, net of (gains) losses (d) 886 (8,221) 1,956 (7,741) Litigation expenses, net of recoveries (e) 2,172 50 2,927 963 Impairment of non-marketable equity securities (f) — — 5,000 — COVID-19 government relief payments received — (5,008) — (5,723) Equity-based compensation of Karman Topco L.P. (g) — — — (1,524) EBITDA for economic interests in investments (h) 2,259 4,219 3,994 9,971 Other 706 312 706 902 Adjusted EBITDA $ 85,377 $ 99,554 $ 228,959 $ 244,142 Three Months Ended September 30, Nine Months Ended September 30, 2026 2025 2026 2025 Total revenues net of reimbursable expenses $ 781,878 $ 780,882 $ 2,262,709 $ 2,212,642 Adjusted EBITDA $ 85,377 $ 99,554 $ 228,959 $ 244,142 Adjusted EBITDA to revenues net of reimbursable expenses 10.9% 12.7% 10.1% 11.0%
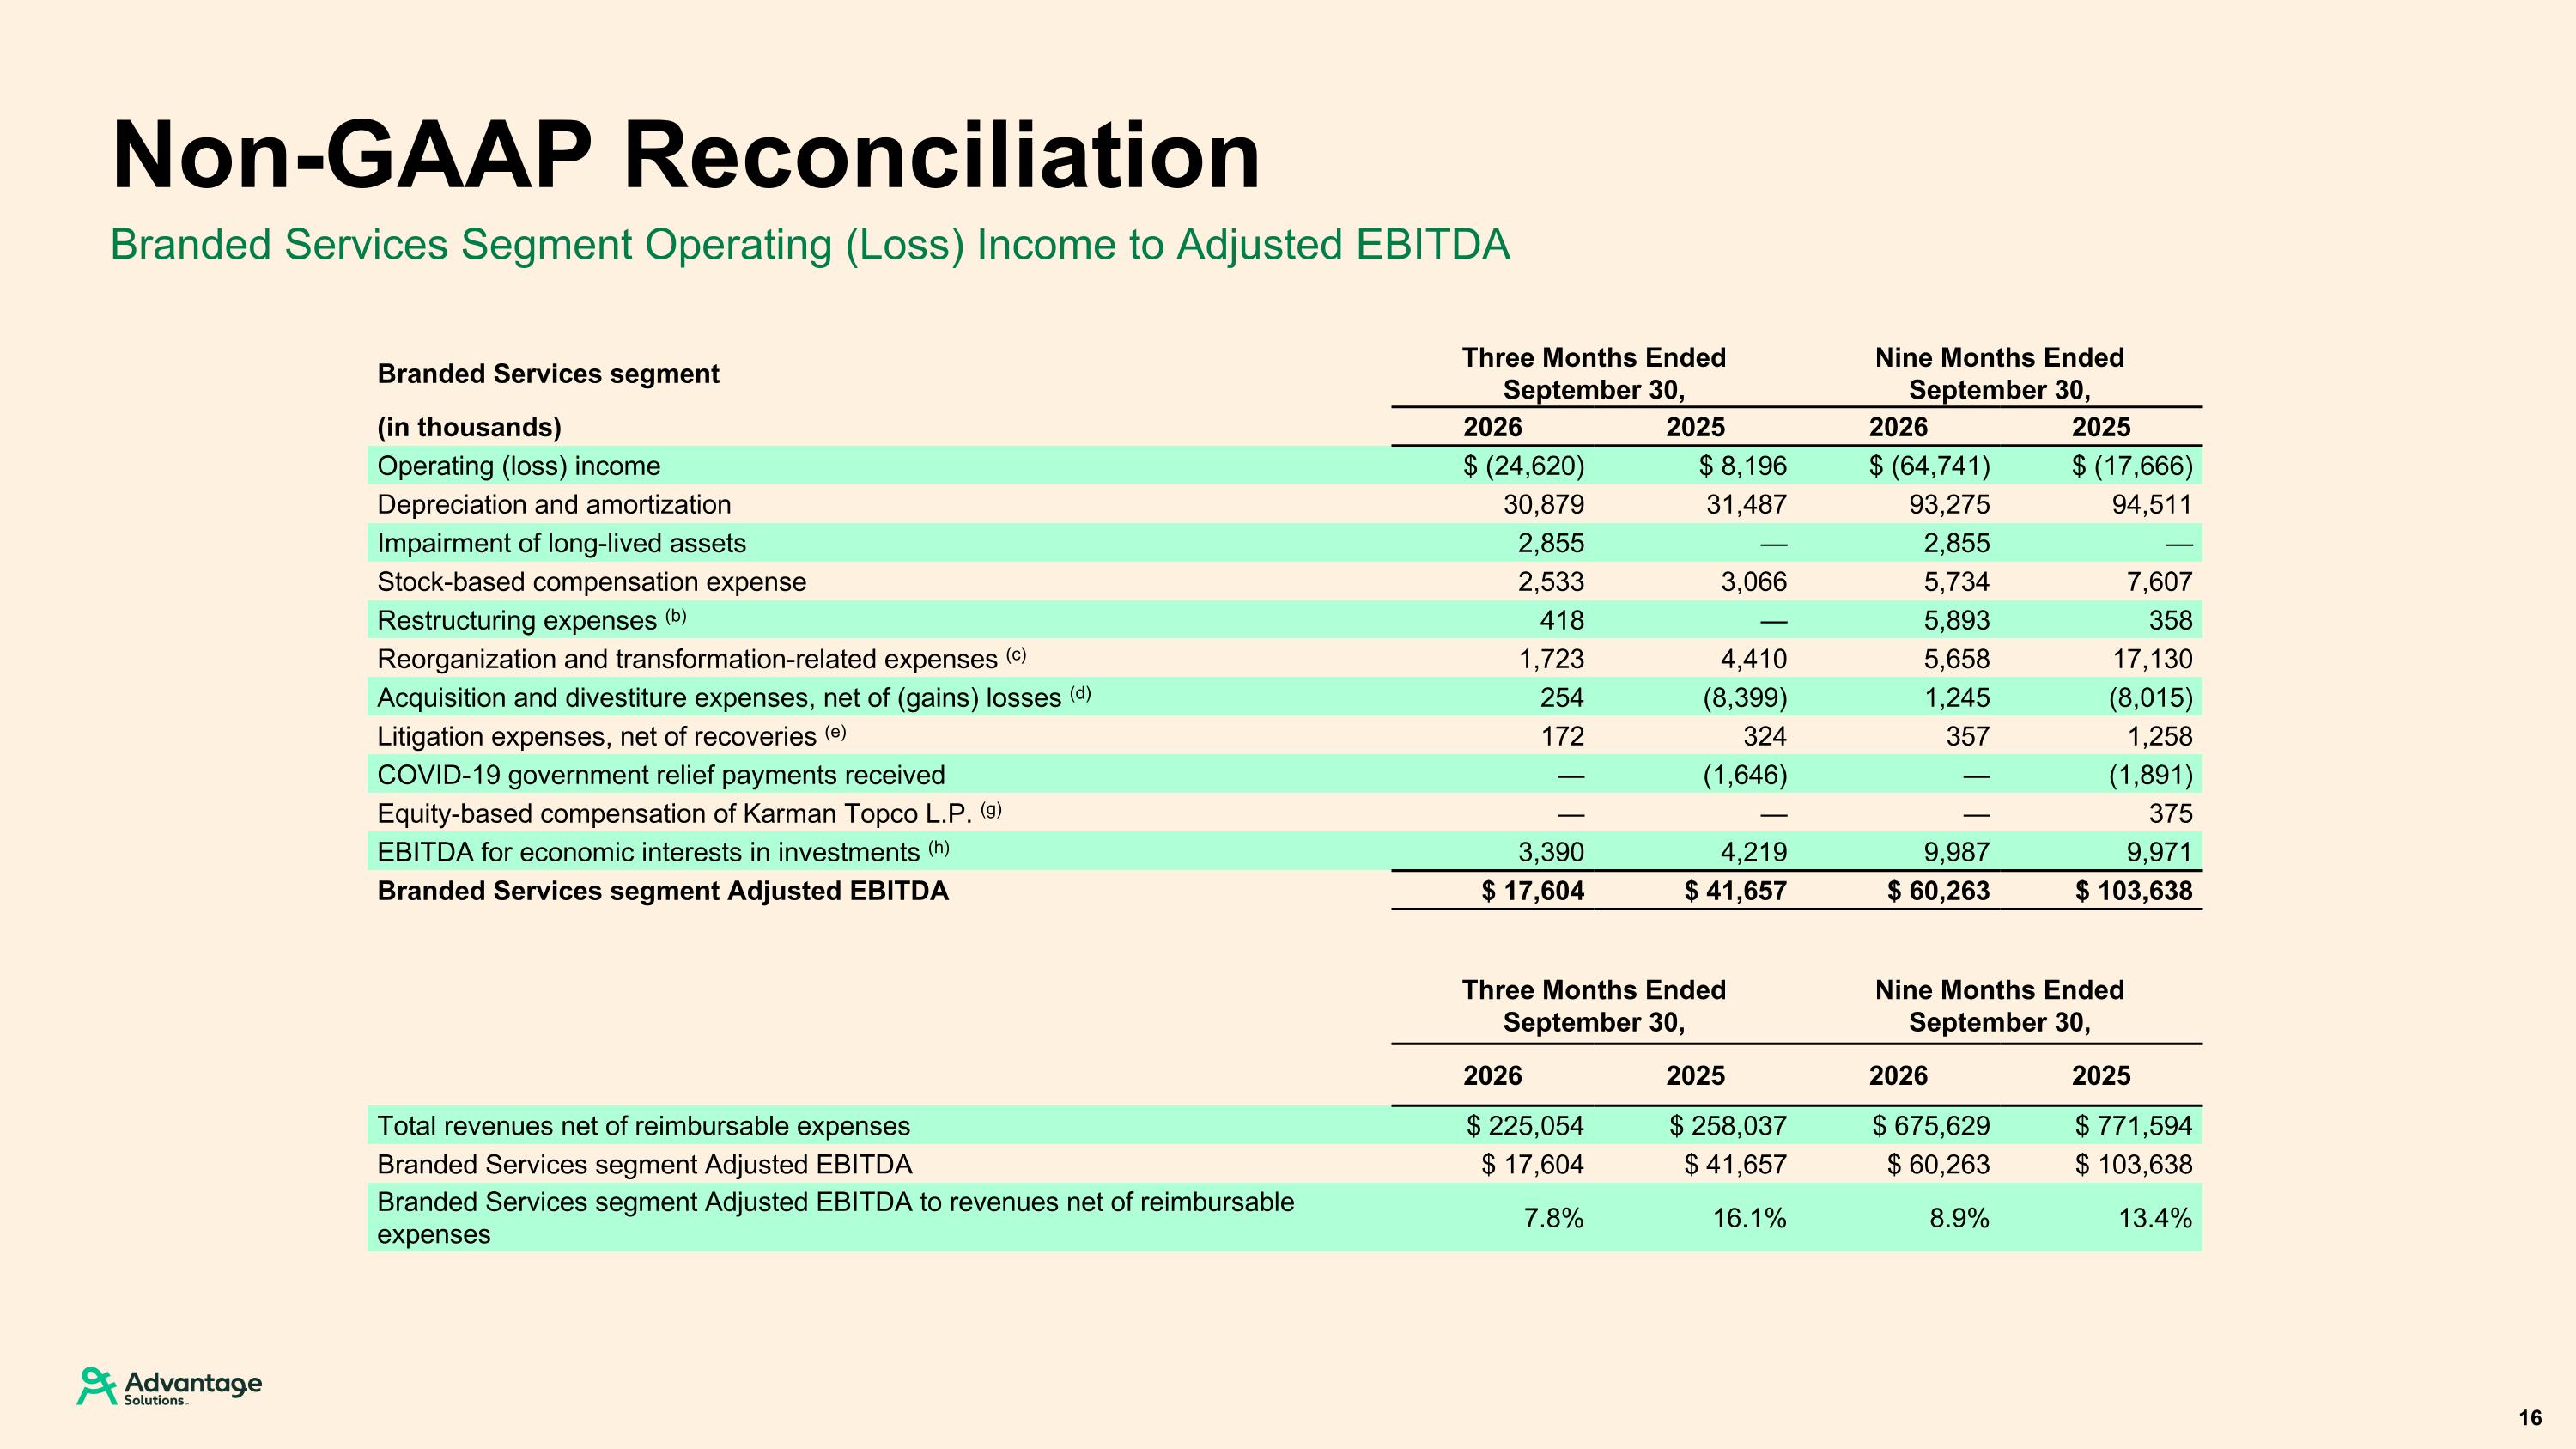
Branded Services Segment Operating (Loss) Income to Adjusted EBITDA Non-GAAP Reconciliation 16 Branded Services segment Three Months Ended September 30, Nine Months Ended September 30, (in thousands) 2026 2025 2026 2025 Operating (loss) income $ (24,620) $ 8,196 $ (64,741) $ (17,666) Depreciation and amortization 30,879 31,487 93,275 94,511 Impairment of long-lived assets 2,855 — 2,855 — Stock-based compensation expense 2,533 3,066 5,734 7,607 Restructuring expenses (b) 418 — 5,893 358 Reorganization and transformation-related expenses (c) 1,723 4,410 5,658 17,130 Acquisition and divestiture expenses, net of (gains) losses (d) 254 (8,399) 1,245 (8,015) Litigation expenses, net of recoveries (e) 172 324 357 1,258 COVID-19 government relief payments received — (1,646) — (1,891) Equity-based compensation of Karman Topco L.P. (g) — — — 375 EBITDA for economic interests in investments (h) 3,390 4,219 9,987 9,971 Branded Services segment Adjusted EBITDA $ 17,604 $ 41,657 $ 60,263 $ 103,638 Three Months Ended September 30, Nine Months Ended September 30, 2026 2025 2026 2025 Total revenues net of reimbursable expenses $ 225,054 $ 258,037 $ 675,629 $ 771,594 Branded Services segment Adjusted EBITDA $ 17,604 $ 41,657 $ 60,263 $ 103,638 Branded Services segment Adjusted EBITDA to revenues net of reimbursable expenses 7.8% 16.1% 8.9% 13.4%
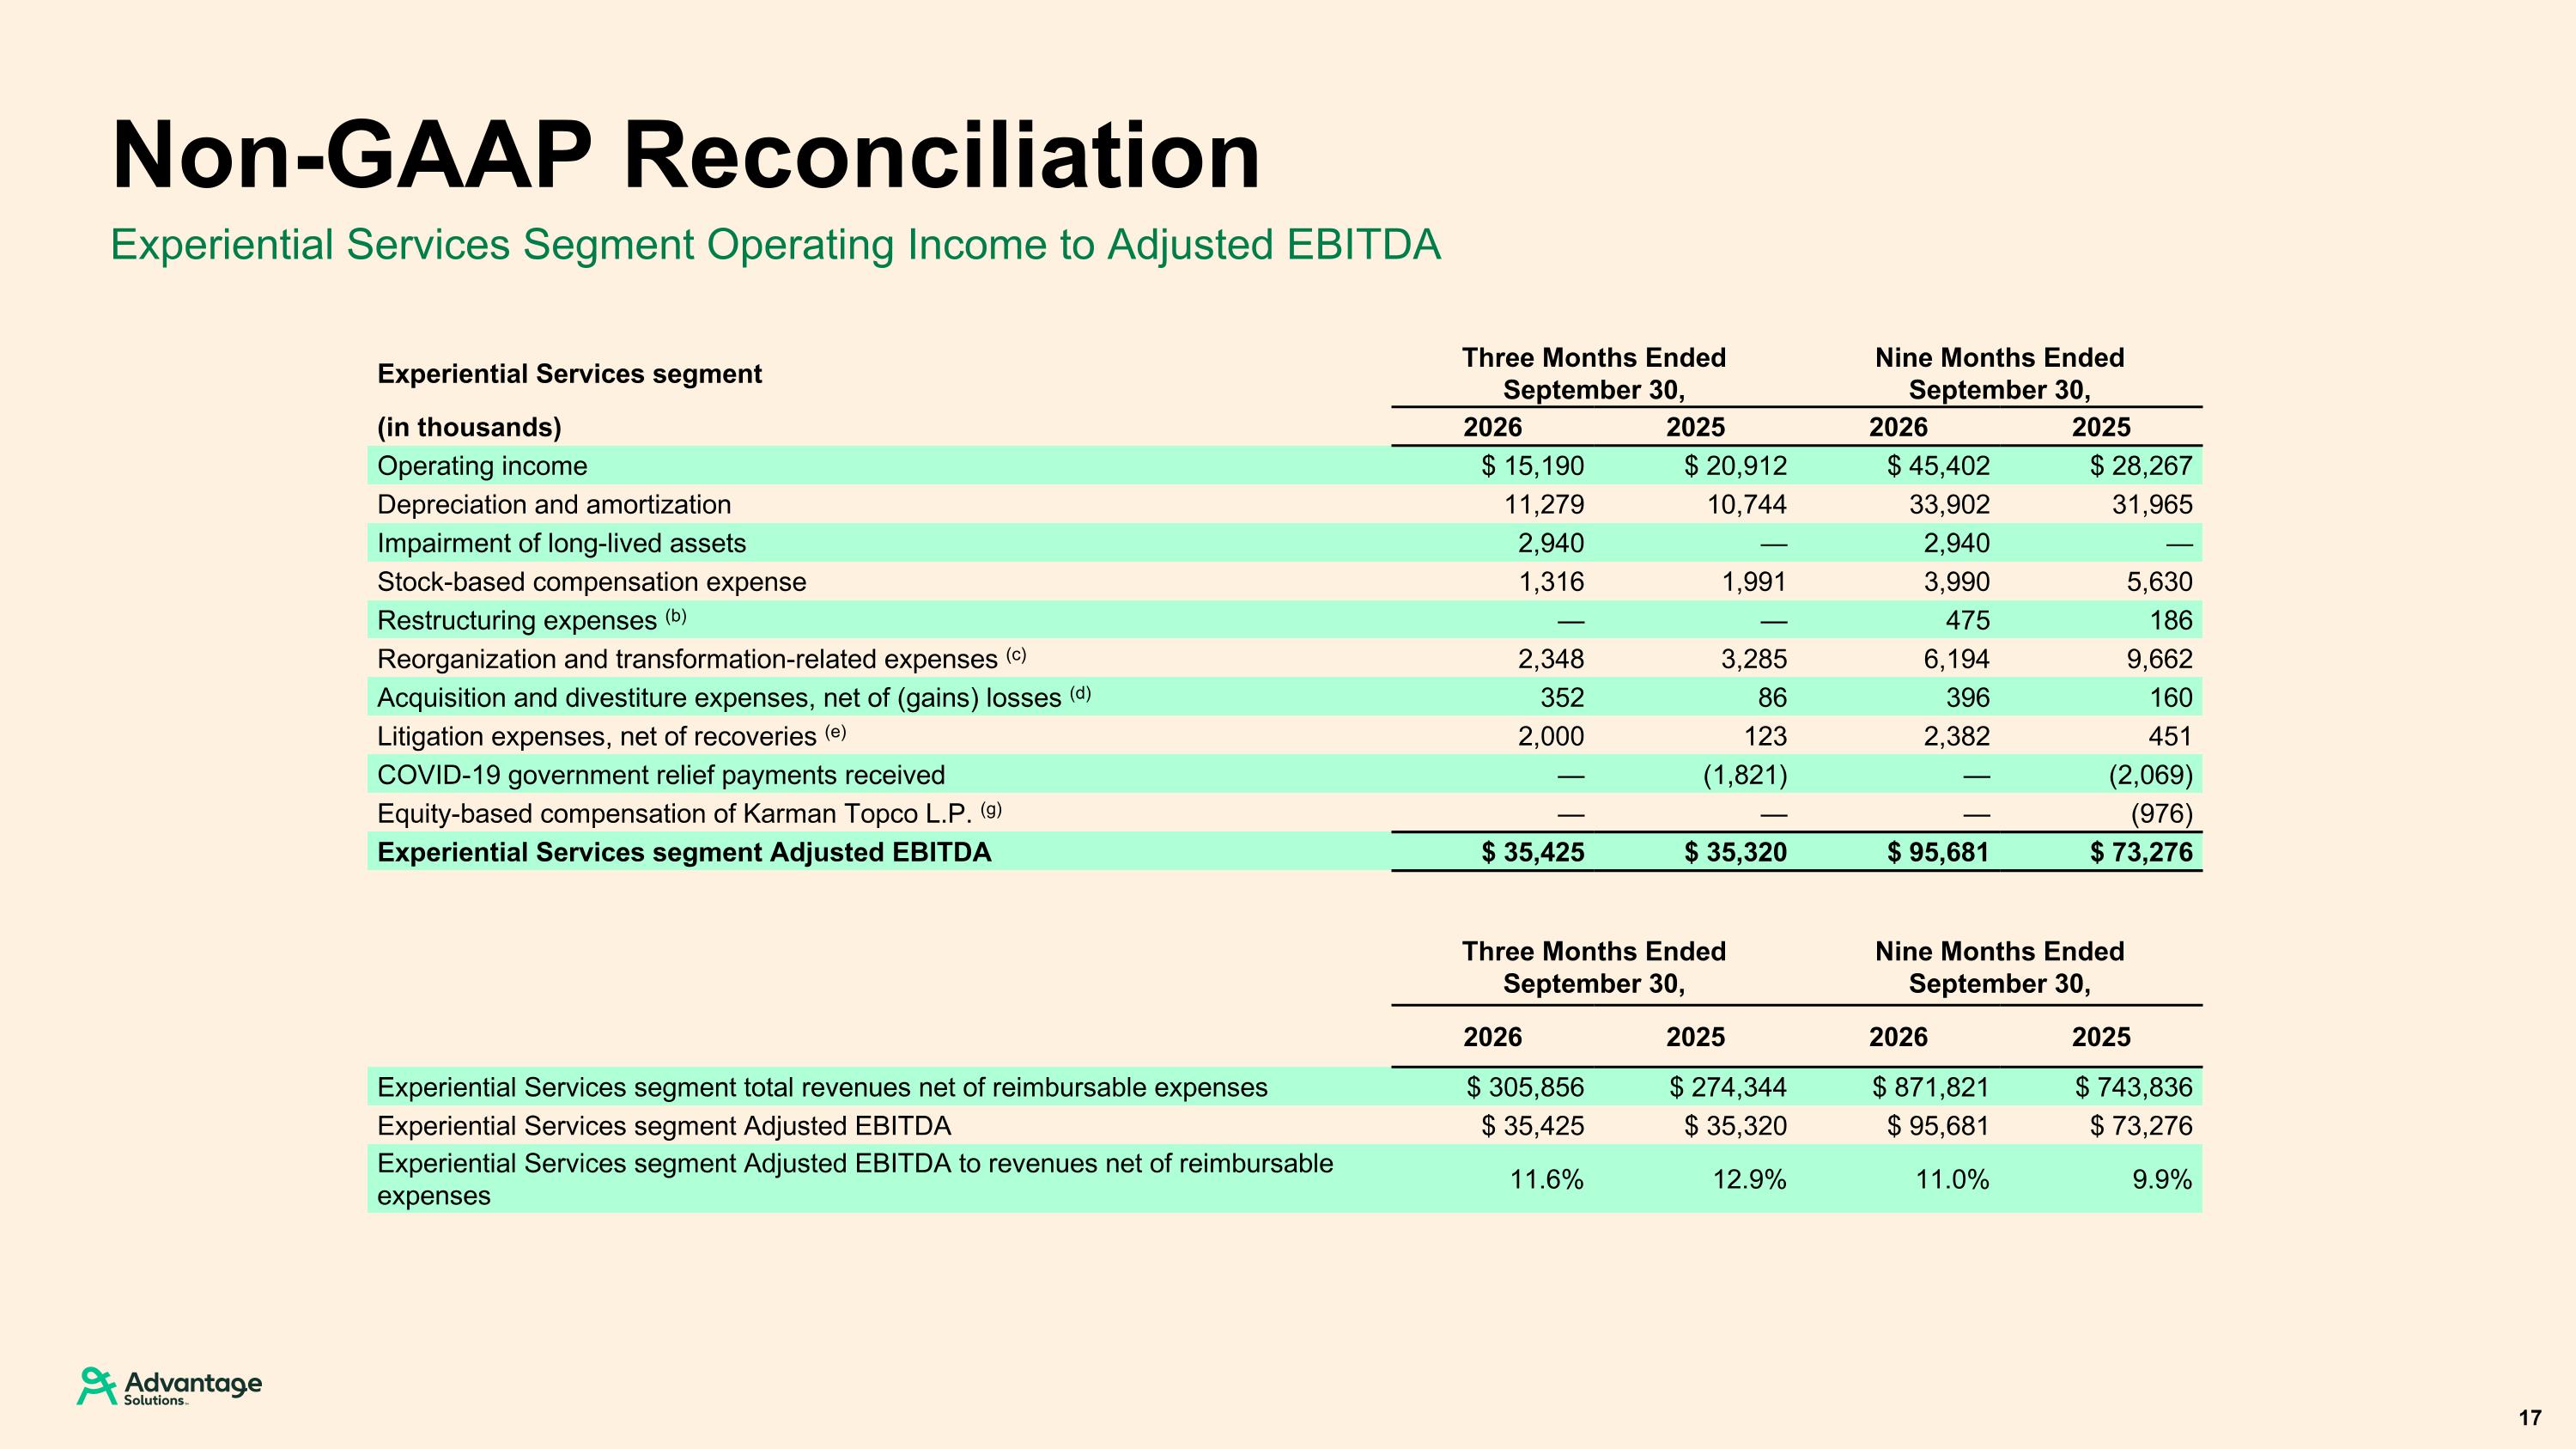
Experiential Services Segment Operating Income to Adjusted EBITDA Non-GAAP Reconciliation 17 Experiential Services segment Three Months Ended September 30, Nine Months Ended September 30, (in thousands) 2026 2025 2026 2025 Operating income $ 15,190 $ 20,912 $ 45,402 $ 28,267 Depreciation and amortization 11,279 10,744 33,902 31,965 Impairment of long-lived assets 2,940 — 2,940 — Stock-based compensation expense 1,316 1,991 3,990 5,630 Restructuring expenses (b) — — 475 186 Reorganization and transformation-related expenses (c) 2,348 3,285 6,194 9,662 Acquisition and divestiture expenses, net of (gains) losses (d) 352 86 396 160 Litigation expenses, net of recoveries (e) 2,000 123 2,382 451 COVID-19 government relief payments received — (1,821) — (2,069) Equity-based compensation of Karman Topco L.P. (g) — — — (976) Experiential Services segment Adjusted EBITDA $ 35,425 $ 35,320 $ 95,681 $ 73,276 Three Months Ended September 30, Nine Months Ended September 30, 2026 2025 2026 2025 Experiential Services segment total revenues net of reimbursable expenses $ 305,856 $ 274,344 $ 871,821 $ 743,836 Experiential Services segment Adjusted EBITDA $ 35,425 $ 35,320 $ 95,681 $ 73,276 Experiential Services segment Adjusted EBITDA to revenues net of reimbursable expenses 11.6% 12.9% 11.0% 9.9%
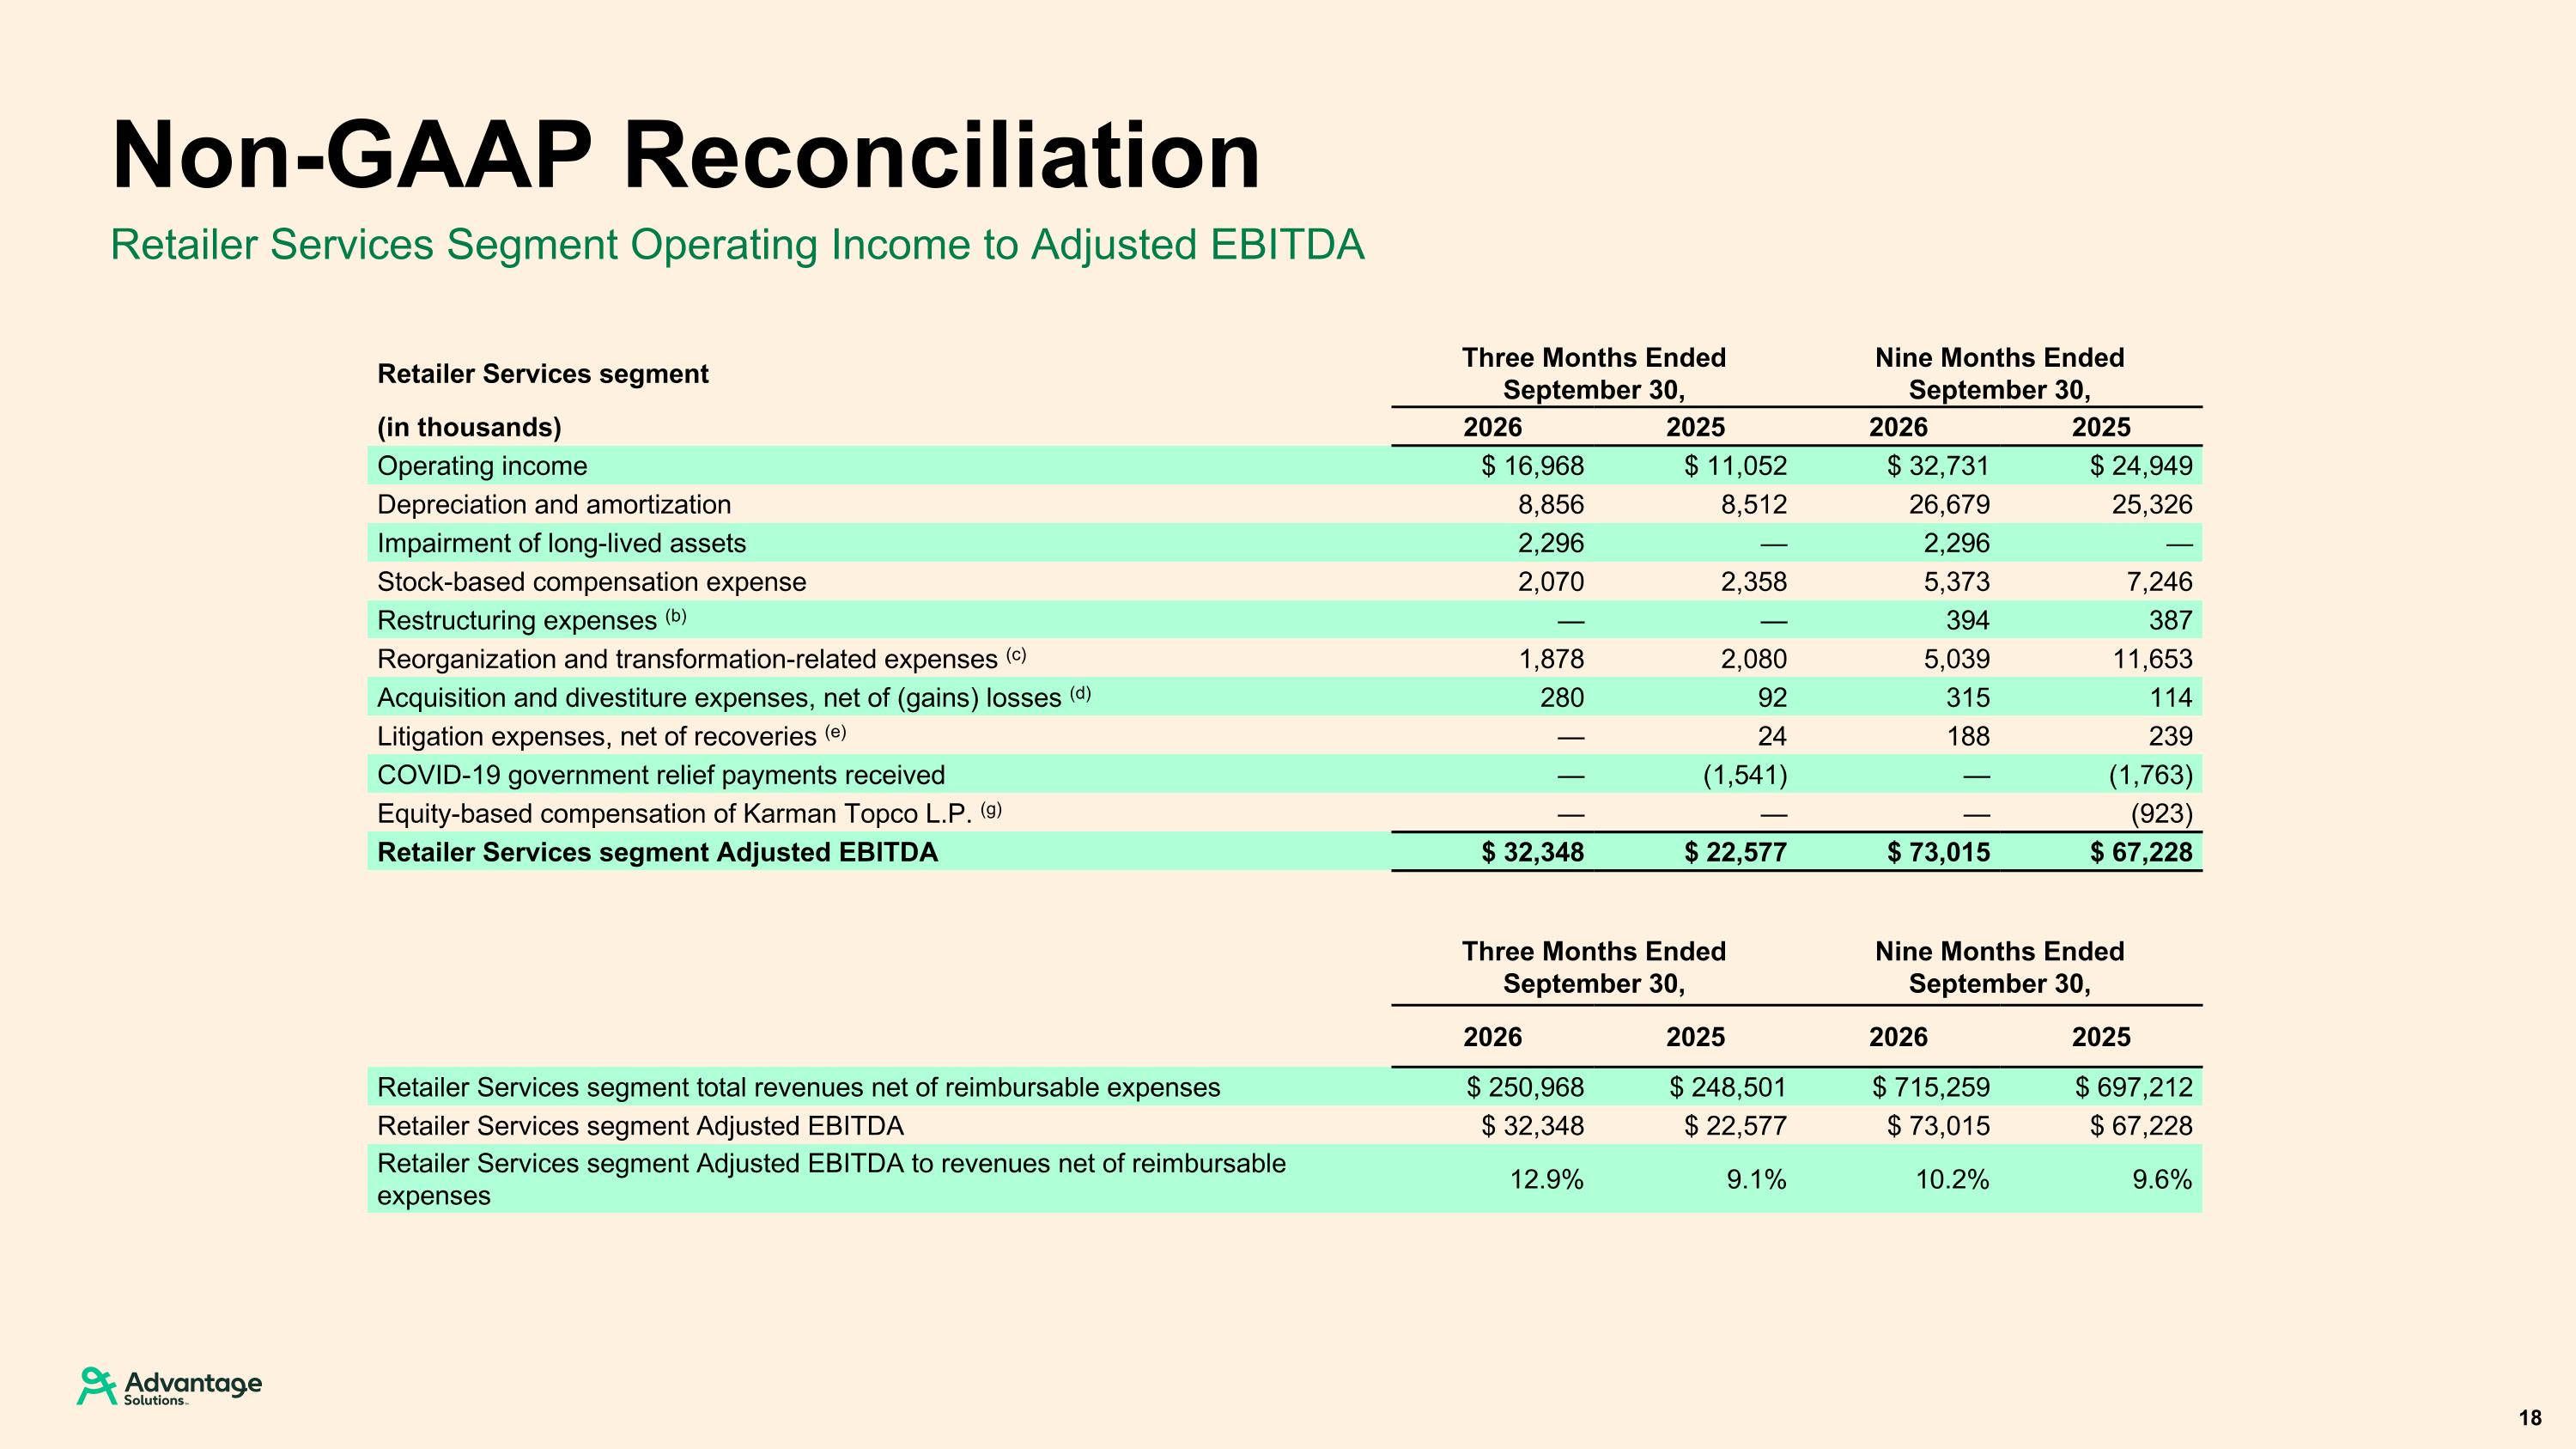
Retailer Services Segment Operating Income to Adjusted EBITDA Non-GAAP Reconciliation 18 Retailer Services segment Three Months Ended September 30, Nine Months Ended September 30, (in thousands) 2026 2025 2026 2025 Operating income $ 16,968 $ 11,052 $ 32,731 $ 24,949 Depreciation and amortization 8,856 8,512 26,679 25,326 Impairment of long-lived assets 2,296 — 2,296 — Stock-based compensation expense 2,070 2,358 5,373 7,246 Restructuring expenses (b) — — 394 387 Reorganization and transformation-related expenses (c) 1,878 2,080 5,039 11,653 Acquisition and divestiture expenses, net of (gains) losses (d) 280 92 315 114 Litigation expenses, net of recoveries (e) — 24 188 239 COVID-19 government relief payments received — (1,541) — (1,763) Equity-based compensation of Karman Topco L.P. (g) — — — (923) Retailer Services segment Adjusted EBITDA $ 32,348 $ 22,577 $ 73,015 $ 67,228 Three Months Ended September 30, Nine Months Ended September 30, 2026 2025 2026 2025 Retailer Services segment total revenues net of reimbursable expenses $ 250,968 $ 248,501 $ 715,259 $ 697,212 Retailer Services segment Adjusted EBITDA $ 32,348 $ 22,577 $ 73,015 $ 67,228 Retailer Services segment Adjusted EBITDA to revenues net of reimbursable expenses 12.9% 9.1% 10.2% 9.6%
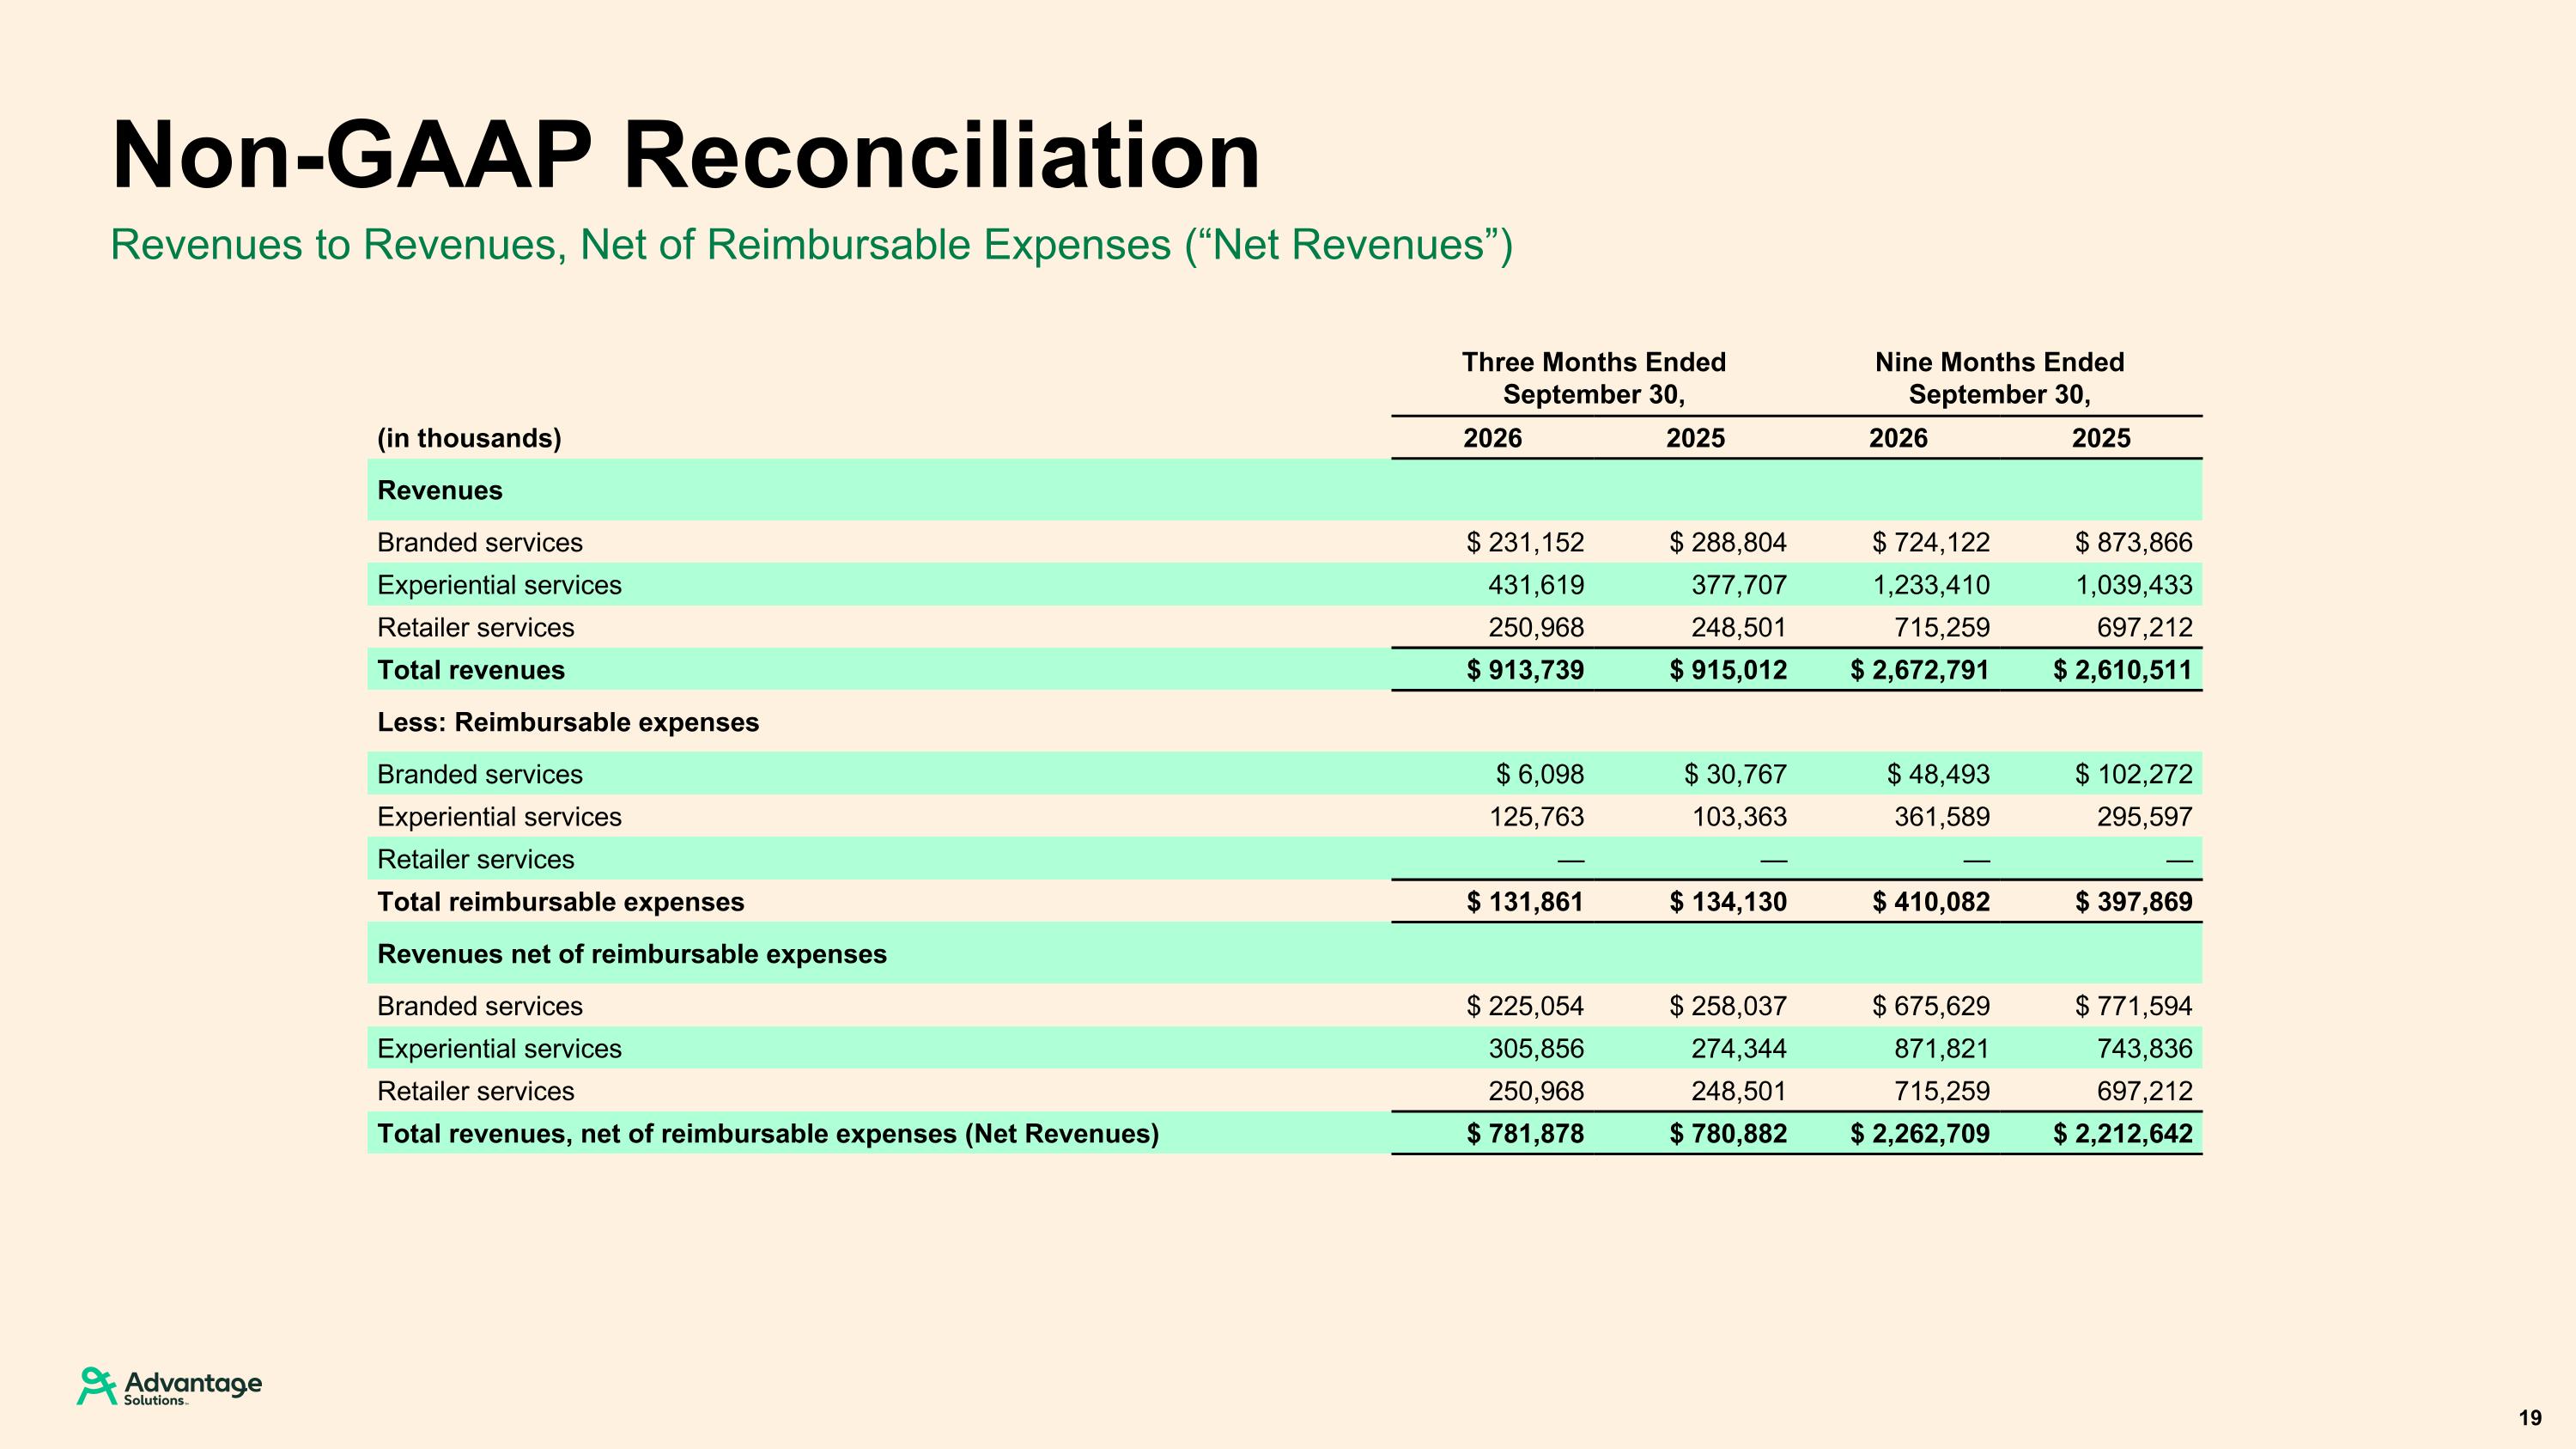
Revenues to Revenues, Net of Reimbursable Expenses (“Net Revenues”) Non-GAAP Reconciliation 19 Three Months Ended September 30, Nine Months Ended September 30, (in thousands) 2026 2025 2026 2025 Revenues Branded services $ 231,152 $ 288,804 $ 724,122 $ 873,866 Experiential services 431,619 377,707 1,233,410 1,039,433 Retailer services 250,968 248,501 715,259 697,212 Total revenues $ 913,739 $ 915,012 $ 2,672,791 $ 2,610,511 Less: Reimbursable expenses Branded services $ 6,098 $ 30,767 $ 48,493 $ 102,272 Experiential services 125,763 103,363 361,589 295,597 Retailer services — — — — Total reimbursable expenses $ 131,861 $ 134,130 $ 410,082 $ 397,869 Revenues net of reimbursable expenses Branded services $ 225,054 $ 258,037 $ 675,629 $ 771,594 Experiential services 305,856 274,344 871,821 743,836 Retailer services 250,968 248,501 715,259 697,212 Total revenues, net of reimbursable expenses (Net Revenues) $ 781,878 $ 780,882 $ 2,262,709 $ 2,212,642
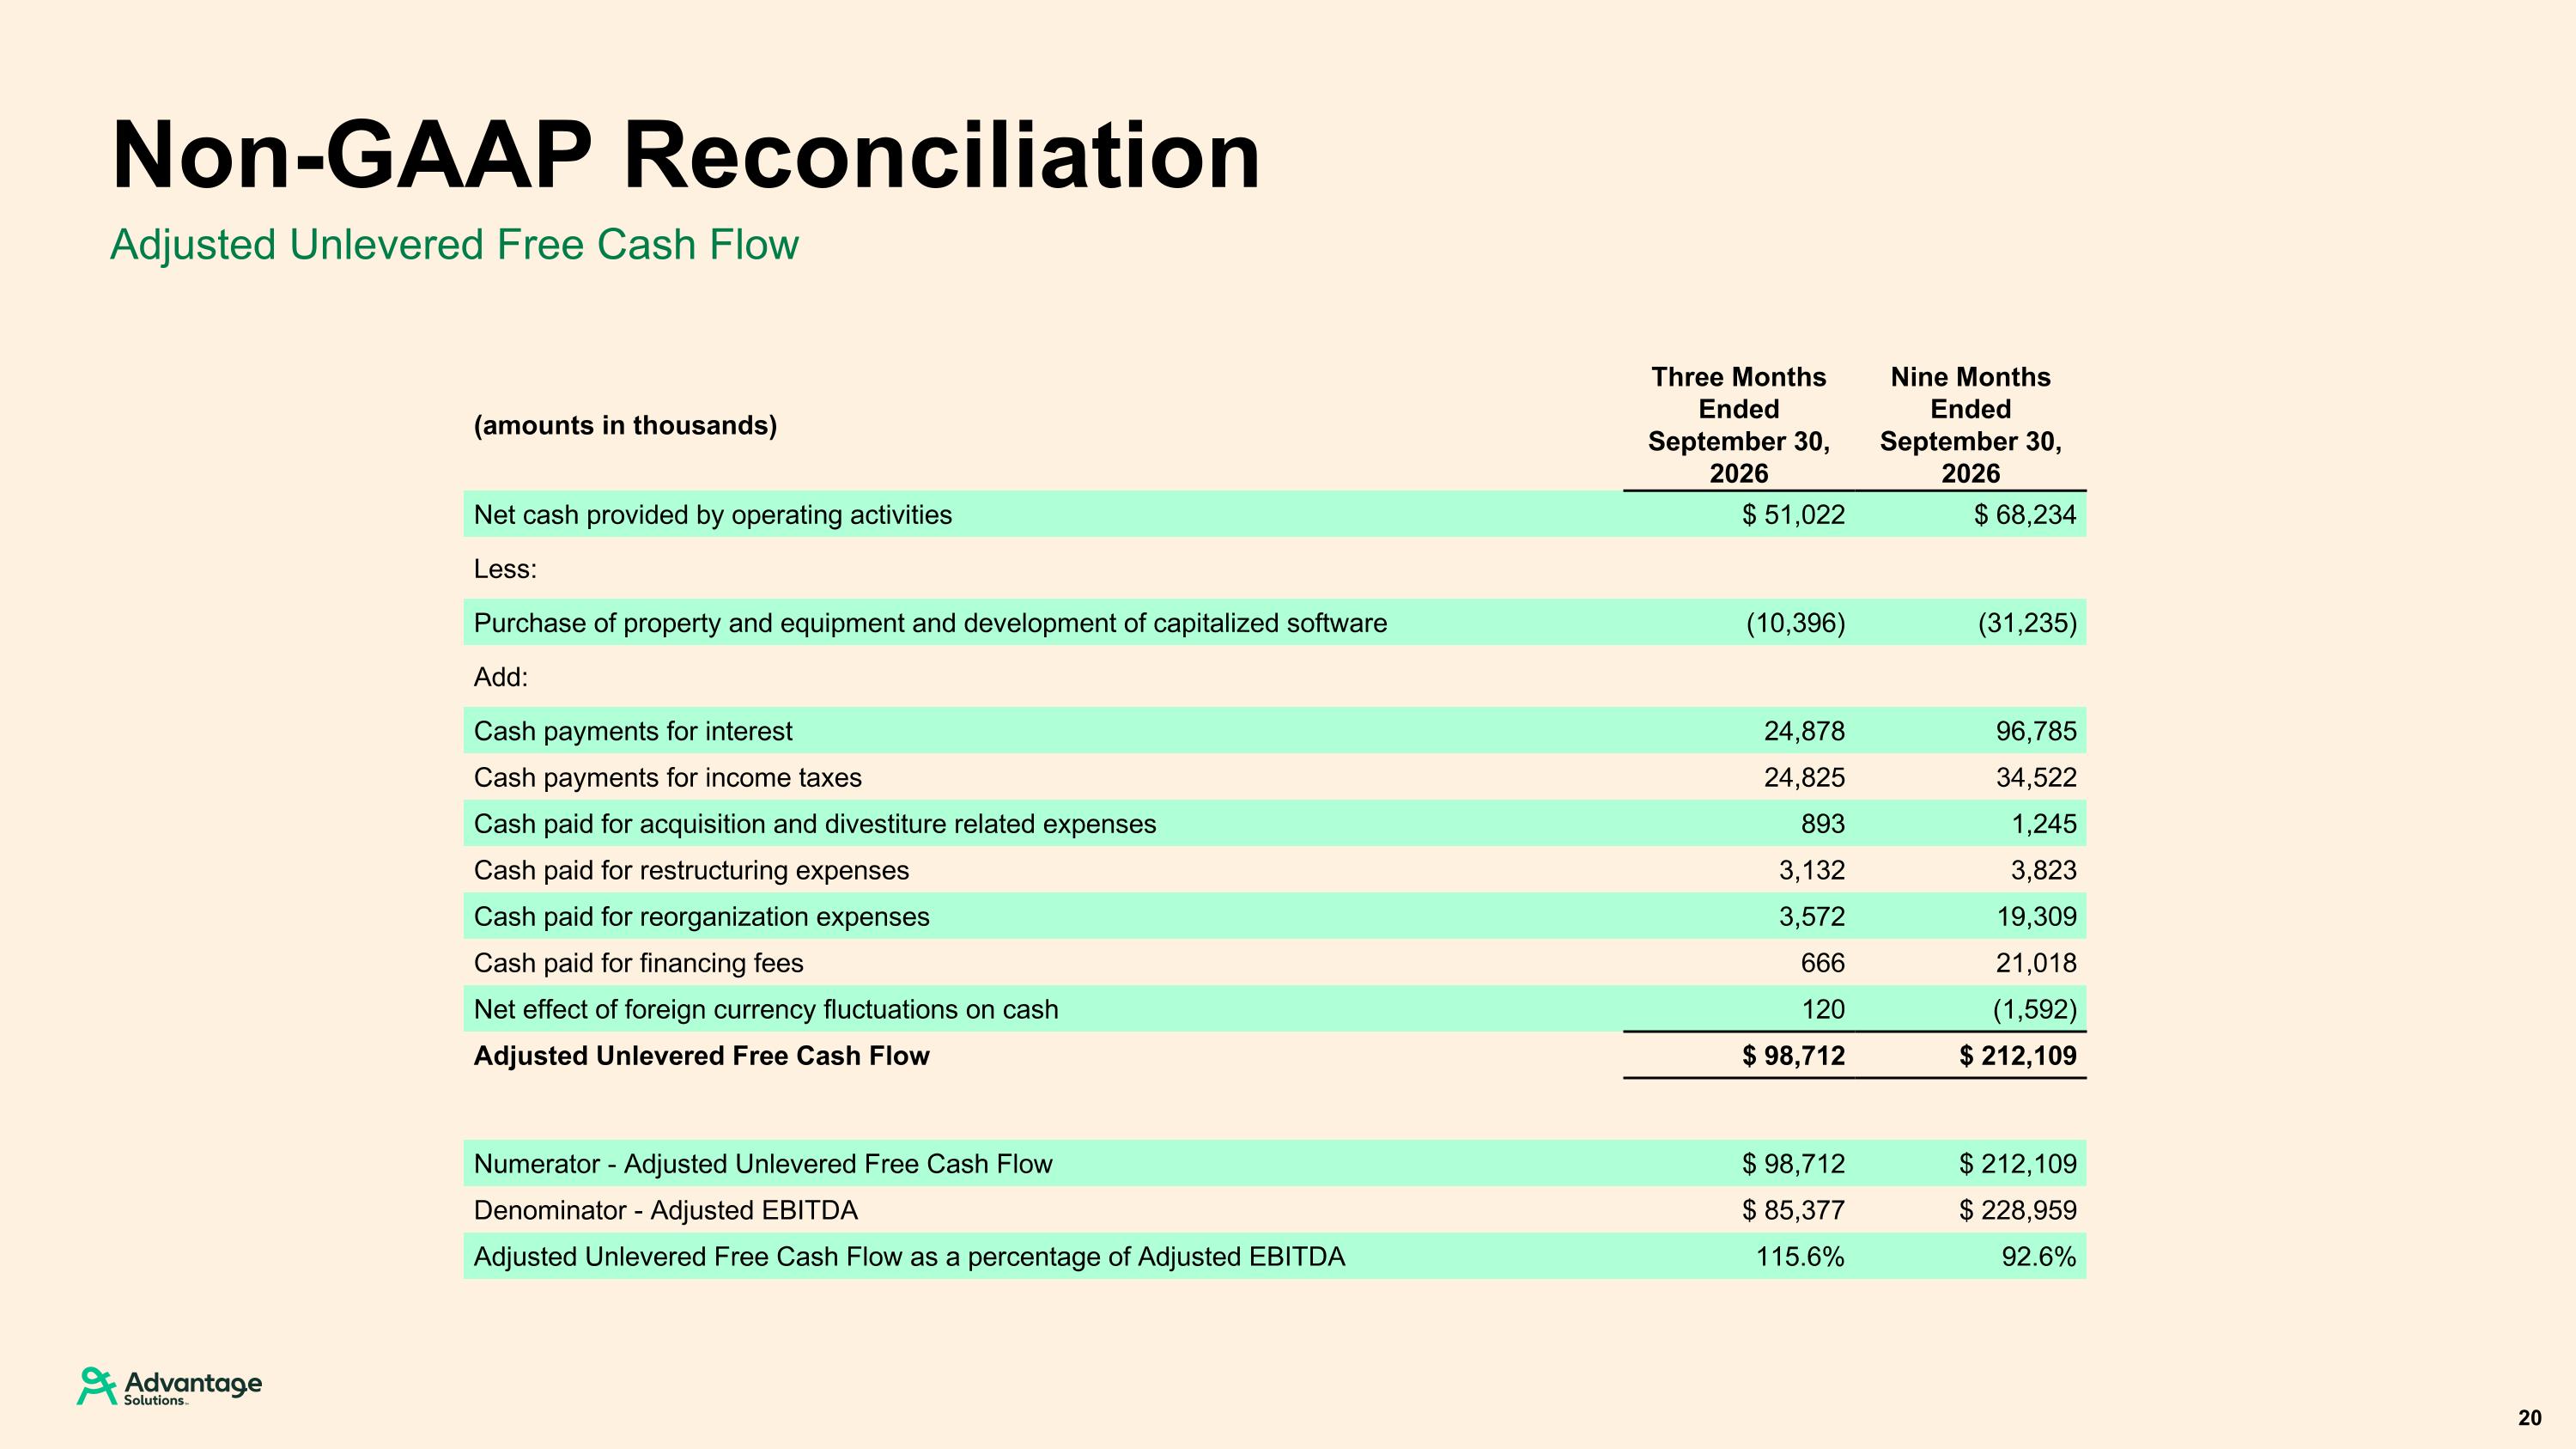
Adjusted Unlevered Free Cash Flow Non-GAAP Reconciliation 20 (amounts in thousands) Three Months Ended September 30, 2026 Nine Months Ended September 30, 2026 Net cash provided by operating activities $ 51,022 $ 68,234 Less: Purchase of property and equipment and development of capitalized software (10,396) (31,235) Add: Cash payments for interest 24,878 96,785 Cash payments for income taxes 24,825 34,522 Cash paid for acquisition and divestiture related expenses 893 1,245 Cash paid for restructuring expenses 3,132 3,823 Cash paid for reorganization expenses 3,572 19,309 Cash paid for financing fees 666 21,018 Net effect of foreign currency fluctuations on cash 120 (1,592) Adjusted Unlevered Free Cash Flow $ 98,712 $ 212,109 Numerator - Adjusted Unlevered Free Cash Flow $ 98,712 $ 212,109 Denominator - Adjusted EBITDA $ 85,377 $ 228,959 Adjusted Unlevered Free Cash Flow as a percentage of Adjusted EBITDA 115.6% 92.6%
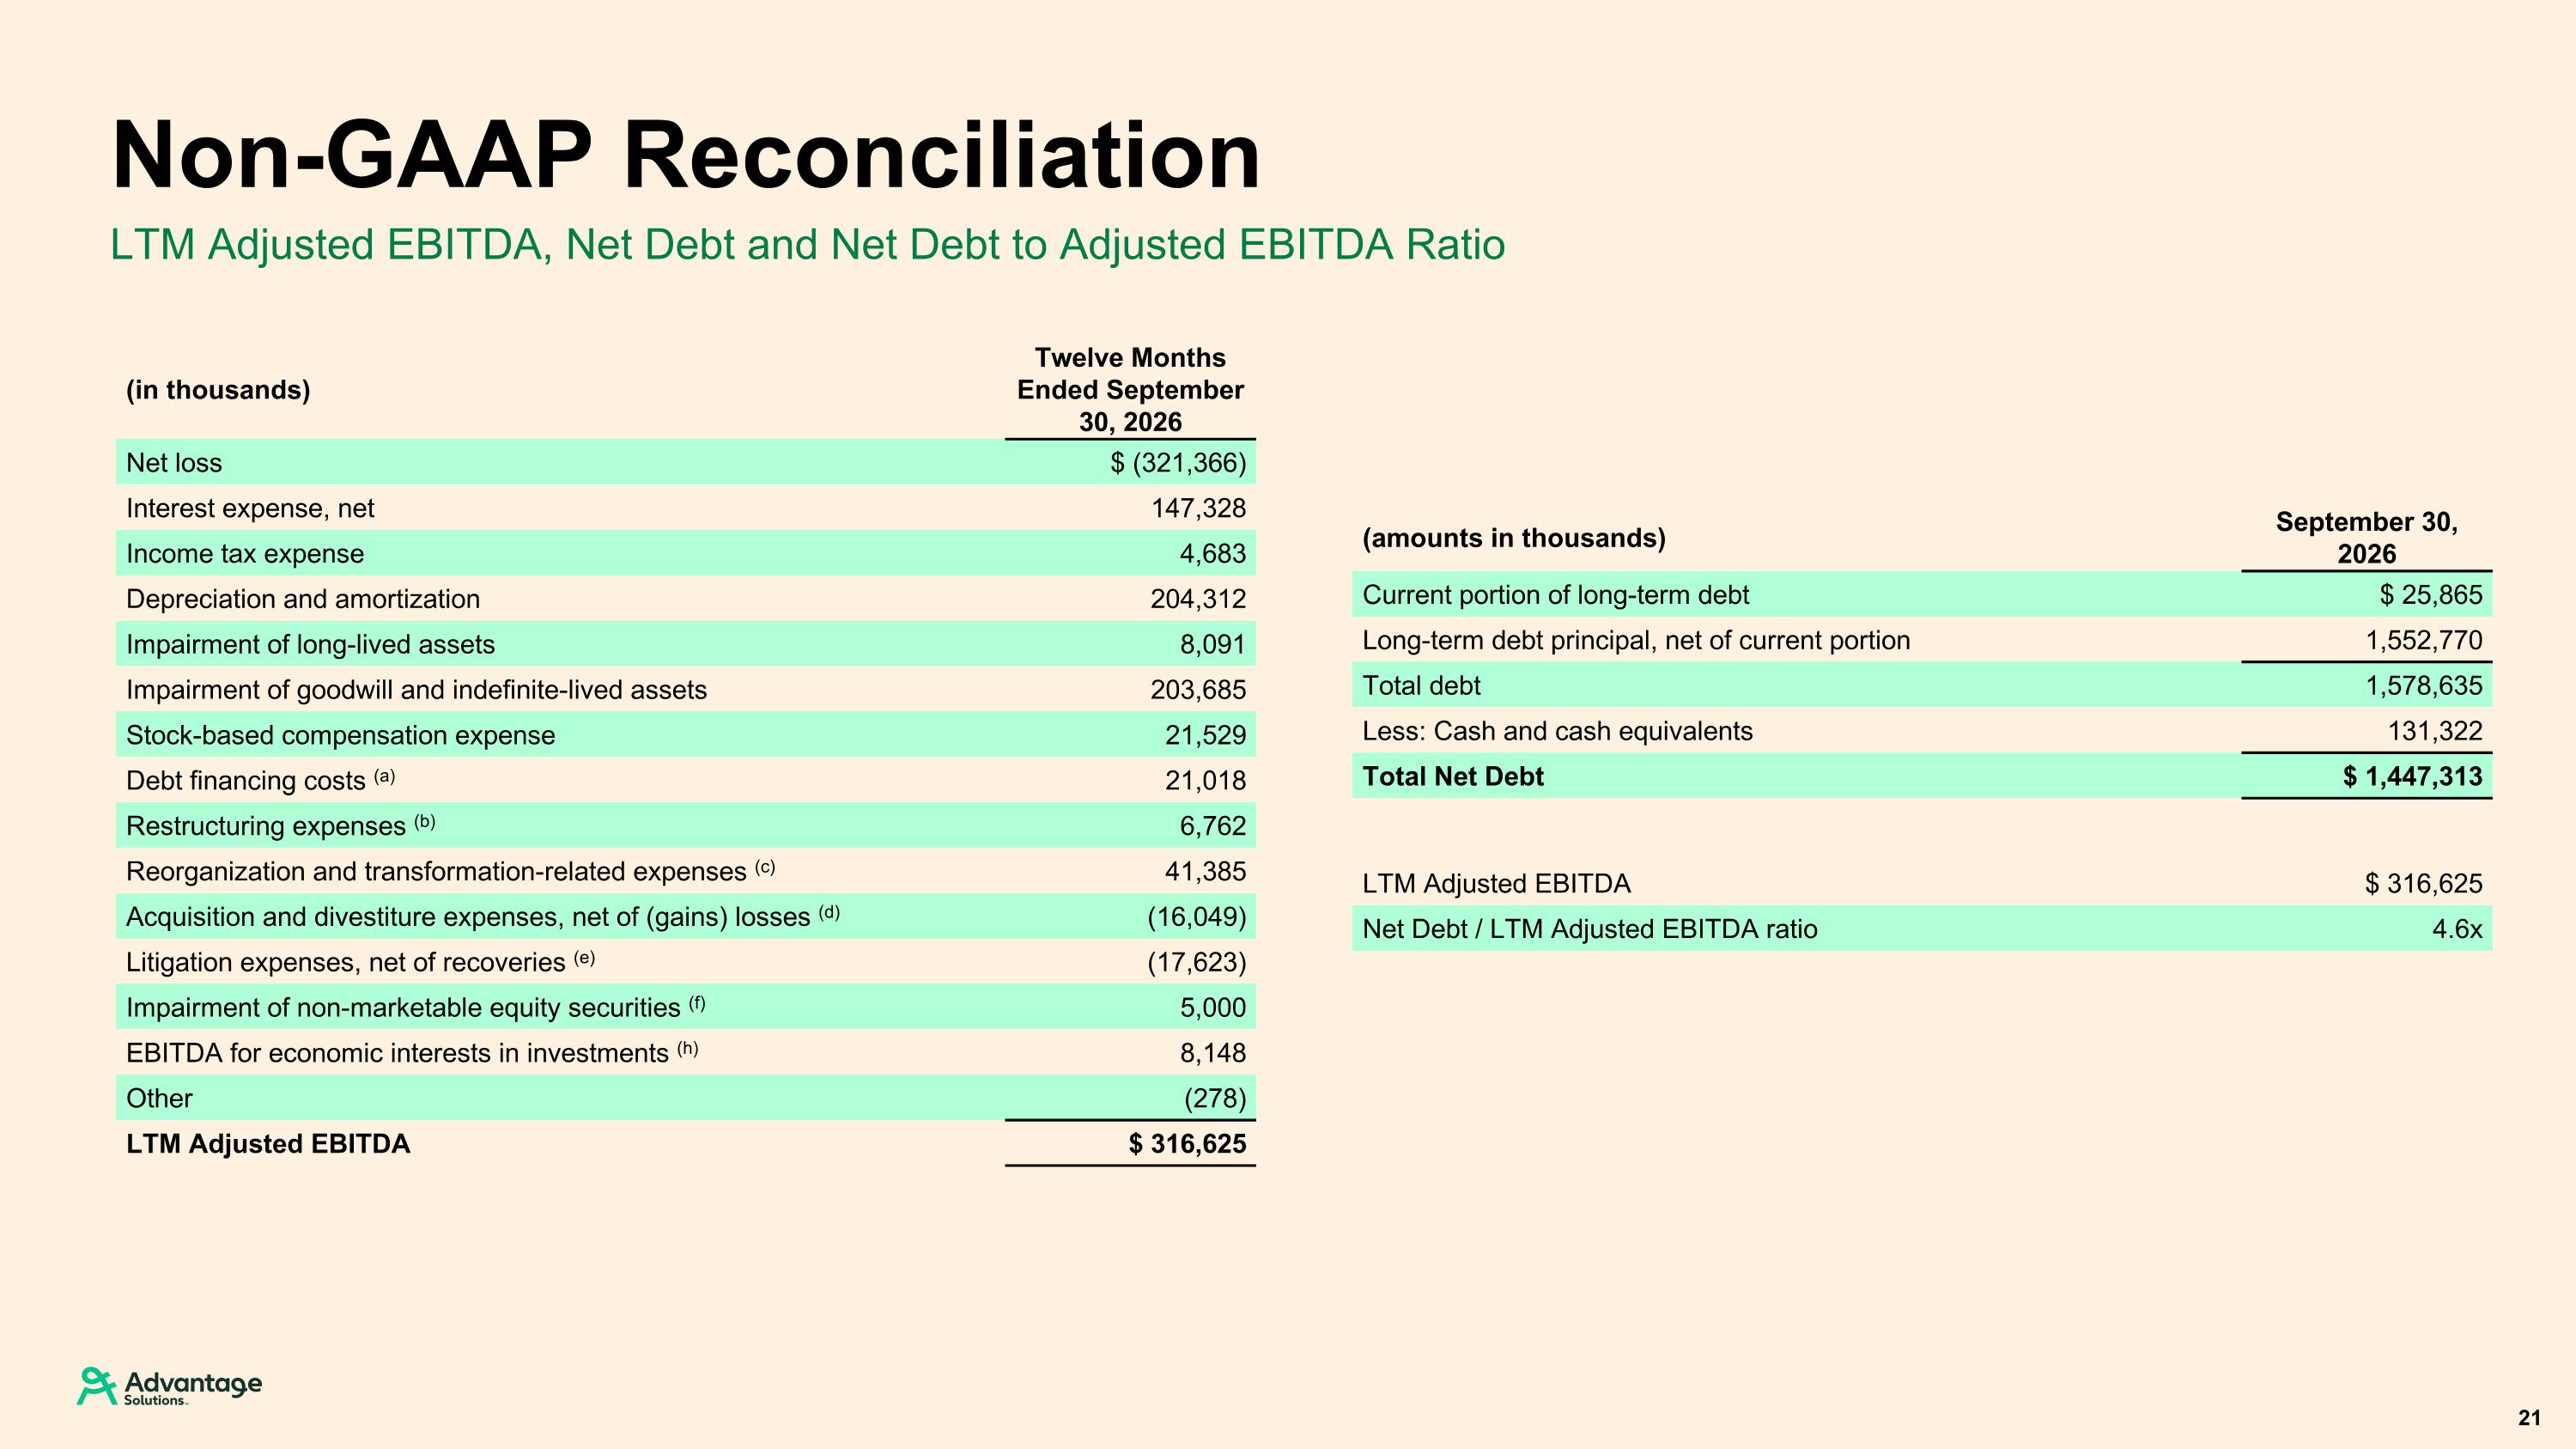
LTM Adjusted EBITDA, Net Debt and Net Debt to Adjusted EBITDA Ratio Non-GAAP Reconciliation 21 (in thousands) Twelve Months Ended September 30, 2026 Net loss $ (321,366) Interest expense, net 147,328 Income tax expense 4,683 Depreciation and amortization 204,312 Impairment of long-lived assets 8,091 Impairment of goodwill and indefinite-lived assets 203,685 Stock-based compensation expense 21,529 Debt financing costs (a) 21,018 Restructuring expenses (b) 6,762 Reorganization and transformation-related expenses (c) 41,385 Acquisition and divestiture expenses, net of (gains) losses (d) (16,049) Litigation expenses, net of recoveries (e) (17,623) Impairment of non-marketable equity securities (f) 5,000 EBITDA for economic interests in investments (h) 8,148 Other (278) LTM Adjusted EBITDA $ 316,625 (amounts in thousands) September 30, 2026 Current portion of long-term debt $ 25,865 Long-term debt principal, net of current portion 1,552,770 Total debt 1,578,635 Less: Cash and cash equivalents 131,322 Total Net Debt $ 1,447,313 LTM Adjusted EBITDA $ 316,625 Net Debt / LTM Adjusted EBITDA ratio 4.6x
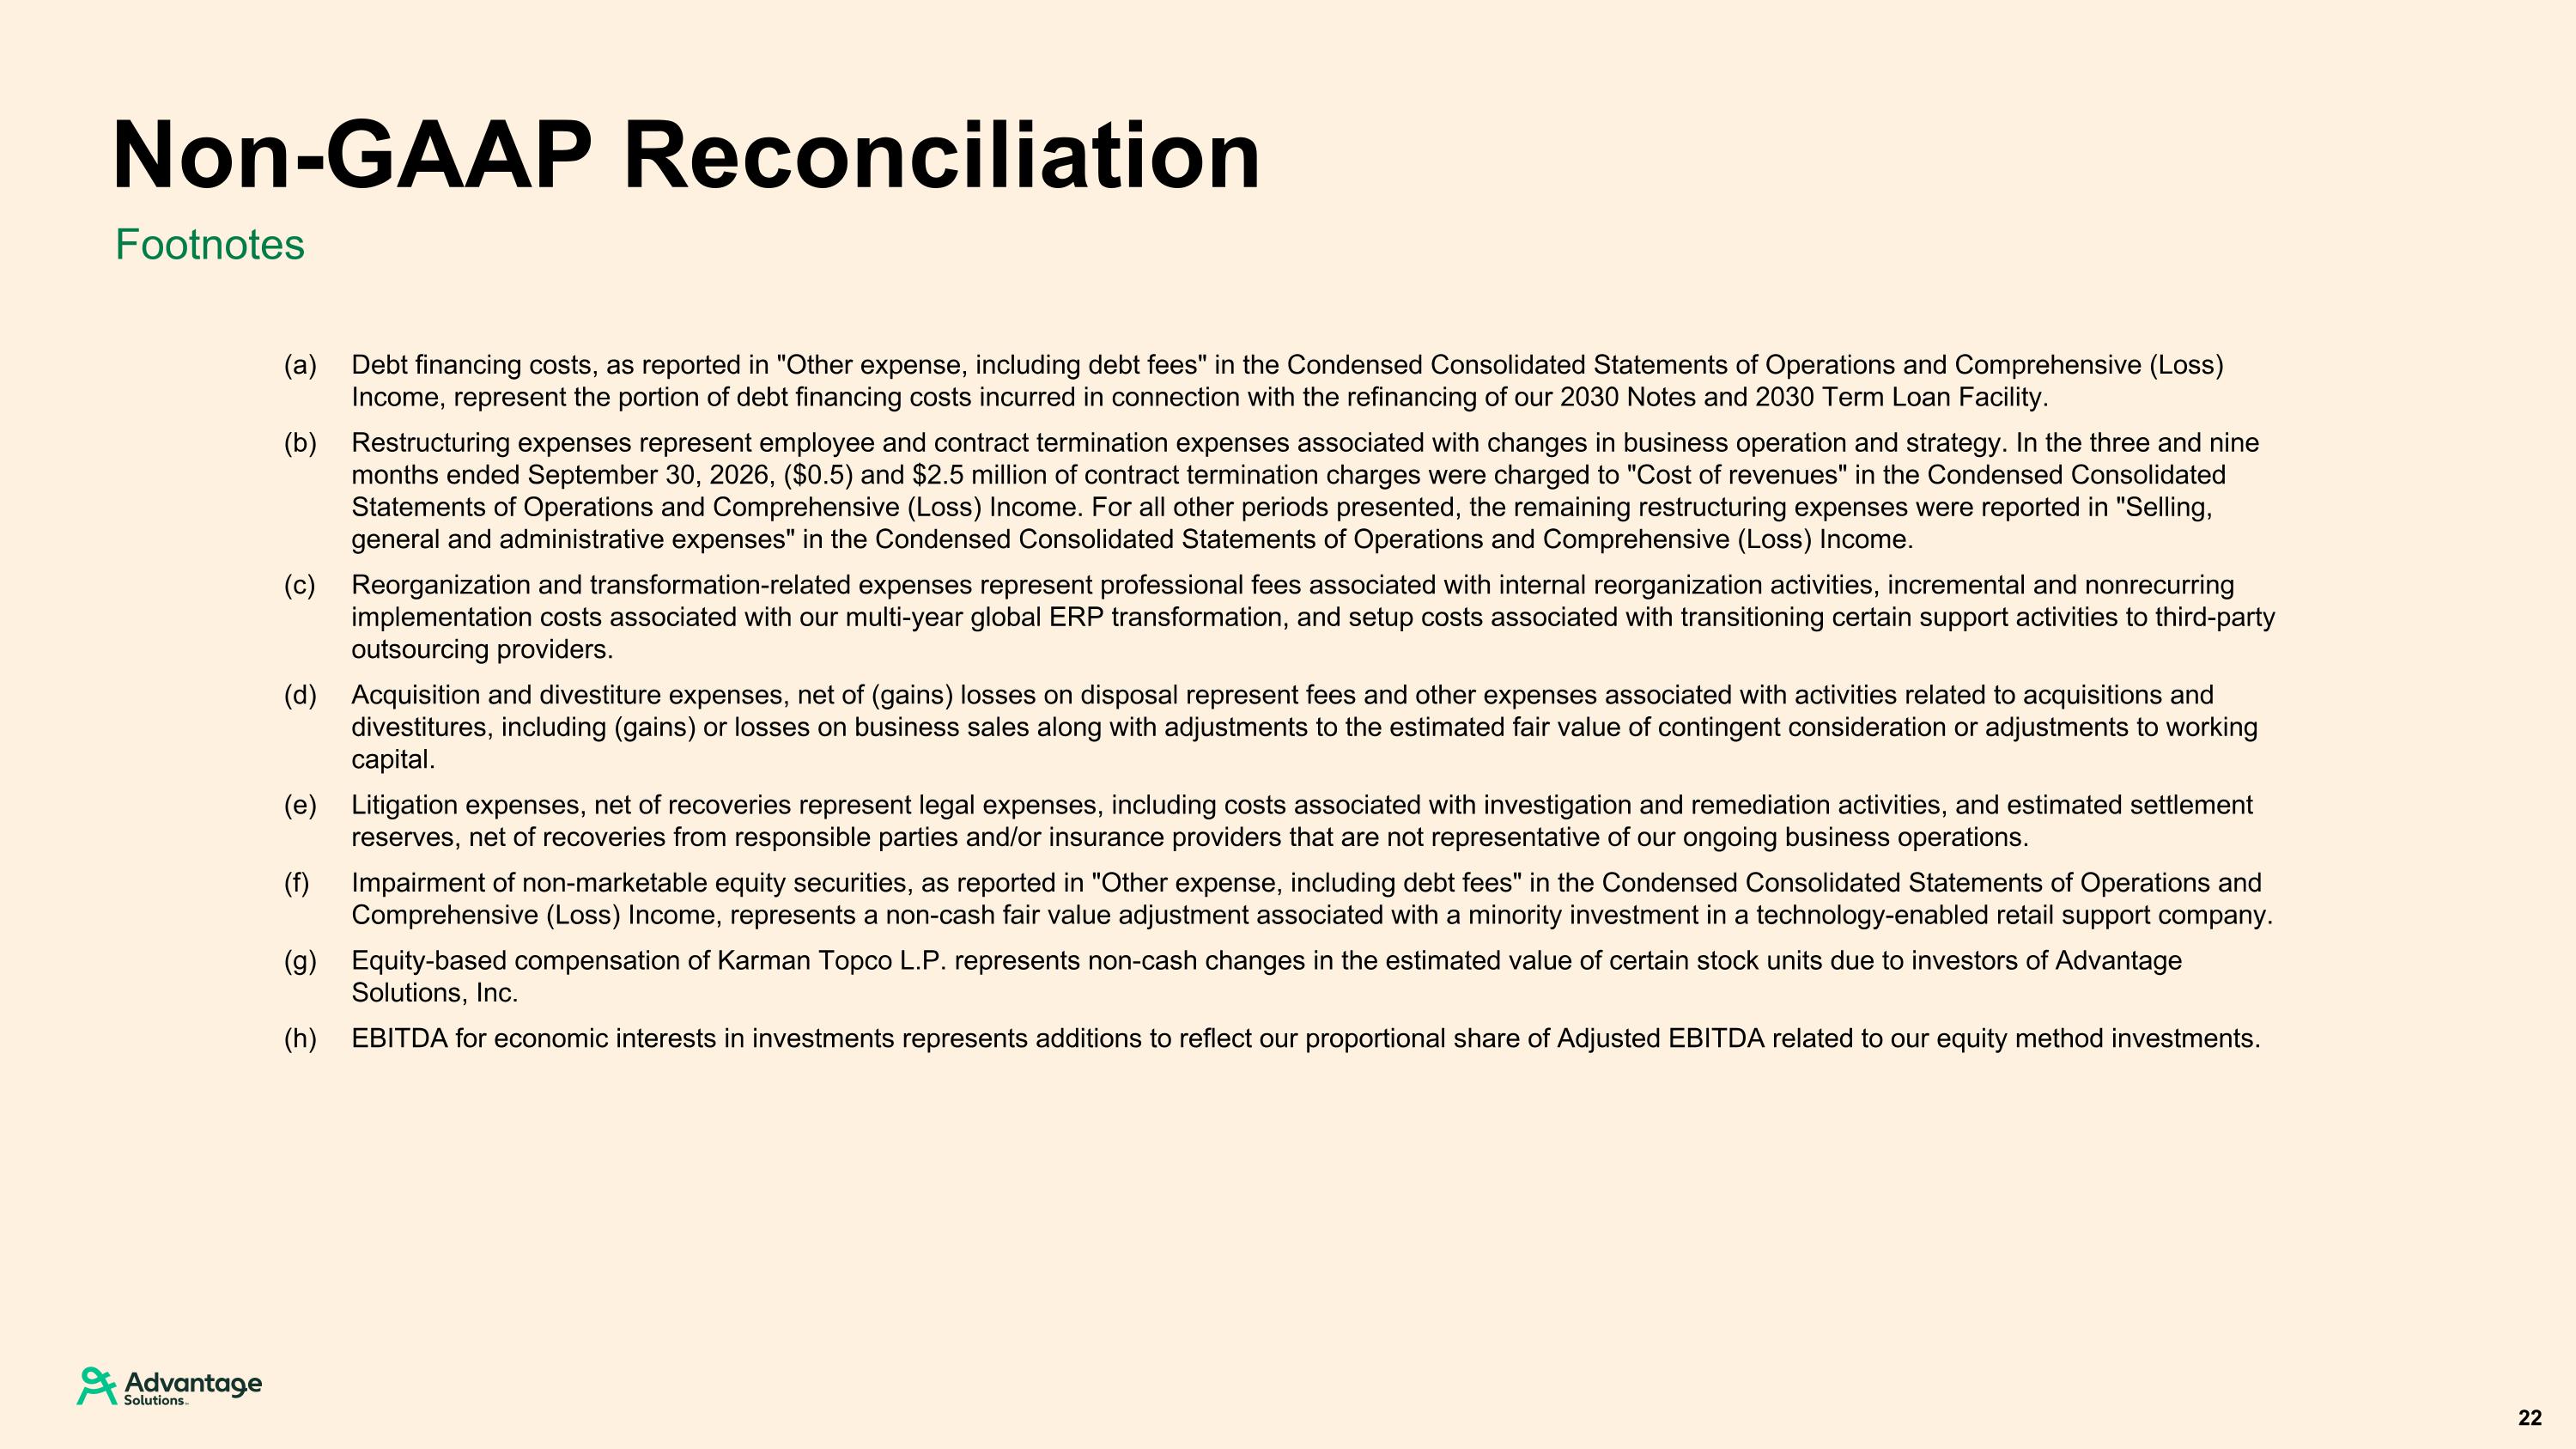
Footnotes Non-GAAP Reconciliation 22 (a) Debt financing costs, as reported in "Other expense, including debt fees" in the Condensed Consolidated Statements of Operations and Comprehensive (Loss) Income, represent the portion of debt financing costs incurred in connection with the refinancing of our 2030 Notes and 2030 Term Loan Facility. (b) Restructuring expenses represent employee and contract termination expenses associated with changes in business operation and strategy. In the three and nine months ended September 30, 2026, ($0.5) and $2.5 million of contract termination charges were charged to "Cost of revenues" in the Condensed Consolidated Statements of Operations and Comprehensive (Loss) Income. For all other periods presented, the remaining restructuring expenses were reported in "Selling, general and administrative expenses" in the Condensed Consolidated Statements of Operations and Comprehensive (Loss) Income. (c) Reorganization and transformation-related expenses represent professional fees associated with internal reorganization activities, incremental and nonrecurring implementation costs associated with our multi-year global ERP transformation, and setup costs associated with transitioning certain support activities to third-party outsourcing providers. (d) Acquisition and divestiture expenses, net of (gains) losses on disposal represent fees and other expenses associated with activities related to acquisitions and divestitures, including (gains) or losses on business sales along with adjustments to the estimated fair value of contingent consideration or adjustments to working capital. (e) Litigation expenses, net of recoveries represent legal expenses, including costs associated with investigation and remediation activities, and estimated settlement reserves, net of recoveries from responsible parties and/or insurance providers that are not representative of our ongoing business operations. (f) Impairment of non-marketable equity securities, as reported in "Other expense, including debt fees" in the Condensed Consolidated Statements of Operations and Comprehensive (Loss) Income, represents a non-cash fair value adjustment associated with a minority investment in a technology-enabled retail support company. (g) Equity-based compensation of Karman Topco L.P. represents non-cash changes in the estimated value of certain stock units due to investors of Advantage Solutions, Inc. (h) EBITDA for economic interests in investments represents additions to reflect our proportional share of Adjusted EBITDA related to our equity method investments.