
Building a Better Helen of Troy November 2026 Exhibit 99.3
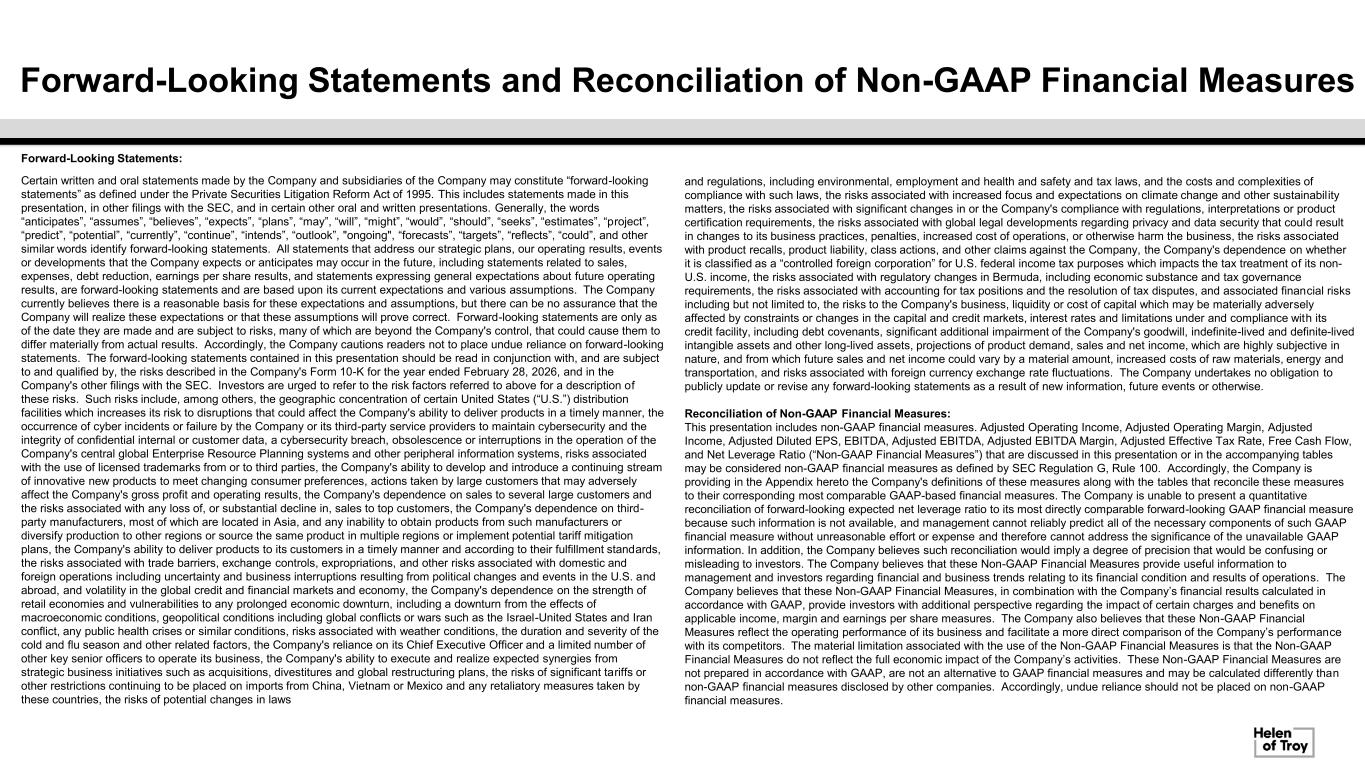
and regulations, including environmental, employment and health and safety and tax laws, and the costs and complexities of compliance with such laws, the risks associated with increased focus and expectations on climate change and other sustainability matters, the risks associated with significant changes in or the Company's compliance with regulations, interpretations or product certification requirements, the risks associated with global legal developments regarding privacy and data security that could result in changes to its business practices, penalties, increased cost of operations, or otherwise harm the business, the risks associated with product recalls, product liability, class actions, and other claims against the Company, the Company's dependence on whether it is classified as a “controlled foreign corporation” for U.S. federal income tax purposes which impacts the tax treatment of its non- U.S. income, the risks associated with regulatory changes in Bermuda, including economic substance and tax governance requirements, the risks associated with accounting for tax positions and the resolution of tax disputes, and associated financial risks including but not limited to, the risks to the Company's business, liquidity or cost of capital which may be materially adversely affected by constraints or changes in the capital and credit markets, interest rates and limitations under and compliance with its credit facility, including debt covenants, significant additional impairment of the Company's goodwill, indefinite-lived and definite-lived intangible assets and other long-lived assets, projections of product demand, sales and net income, which are highly subjective in nature, and from which future sales and net income could vary by a material amount, increased costs of raw materials, energy and transportation, and risks associated with foreign currency exchange rate fluctuations. The Company undertakes no obligation to publicly update or revise any forward-looking statements as a result of new information, future events or otherwise. Reconciliation of Non-GAAP Financial Measures: This presentation includes non-GAAP financial measures. Adjusted Operating Income, Adjusted Operating Margin, Adjusted Income, Adjusted Diluted EPS, EBITDA, Adjusted EBITDA, Adjusted EBITDA Margin, Adjusted Effective Tax Rate, Free Cash Flow, and Net Leverage Ratio (“Non-GAAP Financial Measures”) that are discussed in this presentation or in the accompanying tables may be considered non-GAAP financial measures as defined by SEC Regulation G, Rule 100. Accordingly, the Company is providing in the Appendix hereto the Company's definitions of these measures along with the tables that reconcile these measures to their corresponding most comparable GAAP-based financial measures. The Company is unable to present a quantitative reconciliation of forward-looking expected net leverage ratio to its most directly comparable forward-looking GAAP financial measure because such information is not available, and management cannot reliably predict all of the necessary components of such GAAP financial measure without unreasonable effort or expense and therefore cannot address the significance of the unavailable GAAP information. In addition, the Company believes such reconciliation would imply a degree of precision that would be confusing or misleading to investors. The Company believes that these Non-GAAP Financial Measures provide useful information to management and investors regarding financial and business trends relating to its financial condition and results of operations. The Company believes that these Non-GAAP Financial Measures, in combination with the Company’s financial results calculated in accordance with GAAP, provide investors with additional perspective regarding the impact of certain charges and benefits on applicable income, margin and earnings per share measures. The Company also believes that these Non-GAAP Financial Measures reflect the operating performance of its business and facilitate a more direct comparison of the Company’s performance with its competitors. The material limitation associated with the use of the Non-GAAP Financial Measures is that the Non-GAAP Financial Measures do not reflect the full economic impact of the Company’s activities. These Non-GAAP Financial Measures are not prepared in accordance with GAAP, are not an alternative to GAAP financial measures and may be calculated differently than non-GAAP financial measures disclosed by other companies. Accordingly, undue reliance should not be placed on non-GAAP financial measures. Forward-Looking Statements and Reconciliation of Non-GAAP Financial Measures Forward-Looking Statements: Certain written and oral statements made by the Company and subsidiaries of the Company may constitute “forward-looking statements” as defined under the Private Securities Litigation Reform Act of 1995. This includes statements made in this presentation, in other filings with the SEC, and in certain other oral and written presentations. Generally, the words “anticipates”, “assumes”, “believes”, “expects”, “plans”, “may”, “will”, “might”, “would”, “should”, “seeks”, “estimates”, “project”, “predict”, “potential”, “currently”, “continue”, “intends”, “outlook”, "ongoing", “forecasts”, “targets”, “reflects”, “could”, and other similar words identify forward-looking statements. All statements that address our strategic plans, our operating results, events or developments that the Company expects or anticipates may occur in the future, including statements related to sales, expenses, debt reduction, earnings per share results, and statements expressing general expectations about future operating results, are forward-looking statements and are based upon its current expectations and various assumptions. The Company currently believes there is a reasonable basis for these expectations and assumptions, but there can be no assurance that the Company will realize these expectations or that these assumptions will prove correct. Forward-looking statements are only as of the date they are made and are subject to risks, many of which are beyond the Company's control, that could cause them to differ materially from actual results. Accordingly, the Company cautions readers not to place undue reliance on forward-looking statements. The forward-looking statements contained in this presentation should be read in conjunction with, and are subject to and qualified by, the risks described in the Company's Form 10-K for the year ended February 28, 2026, and in the Company's other filings with the SEC. Investors are urged to refer to the risk factors referred to above for a description of these risks. Such risks include, among others, the geographic concentration of certain United States (“U.S.”) distribution facilities which increases its risk to disruptions that could affect the Company's ability to deliver products in a timely manner, the occurrence of cyber incidents or failure by the Company or its third-party service providers to maintain cybersecurity and the integrity of confidential internal or customer data, a cybersecurity breach, obsolescence or interruptions in the operation of the Company's central global Enterprise Resource Planning systems and other peripheral information systems, risks associated with the use of licensed trademarks from or to third parties, the Company's ability to develop and introduce a continuing stream of innovative new products to meet changing consumer preferences, actions taken by large customers that may adversely affect the Company's gross profit and operating results, the Company's dependence on sales to several large customers and the risks associated with any loss of, or substantial decline in, sales to top customers, the Company's dependence on third- party manufacturers, most of which are located in Asia, and any inability to obtain products from such manufacturers or diversify production to other regions or source the same product in multiple regions or implement potential tariff mitigation plans, the Company's ability to deliver products to its customers in a timely manner and according to their fulfillment standards, the risks associated with trade barriers, exchange controls, expropriations, and other risks associated with domestic and foreign operations including uncertainty and business interruptions resulting from political changes and events in the U.S. and abroad, and volatility in the global credit and financial markets and economy, the Company's dependence on the strength of retail economies and vulnerabilities to any prolonged economic downturn, including a downturn from the effects of macroeconomic conditions, geopolitical conditions including global conflicts or wars such as the Israel-United States and Iran conflict, any public health crises or similar conditions, risks associated with weather conditions, the duration and severity of the cold and flu season and other related factors, the Company's reliance on its Chief Executive Officer and a limited number of other key senior officers to operate its business, the Company's ability to execute and realize expected synergies from strategic business initiatives such as acquisitions, divestitures and global restructuring plans, the risks of significant tariffs or other restrictions continuing to be placed on imports from China, Vietnam or Mexico and any retaliatory measures taken by these countries, the risks of potential changes in laws
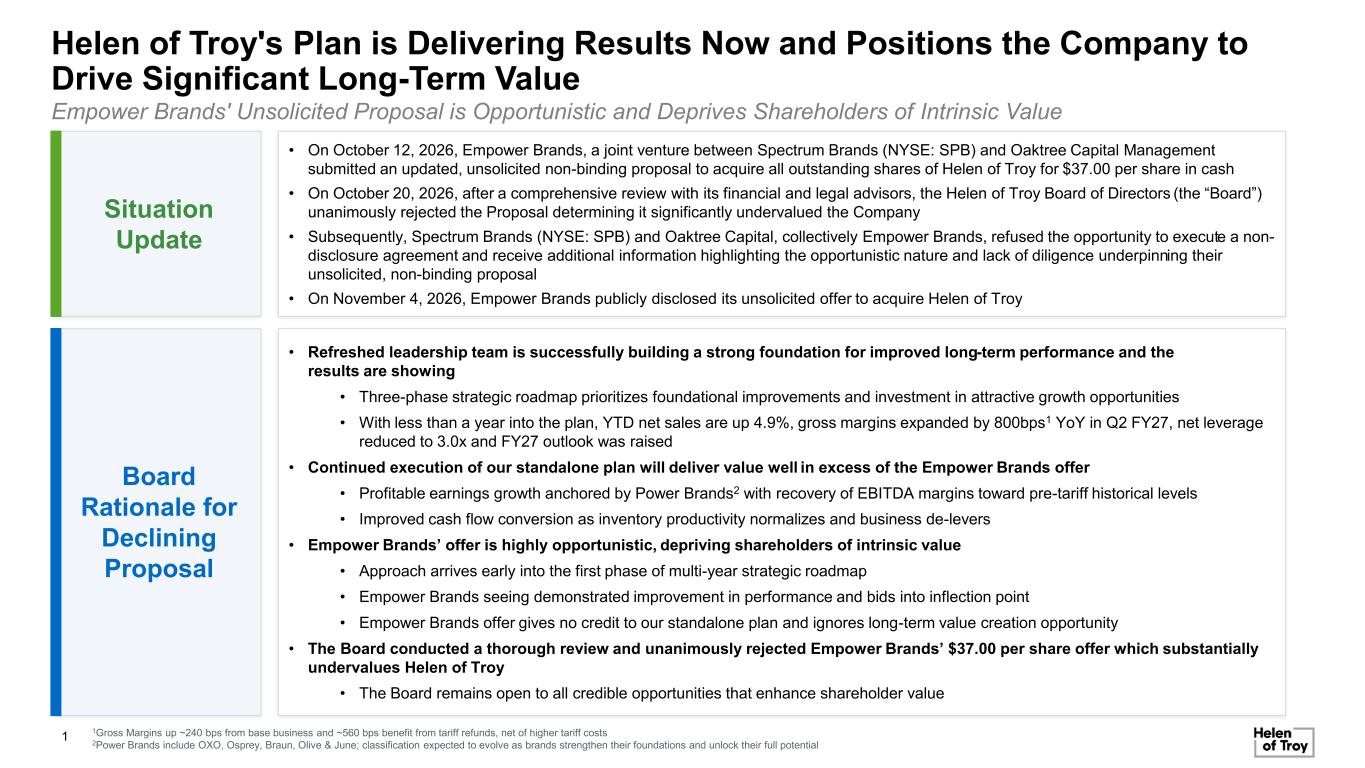
Helen of Troy's Plan is Delivering Results Now and Positions the Company to Drive Significant Long-Term Value Situation Update • On October 12, 2026, Empower Brands, a joint venture between Spectrum Brands (NYSE: SPB) and Oaktree Capital Management submitted an updated, unsolicited non-binding proposal to acquire all outstanding shares of Helen of Troy for $37.00 per share in cash • On October 20, 2026, after a comprehensive review with its financial and legal advisors, the Helen of Troy Board of Directors (the “Board”) unanimously rejected the Proposal determining it significantly undervalued the Company • Subsequently, Spectrum Brands (NYSE: SPB) and Oaktree Capital, collectively Empower Brands, refused the opportunity to execute a non- disclosure agreement and receive additional information highlighting the opportunistic nature and lack of diligence underpinning their unsolicited, non-binding proposal • On November 4, 2026, Empower Brands publicly disclosed its unsolicited offer to acquire Helen of Troy Board Rationale for Declining Proposal • Refreshed leadership team is successfully building a strong foundation for improved long-term performance and the results are showing • Three-phase strategic roadmap prioritizes foundational improvements and investment in attractive growth opportunities • With less than a year into the plan, YTD net sales are up 4.9%, gross margins expanded by 800bps1 YoY in Q2 FY27, net leverage reduced to 3.0x and FY27 outlook was raised • Continued execution of our standalone plan will deliver value well in excess of the Empower Brands offer • Profitable earnings growth anchored by Power Brands2 with recovery of EBITDA margins toward pre-tariff historical levels • Improved cash flow conversion as inventory productivity normalizes and business de-levers • Empower Brands’ offer is highly opportunistic, depriving shareholders of intrinsic value • Approach arrives early into the first phase of multi-year strategic roadmap • Empower Brands seeing demonstrated improvement in performance and bids into inflection point • Empower Brands offer gives no credit to our standalone plan and ignores long-term value creation opportunity • The Board conducted a thorough review and unanimously rejected Empower Brands’ $37.00 per share offer which substantially undervalues Helen of Troy • The Board remains open to all credible opportunities that enhance shareholder value 1Gross Margins up ~240 bps from base business and ~560 bps benefit from tariff refunds, net of higher tariff costs 2Power Brands include OXO, Osprey, Braun, Olive & June; classification expected to evolve as brands strengthen their foundations and unlock their full potential 1 Empower Brands' Unsolicited Proposal is Opportunistic and Deprives Shareholders of Intrinsic Value
A Strong Foundation for Future Growth
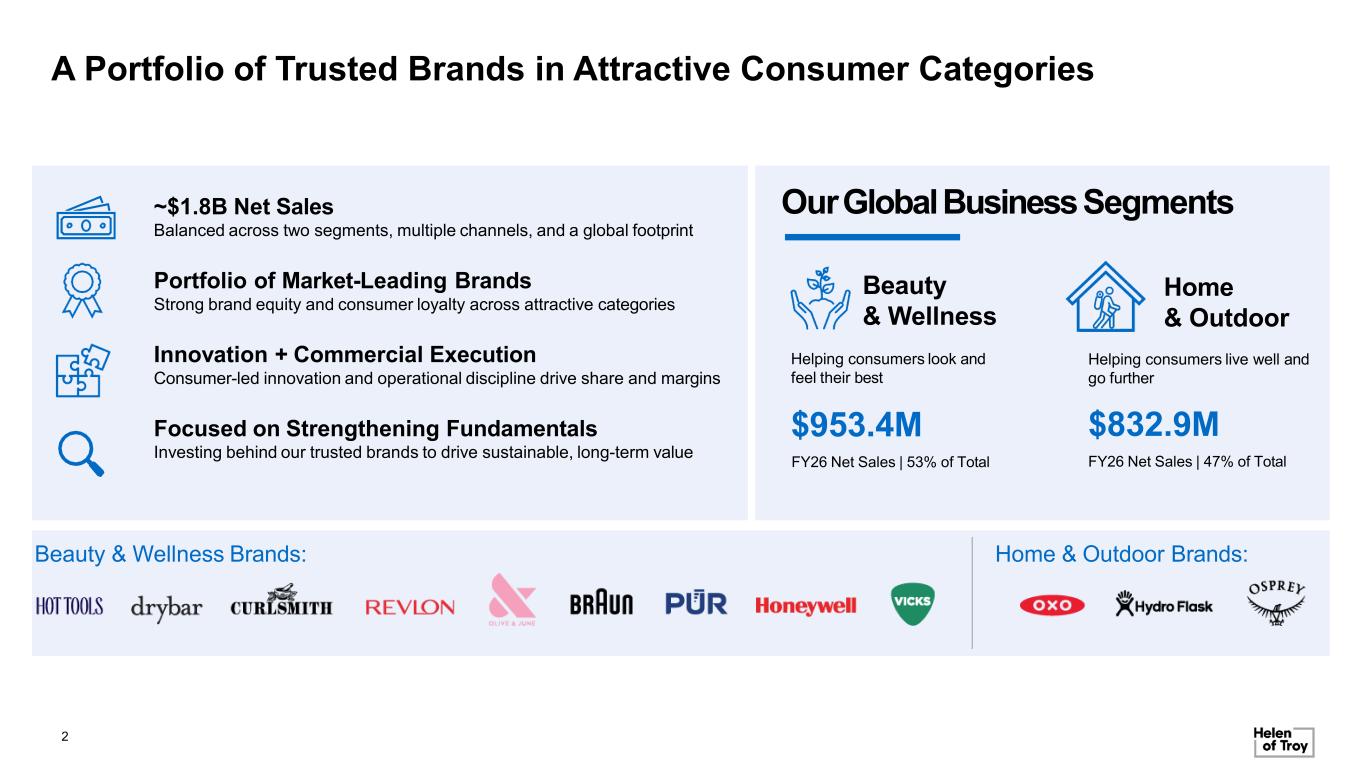
A Portfolio of Trusted Brands in Attractive Consumer Categories ~$1.8B Net Sales Balanced across two segments, multiple channels, and a global footprint Portfolio of Market-Leading Brands Strong brand equity and consumer loyalty across attractive categories Innovation + Commercial Execution Consumer-led innovation and operational discipline drive share and margins Focused on Strengthening Fundamentals Investing behind our trusted brands to drive sustainable, long-term value OurGlobalBusinessSegments Beauty & Wellness Helping consumers look and feel their best Home & Outdoor Helping consumers live well and go further $953.4M FY26 Net Sales | 53% of Total $832.9M FY26 Net Sales | 47% of Total Beauty & Wellness Brands: Home & Outdoor Brands: 2
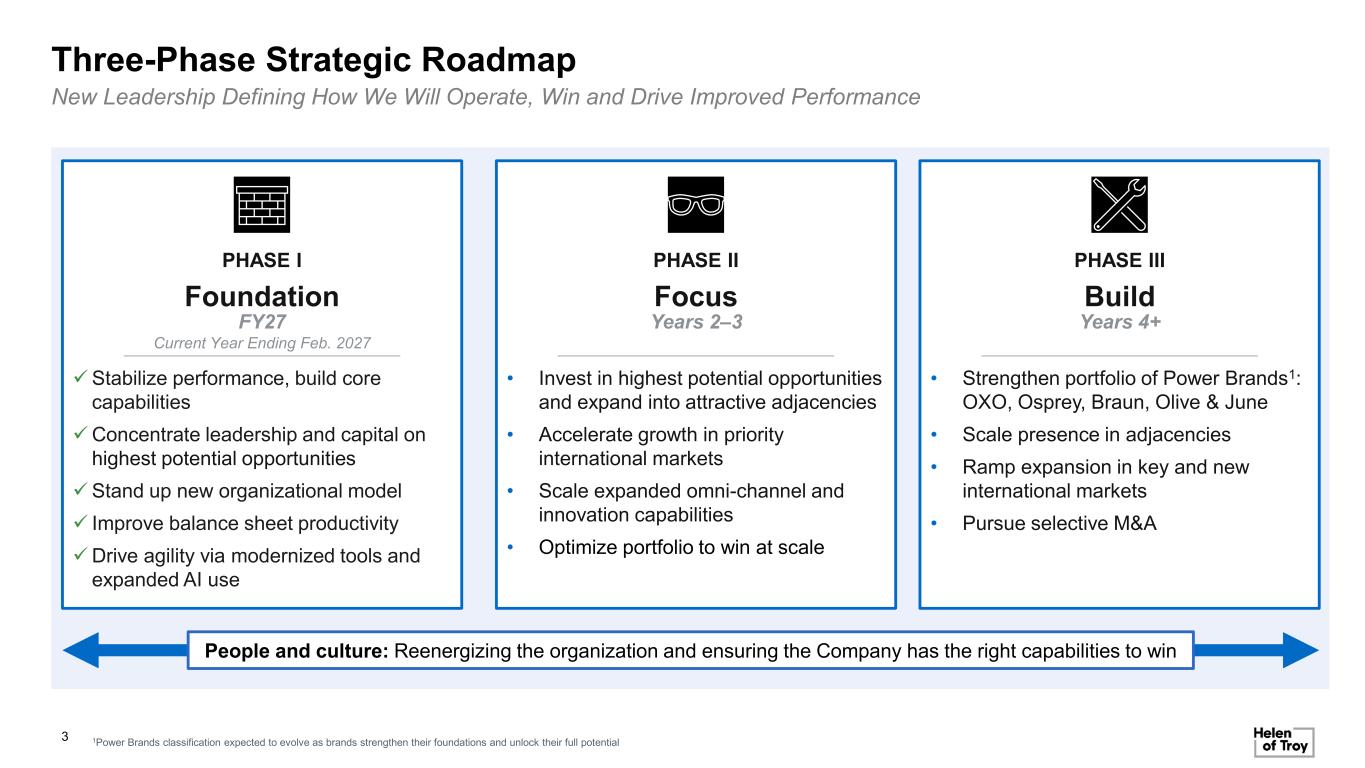
3 PHASE I Foundation FY27 Current Year Ending Feb. 2027 PHASE II Focus Years 2–3 PHASE III Build Years 4+ ✓Stabilize performance, build core capabilities ✓Concentrate leadership and capital on highest potential opportunities ✓Stand up new organizational model ✓ Improve balance sheet productivity ✓Drive agility via modernized tools and expanded AI use • Invest in highest potential opportunities and expand into attractive adjacencies • Accelerate growth in priority international markets • Scale expanded omni-channel and innovation capabilities • Optimize portfolio to win at scale • Strengthen portfolio of Power Brands1: OXO, Osprey, Braun, Olive & June • Scale presence in adjacencies • Ramp expansion in key and new international markets • Pursue selective M&A New Leadership Defining How We Will Operate, Win and Drive Improved Performance Three-Phase Strategic Roadmap 1Power Brands classification expected to evolve as brands strengthen their foundations and unlock their full potential People and culture: Reenergizing the organization and ensuring the Company has the right capabilities to win
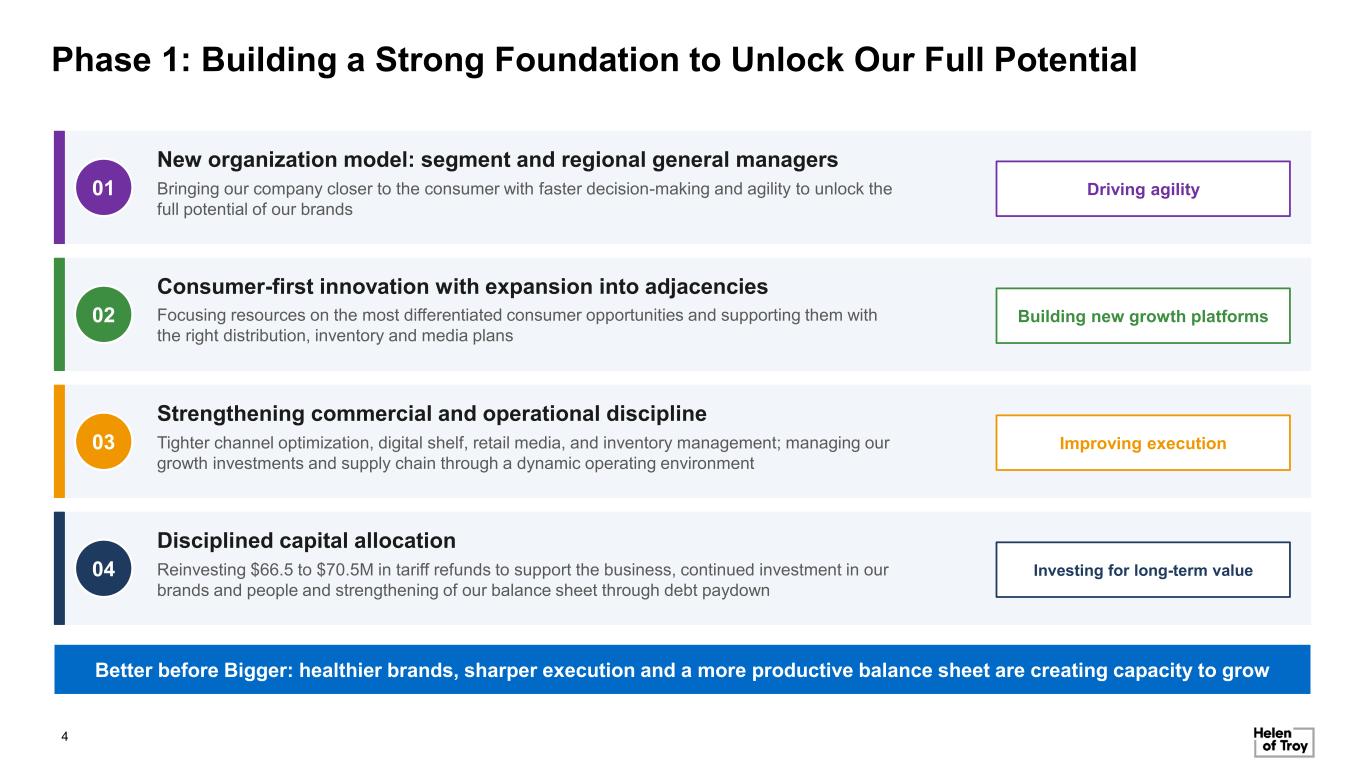
4 Phase 1: Building a Strong Foundation to Unlock Our Full Potential 01 New organization model: segment and regional general managers Bringing our company closer to the consumer with faster decision-making and agility to unlock the full potential of our brands Driving agility 02 Consumer-first innovation with expansion into adjacencies Focusing resources on the most differentiated consumer opportunities and supporting them with the right distribution, inventory and media plans Building new growth platforms 03 Strengthening commercial and operational discipline Tighter channel optimization, digital shelf, retail media, and inventory management; managing our growth investments and supply chain through a dynamic operating environment Improving execution 04 Disciplined capital allocation Reinvesting $66.5 to $70.5M in tariff refunds to support the business, continued investment in our brands and people and strengthening of our balance sheet through debt paydown Investing for long-term value Better before Bigger: healthier brands, sharper execution and a more productive balance sheet are creating capacity to grow
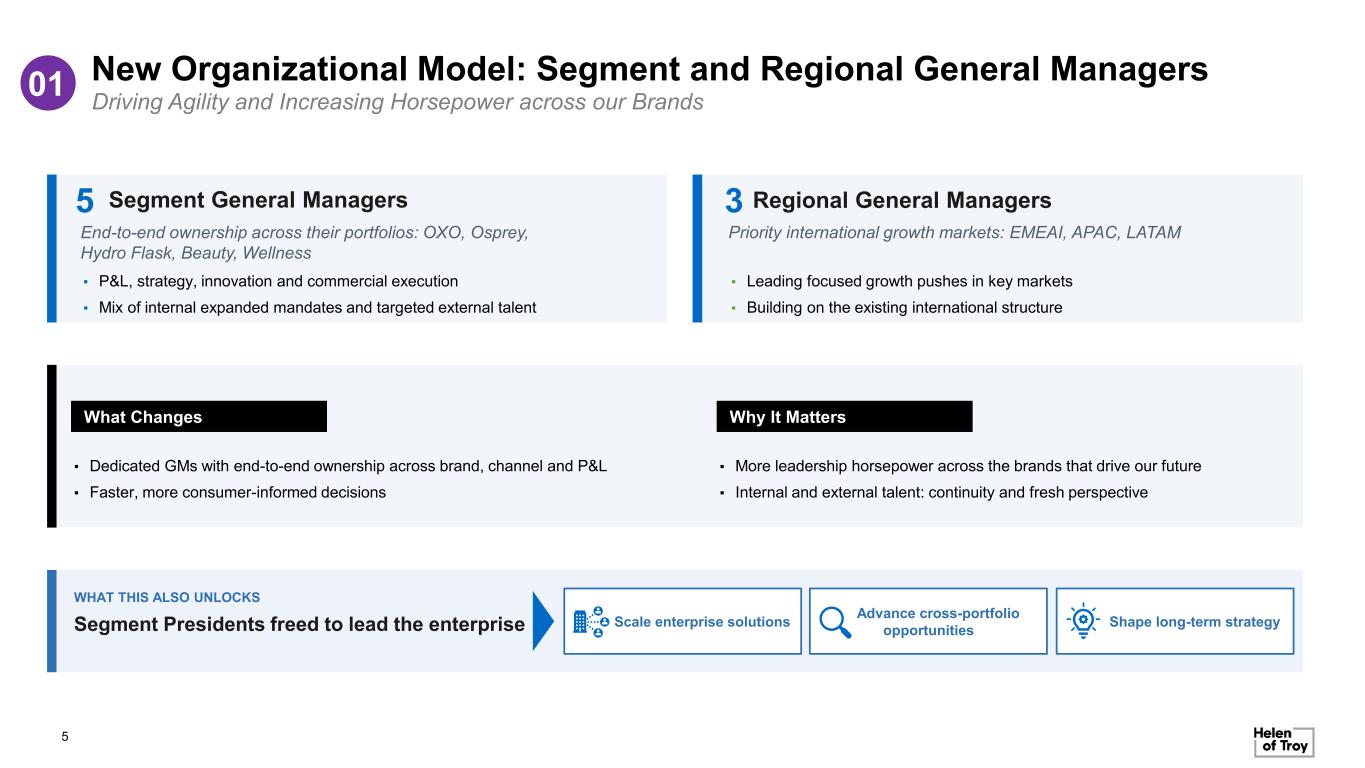
New Organizational Model: Segment and Regional General Managers 5 01 Driving Agility and Increasing Horsepower across our Brands What Changes ▪ Dedicated GMs with end-to-end ownership across brand, channel and P&L ▪ Faster, more consumer-informed decisions Why It Matters ▪ More leadership horsepower across the brands that drive our future ▪ Internal and external talent: continuity and fresh perspective Segment General Managers End-to-end ownership across their portfolios: OXO, Osprey, Hydro Flask, Beauty, Wellness ▪ P&L, strategy, innovation and commercial execution ▪ Mix of internal expanded mandates and targeted external talent Regional General Managers Priority international growth markets: EMEAI, APAC, LATAM ▪ Leading focused growth pushes in key markets ▪ Building on the existing international structure 5 3 WHAT THIS ALSO UNLOCKS Segment Presidents freed to lead the enterprise Scale enterprise solutions Advance cross-portfolio opportunities Shape long-term strategy
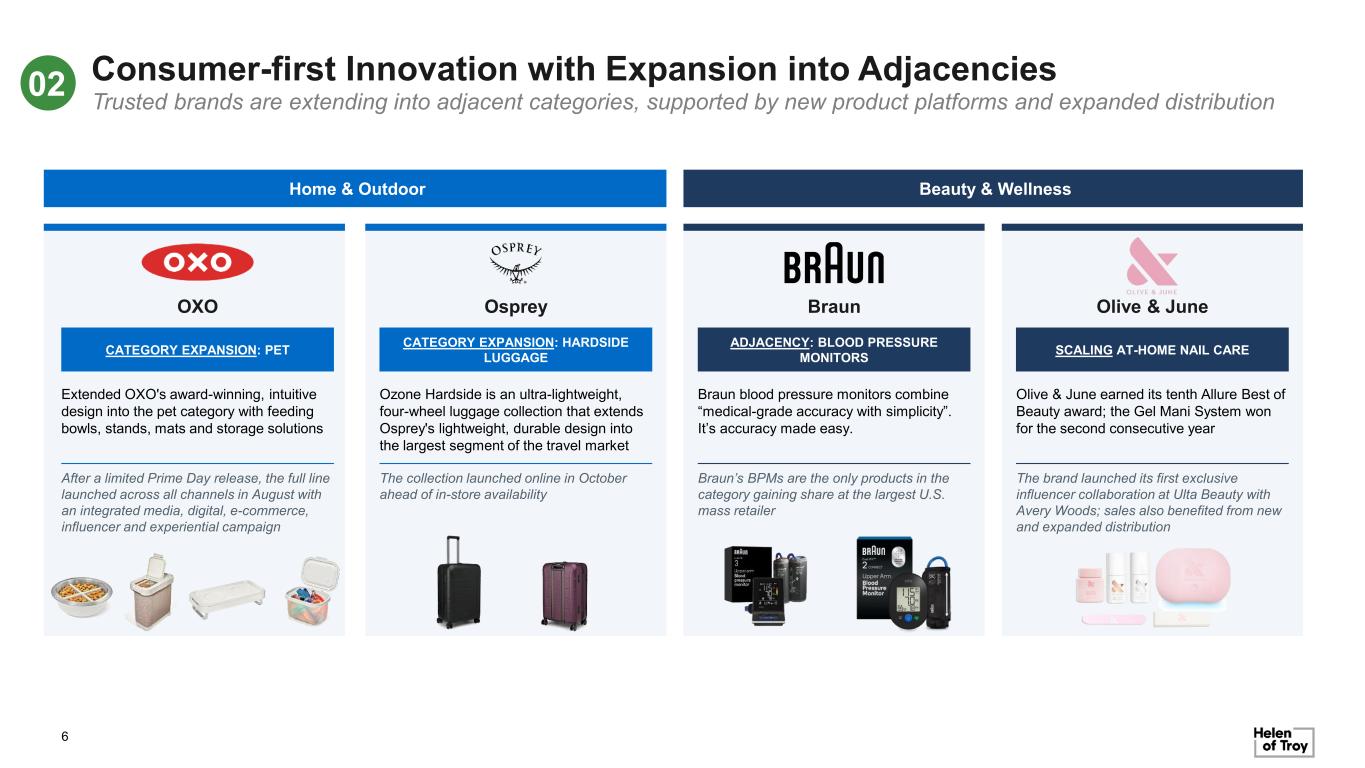
6 02 Home & Outdoor Beauty & Wellness OXO CATEGORY EXPANSION: PET Extended OXO's award-winning, intuitive design into the pet category with feeding bowls, stands, mats and storage solutions After a limited Prime Day release, the full line launched across all channels in August with an integrated media, digital, e-commerce, influencer and experiential campaign Osprey CATEGORY EXPANSION: HARDSIDE LUGGAGE Ozone Hardside is an ultra-lightweight, four-wheel luggage collection that extends Osprey's lightweight, durable design into the largest segment of the travel market The collection launched online in October ahead of in-store availability Braun ADJACENCY: BLOOD PRESSURE MONITORS Braun blood pressure monitors combine “medical-grade accuracy with simplicity”. It’s accuracy made easy. Braun’s BPMs are the only products in the category gaining share at the largest U.S. mass retailer Olive & June SCALING AT-HOME NAIL CARE Olive & June earned its tenth Allure Best of Beauty award; the Gel Mani System won for the second consecutive year The brand launched its first exclusive influencer collaboration at Ulta Beauty with Avery Woods; sales also benefited from new and expanded distribution Consumer-first Innovation with Expansion into Adjacencies Trusted brands are extending into adjacent categories, supported by new product platforms and expanded distribution
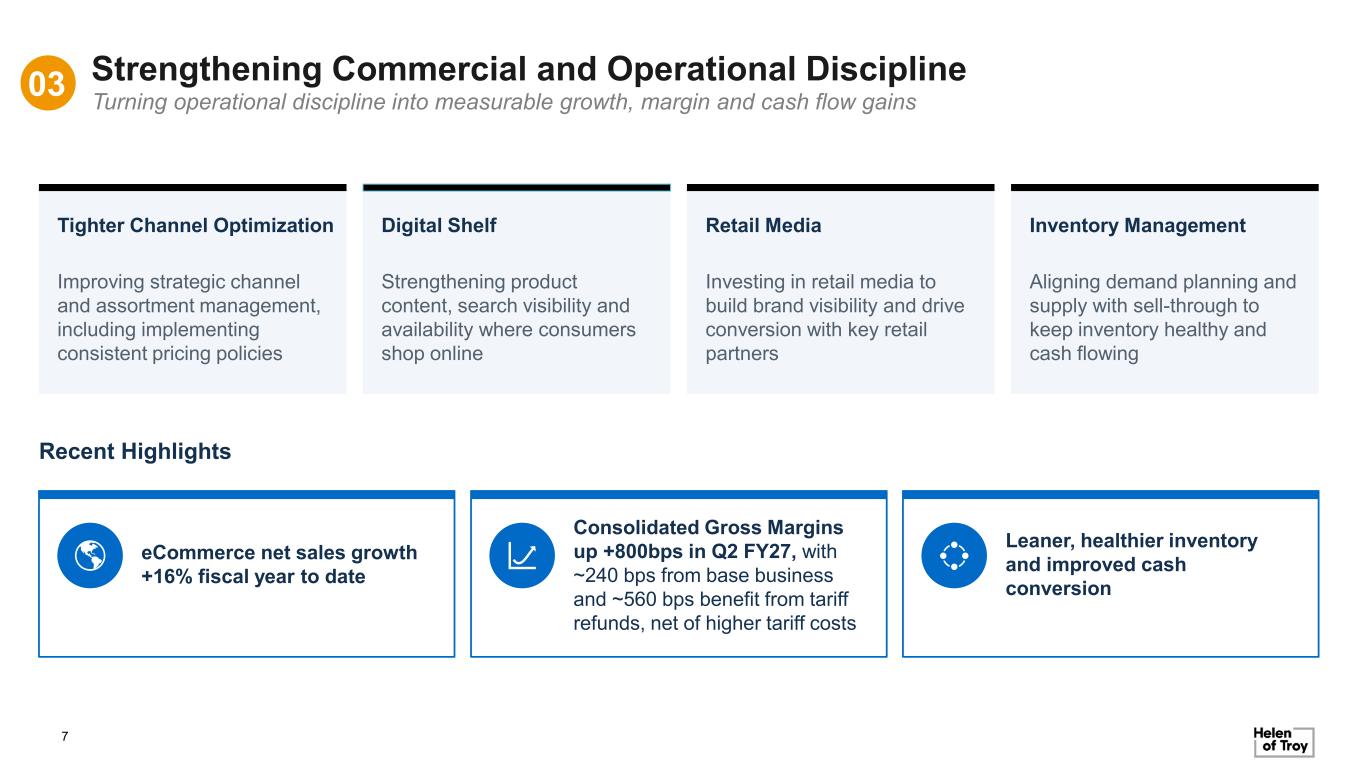
7 Retail Media Investing in retail media to build brand visibility and drive conversion with key retail partners Digital ShelfTighter Channel Optimization Strengthening product content, search visibility and availability where consumers shop online Improving strategic channel and assortment management, including implementing consistent pricing policies Inventory Management Aligning demand planning and supply with sell-through to keep inventory healthy and cash flowing Leaner, healthier inventory and improved cash conversion Consolidated Gross Margins up +800bps in Q2 FY27, with ~240 bps from base business and ~560 bps benefit from tariff refunds, net of higher tariff costs eCommerce net sales growth +16% fiscal year to date 03 Strengthening Commercial and Operational Discipline Turning operational discipline into measurable growth, margin and cash flow gains Recent Highlights
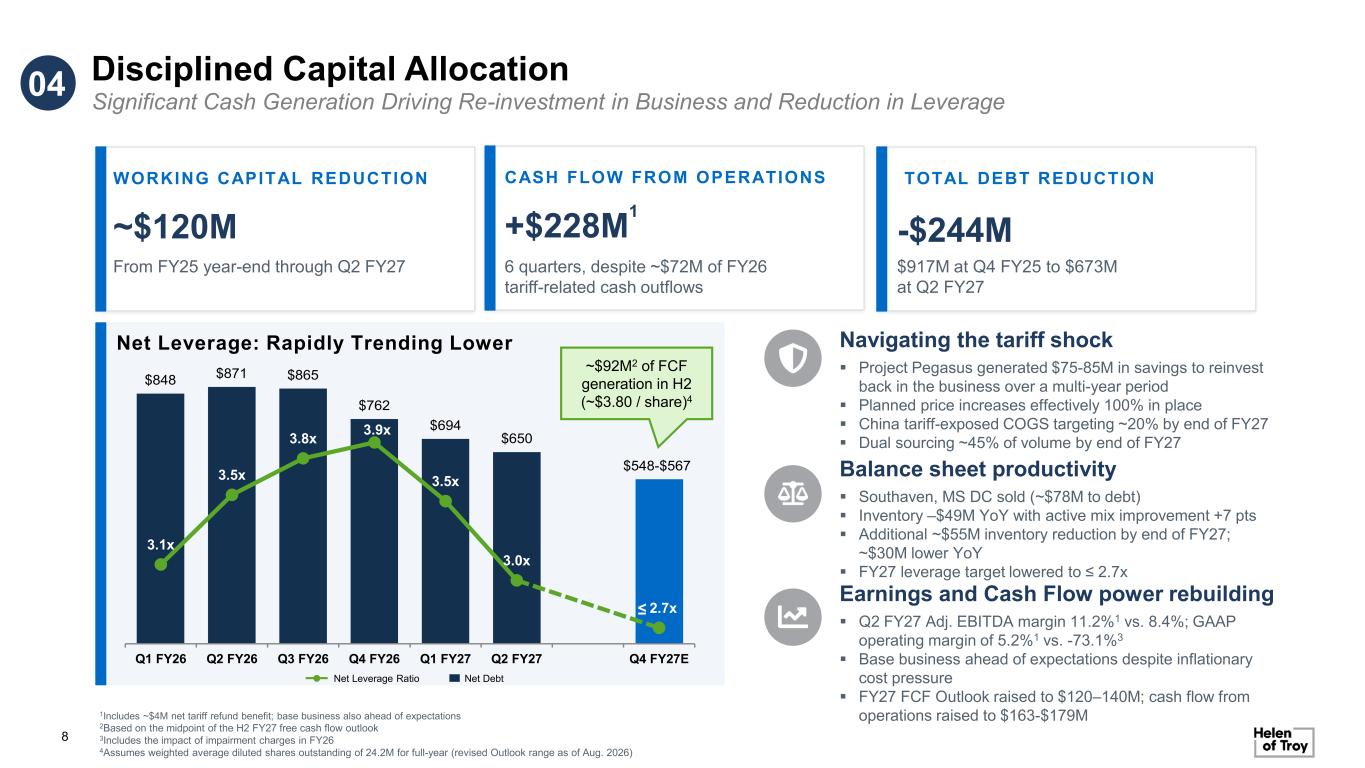
$848 $871 $865 $762 $694 $650 $548-$567 Disciplined Capital Allocation 8 Significant Cash Generation Driving Re-investment in Business and Reduction in Leverage Net Leverage: Rapidly Trending Lower 3.1x 3.5x 3.8x 3.9x 3.5x 3.0x 2.7x Q1 FY26 Q2 FY26 Q3 FY26 Q4 FY26 Q1 FY27 Q2 FY27 Q4 FY27E ≤ Navigating the tariff shock ▪ Project Pegasus generated $75-85M in savings to reinvest back in the business over a multi-year period ▪ Planned price increases effectively 100% in place ▪ China tariff-exposed COGS targeting ~20% by end of FY27 ▪ Dual sourcing ~45% of volume by end of FY27 Balance sheet productivity ▪ Southaven, MS DC sold (~$78M to debt) ▪ Inventory –$49M YoY with active mix improvement +7 pts ▪ Additional ~$55M inventory reduction by end of FY27; ~$30M lower YoY ▪ FY27 leverage target lowered to ≤ 2.7x Earnings and Cash Flow power rebuilding ▪ Q2 FY27 Adj. EBITDA margin 11.2%1 vs. 8.4%; GAAP operating margin of 5.2%1 vs. -73.1%3 ▪ Base business ahead of expectations despite inflationary cost pressure ▪ FY27 FCF Outlook raised to $120–140M; cash flow from operations raised to $163-$179M TOTAL DEBT REDUCTIONWORKING CAPITAL REDUCTION ~$120M From FY25 year-end through Q2 FY27 CASH FLOW FROM OPERATIONS +$228M 1 6 quarters, despite ~$72M of FY26 tariff-related cash outflows 04 1Includes ~$4M net tariff refund benefit; base business also ahead of expectations 2Based on the midpoint of the H2 FY27 free cash flow outlook 3Includes the impact of impairment charges in FY26 4Assumes weighted average diluted shares outstanding of 24.2M for full-year (revised Outlook range as of Aug. 2026) ~$92M2 of FCF generation in H2 (~$3.80 / share)4 Net Leverage Ratio Net Debt -$244M $917M at Q4 FY25 to $673M at Q2 FY27
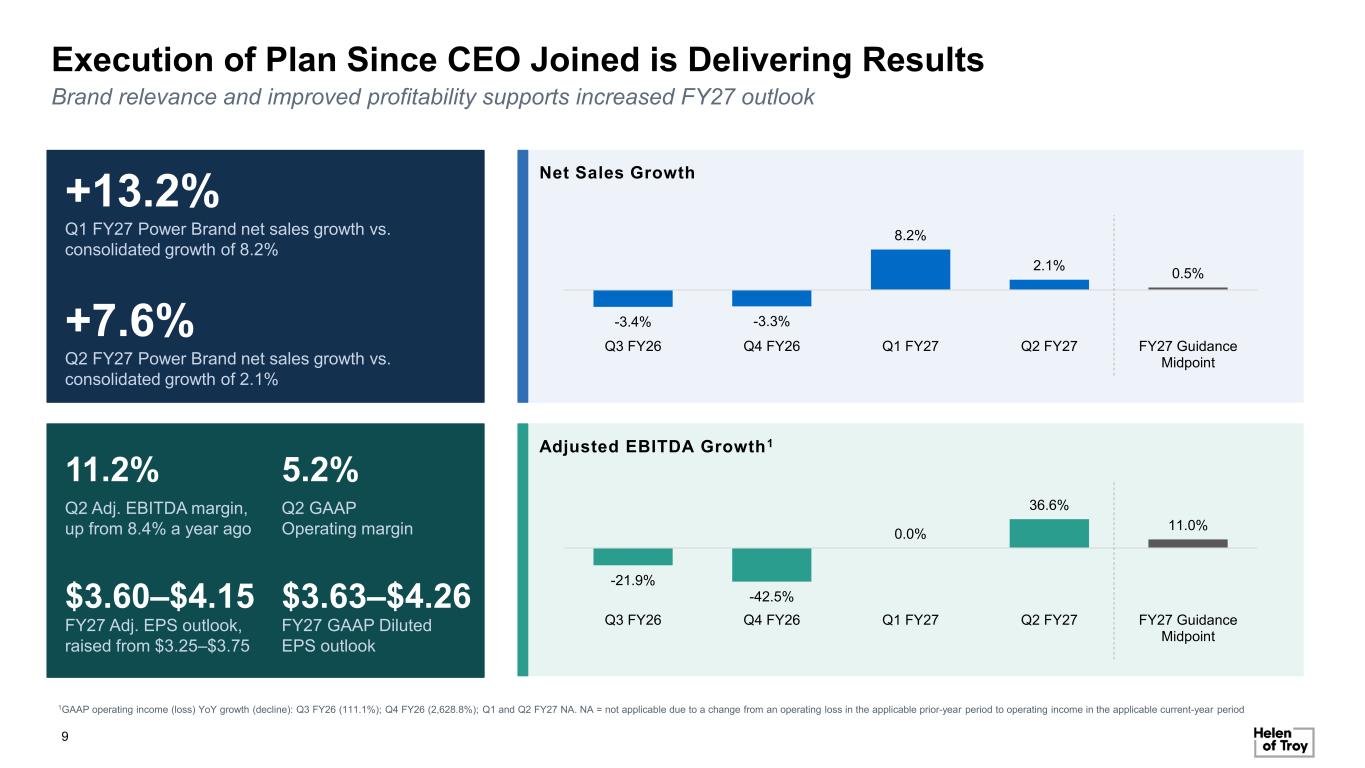
9 Execution of Plan Since CEO Joined is Delivering Results Brand relevance and improved profitability supports increased FY27 outlook +13.2% Q1 FY27 Power Brand net sales growth vs. consolidated growth of 8.2% +7.6% Q2 FY27 Power Brand net sales growth vs. consolidated growth of 2.1% 11.2% Q2 Adj. EBITDA margin, up from 8.4% a year ago $3.60–$4.15 FY27 Adj. EPS outlook, raised from $3.25–$3.75 0.5% 2.1% 8.2% -3.3%-3.4% FY27 Guidance Midpoint Q2 FY27Q1 FY27Q4 FY26Q3 FY26 11.0% 36.6% 0.0% -42.5% -21.9% FY27 Guidance Midpoint Q2 FY27Q1 FY27Q4 FY26Q3 FY26 Net Sales Growth Adjusted EBITDA Growth1 5.2% Q2 GAAP Operating margin $3.63–$4.26 FY27 GAAP Diluted EPS outlook 1GAAP operating income (loss) YoY growth (decline): Q3 FY26 (111.1%); Q4 FY26 (2,628.8%); Q1 and Q2 FY27 NA. NA = not applicable due to a change from an operating loss in the applicable prior-year period to operating income in the applicable current-year period
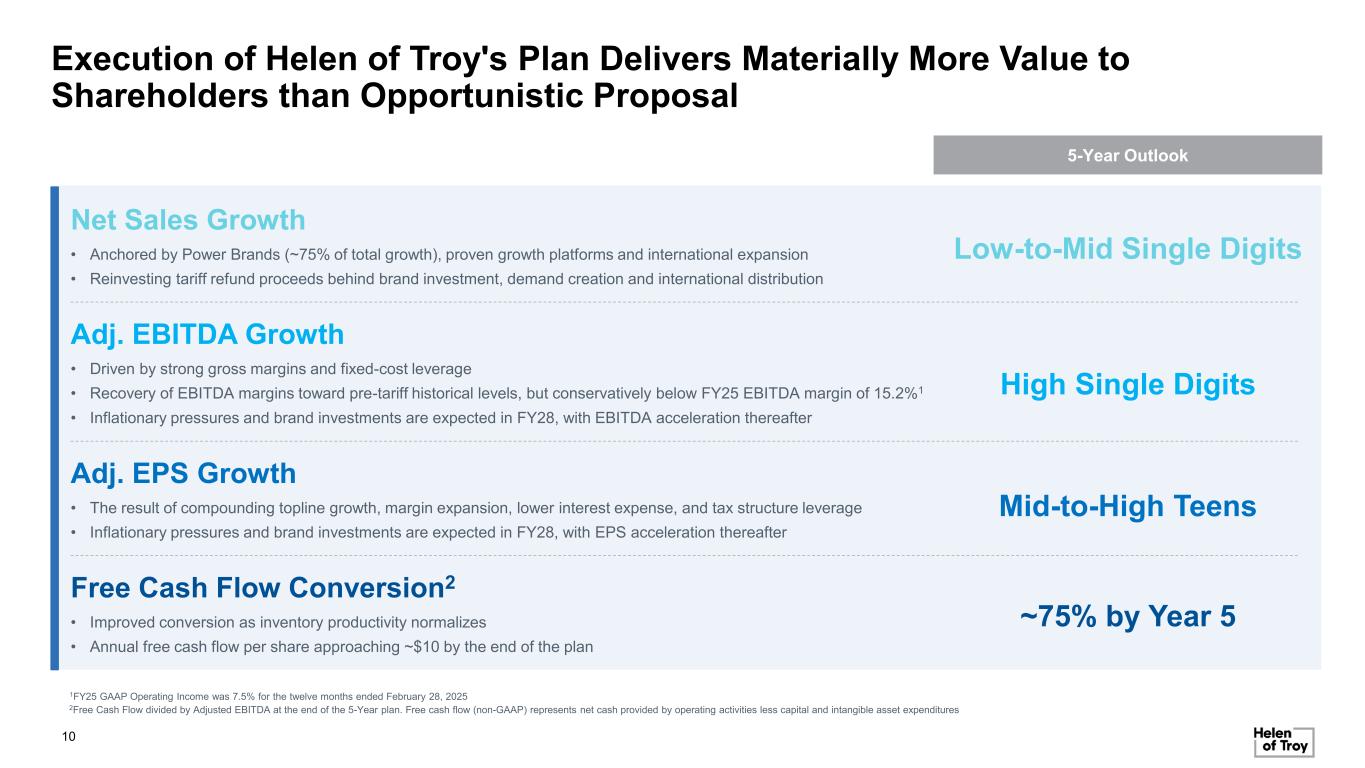
10 Net Sales Growth • Anchored by Power Brands (~75% of total growth), proven growth platforms and international expansion • Reinvesting tariff refund proceeds behind brand investment, demand creation and international distribution Low-to-Mid Single Digits Adj. EBITDA Growth • Driven by strong gross margins and fixed-cost leverage • Recovery of EBITDA margins toward pre-tariff historical levels, but conservatively below FY25 EBITDA margin of 15.2%1 • Inflationary pressures and brand investments are expected in FY28, with EBITDA acceleration thereafter High Single Digits Adj. EPS Growth • The result of compounding topline growth, margin expansion, lower interest expense, and tax structure leverage • Inflationary pressures and brand investments are expected in FY28, with EPS acceleration thereafter Mid-to-High Teens Free Cash Flow Conversion2 • Improved conversion as inventory productivity normalizes • Annual free cash flow per share approaching ~$10 by the end of the plan ~75% by Year 5 Execution of Helen of Troy's Plan Delivers Materially More Value to Shareholders than Opportunistic Proposal 5-Year Outlook 2Free Cash Flow divided by Adjusted EBITDA at the end of the 5-Year plan. Free cash flow (non-GAAP) represents net cash provided by operating activities less capital and intangible asset expenditures 1FY25 GAAP Operating Income was 7.5% for the twelve months ended February 28, 2025
Empower Brands' Unsolicited Proposal Meaningfully Undervalues Helen of Troy and its Strategic Plan
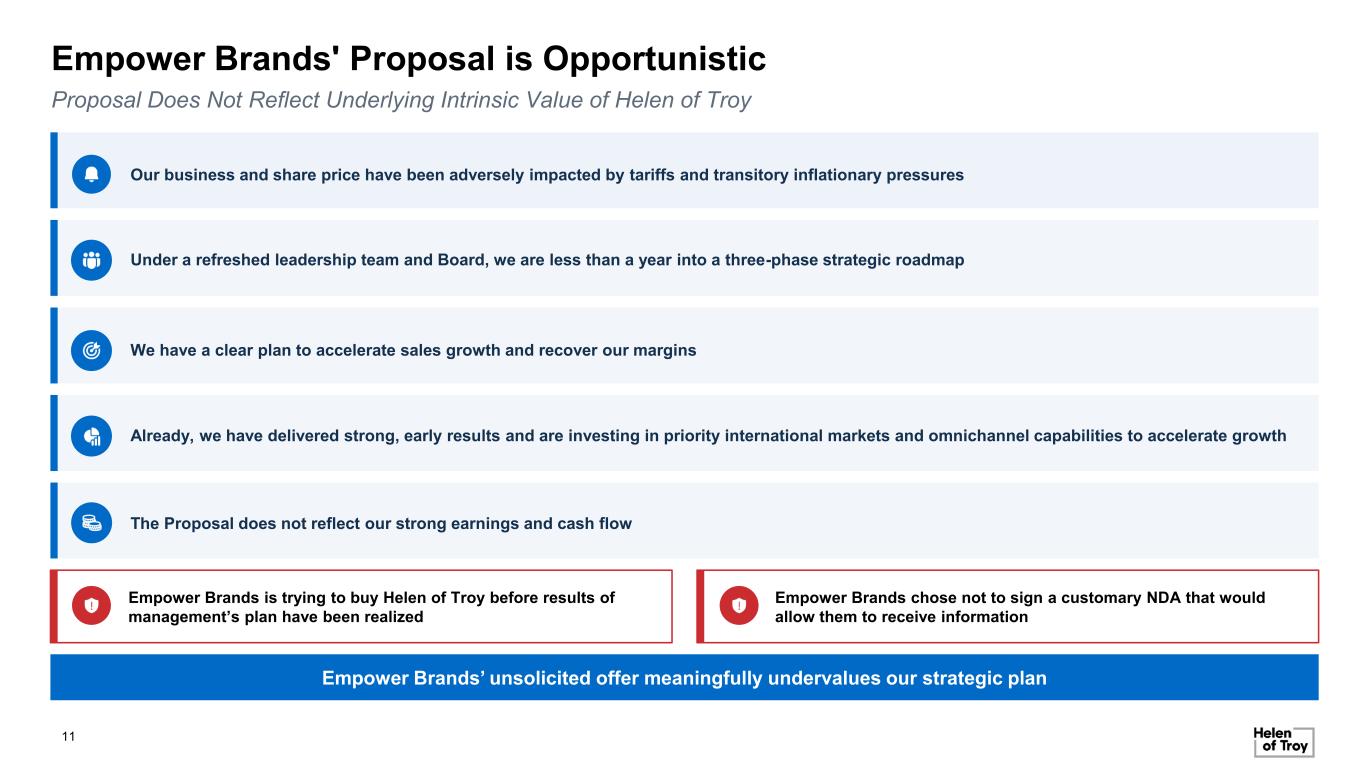
11 Empower Brands' Proposal is Opportunistic Proposal Does Not Reflect Underlying Intrinsic Value of Helen of Troy Empower Brands is trying to buy Helen of Troy before results of management’s plan have been realized Empower Brands chose not to sign a customary NDA that would allow them to receive information Empower Brands’ unsolicited offer meaningfully undervalues our strategic plan We have a clear plan to accelerate sales growth and recover our margins Already, we have delivered strong, early results and are investing in priority international markets and omnichannel capabilities to accelerate growth Our business and share price have been adversely impacted by tariffs and transitory inflationary pressures Under a refreshed leadership team and Board, we are less than a year into a three-phase strategic roadmap The Proposal does not reflect our strong earnings and cash flow
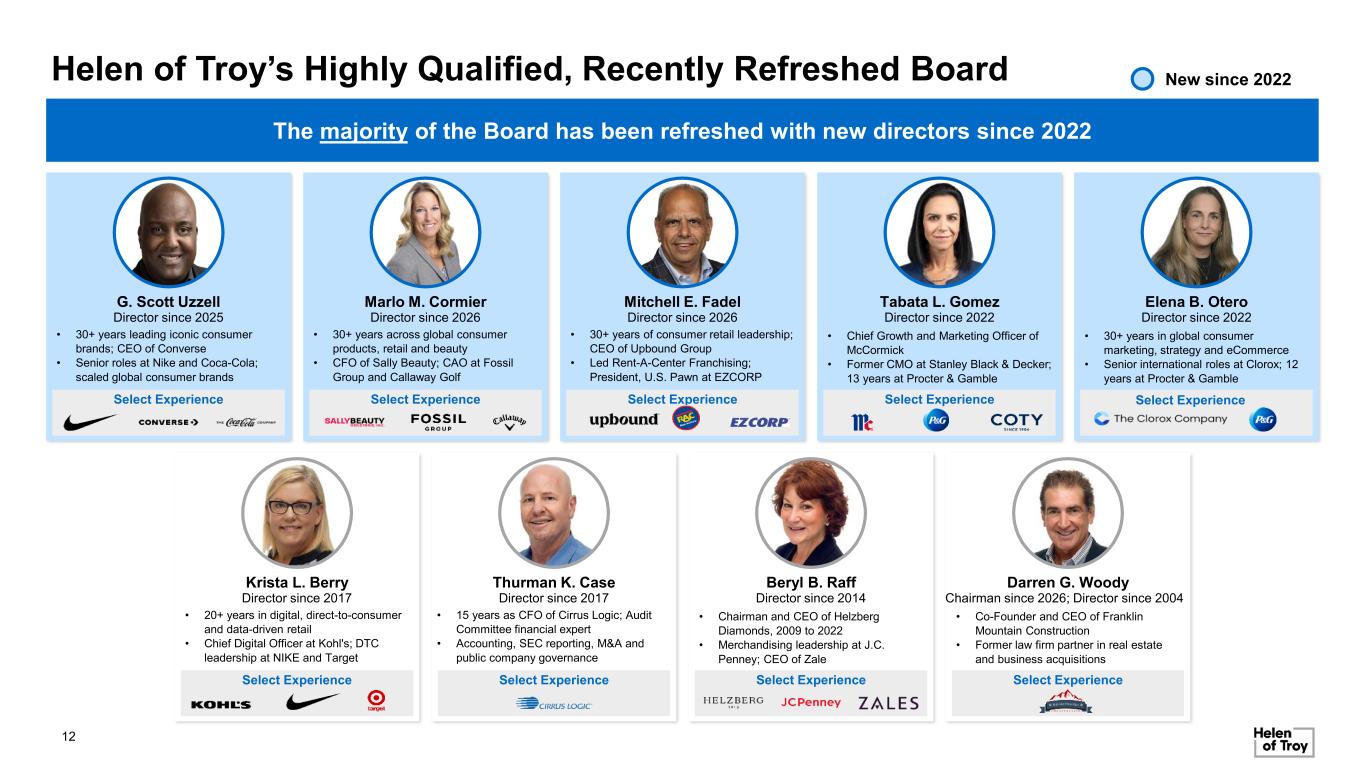
12 G. Scott Uzzell Director since 2025 • 30+ years leading iconic consumer brands; CEO of Converse • Senior roles at Nike and Coca-Cola; scaled global consumer brands Select Experience Krista L. Berry Director since 2017 • 20+ years in digital, direct-to-consumer and data-driven retail • Chief Digital Officer at Kohl's; DTC leadership at NIKE and Target Select Experience Thurman K. Case Director since 2017 • 15 years as CFO of Cirrus Logic; Audit Committee financial expert • Accounting, SEC reporting, M&A and public company governance Select Experience Marlo M. Cormier Director since 2026 • 30+ years across global consumer products, retail and beauty • CFO of Sally Beauty; CAO at Fossil Group and Callaway Golf Select Experience Tabata L. Gomez Director since 2022 • Chief Growth and Marketing Officer of McCormick • Former CMO at Stanley Black & Decker; 13 years at Procter & Gamble Select Experience Beryl B. Raff Director since 2014 • Chairman and CEO of Helzberg Diamonds, 2009 to 2022 • Merchandising leadership at J.C. Penney; CEO of Zale Select Experience Darren G. Woody Chairman since 2026; Director since 2004 • Co-Founder and CEO of Franklin Mountain Construction • Former law firm partner in real estate and business acquisitions Select Experience Mitchell E. Fadel Director since 2026 • 30+ years of consumer retail leadership; CEO of Upbound Group • Led Rent-A-Center Franchising; President, U.S. Pawn at EZCORP Select Experience Helen of Troy’s Highly Qualified, Recently Refreshed Board Elena B. Otero Director since 2022 • 30+ years in global consumer marketing, strategy and eCommerce • Senior international roles at Clorox; 12 years at Procter & Gamble Select Experience New since 2022 The majority of the Board has been refreshed with new directors since 2022
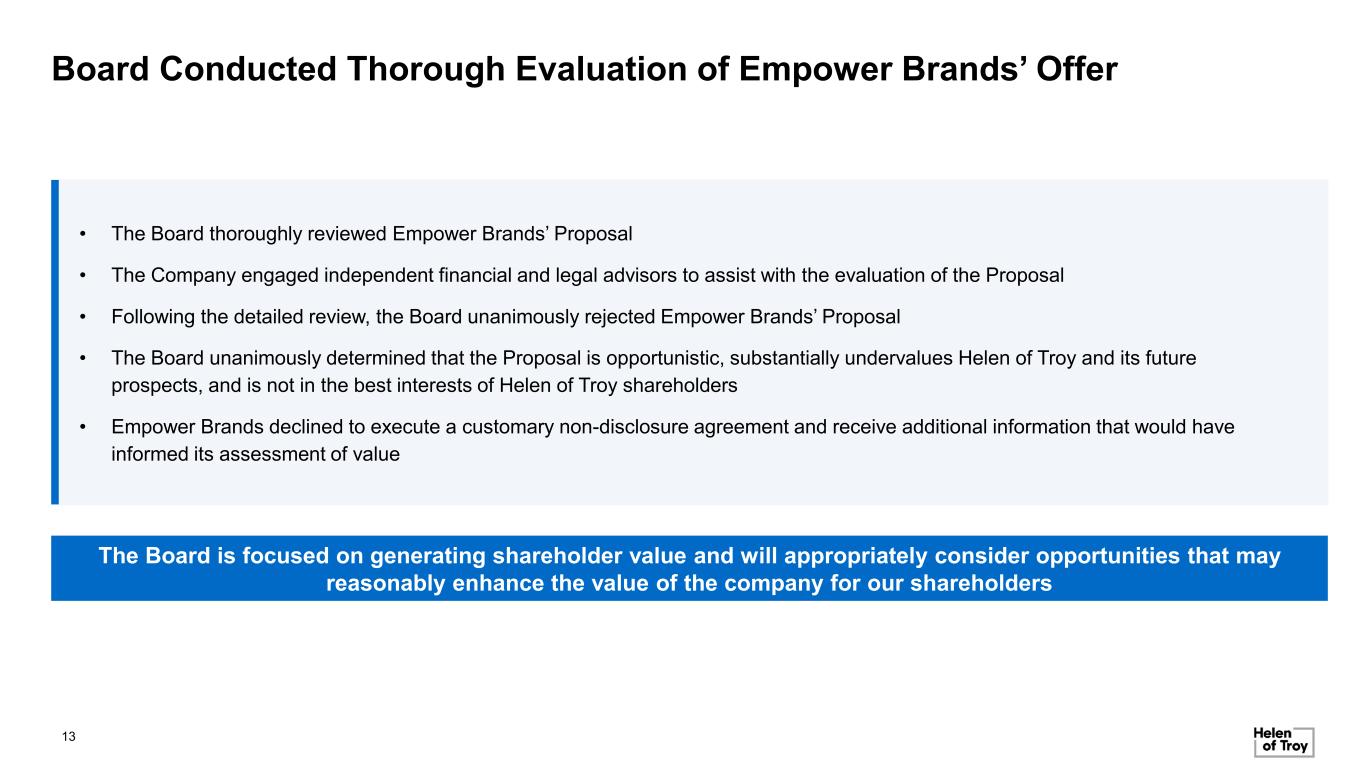
13 • The Board thoroughly reviewed Empower Brands’ Proposal • The Company engaged independent financial and legal advisors to assist with the evaluation of the Proposal • Following the detailed review, the Board unanimously rejected Empower Brands’ Proposal • The Board unanimously determined that the Proposal is opportunistic, substantially undervalues Helen of Troy and its future prospects, and is not in the best interests of Helen of Troy shareholders • Empower Brands declined to execute a customary non-disclosure agreement and receive additional information that would have informed its assessment of value The Board is focused on generating shareholder value and will appropriately consider opportunities that may reasonably enhance the value of the company for our shareholders Board Conducted Thorough Evaluation of Empower Brands’ Offer
Certain Information Regarding Participants The Company and certain of its respective directors and executive officers may be deemed to be participants under the rules of the SEC. Shareholders may obtain information regarding the names, affiliations and interests of the Company’s directors and executive officers in the Company's Annual Report on Form 10-K for the year ended February 28, 2026 , which was filed with the SEC on April 23, 2026, and its proxy statement for the 2026 Annual General Meeting of Shareholders, which was filed with the SEC on June 24, 2026. These documents can be obtained free of charge from the source indicated above. Additional information regarding the interests of these participants in any proxy solicitation and a description of their direct and indirect interests, by security holdings or otherwise, will also be included in any proxy statement and other relevant materials to be filed with the SEC if and when they become available. Additional Information; Certain Information Regarding Participants Additional Information This communication does not constitute an offer to buy or solicitation of an offer to sell any securities. No tender offer for the shares of the Company has commenced at this time. If a tender offer is commenced, the Company may file a solicitation/recommendation statement with the U.S. Securities and Exchange Commission (“SEC”). Any solicitation/recommendation statement filed by the Company that is required to be mailed to shareholders will be mailed to shareholders of the Company. INVESTORS AND SECURITY HOLDERS OF THE COMPANY ARE URGED TO READ THESE AND OTHER DOCUMENTS FILED WITH THE SEC CAREFULLY IN THEIR ENTIRETY IF AND WHEN THEY BECOME AVAILABLE BECAUSE THEY WILL CONTAIN IMPORTANT INFORMATION. Investors and security holders will be able to obtain free copies of these documents (if and when available) and other documents filed with the SEC by the Company through the website maintained by the SEC at http://www.sec.gov. In addition, the Company may file a proxy statement with the SEC. Any definitive proxy statement will be mailed to shareholders of the Company. INVESTORS AND SECURITY HOLDERS OF THE COMPANY ARE URGED TO READ THESE AND OTHER DOCUMENTS FILED WITH THE SEC CAREFULLY IN THEIR ENTIRETY IF AND WHEN THEY BECOME AVAILABLE BECAUSE THEY WILL CONTAIN IMPORTANT INFORMATION. Investors and security holders will be able to obtain free copies of these documents (if and when available) and other documents filed with the SEC by the Company through the website maintained by the SEC at http://www.sec.gov.
Appendix
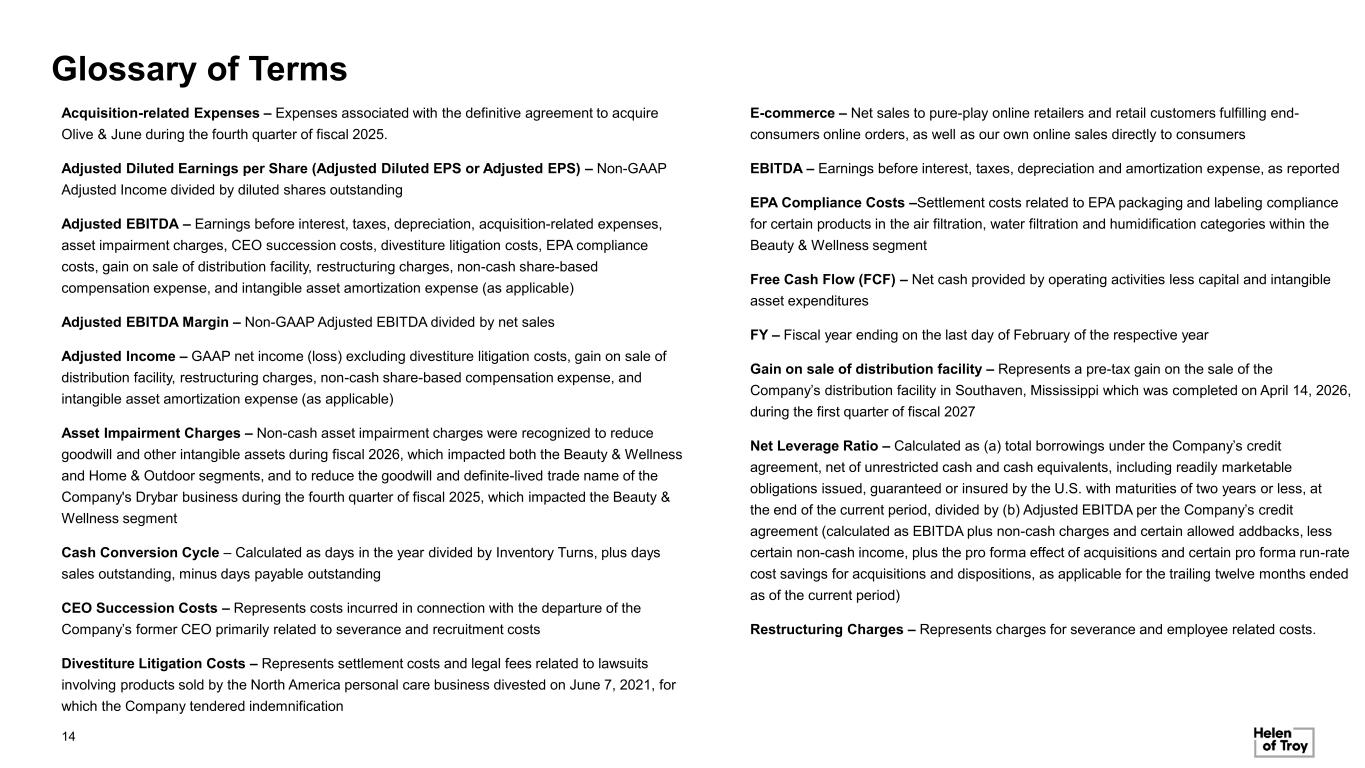
Glossary of Terms Acquisition-related Expenses – Expenses associated with the definitive agreement to acquire Olive & June during the fourth quarter of fiscal 2025. Adjusted Diluted Earnings per Share (Adjusted Diluted EPS or Adjusted EPS) – Non-GAAP Adjusted Income divided by diluted shares outstanding Adjusted EBITDA – Earnings before interest, taxes, depreciation, acquisition-related expenses, asset impairment charges, CEO succession costs, divestiture litigation costs, EPA compliance costs, gain on sale of distribution facility, restructuring charges, non-cash share-based compensation expense, and intangible asset amortization expense (as applicable) Adjusted EBITDA Margin – Non-GAAP Adjusted EBITDA divided by net sales Adjusted Income – GAAP net income (loss) excluding divestiture litigation costs, gain on sale of distribution facility, restructuring charges, non-cash share-based compensation expense, and intangible asset amortization expense (as applicable) Asset Impairment Charges – Non-cash asset impairment charges were recognized to reduce goodwill and other intangible assets during fiscal 2026, which impacted both the Beauty & Wellness and Home & Outdoor segments, and to reduce the goodwill and definite-lived trade name of the Company's Drybar business during the fourth quarter of fiscal 2025, which impacted the Beauty & Wellness segment Cash Conversion Cycle – Calculated as days in the year divided by Inventory Turns, plus days sales outstanding, minus days payable outstanding CEO Succession Costs – Represents costs incurred in connection with the departure of the Company’s former CEO primarily related to severance and recruitment costs Divestiture Litigation Costs – Represents settlement costs and legal fees related to lawsuits involving products sold by the North America personal care business divested on June 7, 2021, for which the Company tendered indemnification E-commerce – Net sales to pure-play online retailers and retail customers fulfilling end- consumers online orders, as well as our own online sales directly to consumers EBITDA – Earnings before interest, taxes, depreciation and amortization expense, as reported EPA Compliance Costs –Settlement costs related to EPA packaging and labeling compliance for certain products in the air filtration, water filtration and humidification categories within the Beauty & Wellness segment Free Cash Flow (FCF) – Net cash provided by operating activities less capital and intangible asset expenditures FY – Fiscal year ending on the last day of February of the respective year Gain on sale of distribution facility – Represents a pre-tax gain on the sale of the Company’s distribution facility in Southaven, Mississippi which was completed on April 14, 2026, during the first quarter of fiscal 2027 Net Leverage Ratio – Calculated as (a) total borrowings under the Company’s credit agreement, net of unrestricted cash and cash equivalents, including readily marketable obligations issued, guaranteed or insured by the U.S. with maturities of two years or less, at the end of the current period, divided by (b) Adjusted EBITDA per the Company’s credit agreement (calculated as EBITDA plus non-cash charges and certain allowed addbacks, less certain non-cash income, plus the pro forma effect of acquisitions and certain pro forma run-rate cost savings for acquisitions and dispositions, as applicable for the trailing twelve months ended as of the current period) Restructuring Charges – Represents charges for severance and employee related costs. 14
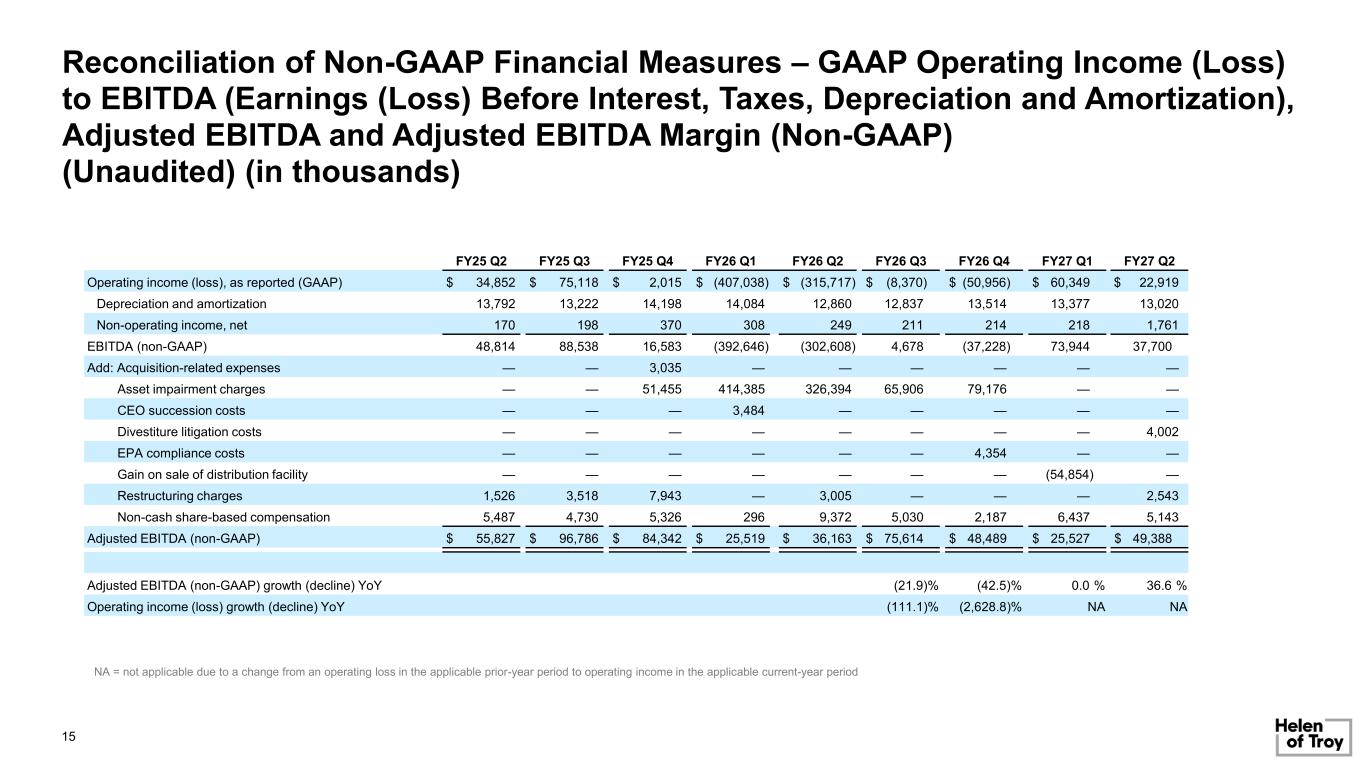
Reconciliation of Non-GAAP Financial Measures – GAAP Operating Income (Loss) to EBITDA (Earnings (Loss) Before Interest, Taxes, Depreciation and Amortization), Adjusted EBITDA and Adjusted EBITDA Margin (Non-GAAP) (Unaudited) (in thousands) 15 NA = not applicable due to a change from an operating loss in the applicable prior-year period to operating income in the applicable current-year period FY25 Q2 FY25 Q3 FY25 Q4 FY26 Q1 FY26 Q2 FY26 Q3 FY26 Q4 FY27 Q1 FY27 Q2 Operating income (loss), as reported (GAAP) $ 34,852 $ 75,118 $ 2,015 $ (407,038) $ (315,717) $ (8,370) $ (50,956) $ 60,349 $ 22,919 Depreciation and amortization 13,792 13,222 14,198 14,084 12,860 12,837 13,514 13,377 13,020 Non-operating income, net 170 198 370 308 249 211 214 218 1,761 EBITDA (non-GAAP) 48,814 88,538 16,583 (392,646) (302,608) 4,678 (37,228) 73,944 37,700 Add: Acquisition-related expenses — — 3,035 — — — — — — Asset impairment charges — — 51,455 414,385 326,394 65,906 79,176 — — CEO succession costs — — — 3,484 — — — — — Divestiture litigation costs — — — — — — — — 4,002 EPA compliance costs — — — — — — 4,354 — — Gain on sale of distribution facility — — — — — — — (54,854) — Restructuring charges 1,526 3,518 7,943 — 3,005 — — — 2,543 Non-cash share-based compensation 5,487 4,730 5,326 296 9,372 5,030 2,187 6,437 5,143 Adjusted EBITDA (non-GAAP) $ 55,827 $ 96,786 $ 84,342 $ 25,519 $ 36,163 $ 75,614 $ 48,489 $ 25,527 $ 49,388 Adjusted EBITDA (non-GAAP) growth (decline) YoY (21.9)% (42.5)% 0.0 % 36.6 % Operating income (loss) growth (decline) YoY (111.1)% (2,628.8)% NA NA
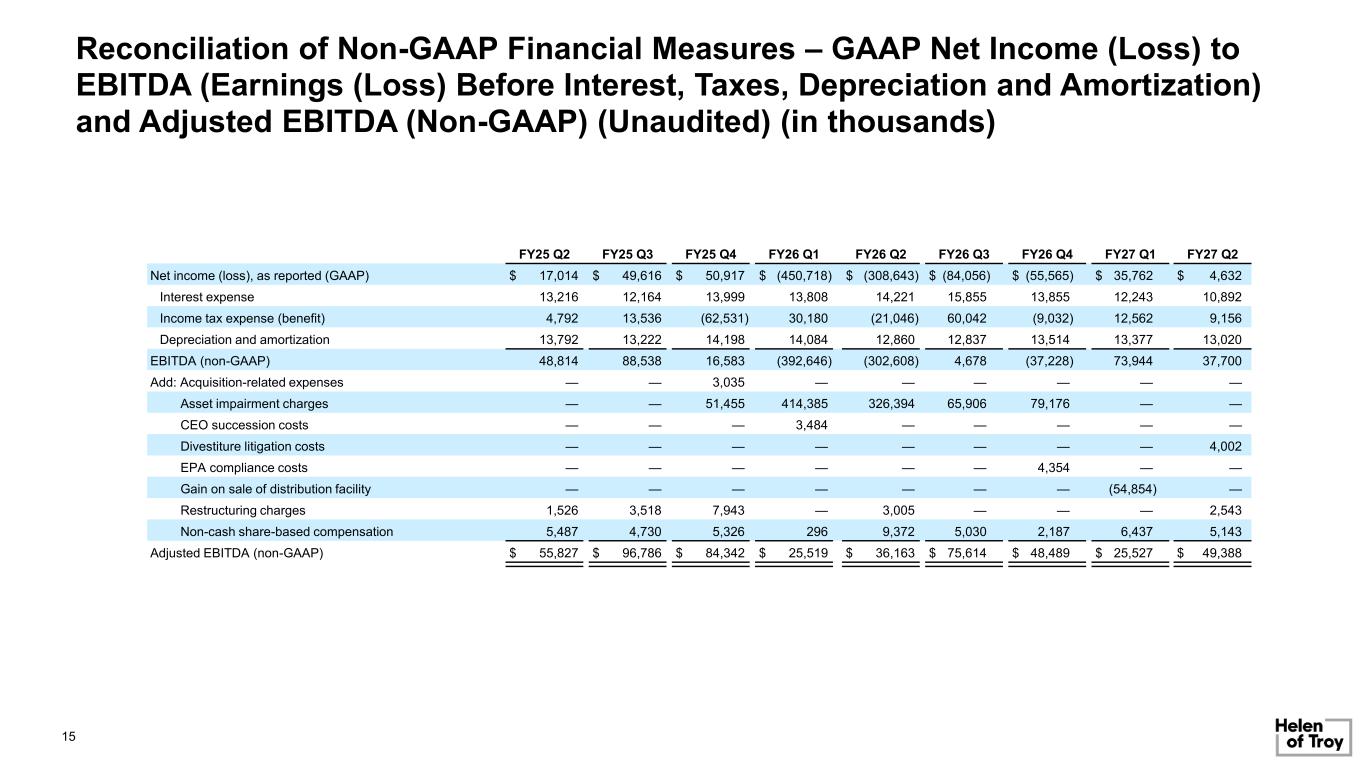
Reconciliation of Non-GAAP Financial Measures – GAAP Net Income (Loss) to EBITDA (Earnings (Loss) Before Interest, Taxes, Depreciation and Amortization) and Adjusted EBITDA (Non-GAAP) (Unaudited) (in thousands) 15 FY25 Q2 FY25 Q3 FY25 Q4 FY26 Q1 FY26 Q2 FY26 Q3 FY26 Q4 FY27 Q1 FY27 Q2 Net income (loss), as reported (GAAP) $ 17,014 $ 49,616 $ 50,917 $ (450,718) $ (308,643) $ (84,056) $ (55,565) $ 35,762 $ 4,632 Interest expense 13,216 12,164 13,999 13,808 14,221 15,855 13,855 12,243 10,892 Income tax expense (benefit) 4,792 13,536 (62,531) 30,180 (21,046) 60,042 (9,032) 12,562 9,156 Depreciation and amortization 13,792 13,222 14,198 14,084 12,860 12,837 13,514 13,377 13,020 EBITDA (non-GAAP) 48,814 88,538 16,583 (392,646) (302,608) 4,678 (37,228) 73,944 37,700 Add: Acquisition-related expenses — — 3,035 — — — — — — Asset impairment charges — — 51,455 414,385 326,394 65,906 79,176 — — CEO succession costs — — — 3,484 — — — — — Divestiture litigation costs — — — — — — — — 4,002 EPA compliance costs — — — — — — 4,354 — — Gain on sale of distribution facility — — — — — — — (54,854) — Restructuring charges 1,526 3,518 7,943 — 3,005 — — — 2,543 Non-cash share-based compensation 5,487 4,730 5,326 296 9,372 5,030 2,187 6,437 5,143 Adjusted EBITDA (non-GAAP) $ 55,827 $ 96,786 $ 84,342 $ 25,519 $ 36,163 $ 75,614 $ 48,489 $ 25,527 $ 49,388
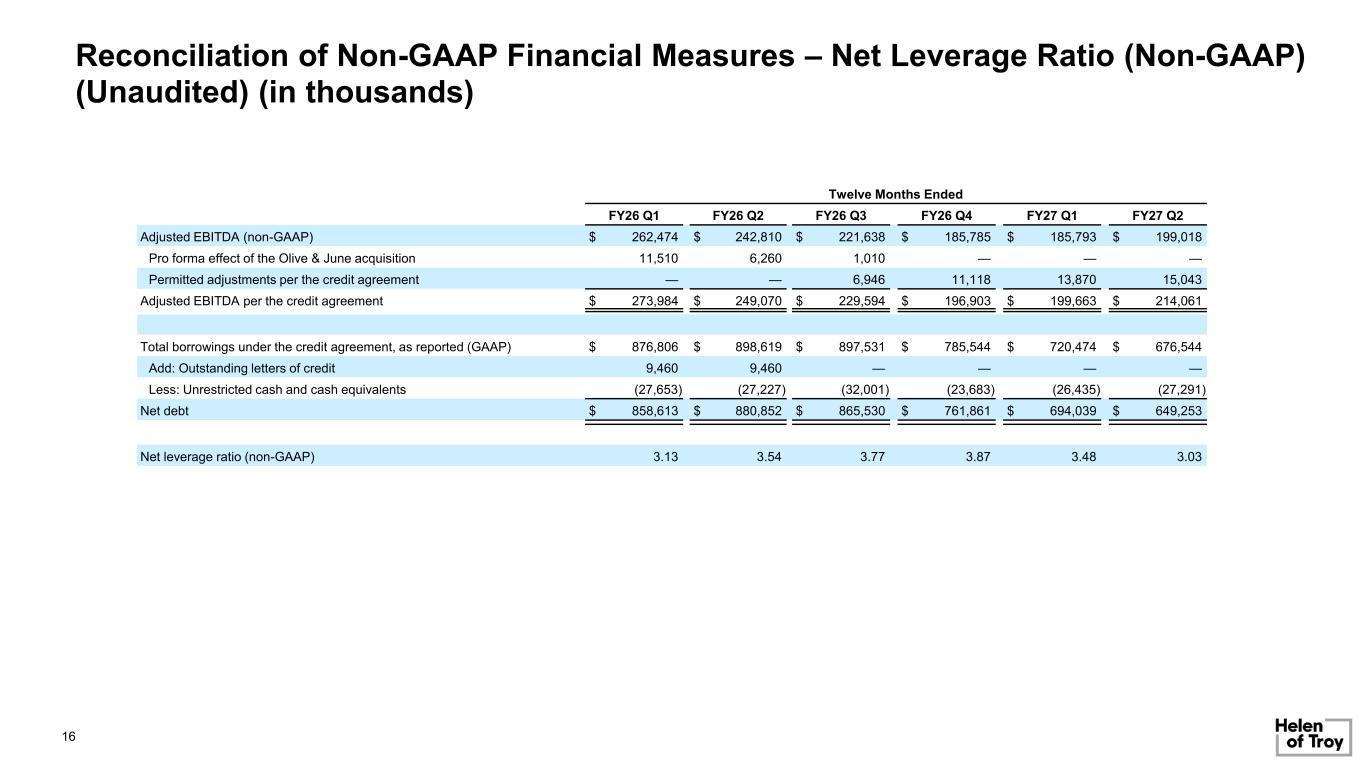
Reconciliation of Non-GAAP Financial Measures – Net Leverage Ratio (Non-GAAP) (Unaudited) (in thousands) Twelve Months Ended FY26 Q1 FY26 Q2 FY26 Q3 FY26 Q4 FY27 Q1 FY27 Q2 Adjusted EBITDA (non-GAAP) $ 262,474 $ 242,810 $ 221,638 $ 185,785 $ 185,793 $ 199,018 Pro forma effect of the Olive & June acquisition 11,510 6,260 1,010 — — — Permitted adjustments per the credit agreement — — 6,946 11,118 13,870 15,043 Adjusted EBITDA per the credit agreement $ 273,984 $ 249,070 $ 229,594 $ 196,903 $ 199,663 $ 214,061 Total borrowings under the credit agreement, as reported (GAAP) $ 876,806 $ 898,619 $ 897,531 $ 785,544 $ 720,474 $ 676,544 Add: Outstanding letters of credit 9,460 9,460 — — — — Less: Unrestricted cash and cash equivalents (27,653) (27,227) (32,001) (23,683) (26,435) (27,291) Net debt $ 858,613 $ 880,852 $ 865,530 $ 761,861 $ 694,039 $ 649,253 Net leverage ratio (non-GAAP) 3.13 3.54 3.77 3.87 3.48 3.03 16
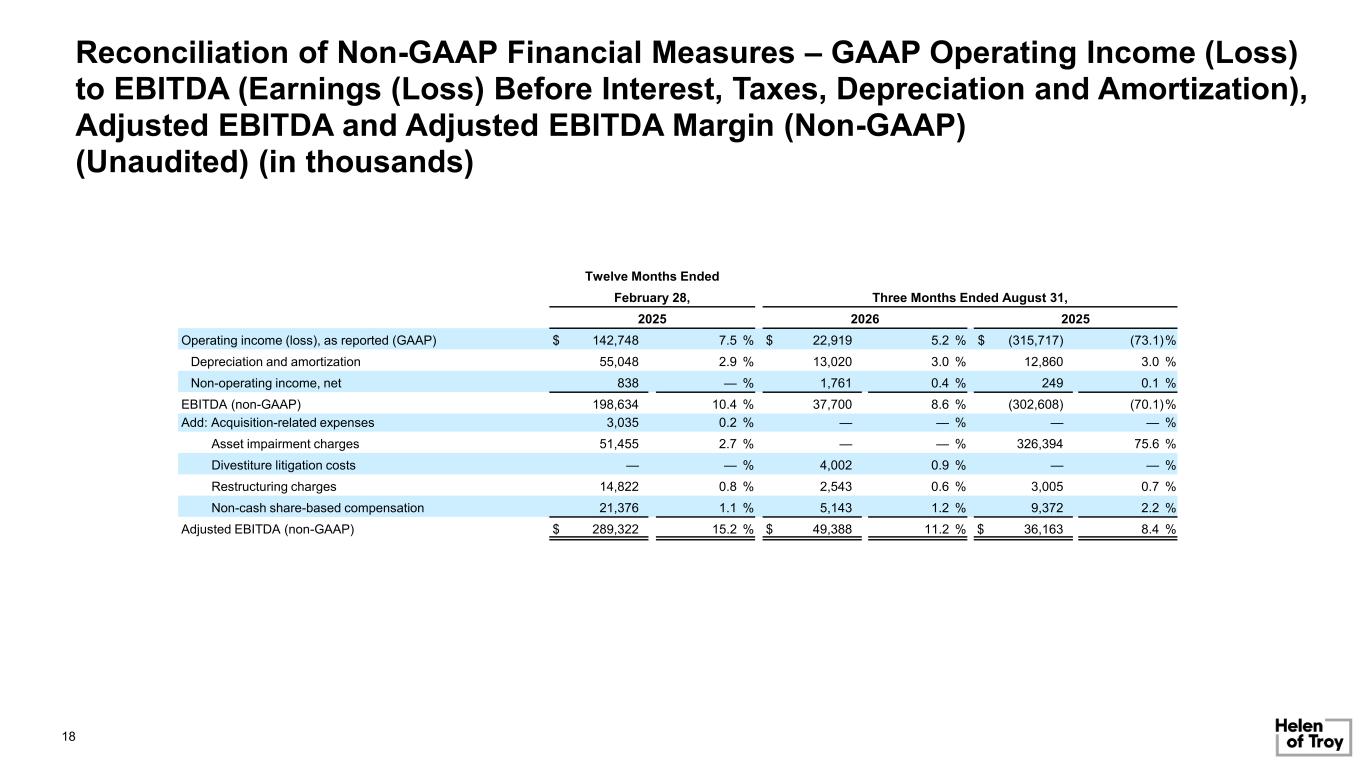
Twelve Months Ended February 28, Three Months Ended August 31, 2025 2026 2025 Operating income (loss), as reported (GAAP) $ 142,748 7.5 % $ 22,919 5.2 % $ (315,717) (73.1)% Depreciation and amortization 55,048 2.9 % 13,020 3.0 % 12,860 3.0 % Non-operating income, net 838 — % 1,761 0.4 % 249 0.1 % EBITDA (non-GAAP) 198,634 10.4 % 37,700 8.6 % (302,608) (70.1)% Add: Acquisition-related expenses 3,035 0.2 % — — % — — % Asset impairment charges 51,455 2.7 % — — % 326,394 75.6 % Divestiture litigation costs — — % 4,002 0.9 % — — % Restructuring charges 14,822 0.8 % 2,543 0.6 % 3,005 0.7 % Non-cash share-based compensation 21,376 1.1 % 5,143 1.2 % 9,372 2.2 % Adjusted EBITDA (non-GAAP) $ 289,322 15.2 % $ 49,388 11.2 % $ 36,163 8.4 % Reconciliation of Non-GAAP Financial Measures – GAAP Operating Income (Loss) to EBITDA (Earnings (Loss) Before Interest, Taxes, Depreciation and Amortization), Adjusted EBITDA and Adjusted EBITDA Margin (Non-GAAP) (Unaudited) (in thousands) 18
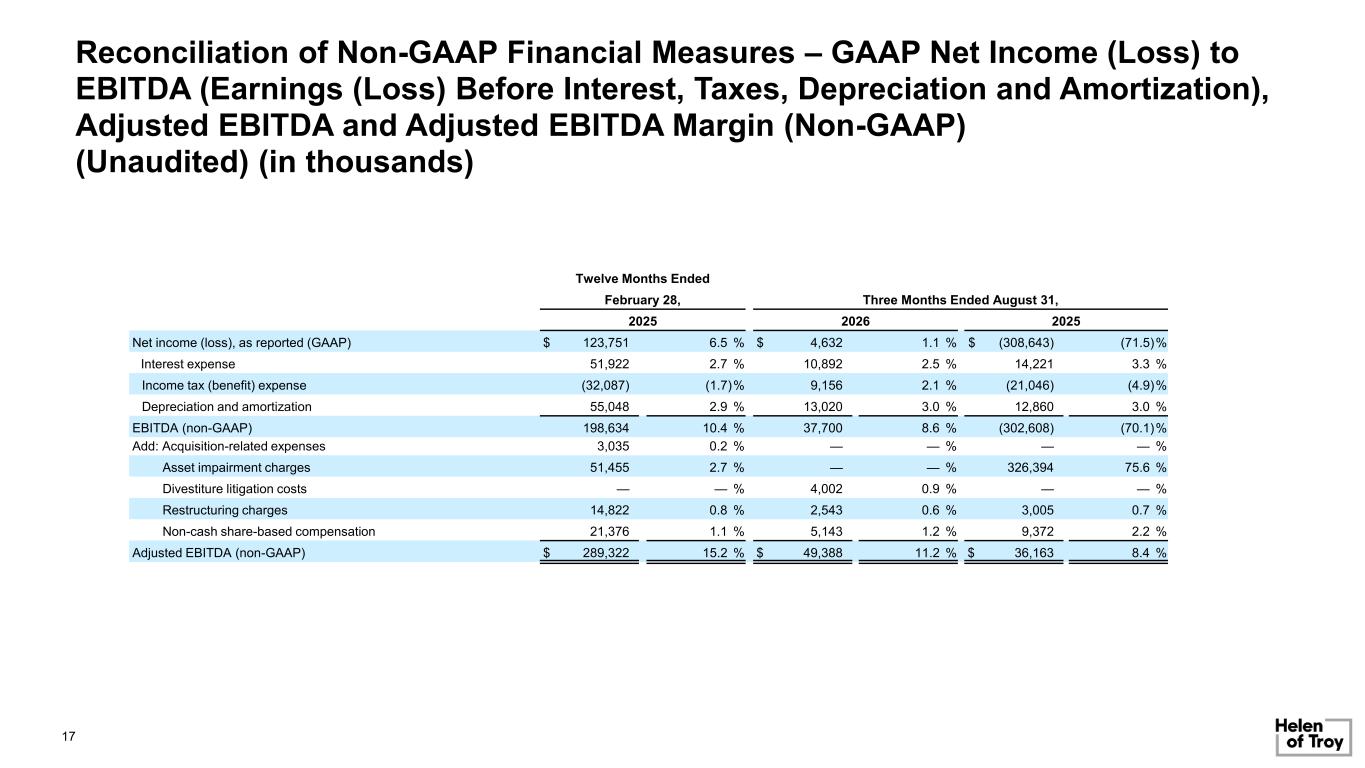
Twelve Months Ended February 28, Three Months Ended August 31, 2025 2026 2025 Net income (loss), as reported (GAAP) $ 123,751 6.5 % $ 4,632 1.1 % $ (308,643) (71.5)% Interest expense 51,922 2.7 % 10,892 2.5 % 14,221 3.3 % Income tax (benefit) expense (32,087) (1.7)% 9,156 2.1 % (21,046) (4.9)% Depreciation and amortization 55,048 2.9 % 13,020 3.0 % 12,860 3.0 % EBITDA (non-GAAP) 198,634 10.4 % 37,700 8.6 % (302,608) (70.1)% Add: Acquisition-related expenses 3,035 0.2 % — — % — — % Asset impairment charges 51,455 2.7 % — — % 326,394 75.6 % Divestiture litigation costs — — % 4,002 0.9 % — — % Restructuring charges 14,822 0.8 % 2,543 0.6 % 3,005 0.7 % Non-cash share-based compensation 21,376 1.1 % 5,143 1.2 % 9,372 2.2 % Adjusted EBITDA (non-GAAP) $ 289,322 15.2 % $ 49,388 11.2 % $ 36,163 8.4 % Reconciliation of Non-GAAP Financial Measures – GAAP Net Income (Loss) to EBITDA (Earnings (Loss) Before Interest, Taxes, Depreciation and Amortization), Adjusted EBITDA and Adjusted EBITDA Margin (Non-GAAP) (Unaudited) (in thousands) 17
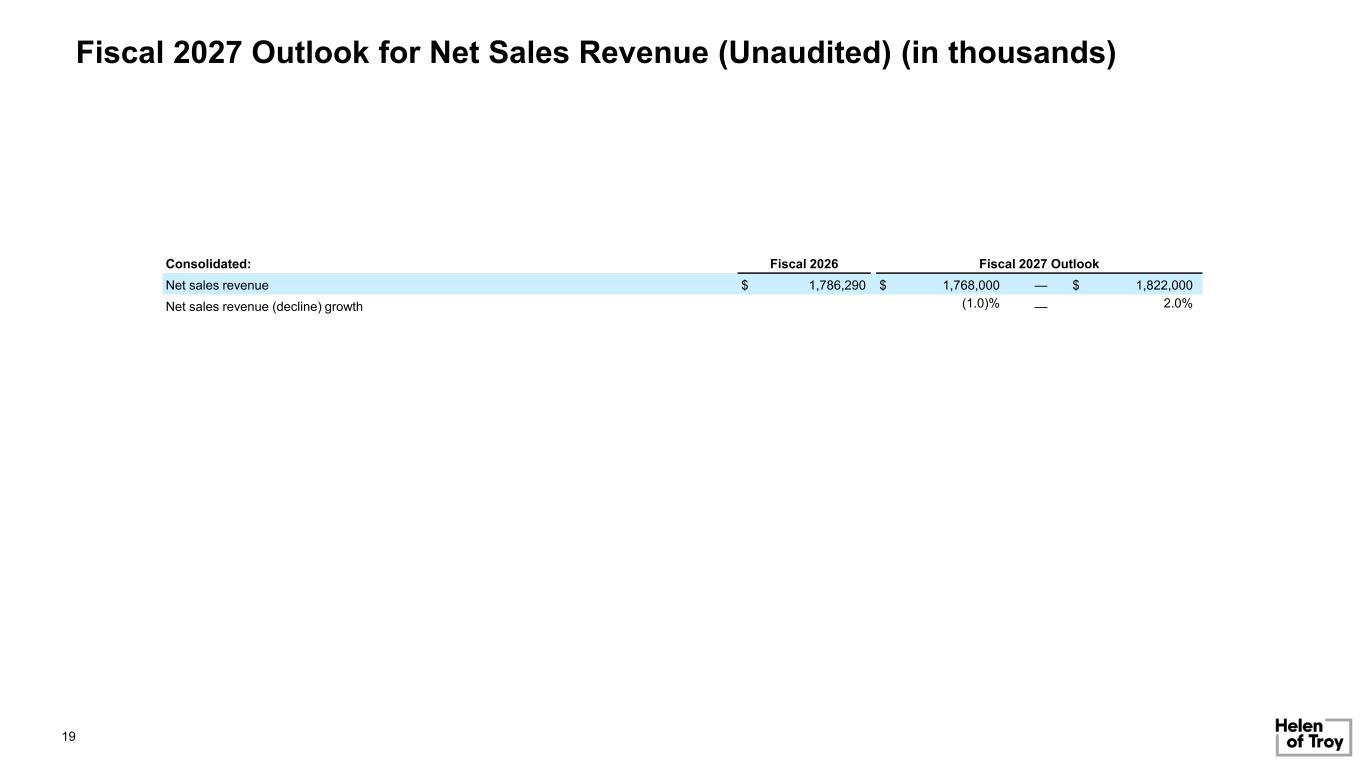
Fiscal 2027 Outlook for Net Sales Revenue (Unaudited) (in thousands) Consolidated: Fiscal 2026 Fiscal 2027 Outlook Net sales revenue $ 1,786,290 $ 1,768,000 — $ 1,822,000 Net sales revenue (decline) growth (1.0)% — 2.0% 19
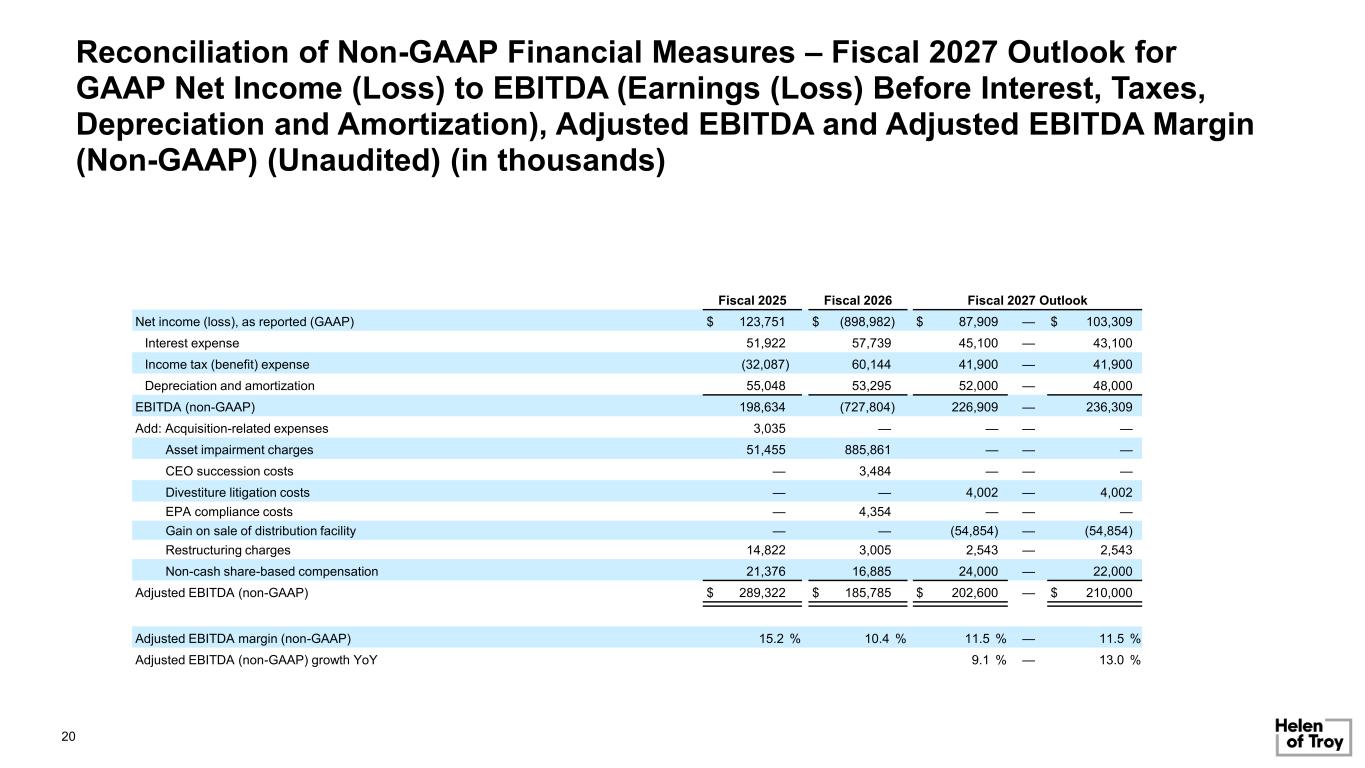
Reconciliation of Non-GAAP Financial Measures – Fiscal 2027 Outlook for GAAP Net Income (Loss) to EBITDA (Earnings (Loss) Before Interest, Taxes, Depreciation and Amortization), Adjusted EBITDA and Adjusted EBITDA Margin (Non-GAAP) (Unaudited) (in thousands) Fiscal 2025 Fiscal 2026 Fiscal 2027 Outlook Net income (loss), as reported (GAAP) $ 123,751 $ (898,982) $ 87,909 — $ 103,309 Interest expense 51,922 57,739 45,100 — 43,100 Income tax (benefit) expense (32,087) 60,144 41,900 — 41,900 Depreciation and amortization 55,048 53,295 52,000 — 48,000 EBITDA (non-GAAP) 198,634 (727,804) 226,909 — 236,309 Add: Acquisition-related expenses 3,035 — — — — Asset impairment charges 51,455 885,861 — — — CEO succession costs — 3,484 — — — Divestiture litigation costs — — 4,002 — 4,002 EPA compliance costs — 4,354 — — — Gain on sale of distribution facility — — (54,854) — (54,854) Restructuring charges 14,822 3,005 2,543 — 2,543 Non-cash share-based compensation 21,376 16,885 24,000 — 22,000 Adjusted EBITDA (non-GAAP) $ 289,322 $ 185,785 $ 202,600 — $ 210,000 Adjusted EBITDA margin (non-GAAP) 15.2 % 10.4 % 11.5 % — 11.5 % Adjusted EBITDA (non-GAAP) growth YoY 9.1 % — 13.0 % 20
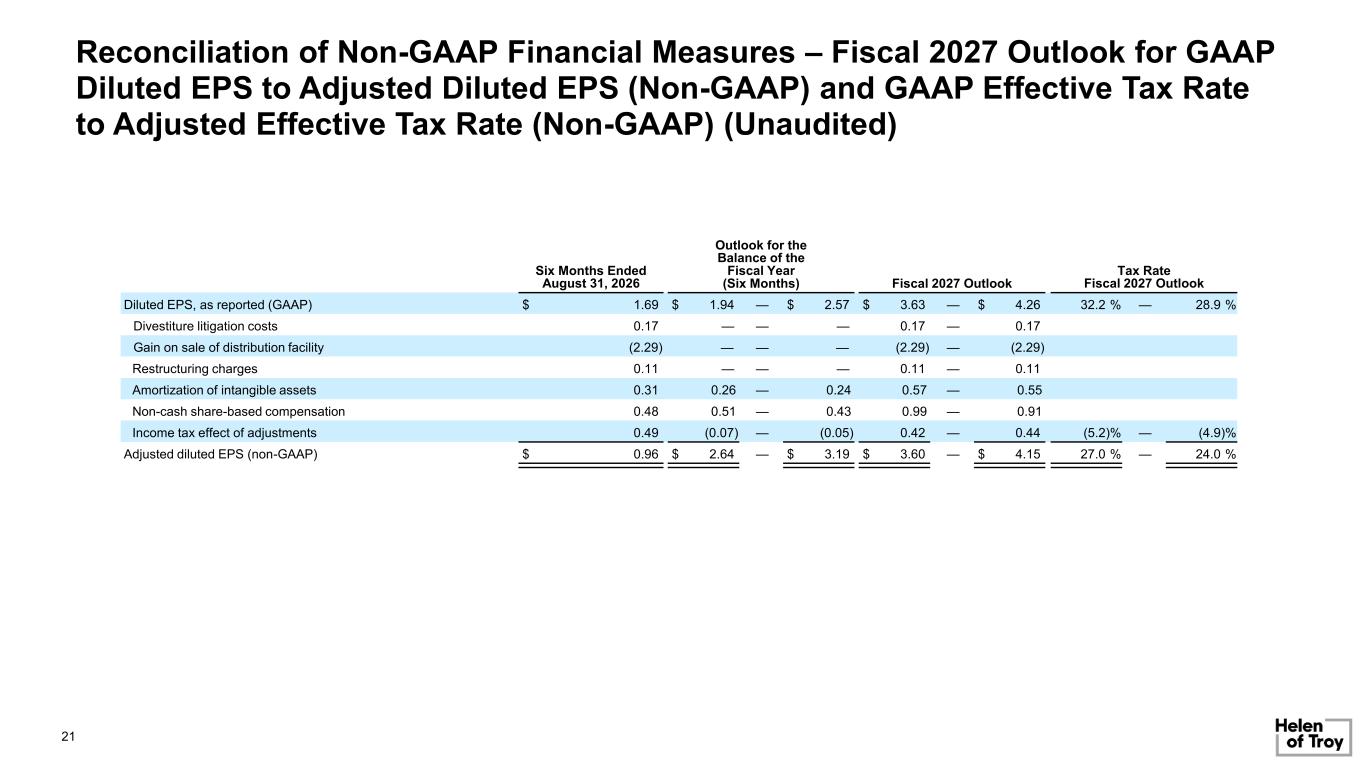
Reconciliation of Non-GAAP Financial Measures – Fiscal 2027 Outlook for GAAP Diluted EPS to Adjusted Diluted EPS (Non-GAAP) and GAAP Effective Tax Rate to Adjusted Effective Tax Rate (Non-GAAP) (Unaudited) Six Months Ended August 31, 2026 Outlook for the Balance of the Fiscal Year (Six Months) Fiscal 2027 Outlook Tax Rate Fiscal 2027 Outlook Diluted EPS, as reported (GAAP) $ 1.69 $ 1.94 — $ 2.57 $ 3.63 — $ 4.26 32.2 % — 28.9 % Divestiture litigation costs 0.17 — — — 0.17 — 0.17 Gain on sale of distribution facility (2.29) — — — (2.29) — (2.29) Restructuring charges 0.11 — — — 0.11 — 0.11 Amortization of intangible assets 0.31 0.26 — 0.24 0.57 — 0.55 Non-cash share-based compensation 0.48 0.51 — 0.43 0.99 — 0.91 Income tax effect of adjustments 0.49 (0.07) — (0.05) 0.42 — 0.44 (5.2)% — (4.9)% Adjusted diluted EPS (non-GAAP) $ 0.96 $ 2.64 — $ 3.19 $ 3.60 — $ 4.15 27.0 % — 24.0 % 21
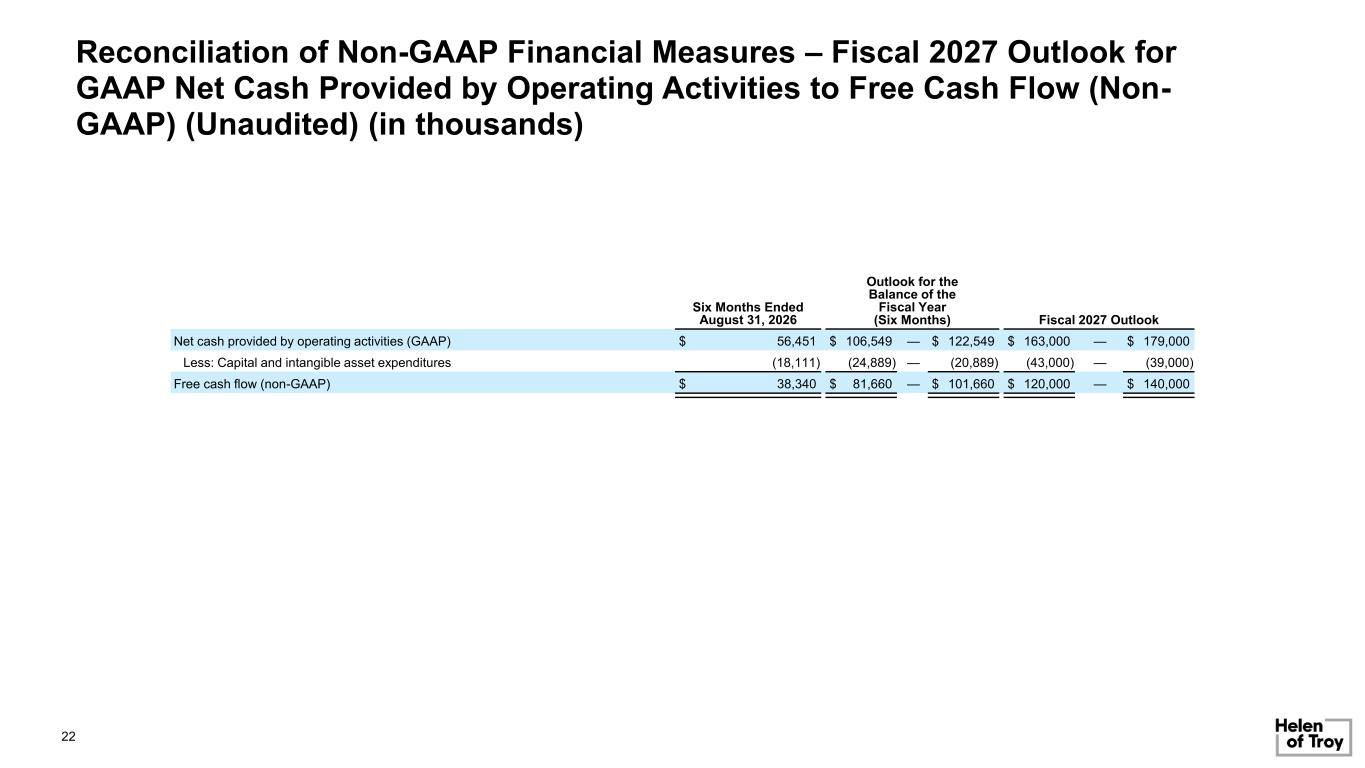
Reconciliation of Non-GAAP Financial Measures – Fiscal 2027 Outlook for GAAP Net Cash Provided by Operating Activities to Free Cash Flow (Non- GAAP) (Unaudited) (in thousands) Six Months Ended August 31, 2026 Outlook for the Balance of the Fiscal Year (Six Months) Fiscal 2027 Outlook Net cash provided by operating activities (GAAP) $ 56,451 $ 106,549 — $ 122,549 $ 163,000 — $ 179,000 Less: Capital and intangible asset expenditures (18,111) (24,889) — (20,889) (43,000) — (39,000) Free cash flow (non-GAAP) $ 38,340 $ 81,660 — $ 101,660 $ 120,000 — $ 140,000 22