This contains important information about the Monteagle Select Value Fund – MVEIX (the “Fund”) for the period September 1, 2025 to August 31, 2026.
ADDITIONAL INFORMATION
For additional information about the Fund; including its prospectus, financial information, holdings and proxy information, visit https://monteaglefunds.com or contact us at 1-888-263-5593.
expense Information
What were the Fund costs for the past year?
(based on a hypothetical $10,000 investment)
| Fund Name | Costs of a $10,000 investment | Costs paid as a percentage of a $10,000 investment |
| Monteagle Select Value Fund - Institutional Class | $159 | 1.42% |
managment’s discussion of fund performance
Fund Performance
The Fund generated positive returns for the fiscal year ending August 31, 2026, primarily due to its exposure to the Information Technology sector. Although value stocks underperformed the broader S&P 500, the Fund returned 23.50%, exceeding the S&P 500’s return of 20.38%. The Fund also outperformed the S&P 500 Value Index (SVX), which returned 18.12% during the fiscal year.
Strategy
The Fund’s investment goal is long-term capital appreciation. The Fund uses a “value investing” style by investing at least 80 percent of its assets in common stock of domestic companies believed to be underpriced while utilizing a reversion-to-the-mean strategy. The adviser will generally hold between 20 and 60 equities and diversify its holdings across numerous industries. Value stocks are broadly defined as equities which have a price-to-earnings ratio and a price-to-book ratio less than the relative market average, a higher dividend yield and a beta of less than 1.0.
Techniques
The Fund concentrates on equities contained in the S&P 500. The Fund’s adviser uses a predominant reversion-to-the-mean strategy with a value tilt. More specifically, stocks with attractive earnings yields and forward earnings yields are targeted for purchase in anticipation of appreciation in price, given favorable valuations and forward-looking metrics. The adviser also considers a company’s return on invested capital when evaluating its relative attractiveness. Traditional value metrics used in this analysis include Forward P/E Ratios, Price to Book Ratios and Price to Sales Ratios. Forward P/E ratios are utilized over traditional P/E ratios to avoid “value traps,” where the price may appear attractive based on current earnings but may be potentially overvalued when factoring in future earnings. When choosing specific stocks, the various metrics used for selection are compared against other companies within the same sector to seek the best relative value within each sector. The overall sector allocation considers the S&P 500’s sector weighting to reduce return volatility relative to the index but can deviate based on stocks available for purchase. The strategy focuses on stock selection to drive returns compared to sector rotation or market timing. It is anticipated that the Fund may hold higher levels of cash during periods of market uncertainty. This strategy is executed with a long-term outlook and will have periods of underperformance and outperformance versus its Index.
Performance graph
AVERAGE ANNUAL RETURNS
(for the periods ended August 31, 2026)
|
One Year |
Five Year |
Ten Year |
Dollar Value | |
| Monteagle Select Value Fund - Institutional Class | 23.50% | 8.10% | 10.37% | $26,831 |
| S&P 500 Index | 20.38% | 12.78% | 15.37% | $41,774 |
Cumulative Performance Comparison of $10,000 Investment
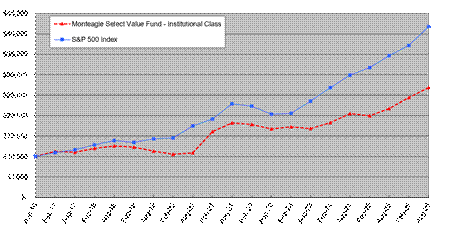
Past performance is not a good predictor of future performance. The returns shown do not reflect taxes that a shareholder would pay on Fund distributions or on the redemption of Fund shares. Updated performance data current to the most recent month-end can be obtained by calling 1-888-263-5593.
Fund statistics
| NET | PORTFOLIO | PORTFOLIO | FEES PAID TO |
| ASSETS: | HOLDINGS | TURNOVER | THE ADVISER |
| $21,098,323 | 50 | 81% | $94,510 |
PORTFOLIO ILLUSTRATION
The following chart gives a visual breakdown of the Fund by the sectors the underlying securities represent as a percentage of the portfolio of investments.
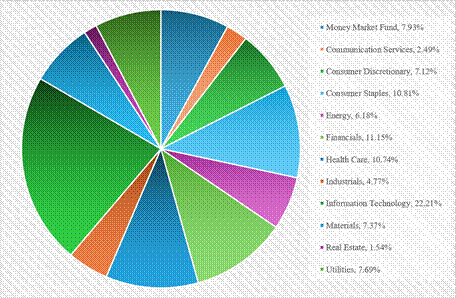
Sectors are categorized using Global Industry Classification Standard.
top ten holdings
(% of Net Assets)
| 1. | Federated Hermes Government Obligations Fund - Institutional Class | 7.93% |
| 2. | Micron Technology, Inc. | 5.00% |
| 3. | Microsoft Corp. | 3.61% |
| 4. | Cisco Systems, Inc. | 3.04% |
| 5. | Adobe Systems, Inc. | 2.91% |
| 6. | APA Corp. | 2.78% |
| 7. | The Campbell's Co. | 2.54% |
| 8. | Apollo Global Management, Inc. | 2.46% |
| 9. | Salesforce.com, Inc. | 2.44% |
| 10. | Domino's Pizza, Inc. | 2.43% |
| Total % of Net Assets | 35.14% |
This contains important information about the Monteagle Opportunity Equity Fund – Investor Class – HEQFX (the “Fund”) for the period September 1, 2025 to August 31, 2026.
ADDITIONAL INFORMATION
For additional information about the Fund; including its prospectus, financial information, holdings and proxy information, visit https://monteaglefunds.com or contact us at 1-888-263-5593.
expense Information
What were the Fund costs for the past year?
(based on a hypothetical $10,000 investment)
| Fund Name | Costs of a $10,000 investment | Costs paid as a percentage of a $10,000 investment |
| Monteagle Opportunity Equity Fund - Investor Class | $192 | 1.79% |
managment’s discussion of fund performance
The summer months were marked by a sharp change in market leadership. The AI-driven rally that powered the first half of the year stalled in July. Investors' attention moved from AI demand to whether the large AI spending plans would pay off. Semiconductor and mega-cap growth stocks sold off, and value and more economically sensitive areas of the market took the lead. Energy and Financials did especially well, helped by Middle East tensions, firm oil prices and rising long-term interest rates. Technology recovered in August, but the broadening of the market beyond a handful of mega-cap names was the defining theme of the period. That favored the Fund's approach.
In the three months ending August 31, 2026, the Monteagle Opportunity Equity Fund – Investor Class returned 3.78%, compared to 1.68% for the S&P 500. Against the S&P 500, sector allocation drove most of the Fund's outperformance this quarter, although security selection was also a positive contributor. The Fund's underweights to Communication Services and Information Technology helped as both sectors lagged the index. Security selection in Consumer Discretionary was particularly strong. The largest positive contributors for the quarter were Abercrombie & Fitch Co., Matson Inc., and Veeva Systems Inc. while the largest detractors were Nextpower Inc., Worthington Steel Inc., and ON Semiconductor Corp.
Year to date through August 31, the Fund returned 13.13%, compared to 13.12% for the S&P 500. The first half of 2026 was dominated by an AI and semiconductor rally of historic strength. The Philadelphia Semiconductor Index rose 88% in the second quarter alone. Because the S&P 500 is heavily weighted toward the largest technology companies, its Information Technology sector gained 22.40% through August. That sector makes up roughly 35% of the index, and the Fund's structural underweight negatively impacted allocation. Stock selection in Industrials was the largest single drag. On the positive side, firm oil prices driven by geopolitical tensions boosted Energy. The Fund's energy holdings returned 66.27%, compared to 43.45% for the sector in the index. Selection in Consumer Discretionary also provided a meaningful boost to returns as did the Fund's underweight to the Communication Services sector.
We continue to believe in our process through market cycles. The first half of the year showed how a market led by a narrow group of mega-cap technology stocks can weigh on relative results against the S&P 500. However, the Summer showed that when leadership broadens, a portfolio of high-quality small- and mid-cap companies can benefit. With long-term interest rates at multi-year highs, a strong earnings backdrop and ongoing debate about the payoff from AI spending, we believe the Fund is well positioned for the current environment.
Performance graph
AVERAGE ANNUAL RETURNS
(for the periods ended August 31, 2026)
|
One Year |
Five Year |
Ten Year |
Dollar Value | |
| Monteagle Opportunity Equity Fund – Investor Class | 14.78% | 8.18% | 9.63% | $ 25,083 |
| S&P 500 Index | 20.38% | 12.78% | 15.37% | $ 41,775 |
Cumulative Performance Comparison of $10,000 Investment
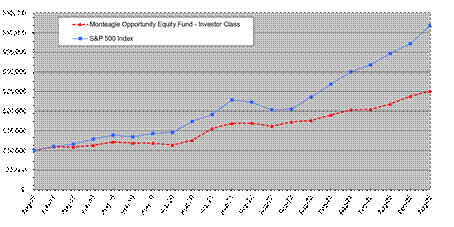
Past performance is not a good predictor of future performance. The returns shown do not reflect taxes that a shareholder would pay on Fund distributions or on the redemption of Fund shares. Updated performance data current to the most recent month-end can be obtained by calling 1-888-263-5593.
Fund statistics
| NET | PORTFOLIO | PORTFOLIO | FEES PAID TO |
| ASSETS: | HOLDINGS | TURNOVER | THE ADVISER |
| $10,340,726 | 119 | 16% | $41,816 |
PORTFOLIO ILLUSTRATION
The following chart gives a visual breakdown of the Fund by the sectors the underlying securities represent as a percentage of the portfolio of investments.
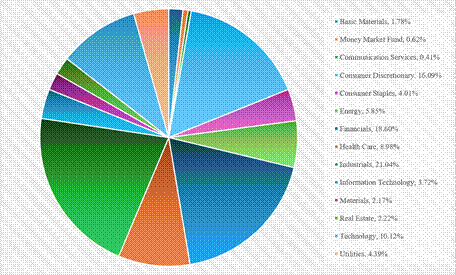
Sectors are categorized using Global Industry Classification Standard.
top ten holdings
(% of Net Assets)
| 1. | Matson, Inc. | 2.00% |
| 2. | Abercrombie & Fitch Co. | 1.71% |
| 3. | Brady Corp. Class A | 1.30% |
| 4. | Landstar System, Inc. | 1.30% |
| 5. | Fluor Corp. | 1.29% |
| 6. | Mueller Industries, Inc. | 1.28% |
| 7. | Renaissancere Holdings Ltd. | 1.23% |
| 8. | A.O. Smith Corp. | 1.21% |
| 9. | Veeva Systems, Inc. | 1.16% |
| 10. | Alkermes PLC | 1.16% |
| Total % of Net Assets | 13.64% |
This contains important information about the Monteagle Opportunity Equity Fund – Institutional Class – HEQCX (the “Fund”) for the period September 1, 2025 to August 31, 2026.
ADDITIONAL INFORMATION
For additional information about the Fund; including its prospectus, financial information, holdings and proxy information, visit https://monteaglefunds.com or contact us at 1-888-263-5593.
expense Information
What were the Fund costs for the past year?
(based on a hypothetical $10,000 investment)
| Fund Name | Costs of a $10,000 investment | Costs paid as a percentage of a $10,000 investment |
| Monteagle Opportunity Equity Fund - Institutional Class | $139 | 1.29% |
managment’s discussion of fund performance
The summer months were marked by a sharp change in market leadership. The AI-driven rally that powered the first half of the year stalled in July. Investors' attention moved from AI demand to whether the large AI spending plans would pay off. Semiconductor and mega-cap growth stocks sold off, and value and more economically sensitive areas of the market took the lead. Energy and Financials did especially well, helped by Middle East tensions, firm oil prices and rising long-term interest rates. Technology recovered in August, but the broadening of the market beyond a handful of mega-cap names was the defining theme of the period. That favored the Fund's approach.
In the three months ending August 31, 2026, the Monteagle Opportunity Equity Fund – Investor Class returned 3.88%, compared to 1.68% for the S&P 500. Against the S&P 500, sector allocation drove most of the Fund's outperformance this quarter, although security selection was also a positive contributor. The Fund's underweights to Communication Services and Information Technology helped as both sectors lagged the index. Security selection in Consumer Discretionary was particularly strong. The largest positive contributors for the quarter were Abercrombie & Fitch Co., Matson Inc., and Veeva Systems Inc. while the largest detractors were Nextpower Inc., Worthington Steel Inc., and ON Semiconductor Corp.
Year to date through August 31, the Fund returned 13.42%, compared to 13.12% for the S&P 500. The first half of 2026 was dominated by an AI and semiconductor rally of historic strength. The Philadelphia Semiconductor Index rose 88% in the second quarter alone. Because the S&P 500 is heavily weighted toward the largest technology companies, its Information Technology sector gained 22.40% through August. That sector makes up roughly 35% of the index, and the Fund's structural underweight negatively impacted allocation. Stock selection in Industrials was the largest single drag. On the positive side, firm oil prices driven by geopolitical tensions boosted Energy. The Fund's energy holdings returned 66.27%, compared to 43.45% for the sector in the index. Selection in Consumer Discretionary also provided a meaningful boost to returns as did the Fund's underweight to the Communication Services sector.
We continue to believe in our process through market cycles. The first half of the year showed how a market led by a narrow group of mega-cap technology stocks can weigh on relative results against the S&P 500. However, the Summer showed that when leadership broadens, a portfolio of high-quality small- and mid-cap companies can benefit. With long-term interest rates at multi-year highs, a strong earnings backdrop and ongoing debate about the payoff from AI spending, we believe the Fund is well positioned for the current environment.
Performance graph
AVERAGE ANNUAL RETURNS
(for the periods ended August 31, 2026)
|
One Year |
Five Year |
Ten Year |
Dollar Value | |
| Monteagle Opportunity Equity Fund - Institutional Class | 15.34% | 8.70% | 10.16% | $2,632,045 |
| S&P 500 Index | 20.38% | 12.78% | 15.37% | $4,177,402 |
Cumulative Performance Comparison of $1,000,000 Investment
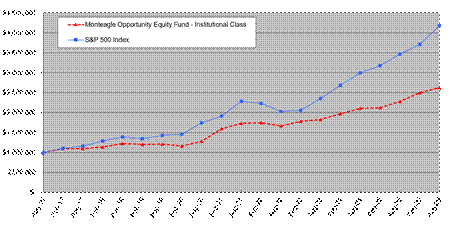
Past performance is not a good predictor of future performance. The returns shown do not reflect taxes that a shareholder would pay on Fund distributions or on the redemption of Fund shares. Updated performance data current to the most recent month-end can be obtained by calling 1-888-263-5593.
Fund statistics
| NET | PORTFOLIO | PORTFOLIO | FEES PAID TO |
| ASSETS: | HOLDINGS | TURNOVER | THE ADVISER |
| $7,530,566 | 119 | 16% | $41,816 |
PORTFOLIO ILLUSTRATION
The following chart gives a visual breakdown of the Fund by the sectors the underlying securities represent as a percentage of the portfolio of investments.
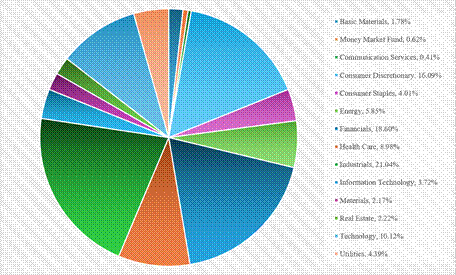
Sectors are categorized using Global Industry Classification Standard.
top ten holdings
(% of Net Assets)
| 1. | Matson, Inc. | 2.00% |
| 2. | Abercrombie & Fitch Co. | 1.71% |
| 3. | Brady Corp. Class A | 1.30% |
| 4. | Landstar System, Inc. | 1.30% |
| 5. | Fluor Corp. | 1.29% |
| 6. | Mueller Industries, Inc. | 1.28% |
| 7. | Renaissancere Holdings Ltd. | 1.23% |
| 8. | A.O. Smith Corp. | 1.21% |
| 9. | Veeva Systems, Inc. | 1.16% |
| 10. | Alkermes PLC | 1.16% |
| Total % of Net Assets | 13.64% |
This contains important information about the Monteagle Enhanced Equity Income Fund – Institutional Class - EEIFX (the “Fund”) for the period September 1, 2025 to August 31, 2026.
ADDITIONAL INFORMATION
For additional information about the Fund; including its prospectus, financial information, holdings and proxy information, visit https://monteaglefunds.com or contact us at 1-888-263-5593.
expense Information
What were the Fund costs for the past year?
(based on a hypothetical $10,000 investment)
| Fund Name | Costs of a $10,000 investment | Costs paid as a percentage of a $10,000 investment |
| Monteagle Enhanced Equity Income Fund - Institutional Class | $144 | 1.33% |
managment’s discussion of fund performance
The Fund enjoyed positive returns for the year ended August 31, 2026, posting a 12-month total return of 16.97%. This fell short of its stated index, the CBOE S&P 500 BuyWrite Monthly Index, which posted a 19.31%. Still, the Fund leads its benchmark since inception. While the call writing strategy employed by the fund did generate substantial income, it also led to some missed upside from "winners" being called away. This clearly detracted from performance in some cases.
Strategy
The strategy is to maintain long positions in quality equity securities expected to appreciate over the long term. The Fund then writes covered call options above the purchase price in an effort to boost income and total return. The targeted securities typically will not have a beta to the overall market that will make it too difficult to keep in the portfolio. In the event the security has risen above the strike price on the option contract expiration date, the securities will be called away and the Fund will reinvest proceeds in a prudent manner. The Fund also seeks to capture the dividend income on portfolio securities and factors this into derivative selection.
Techniques
The Fund seeks equity securities than fall into one of three distinct buckets: 1) names with higher implied volatility than make good call writing candidates, 2) stable income producing securities and 3) stocks trading at a sizeable discount to what is viewed as fair value. Generally speaking, the Fund seeks for each bucket to represent roughly 1/3 each of the overall portfolio. Currently, the call writing bucket is dominated by technology sector names, particularly those levered to a continued artificial intelligence build-out. The income generating bucket primarily consists of financials and energy names. And, the deep value bucket is largely comprised of consumer discretionary and defense names.
Performance graph
AVERAGE ANNUAL RETURNS
(for the periods ended August 31, 2026)
|
One Year |
Since Inception |
Dollar Value | |
|
Monteagle Enhanced Equity Income Fund – Institutional Class |
16.97% | 13.81% | $15,935 |
| CBOE S&P 500 BuyWrite Monthly Index | 19.31% | 13.00% | $15,535 |
| S&P 500 Index | 20.38% | 21.36% | $20,096 |
Cumulative Performance Comparison of $10,000 Investment
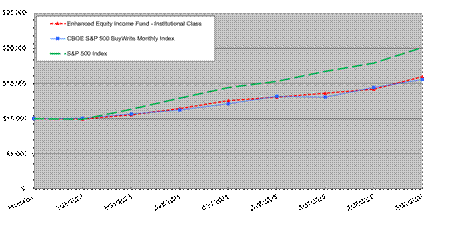
Past performance is not a good predictor of future performance. The returns shown do not reflect taxes that a shareholder would pay on Fund distributions or on the redemption of Fund shares. Updated performance data current to the most recent month-end can be obtained by calling 1-888-263-5593.
Fund statistics
| NET | PORTFOLIO | PORTFOLIO | FEES PAID TO |
| ASSETS: | HOLDINGS | TURNOVER | THE ADVISER |
| $13,388,737 | 43 | 106% | $41,026 |
PORTFOLIO ILLUSTRATION
The following chart gives a visual breakdown of the Fund by the sectors the underlying securities represent as a percentage of the portfolio of investments.
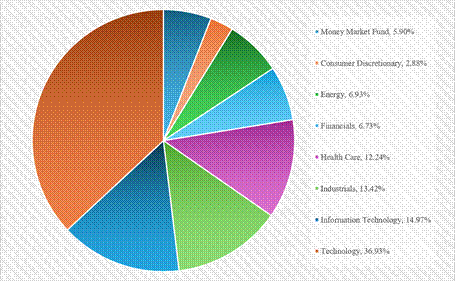
Sectors are categorized using Global Industry Classification Standard.
top ten holdings
(% of Net Assets)
| 1. | Amazon.com, Inc. | 5.82% |
| 2. | NVDIA Corp. | 5.77% |
| 3. | Microsoft Corp. | 5.68% |
| 4. | Federated Hermes Government Obligations Fund - Institutional Class | 5.52% |
| 5. | Meta Platforms, Inc. | 4.27% |
| 6. | Bank of America Corp. | 4.16% |
| 7. | Salesforce.com, Inc. | 3.85% |
| 8. | Alphabet, Inc. | 3.80% |
| 9. | SLB Ltd. | 3.59% |
| 10. | Western Digital Corp. | 3.37% |
| Total % of Net Assets | 45.83% |
This contains important information about The Texas Fund – Institutional Class – BIGTX (the “Fund”) for the period September 1, 2025 to August 31, 2026.
ADDITIONAL INFORMATION
For additional information about the Fund; including its prospectus, financial information, holdings and proxy information, visit https://monteaglefunds.com or contact us at 1-888-263-5593.
expense Information
What were the Fund costs for the past year?
(based on a hypothetical $10,000 investment)
| Fund Name | Costs of a $10,000 investment | Costs paid as a percentage of a $10,000 investment |
| The Texas Fund - Institutional Class | $179 | 1.62% |
managment’s discussion of fund performance
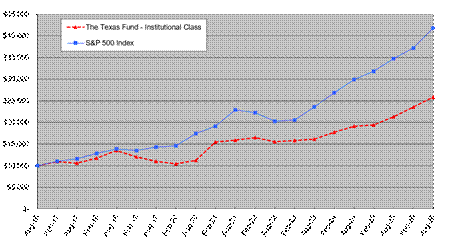
The Fund enjoyed positive returns for the year ended August 31, 2026, in part due to favorable stock market conditions. BIGTX outperformed the S&P 500 Index, the S&P 400 Mid Cap Index, and the S&P 500 Equal Weight Index, with returns of 20.38%, 17.13%, and 18.23%, respectively, compared to the Fund’s 21.32% return. The positive performance of the Fund was primarily attributable to select outperforming stocks and sector weightings from a tactical allocation strategy. Specifically, the Fund is currently overweight Technology, Energy, and Industrials, which were top performing sectors within the S&P. The Fund outperforms the S&P 500 Equal Weight Index for the rolling one-year, three-year, and five-year period and is top-ranked among peers on a one-year and five-year rolling period. It is also in the top 30th percentile rank of peers in the category by Morningstar for the rolling 1-, 3-, and 5-year periods.
The Fund’s investment goal is long-term capital appreciation. The Fund invests in a broad market capitalization across the various sectors and sizes of the Texas economy keeping 80% or more of the fund invested in: 1) companies headquartered in Texas, 2) organized under Texas state laws, or 3) derive 50% of revenues or profits or have 50% of their assets in Texas. The adviser limits the pool of stocks considered for purchase to only those equities with market capitalization greater than $500 million. The adviser also limits the amount in any one sector to less than 25% of the overall portfolio of companies.
In selecting stocks, the Fund’s adviser uses a formula ranking stocks in each sector. Company rankings are determined by the Fund’s adviser after analyzing the financials, valuation, and growth prospects in comparison with their peers in the sector. The advisor considers the macro environment as well as sector opportunities to determine how heavily to weight a sector. The overall objective is to hold higher ranked companies for a long-term period to allow the capture of their growth within the Texas economy.
Since there are a number of small and mid-cap companies in Texas, the fund does not target a specific market capitalization but includes a broad range. The Fund also maintains investments across the spectrum of Texas companies from those considered to be value companies to those considered growth companies.
Performance graph
AVERAGE ANNUAL RETURNS
(for the periods ended August 31, 2026)
|
One Year |
Five Year |
Ten Year |
Dollar Value | |
| The Texas Fund – Institutional Class | 21.32% | 10.14% | 9.95% | $25,815 |
| S&P 500 Index | 20.38% | 12.78% | 15.37% | $41,774 |
Cumulative Performance Comparison of $10,000 Investment
Past performance is not a good predictor of future performance. The returns shown do not reflect taxes that a shareholder would pay on Fund distributions or on the redemption of Fund shares. Updated performance data current to the most recent month-end can be obtained by calling 1-888-263-5593.
Fund statistics
| NET | PORTFOLIO | PORTFOLIO | FEES PAID TO |
| ASSETS: | HOLDINGS | TURNOVER | THE ADVISER |
| $22,378,384 | 83 | 84% | $79,856 |
PORTFOLIO ILLUSTRATION
The following chart gives a visual breakdown of the Fund by the sectors the underlying securities represent as a percentage of the portfolio of investments.
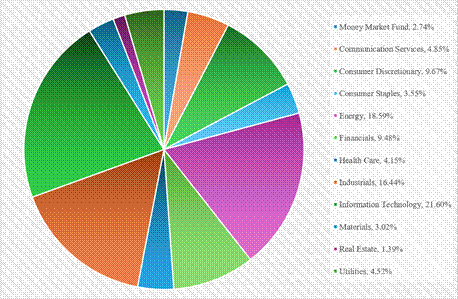
Sectors are categorized using Global Industry Classification Standard.
top ten holdings
(% of Net Assets)
| 1. | Dell Technologies, Inc. Class C | 3.85% |
| 2. | Tesla, Inc. | 3.83% |
| 3. | Crowdstrike Holdings, Inc. Class A | 3.59% |
| 4. | The Charles Schwab Corp. | 3.13% |
| 5. | Chevron Corp. | 2.96% |
| 6. | Oracle Corp. | 2.95% |
| 7. | Caterpillar, Inc. | 2.94% |
| 8. | Exxon Mobil Corp. | 2.89% |
| 9. | Federated Hermes Government Obligations Fund - Institutional Class | 2.74% |
| 10. | Texas Instruments, Inc. | 2.58% |
| Total % of Net Assets | 31.46% |