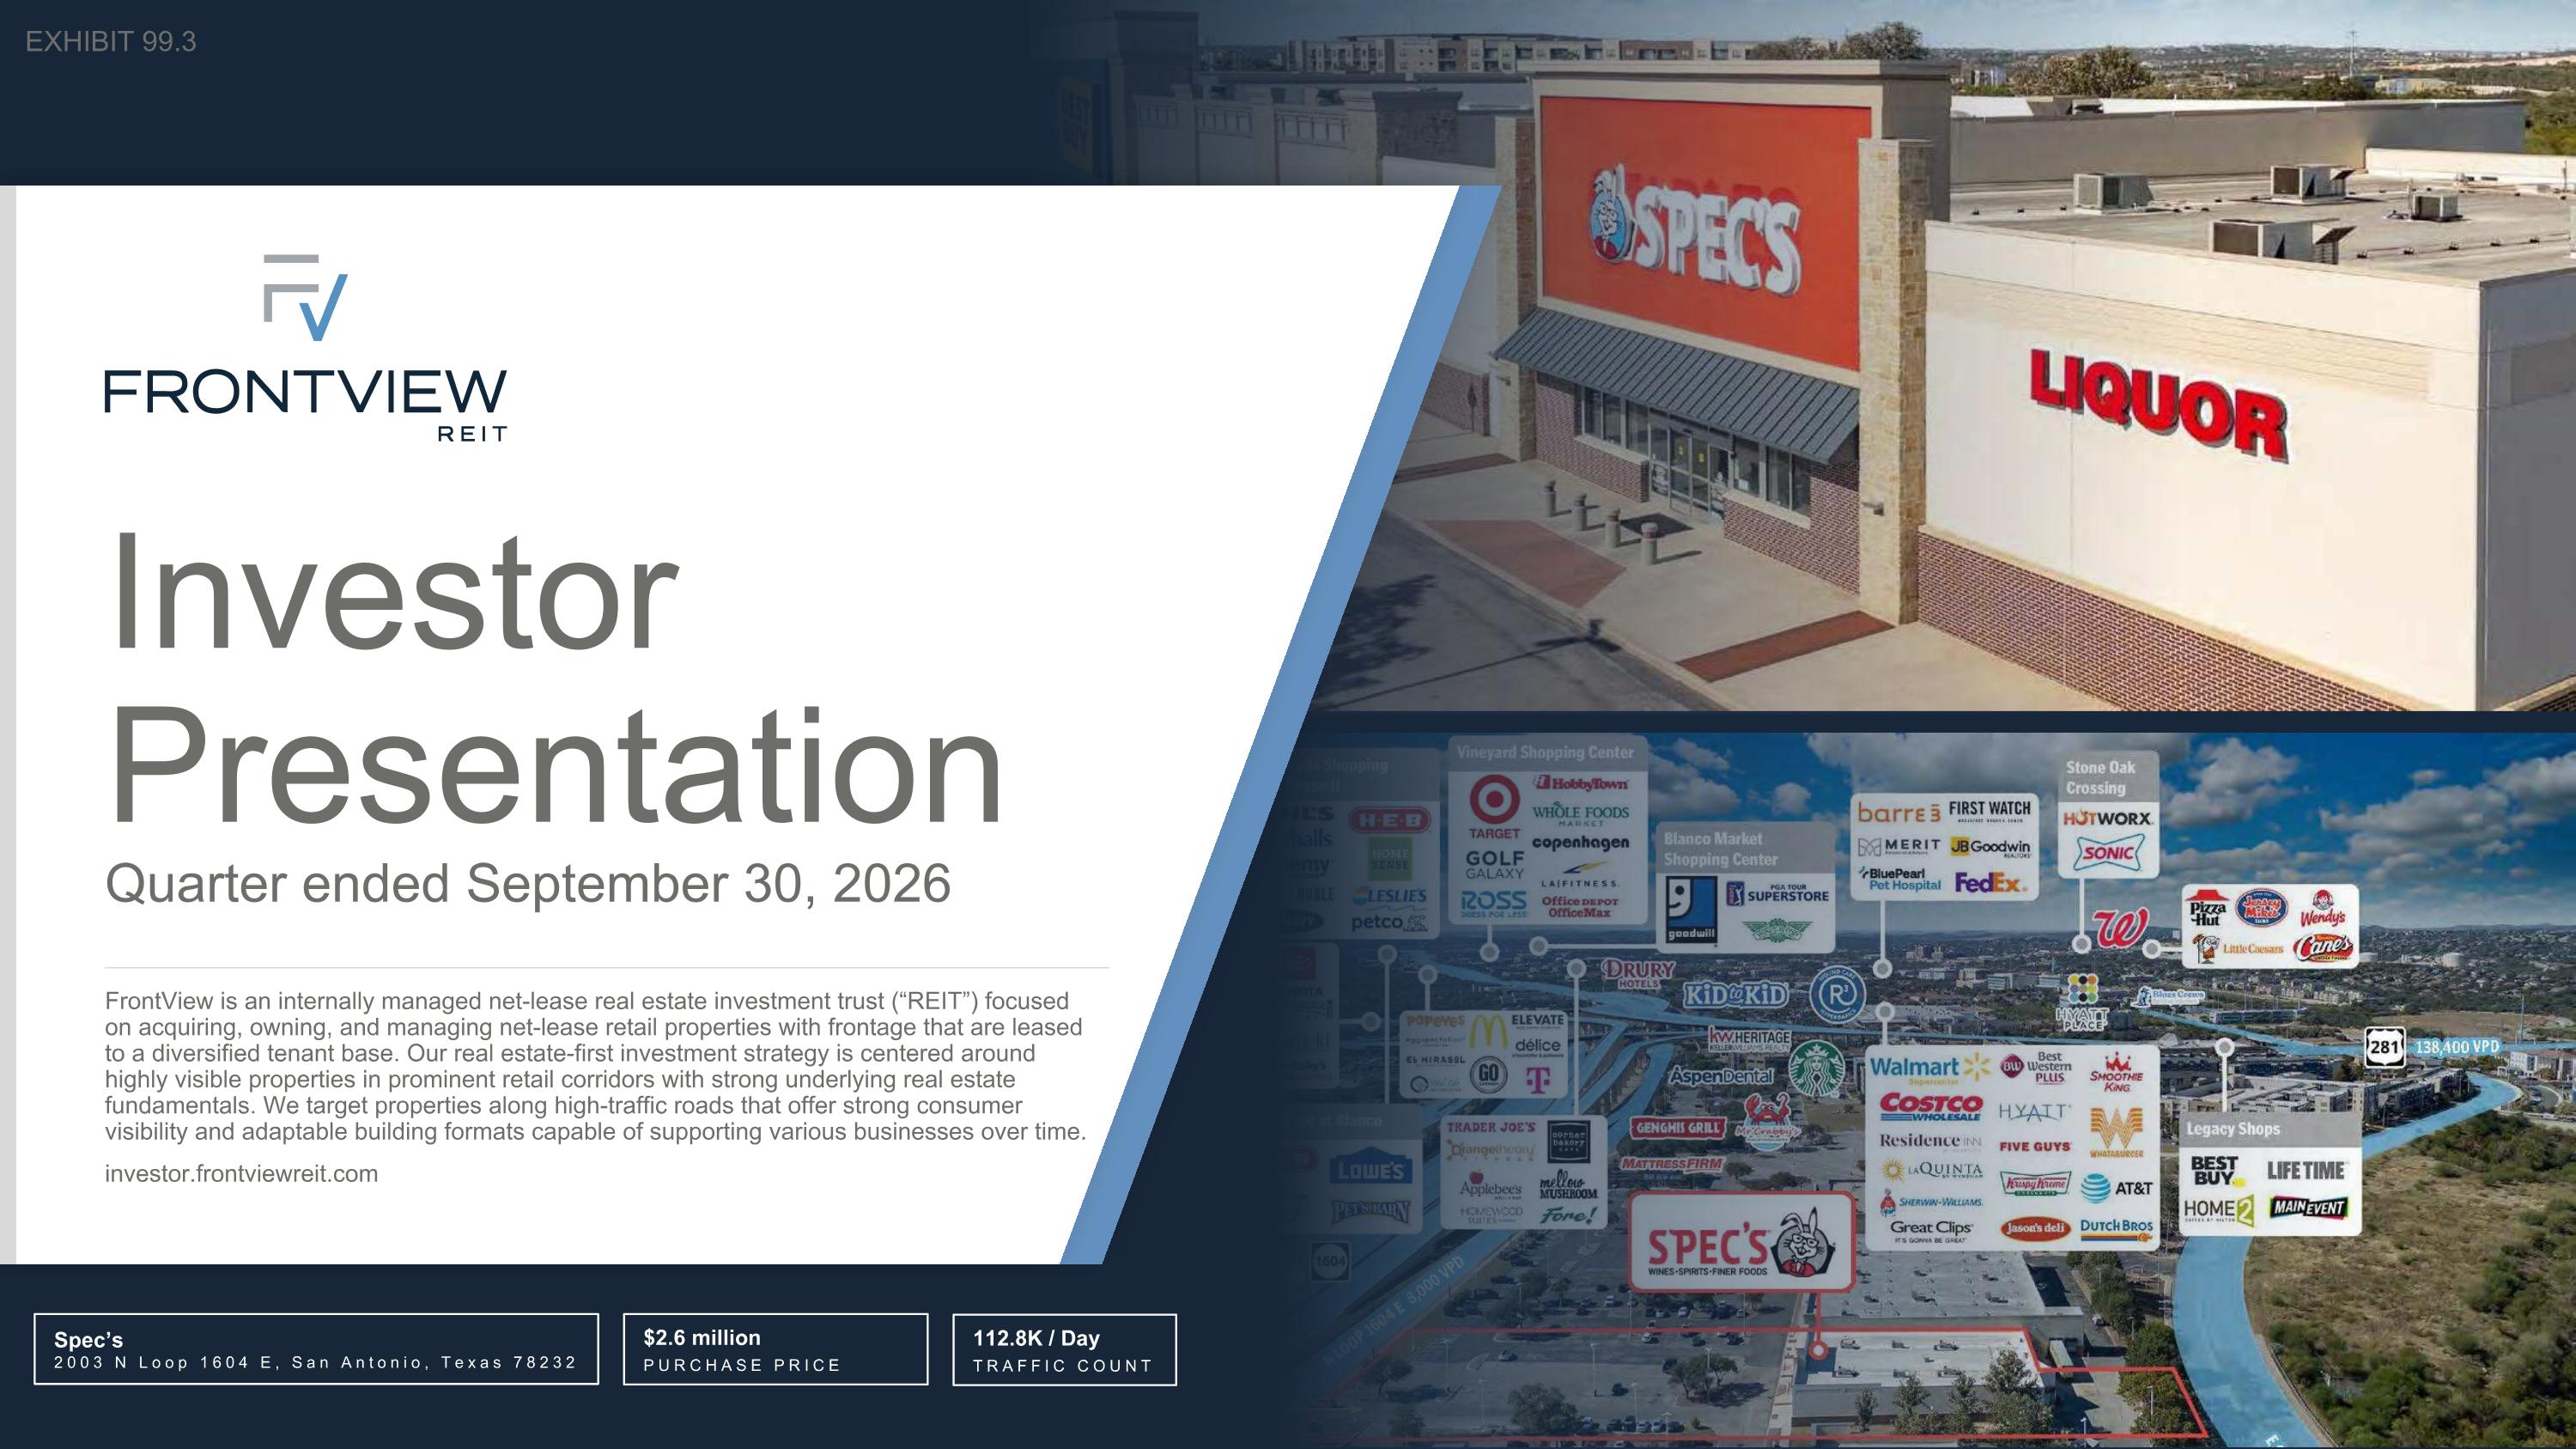
Investor Presentation Quarter ended September 30, 2026 EXHIBIT 99.3
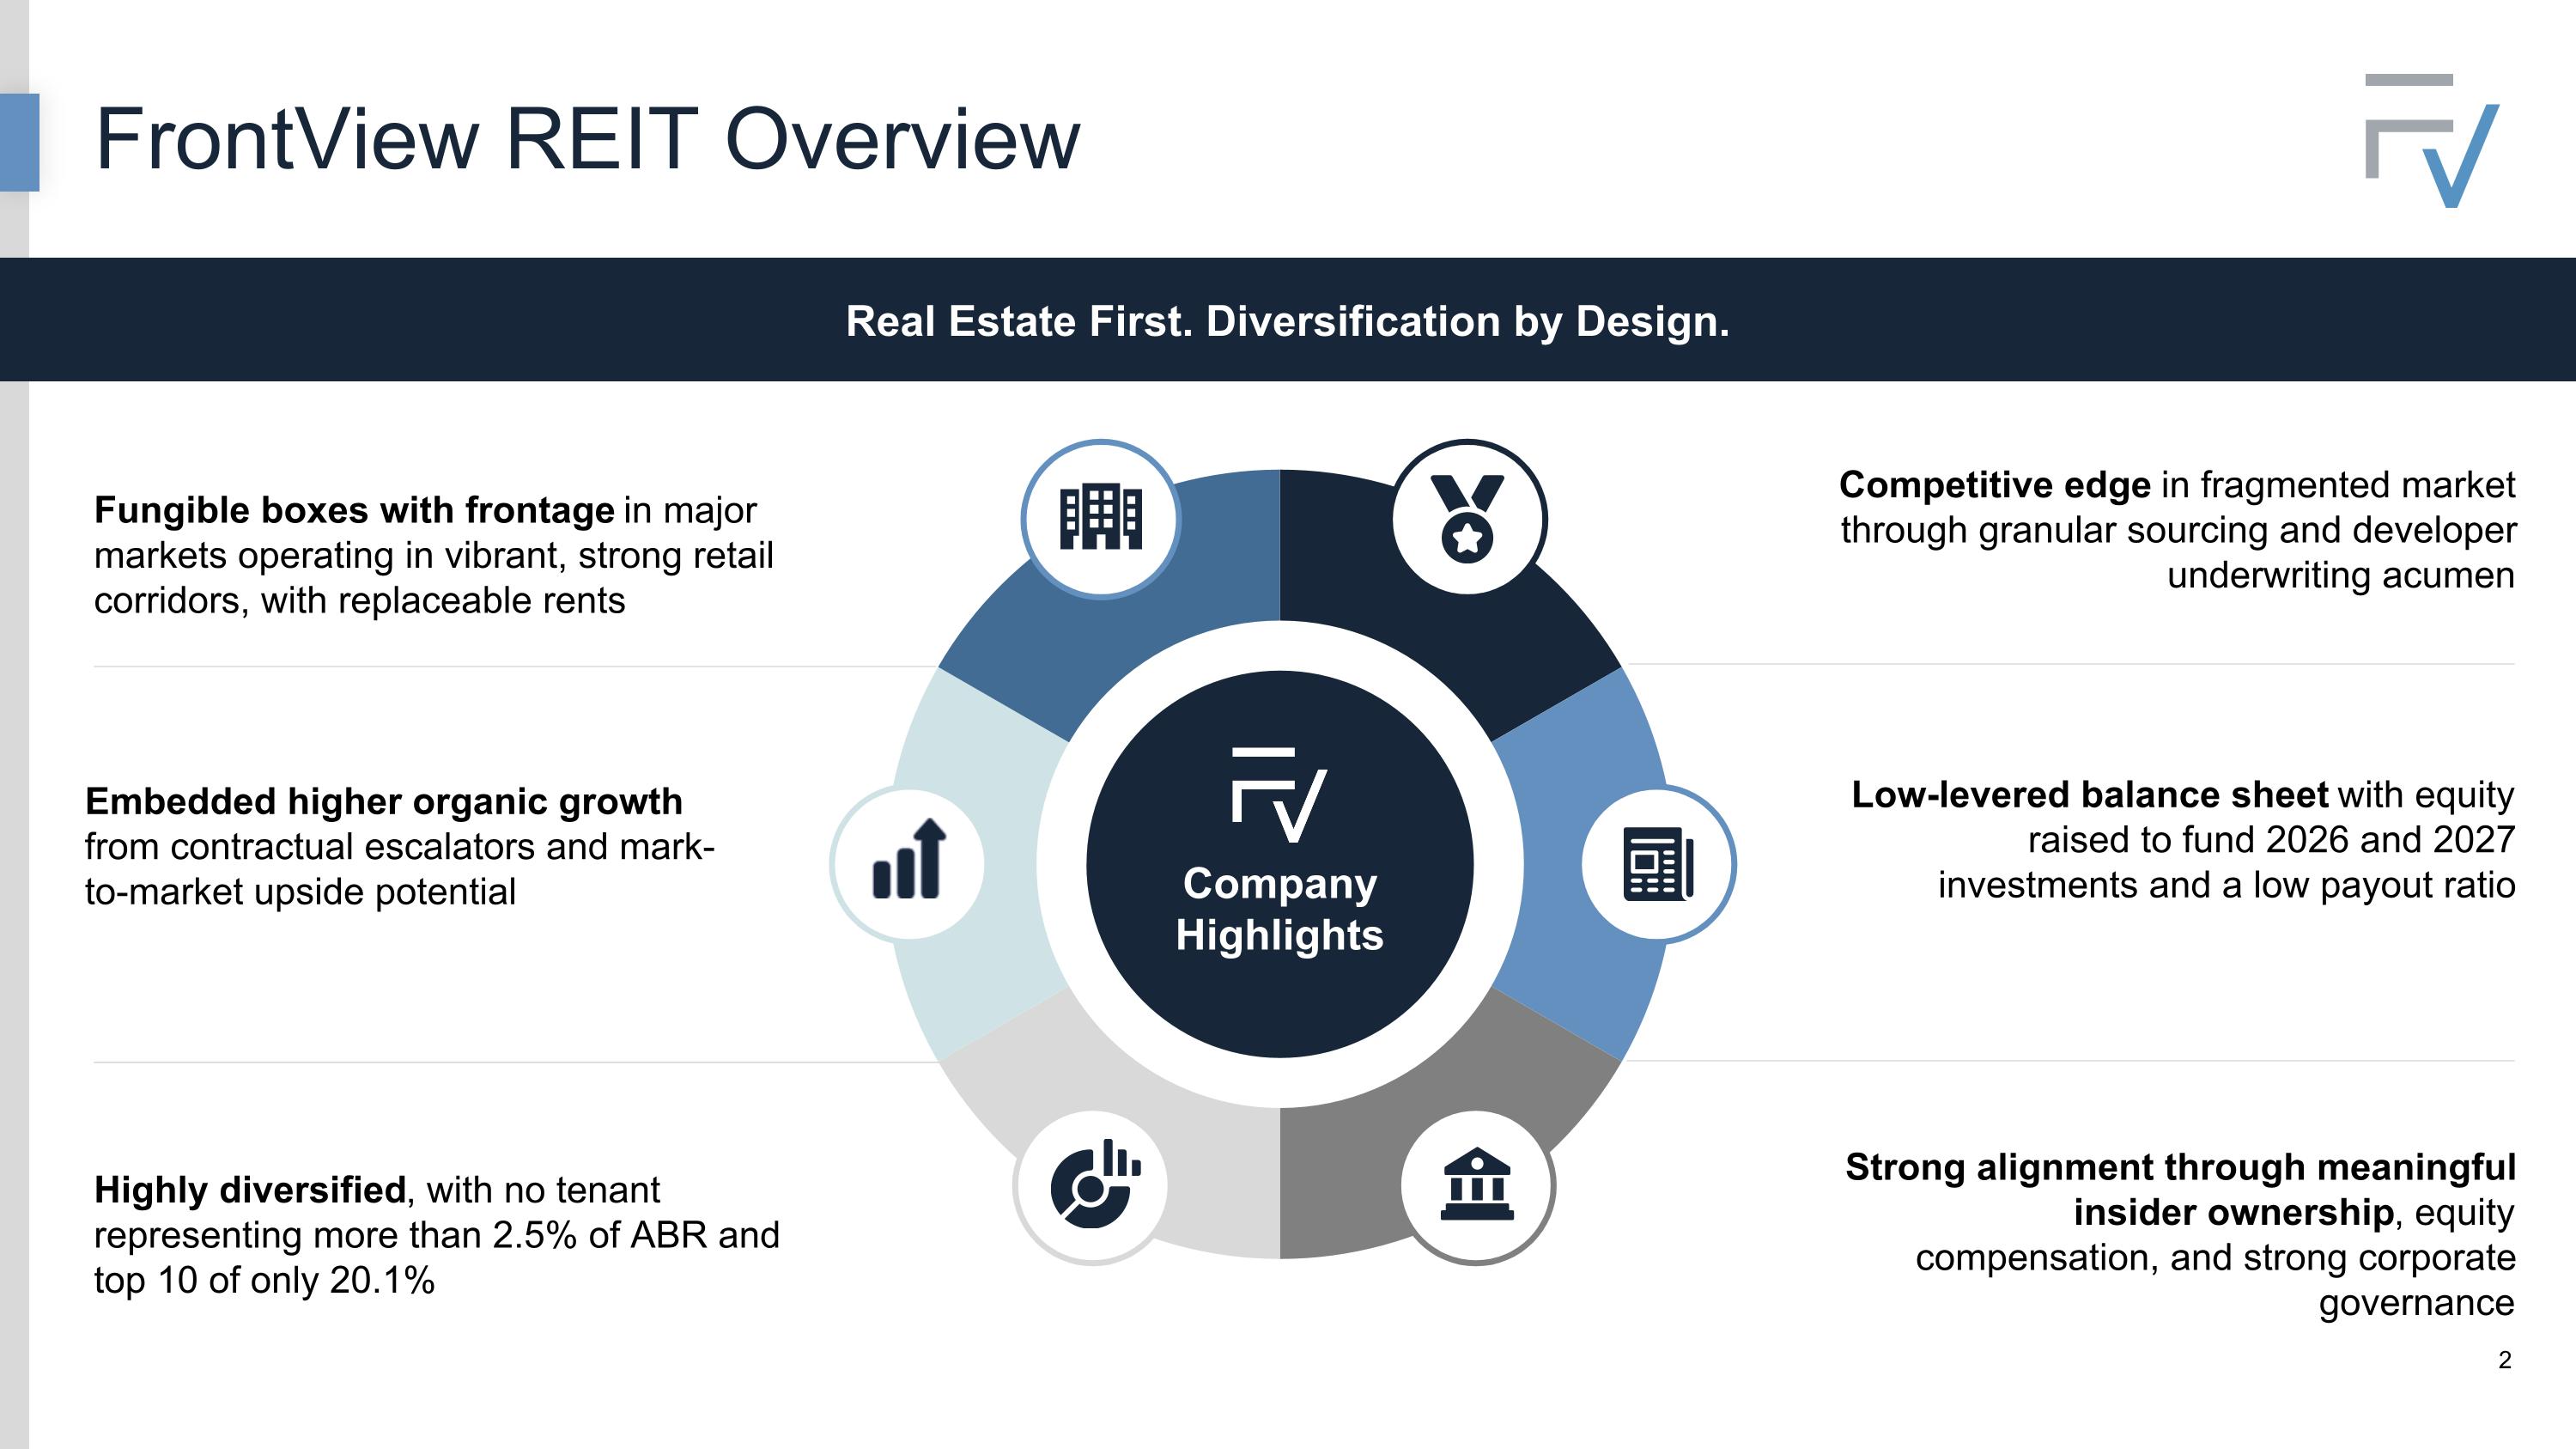
FrontView REIT Overview Fungible boxes with frontage in major markets operating in vibrant, strong retail corridors, with replaceable rents Embedded higher organic growth from contractual escalators and mark-to-market upside potential Highly diversified, with no tenant representing more than 2.5% of ABR and top 10 of only 20.1% Strong alignment through meaningful insider ownership, equity compensation, and strong corporate governance Competitive edge in fragmented market through granular sourcing and developer underwriting acumen Low-levered balance sheet with equity raised to fund 2026 and 2027 investments and a low payout ratio Real Estate First. Diversification by Design. Company Highlights
Q3 2026: Highlights and Opportunity 3 3 Optimized portfolio through capital recycling, enhancing diversification, real estate quality, tenant credit and WALT Q3 AFFO per share of $0.33; with Adj. Net Debt / Ann. Adj. EBITDAre of 4.5x, Net Debt / Ann. Adj. EBITDAre of 5.0x, Fixed Charge Coverage Ratio of 3.5x and Leverage Ratio of 30.6% 99.4% occupied with only two vacant properties; re-tenanted six properties with a 19.3% increase in rent Disciplined Execution Differentiated Portfolio Diversified tenant base, with the largest tenant at only 2.5% of ABR, top 10 at 20.1% and top 20 at 34.8% Highly desirable locations, with over 28K average daily traffic, top 27.5 Placer.ai score and 175K 5-mile population Structural Growth and Valuation Below market rents in sought-after locations drive better results Focus on growing market: top 100 MSAs increased to 79.2% from 78.5% Granular frontage portfolio, with median box size of 5,090 SQFT and median rent per box of $175,633 Discounted to NAV at 7.5% implied cap rate with low PEG ratio Scalable Platform that requires limited G&A to double the portfolio Smaller asset base with retained free cash flow and escalators drive higher structural growth Better outcomes: re-tenanting and dispositions showcase value of the underlying real estate
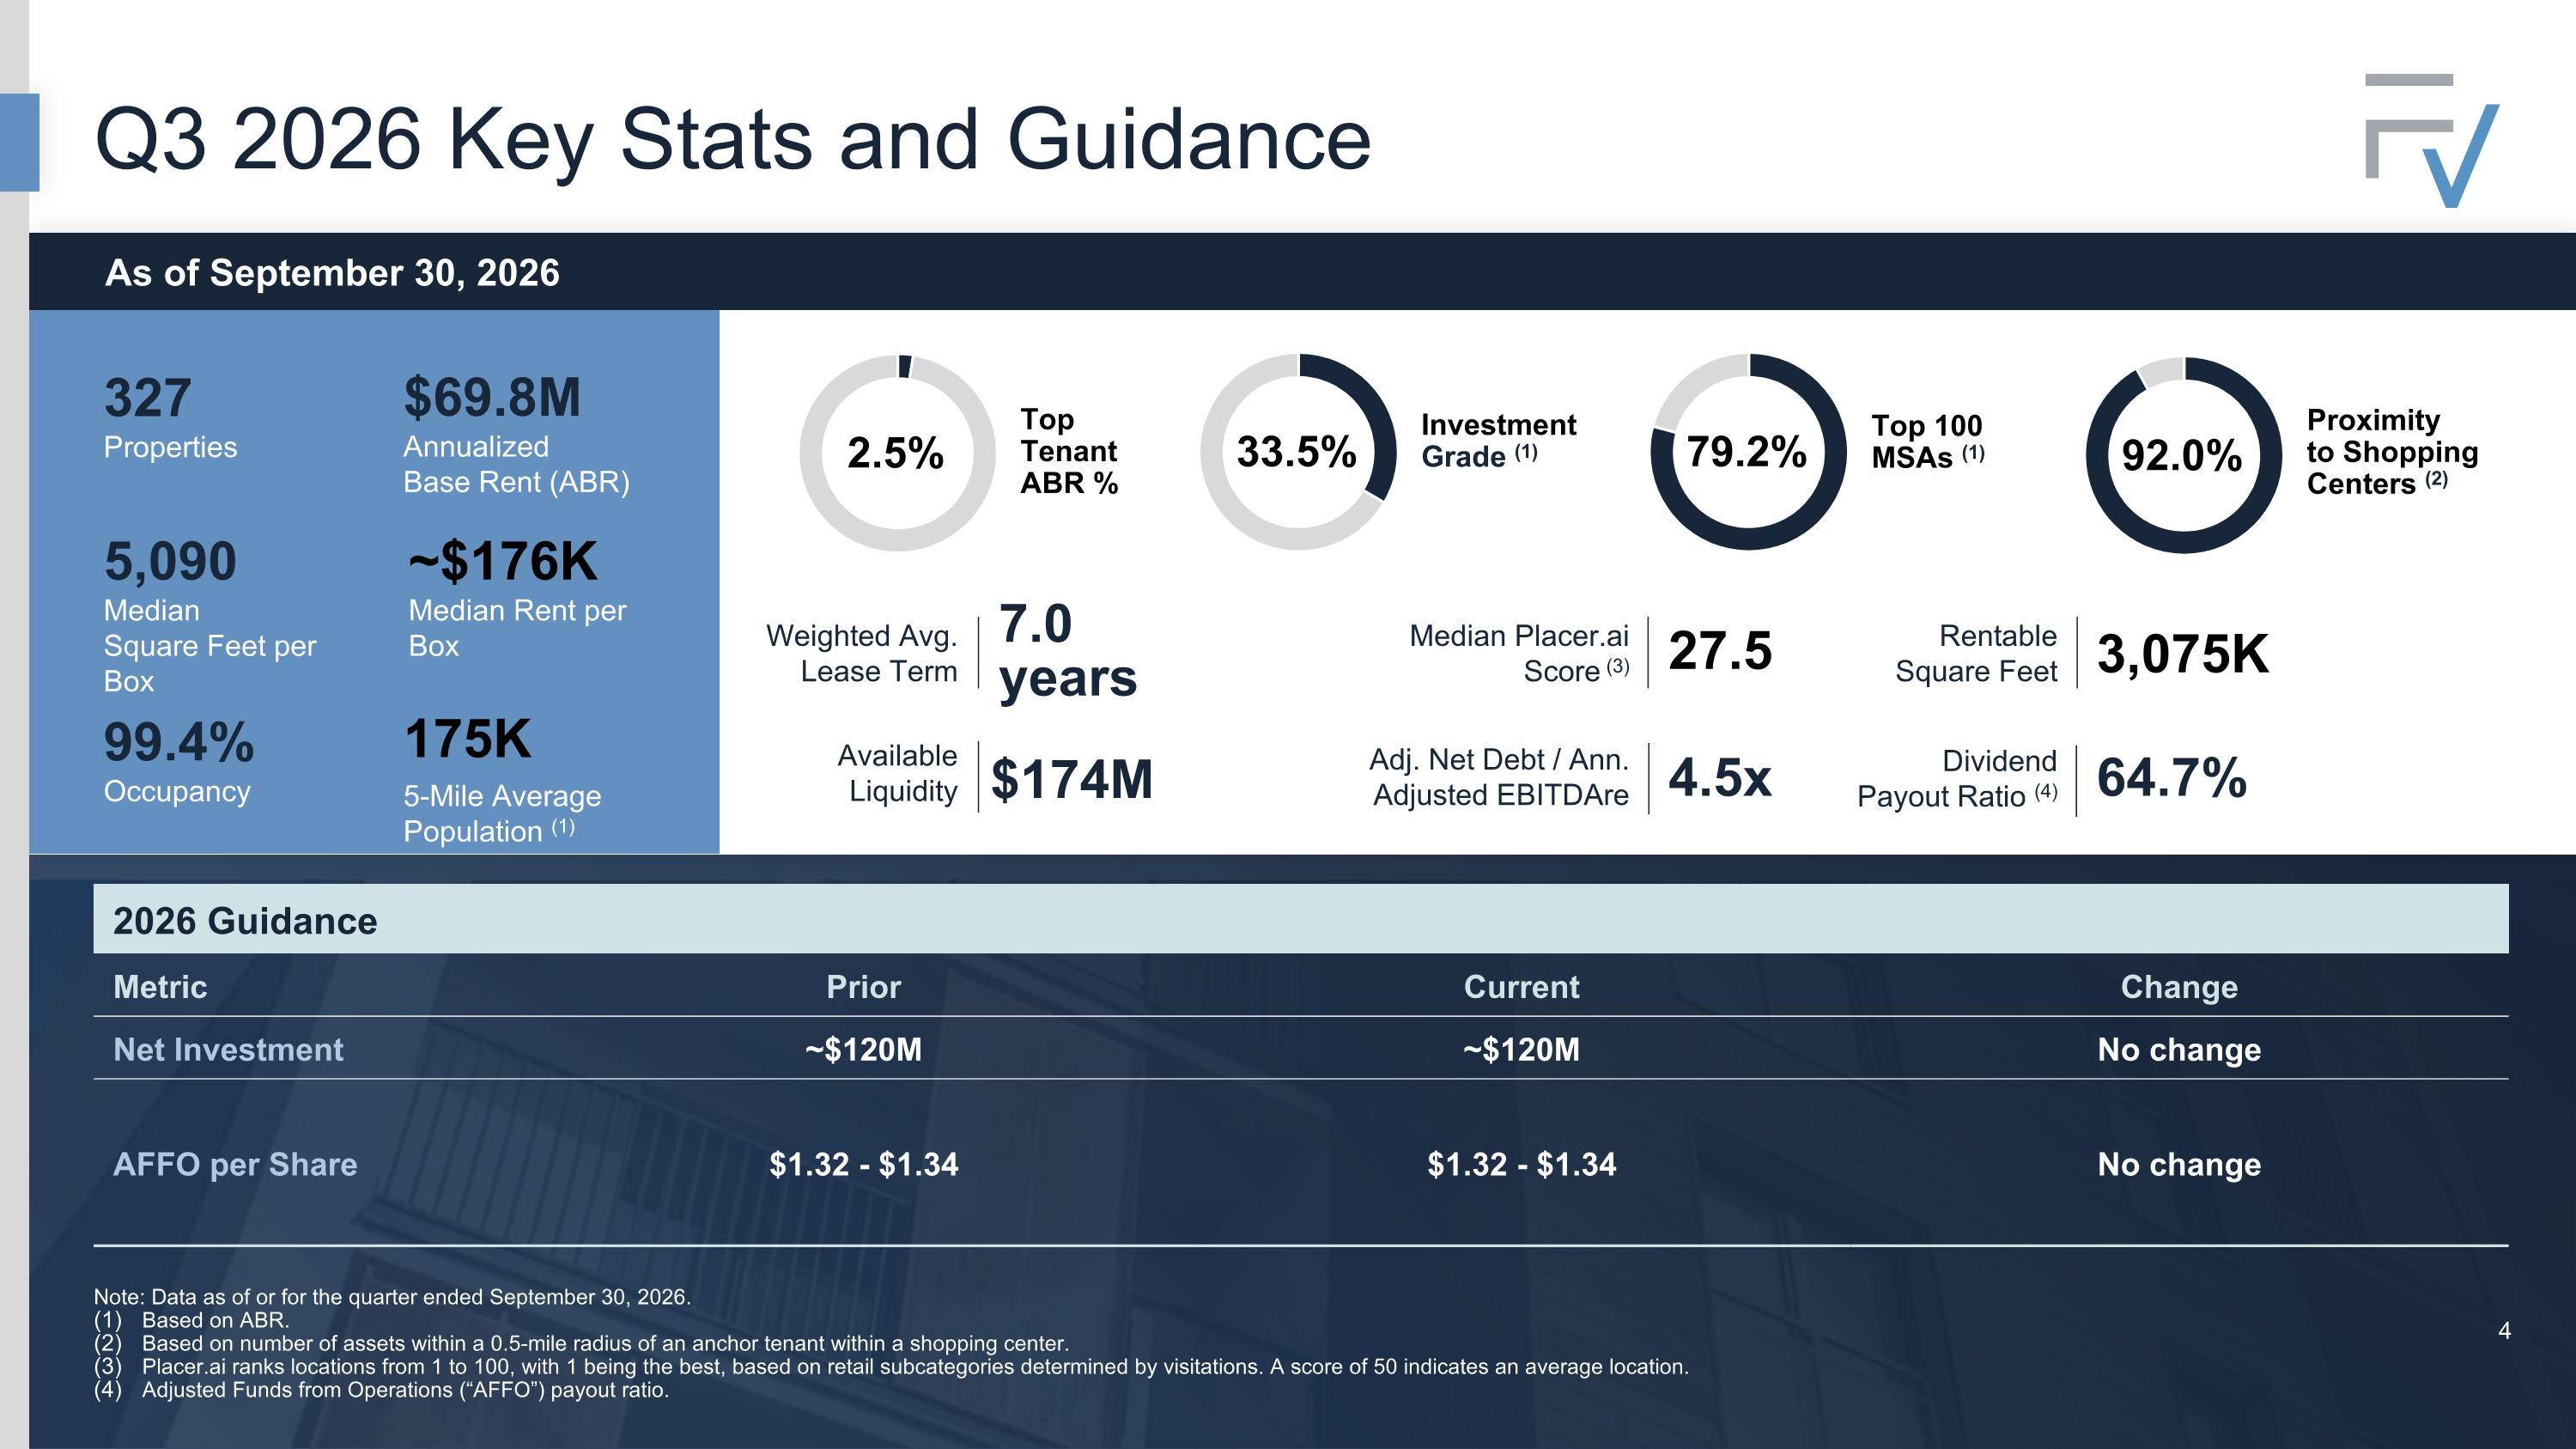
Q3 2026 Key Stats and Guidance 2026 Guidance Metric Prior Current Change Net Investment ~$120M ~$120M No change AFFO per Share $1.32 - $1.34 $1.32 - $1.34 No change As of September 30, 2026 Top Tenant ABR % 2.5% 5,090 Median Square Feet per Box $69.8M Annualized Base Rent (ABR) 99.4% Occupancy 327 Properties ~$176K Median Rent per Box 175K 5-Mile Average Population (1) Weighted Avg. Lease Term 7.0 years Available Liquidity $174M Dividend Payout Ratio (4) 64.7% Adj. Net Debt / Ann. Adjusted EBITDAre 4.5x Rentable Square Feet 3,075K Note: Data as of or for the quarter ended September 30, 2026. Based on ABR. Based on number of assets within a 0.5-mile radius of an anchor tenant within a shopping center. Placer.ai ranks locations from 1 to 100, with 1 being the best, based on retail subcategories determined by visitations. A score of 50 indicates an average location. Adjusted Funds from Operations (“AFFO”) payout ratio. Investment Grade (1) 33.5% Top 100 MSAs (1) 79.2% Median Placer.ai Score (3) 27.5 Proximity to Shopping Centers (2) 92.0% 4
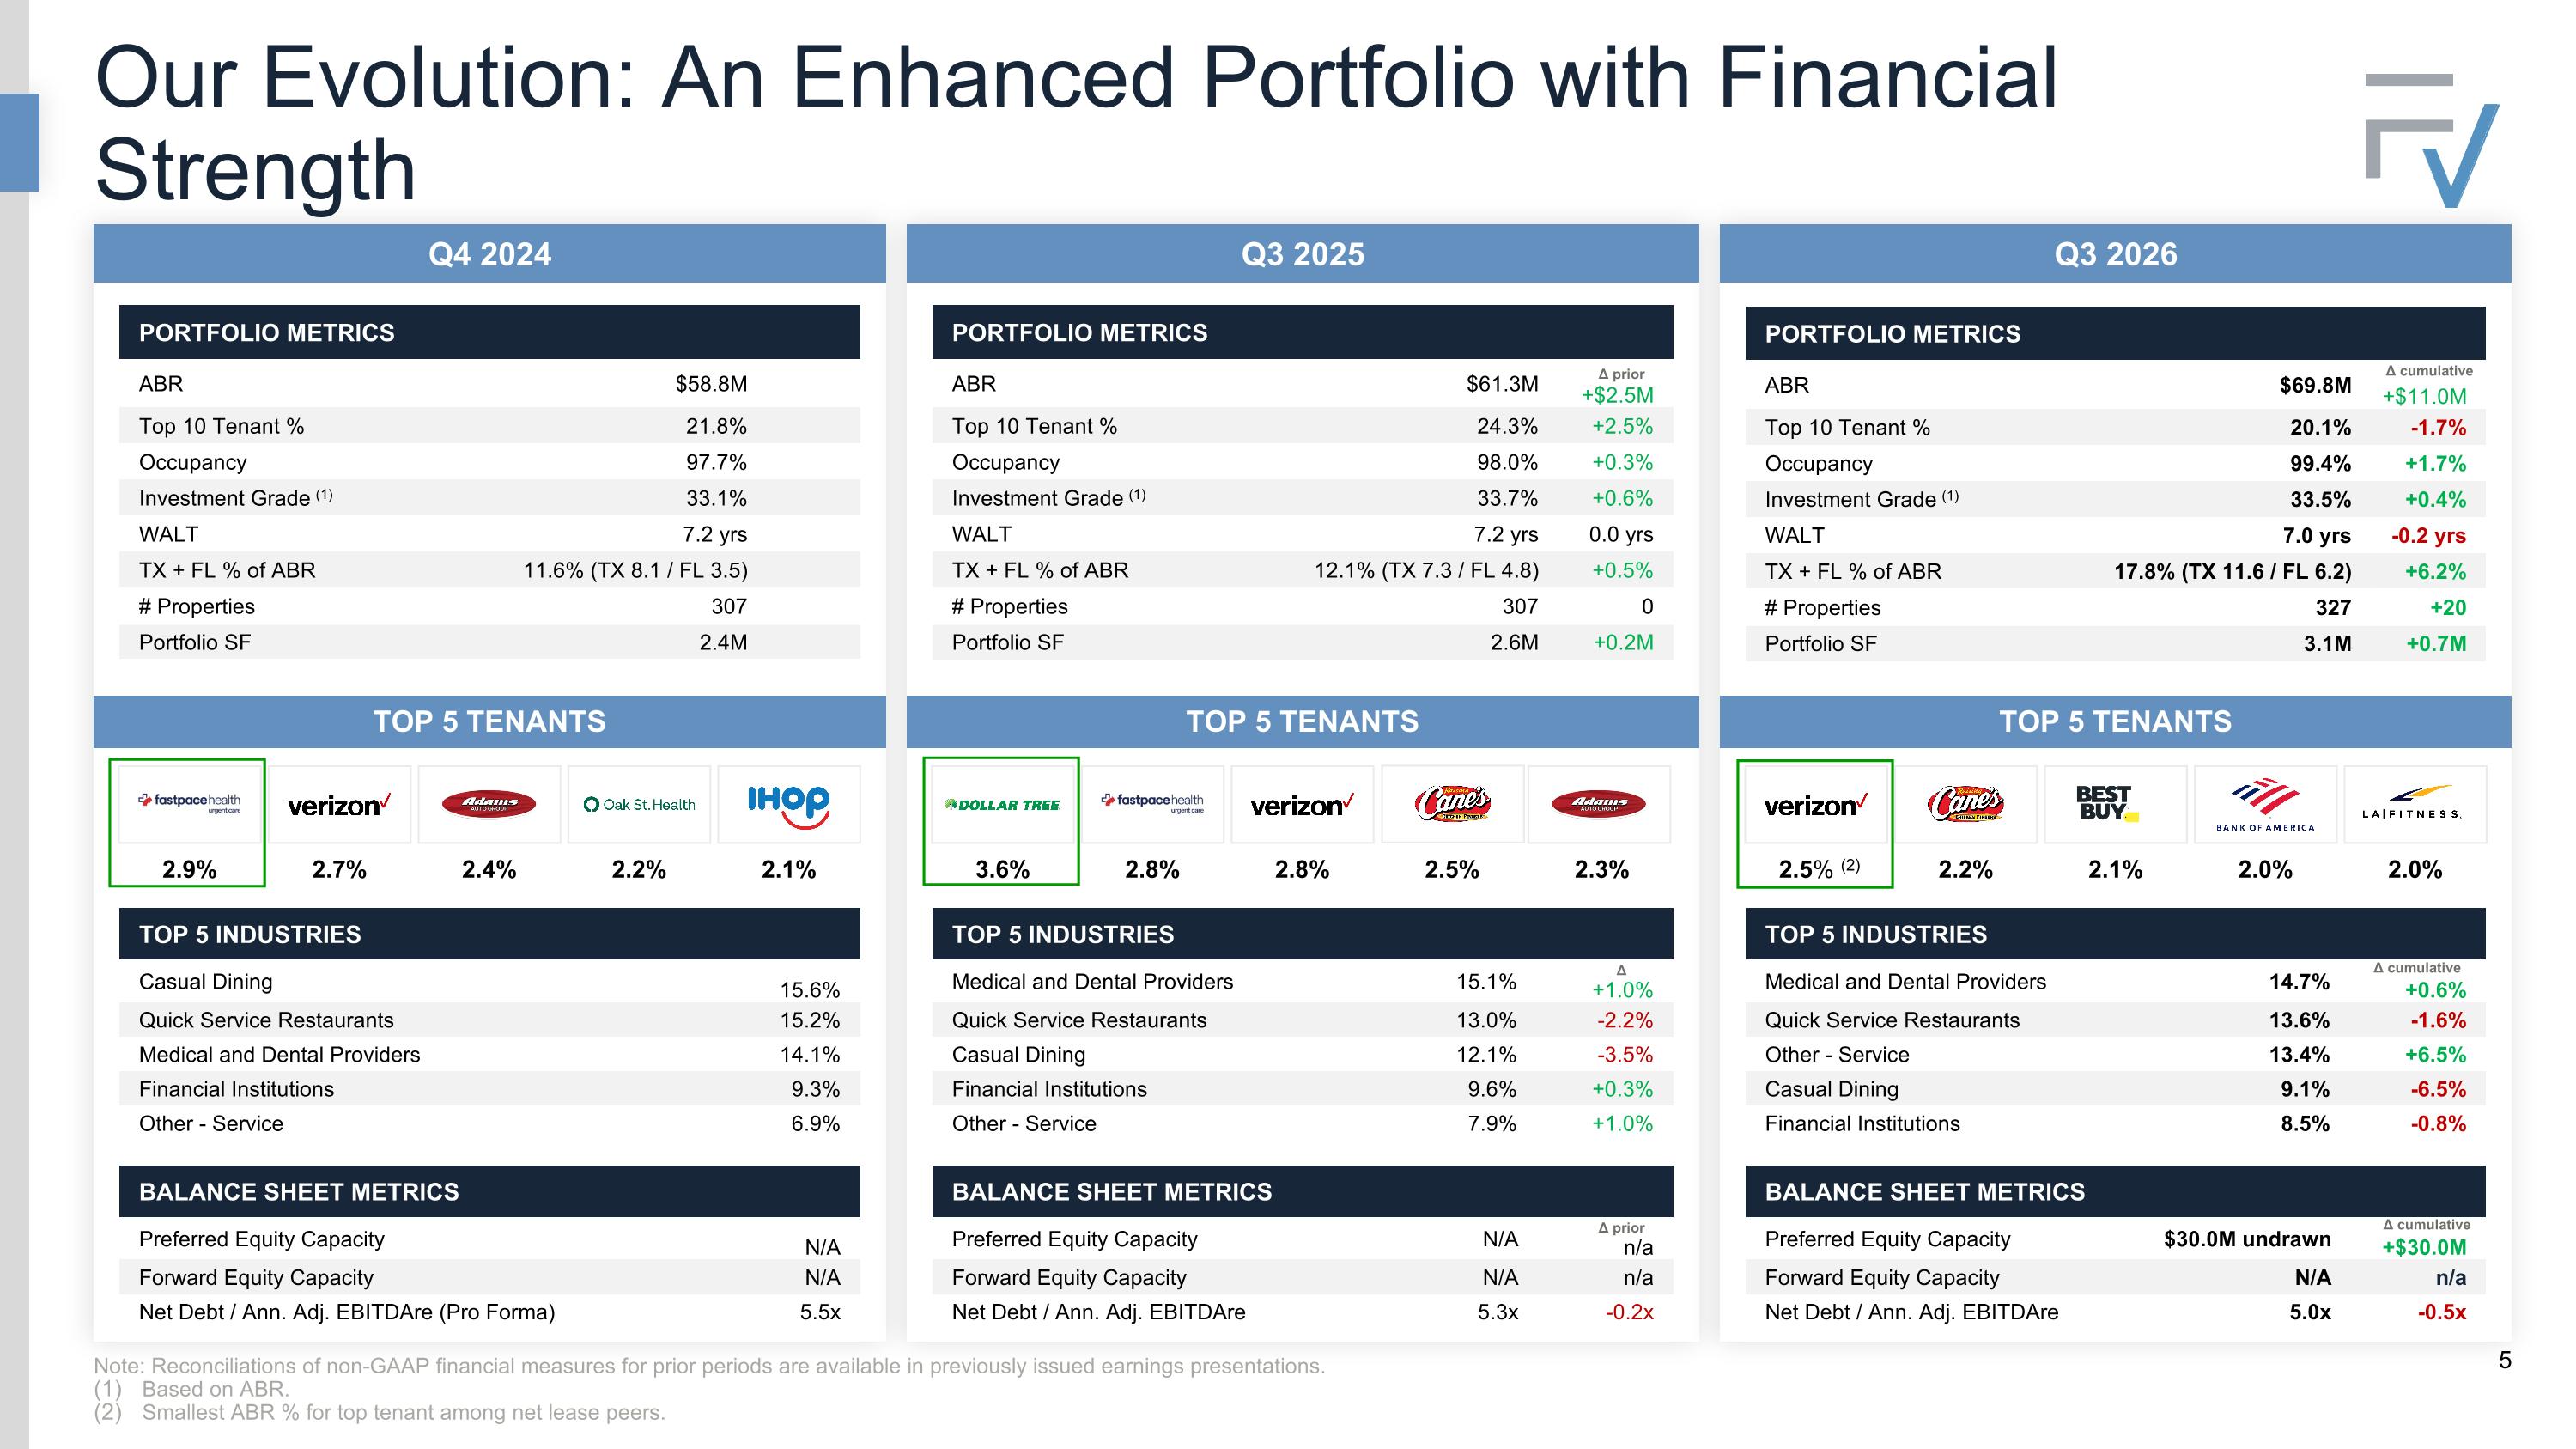
Q4 2024 Q3 2025 Q3 2026 PORTFOLIO METRICS ABR $58.8M Top 10 Tenant % 21.8% Occupancy 97.7% Investment Grade (1) 33.1% WALT 7.2 yrs TX + FL % of ABR 11.6% (TX 8.1 / FL 3.5) # Properties 307 Portfolio SF 2.4M TOP 5 TENANTS TOP 5 TENANTS TOP 5 TENANTS TOP 5 INDUSTRIES Casual Dining 15.6% Quick Service Restaurants 15.2% Medical and Dental Providers 14.1% Financial Institutions 9.3% Other - Service 6.9% BALANCE SHEET METRICS Preferred Equity Capacity N/A Forward Equity Capacity N/A Net Debt / Ann. Adj. EBITDAre (Pro Forma) 5.5x TOP 5 INDUSTRIES Medical and Dental Providers 15.1% +1.0% Quick Service Restaurants 13.0% -2.2% Casual Dining 12.1% -3.5% Financial Institutions 9.6% +0.3% Other - Service 7.9% +1.0% BALANCE SHEET METRICS Preferred Equity Capacity N/A n/a Forward Equity Capacity N/A n/a Net Debt / Ann. Adj. EBITDAre 5.3x -0.2x 2.7% 2.4% 2.2% 2.1% PORTFOLIO METRICS ABR $61.3M +$2.5M Top 10 Tenant % 24.3% +2.5% Occupancy 98.0% +0.3% Investment Grade (1) 33.7% +0.6% WALT 7.2 yrs 0.0 yrs TX + FL % of ABR 12.1% (TX 7.3 / FL 4.8) +0.5% # Properties 307 0 Portfolio SF 2.6M +0.2M Δ prior PORTFOLIO METRICS ABR $69.8M +$11.0M Top 10 Tenant % 20.1% -1.7% Occupancy 99.4% +1.7% Investment Grade (1) 33.5% +0.4% WALT 7.0 yrs -0.2 yrs TX + FL % of ABR 17.8% (TX 11.6 / FL 6.2) +6.2% # Properties 327 +20 Portfolio SF 3.1M +0.7M Δ cumulative 2.8% 2.8% 2.5% 2.3% 2.2% 2.1% 2.0% 2.0% Δ Δ prior TOP 5 INDUSTRIES Medical and Dental Providers 14.7% +0.6% Quick Service Restaurants 13.6% -1.6% Other - Service 13.4% +6.5% Casual Dining 9.1% -6.5% Financial Institutions 8.5% -0.8% BALANCE SHEET METRICS Preferred Equity Capacity $30.0M undrawn +$30.0M Forward Equity Capacity N/A n/a Net Debt / Ann. Adj. EBITDAre 5.0x -0.5x 2.9% 3.6% 2.5% (2) Note: Reconciliations of non-GAAP financial measures for prior periods are available in previously issued earnings presentations. Based on ABR. Smallest ABR % for top tenant among net lease peers. Δ cumulative Δ cumulative Our Evolution: An Enhanced Portfolio with Financial Strength
Value Creation
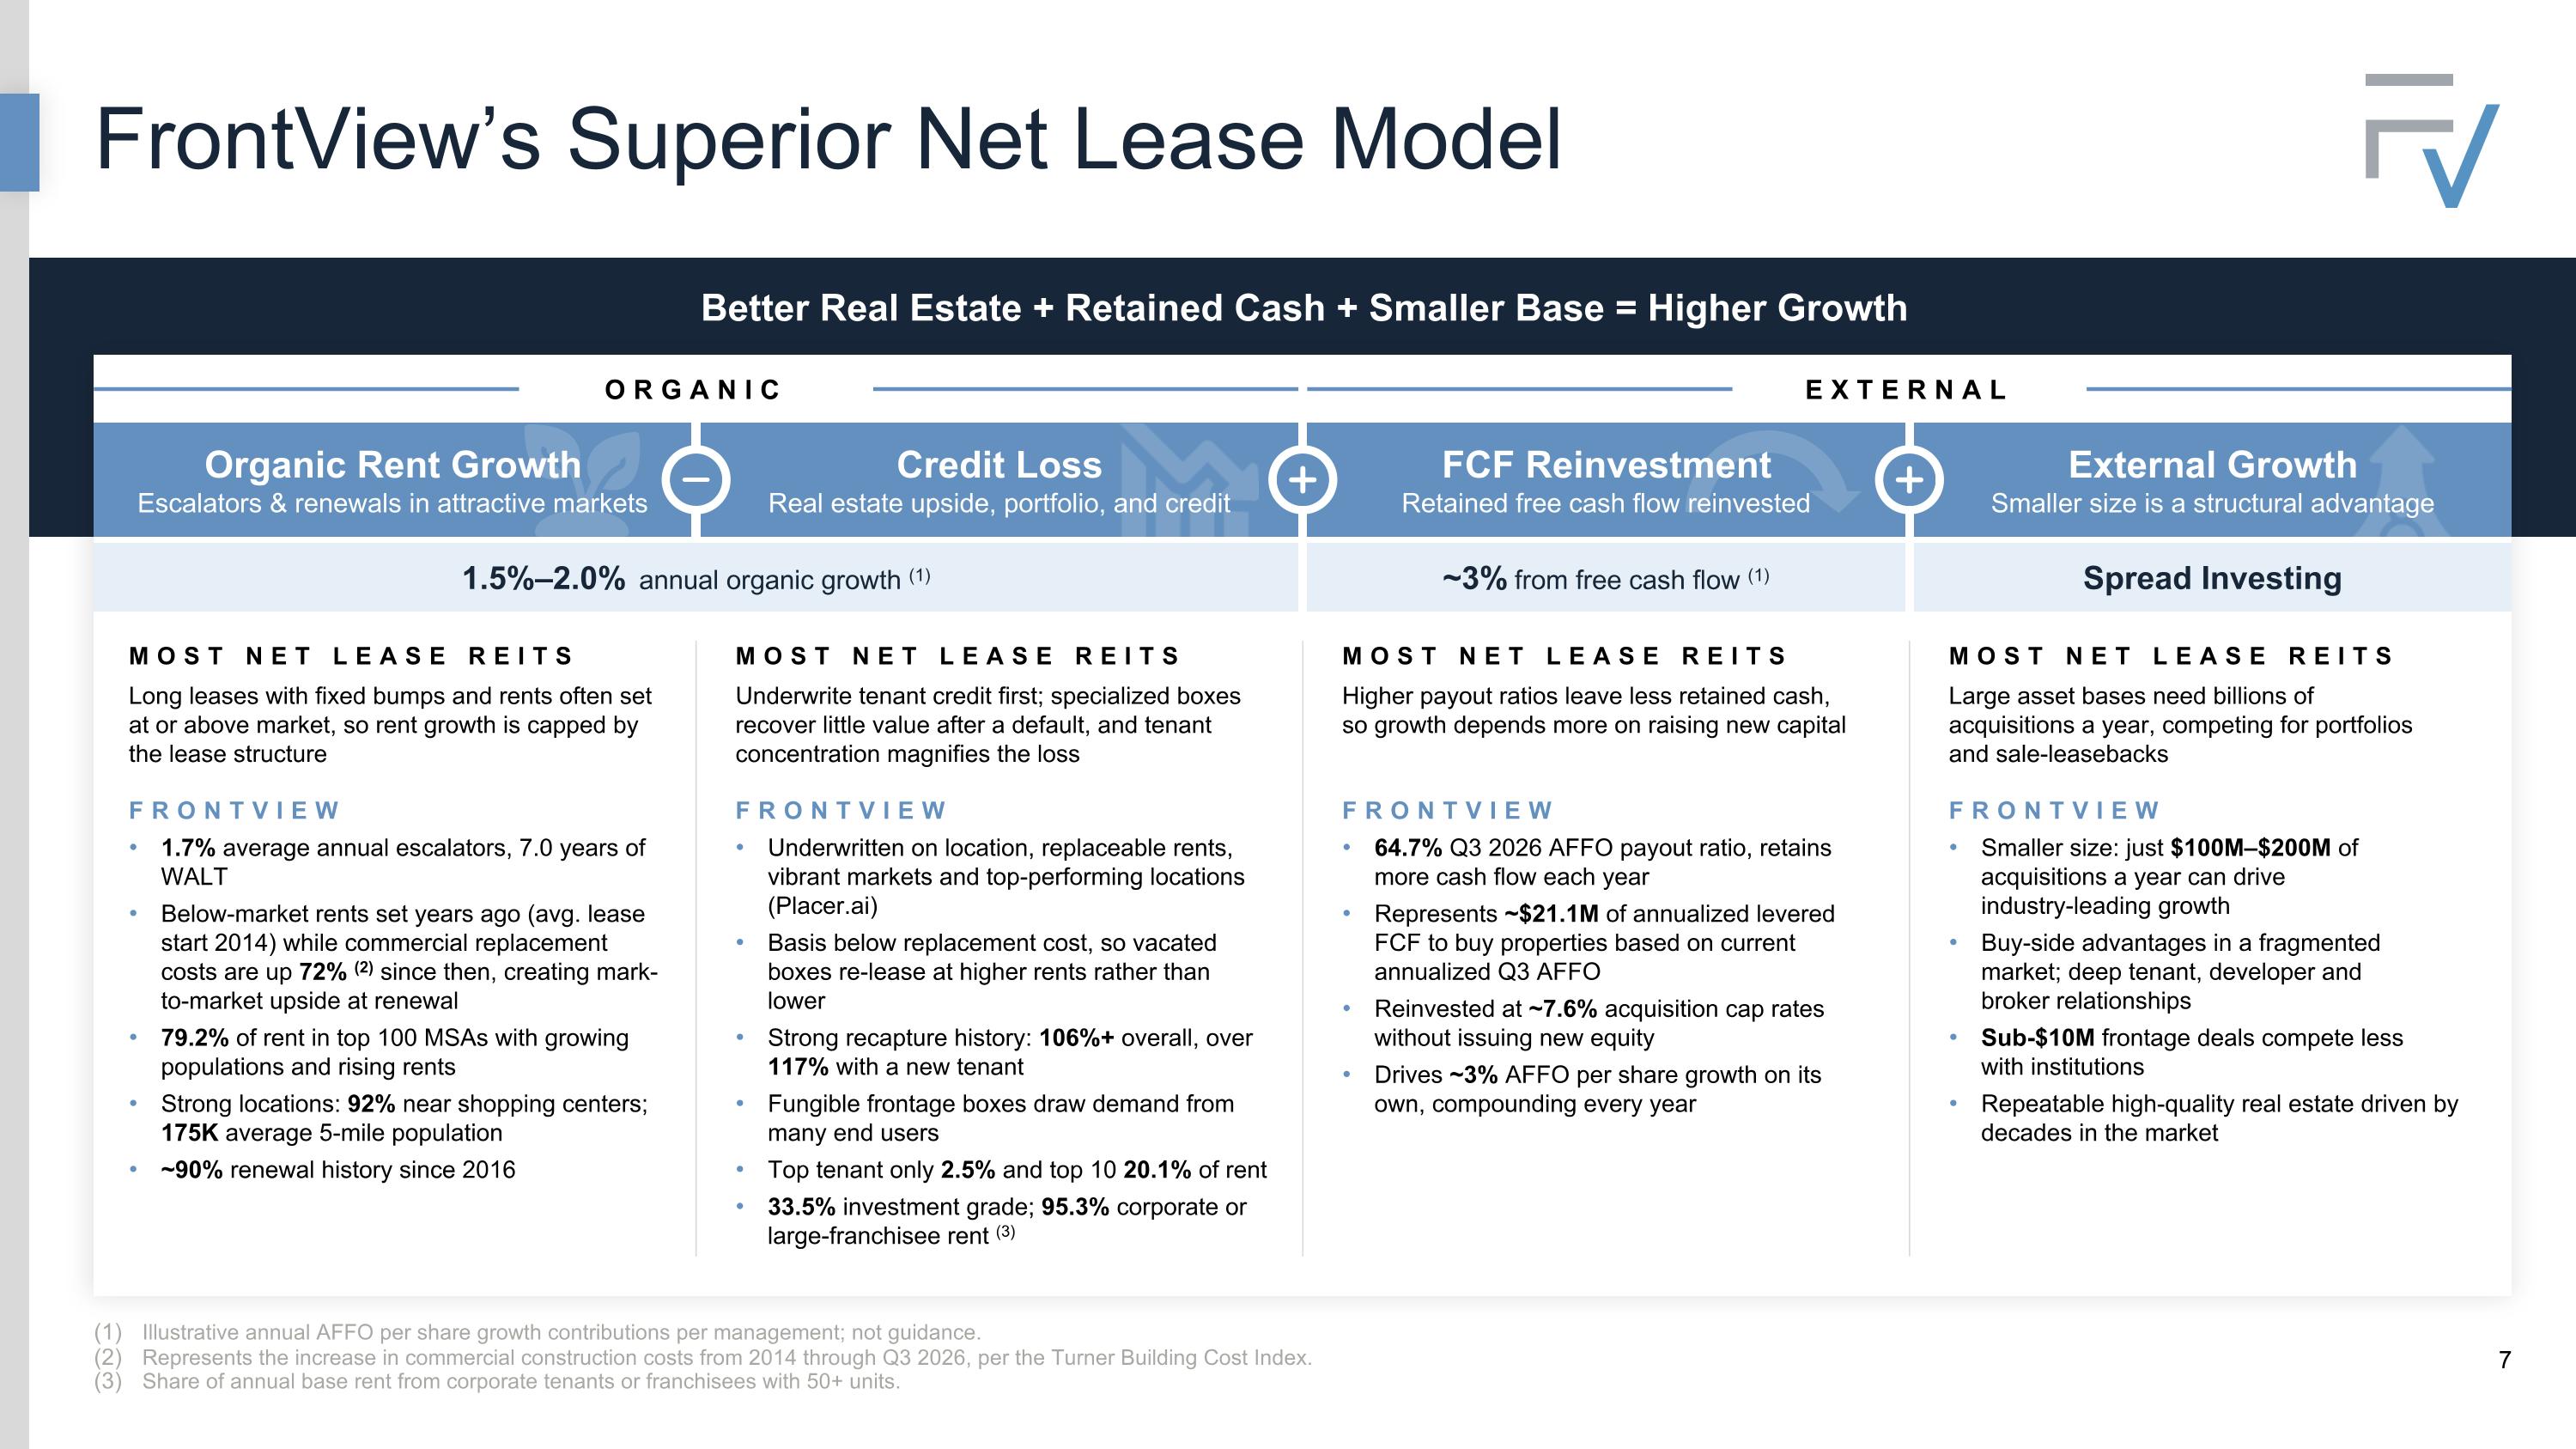
FrontView’s Superior Net Lease Model Better Real Estate + Retained Cash + Smaller Base = Higher Growth External Growth Smaller size is a structural advantage Organic Rent Growth Escalators & renewals in attractive markets Credit Loss Real estate upside, portfolio, and credit ORGANIC FCF Reinvestment Retained free cash flow reinvested EXTERNAL 1.5%–2.0% annual organic growth (1) ~3% from free cash flow (1) Spread Investing MOST NET LEASE REITS Long leases with fixed bumps and rents often set at or above market, so rent growth is capped by the lease structure MOST NET LEASE REITS Underwrite tenant credit first; specialized boxes recover little value after a default, and tenant concentration magnifies the loss MOST NET LEASE REITS Higher payout ratios leave less retained cash, so growth depends more on raising new capital MOST NET LEASE REITS Large asset bases need billions of acquisitions a year, competing for portfolios and sale-leasebacks FRONTVIEW 1.7% average annual escalators, 7.0 years of WALT Below-market rents set years ago (avg. lease start 2014) while commercial replacement costs are up 72% (2) since then, creating mark-to-market upside at renewal 79.2% of rent in top 100 MSAs with growing populations and rising rents Strong locations: 92% near shopping centers; 175K average 5-mile population ~90% renewal history since 2016 FRONTVIEW Underwritten on location, replaceable rents, vibrant markets and top-performing locations (Placer.ai) Basis below replacement cost, so vacated boxes re-lease at higher rents rather than lower Strong recapture history: 106%+ overall, over 117% with a new tenant Fungible frontage boxes draw demand from many end users Top tenant only 2.5% and top 10 20.1% of rent 33.5% investment grade; 95.3% corporate or large-franchisee rent (3) FRONTVIEW 64.7% Q3 2026 AFFO payout ratio, retains more cash flow each year Represents ~$21.1M of annualized levered FCF to buy properties based on current annualized Q3 AFFO Reinvested at ~7.6% acquisition cap rates without issuing new equity Drives ~3% AFFO per share growth on its own, compounding every year FRONTVIEW Smaller size: just $100M–$200M of acquisitions a year can drive industry-leading growth Buy-side advantages in a fragmented market; deep tenant, developer and broker relationships Sub-$10M frontage deals compete less with institutions Repeatable high-quality real estate driven by decades in the market Illustrative annual AFFO per share growth contributions per management; not guidance. Represents the increase in commercial construction costs from 2014 through Q3 2026, per the Turner Building Cost Index. Share of annual base rent from corporate tenants or franchisees with 50+ units.
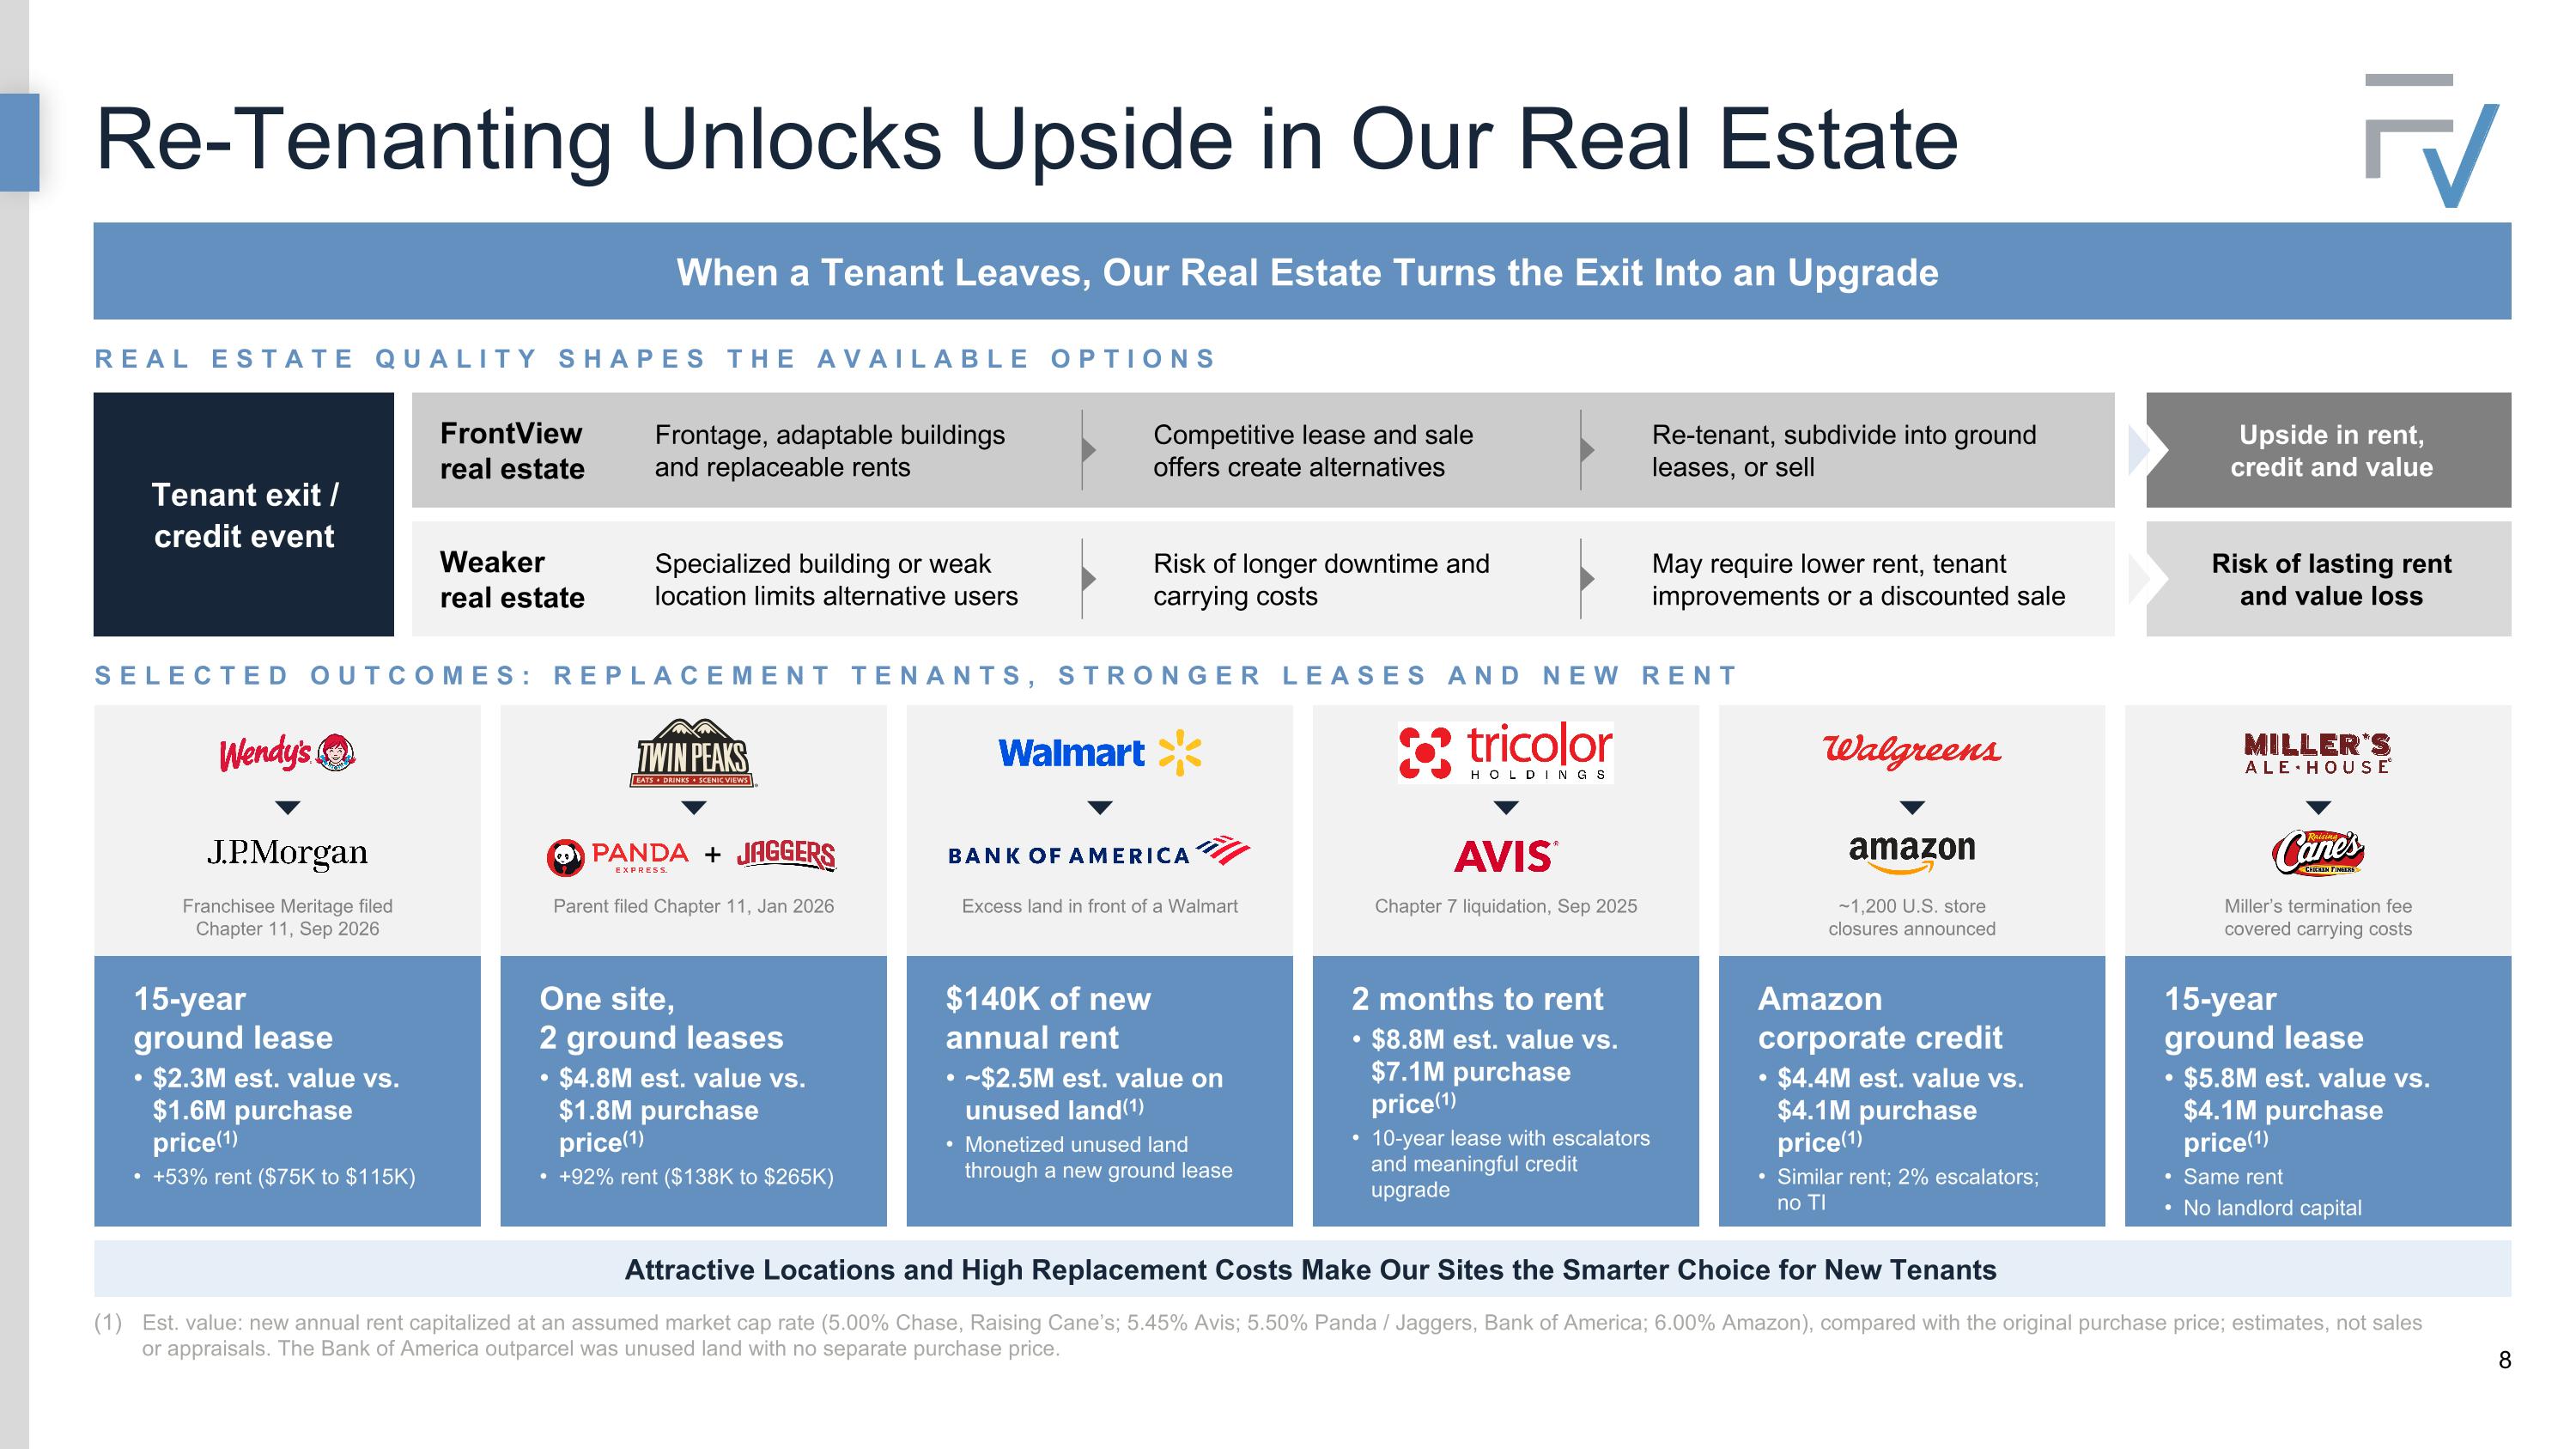
When a Tenant Leaves, Our Real Estate Turns the Exit Into an Upgrade Re-Tenanting Unlocks Upside in Our Real Estate Est. value: new annual rent capitalized at an assumed market cap rate (5.00% Chase, Raising Cane’s; 5.45% Avis; 5.50% Panda / Jaggers, Bank of America; 6.00% Amazon), compared with the original purchase price; estimates, not sales or appraisals. The Bank of America outparcel was unused land with no separate purchase price. REAL ESTATE QUALITY SHAPES THE AVAILABLE OPTIONS Risk of lasting rent and value loss Upside in rent, credit and value Tenant exit / credit event Weaker real estate FrontView real estate Specialized building or weak location limits alternative users Risk of longer downtime and carrying costs May require lower rent, tenant improvements or a discounted sale Frontage, adaptable buildings and replaceable rents Competitive lease and sale offers create alternatives Re-tenant, subdivide into ground leases, or sell SELECTED OUTCOMES: REPLACEMENT TENANTS, STRONGER LEASES AND NEW RENT Attractive Locations and High Replacement Costs Make Our Sites the Smarter Choice for New Tenants Franchisee Meritage filed Chapter 11, Sep 2026 Parent filed Chapter 11, Jan 2026 One site, 2 ground leases $4.8M est. value vs. $1.8M purchase price(1) +92% rent ($138K to $265K) 2 months to rent $8.8M est. value vs. $7.1M purchase price(1) 10-year lease with escalators and meaningful credit upgrade Amazon corporate credit $4.4M est. value vs. $4.1M purchase price(1) Similar rent; 2% escalators; no TI 15-year ground lease $5.8M est. value vs. $4.1M purchase price(1) Same rent No landlord capital $140K of new annual rent ~$2.5M est. value on unused land(1) Monetized unused land through a new ground lease 15-year ground lease $2.3M est. value vs. $1.6M purchase price(1) +53% rent ($75K to $115K) Chapter 7 liquidation, Sep 2025 ~1,200 U.S. store closures announced Miller’s termination fee covered carrying costs Excess land in front of a Walmart +
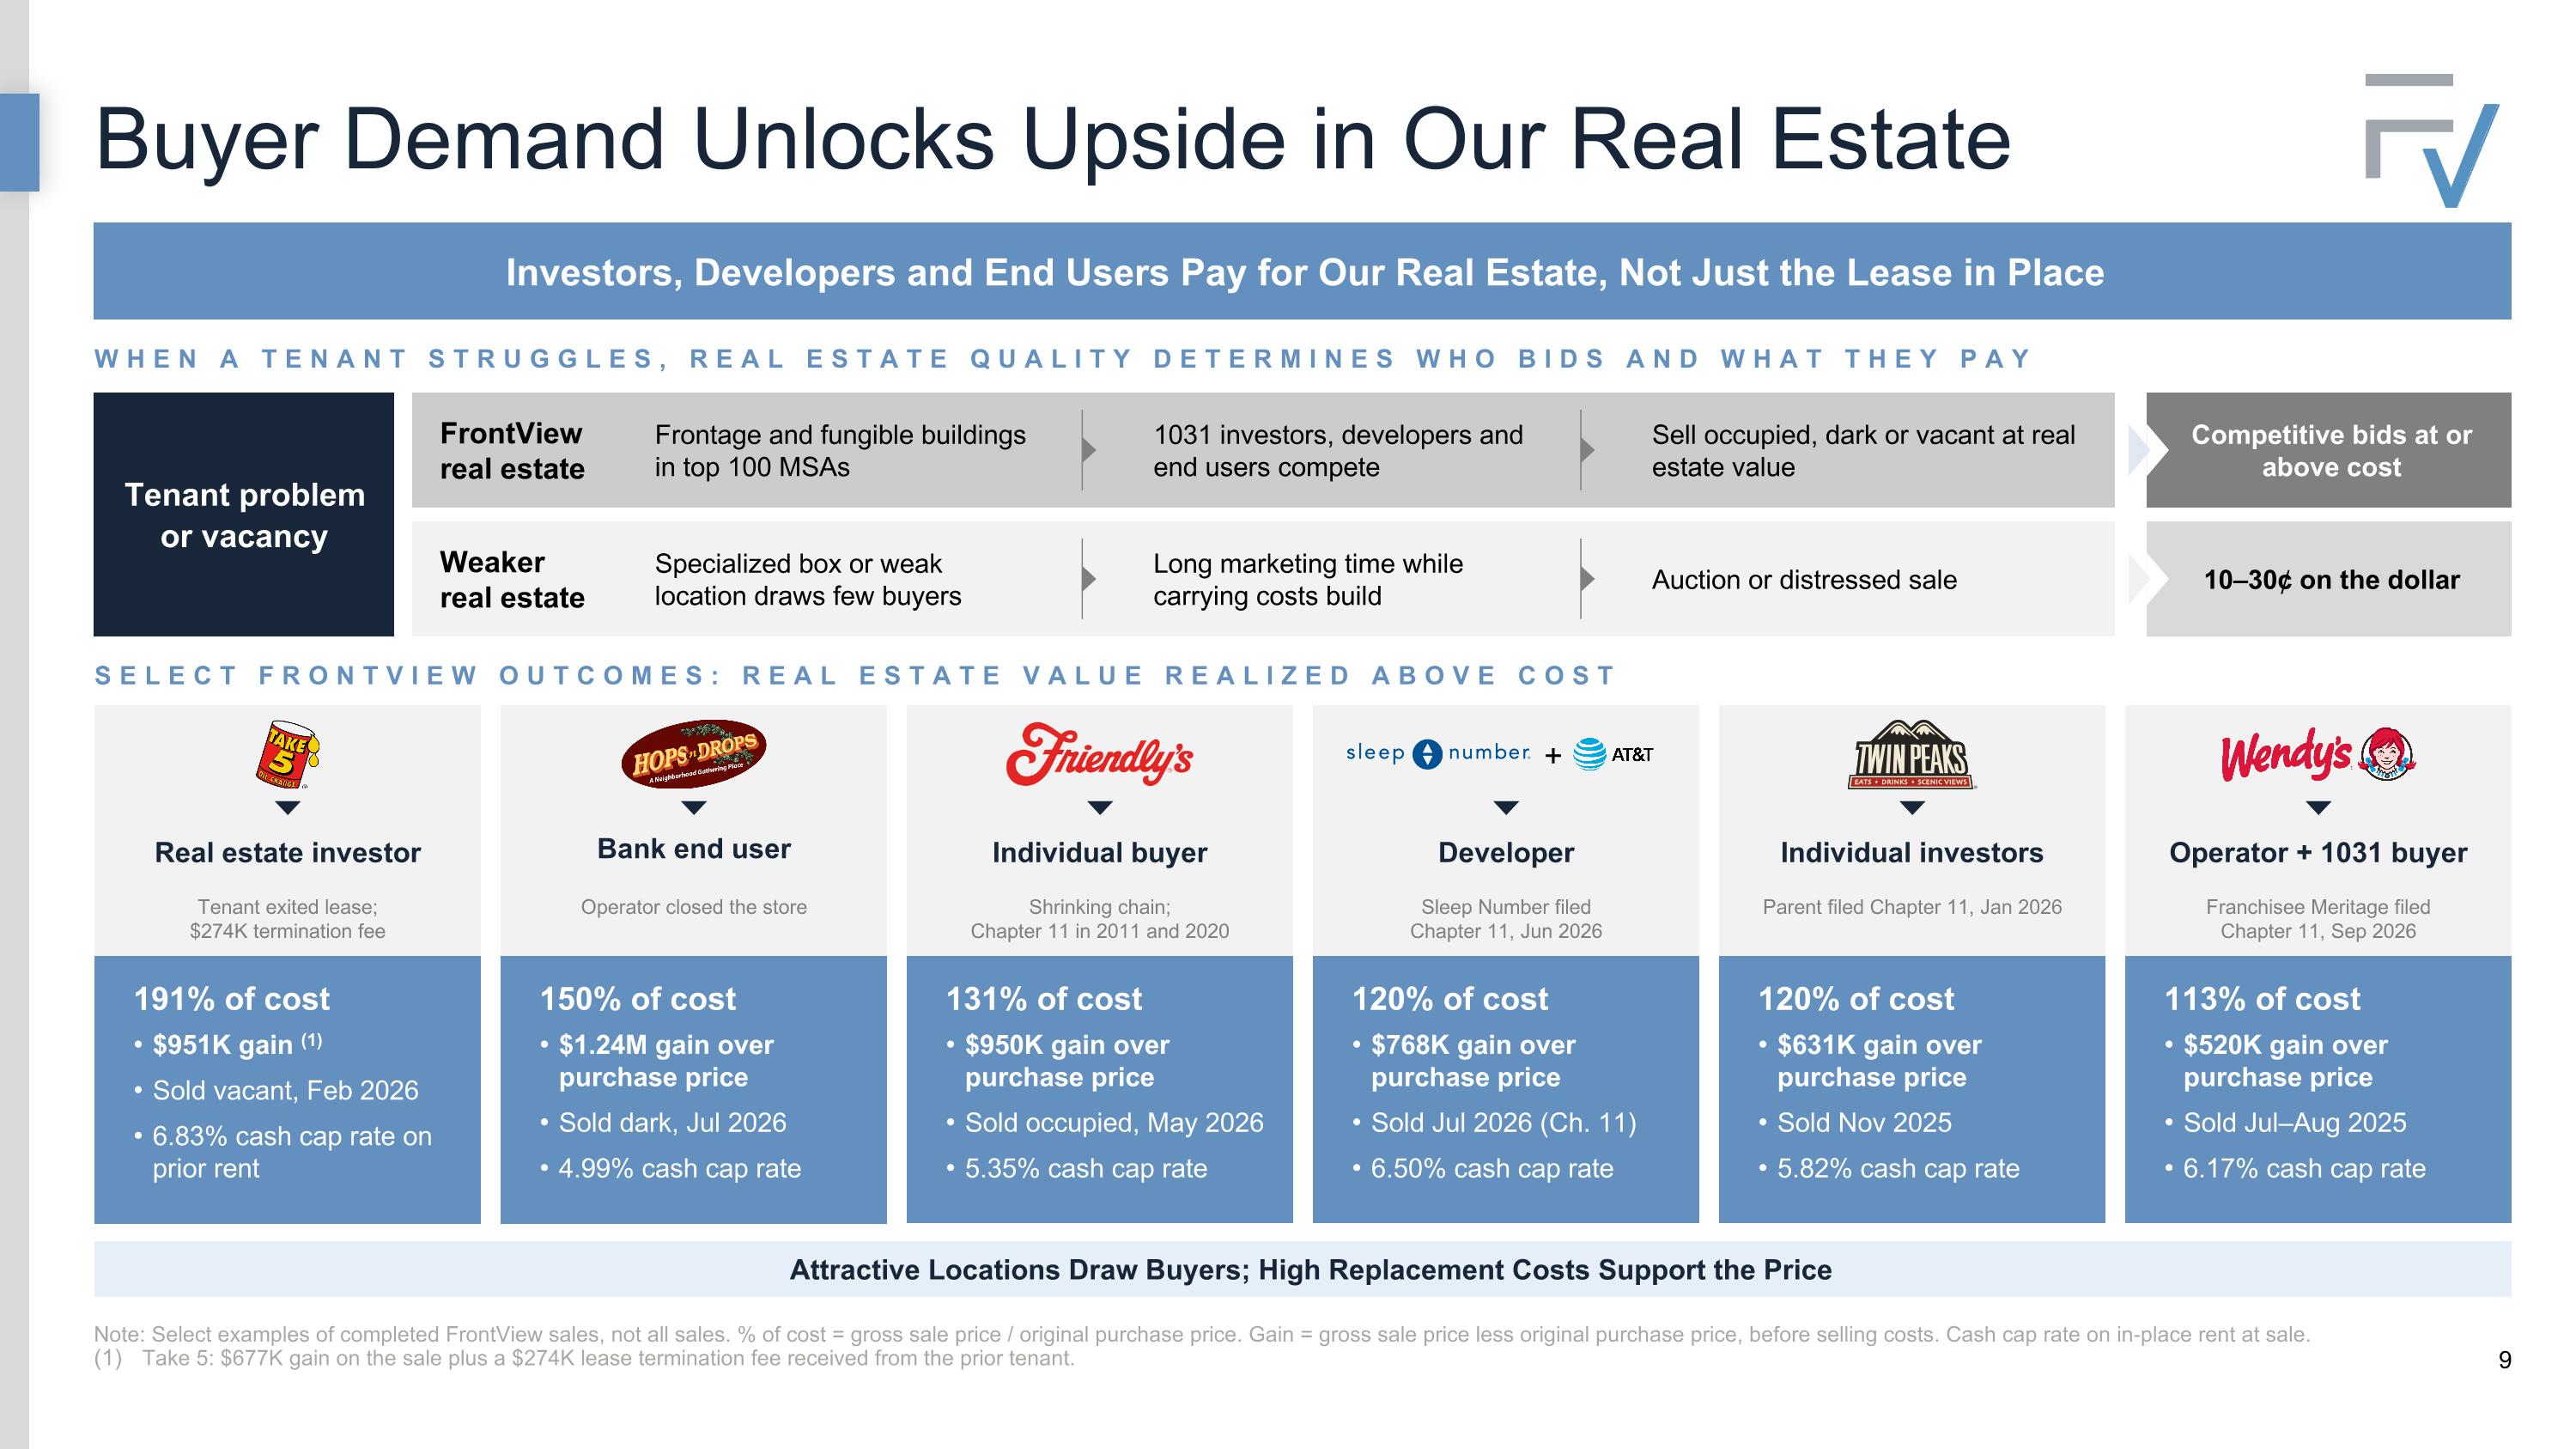
Investors, Developers and End Users Pay for Our Real Estate, Not Just the Lease in Place Buyer Demand Unlocks Upside in Our Real Estate Note: Select examples of completed FrontView sales, not all sales. % of cost = gross sale price / original purchase price. Gain = gross sale price less original purchase price, before selling costs. Cash cap rate on in-place rent at sale. Take 5: $677K gain on the sale plus a $274K lease termination fee received from the prior tenant. WHEN A TENANT STRUGGLES, REAL ESTATE QUALITY DETERMINES WHO BIDS AND WHAT THEY PAY 10–30¢ on the dollar Competitive bids at or above cost Tenant problem or vacancy Weaker real estate FrontView real estate Specialized box or weak location draws few buyers Long marketing time while carrying costs build Auction or distressed sale Frontage and fungible buildings in top 100 MSAs 1031 investors, developers and end users compete Sell occupied, dark or vacant at real estate value SELECT FRONTVIEW OUTCOMES: REAL ESTATE VALUE REALIZED ABOVE COST 150% of cost $1.24M gain over purchase price Sold dark, Jul 2026 4.99% cash cap rate 131% of cost $950K gain over purchase price Sold occupied, May 2026 5.35% cash cap rate 120% of cost $768K gain over purchase price Sold Jul 2026 (Ch. 11) 6.50% cash cap rate 120% of cost $631K gain over purchase price Sold Nov 2025 5.82% cash cap rate 113% of cost $520K gain over purchase price Sold Jul–Aug 2025 6.17% cash cap rate 191% of cost $951K gain (1) Sold vacant, Feb 2026 6.83% cash cap rate on prior rent Real estate investor Tenant exited lease; $274K termination fee Bank end user Operator closed the store Individual buyer Shrinking chain; Chapter 11 in 2011 and 2020 Developer Sleep Number filed Chapter 11, Jun 2026 Individual investors Parent filed Chapter 11, Jan 2026 Operator + 1031 buyer Franchisee Meritage filed Chapter 11, Sep 2026 + Attractive Locations Draw Buyers; High Replacement Costs Support the Price
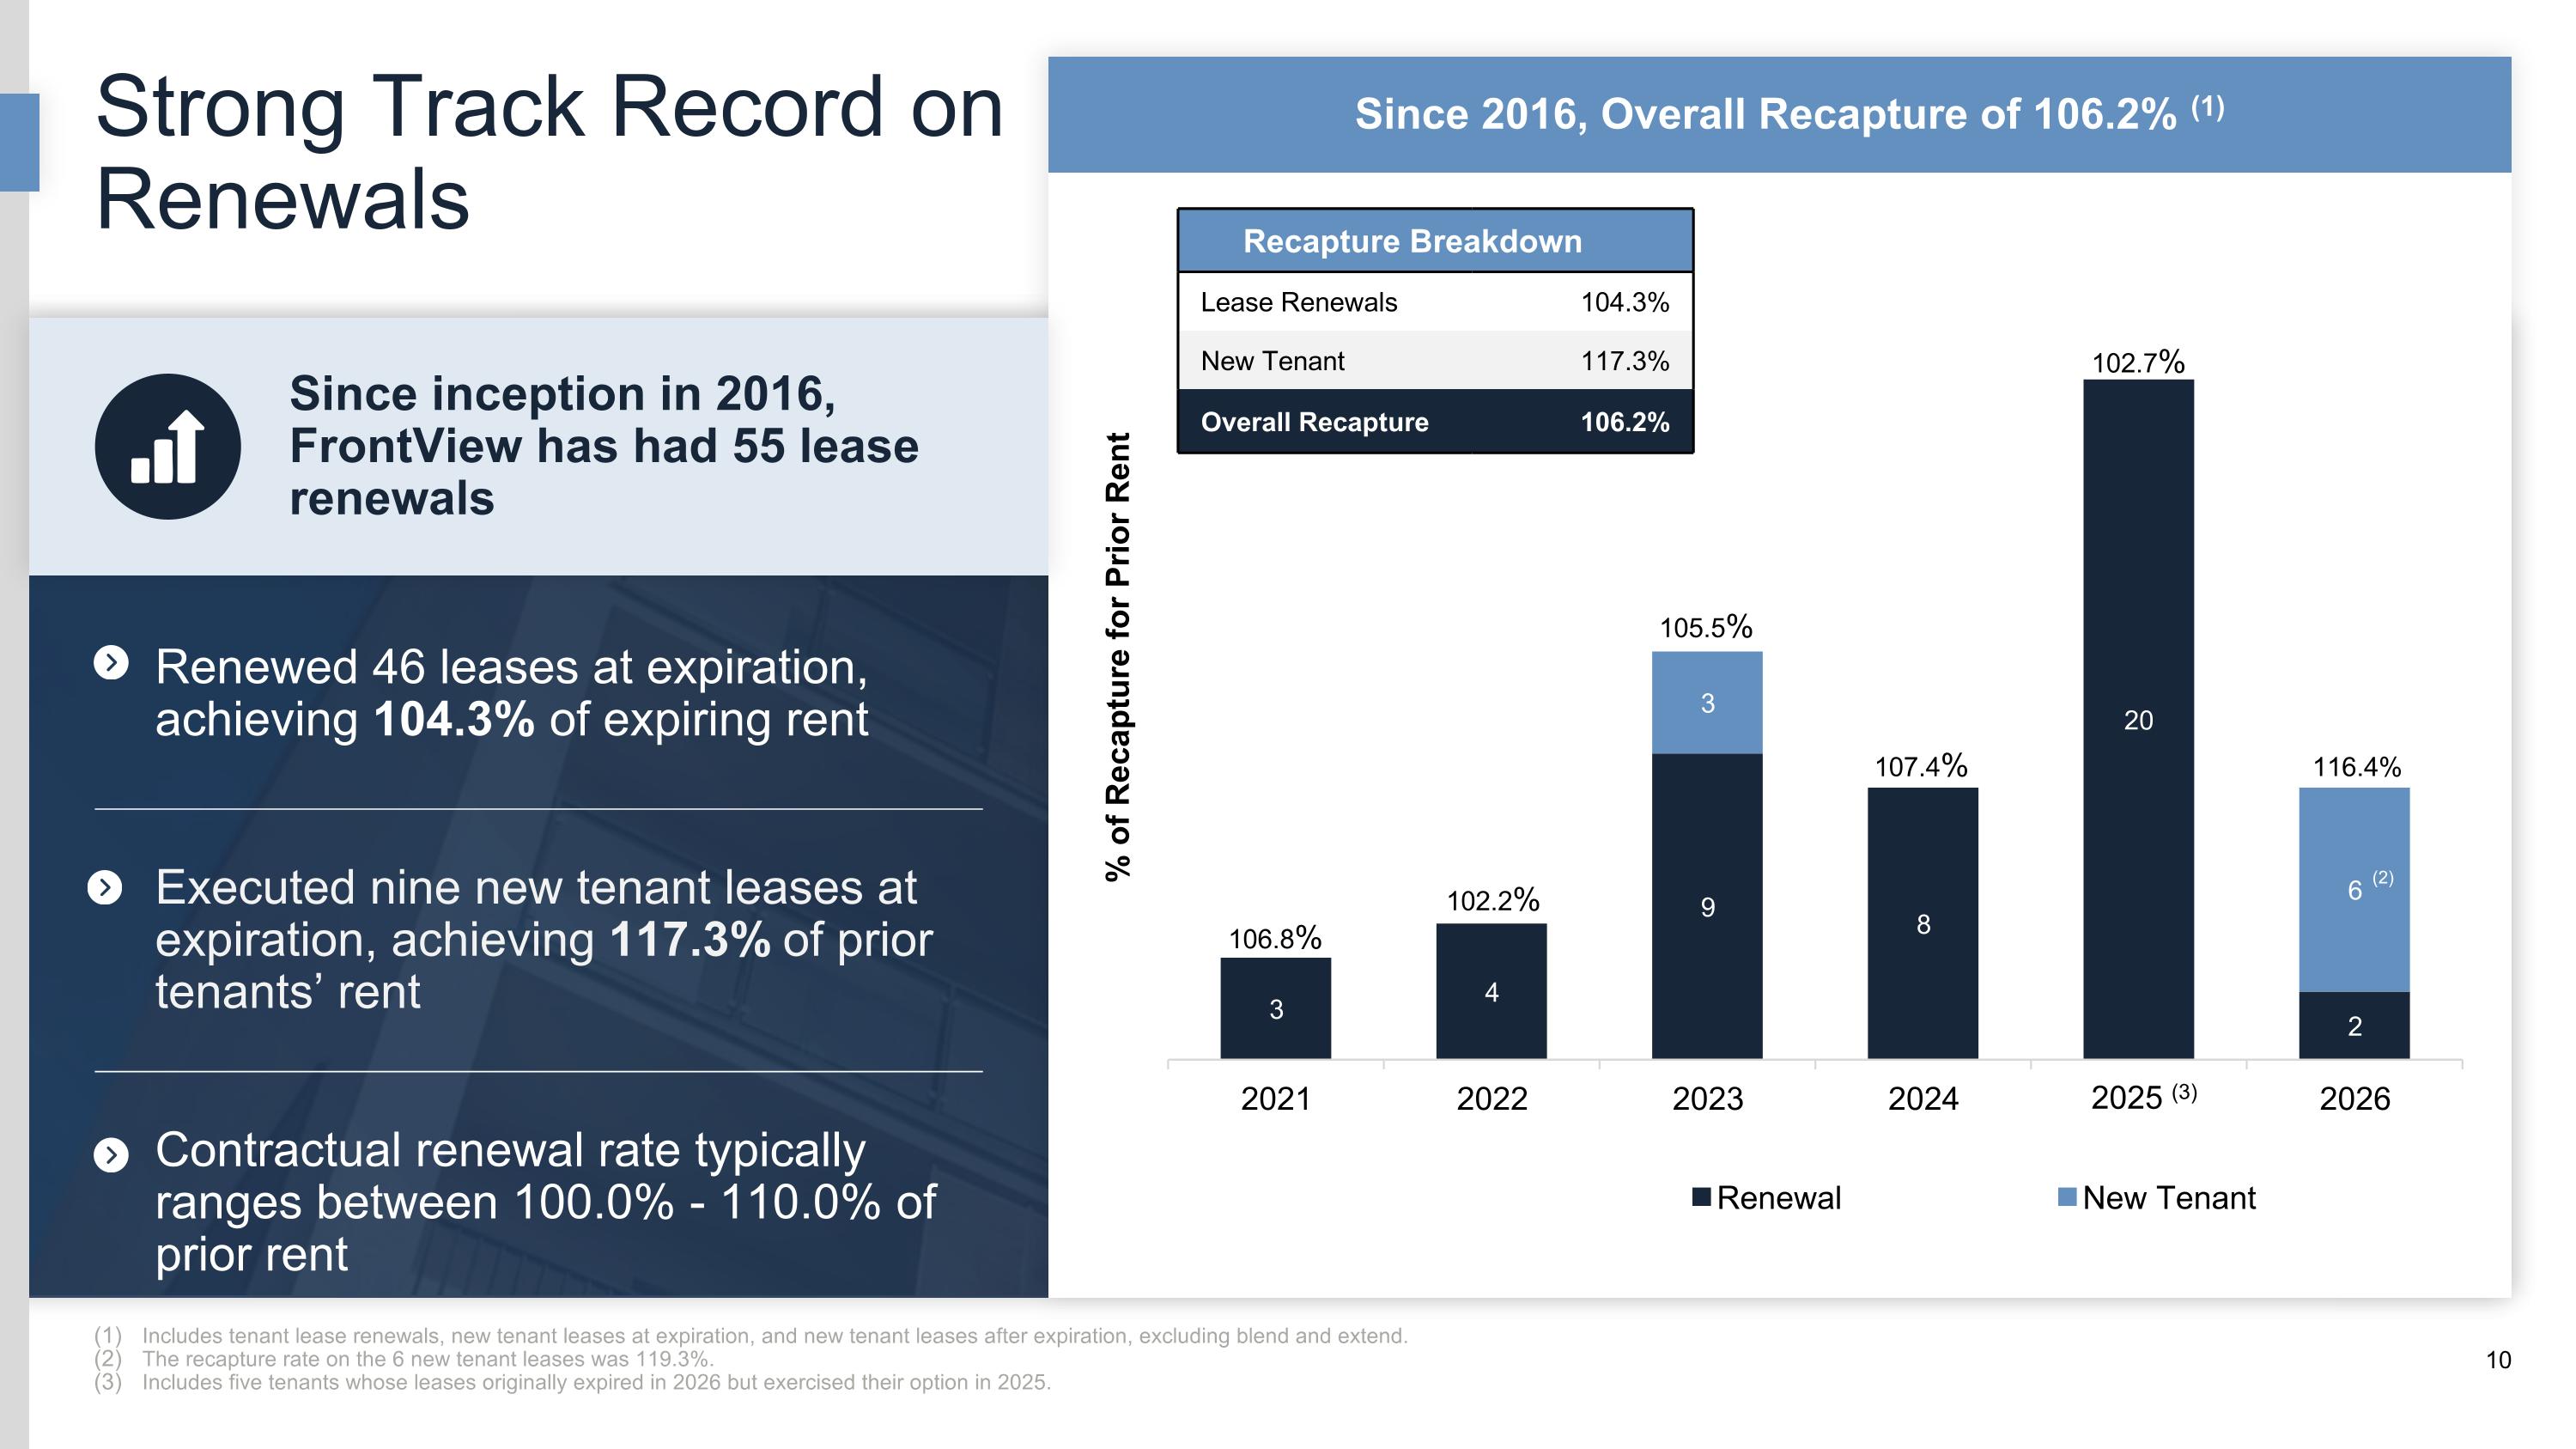
Strong Track Record on Renewals Includes tenant lease renewals, new tenant leases at expiration, and new tenant leases after expiration, excluding blend and extend. The recapture rate on the 6 new tenant leases was 119.3%. Includes five tenants whose leases originally expired in 2026 but exercised their option in 2025. Executed nine new tenant leases at expiration, achieving 117.3% of prior tenants’ rent Renewed 46 leases at expiration, achieving 104.3% of expiring rent Contractual renewal rate typically ranges between 100.0% - 110.0% of prior rent Since 2016, Overall Recapture of 106.2% (1) 2025 (3) 116.4% 106.8% 102.2% 105.5% 107.4% 102.7% Since inception in 2016, FrontView has had 55 lease renewals Recapture Breakdown Lease Renewals 104.3% New Tenant 117.3% Overall Recapture 106.2% (2)
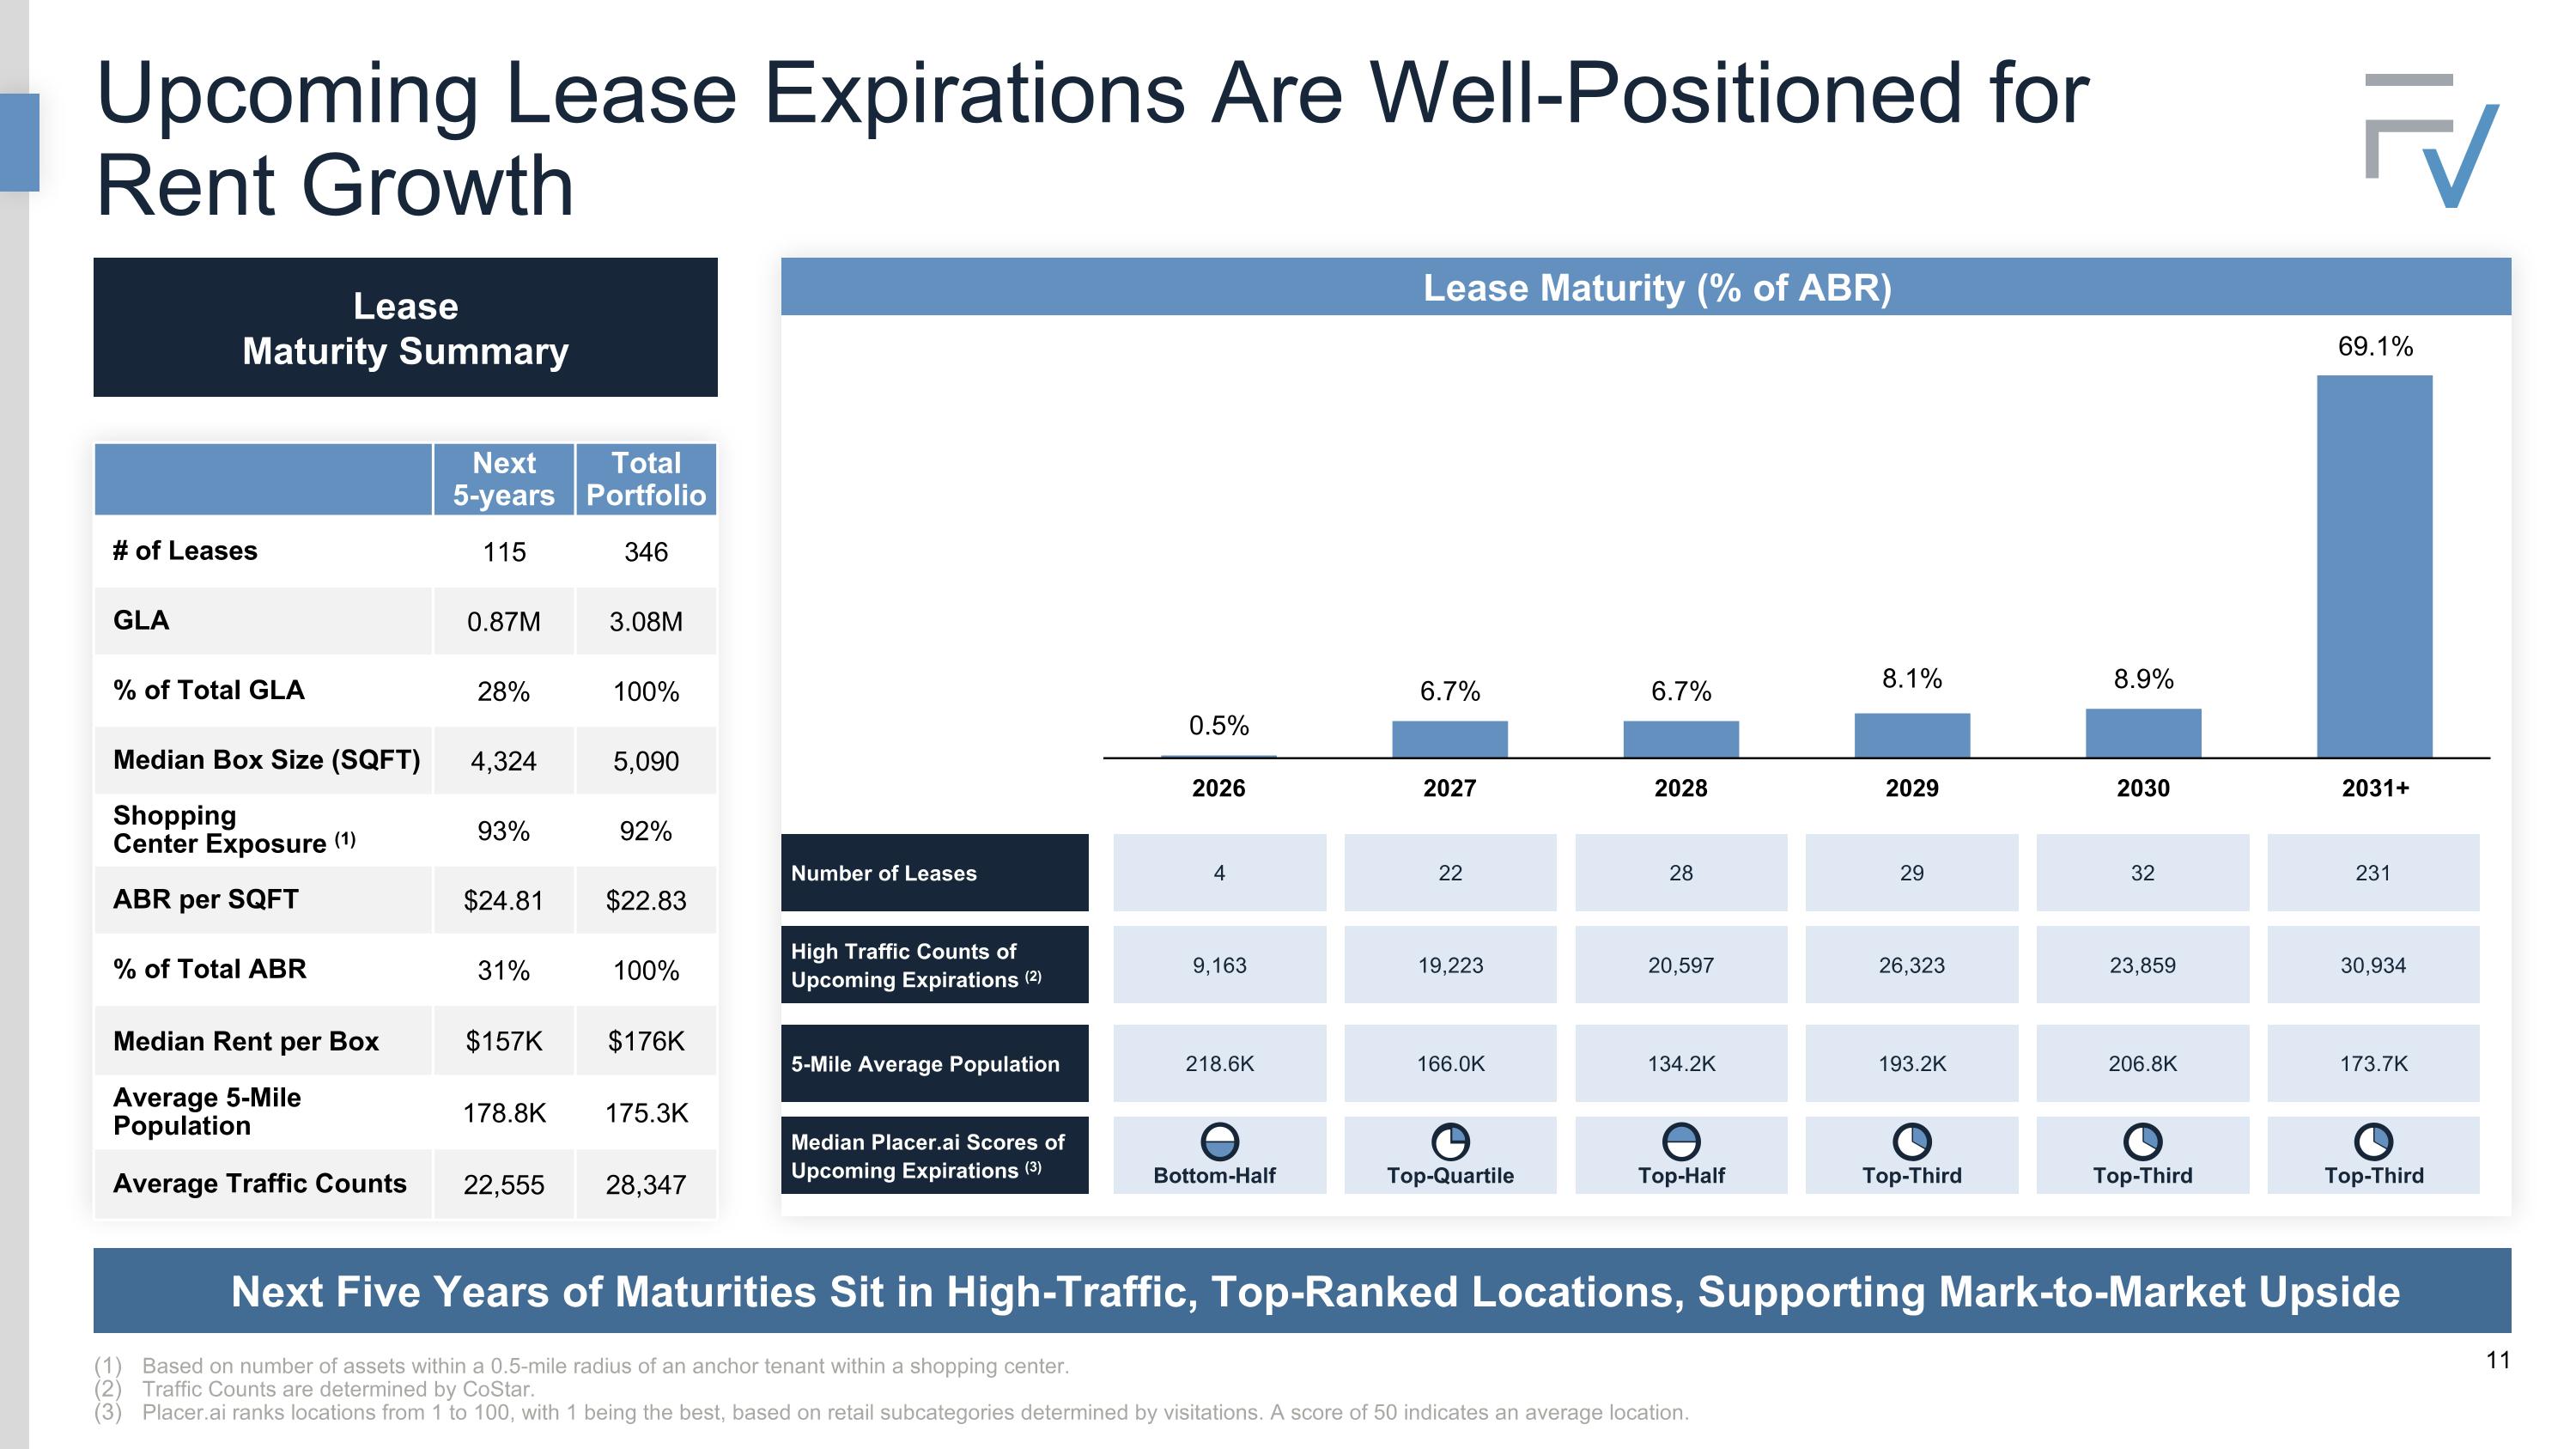
Based on number of assets within a 0.5-mile radius of an anchor tenant within a shopping center. Traffic Counts are determined by CoStar. Placer.ai ranks locations from 1 to 100, with 1 being the best, based on retail subcategories determined by visitations. A score of 50 indicates an average location. Lease Maturity Summary Next 5-years Total Portfolio # of Leases 115 346 GLA 0.87M 3.08M % of Total GLA 28% 100% Median Box Size (SQFT) 4,324 5,090 Shopping Center Exposure (1) 93% 92% ABR per SQFT $24.81 $22.83 % of Total ABR 31% 100% Median Rent per Box $157K $176K Average 5-Mile Population 178.8K 175.3K Average Traffic Counts 22,555 28,347 Next Five Years of Maturities Sit in High-Traffic, Top-Ranked Locations, Supporting Mark-to-Market Upside Lease Maturity (% of ABR) High Traffic Counts of Upcoming Expirations (2) 9,163 19,223 20,597 26,323 23,859 30,934 5-Mile Average Population 218.6K 166.0K 134.2K 193.2K 206.8K 173.7K Median Placer.ai Scores of Upcoming Expirations (3) Top-Quartile Top-Half Number of Leases 4 22 28 29 32 231 Top-Third Top-Third Top-Third Bottom-Half Upcoming Lease Expirations Are Well-Positioned for Rent Growth
Portfolio Overview
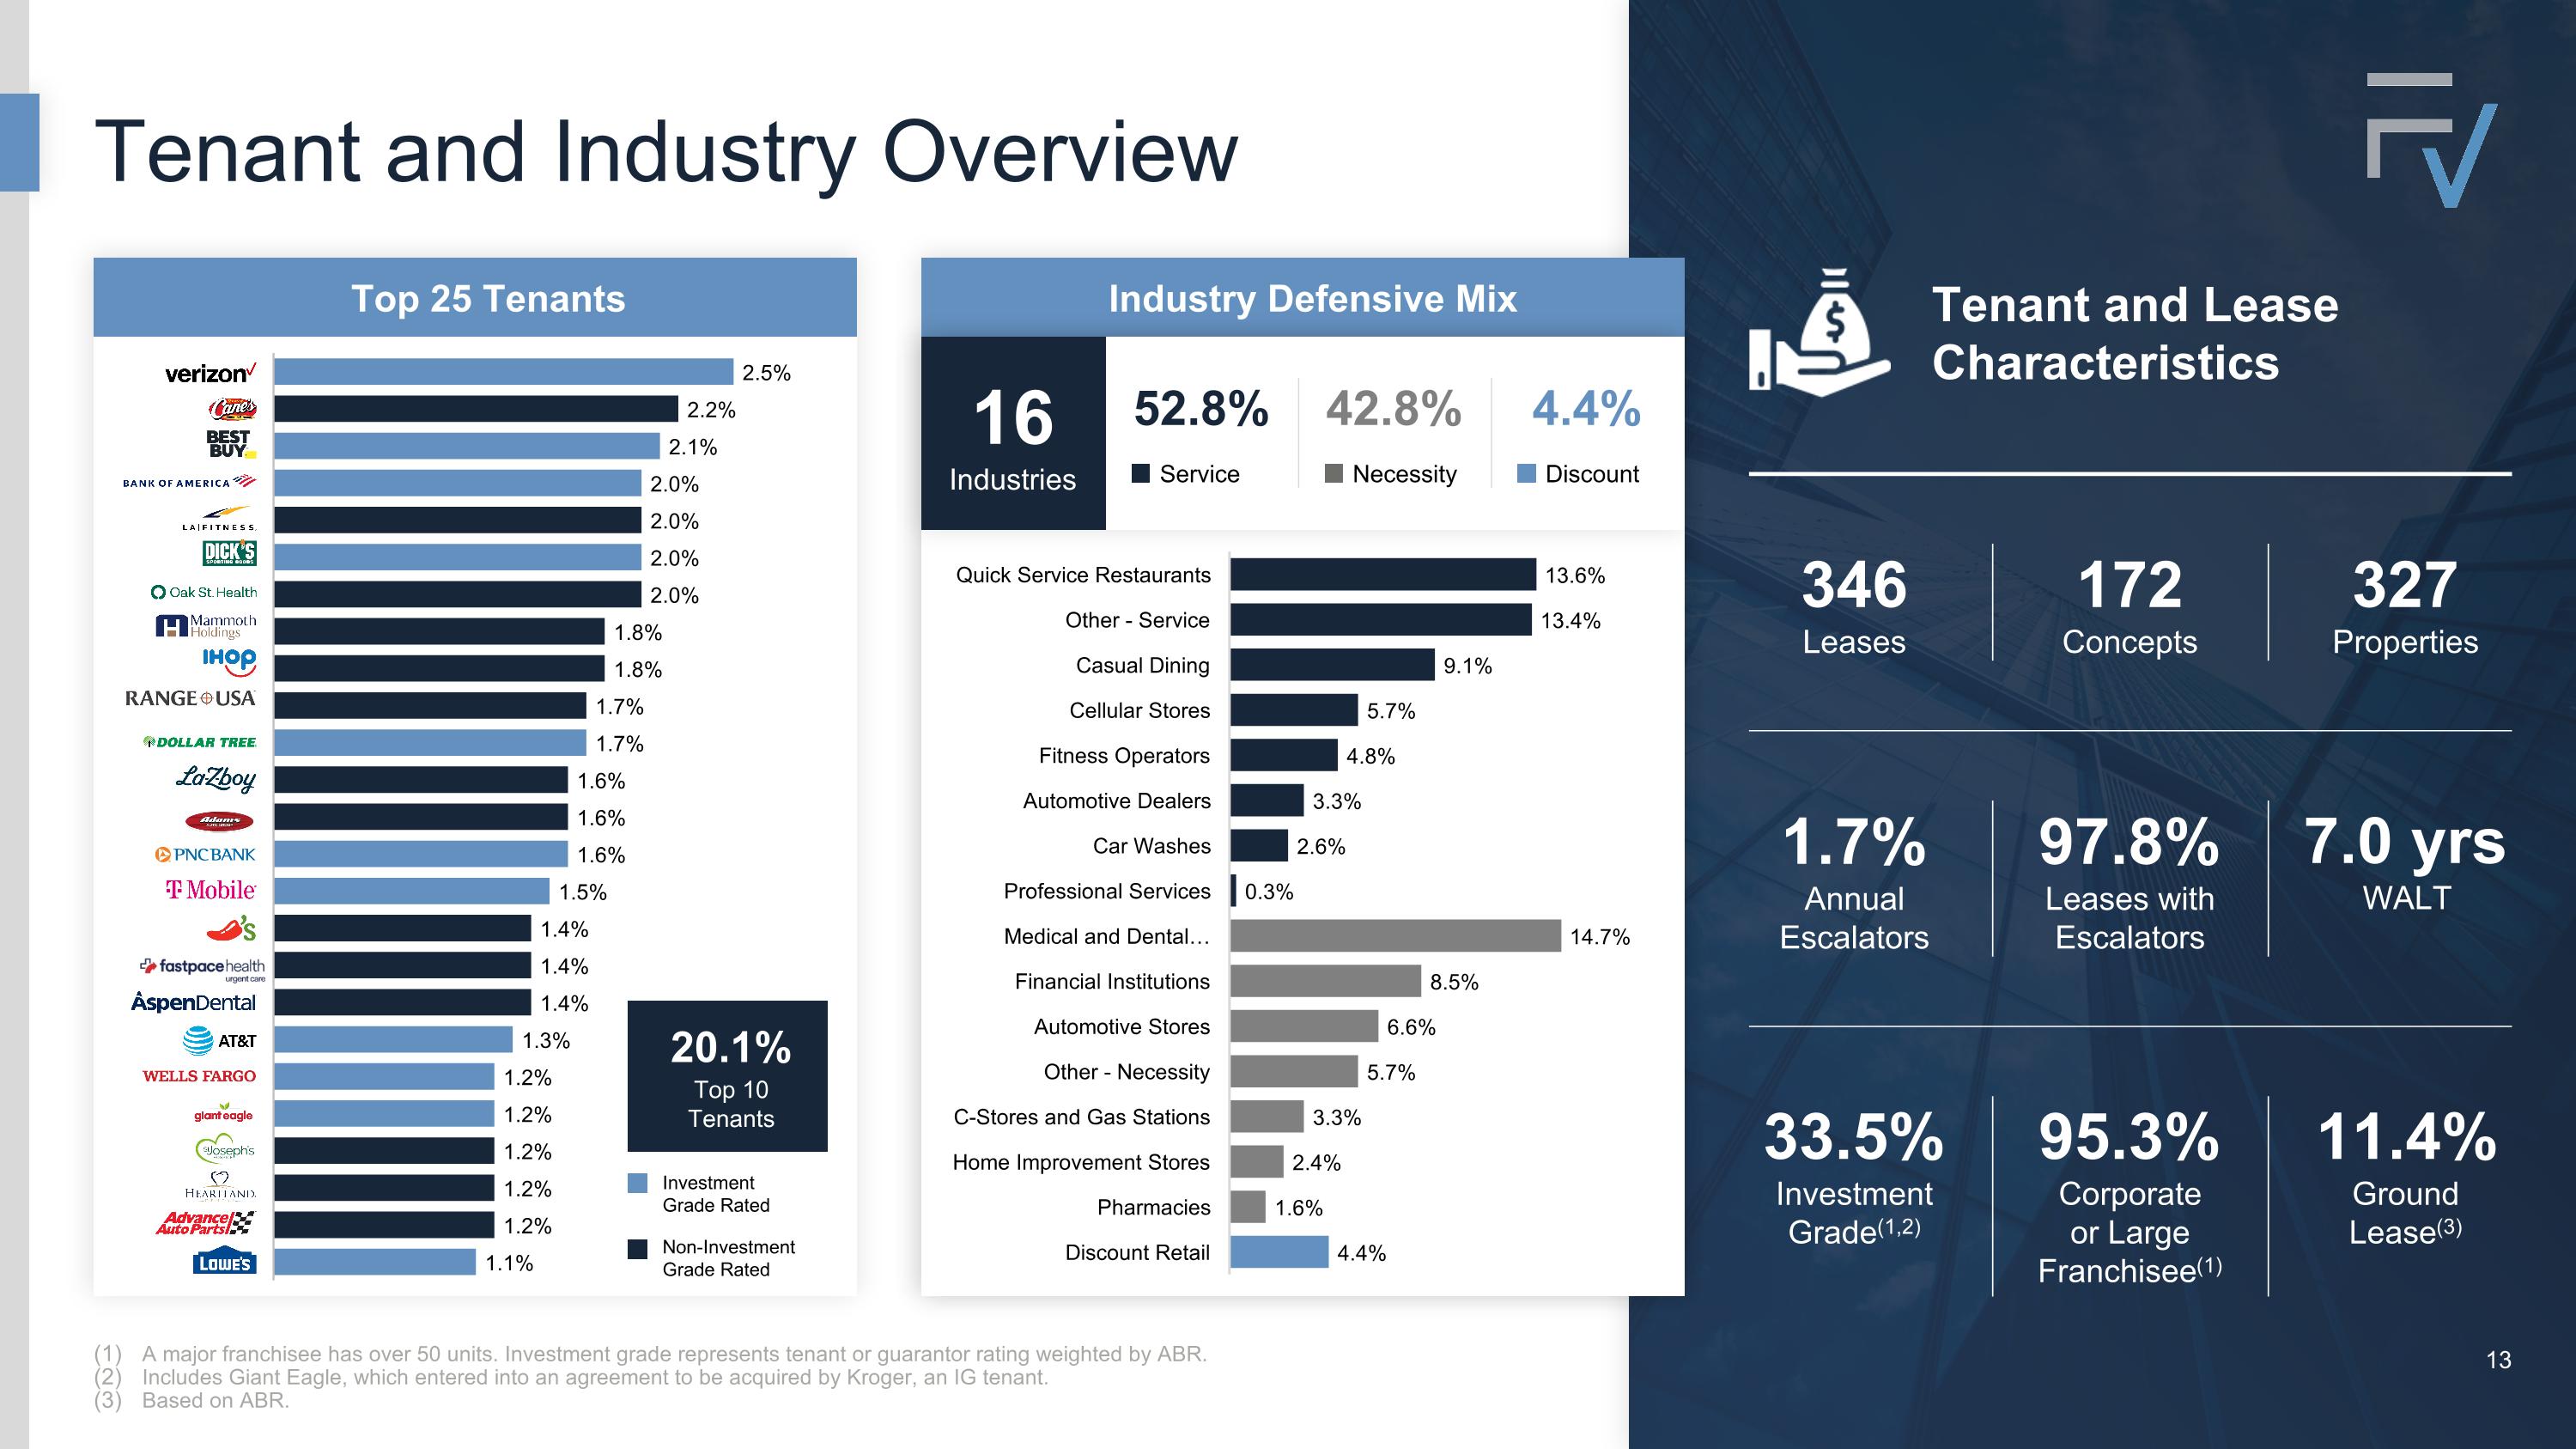
Tenant and Industry Overview Tenant and Lease Characteristics 33.5% Investment Grade(1,2) 95.3% Corporate or Large Franchisee(1) 11.4% Ground Lease(3) 346 Leases 172 Concepts 327 Properties 1.7% Annual Escalators 97.8% Leases with Escalators 7.0 yrs WALT Top 25 Tenants Industry Defensive Mix Tenant and Lease Characteristics 13 20.1% Top 10 Tenants Investment Grade Rated Non-Investment Grade Rated 42.8% Necessity 52.8% Service 4.4% Discount 16 Industries A major franchisee has over 50 units. Investment grade represents tenant or guarantor rating weighted by ABR. Includes Giant Eagle, which entered into an agreement to be acquired by Kroger, an IG tenant. Based on ABR.
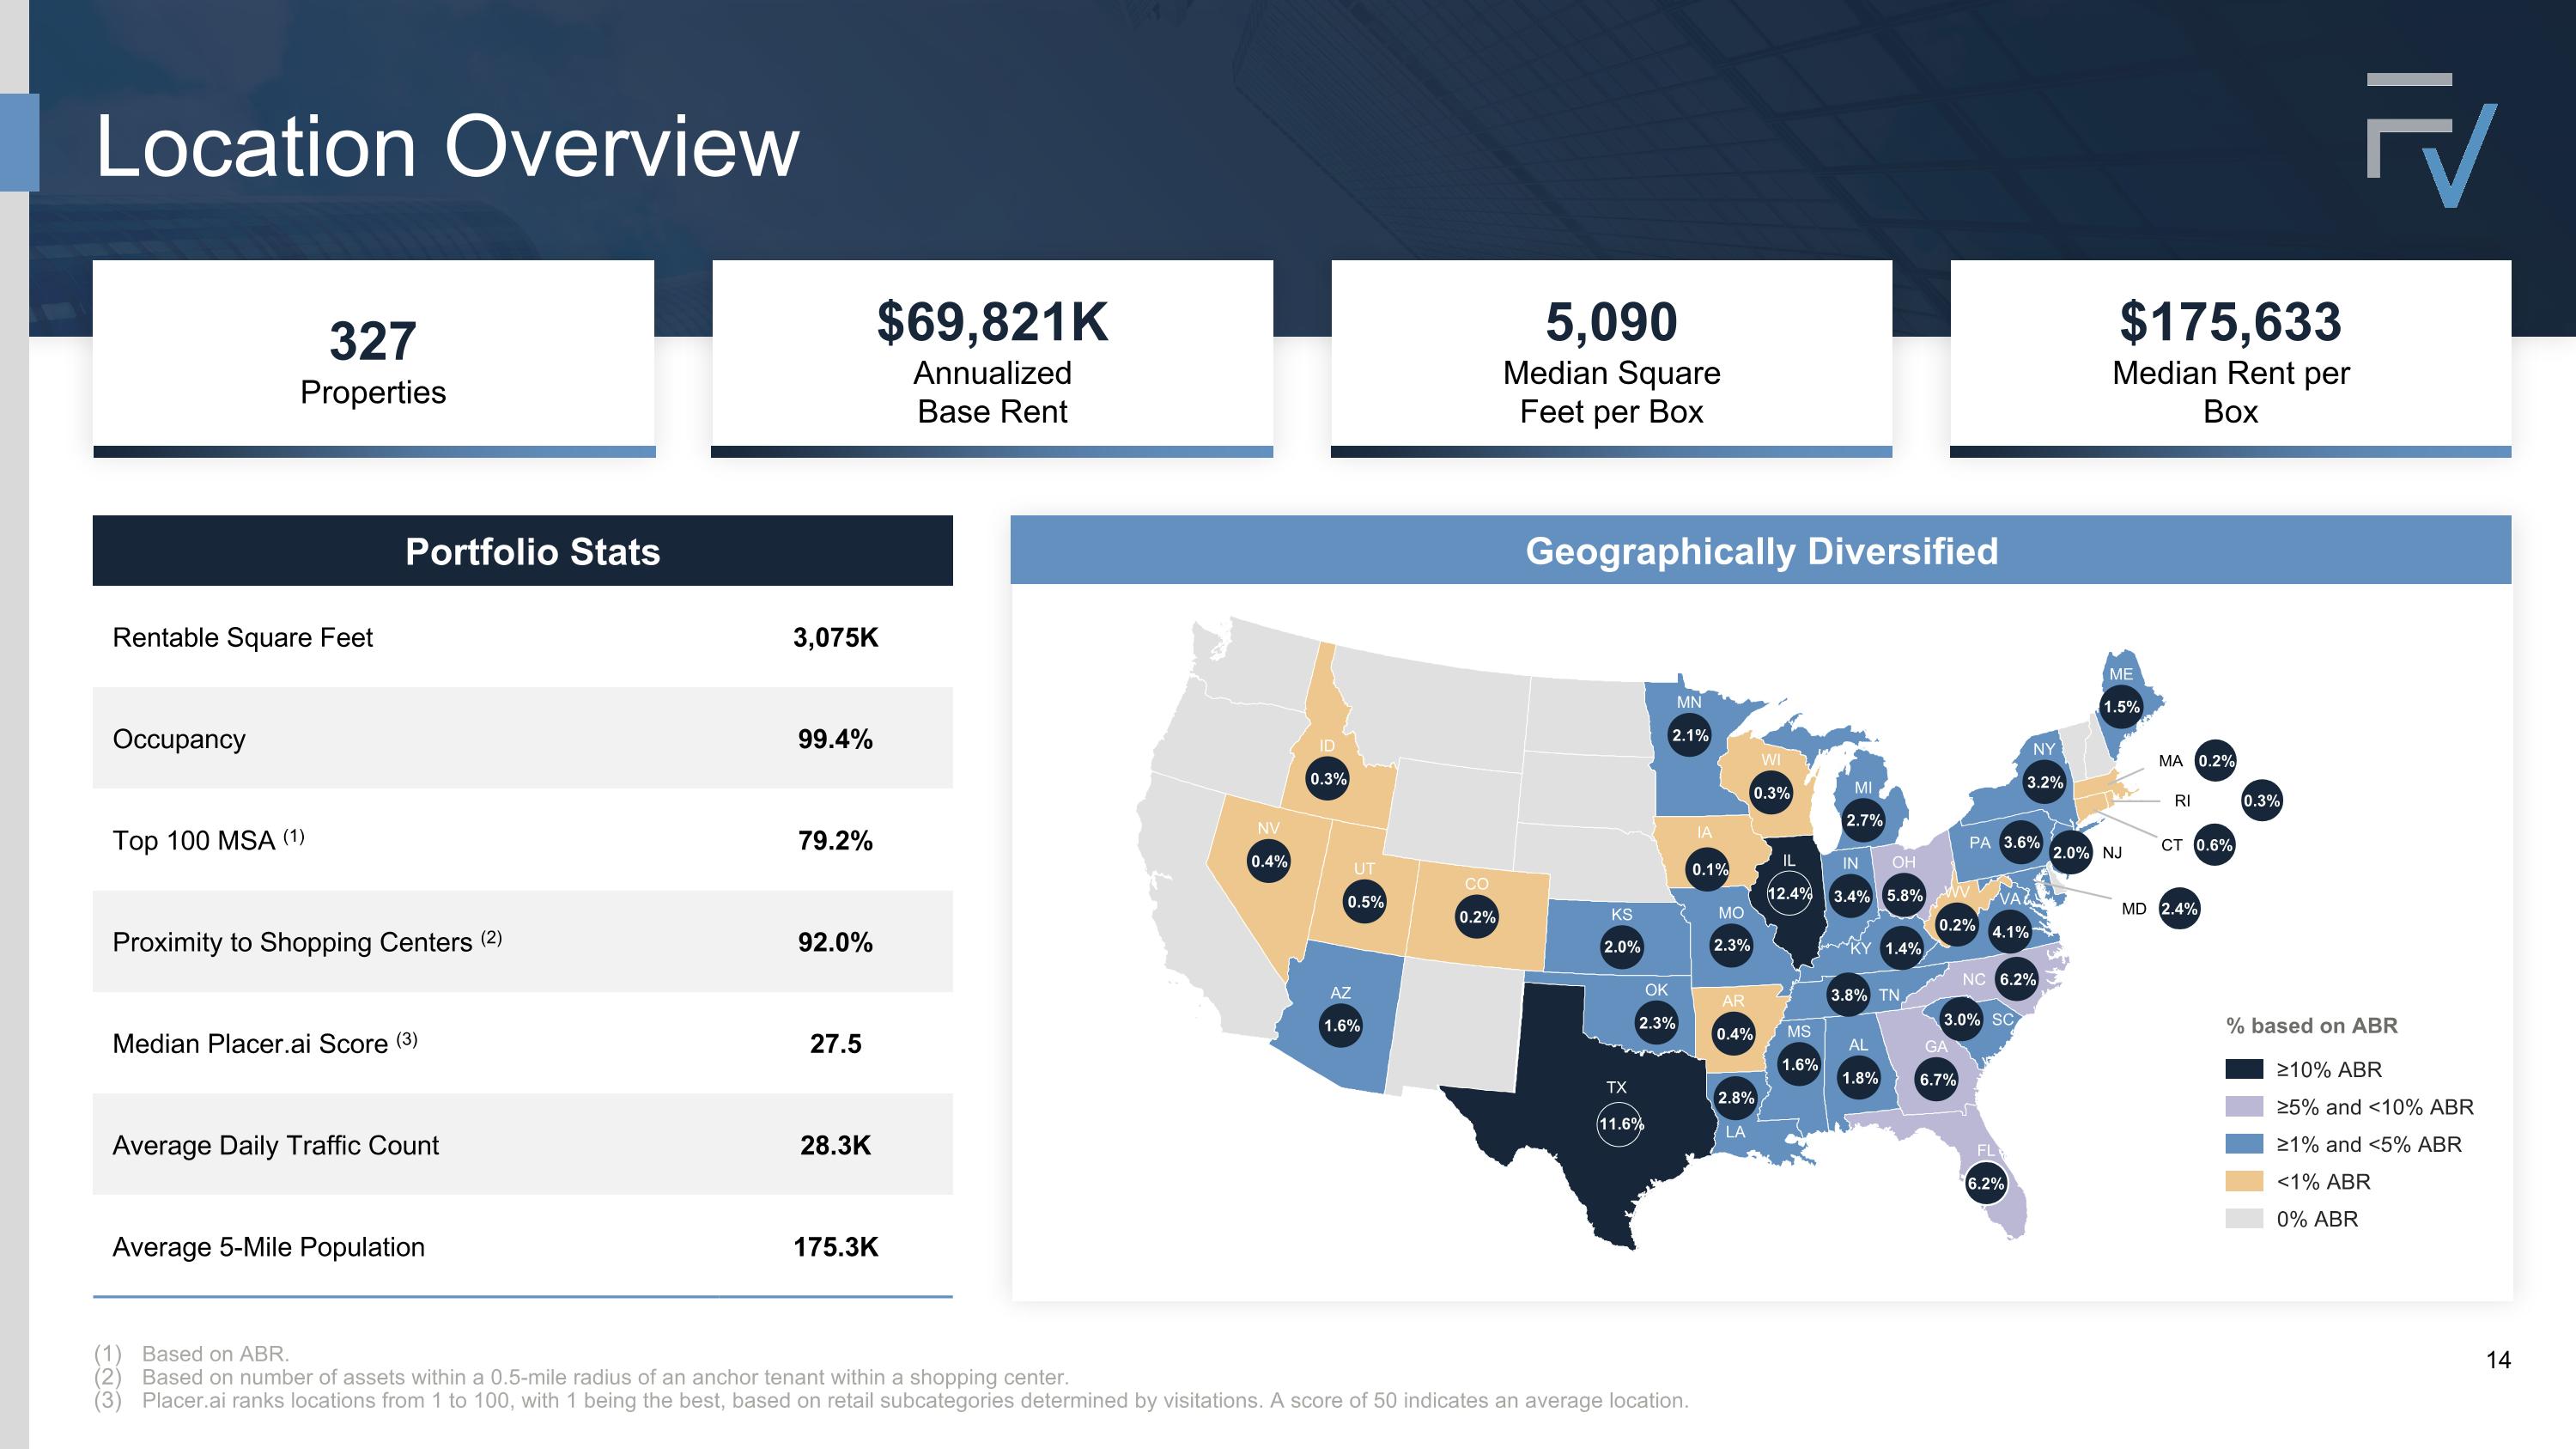
Based on ABR. Based on number of assets within a 0.5-mile radius of an anchor tenant within a shopping center. Placer.ai ranks locations from 1 to 100, with 1 being the best, based on retail subcategories determined by visitations. A score of 50 indicates an average location. 327 Properties $69,821K Annualized Base Rent 5,090 Median Square Feet per Box $175,633 Median Rent per Box Geographically Diversified MA MN IA ID AZ CO NV UT AR KS MO OK LA TX CT RI AL FL GA MS SC IL IN KY NC OH TN VA WI MD NJ NY PA ME MI WV % based on ABR ≥10% ABR ≥5% and <10% ABR ≥1% and <5% ABR <1% ABR 0% ABR 0.3% 0.4% 0.5% 0.2% 1.6% 2.1% 0.1% 0.3% 2.7% 2.0% 2.3% 2.3% 0.4% 2.8% 12.4% 3.4% 5.8% 1.4% 3.8% 1.6% 1.8% 6.7% 6.2% 3.0% 6.2% 4.1% 0.2% 3.6% 3.2% 1.5% 0.2% 0.3% 0.6% 2.0% 2.4% Portfolio Stats Rentable Square Feet 3,075K Occupancy 99.4% Top 100 MSA (1) 79.2% Proximity to Shopping Centers (2) 92.0% Median Placer.ai Score (3) 27.5 Average Daily Traffic Count 28.3K Average 5-Mile Population 175.3K Location Overview 11.6%
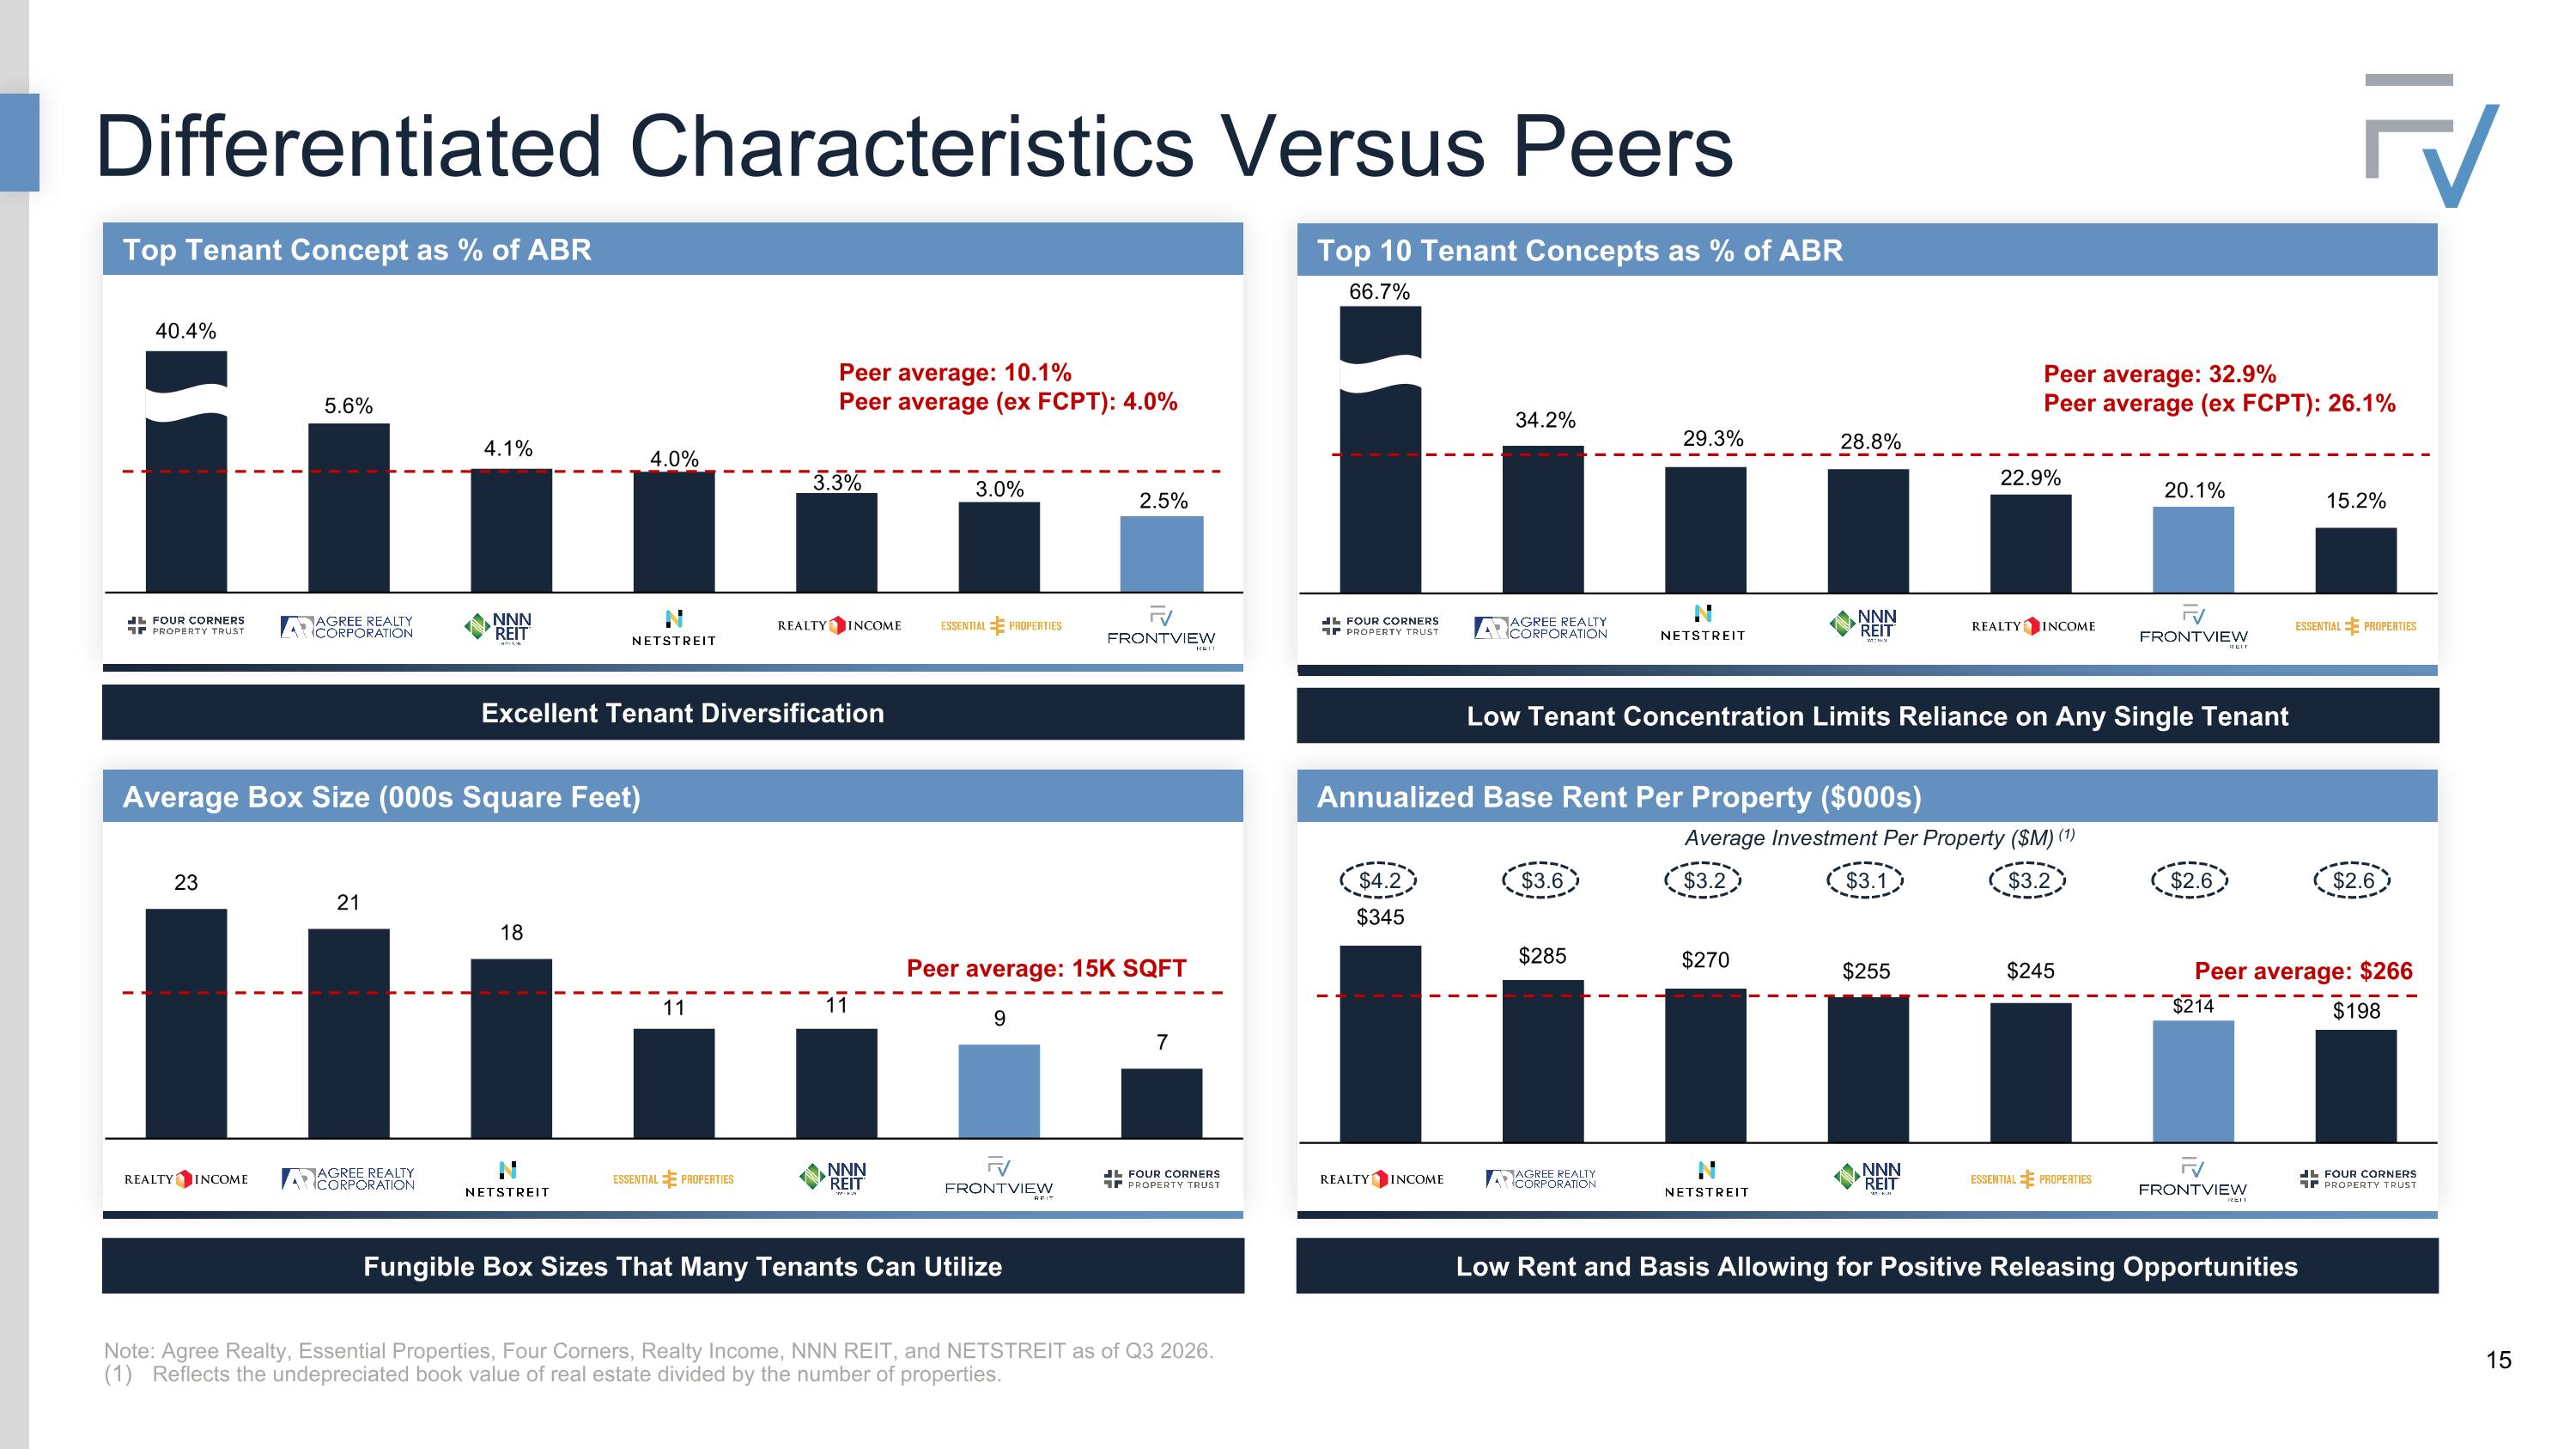
Differentiated Characteristics Versus Peers Note: Agree Realty, Essential Properties, Four Corners, Realty Income, NNN REIT, and NETSTREIT as of Q3 2026. Reflects the undepreciated book value of real estate divided by the number of properties. Average Box Size (000s Square Feet) Fungible Box Sizes That Many Tenants Can Utilize Peer average: 15K SQFT Low Rent and Basis Allowing for Positive Releasing Opportunities Annualized Base Rent Per Property ($000s) Peer average: $266 Excellent Tenant Diversification Top Tenant Concept as % of ABR Peer average: 10.1% Peer average (ex FCPT): 4.0% Low Tenant Concentration Limits Reliance on Any Single Tenant $2.6 $2.6 $3.6 $4.2 $3.2 $3.1 $3.2 Average Investment Per Property ($M) (1) Top 10 Tenant Concepts as % of ABR Peer average: 32.9% Peer average (ex FCPT): 26.1% 66.7%
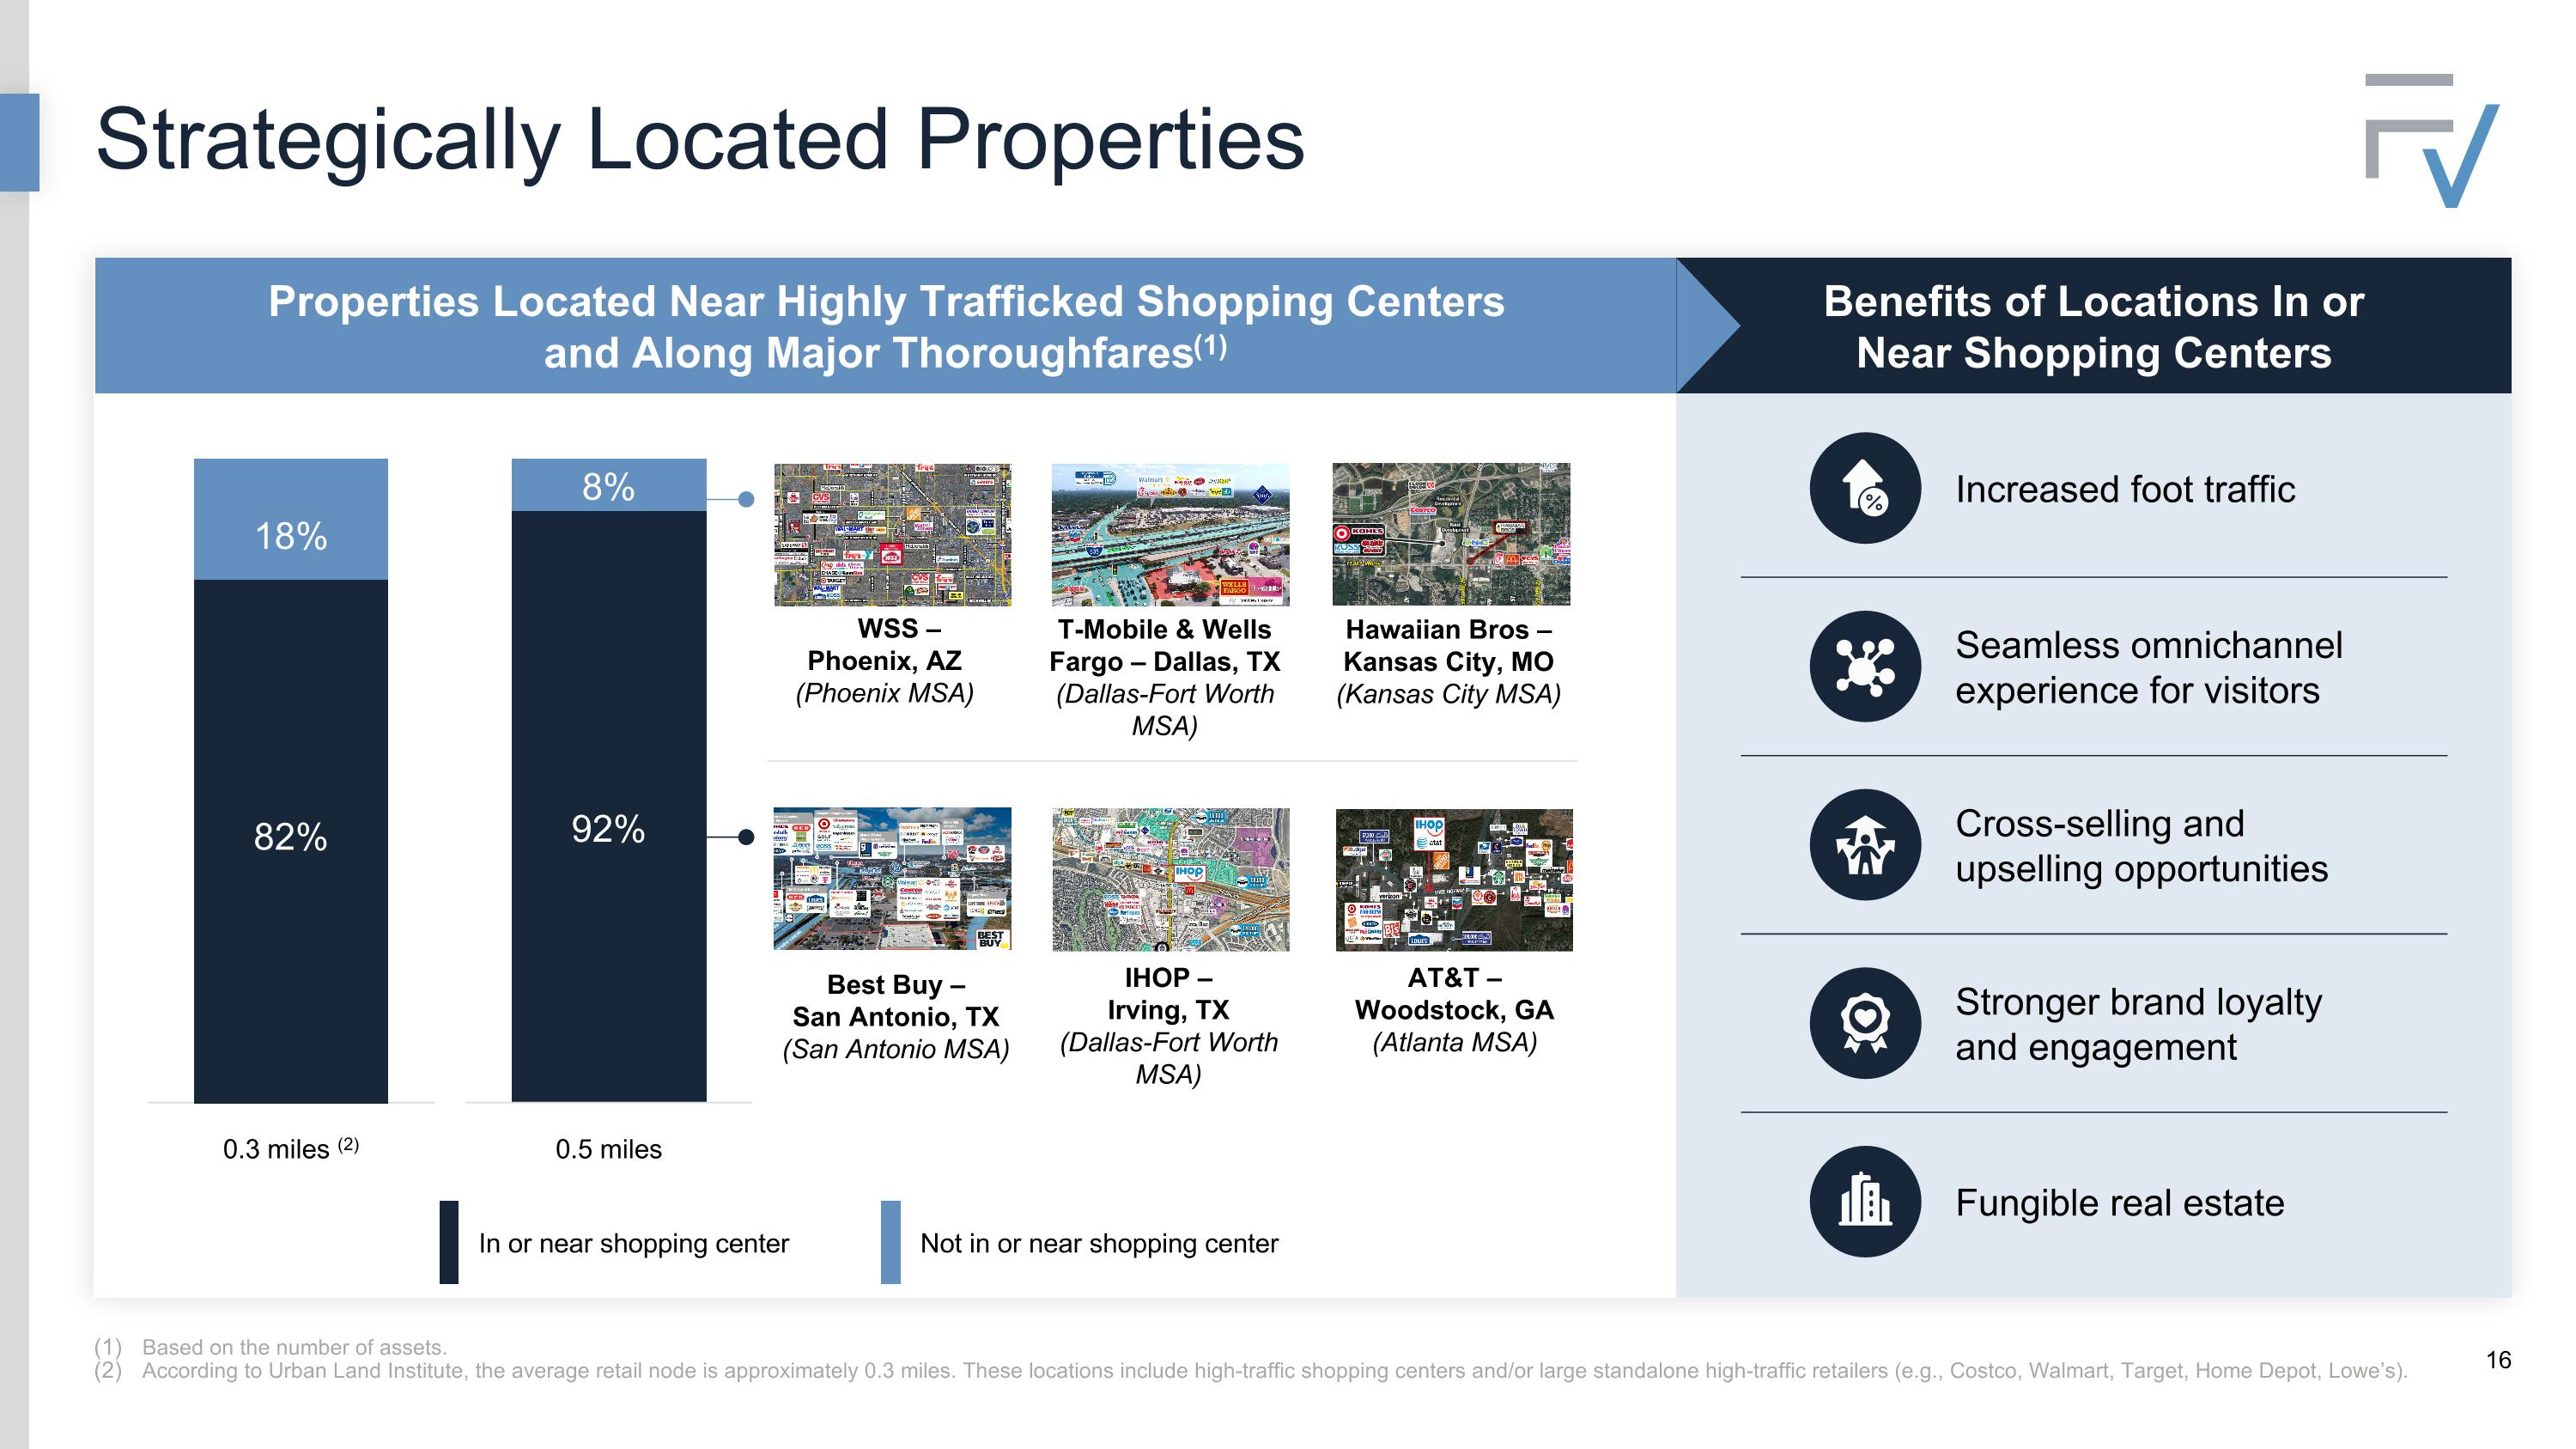
Strategically Located Properties Benefits of Locations In or Near Shopping Centers Fungible real estate Cross-selling and upselling opportunities Seamless omnichannel experience for visitors Increased foot traffic Stronger brand loyalty and engagement Properties Located Near Highly Trafficked Shopping Centers and Along Major Thoroughfares(1) In or near shopping center Not in or near shopping center Best Buy – San Antonio, TX (San Antonio MSA) T-Mobile & Wells Fargo – Dallas, TX (Dallas-Fort Worth MSA) 8% 92% 18% 82% 0.3 miles (2) 0.5 miles WSS – Phoenix, AZ (Phoenix MSA) Based on the number of assets. According to Urban Land Institute, the average retail node is approximately 0.3 miles. These locations include high-traffic shopping centers and/or large standalone high-traffic retailers (e.g., Costco, Walmart, Target, Home Depot, Lowe’s). IHOP – Irving, TX (Dallas-Fort Worth MSA) AT&T – Woodstock, GA (Atlanta MSA) Hawaiian Bros – Kansas City, MO (Kansas City MSA)
Capital Allocation & Balance Sheet
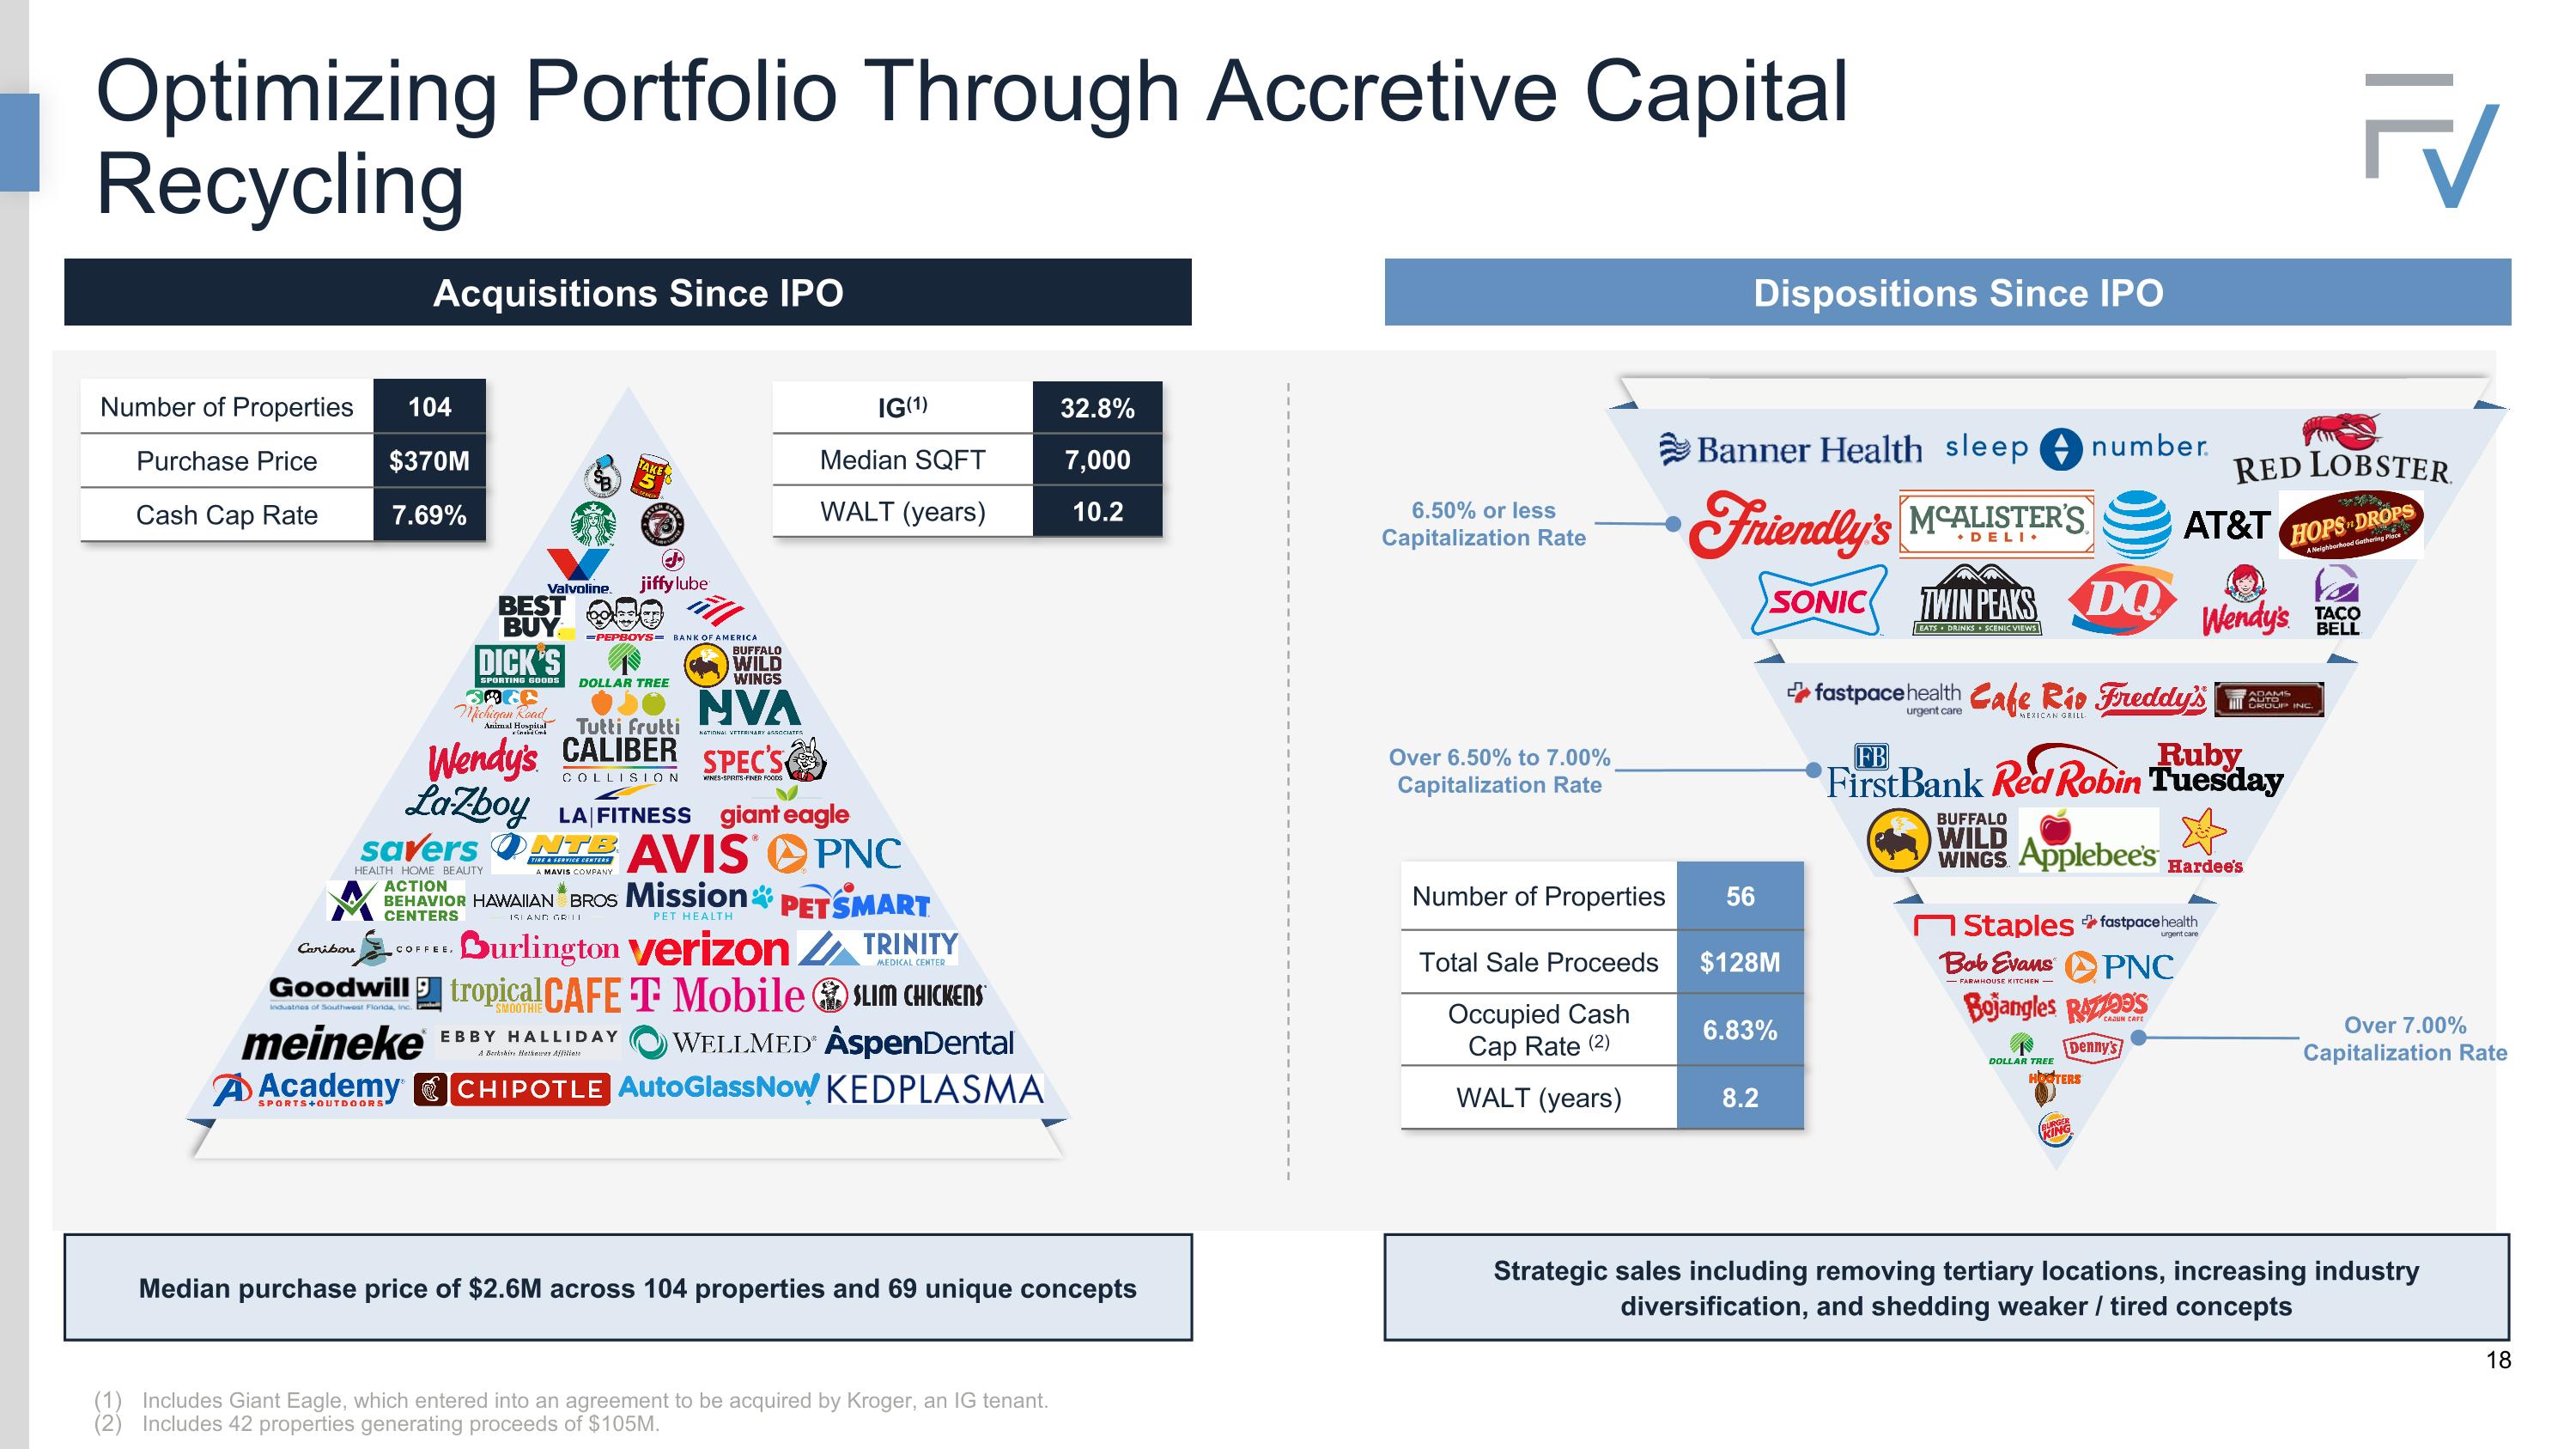
Optimizing Portfolio Through Accretive Capital Recycling 6.50% or less Capitalization Rate Dispositions Since IPO Acquisitions Since IPO Over 6.50% to 7.00% Capitalization Rate Over 7.00% Capitalization Rate Number of Properties 104 Purchase Price $370M Cash Cap Rate 7.69% IG(1) 32.8% Median SQFT 7,000 WALT (years) 10.2 Number of Properties 56 Total Sale Proceeds $128M Occupied Cash Cap Rate (2) 6.83% WALT (years) 8.2 Median purchase price of $2.6M across 104 properties and 69 unique concepts Strategic sales including removing tertiary locations, increasing industry diversification, and shedding weaker / tired concepts Includes Giant Eagle, which entered into an agreement to be acquired by Kroger, an IG tenant. Includes 42 properties generating proceeds of $105M.
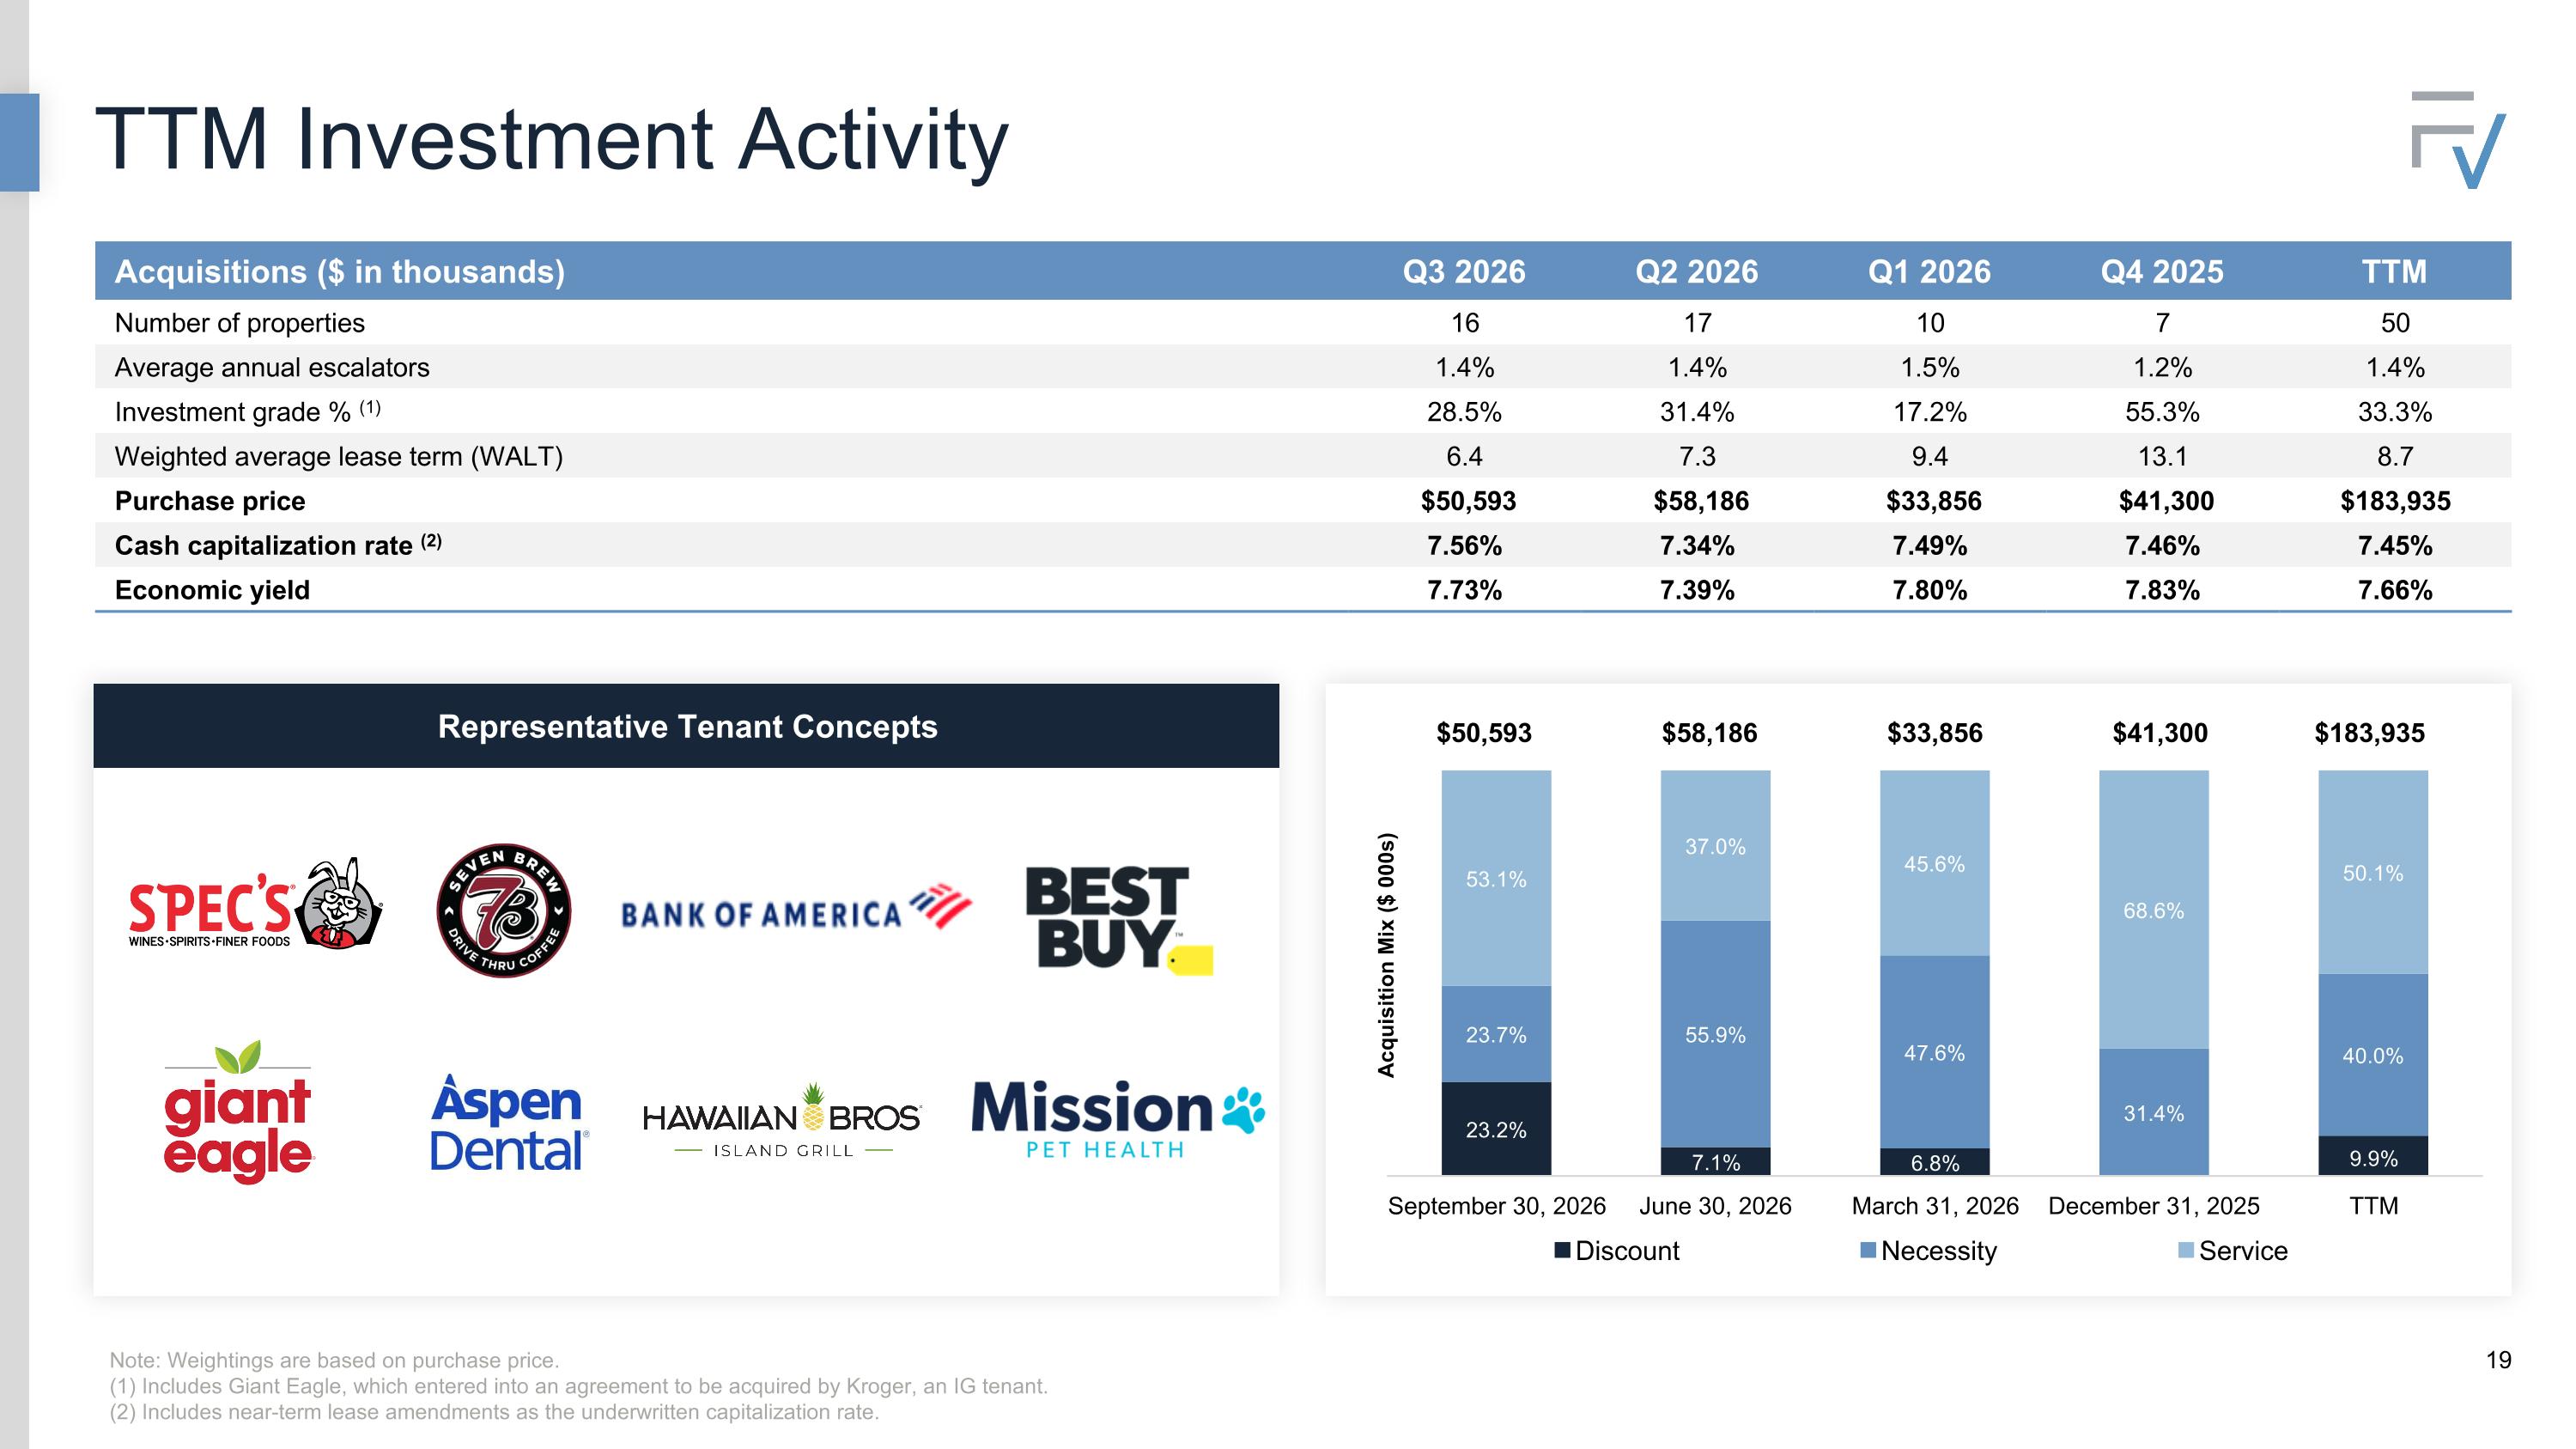
Acquisitions ($ in thousands) Q3 2026 Q2 2026 Q1 2026 Q4 2025 TTM Number of properties 16 17 10 7 50 Average annual escalators 1.4% 1.4% 1.5% 1.2% 1.4% Investment grade % (1) 28.5% 31.4% 17.2% 55.3% 33.3% Weighted average lease term (WALT) 6.4 7.3 9.4 13.1 8.7 Purchase price $50,593 $58,186 $33,856 $41,300 $183,935 Cash capitalization rate (2) 7.56% 7.34% 7.49% 7.46% 7.45% Economic yield 7.73% 7.39% 7.80% 7.83% 7.66% Representative Tenant Concepts Note: Weightings are based on purchase price. (1) Includes Giant Eagle, which entered into an agreement to be acquired by Kroger, an IG tenant. (2) Includes near-term lease amendments as the underwritten capitalization rate. TTM Investment Activity $50,593 $58,186 $33,856 $41,300 $183,935
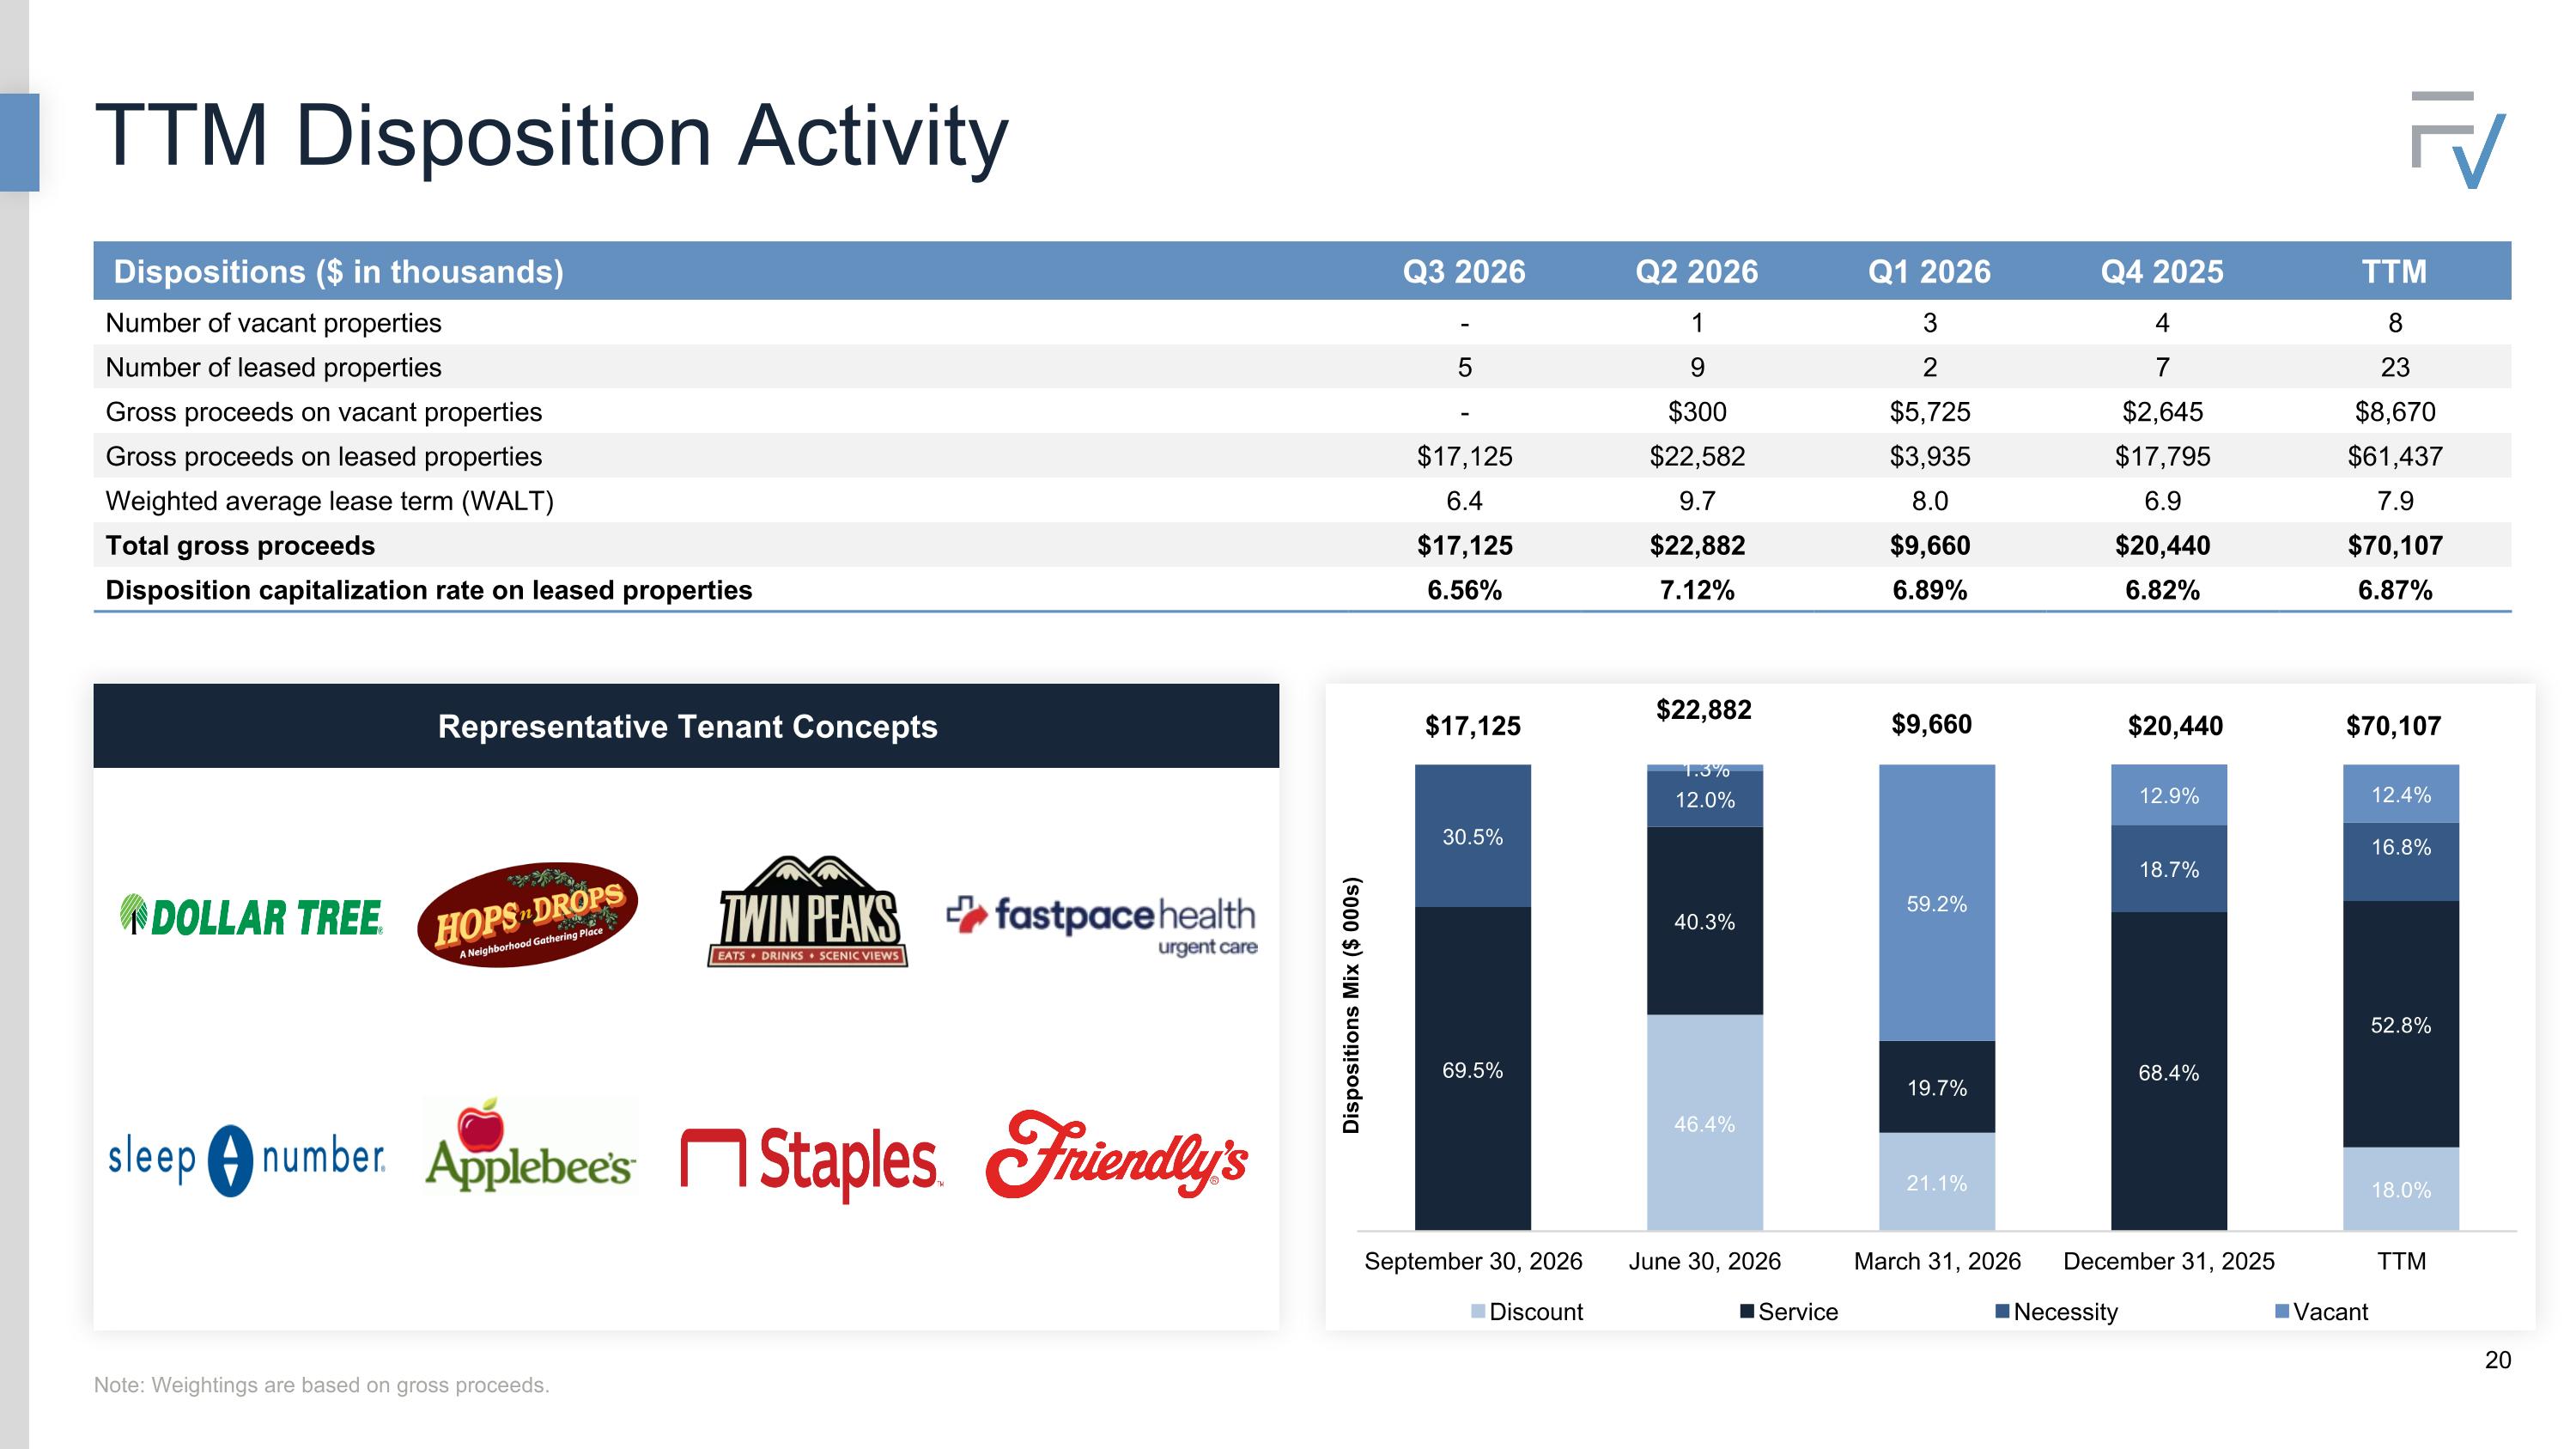
Dispositions ($ in thousands) Q3 2026 Q2 2026 Q1 2026 Q4 2025 TTM Number of vacant properties - 1 3 4 8 Number of leased properties 5 9 2 7 23 Gross proceeds on vacant properties - $300 $5,725 $2,645 $8,670 Gross proceeds on leased properties $17,125 $22,582 $3,935 $17,795 $61,437 Weighted average lease term (WALT) 6.4 9.7 8.0 6.9 7.9 Total gross proceeds $17,125 $22,882 $9,660 $20,440 $70,107 Disposition capitalization rate on leased properties 6.56% 7.12% 6.89% 6.82% 6.87% Representative Tenant Concepts Note: Weightings are based on gross proceeds. TTM Disposition Activity $17,125 $22,882 $9,660 $20,440 $70,107
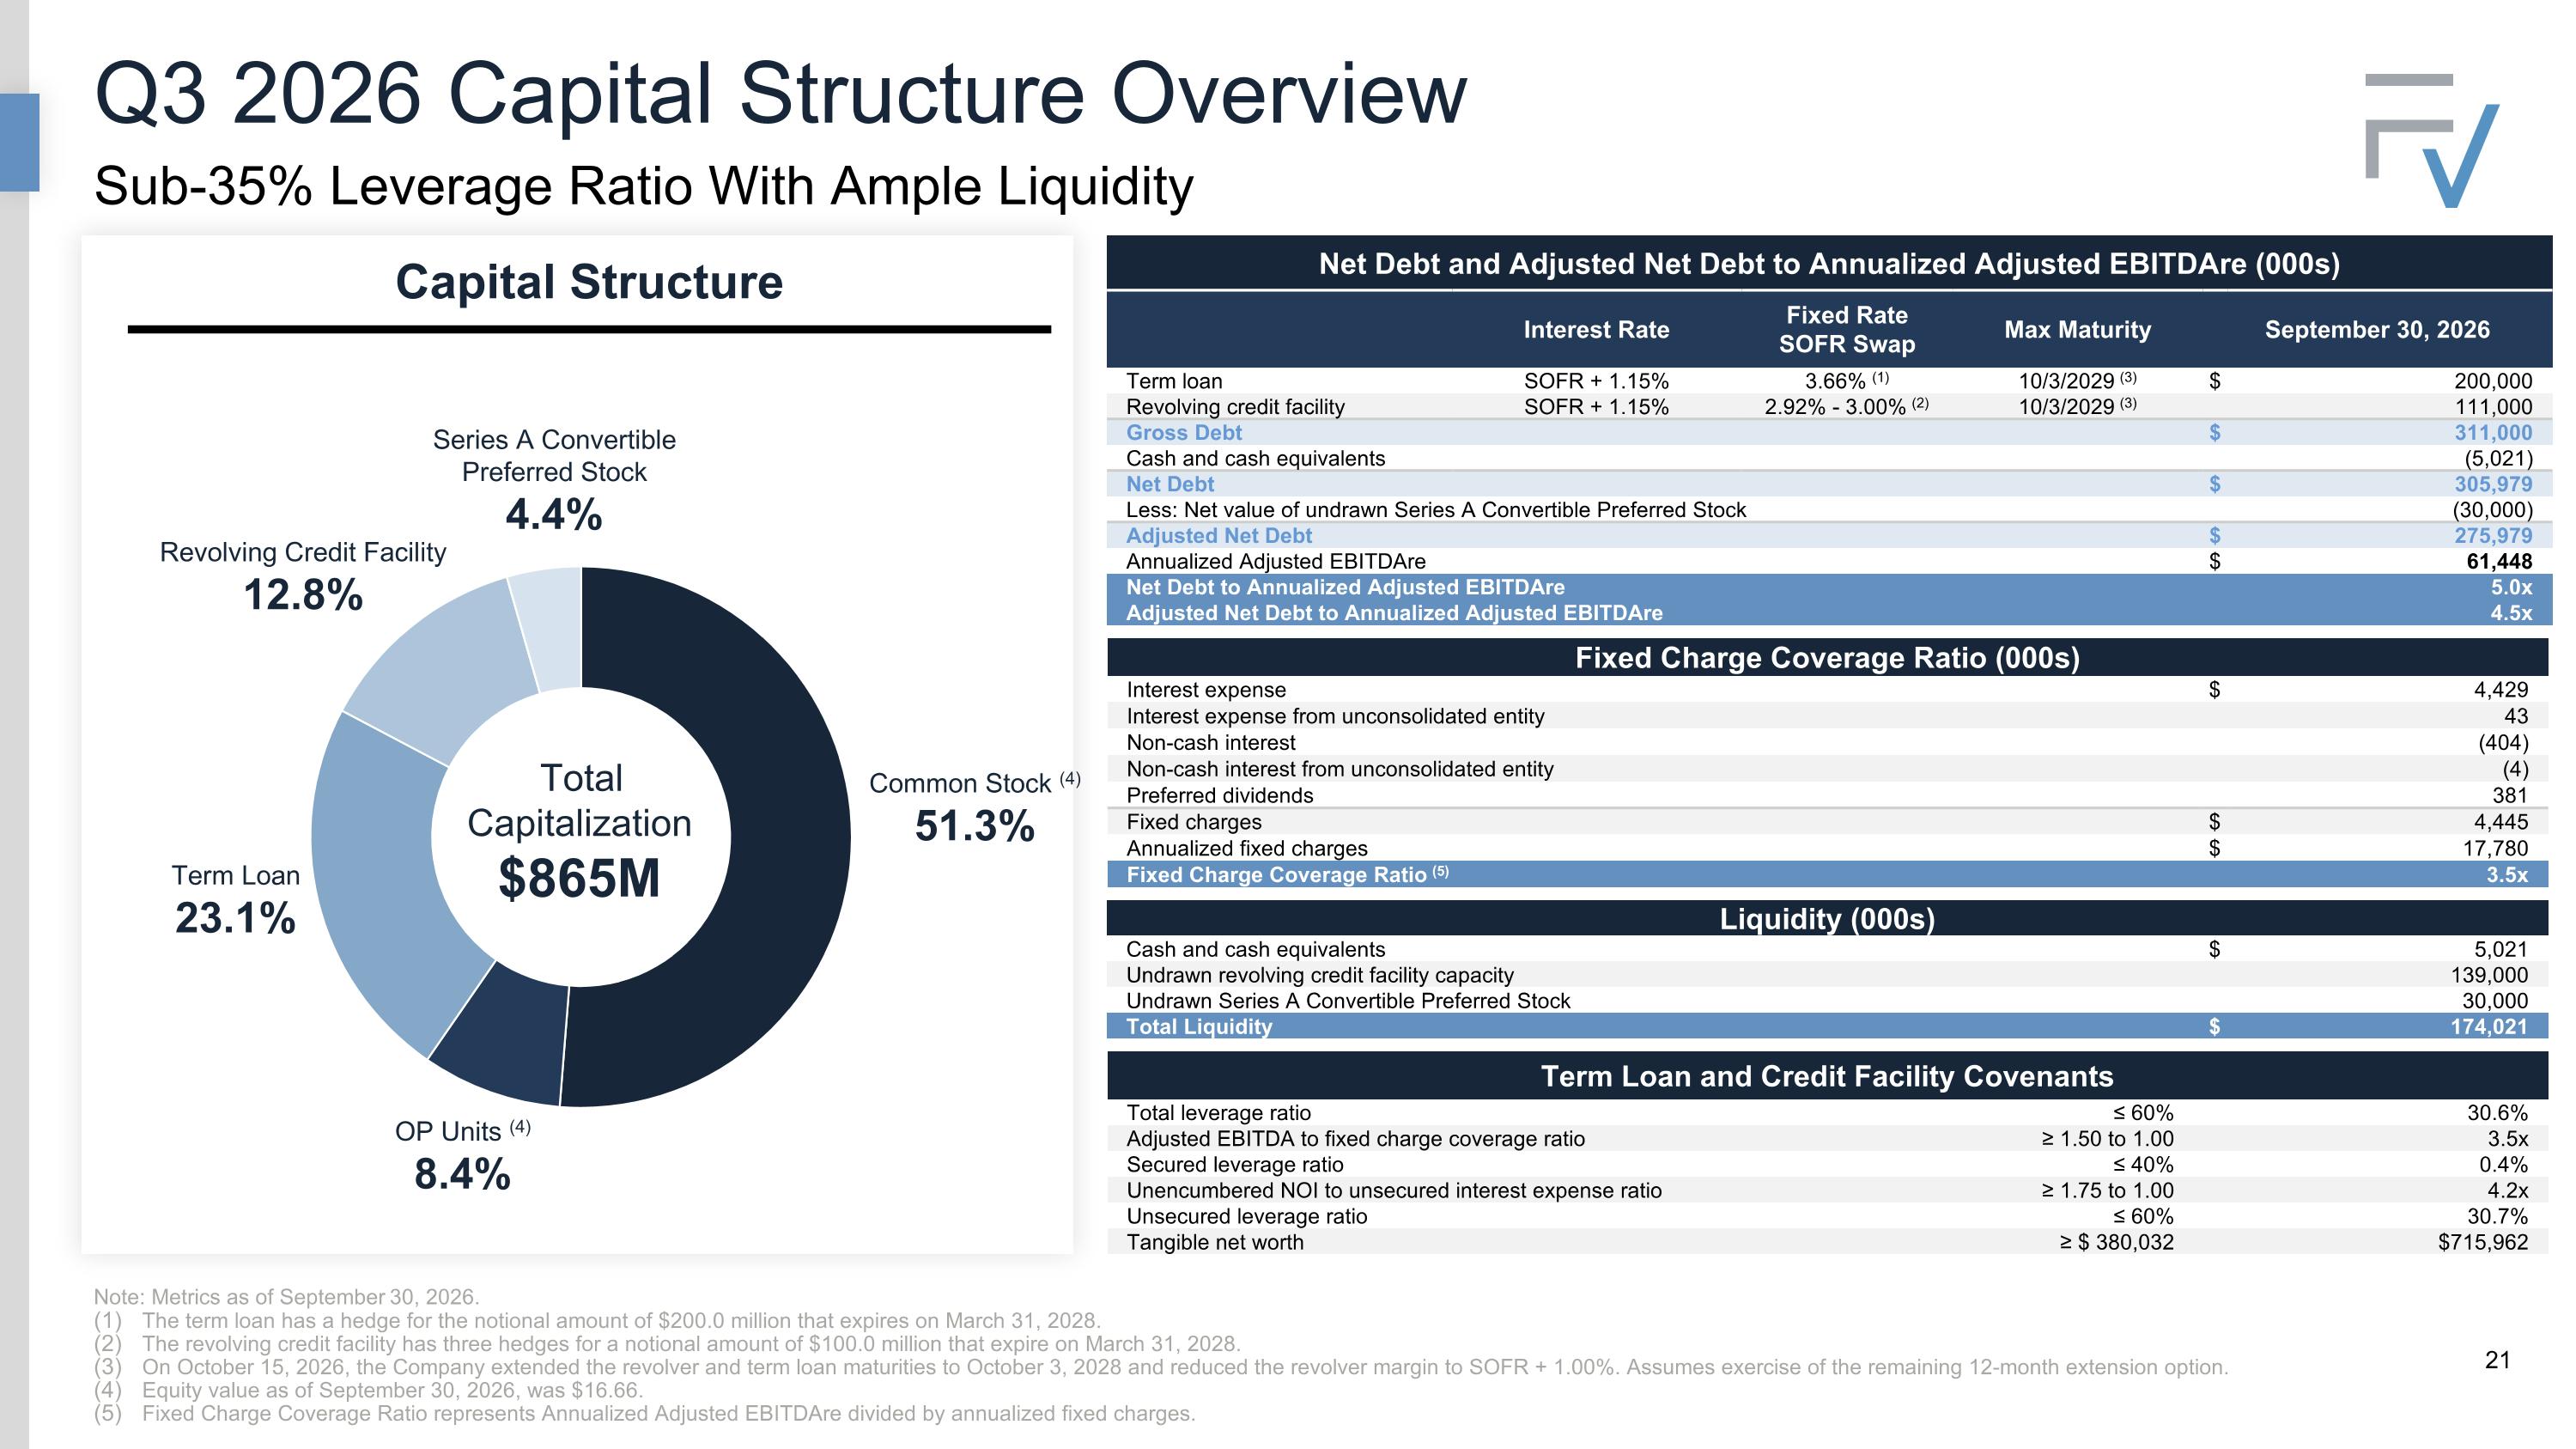
Q3 2026 Capital Structure Overview Sub-35% Leverage Ratio With Ample Liquidity Note: Metrics as of September 30, 2026. The term loan has a hedge for the notional amount of $200.0 million that expires on March 31, 2028. The revolving credit facility has three hedges for a notional amount of $100.0 million that expire on March 31, 2028. On October 15, 2026, the Company extended the revolver and term loan maturities to October 3, 2028 and reduced the revolver margin to SOFR + 1.00%. Assumes exercise of the remaining 12-month extension option. Equity value as of September 30, 2026, was $16.66. Fixed Charge Coverage Ratio represents Annualized Adjusted EBITDAre divided by annualized fixed charges. Capital Structure Total Capitalization $865M Common Stock (4) 51.3% OP Units (4) 8.4% Net Debt and Adjusted Net Debt to Annualized Adjusted EBITDAre (000s) Interest Rate Interest rate Fixed Rate SOFR Swap Max Maturity September 30, 2026 Term loan SOFR + 1.15% Adj. SOFR + 1.2%( 3.66% (1) 10/3/2029 (3) $ 200,000 Revolving credit facility SOFR + 1.15% Adj. SOFR + 1.20% 2.92% - 3.00% (2) 10/3/2029 (3) 111,000 Gross Debt $ 311,000 Cash and cash equivalents (5,021) Net Debt $ 305,979 Less: Net value of undrawn Series A Convertible Preferred Stock (30,000) Adjusted Net Debt $ 275,979 Annualized Adjusted EBITDAre $ 61,448 Net Debt to Annualized Adjusted EBITDAre 5.0x Adjusted Net Debt to Annualized Adjusted EBITDAre 4.5x Fixed Charge Coverage Ratio (000s) Interest expense $ 4,429 Interest expense from unconsolidated entity 43 Non-cash interest (404) Non-cash interest from unconsolidated entity (4) Preferred dividends 381 Fixed charges $ 4,445 Annualized fixed charges $ 17,780 Fixed Charge Coverage Ratio (5) 3.5x Liquidity (000s) Cash and cash equivalents $ 5,021 Undrawn revolving credit facility capacity 139,000 Undrawn Series A Convertible Preferred Stock 30,000 Total Liquidity $ 174,021 Term Loan and Credit Facility Covenants Total leverage ratio ≤ 60% 30.6% Adjusted EBITDA to fixed charge coverage ratio ≥ 1.50 to 1.00 3.5x Secured leverage ratio ≤ 40% 0.4% Unencumbered NOI to unsecured interest expense ratio ≥ 1.75 to 1.00 4.2x Unsecured leverage ratio ≤ 60% 30.7% Tangible net worth ≥ $ 380,032 $715,962 Series A Convertible Preferred Stock 4.4% Revolving Credit Facility 12.8% Term Loan 23.1%
Investment Opportunity
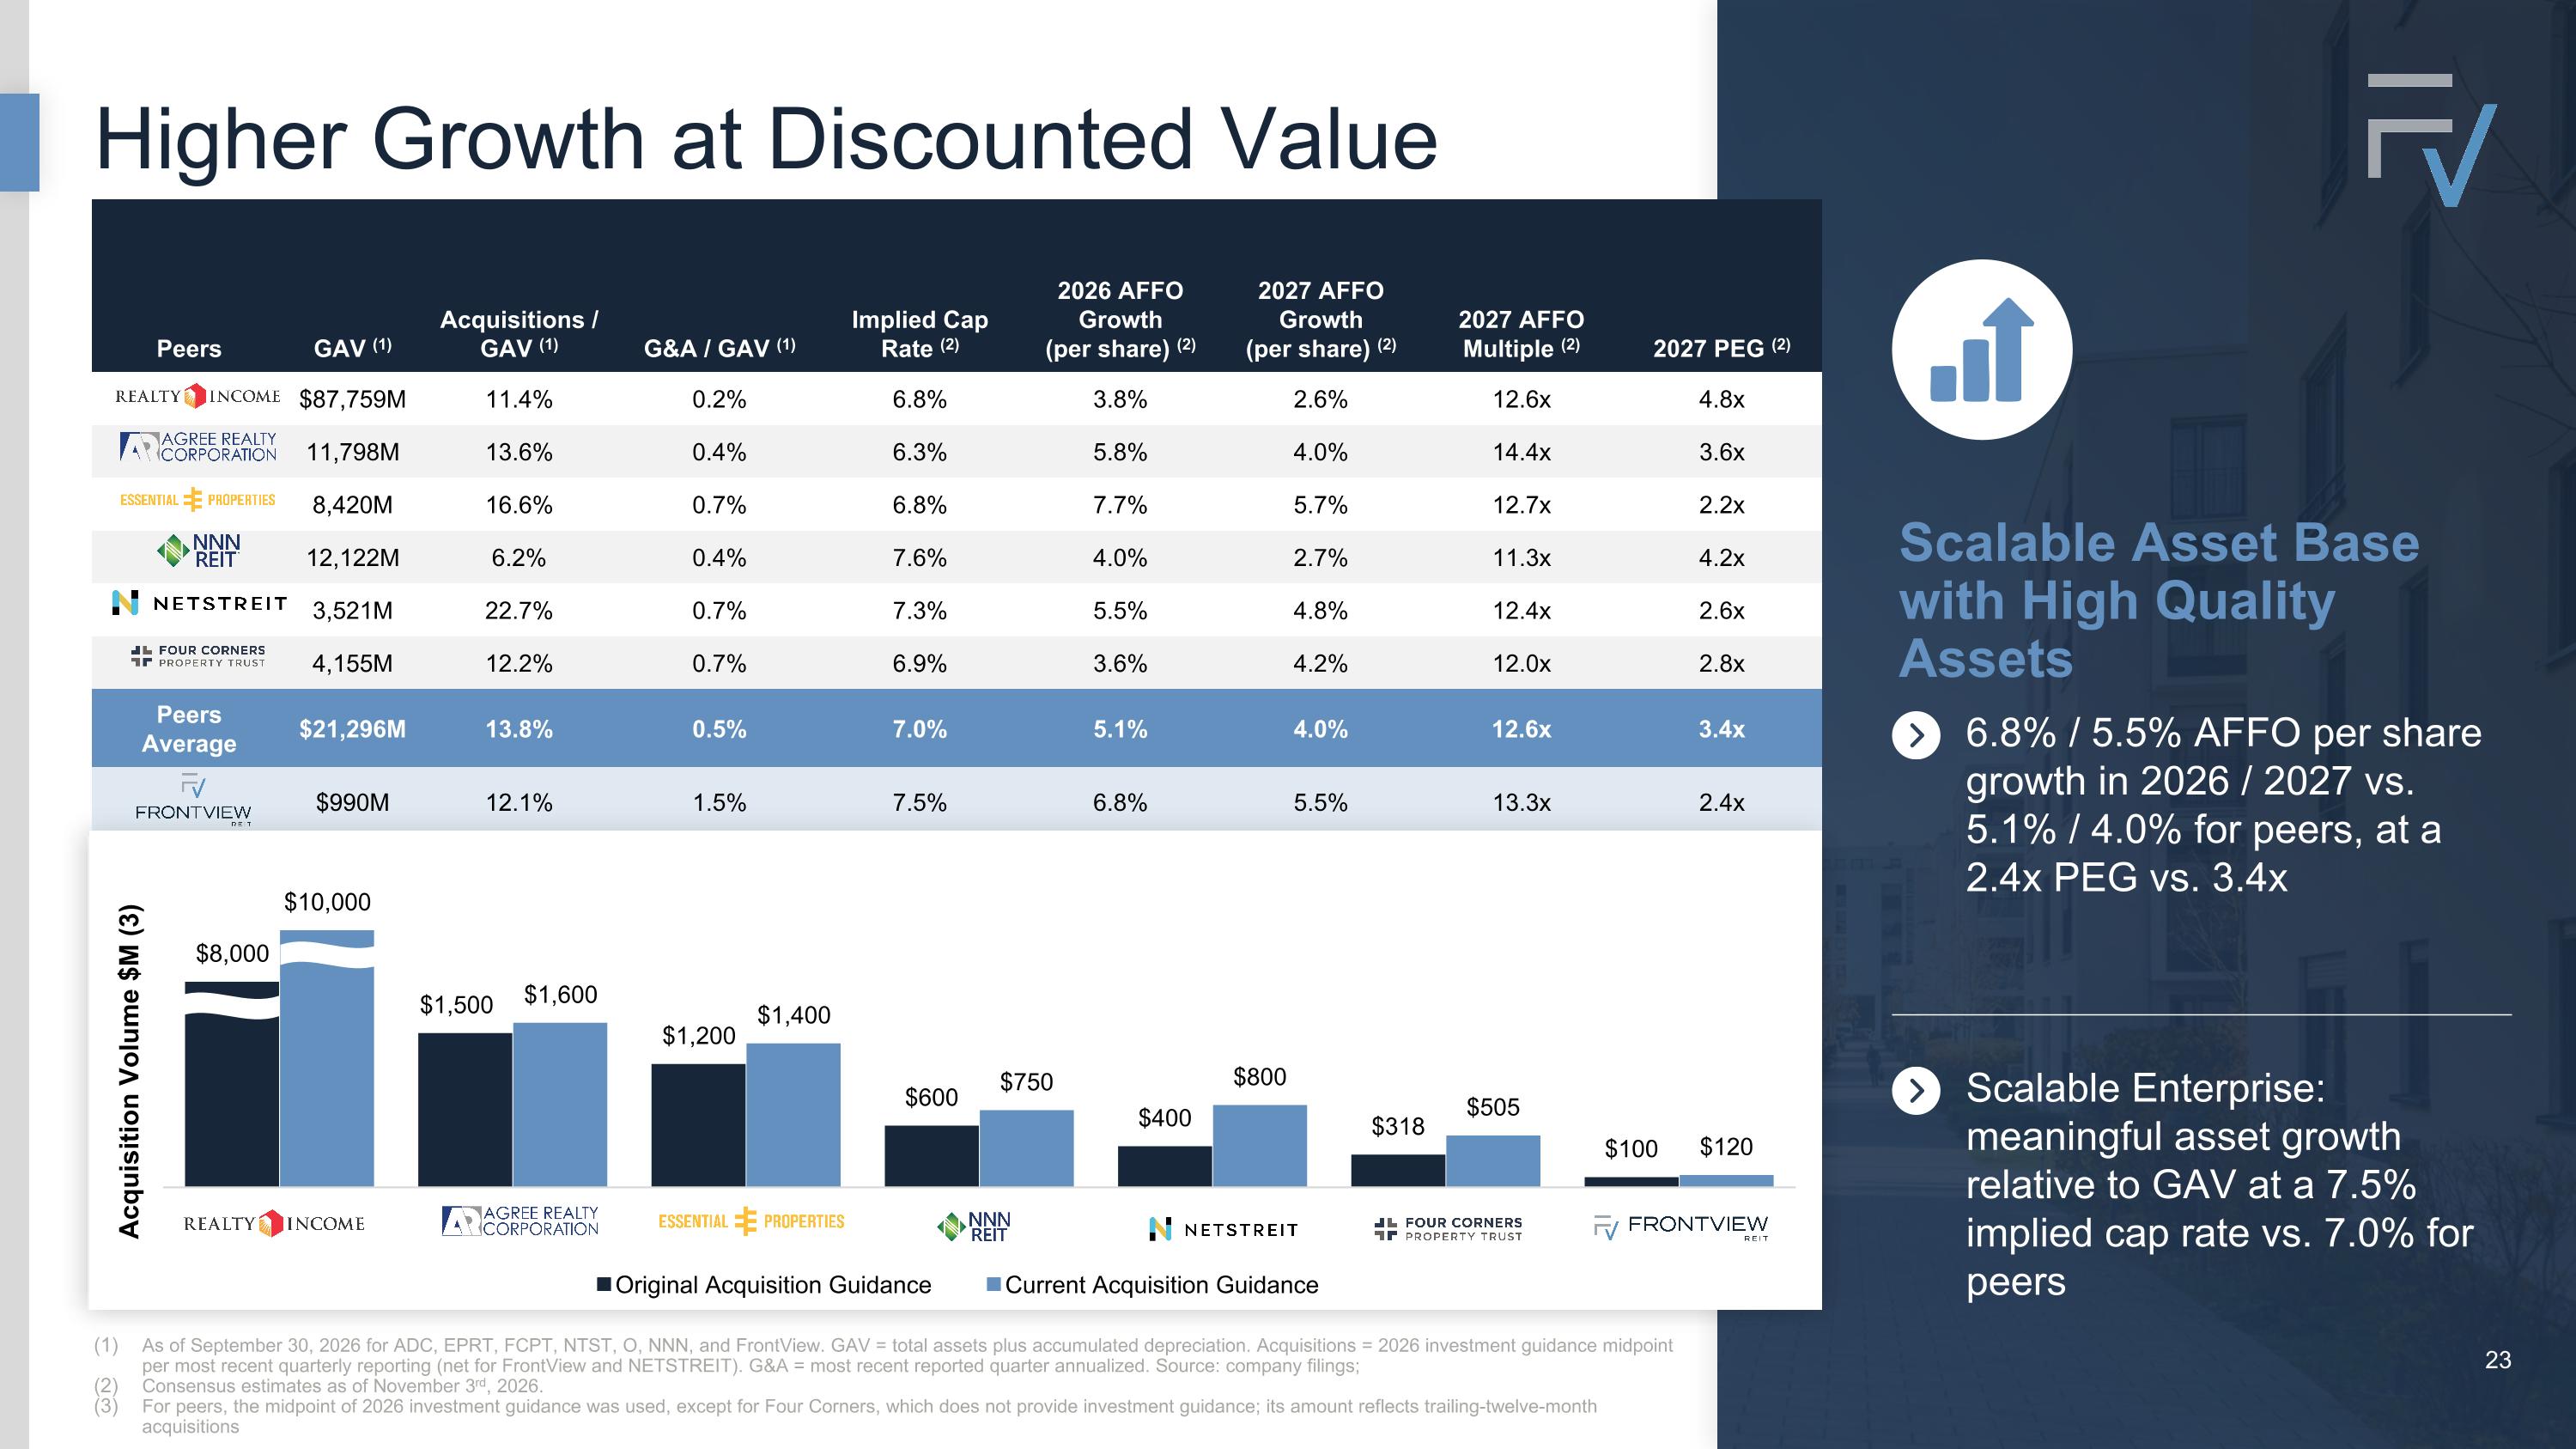
Higher Growth at Discounted Value Peers GAV (1) Acquisitions / GAV (1) G&A / GAV (1) Implied Cap Rate (2) 2026 AFFO Growth (per share) (2) 2027 AFFO Growth (per share) (2) 2027 AFFO Multiple (2) 2027 PEG (2) $87,759M 11.4% 0.2% 6.8% 3.8% 2.6% 12.6x 4.8x 11,798M 13.6% 0.4% 6.3% 5.8% 4.0% 14.4x 3.6x 8,420M 16.6% 0.7% 6.8% 7.7% 5.7% 12.7x 2.2x 12,122M 6.2% 0.4% 7.6% 4.0% 2.7% 11.3x 4.2x 3,521M 22.7% 0.7% 7.3% 5.5% 4.8% 12.4x 2.6x 4,155M 12.2% 0.7% 6.9% 3.6% 4.2% 12.0x 2.8x Peers Average $21,296M 13.8% 0.5% 7.0% 5.1% 4.0% 12.6x 3.4x $990M 12.1% 1.5% 7.5% 6.8% 5.5% 13.3x 2.4x Scalable Asset Base with High Quality Assets 6.8% / 5.5% AFFO per share growth in 2026 / 2027 vs. 5.1% / 4.0% for peers, at a 2.4x PEG vs. 3.4x Scalable Enterprise: meaningful asset growth relative to GAV at a 7.5% implied cap rate vs. 7.0% for peers As of September 30, 2026 for ADC, EPRT, FCPT, NTST, O, NNN, and FrontView. GAV = total assets plus accumulated depreciation. Acquisitions = 2026 investment guidance midpoint per most recent quarterly reporting (net for FrontView and NETSTREIT). G&A = most recent reported quarter annualized. Source: company filings; Consensus estimates as of November 3rd, 2026. For peers, the midpoint of 2026 investment guidance was used, except for Four Corners, which does not provide investment guidance; its amount reflects trailing-twelve-month acquisitions 23
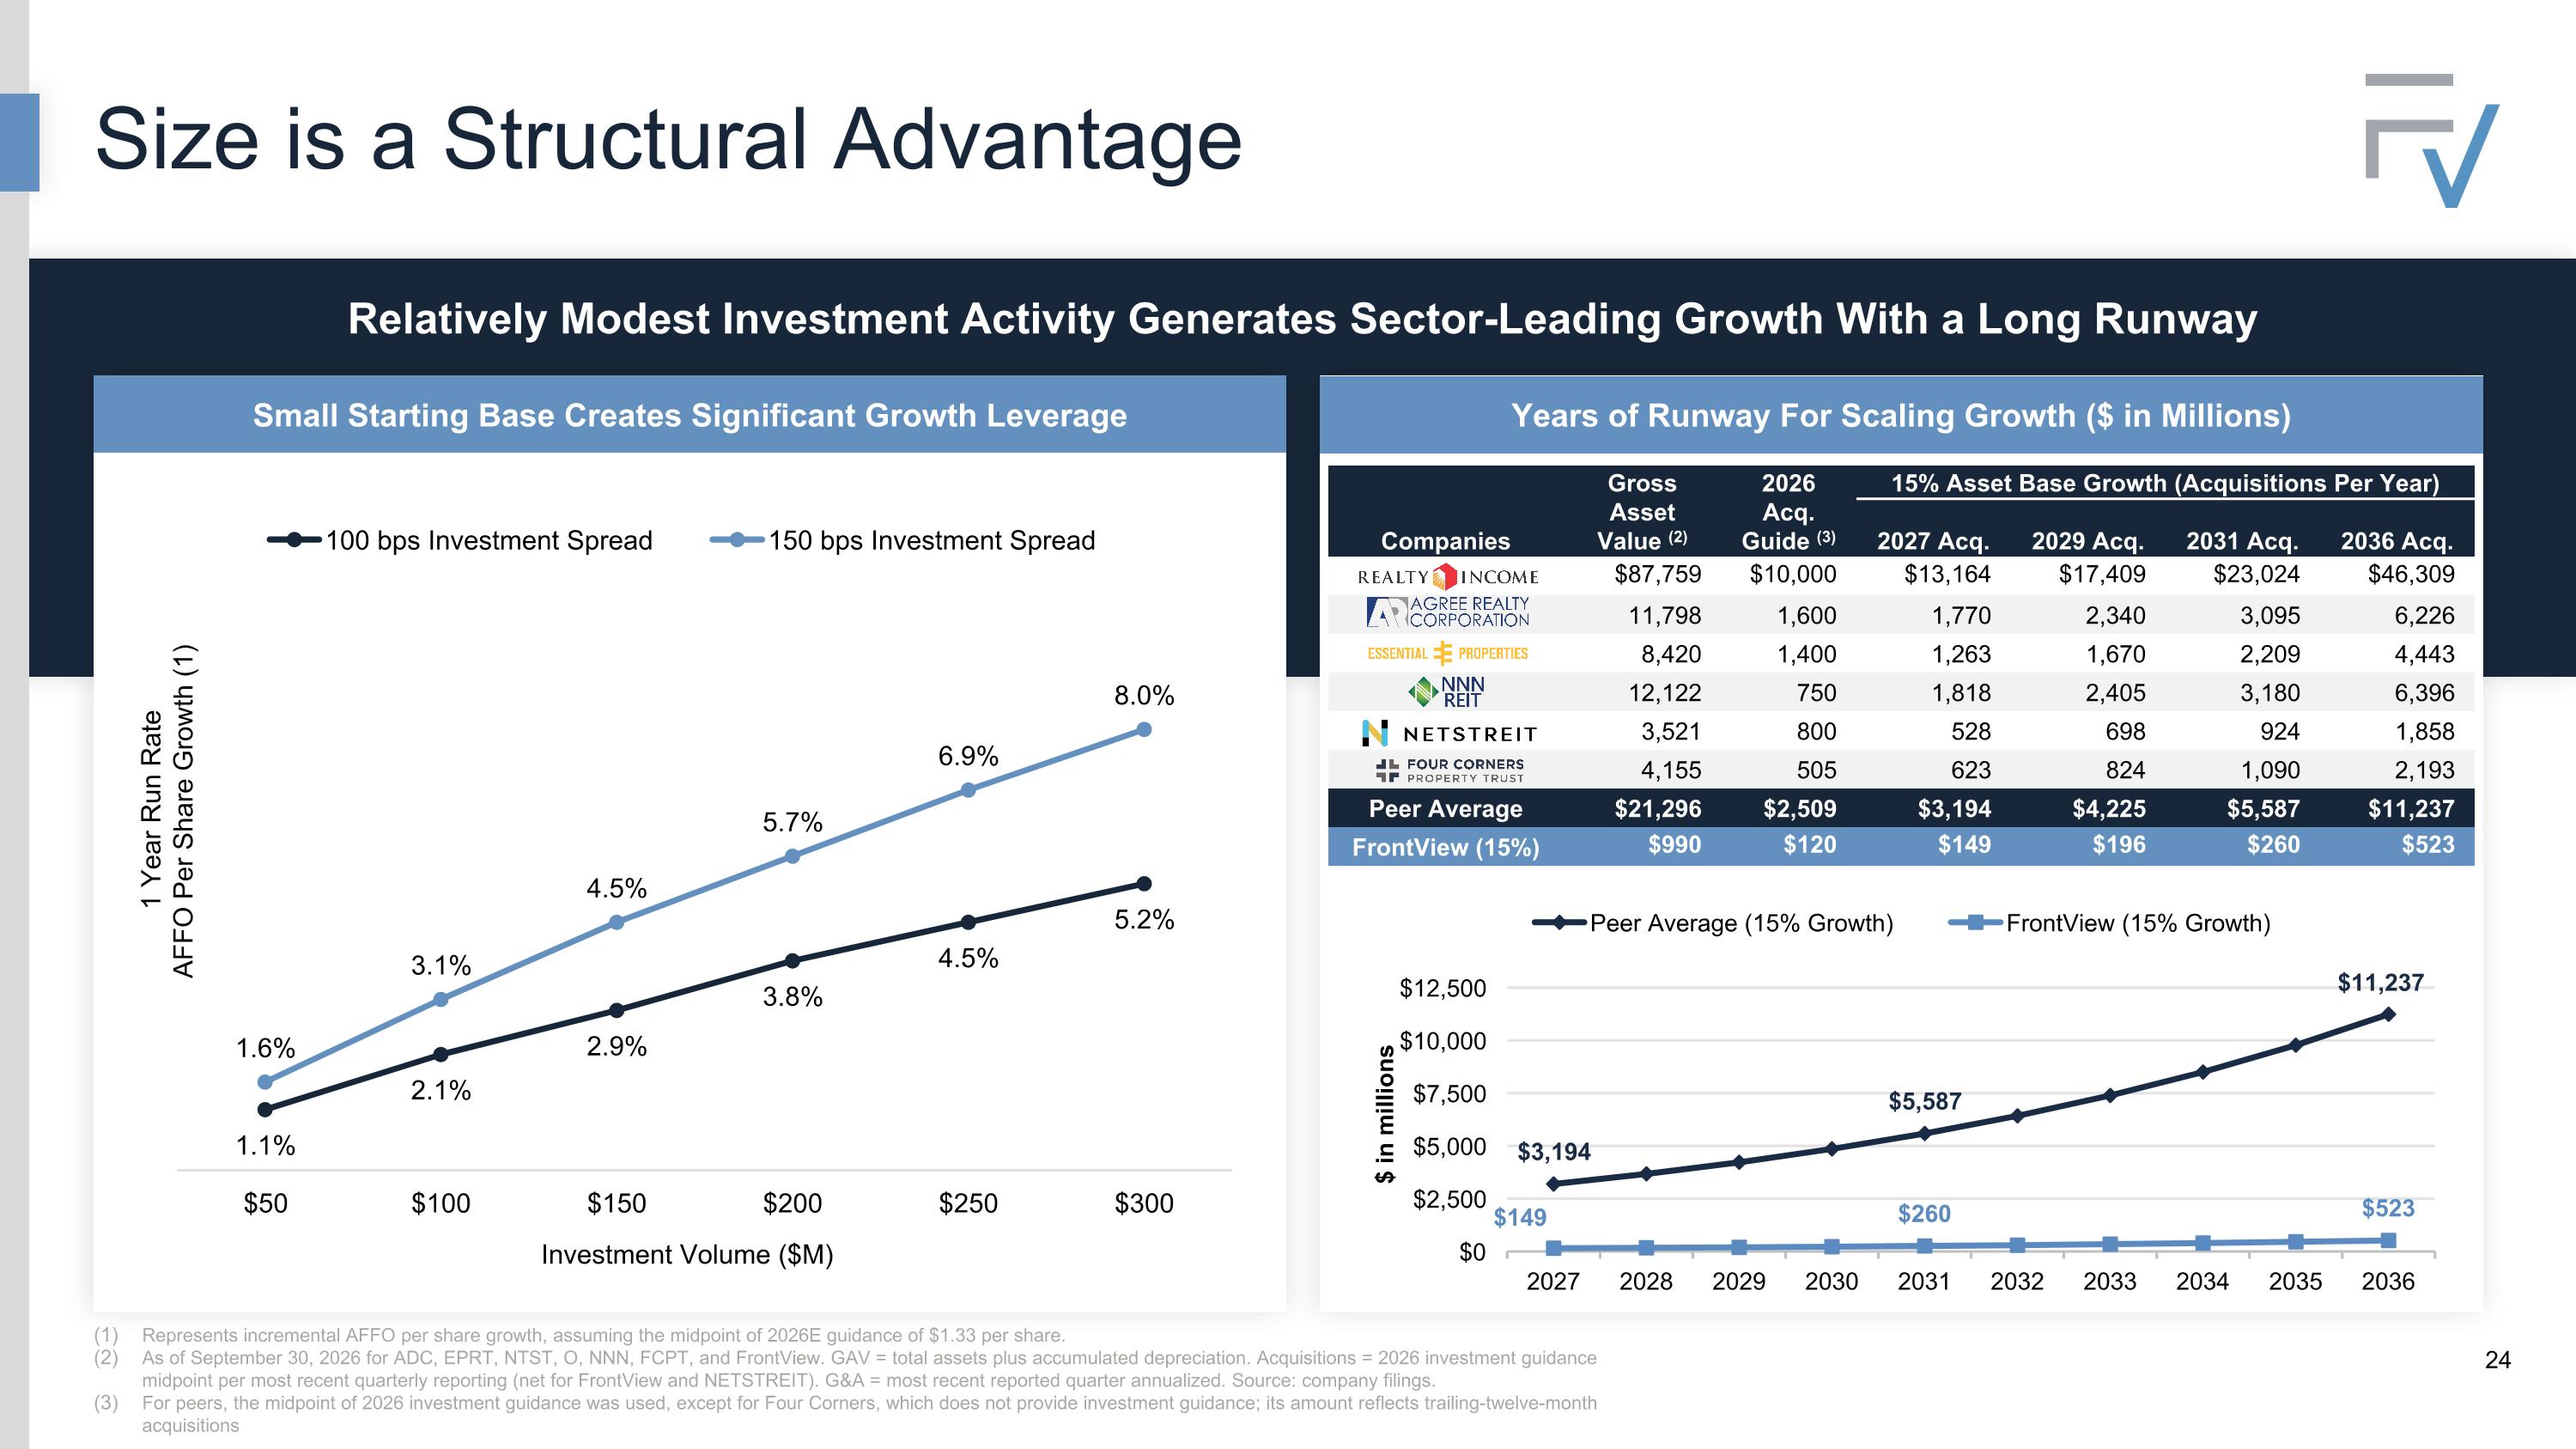
Size is a Structural Advantage Relatively Modest Investment Activity Generates Sector-Leading Growth With a Long Runway Represents incremental AFFO per share growth, assuming the midpoint of 2026E guidance of $1.33 per share. As of September 30, 2026 for ADC, EPRT, NTST, O, NNN, FCPT, and FrontView. GAV = total assets plus accumulated depreciation. Acquisitions = 2026 investment guidance midpoint per most recent quarterly reporting (net for FrontView and NETSTREIT). G&A = most recent reported quarter annualized. Source: company filings. For peers, the midpoint of 2026 investment guidance was used, except for Four Corners, which does not provide investment guidance; its amount reflects trailing-twelve-month acquisitions Small Starting Base Creates Significant Growth Leverage Years of Runway For Scaling Growth ($ in Millions) Companies Gross Asset Value (2) 2026 Acq. Guide (3) 15% Asset Base Growth (Acquisitions Per Year) 2027 Acq. 2029 Acq. 2031 Acq. 2036 Acq. $87,759 $10,000 $13,164 $17,409 $23,024 $46,309 11,798 1,600 1,770 2,340 3,095 6,226 8,420 1,400 1,263 1,670 2,209 4,443 12,122 750 1,818 2,405 3,180 6,396 3,521 800 528 698 924 1,858 4,155 505 623 824 1,090 2,193 Peer Average $21,296 $2,509 $3,194 $4,225 $5,587 $11,237 FrontView (15%) $990 $120 $149 $196 $260 $523
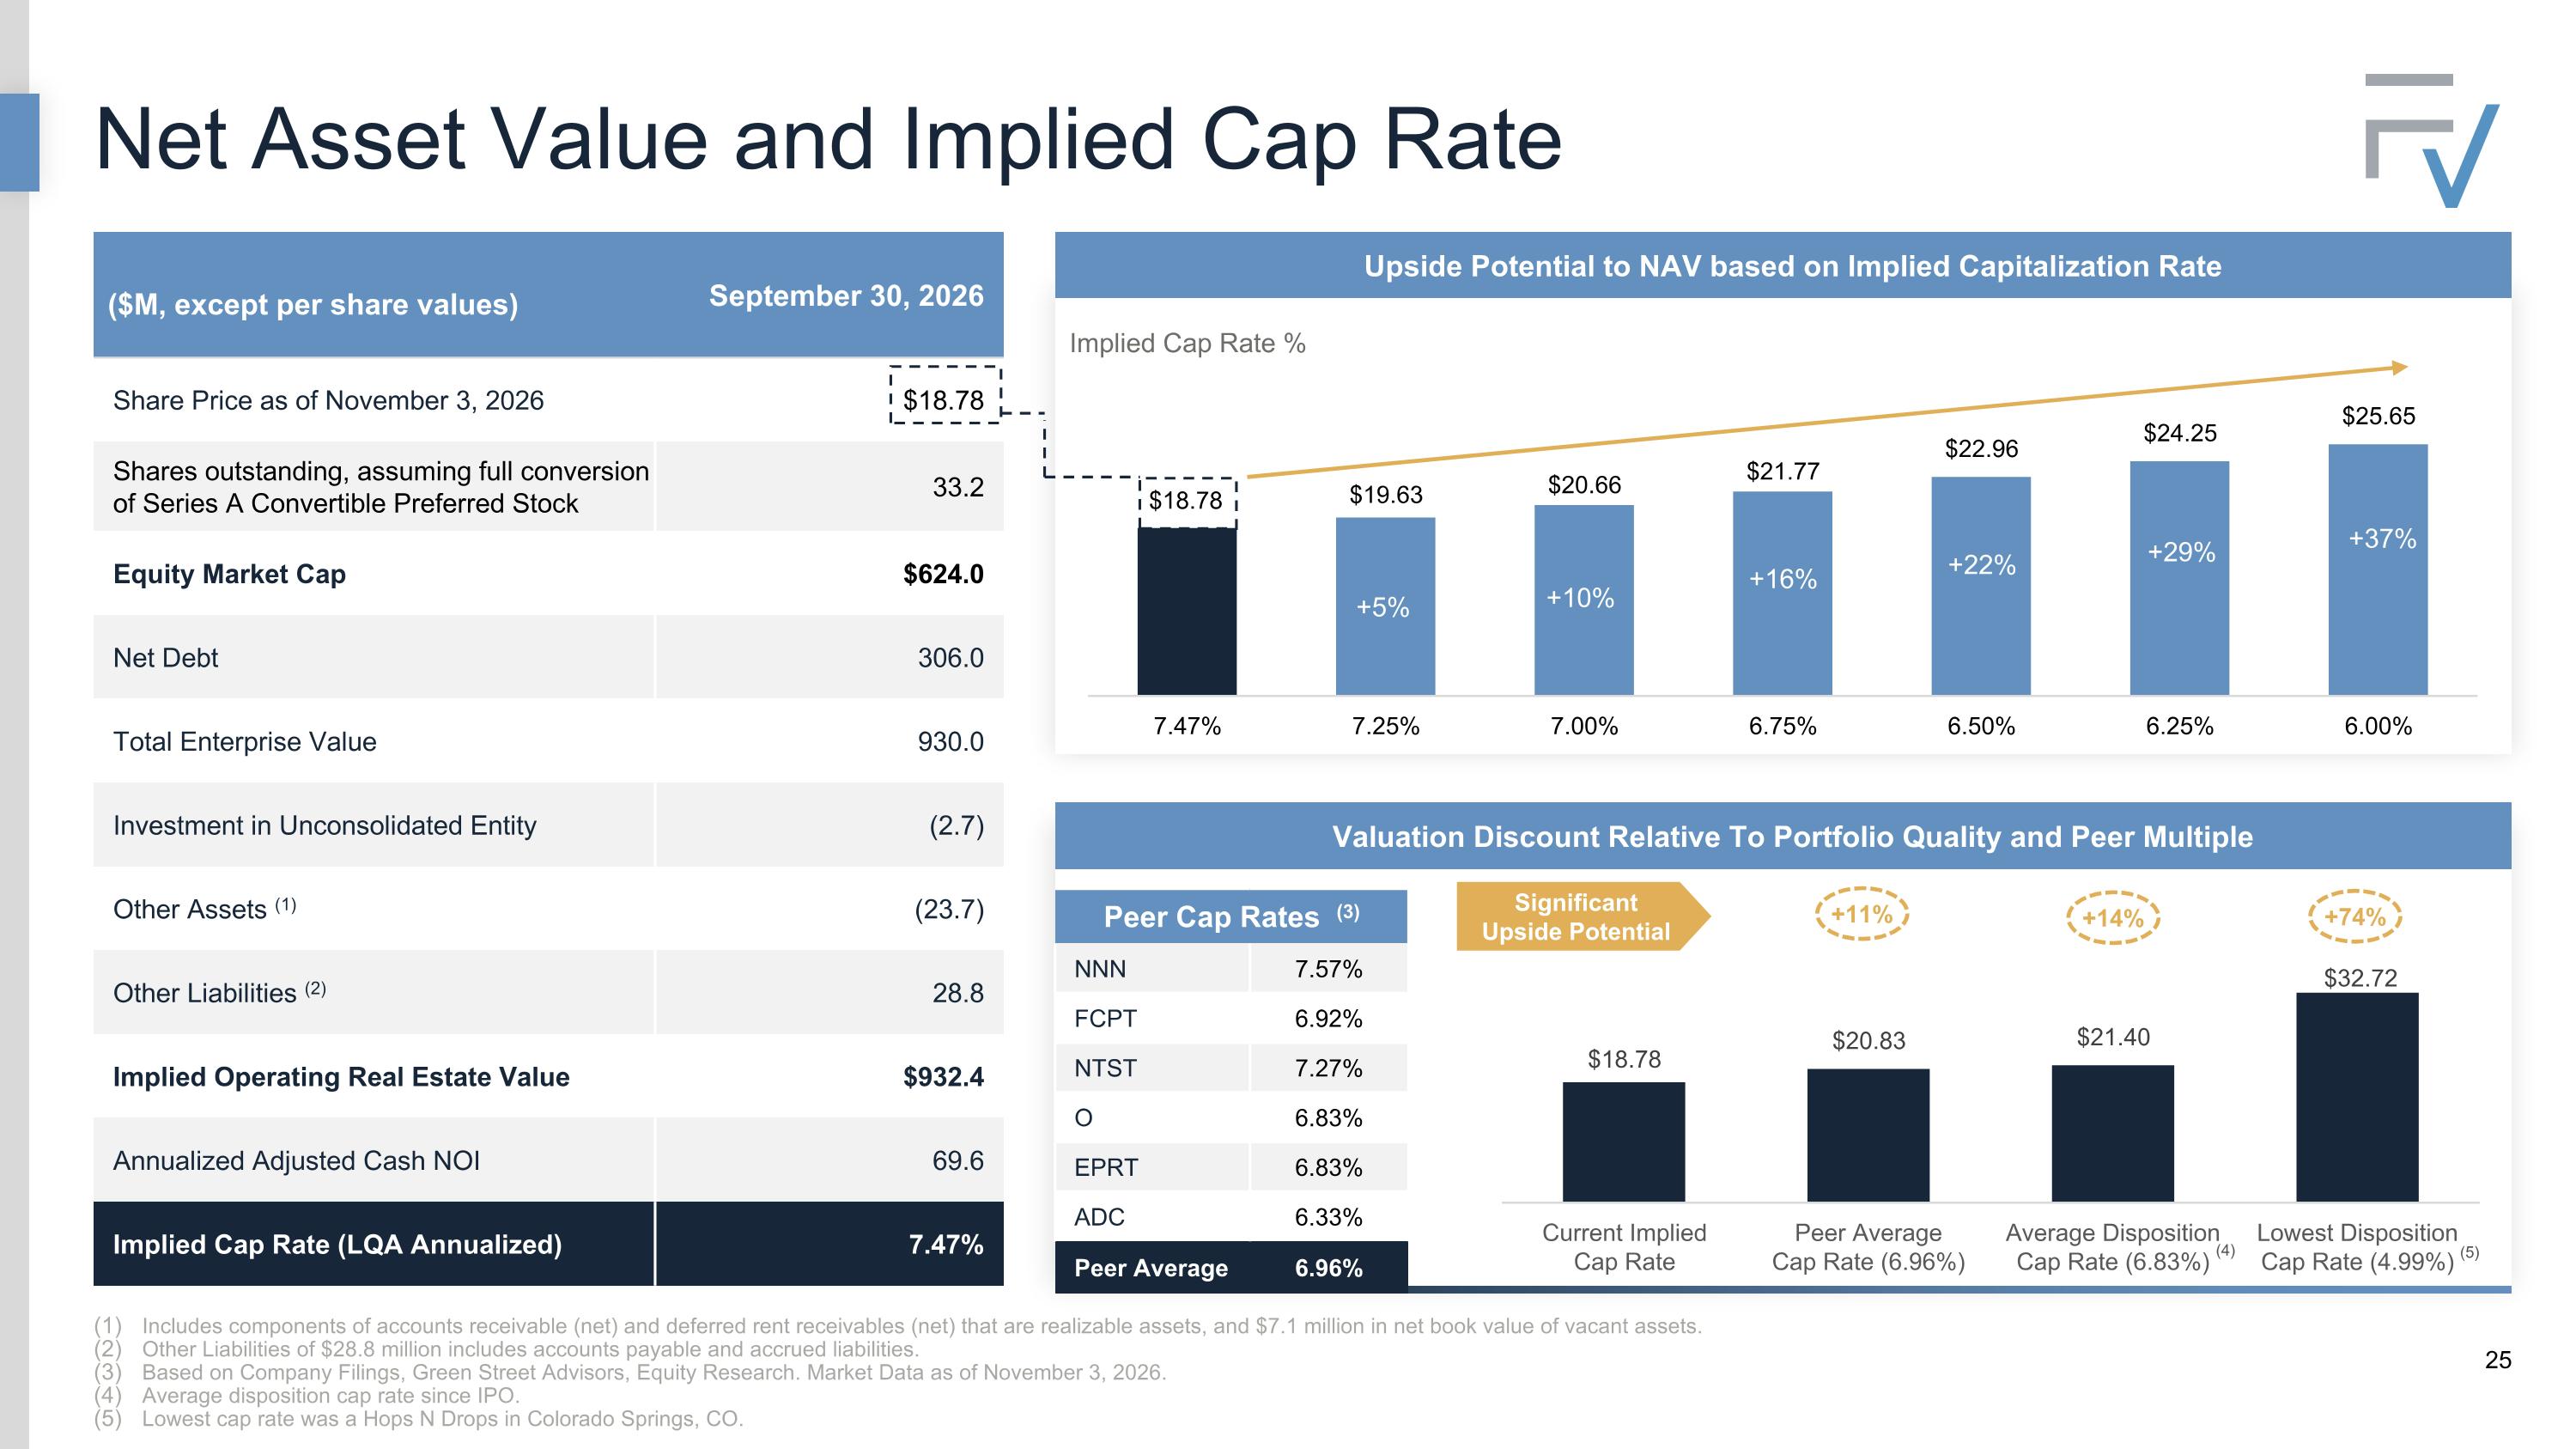
Net Asset Value and Implied Cap Rate Valuation Discount Relative To Portfolio Quality and Peer Multiple September 30, 2026 Share Price as of November 3, 2026 $18.78 Shares outstanding, assuming full conversion of Series A Convertible Preferred Stock 33.2 Equity Market Cap $624.0 Net Debt 306.0 Total Enterprise Value 930.0 Investment in Unconsolidated Entity (2.7) Other Assets (1) (23.7) Other Liabilities (2) 28.8 Implied Operating Real Estate Value $932.4 Annualized Adjusted Cash NOI 69.6 Implied Cap Rate (LQA Annualized) 7.47% Includes components of accounts receivable (net) and deferred rent receivables (net) that are realizable assets, and $7.1 million in net book value of vacant assets. Other Liabilities of $28.8 million includes accounts payable and accrued liabilities. Based on Company Filings, Green Street Advisors, Equity Research. Market Data as of November 3, 2026. Average disposition cap rate since IPO. Lowest cap rate was a Hops N Drops in Colorado Springs, CO. ($M, except per share values) Upside Potential to NAV based on Implied Capitalization Rate +5% +10% +16% +22% +29% +37% (4) Peer Cap Rates (3) NNN 7.57% FCPT 6.92% NTST 7.27% O 6.83% EPRT 6.83% ADC 6.33% Peer Average 6.96% +11% Significant Upside Potential +74% Implied Cap Rate % +14% (5)
Case Studies
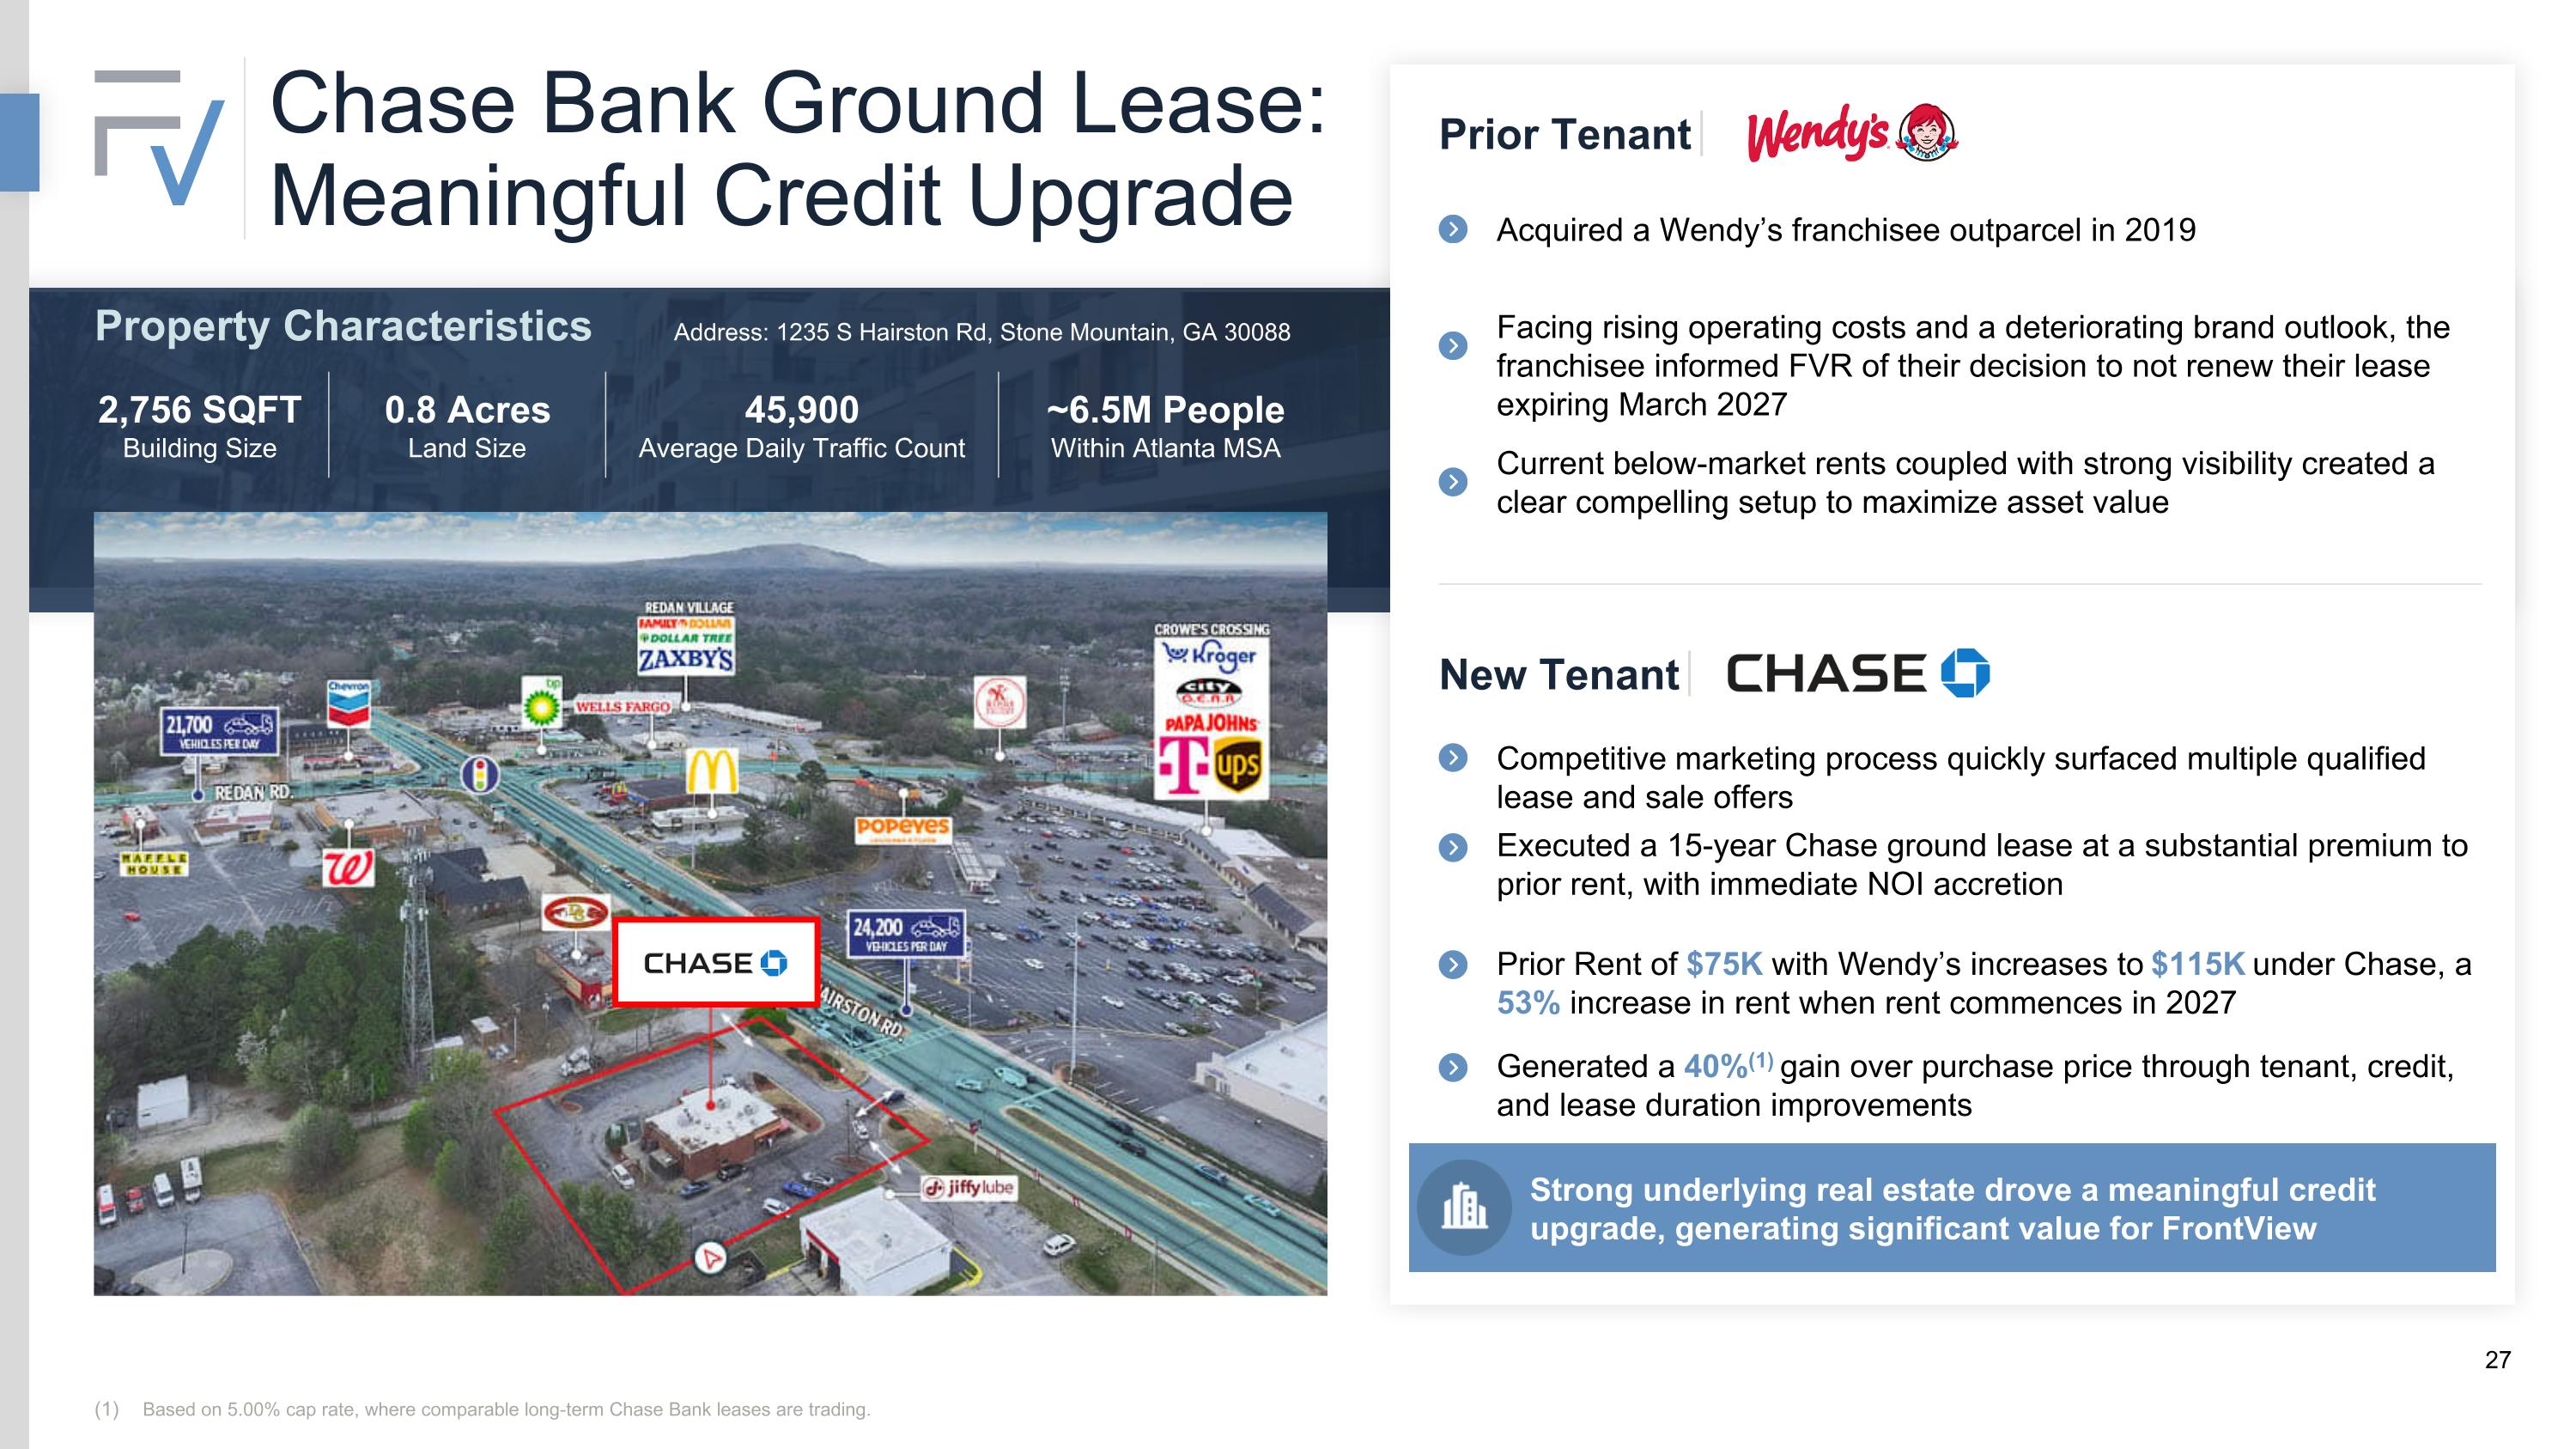
Strong underlying real estate drove a meaningful credit upgrade, generating significant value for FrontView 2,756 SQFT Building Size 45,900 Average Daily Traffic Count ~6.5M People Within Atlanta MSA 0.8 Acres Land Size Based on 5.00% cap rate, where comparable long-term Chase Bank leases are trading. New Tenant Competitive marketing process quickly surfaced multiple qualified lease and sale offers Executed a 15-year Chase ground lease at a substantial premium to prior rent, with immediate NOI accretion Generated a 40%(1) gain over purchase price through tenant, credit, and lease duration improvements Acquired a Wendy’s franchisee outparcel in 2019 Facing rising operating costs and a deteriorating brand outlook, the franchisee informed FVR of their decision to not renew their lease expiring March 2027 Current below-market rents coupled with strong visibility created a clear compelling setup to maximize asset value Prior Tenant Chase Bank Ground Lease: Meaningful Credit Upgrade Prior Rent of $75K with Wendy’s increases to $115K under Chase, a 53% increase in rent when rent commences in 2027 Property Characteristics Address: 1235 S Hairston Rd, Stone Mountain, GA 30088
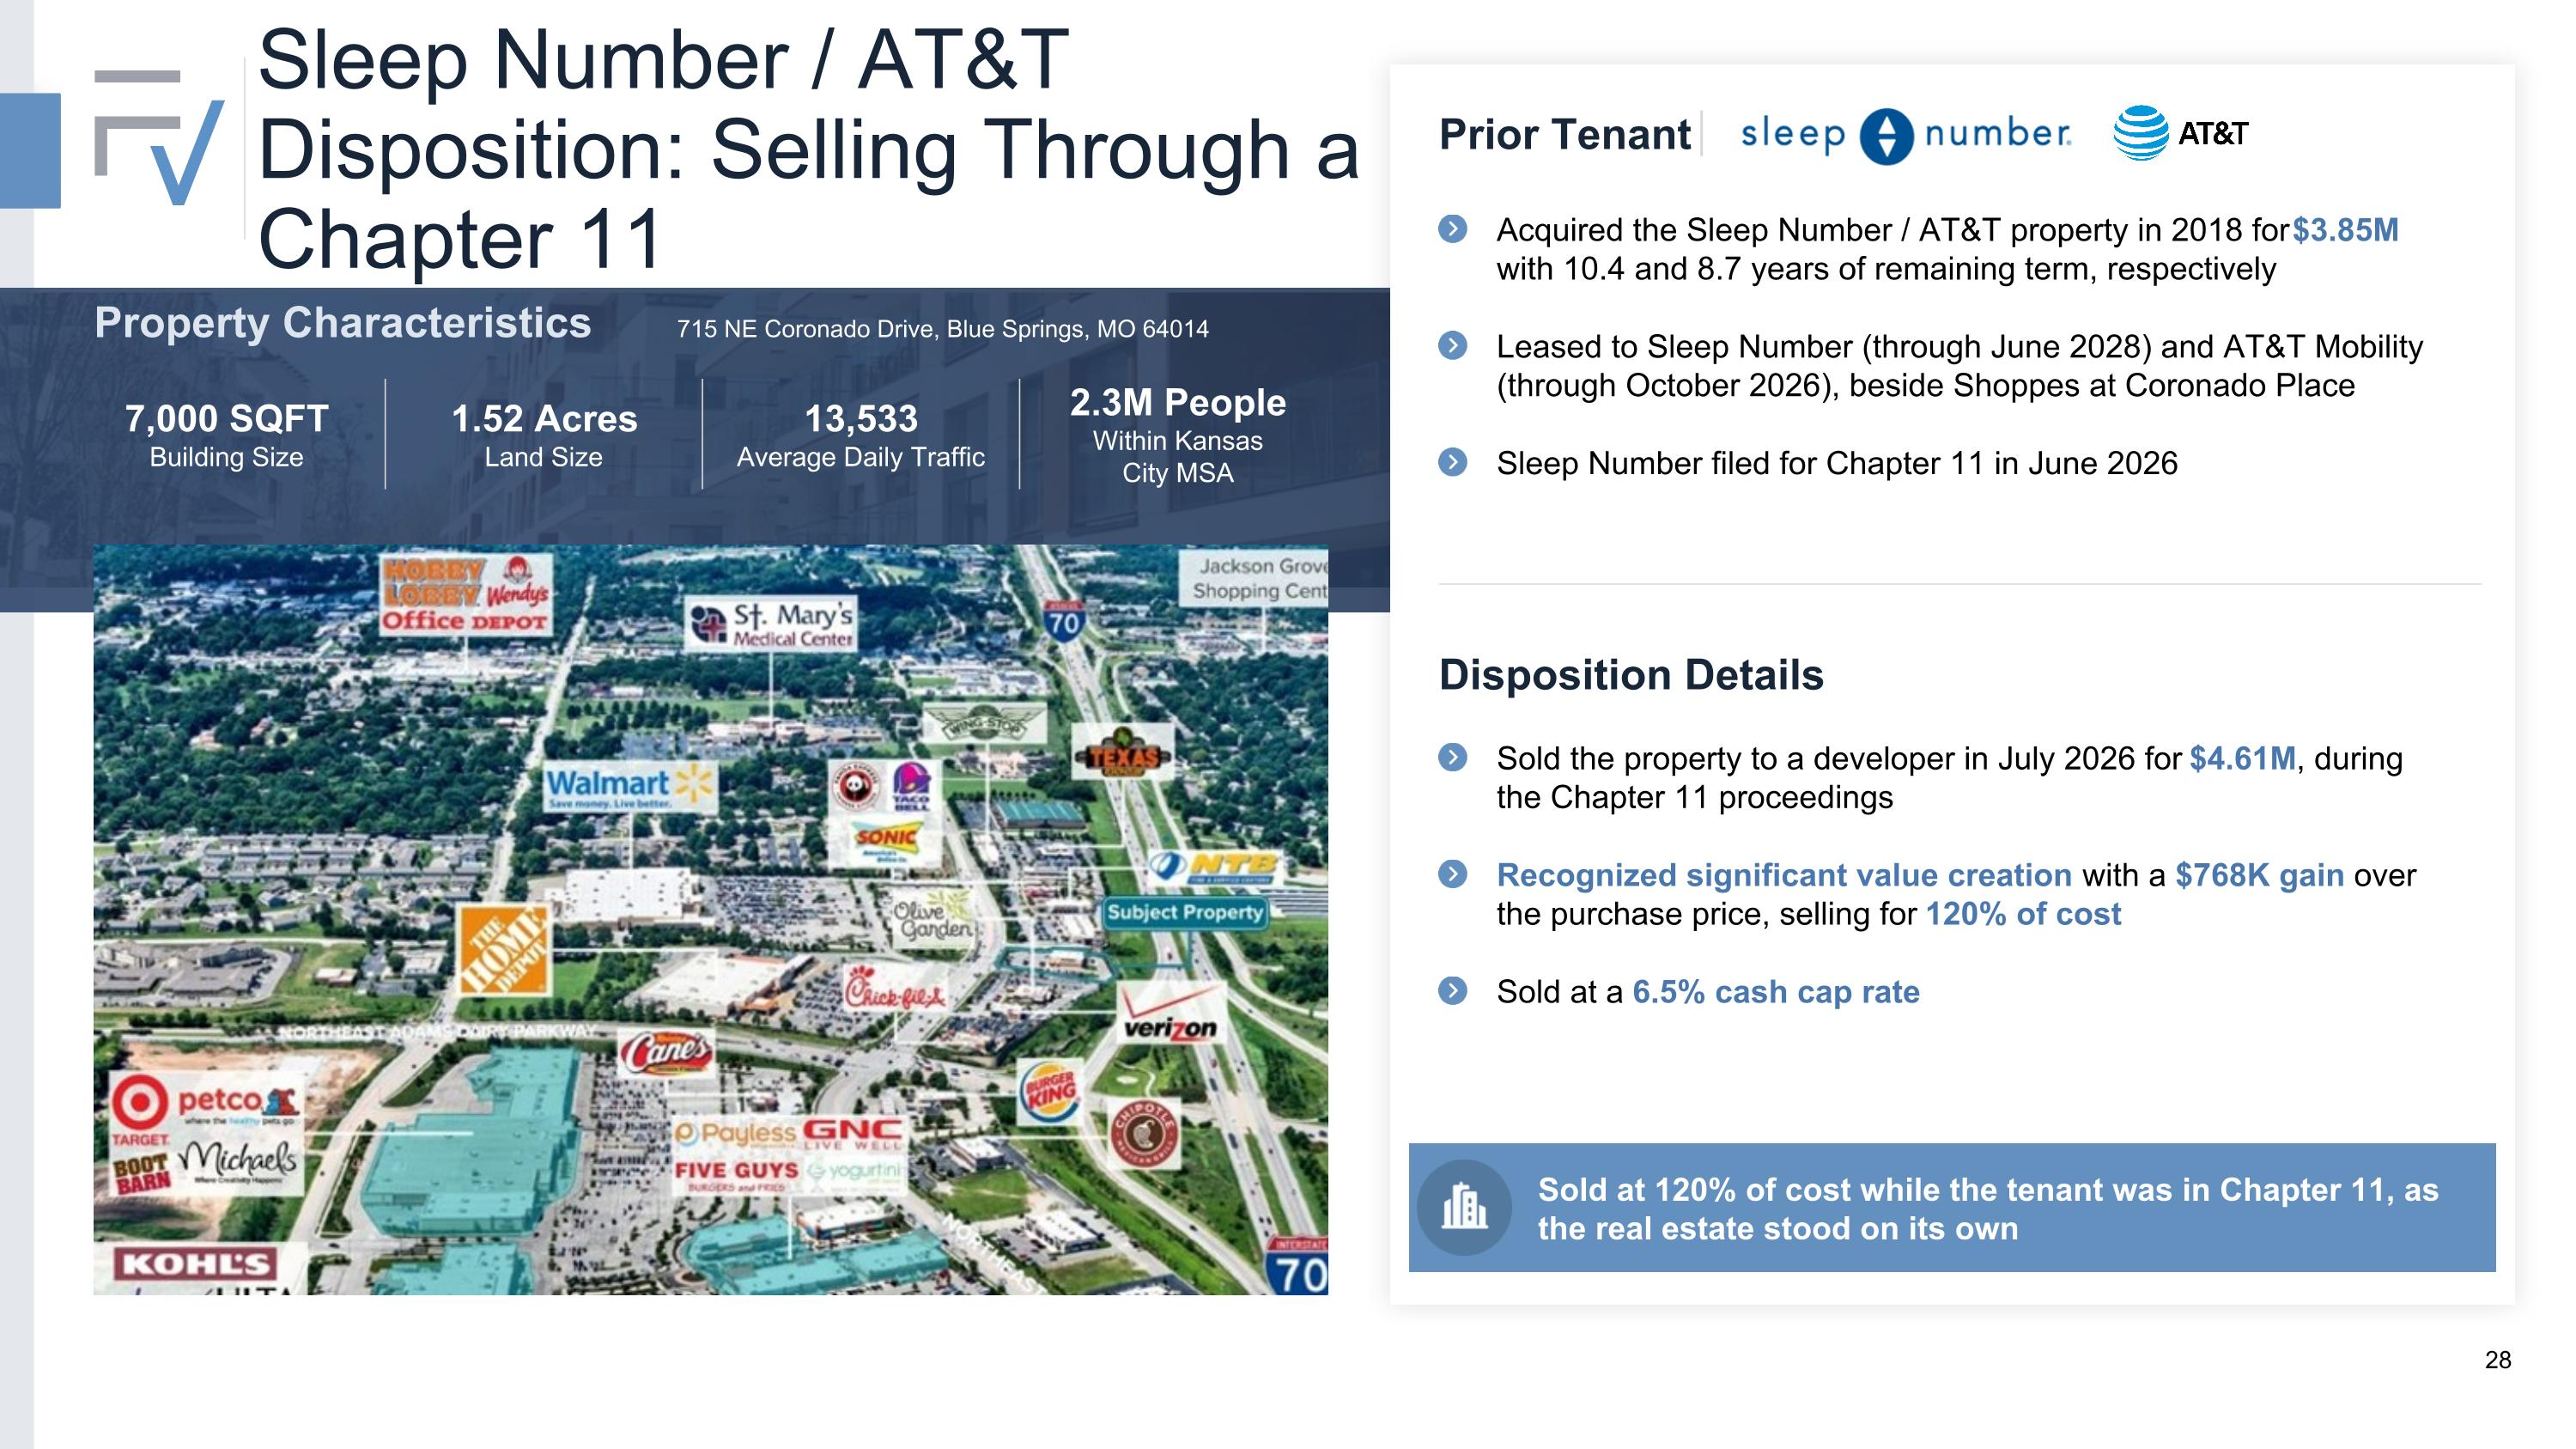
Sleep Number / AT&T Disposition: Selling Through a Chapter 11 Property Characteristics 715 NE Coronado Drive, Blue Springs, MO 64014 7,000 SQFT Building Size 1.52 Acres Land Size 13,533 Average Daily Traffic 2.3M People Within Kansas City MSA Disposition Details Sold the property to a developer in July 2026 for $4.61M, during the Chapter 11 proceedings Recognized significant value creation with a $768K gain over the purchase price, selling for 120% of cost Sold at a 6.5% cash cap rate Acquired the Sleep Number / AT&T property in 2018 for $3.85M with 10.4 and 8.7 years of remaining term, respectively Leased to Sleep Number (through June 2028) and AT&T Mobility (through October 2026), beside Shoppes at Coronado Place Sleep Number filed for Chapter 11 in June 2026 Prior Tenant Sold at 120% of cost while the tenant was in Chapter 11, as the real estate stood on its own
Non-GAAP Reconciliations
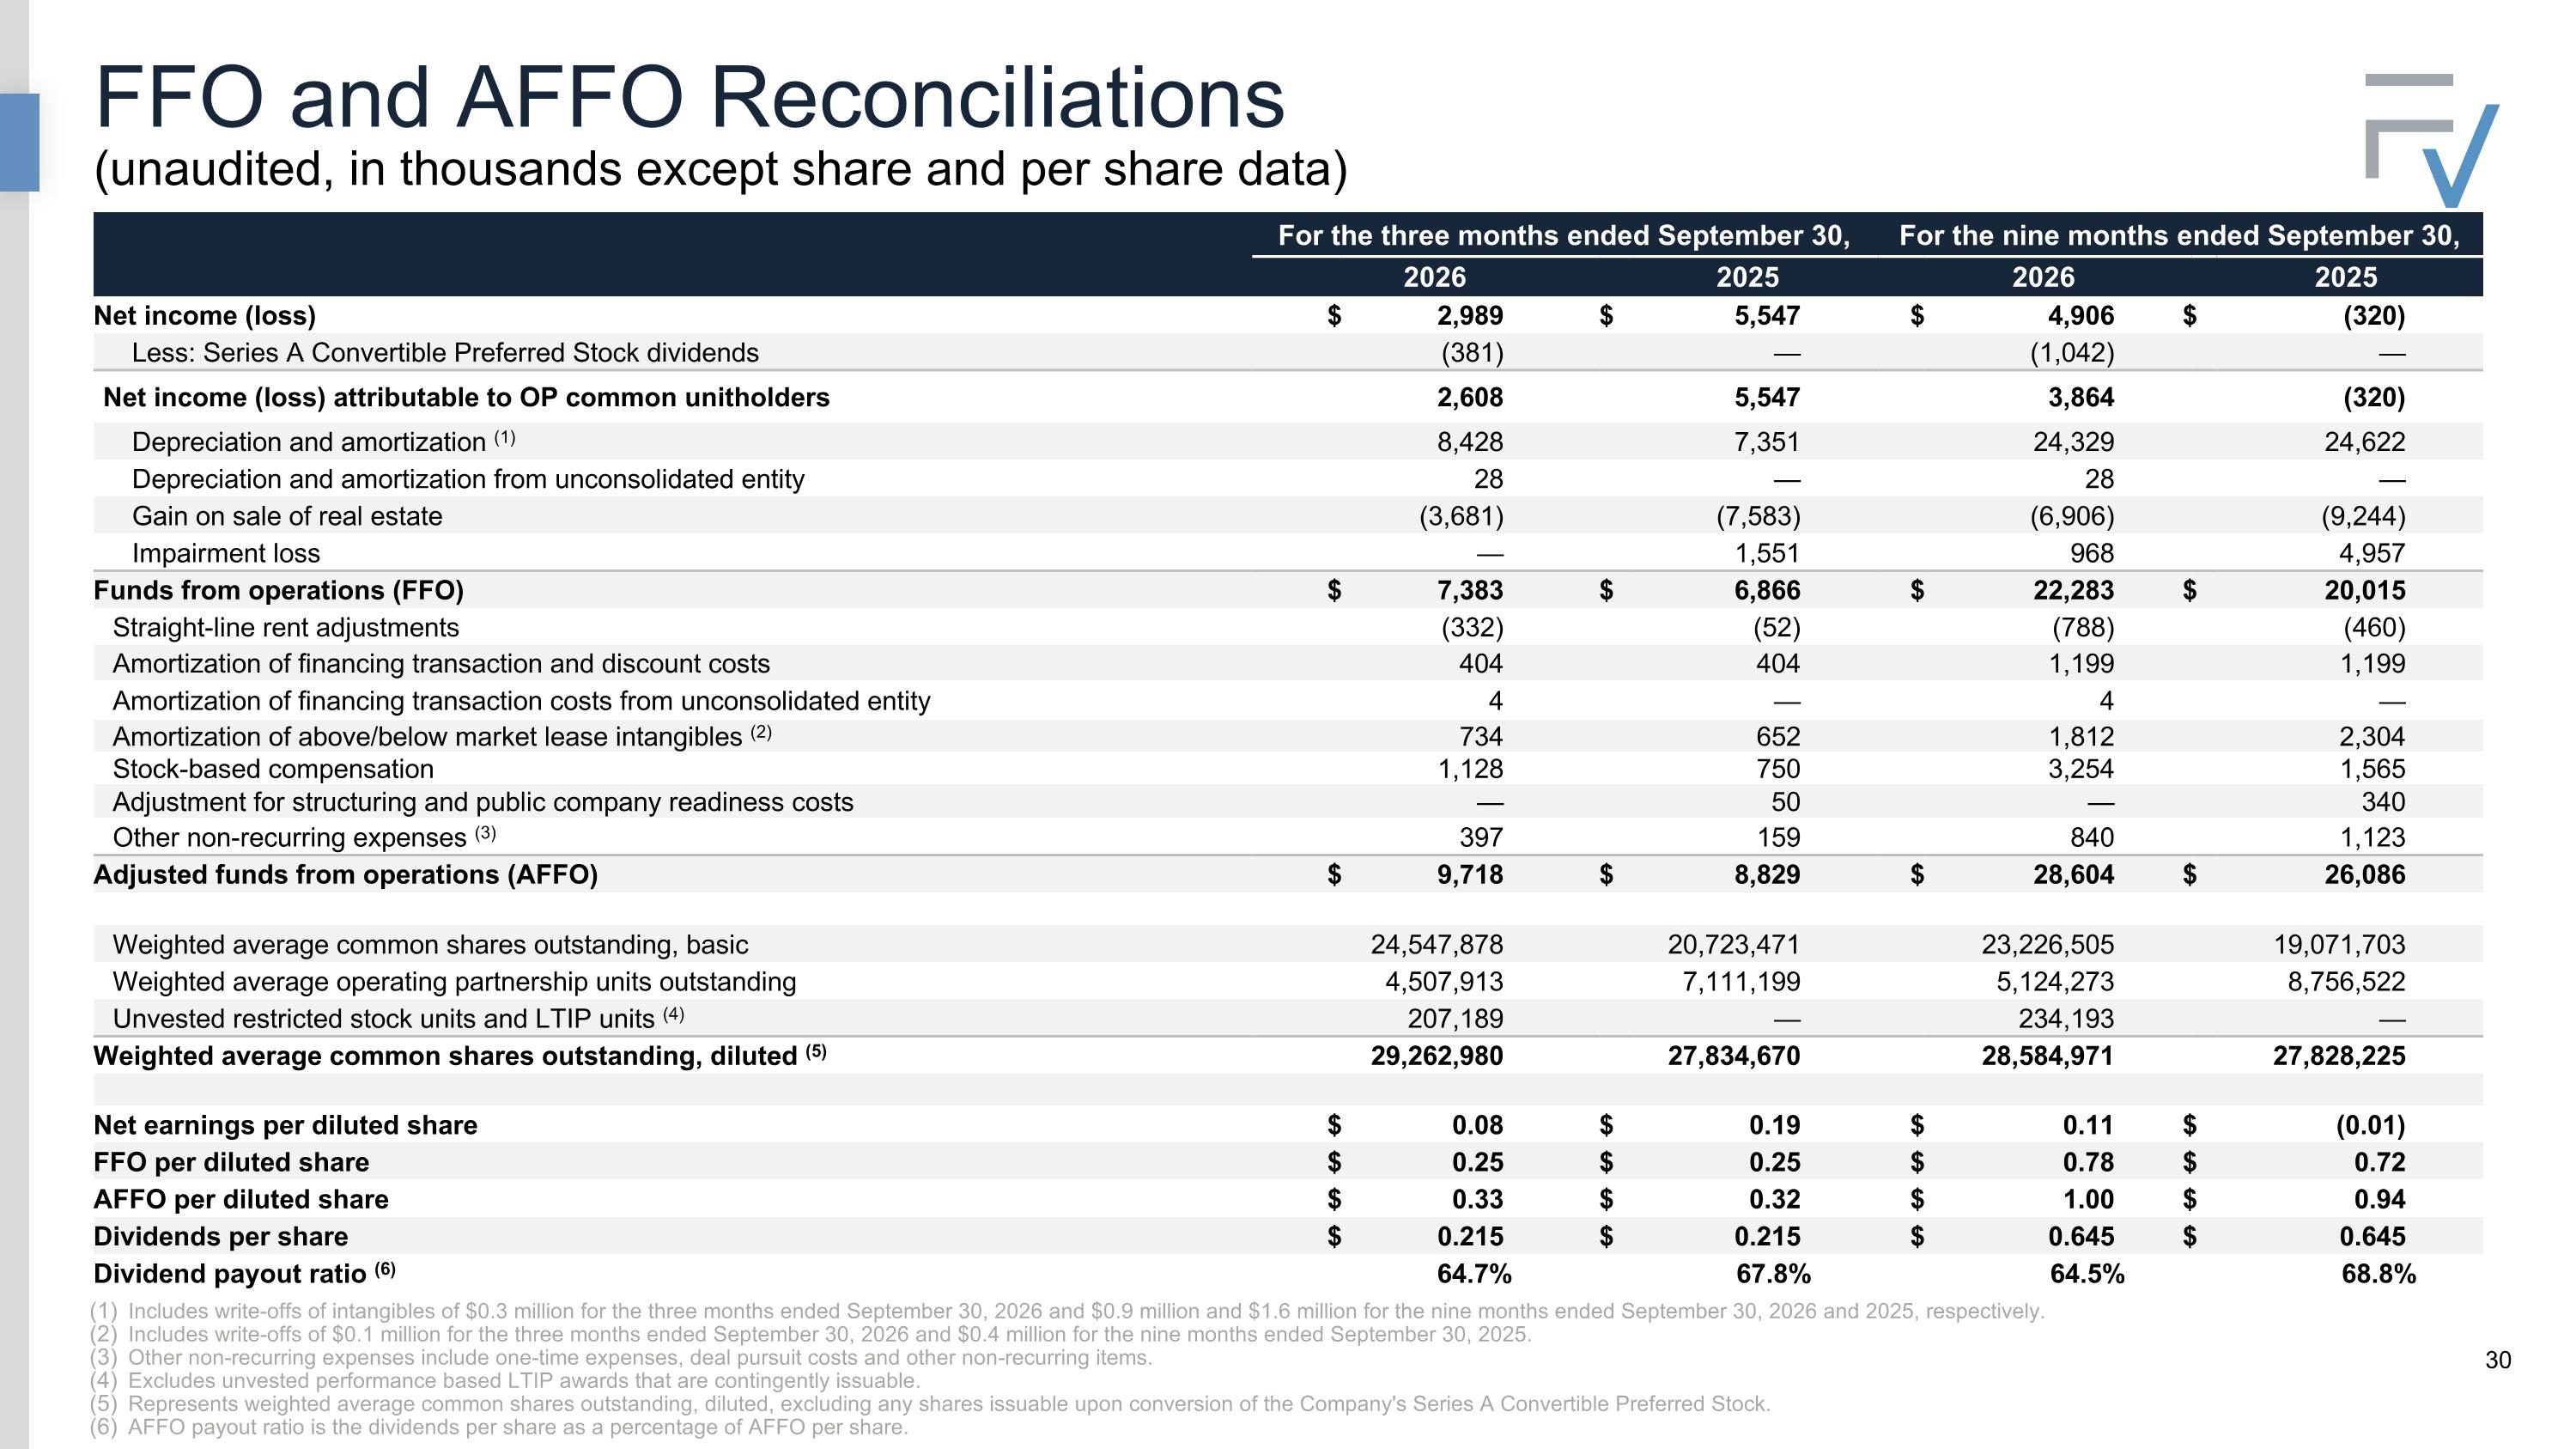
FFO and AFFO Reconciliations (unaudited, in thousands except share and per share data) For the three months ended September 30, For the nine months ended September 30, 2026 2025 2026 2025 Net income (loss) $ 2,989 $ 5,547 $ 4,906 $ (320) Less: Series A Convertible Preferred Stock dividends (381) — (1,042) — Net income (loss) attributable to OP common unitholders 2,608 5,547 3,864 (320) Depreciation and amortization (1) 8,428 7,351 24,329 24,622 Depreciation and amortization from unconsolidated entity 28 — 28 — Gain on sale of real estate (3,681) (7,583) (6,906) (9,244) Impairment loss — 1,551 968 4,957 Funds from operations (FFO) $ 7,383 $ 6,866 $ 22,283 $ 20,015 Straight-line rent adjustments (332) (52) (788) (460) Amortization of financing transaction and discount costs 404 404 1,199 1,199 Amortization of financing transaction costs from unconsolidated entity 4 — 4 — Amortization of above/below market lease intangibles (2) 734 652 1,812 2,304 Stock-based compensation 1,128 750 3,254 1,565 Adjustment for structuring and public company readiness costs — 50 — 340 Other non-recurring expenses (3) 397 159 840 1,123 Adjusted funds from operations (AFFO) $ 9,718 $ 8,829 $ 28,604 $ 26,086 Weighted average common shares outstanding, basic 24,547,878 20,723,471 23,226,505 19,071,703 Weighted average operating partnership units outstanding 4,507,913 7,111,199 5,124,273 8,756,522 Unvested restricted stock units and LTIP units (4) 207,189 — 234,193 — Weighted average common shares outstanding, diluted (5) 29,262,980 27,834,670 28,584,971 27,828,225 Net earnings per diluted share $ 0.08 $ 0.19 $ 0.11 $ (0.01) FFO per diluted share $ 0.25 $ 0.25 $ 0.78 $ 0.72 AFFO per diluted share $ 0.33 $ 0.32 $ 1.00 $ 0.94 Dividends per share $ 0.215 $ 0.215 $ 0.645 $ 0.645 Dividend payout ratio (6) 64.7% 67.8% 64.5% 68.8% Includes write-offs of intangibles of $0.3 million for the three months ended September 30, 2026 and $0.9 million and $1.6 million for the nine months ended September 30, 2026 and 2025, respectively. Includes write-offs of $0.1 million for the three months ended September 30, 2026 and $0.4 million for the nine months ended September 30, 2025. Other non-recurring expenses include one-time expenses, deal pursuit costs and other non-recurring items. Excludes unvested performance based LTIP awards that are contingently issuable. Represents weighted average common shares outstanding, diluted, excluding any shares issuable upon conversion of the Company's Series A Convertible Preferred Stock. AFFO payout ratio is the dividends per share as a percentage of AFFO per share.
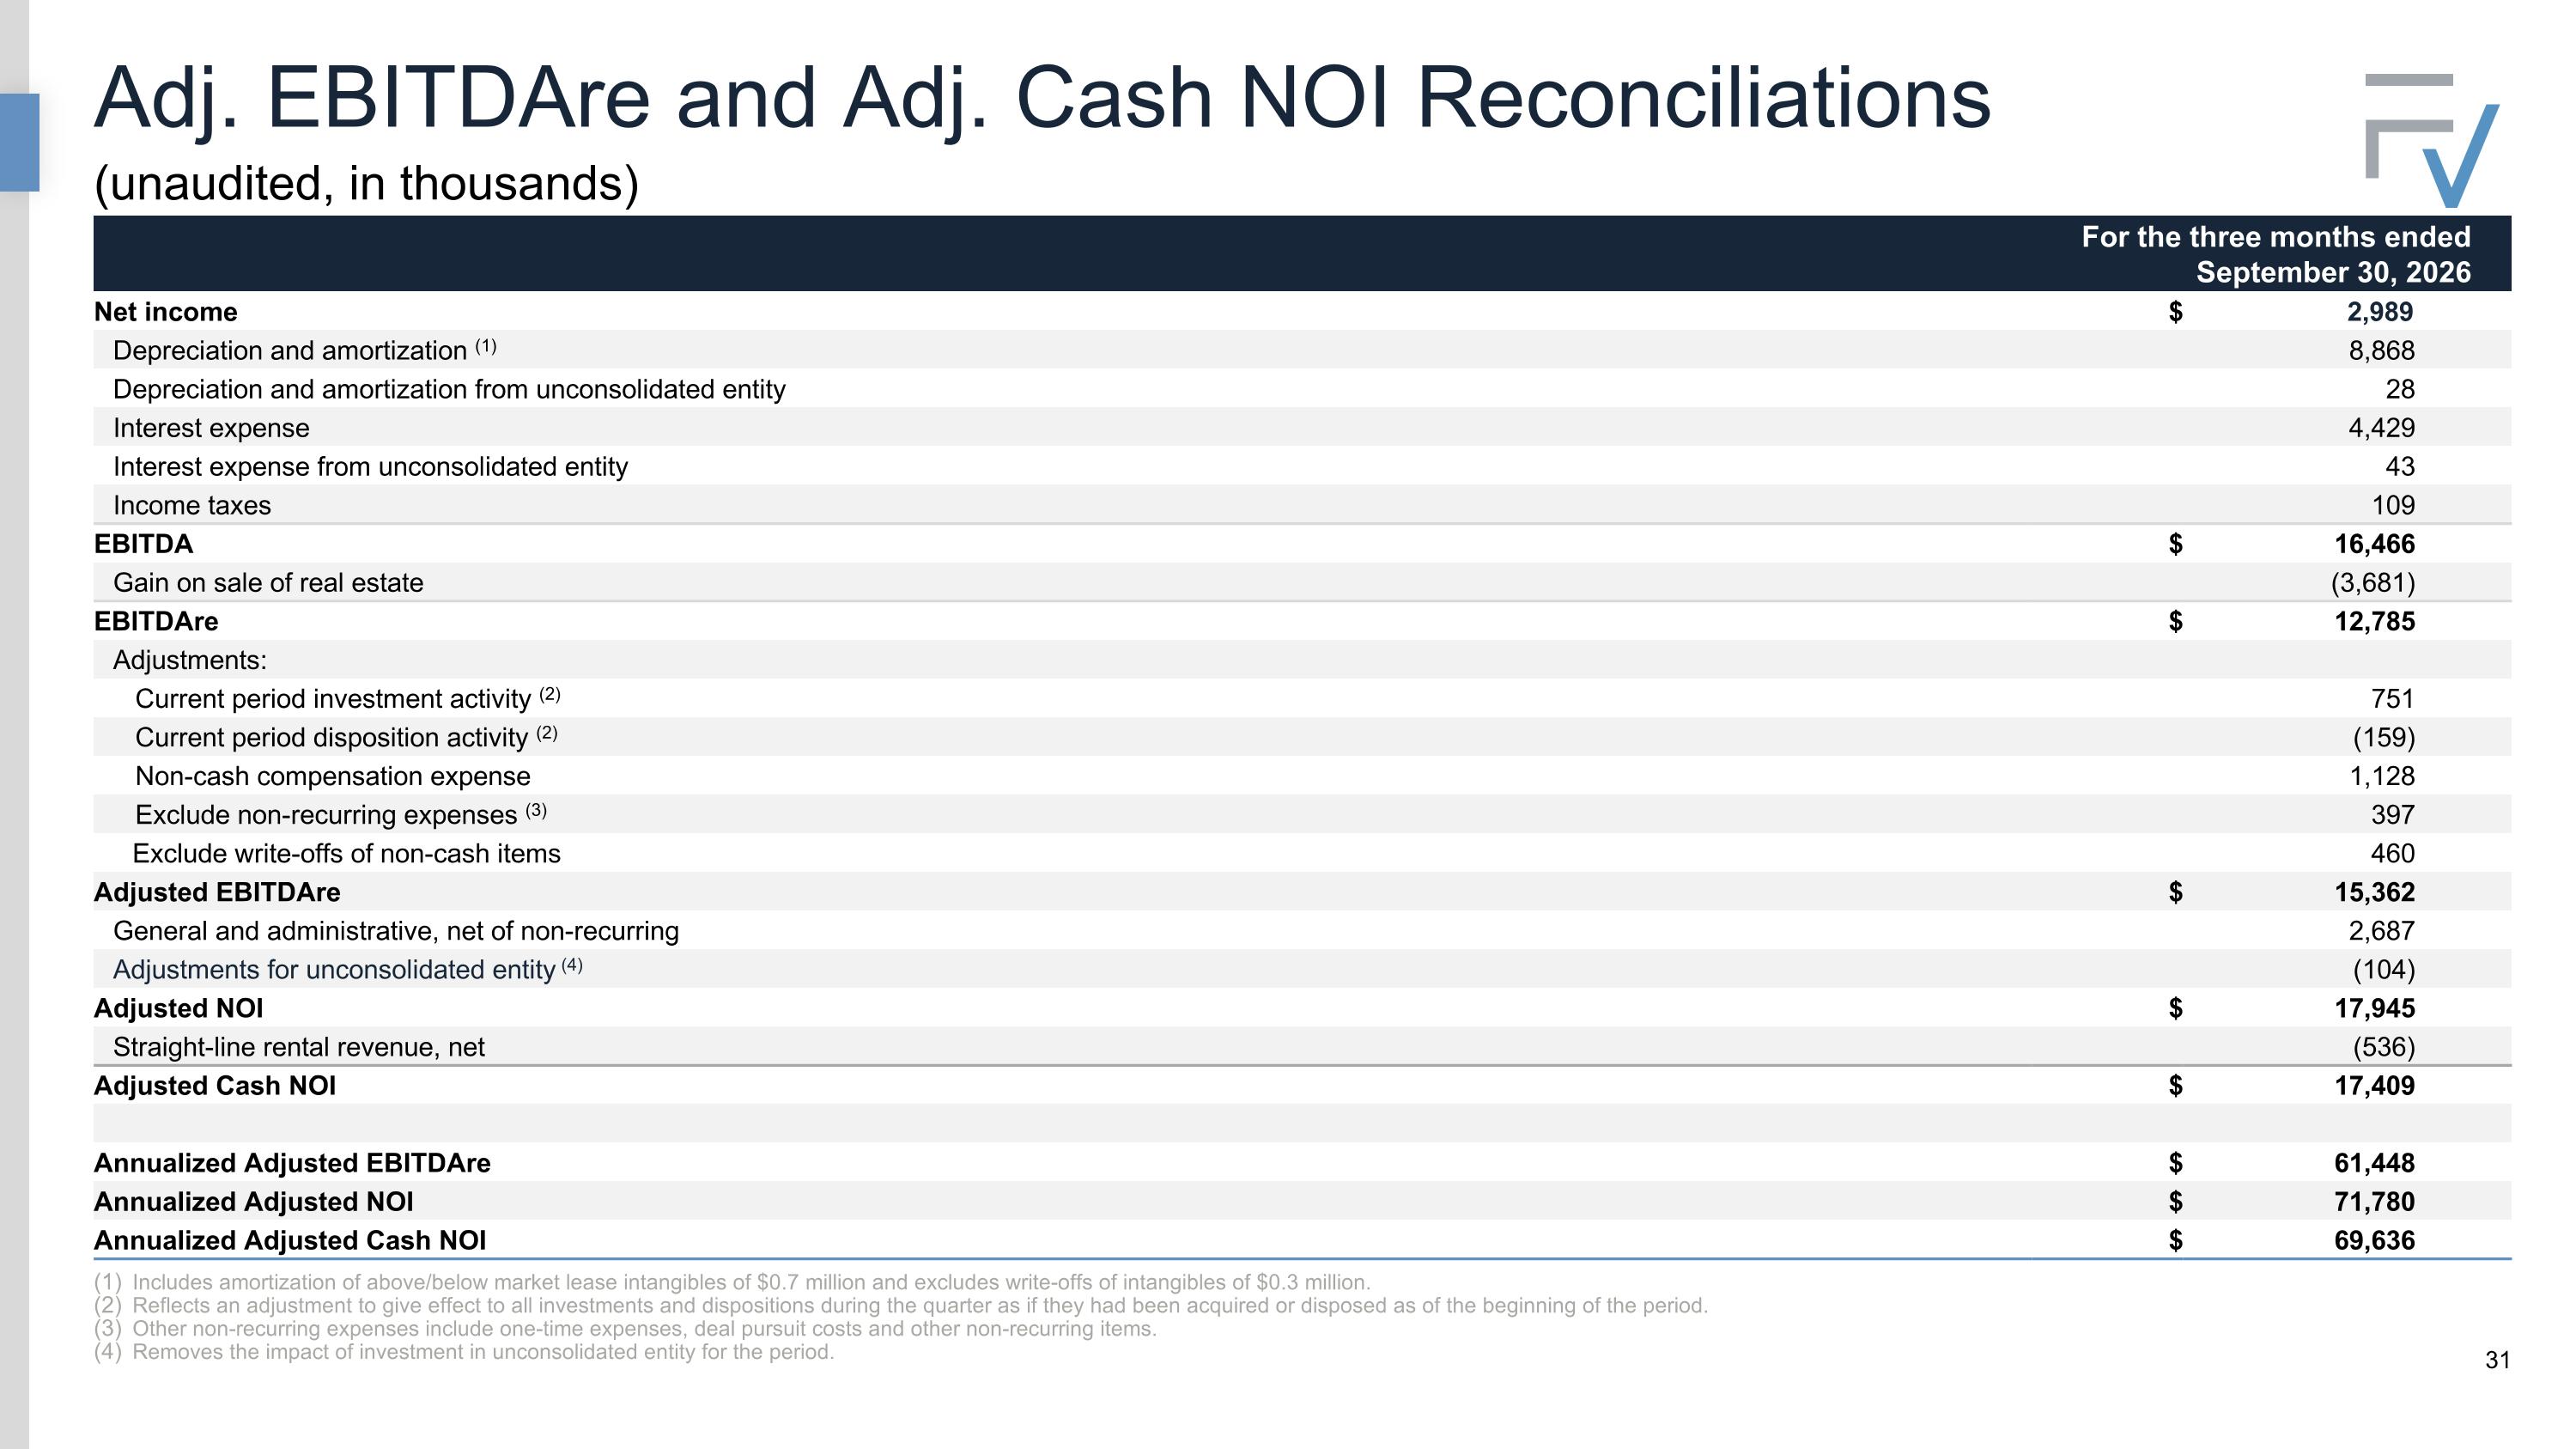
Adj. EBITDAre and Adj. Cash NOI Reconciliations (unaudited, in thousands) Includes amortization of above/below market lease intangibles of $0.7 million and excludes write-offs of intangibles of $0.3 million. Reflects an adjustment to give effect to all investments and dispositions during the quarter as if they had been acquired or disposed as of the beginning of the period. Other non-recurring expenses include one-time expenses, deal pursuit costs and other non-recurring items. Removes the impact of investment in unconsolidated entity for the period. For the three months ended September 30, 2026 Net income $ 2,989 Depreciation and amortization (1) 8,868 Depreciation and amortization from unconsolidated entity 28 Interest expense 4,429 Interest expense from unconsolidated entity 43 Income taxes 109 EBITDA $ 16,466 Gain on sale of real estate (3,681) EBITDAre $ 12,785 Adjustments: Current period investment activity (2) 751 Current period disposition activity (2) (159) Non-cash compensation expense 1,128 Exclude non-recurring expenses (3) 397 Exclude write-offs of non-cash items 460 Adjusted EBITDAre $ 15,362 General and administrative, net of non-recurring 2,687 Adjustments for unconsolidated entity (4) (104) Adjusted NOI $ 17,945 Straight-line rental revenue, net (536) Adjusted Cash NOI $ 17,409 Annualized Adjusted EBITDAre $ 61,448 Annualized Adjusted NOI $ 71,780 Annualized Adjusted Cash NOI $ 69,636
Appendix Supplemental Detail, Definitions and Forward-Looking Statements
Additional Portfolio Stratifications Supplemental Information Available at investor.frontviewreit.com Quarterly Highlights Financial Statements Net Asset Value Components Full Tenant List and ABR by Tenant Industry, Ground Lease, and Geography Stratifications Definitions The Supplemental is available on the company website
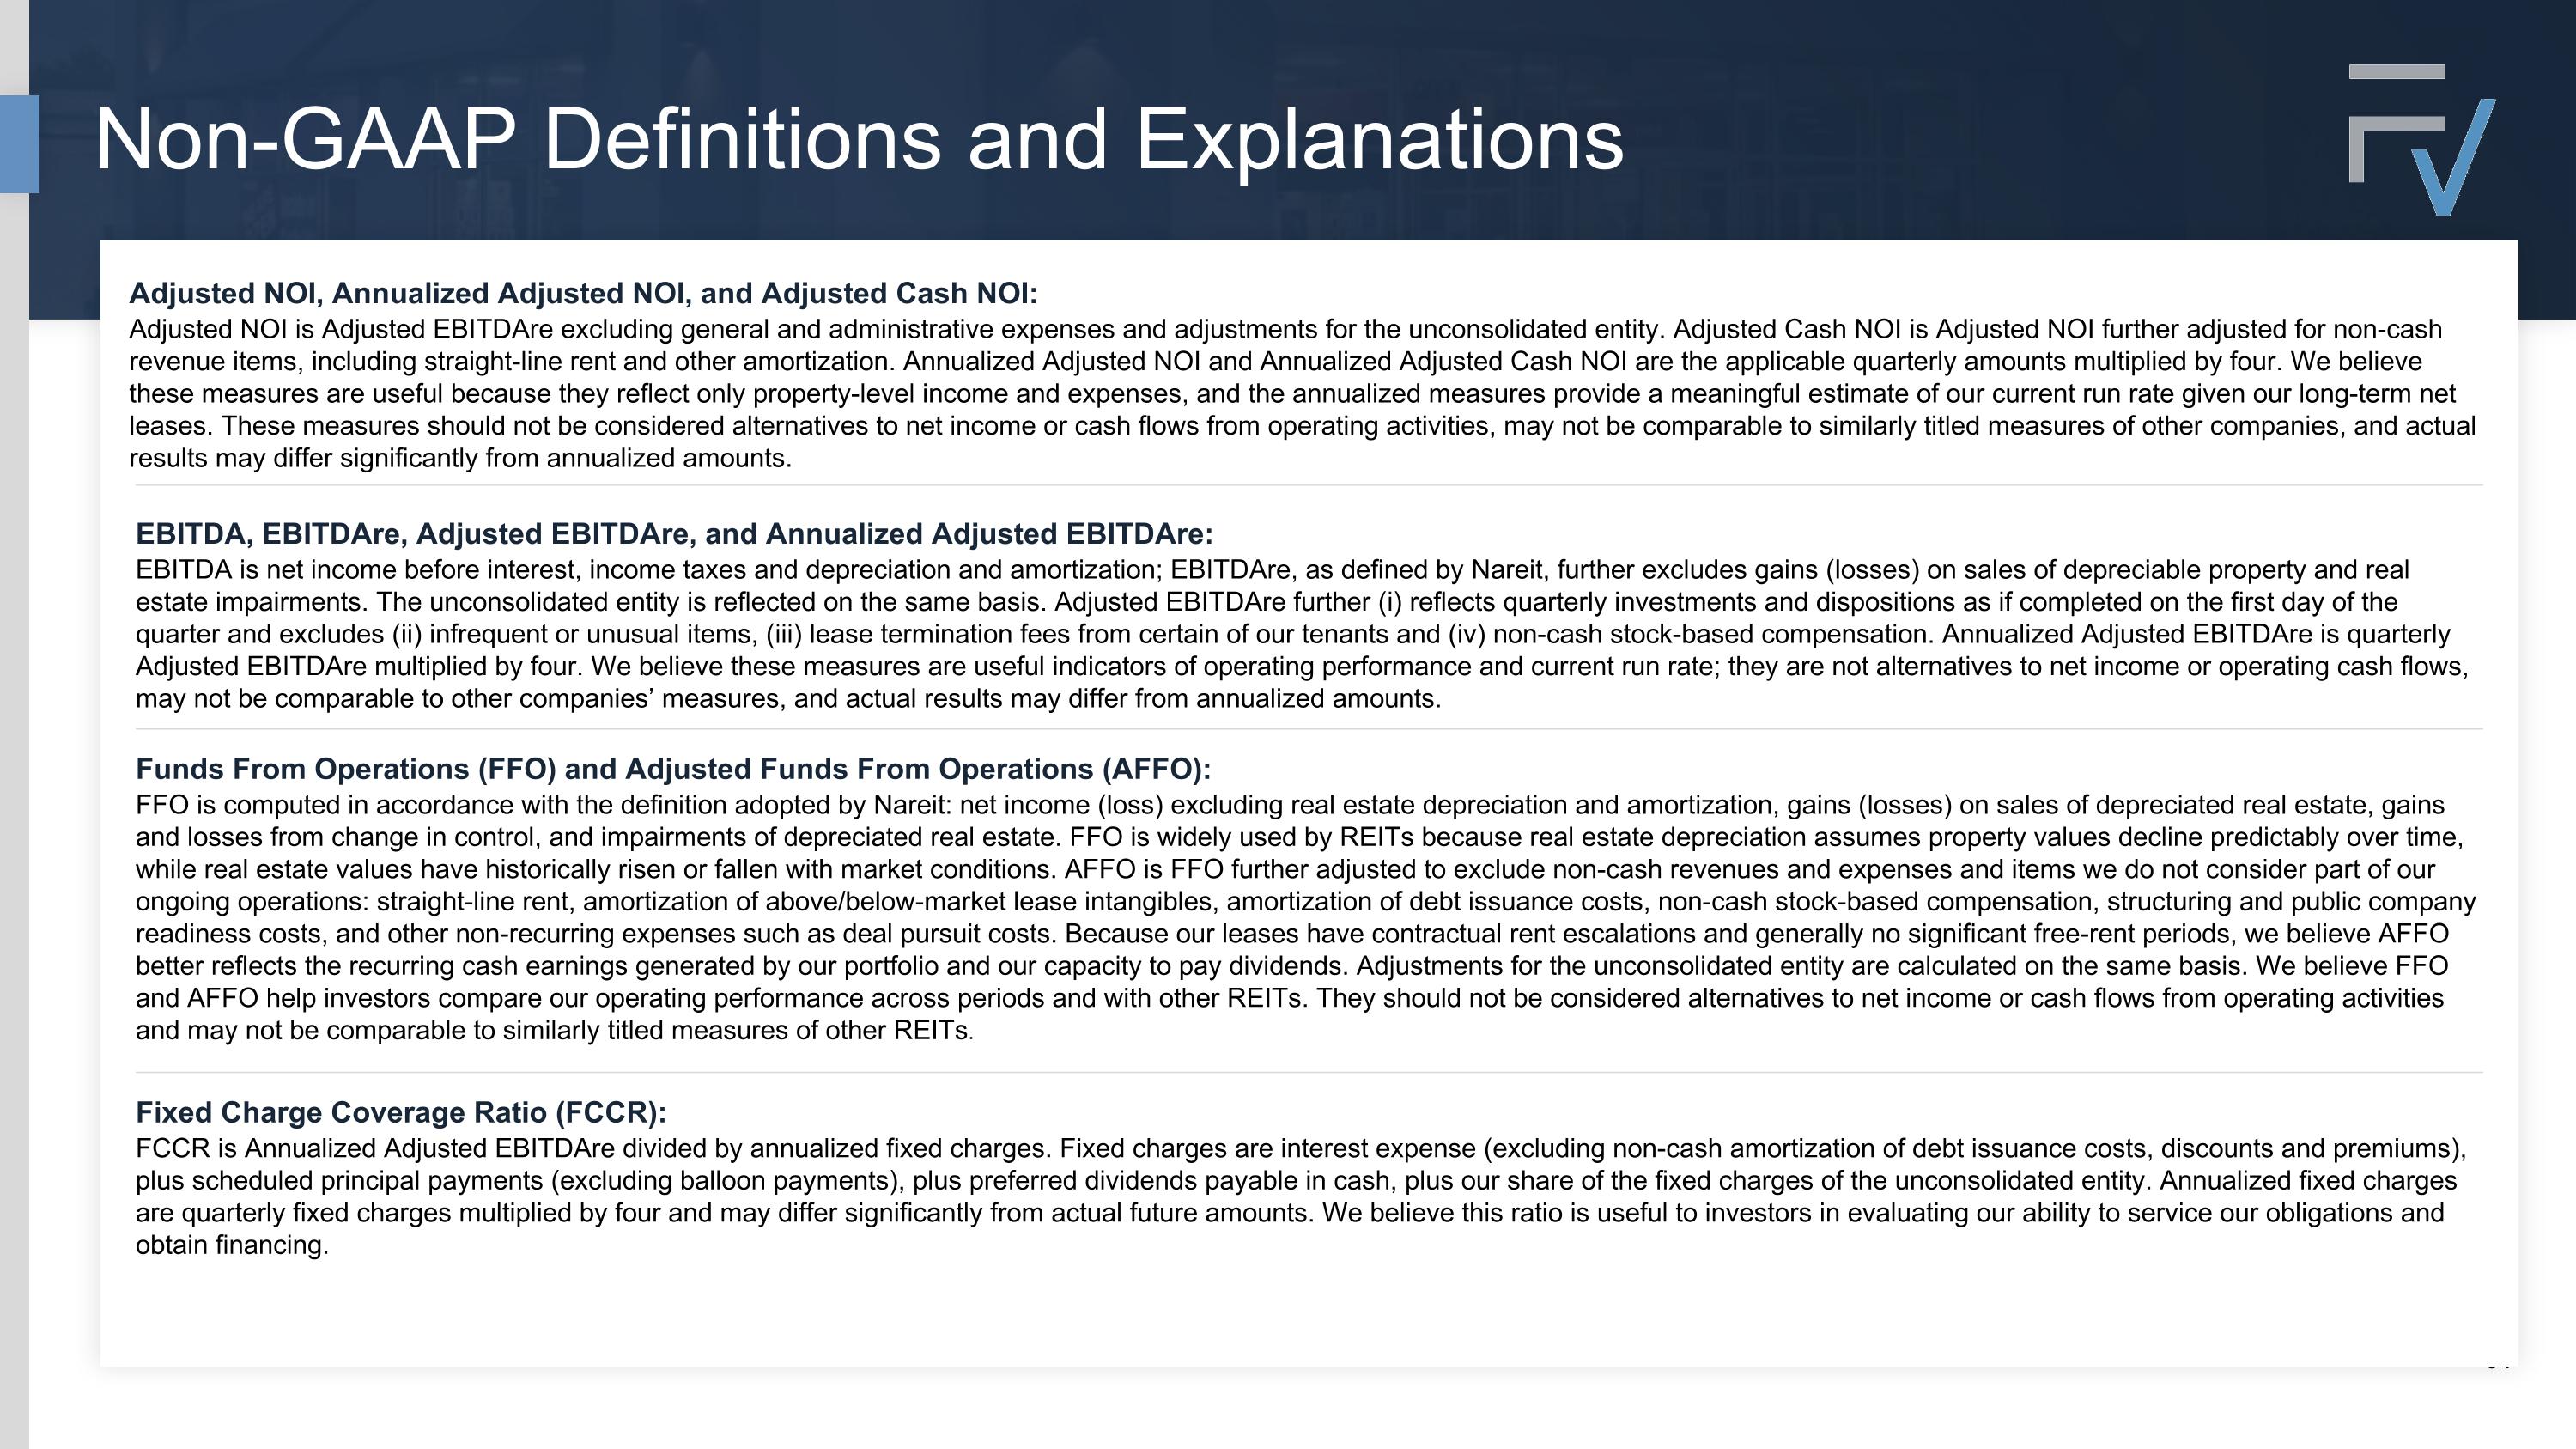
Non-GAAP Definitions and Explanations EBITDA, EBITDAre, Adjusted EBITDAre, and Annualized Adjusted EBITDAre: EBITDA is net income before interest, income taxes and depreciation and amortization; EBITDAre, as defined by Nareit, further excludes gains (losses) on sales of depreciable property and real estate impairments. The unconsolidated entity is reflected on the same basis. Adjusted EBITDAre further (i) reflects quarterly investments and dispositions as if completed on the first day of the quarter and excludes (ii) infrequent or unusual items, (iii) lease termination fees from certain of our tenants and (iv) non-cash stock-based compensation. Annualized Adjusted EBITDAre is quarterly Adjusted EBITDAre multiplied by four. We believe these measures are useful indicators of operating performance and current run rate; they are not alternatives to net income or operating cash flows, may not be comparable to other companies’ measures, and actual results may differ from annualized amounts. Funds From Operations (FFO) and Adjusted Funds From Operations (AFFO): FFO is computed in accordance with the definition adopted by Nareit: net income (loss) excluding real estate depreciation and amortization, gains (losses) on sales of depreciated real estate, gains and losses from change in control, and impairments of depreciated real estate. FFO is widely used by REITs because real estate depreciation assumes property values decline predictably over time, while real estate values have historically risen or fallen with market conditions. AFFO is FFO further adjusted to exclude non-cash revenues and expenses and items we do not consider part of our ongoing operations: straight-line rent, amortization of above/below-market lease intangibles, amortization of debt issuance costs, non-cash stock-based compensation, structuring and public company readiness costs, and other non-recurring expenses such as deal pursuit costs. Because our leases have contractual rent escalations and generally no significant free-rent periods, we believe AFFO better reflects the recurring cash earnings generated by our portfolio and our capacity to pay dividends. Adjustments for the unconsolidated entity are calculated on the same basis. We believe FFO and AFFO help investors compare our operating performance across periods and with other REITs. They should not be considered alternatives to net income or cash flows from operating activities and may not be comparable to similarly titled measures of other REITs. Adjusted NOI, Annualized Adjusted NOI, and Adjusted Cash NOI: Adjusted NOI is Adjusted EBITDAre excluding general and administrative expenses and adjustments for the unconsolidated entity. Adjusted Cash NOI is Adjusted NOI further adjusted for non-cash revenue items, including straight-line rent and other amortization. Annualized Adjusted NOI and Annualized Adjusted Cash NOI are the applicable quarterly amounts multiplied by four. We believe these measures are useful because they reflect only property-level income and expenses, and the annualized measures provide a meaningful estimate of our current run rate given our long-term net leases. These measures should not be considered alternatives to net income or cash flows from operating activities, may not be comparable to similarly titled measures of other companies, and actual results may differ significantly from annualized amounts. Fixed Charge Coverage Ratio (FCCR): FCCR is Annualized Adjusted EBITDAre divided by annualized fixed charges. Fixed charges are interest expense (excluding non-cash amortization of debt issuance costs, discounts and premiums), plus scheduled principal payments (excluding balloon payments), plus preferred dividends payable in cash, plus our share of the fixed charges of the unconsolidated entity. Annualized fixed charges are quarterly fixed charges multiplied by four and may differ significantly from actual future amounts. We believe this ratio is useful to investors in evaluating our ability to service our obligations and obtain financing.
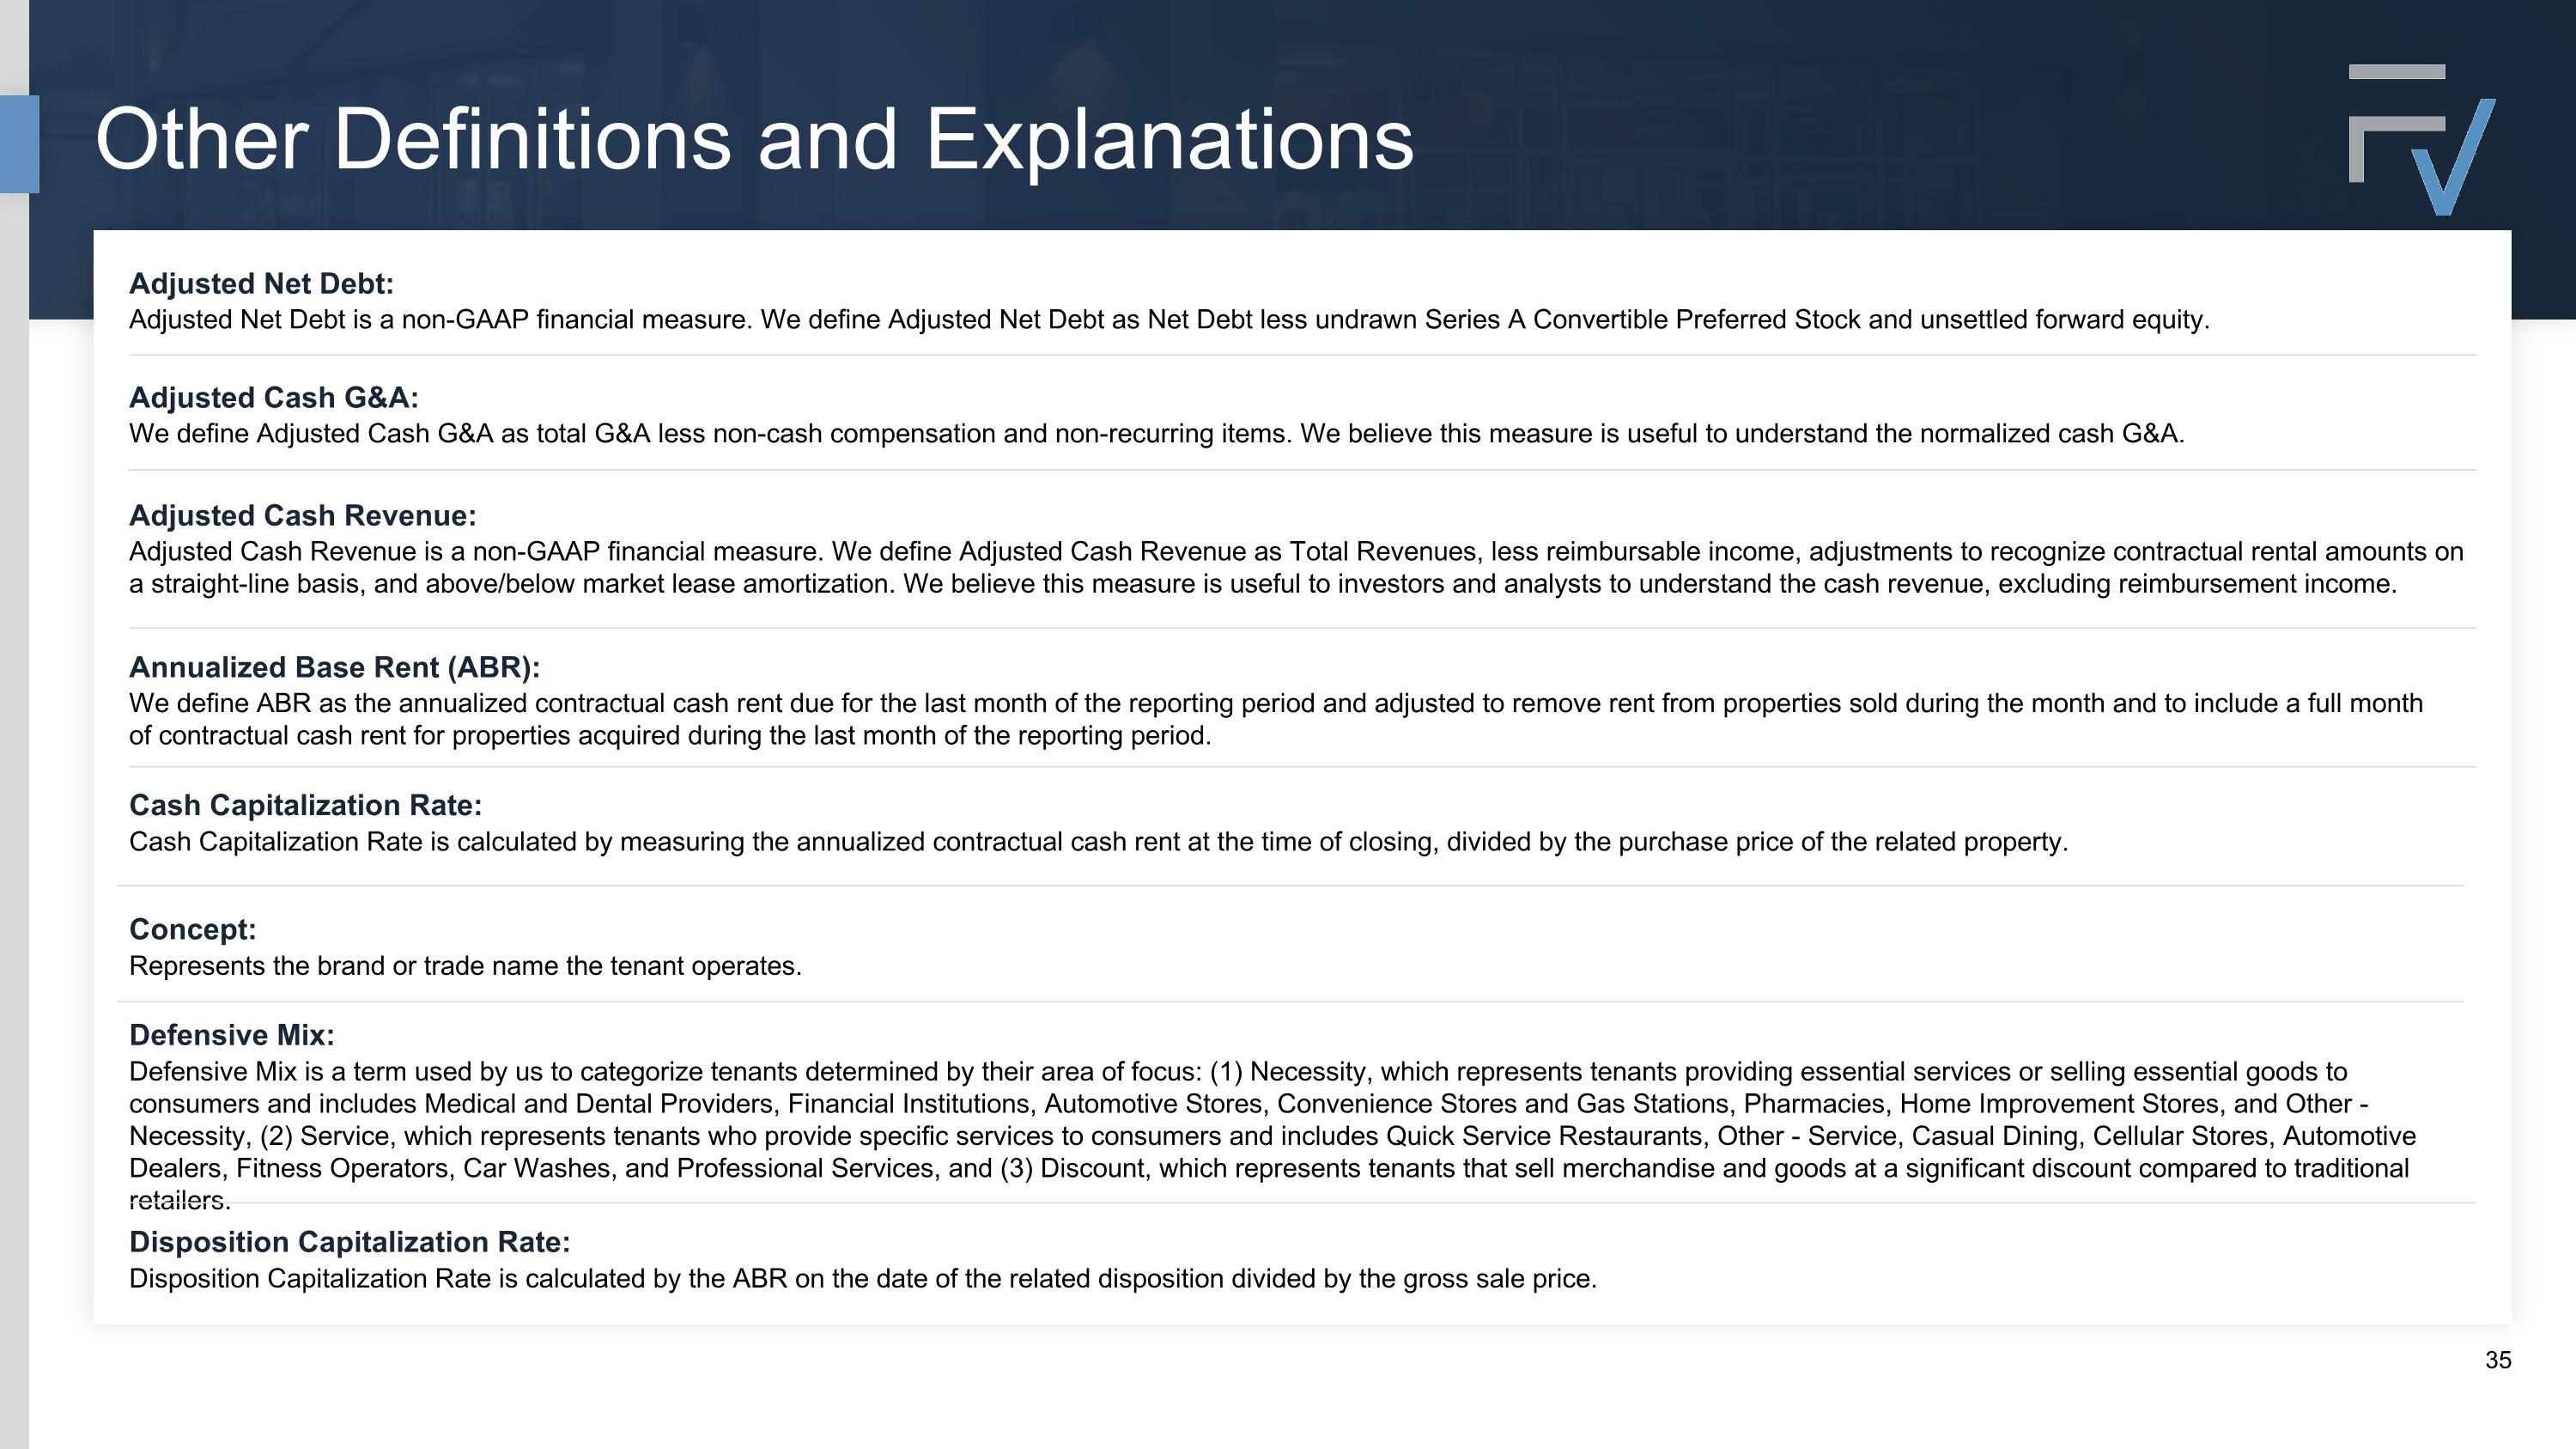
Other Definitions and Explanations Cash Capitalization Rate: Cash Capitalization Rate is calculated by measuring the annualized contractual cash rent at the time of closing, divided by the purchase price of the related property. Concept: Represents the brand or trade name the tenant operates. Disposition Capitalization Rate: Disposition Capitalization Rate is calculated by the ABR on the date of the related disposition divided by the gross sale price. Defensive Mix: Defensive Mix is a term used by us to categorize tenants determined by their area of focus: (1) Necessity, which represents tenants providing essential services or selling essential goods to consumers and includes Medical and Dental Providers, Financial Institutions, Automotive Stores, Convenience Stores and Gas Stations, Pharmacies, Home Improvement Stores, and Other - Necessity, (2) Service, which represents tenants who provide specific services to consumers and includes Quick Service Restaurants, Other - Service, Casual Dining, Cellular Stores, Automotive Dealers, Fitness Operators, Car Washes, and Professional Services, and (3) Discount, which represents tenants that sell merchandise and goods at a significant discount compared to traditional retailers. Annualized Base Rent (ABR): We define ABR as the annualized contractual cash rent due for the last month of the reporting period and adjusted to remove rent from properties sold during the month and to include a full month of contractual cash rent for properties acquired during the last month of the reporting period. Adjusted Net Debt: Adjusted Net Debt is a non-GAAP financial measure. We define Adjusted Net Debt as Net Debt less undrawn Series A Convertible Preferred Stock and unsettled forward equity. Adjusted Cash Revenue: Adjusted Cash Revenue is a non-GAAP financial measure. We define Adjusted Cash Revenue as Total Revenues, less reimbursable income, adjustments to recognize contractual rental amounts on a straight-line basis, and above/below market lease amortization. We believe this measure is useful to investors and analysts to understand the cash revenue, excluding reimbursement income. Adjusted Cash G&A: We define Adjusted Cash G&A as total G&A less non-cash compensation and non-recurring items. We believe this measure is useful to understand the normalized cash G&A.
Other Definitions and Explanations (Continued) WALT: WALT represents the remaining average lease term of our leases, weighted by rent, and excluding lease renewal options and investments in mortgage loans. Purchase Price: Purchase Price is represented by the contractual acquisition price of the related property, excluding any transaction costs or other capital expenditures. Tenant: Tenant represents the legal entity responsible for fulfilling obligations under the lease agreement. Gross Debt: We define Gross Debt as total debt, net plus debt issuance costs and original issuance discount. Net Debt: Net Debt is a non-GAAP financial measure. We define Net Debt as our Gross Debt less cash and cash equivalents. Occupancy: Occupancy or a specified percentage of our portfolio that is “occupied” or “leased” means as of a specified date (i) the number of properties that are subject to a signed lease divided by (ii) the total number of properties in our portfolio. Secured Overnight Financing Rate (SOFR): We define SOFR as the current one-month term SOFR. GAAP: GAAP is the Generally Accepted Accounting Principles in the United States. Economic Yield: Economic Yield is defined as the sum of contractual fixed annual rents computed on a straight-line basis over the primary lease terms, divided by the purchase price.
Forward-Looking and Cautionary Statements IP Disclaimer This document contains references to copyrights, trademarks, trade names, and service marks that belong to other companies. FrontView REIT, Inc. is not affiliated or associated with, and is not endorsed by and does not endorse, such companies or their products or services. This presentation contains forward-looking statements, which reflect our current views regarding our business, financial performance, growth prospects and strategies, market opportunities, and market trends. Forward-looking statements include all statements that are not historical facts. In some cases, you can identify these forward-looking statements by the use of words such as “outlook,” “believes,” “expects,” “potential,” “continues,” “may,” “will,” “should,” “could,” “would be,” “seeks,” “approximately,” “projects,” “predicts,” “intends,” “plans,” “estimates,” “anticipates,” or the negative version of these words or other comparable words. All of the forward-looking statements herein, including 2026 guidance, are subject to various risks and uncertainties. Assumptions relating to the foregoing involve judgments with respect to, among other things, future economic, competitive and market conditions, and future business decisions, all of which are difficult or impossible to predict accurately and many of which are beyond our control. Although we believe that the expectations reflected in such forward-looking statements are based on reasonable assumptions, our actual results, performance, and achievements could differ materially from those expressed in or by the forward-looking statements and may be affected by a variety of risks and other factors. Accordingly, there are or will be important factors that could cause actual outcomes or results to differ materially from such forward-looking statements. These factors include, but are not limited to, risks and uncertainties related to general economic conditions, including but not limited to increases in the rate of inflation and/or interest rates, local real estate conditions, tenant financial health, and property acquisitions and the timing of these investments and acquisitions. These and other risks, assumptions, and uncertainties are described in our filings with the SEC, which are available on the SEC’s website at www.sec.gov. You are cautioned not to place undue reliance on any forward-looking statements included herein. All forward-looking statements are made as of the date of this document and the risk that actual results, performance, and achievements will differ materially from the expectations expressed or referenced herein will increase with the passage of time. We undertake no obligation to publicly update or review any forward-looking statement, whether as a result of new information, future developments, or otherwise, except as required by law. Forward Looking Statements This data and other information described herein are as of and for the three and nine months ended September 30, 2026, unless otherwise indicated. Future performance may not be consistent with past performance and is subject to change, involving inherent risks and uncertainties. This information should be read in conjunction with FrontView’s Annual Report on Form 10-K as of and for the year ended December 31, 2025 and Form 10-Q for the period ended September 30, 2026, including the financial statements and the management’s discussion and analysis of financial condition and results of operations sections. About the Data