Q3 2026 Quarterly Supplemental Information FrontView is an internally managed net-lease real estate investment trust (“REIT”) focused on acquiring, owning, and managing properties with frontage that are leased to a diversified tenant base. Our real estate-first investment strategy is centered around highly visible properties in prominent retail corridors with strong underlying real estate fundamentals. We target properties along high-traffic roads that offer strong consumer visibility and adaptable building formats capable of supporting various businesses over time. investor.frontviewreit.com EXHIBIT 99.2
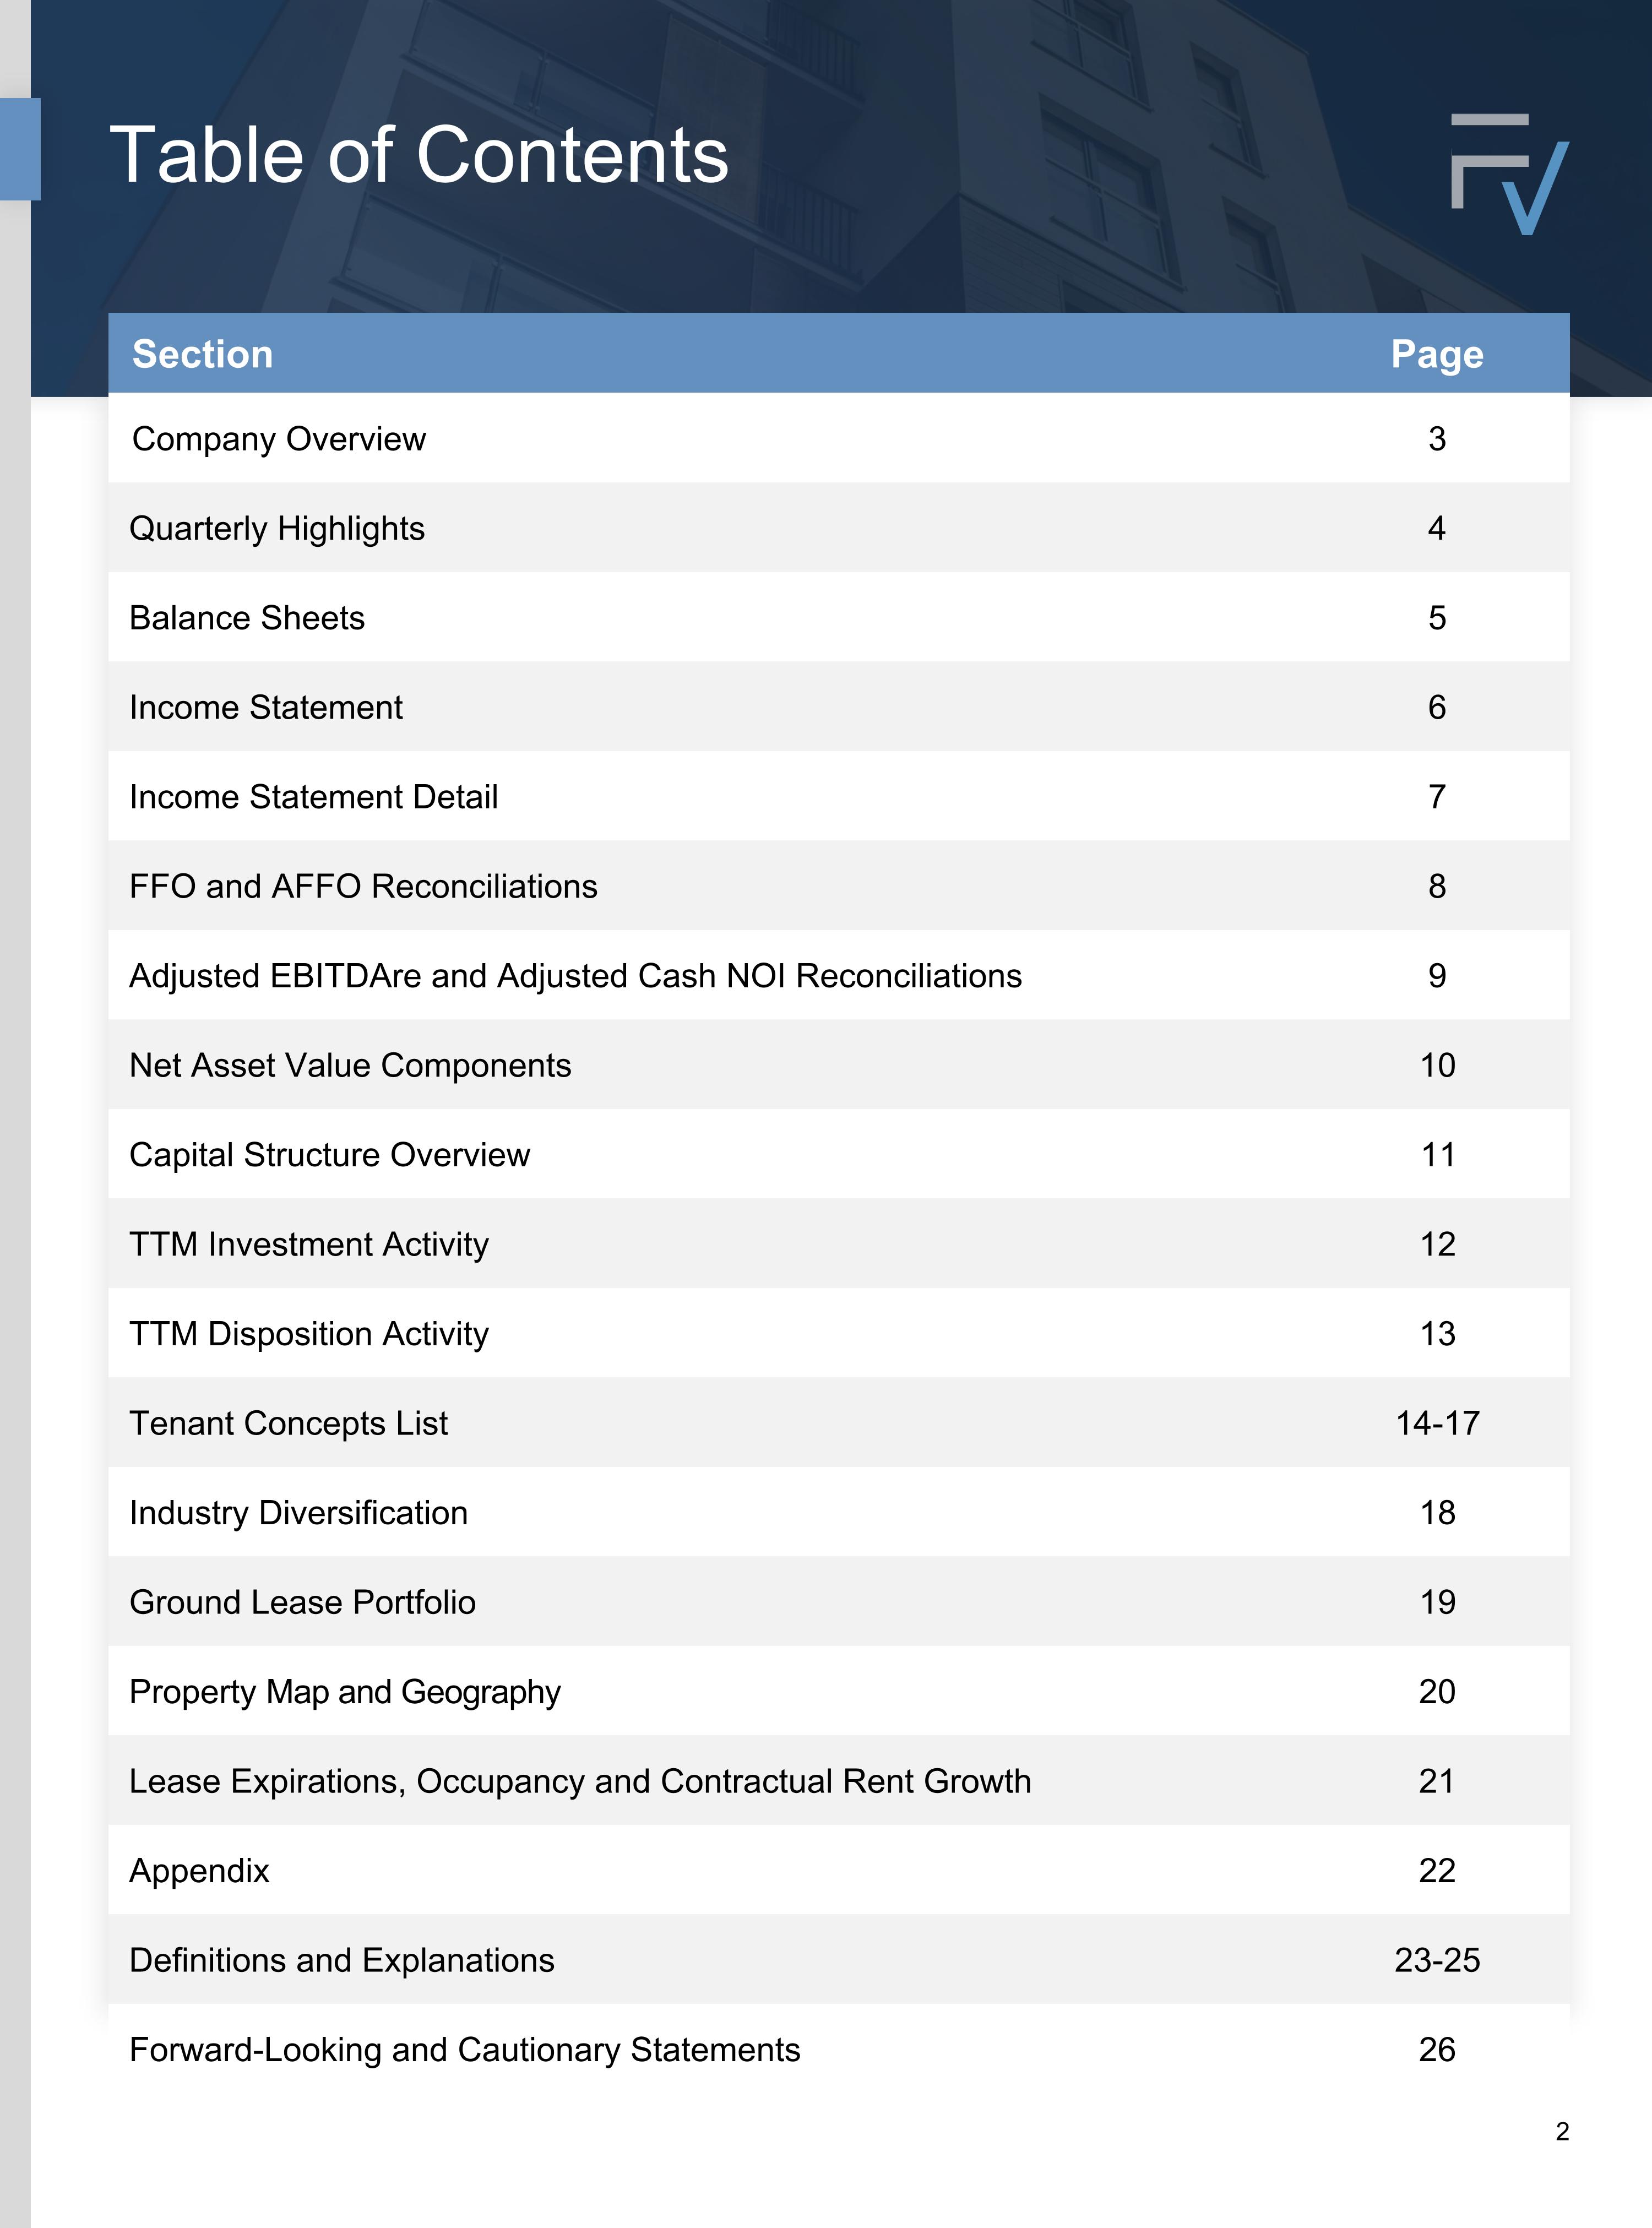
Table of Contents Section Page Company Overview 3 Quarterly Highlights 4 Balance Sheets 5 Income Statement 6 Income Statement Detail 7 FFO and AFFO Reconciliations 8 Adjusted EBITDAre and Adjusted Cash NOI Reconciliations 9 Net Asset Value Components 10 Capital Structure Overview 11 TTM Investment Activity 12 TTM Disposition Activity 13 Tenant Concepts List 14-17 Industry Diversification 18 Ground Lease Portfolio 19 Property Map and Geography 20 Lease Expirations, Occupancy and Contractual Rent Growth 21 Appendix 22 Definitions and Explanations 23-25 Forward-Looking and Cautionary Statements 26 2
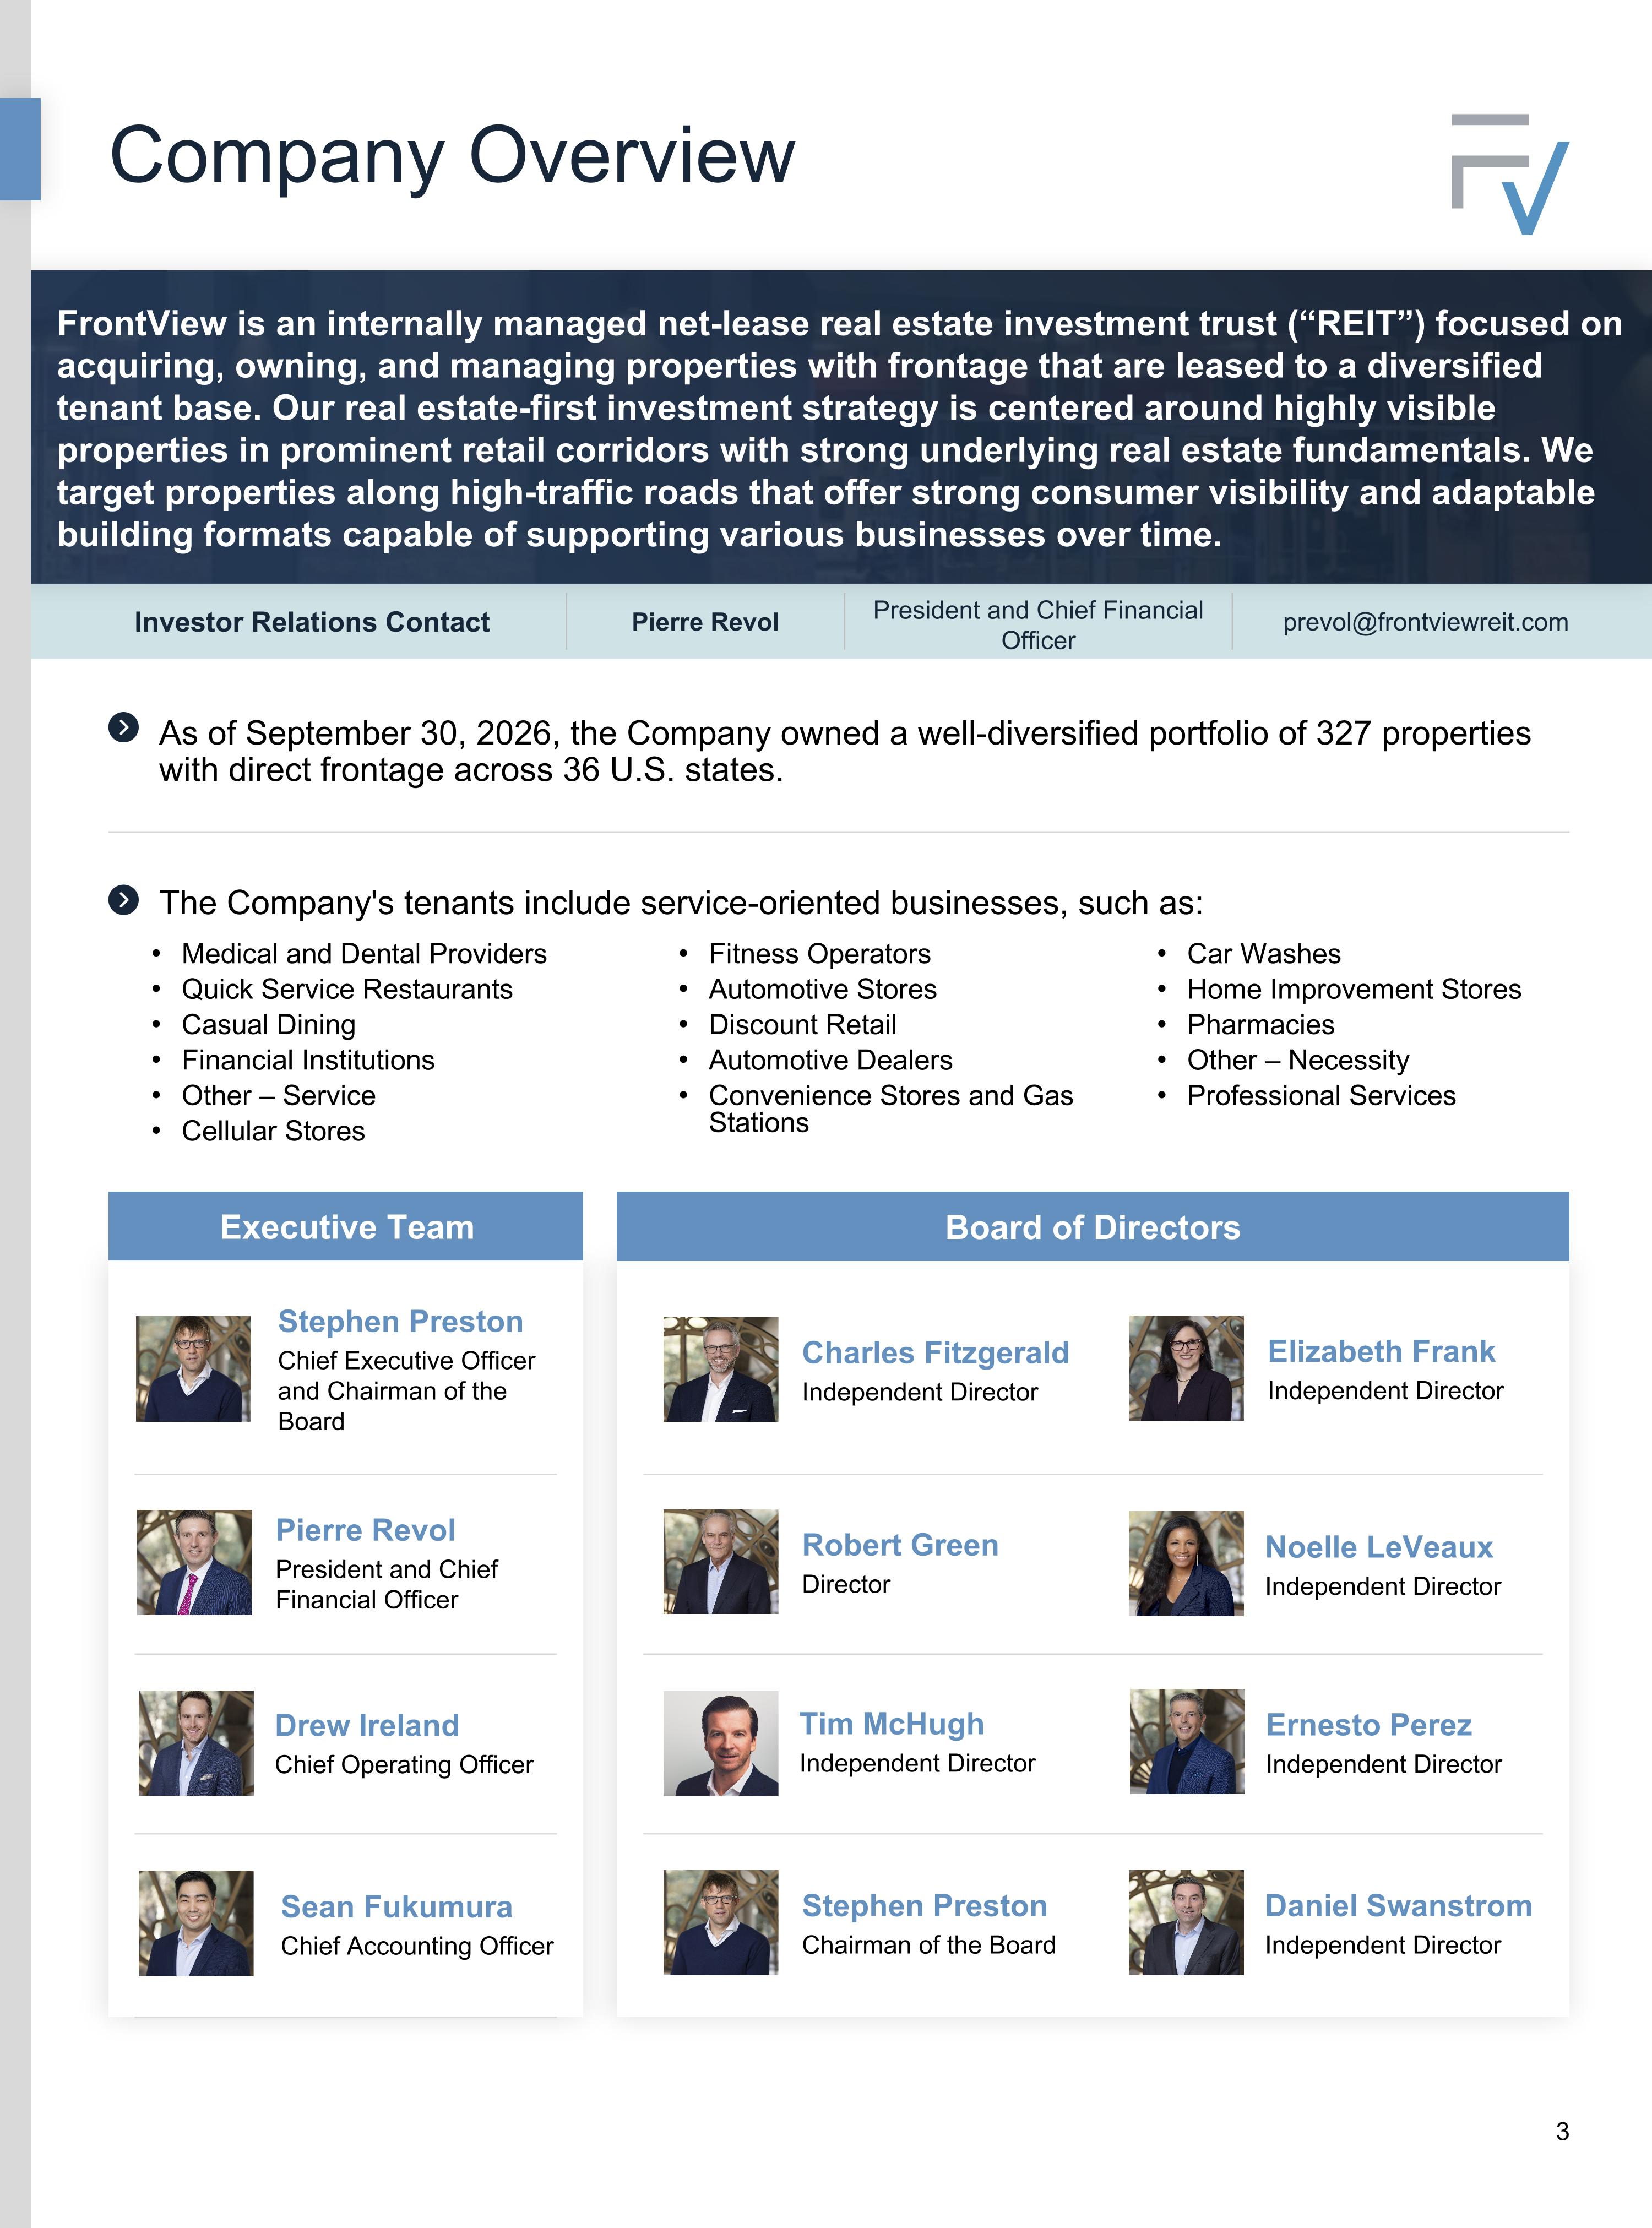
Investor Relations Contact Pierre Revol President and Chief Financial Officer prevol@frontviewreit.com Company Overview FrontView is an internally managed net-lease real estate investment trust (“REIT”) focused on acquiring, owning, and managing properties with frontage that are leased to a diversified tenant base. Our real estate-first investment strategy is centered around highly visible properties in prominent retail corridors with strong underlying real estate fundamentals. We target properties along high-traffic roads that offer strong consumer visibility and adaptable building formats capable of supporting various businesses over time. As of September 30, 2026, the Company owned a well-diversified portfolio of 327 properties with direct frontage across 36 U.S. states. The Company's tenants include service-oriented businesses, such as: Medical and Dental Providers Quick Service Restaurants Casual Dining Financial Institutions Other – Service Cellular Stores Fitness Operators Automotive Stores Discount Retail Automotive Dealers Convenience Stores and Gas Stations Car Washes Home Improvement Stores Pharmacies Other – Necessity Professional Services Executive Team Pierre Revol President and Chief Financial Officer Daniel Swanstrom Independent Director Elizabeth Frank Independent Director Drew Ireland Chief Operating Officer Charles Fitzgerald Independent Director Ernesto Perez Independent Director Sean Fukumura Chief Accounting Officer Robert Green Director Stephen Preston Chief Executive Officer and Chairman of the Board Noelle LeVeaux Independent Director Stephen Preston Chairman of the Board Board of Directors Tim McHugh Independent Director
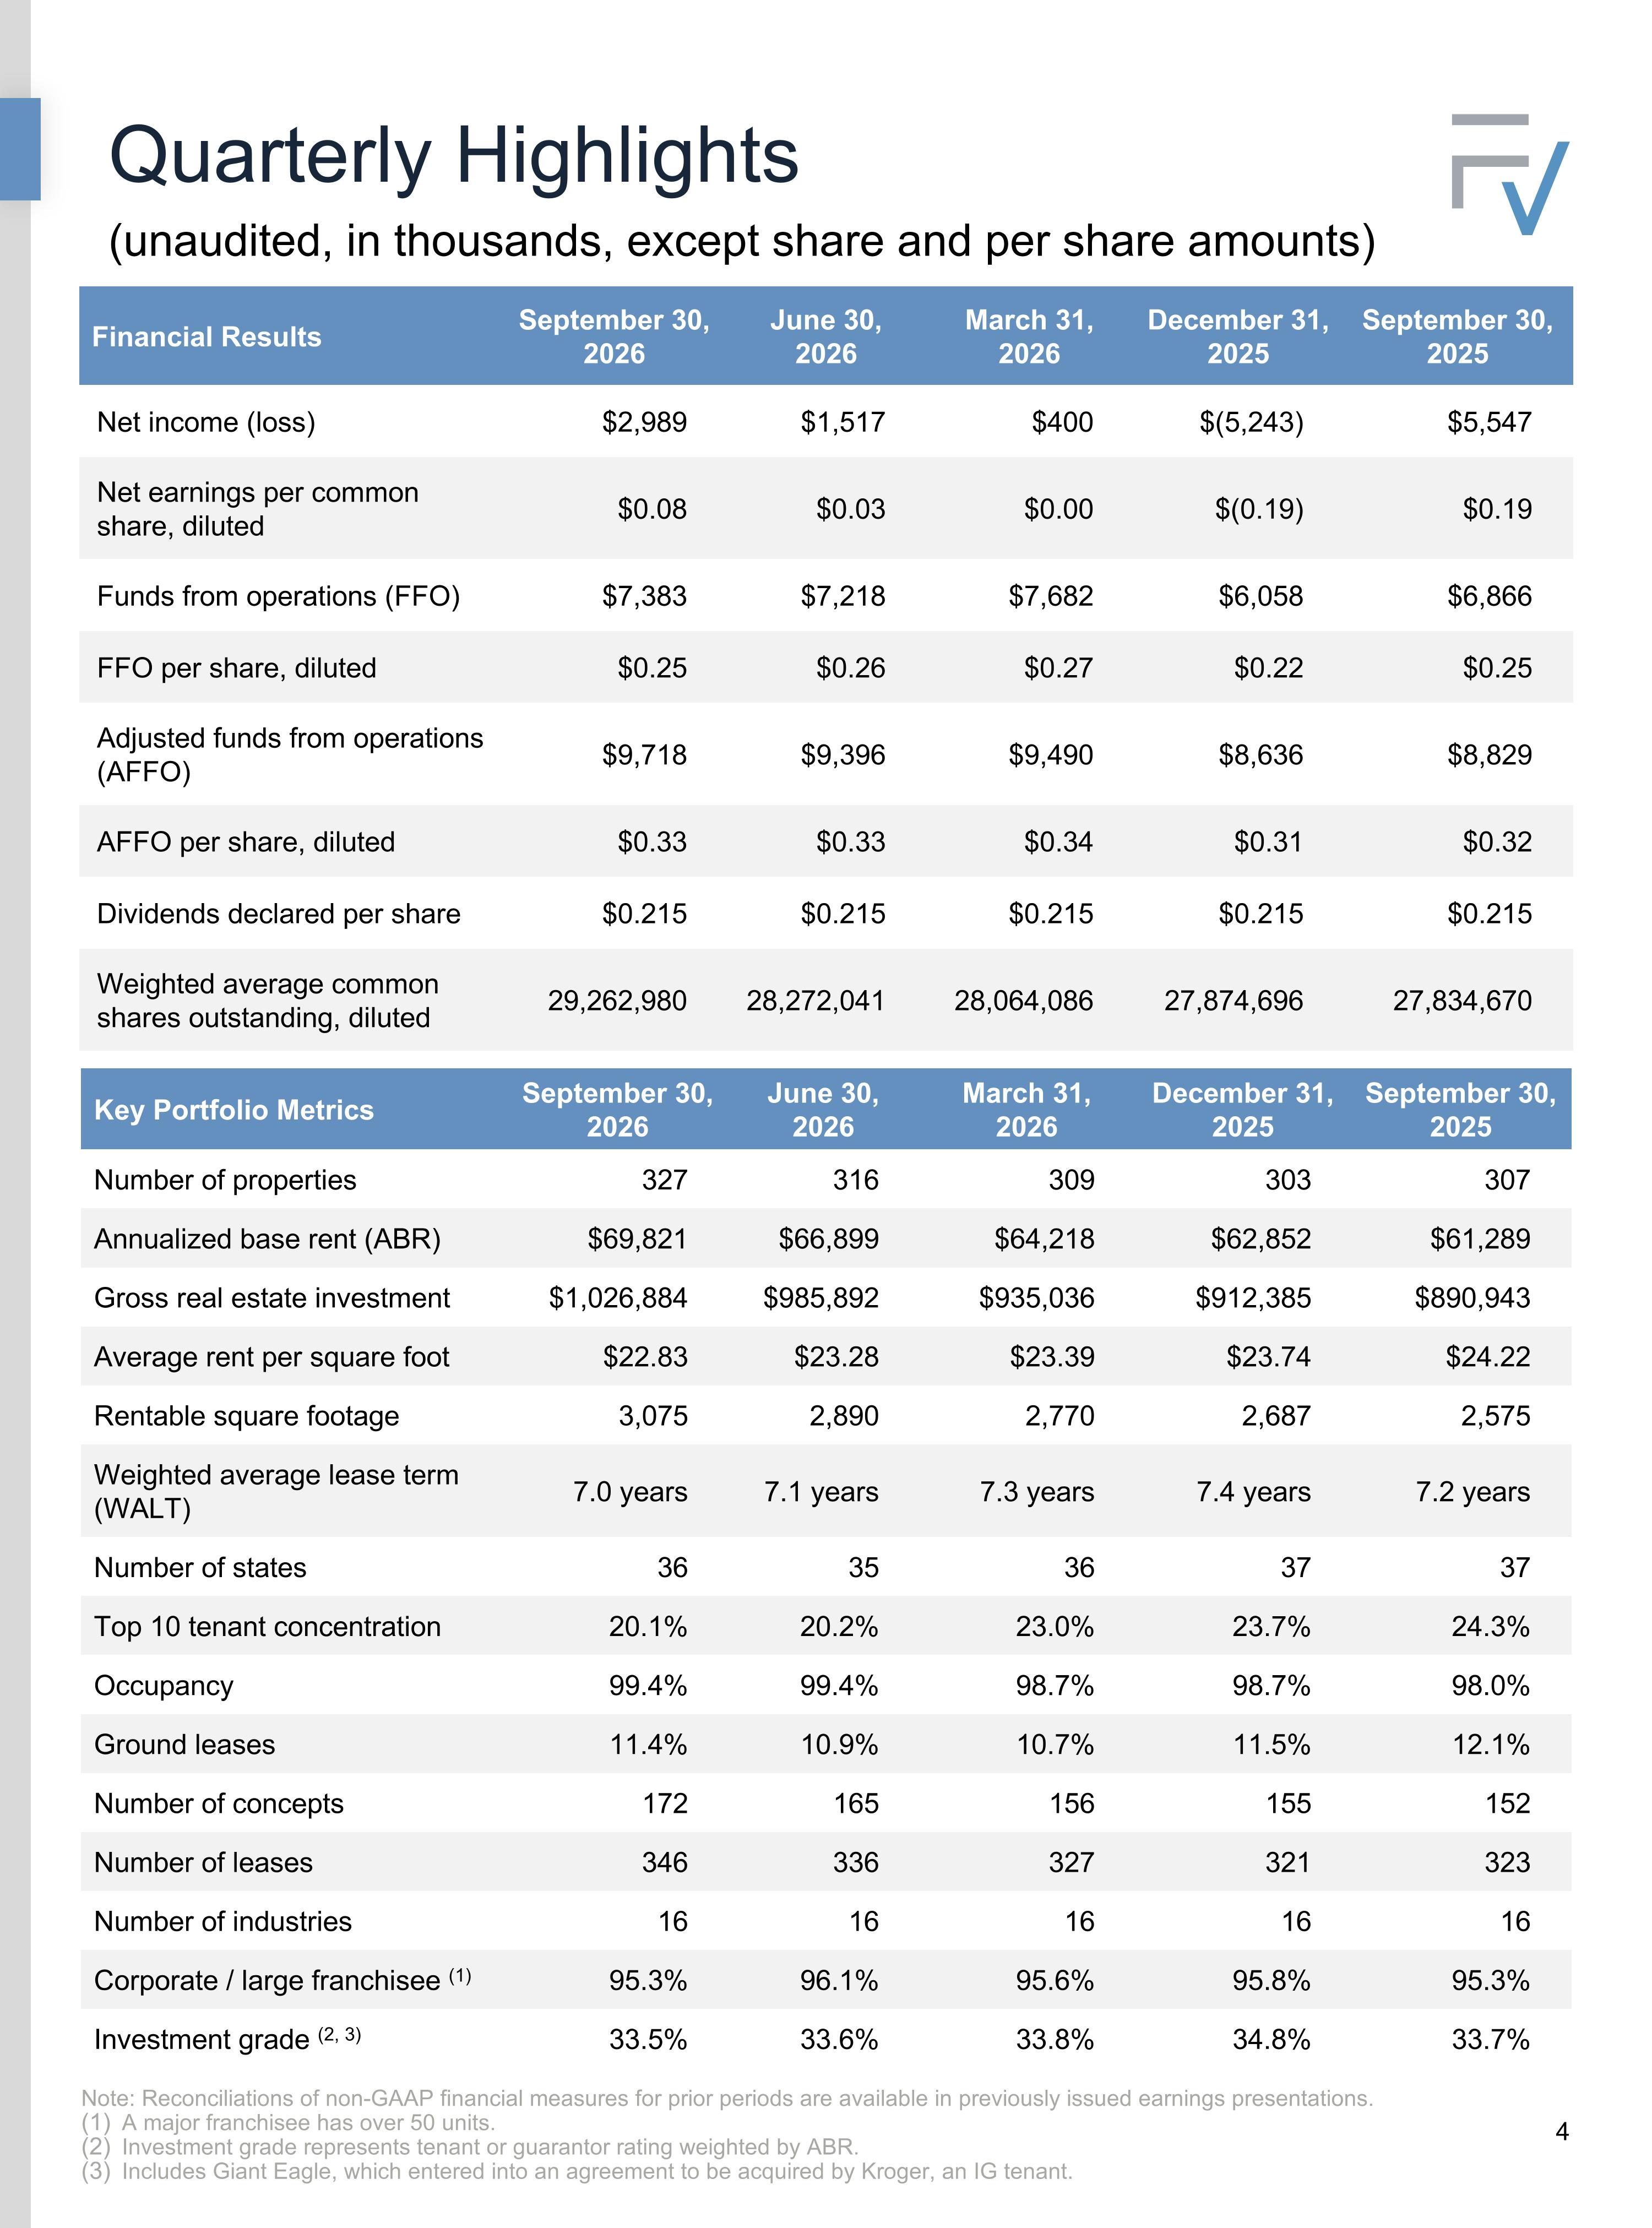
Quarterly Highlights Note: Reconciliations of non-GAAP financial measures for prior periods are available in previously issued earnings presentations. A major franchisee has over 50 units. Investment grade represents tenant or guarantor rating weighted by ABR. Includes Giant Eagle, which entered into an agreement to be acquired by Kroger, an IG tenant. Financial Results September 30, 2026 June 30, 2026 March 31, 2026 December 31, 2025 September 30, 2025 Net income (loss) $2,989 $1,517 $400 $(5,243) $5,547 Net earnings per common share, diluted $0.08 $0.03 $0.00 $(0.19) $0.19 Funds from operations (FFO) $7,383 $7,218 $7,682 $6,058 $6,866 FFO per share, diluted $0.25 $0.26 $0.27 $0.22 $0.25 Adjusted funds from operations (AFFO) $9,718 $9,396 $9,490 $8,636 $8,829 AFFO per share, diluted $0.33 $0.33 $0.34 $0.31 $0.32 Dividends declared per share $0.215 $0.215 $0.215 $0.215 $0.215 Weighted average common shares outstanding, diluted 29,262,980 28,272,041 28,064,086 27,874,696 27,834,670 Key Portfolio Metrics September 30, 2026 June 30, 2026 March 31, 2026 December 31, 2025 September 30, 2025 Number of properties 327 316 309 303 307 Annualized base rent (ABR) $69,821 $66,899 $64,218 $62,852 $61,289 Gross real estate investment $1,026,884 $985,892 $935,036 $912,385 $890,943 Average rent per square foot $22.83 $23.28 $23.39 $23.74 $24.22 Rentable square footage 3,075 2,890 2,770 2,687 2,575 Weighted average lease term (WALT) 7.0 years 7.1 years 7.3 years 7.4 years 7.2 years Number of states 36 35 36 37 37 Top 10 tenant concentration 20.1% 20.2% 23.0% 23.7% 24.3% Occupancy 99.4% 99.4% 98.7% 98.7% 98.0% Ground leases 11.4% 10.9% 10.7% 11.5% 12.1% Number of concepts 172 165 156 155 152 Number of leases 346 336 327 321 323 Number of industries 16 16 16 16 16 Corporate / large franchisee (1) 95.3% 96.1% 95.6% 95.8% 95.3% Investment grade (2, 3) 33.5% 33.6% 33.8% 34.8% 33.7% (unaudited, in thousands, except share and per share amounts)
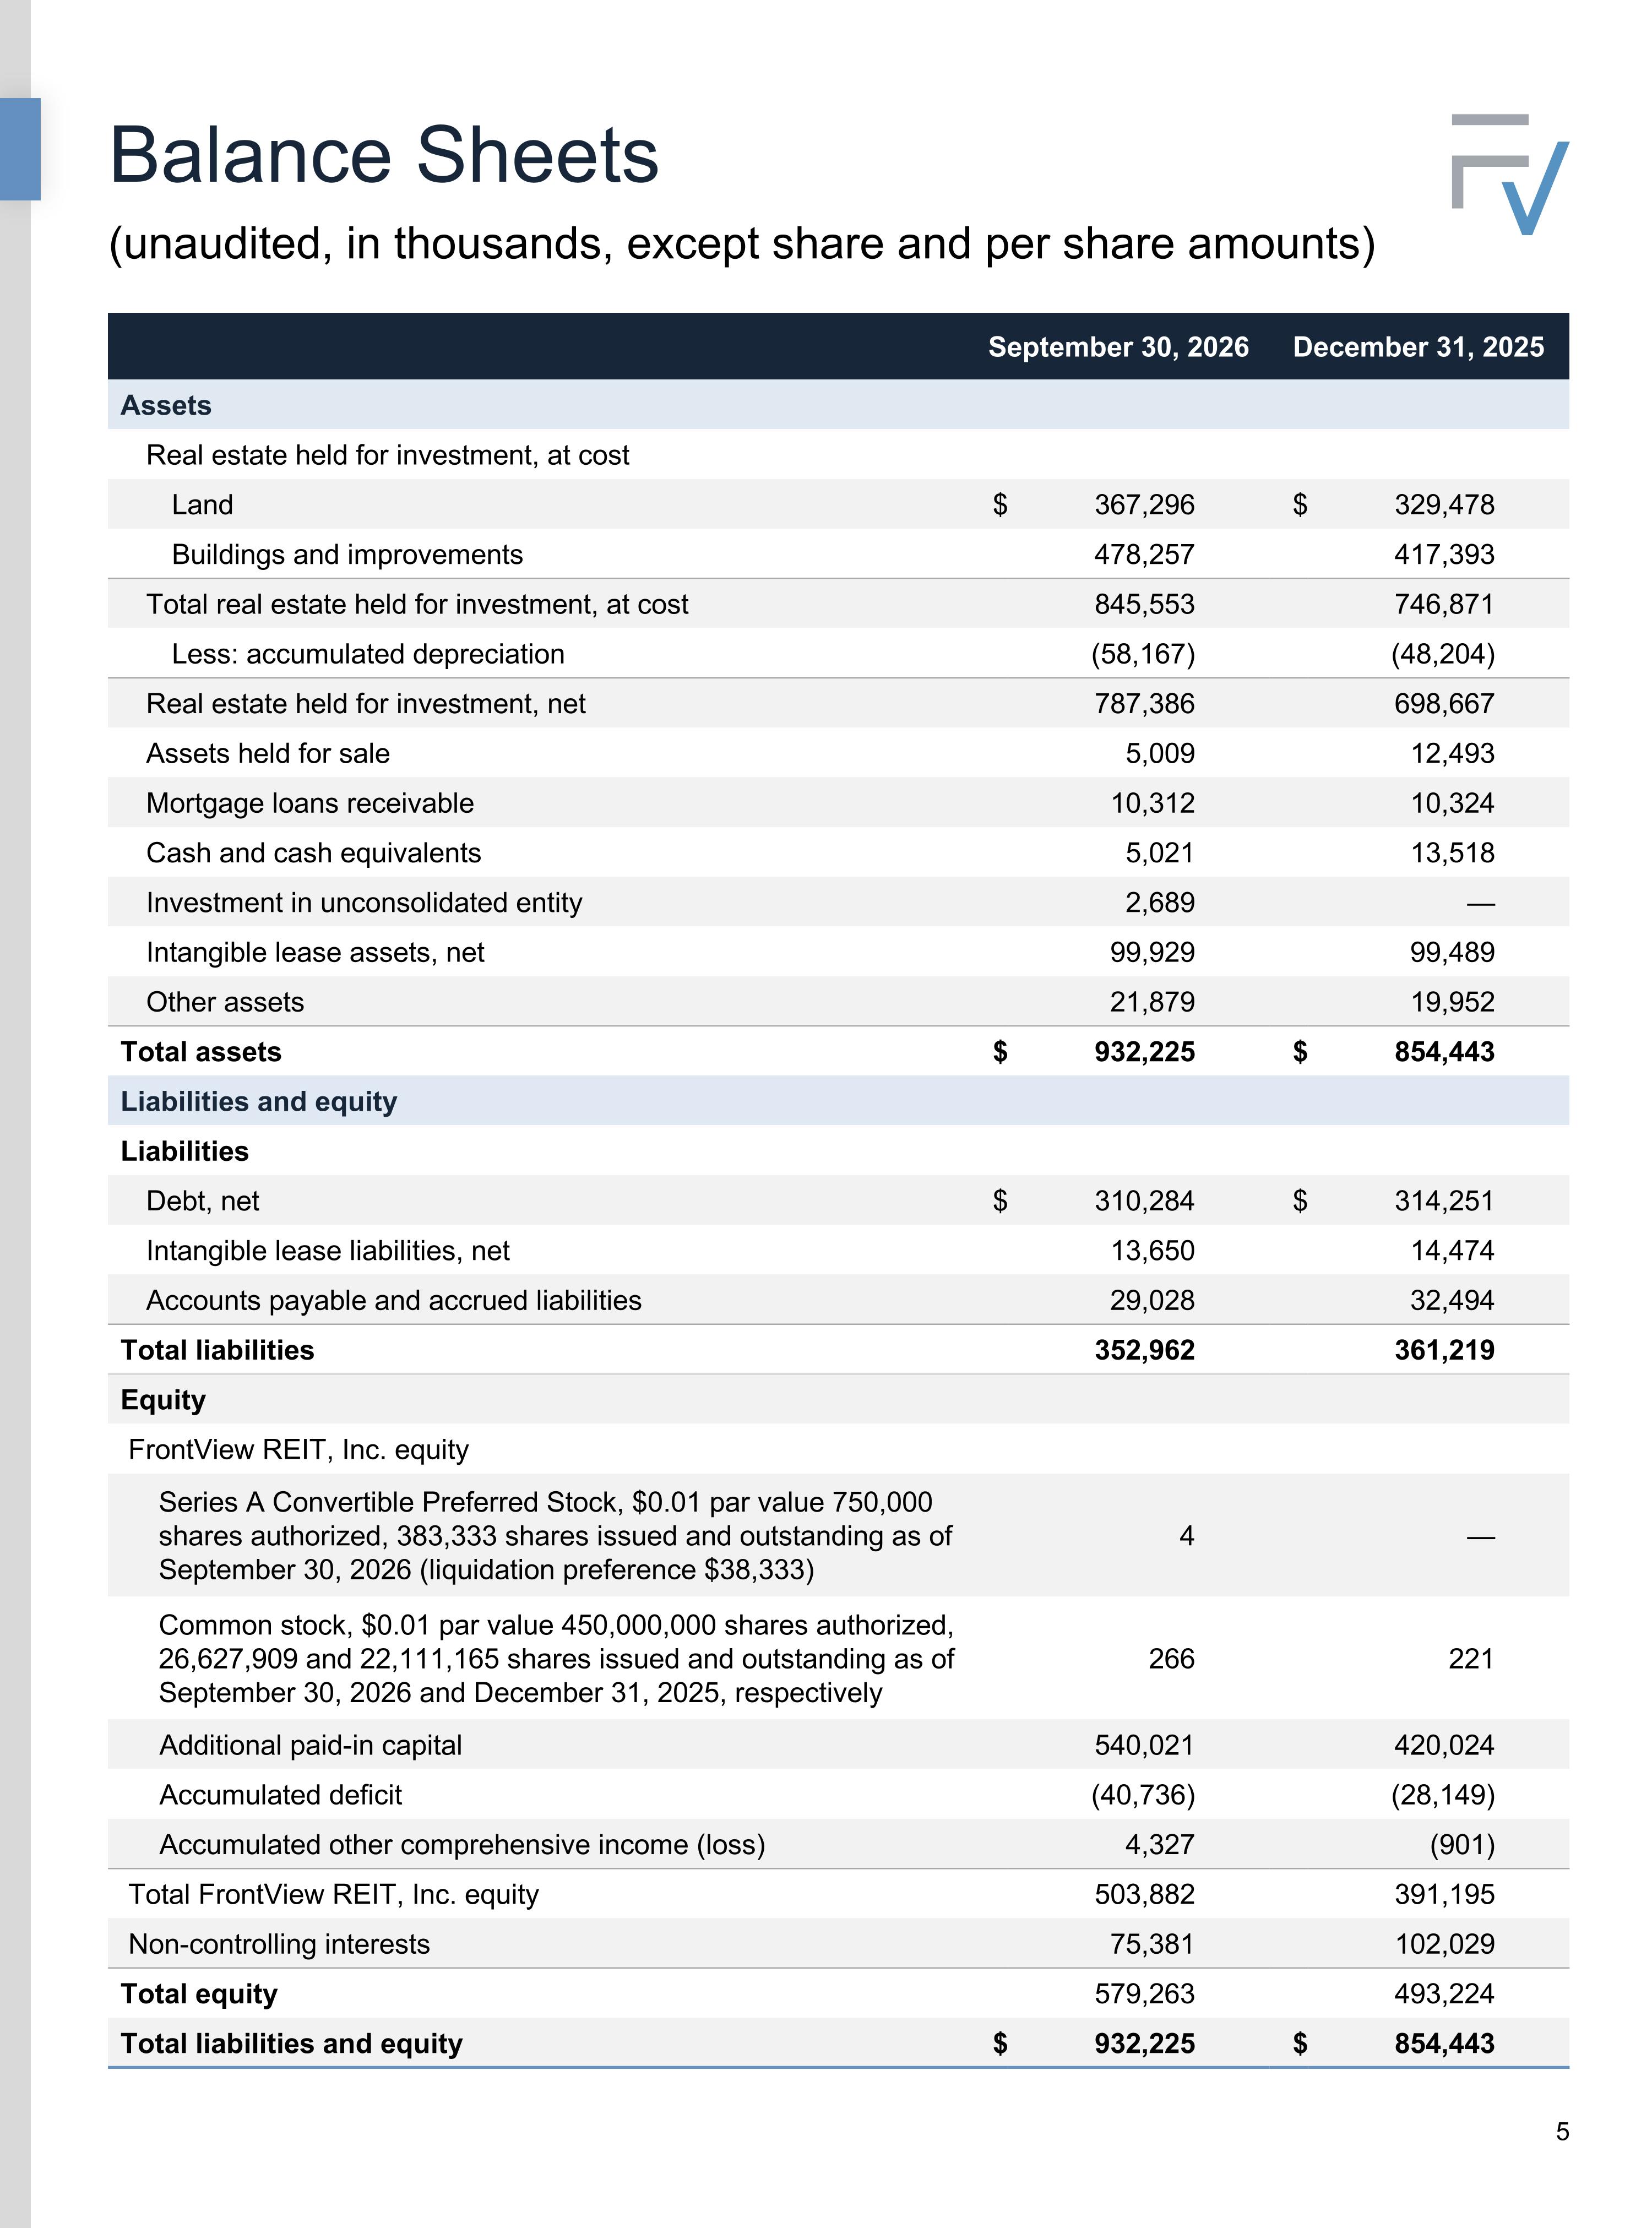
Balance Sheets (unaudited, in thousands, except share and per share amounts) September 30, 2026 December 31, 2025 Assets Real estate held for investment, at cost Land $ 367,296 $ 329,478 Buildings and improvements 478,257 417,393 Total real estate held for investment, at cost 845,553 746,871 Less: accumulated depreciation (58,167) (48,204) Real estate held for investment, net 787,386 698,667 Assets held for sale 5,009 12,493 Mortgage loans receivable 10,312 10,324 Cash and cash equivalents 5,021 13,518 Investment in unconsolidated entity 2,689 — Intangible lease assets, net 99,929 99,489 Other assets 21,879 19,952 Total assets $ 932,225 $ 854,443 Liabilities and equity Liabilities Debt, net $ 310,284 $ 314,251 Intangible lease liabilities, net 13,650 14,474 Accounts payable and accrued liabilities 29,028 32,494 Total liabilities 352,962 361,219 Equity FrontView REIT, Inc. equity Series A Convertible Preferred Stock, $0.01 par value 750,000 shares authorized, 383,333 shares issued and outstanding as of September 30, 2026 (liquidation preference $38,333) 4 — Common stock, $0.01 par value 450,000,000 shares authorized, 26,627,909 and 22,111,165 shares issued and outstanding as of September 30, 2026 and December 31, 2025, respectively 266 221 Additional paid-in capital 540,021 420,024 Accumulated deficit (40,736) (28,149) Accumulated other comprehensive income (loss) 4,327 (901) Total FrontView REIT, Inc. equity 503,882 391,195 Non-controlling interests 75,381 102,029 Total equity 579,263 493,224 Total liabilities and equity $ 932,225 $ 854,443
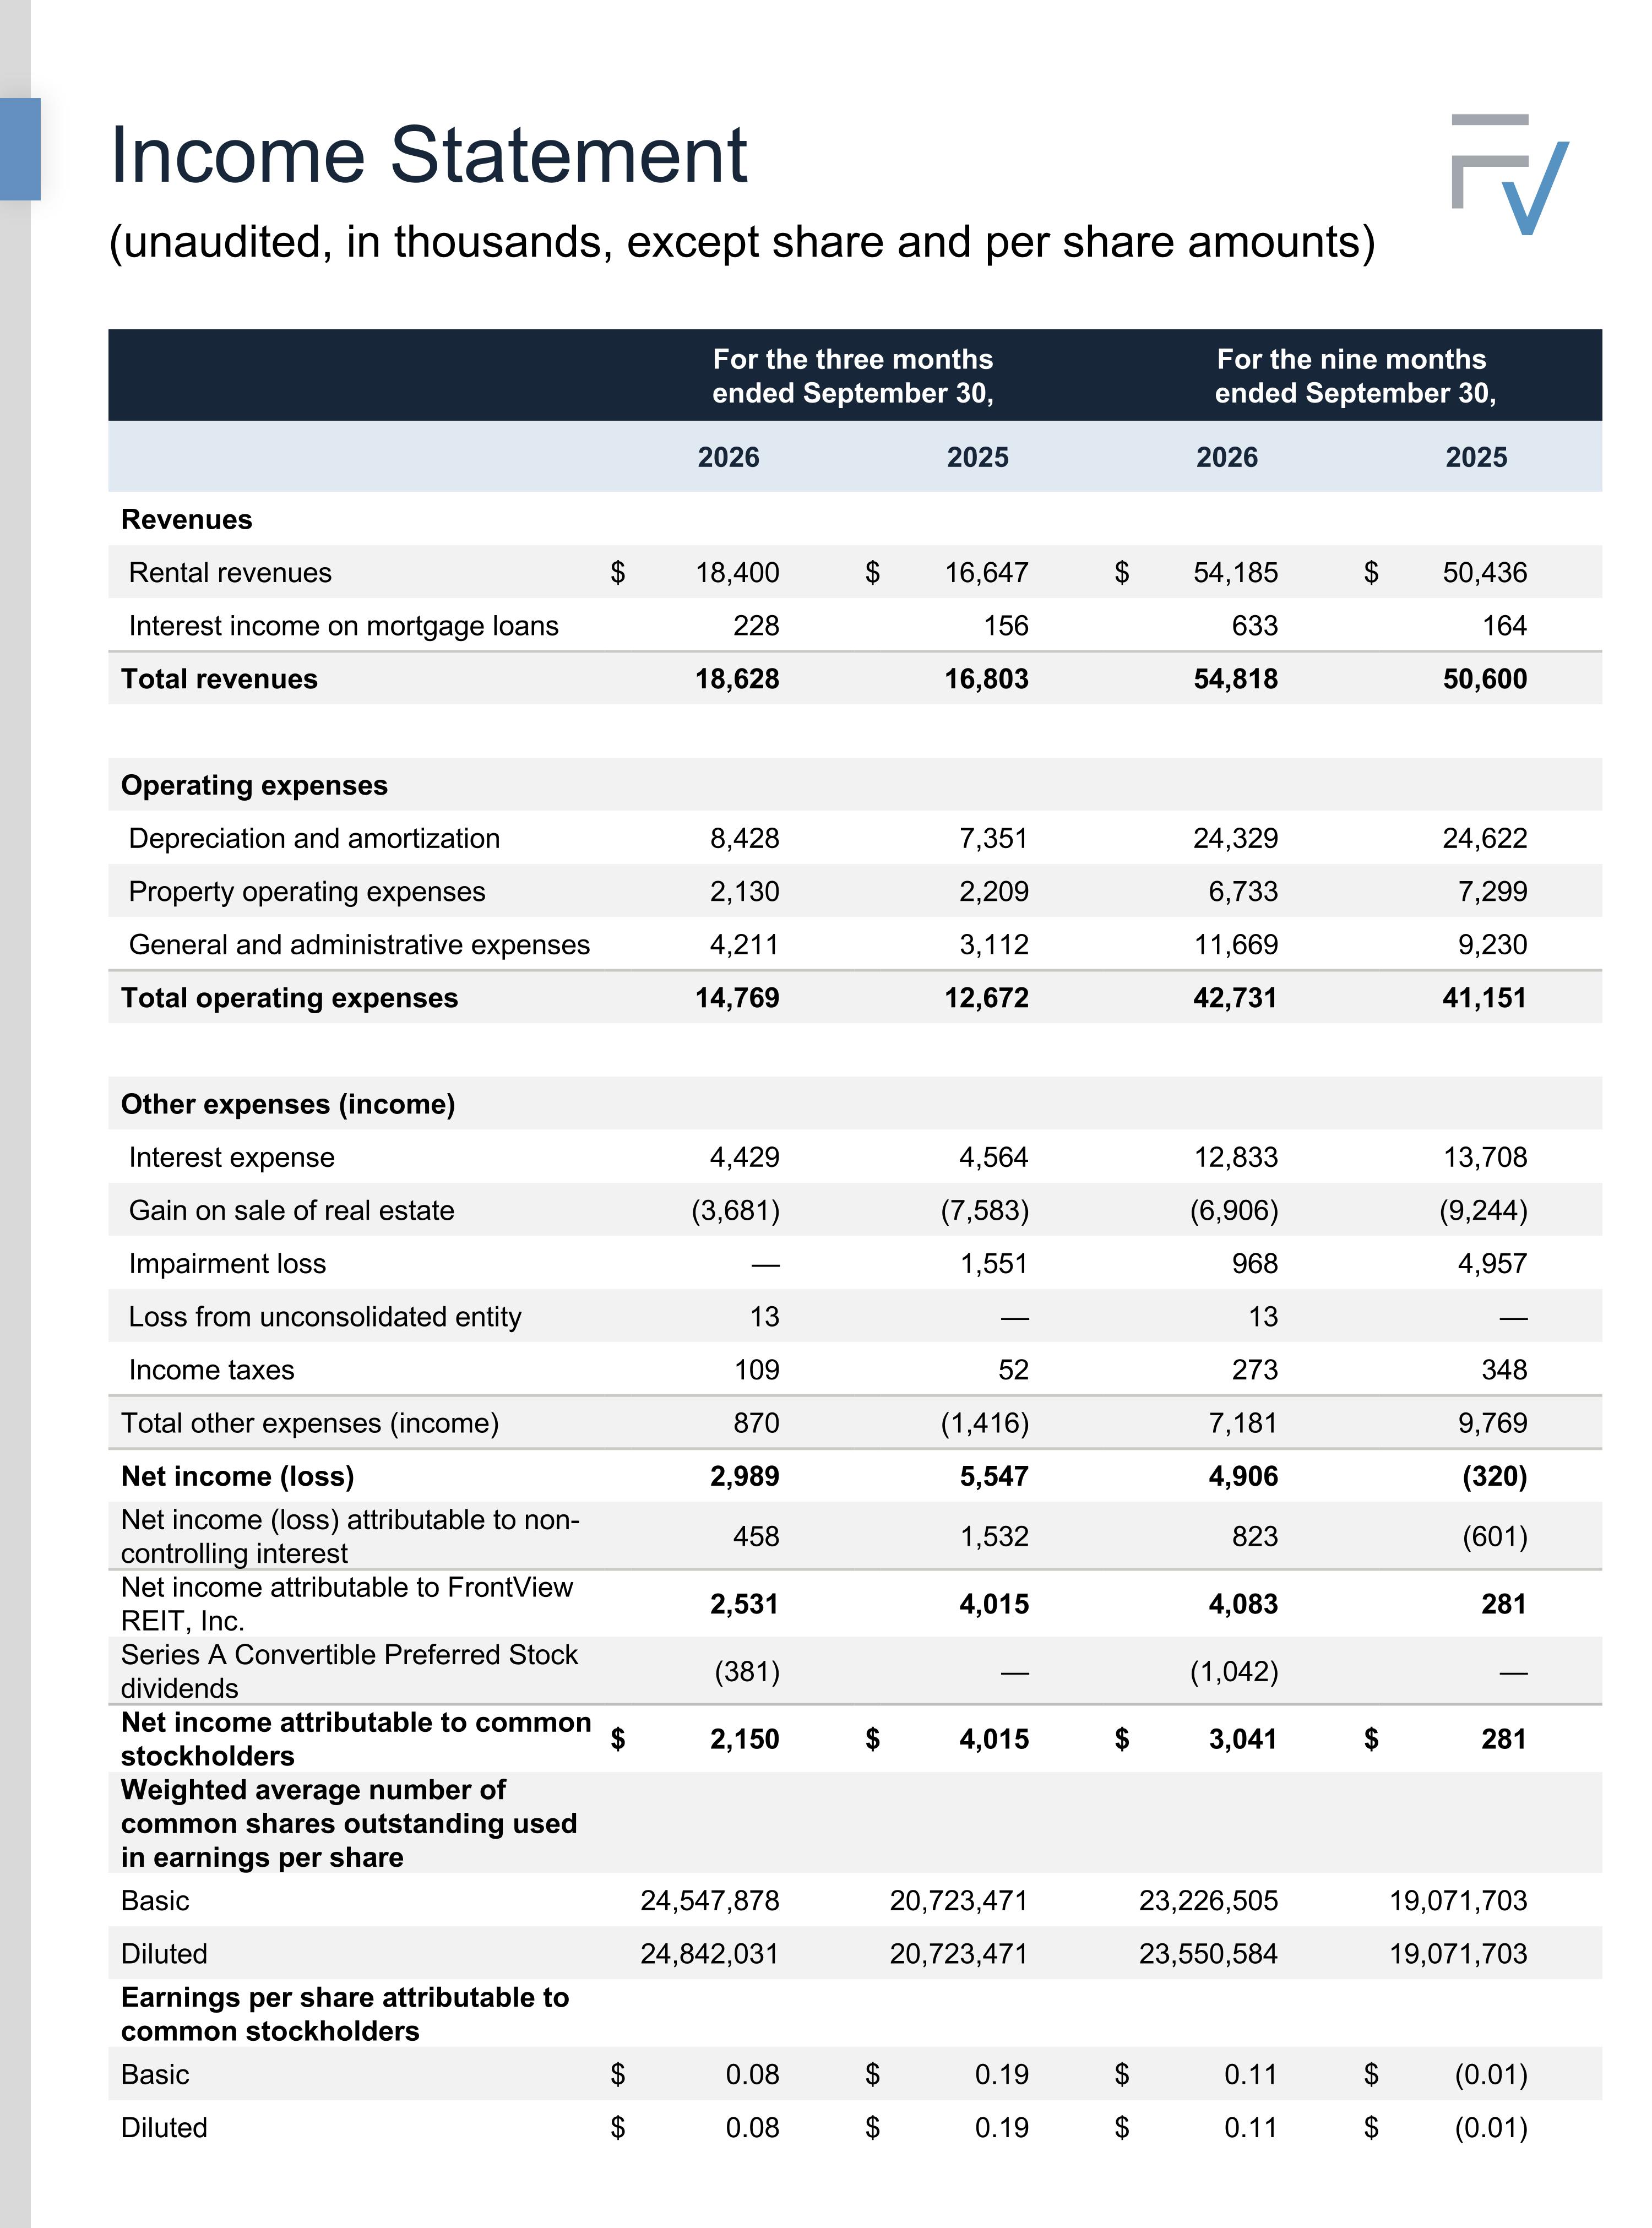
Income Statement For the three months ended September 30, For the nine months ended September 30, 2026 2025 2026 2025 Revenues Rental revenues $ 18,400 $ 16,647 $ 54,185 $ 50,436 Interest income on mortgage loans 228 156 633 164 Total revenues 18,628 16,803 54,818 50,600 Operating expenses Depreciation and amortization 8,428 7,351 24,329 24,622 Property operating expenses 2,130 2,209 6,733 7,299 General and administrative expenses 4,211 3,112 11,669 9,230 Total operating expenses 14,769 12,672 42,731 41,151 Other expenses (income) Interest expense 4,429 4,564 12,833 13,708 Gain on sale of real estate (3,681) (7,583) (6,906) (9,244) Impairment loss — 1,551 968 4,957 Loss from unconsolidated entity 13 — 13 — Income taxes 109 52 273 348 Total other expenses (income) 870 (1,416) 7,181 9,769 Net income (loss) 2,989 5,547 4,906 (320) Net income (loss) attributable to non-controlling interest 458 1,532 823 (601) Net income attributable to FrontView REIT, Inc. 2,531 4,015 4,083 281 Series A Convertible Preferred Stock dividends (381) — (1,042) — Net income attributable to common stockholders $ 2,150 $ 4,015 $ 3,041 $ 281 Weighted average number of common shares outstanding used in earnings per share Basic 24,547,878 20,723,471 23,226,505 19,071,703 Diluted 24,842,031 20,723,471 23,550,584 19,071,703 Earnings per share attributable to common stockholders Basic $ 0.08 $ 0.19 $ 0.11 $ (0.01) Diluted $ 0.08 $ 0.19 $ 0.11 $ (0.01) (unaudited, in thousands, except share and per share amounts)
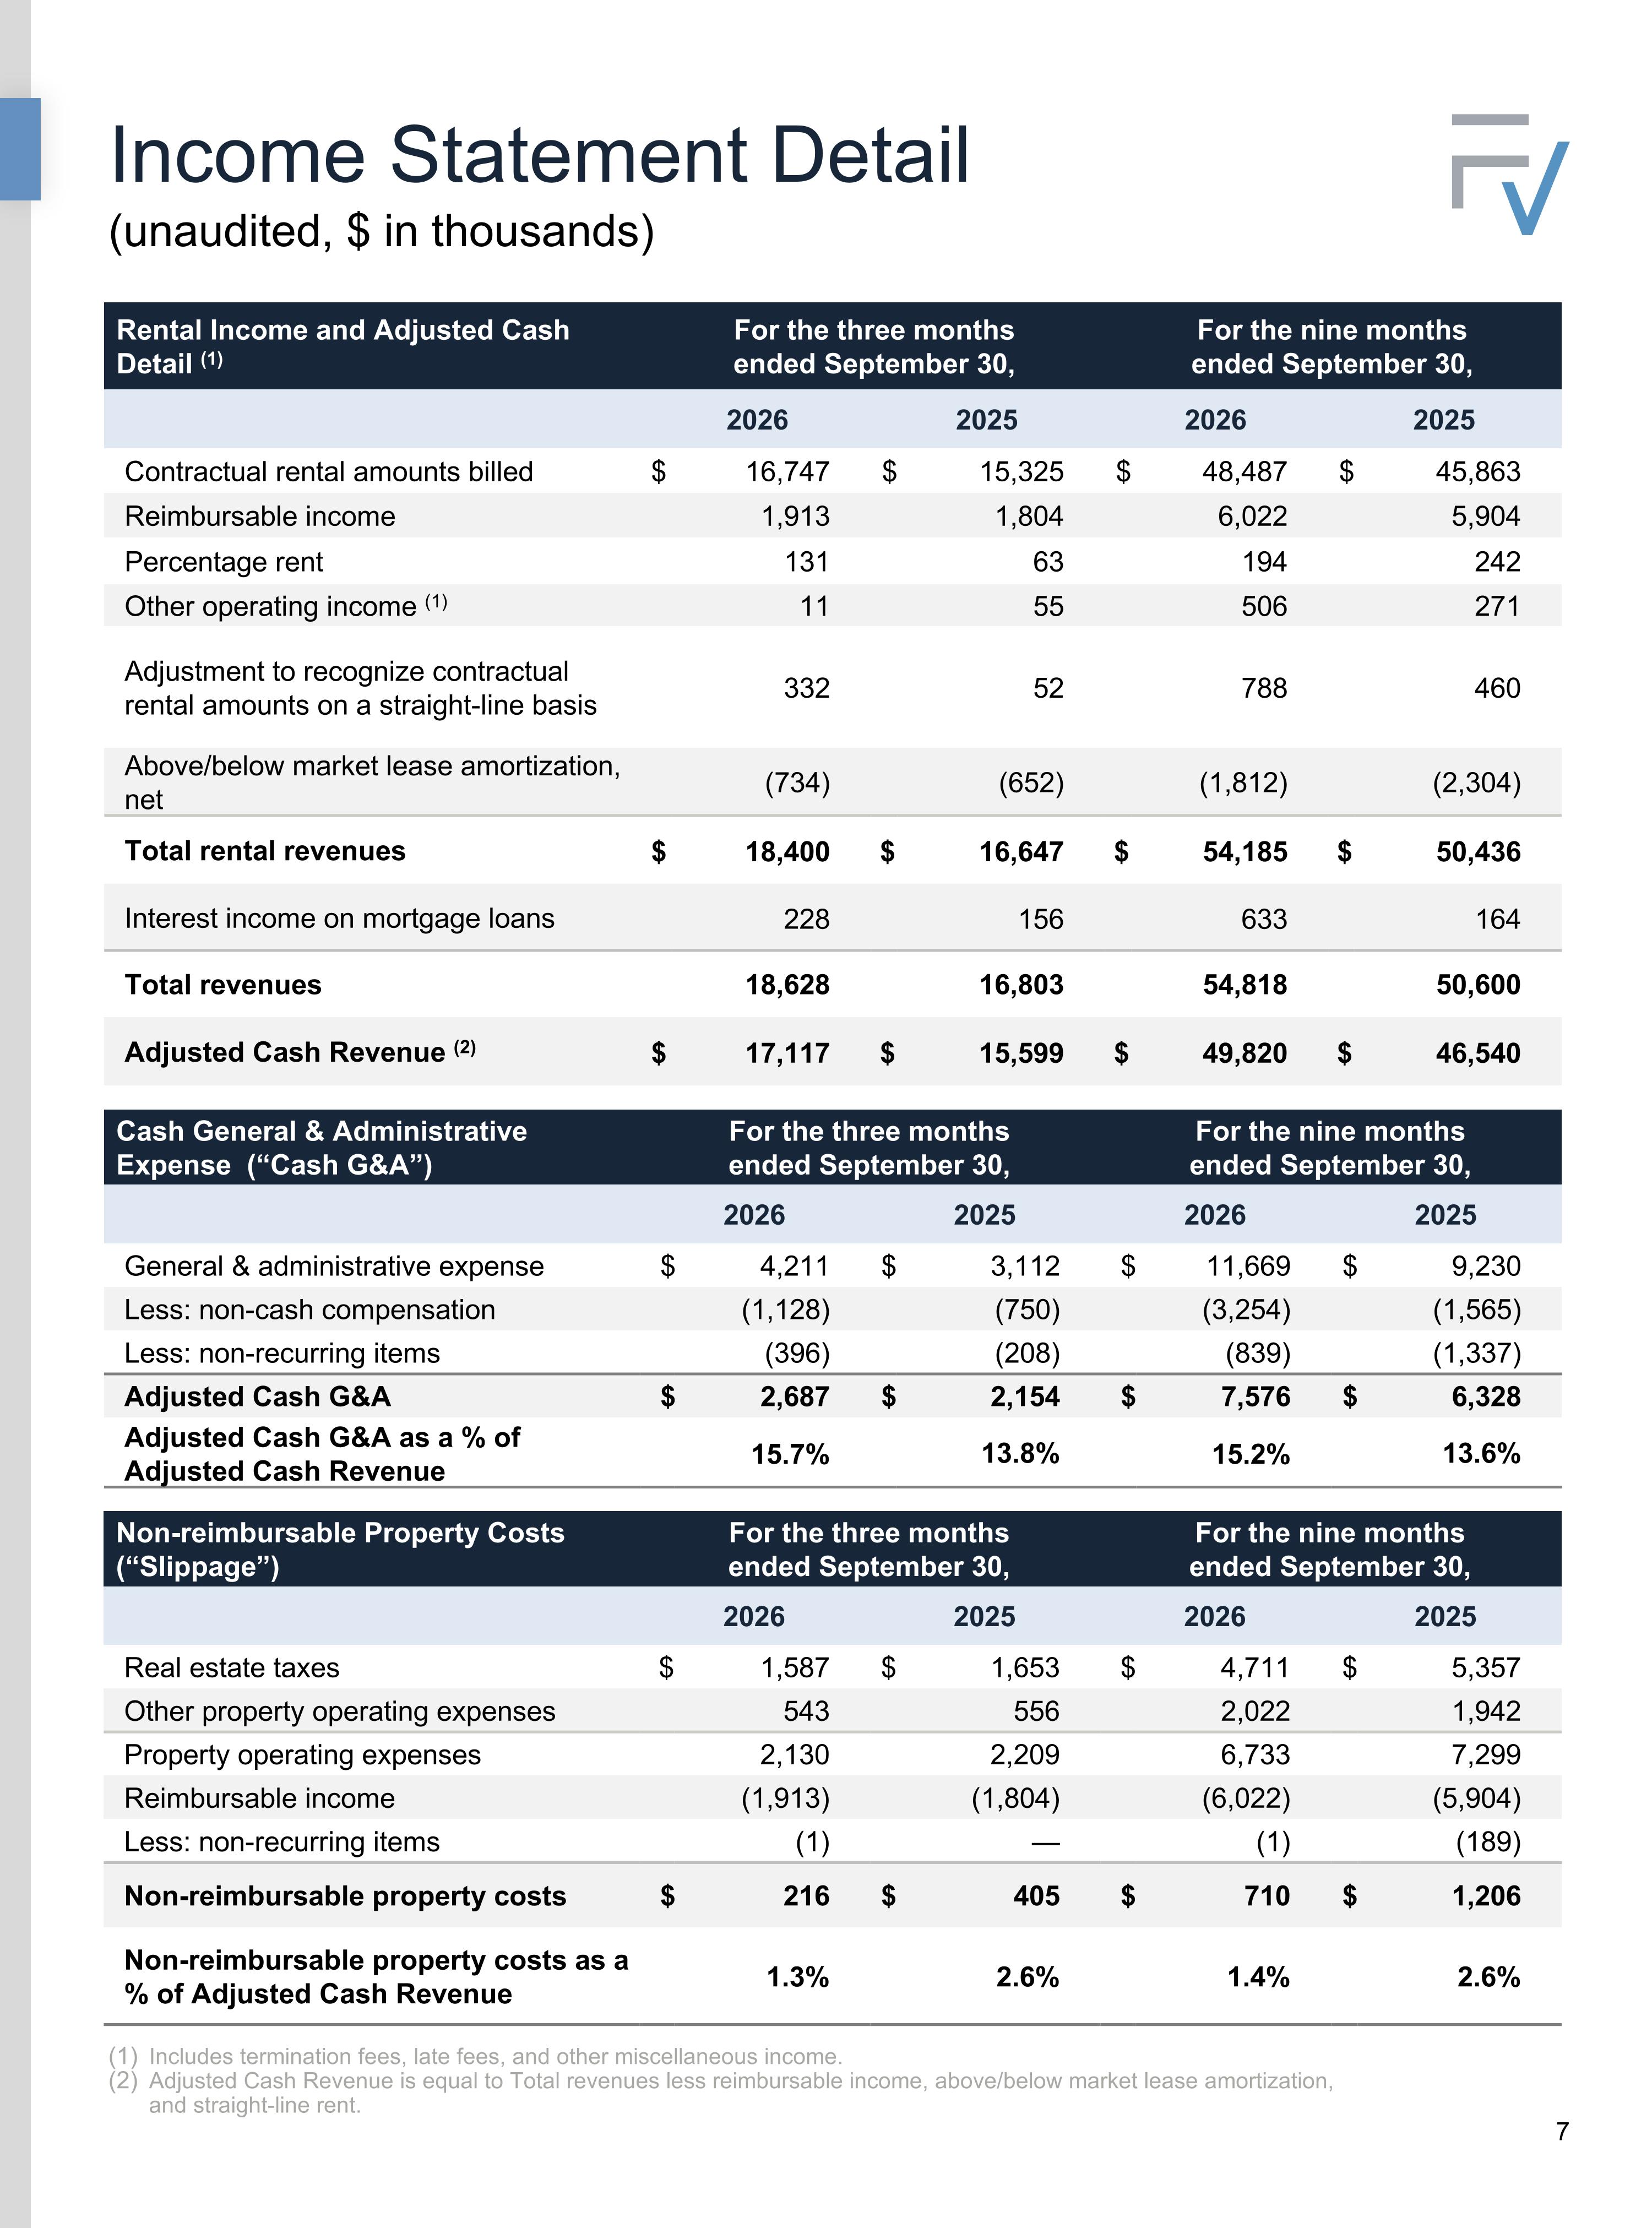
Income Statement Detail (unaudited, $ in thousands) Includes termination fees, late fees, and other miscellaneous income. Adjusted Cash Revenue is equal to Total revenues less reimbursable income, above/below market lease amortization, and straight-line rent. Rental Income and Adjusted Cash Detail (1) For the three months ended September 30, For the nine months ended September 30, 2026 2025 2026 2025 Contractual rental amounts billed $ 16,747 $ 15,325 $ 48,487 $ 45,863 Reimbursable income 1,913 1,804 6,022 5,904 Percentage rent 131 63 194 242 Other operating income (1) 11 55 506 271 Adjustment to recognize contractual rental amounts on a straight-line basis 332 52 788 460 Above/below market lease amortization, net (734) (652) (1,812) (2,304) Total rental revenues $ 18,400 $ 16,647 $ 54,185 $ 50,436 Interest income on mortgage loans 228 156 633 164 Total revenues 18,628 16,803 54,818 50,600 Adjusted Cash Revenue (2) $ 17,117 $ 15,599 $ 49,820 $ 46,540 Non-reimbursable Property Costs (“Slippage”) For the three months ended September 30, For the nine months ended September 30, 2026 2025 2026 2025 Real estate taxes $ 1,587 $ 1,653 $ 4,711 $ 5,357 Other property operating expenses 543 556 2,022 1,942 Property operating expenses 2,130 2,209 6,733 7,299 Reimbursable income (1,913) (1,804) (6,022) (5,904) Less: non-recurring items (1) — (1) (189) Non-reimbursable property costs $ 216 $ 405 $ 710 $ 1,206 Non-reimbursable property costs as a % of Adjusted Cash Revenue 1.3% 2.6% 1.4% 2.6% Cash General & Administrative Expense (“Cash G&A”) For the three months ended September 30, For the nine months ended September 30, 2026 2025 2026 2025 General & administrative expense $ 4,211 $ 3,112 $ 11,669 $ 9,230 Less: non-cash compensation (1,128) (750) (3,254) (1,565) Less: non-recurring items (396) (208) (839) (1,337) Adjusted Cash G&A $ 2,687 $ 2,154 $ 7,576 $ 6,328 Adjusted Cash G&A as a % of Adjusted Cash Revenue 15.7% 13.8% 15.2% 13.6%
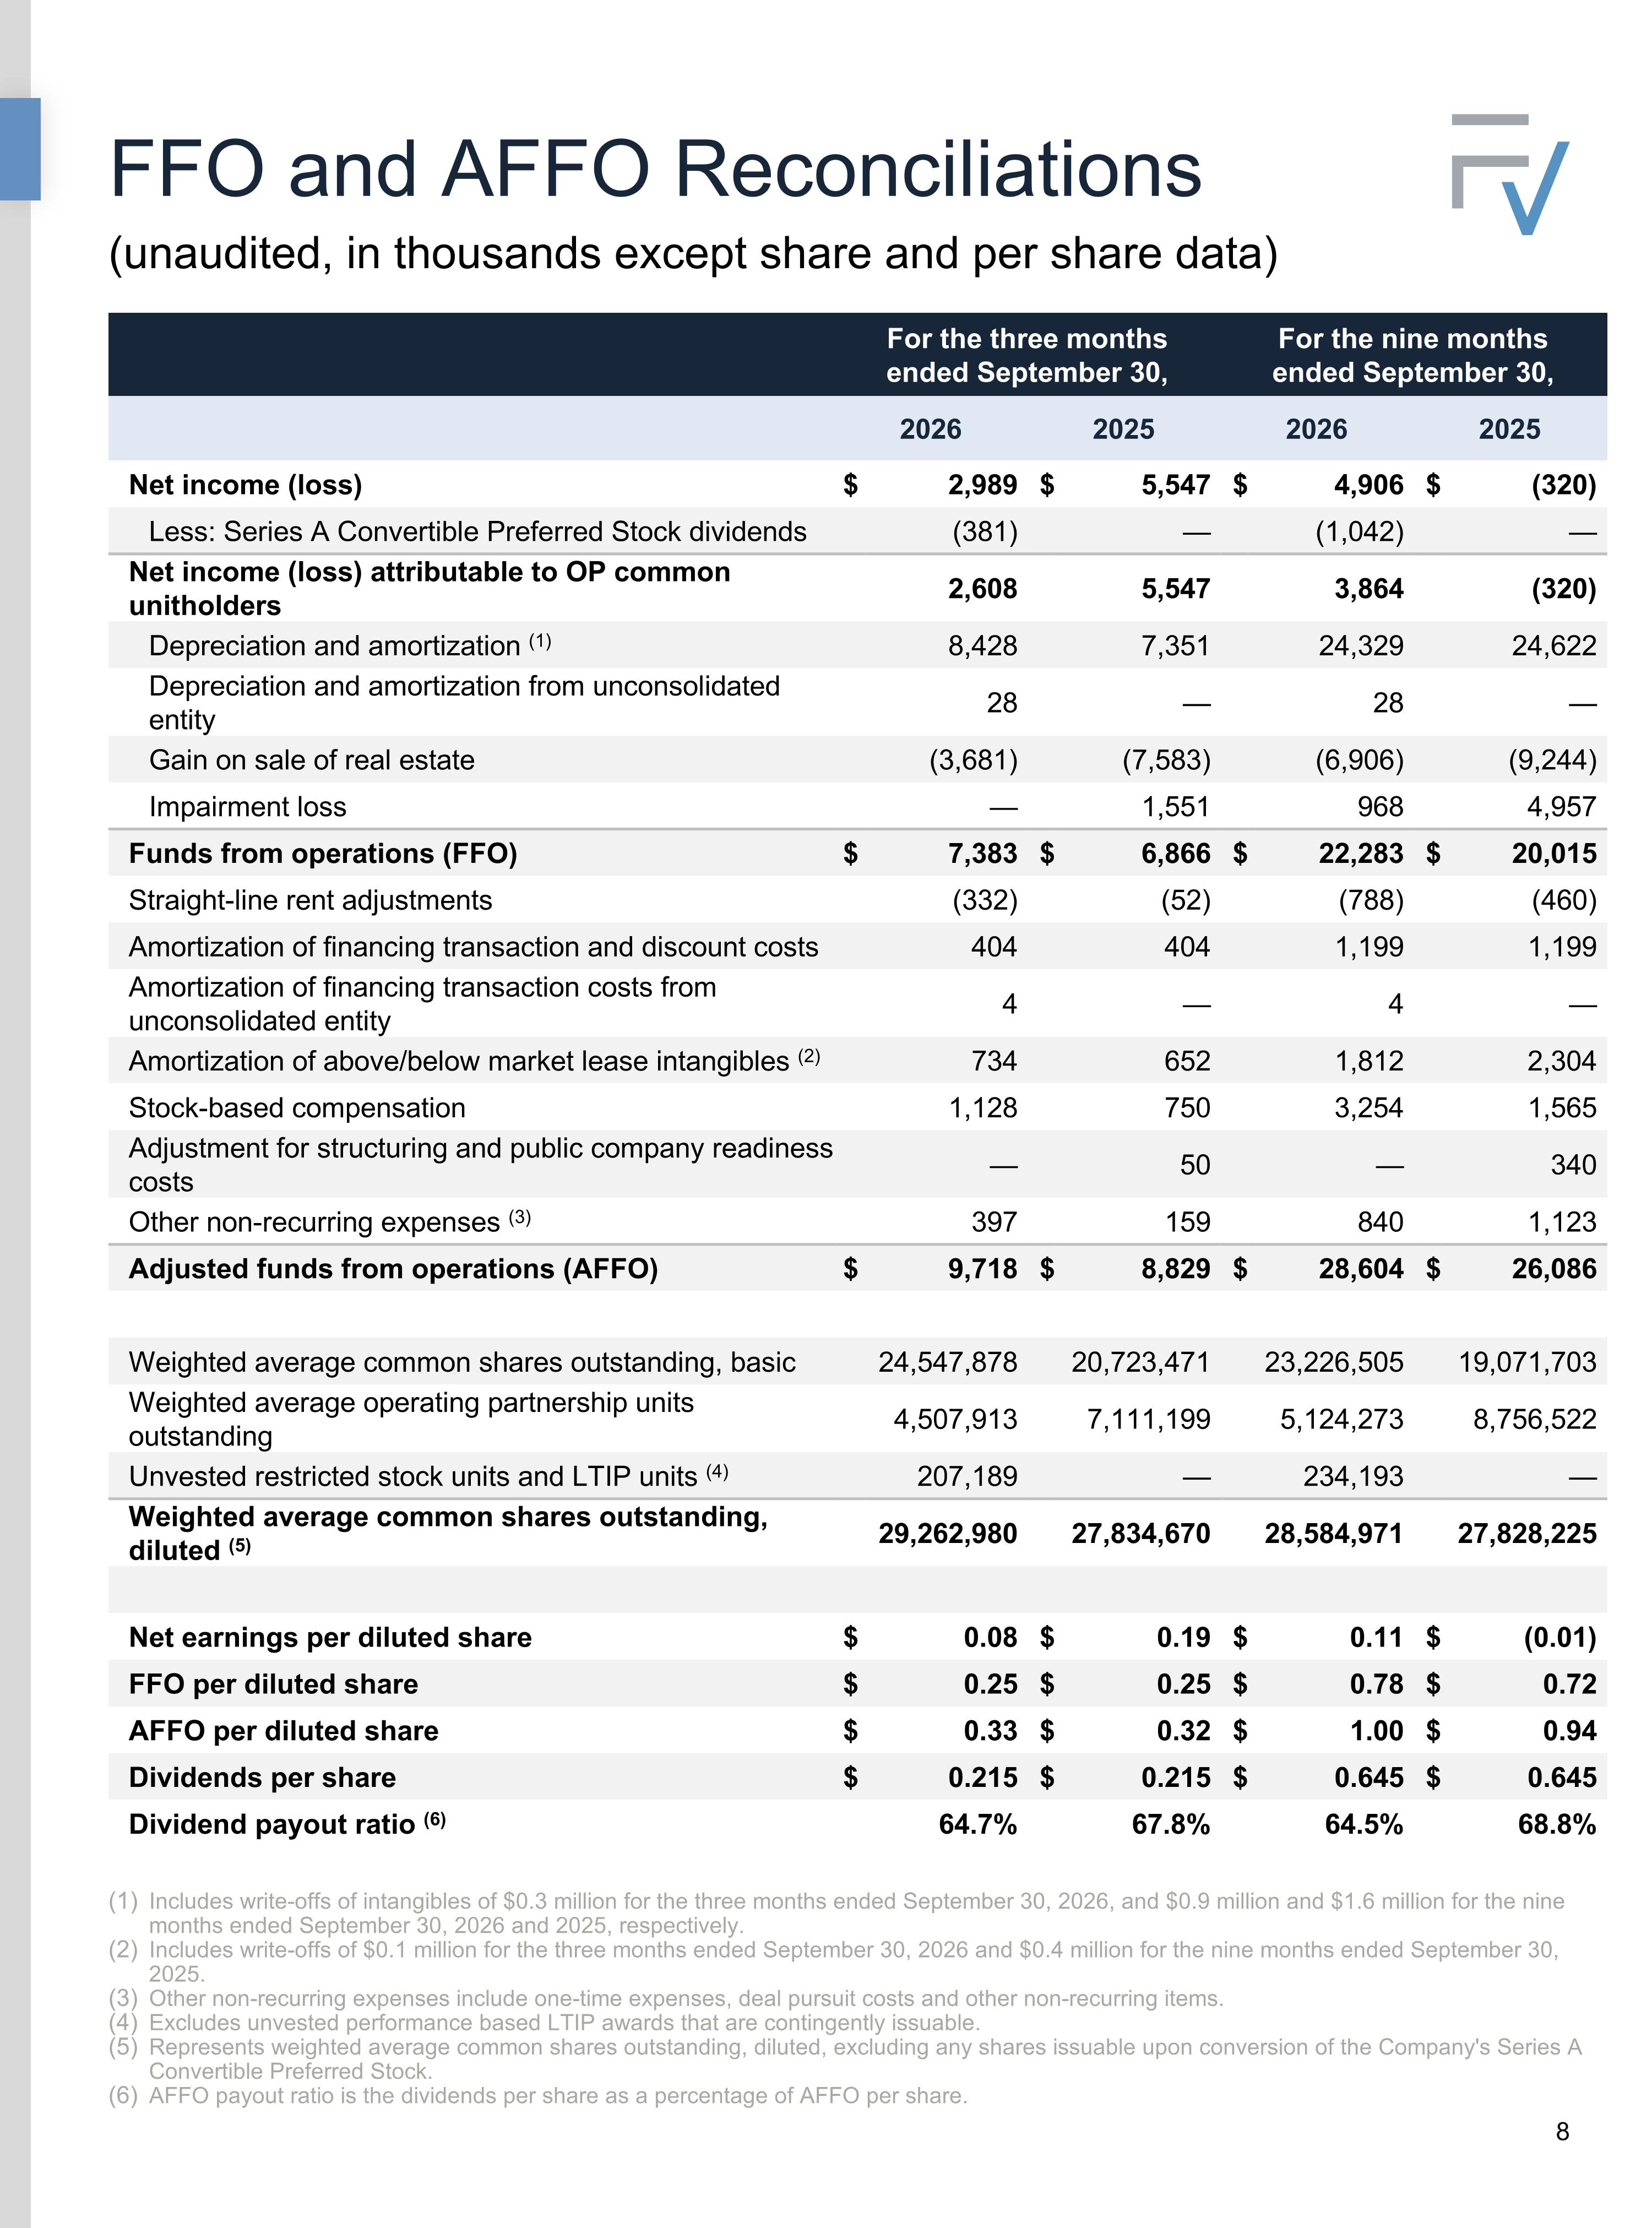
Includes write-offs of intangibles of $0.3 million for the three months ended September 30, 2026, and $0.9 million and $1.6 million for the nine months ended September 30, 2026 and 2025, respectively. Includes write-offs of $0.1 million for the three months ended September 30, 2026 and $0.4 million for the nine months ended September 30, 2025. Other non-recurring expenses include one-time expenses, deal pursuit costs and other non-recurring items. Excludes unvested performance based LTIP awards that are contingently issuable. Represents weighted average common shares outstanding, diluted, excluding any shares issuable upon conversion of the Company's Series A Convertible Preferred Stock. AFFO payout ratio is the dividends per share as a percentage of AFFO per share. FFO and AFFO Reconciliations (unaudited, in thousands except share and per share data) For the three months ended September 30, For the nine months ended September 30, 2026 2025 2026 2025 Net income (loss) $ 2,989 $ 5,547 $ 4,906 $ (320) Less: Series A Convertible Preferred Stock dividends (381) — (1,042) — Net income (loss) attributable to OP common unitholders 2,608 5,547 3,864 (320) Depreciation and amortization (1) 8,428 7,351 24,329 24,622 Depreciation and amortization from unconsolidated entity 28 — 28 — Gain on sale of real estate (3,681) (7,583) (6,906) (9,244) Impairment loss — 1,551 968 4,957 Funds from operations (FFO) $ 7,383 $ 6,866 $ 22,283 $ 20,015 Straight-line rent adjustments (332) (52) (788) (460) Amortization of financing transaction and discount costs 404 404 1,199 1,199 Amortization of financing transaction costs from unconsolidated entity 4 — 4 — Amortization of above/below market lease intangibles (2) 734 652 1,812 2,304 Stock-based compensation 1,128 750 3,254 1,565 Adjustment for structuring and public company readiness costs — 50 — 340 Other non-recurring expenses (3) 397 159 840 1,123 Adjusted funds from operations (AFFO) $ 9,718 $ 8,829 $ 28,604 $ 26,086 Weighted average common shares outstanding, basic 24,547,878 20,723,471 23,226,505 19,071,703 Weighted average operating partnership units outstanding 4,507,913 7,111,199 5,124,273 8,756,522 Unvested restricted stock units and LTIP units (4) 207,189 — 234,193 — Weighted average common shares outstanding, diluted (5) 29,262,980 27,834,670 28,584,971 27,828,225 Net earnings per diluted share $ 0.08 $ 0.19 $ 0.11 $ (0.01) FFO per diluted share $ 0.25 $ 0.25 $ 0.78 $ 0.72 AFFO per diluted share $ 0.33 $ 0.32 $ 1.00 $ 0.94 Dividends per share $ 0.215 $ 0.215 $ 0.645 $ 0.645 Dividend payout ratio (6) 64.7% 67.8% 64.5% 68.8%
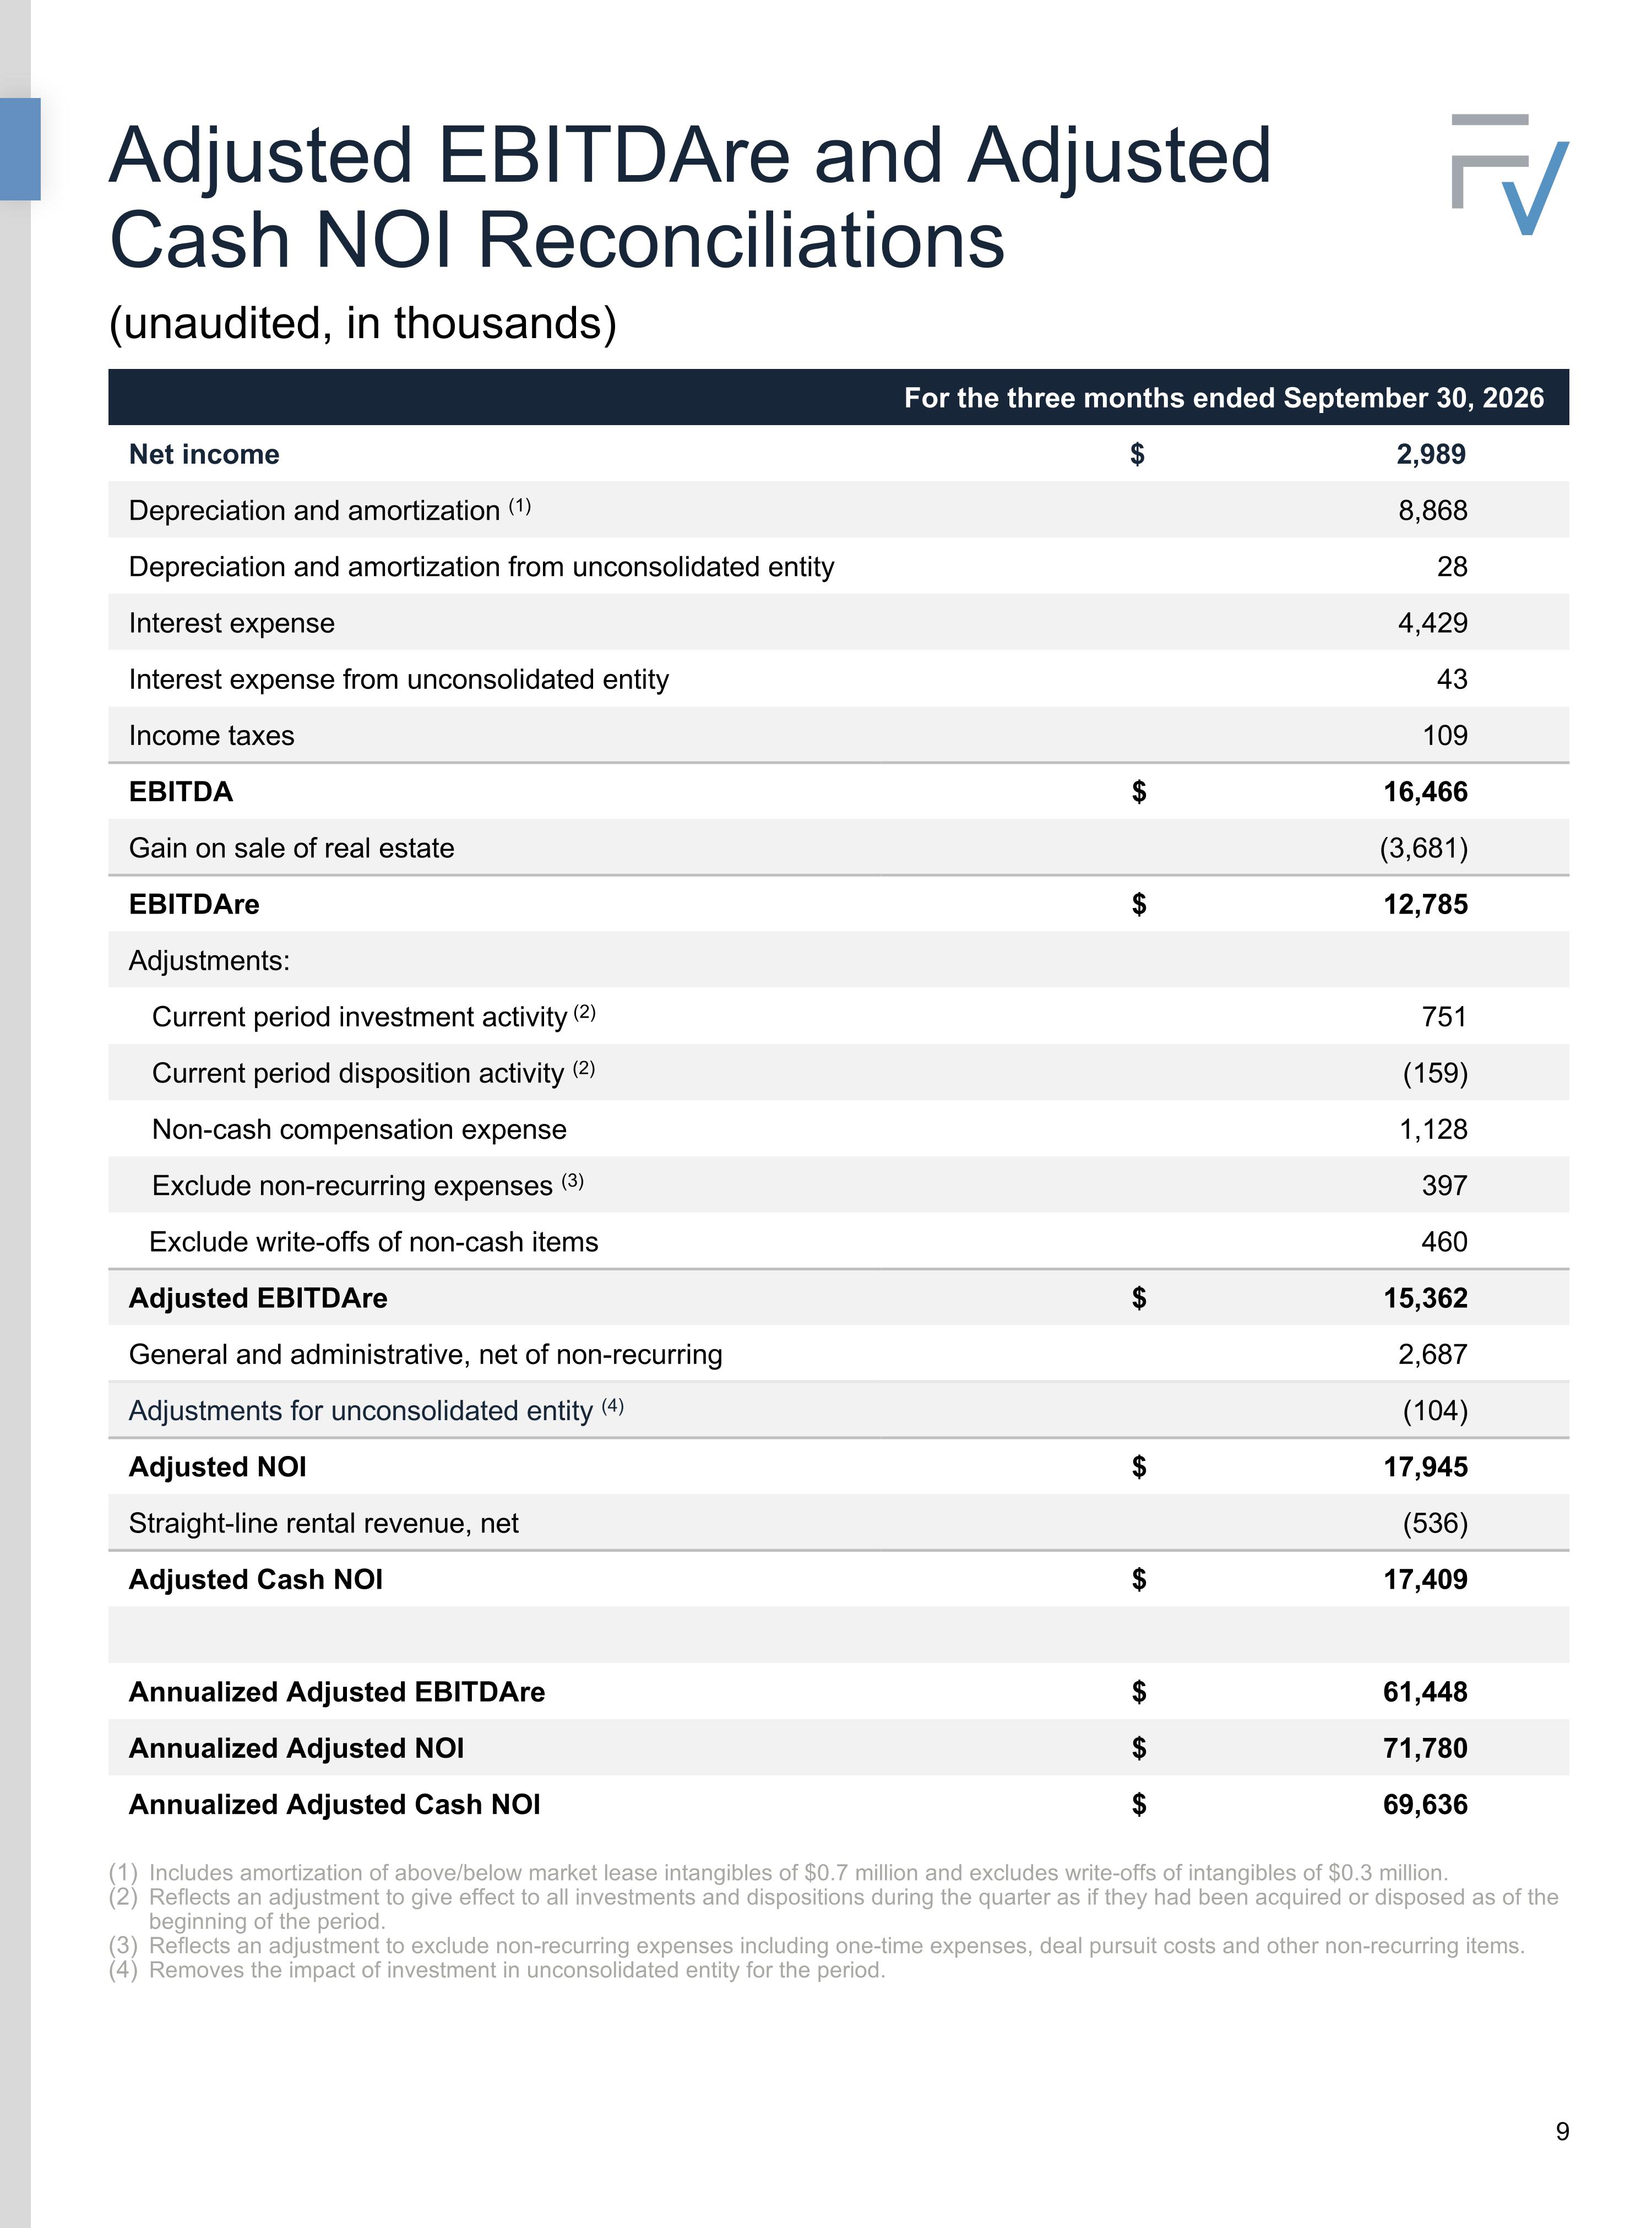
Adjusted EBITDAre and Adjusted Cash NOI Reconciliations (unaudited, in thousands) For the three months ended September 30, 2026 Net income $ 2,989 Depreciation and amortization (1) 8,868 Depreciation and amortization from unconsolidated entity 28 Interest expense 4,429 Interest expense from unconsolidated entity 43 Income taxes 109 EBITDA $ 16,466 Gain on sale of real estate (3,681) EBITDAre $ 12,785 Adjustments: Current period investment activity (2) 751 Current period disposition activity (2) (159) Non-cash compensation expense 1,128 Exclude non-recurring expenses (3) 397 Exclude write-offs of non-cash items 460 Adjusted EBITDAre $ 15,362 General and administrative, net of non-recurring 2,687 Adjustments for unconsolidated entity (4) (104) Adjusted NOI $ 17,945 Straight-line rental revenue, net (536) Adjusted Cash NOI $ 17,409 Annualized Adjusted EBITDAre $ 61,448 Annualized Adjusted NOI $ 71,780 Annualized Adjusted Cash NOI $ 69,636 Includes amortization of above/below market lease intangibles of $0.7 million and excludes write-offs of intangibles of $0.3 million. Reflects an adjustment to give effect to all investments and dispositions during the quarter as if they had been acquired or disposed as of the beginning of the period. Reflects an adjustment to exclude non-recurring expenses including one-time expenses, deal pursuit costs and other non-recurring items. Removes the impact of investment in unconsolidated entity for the period.
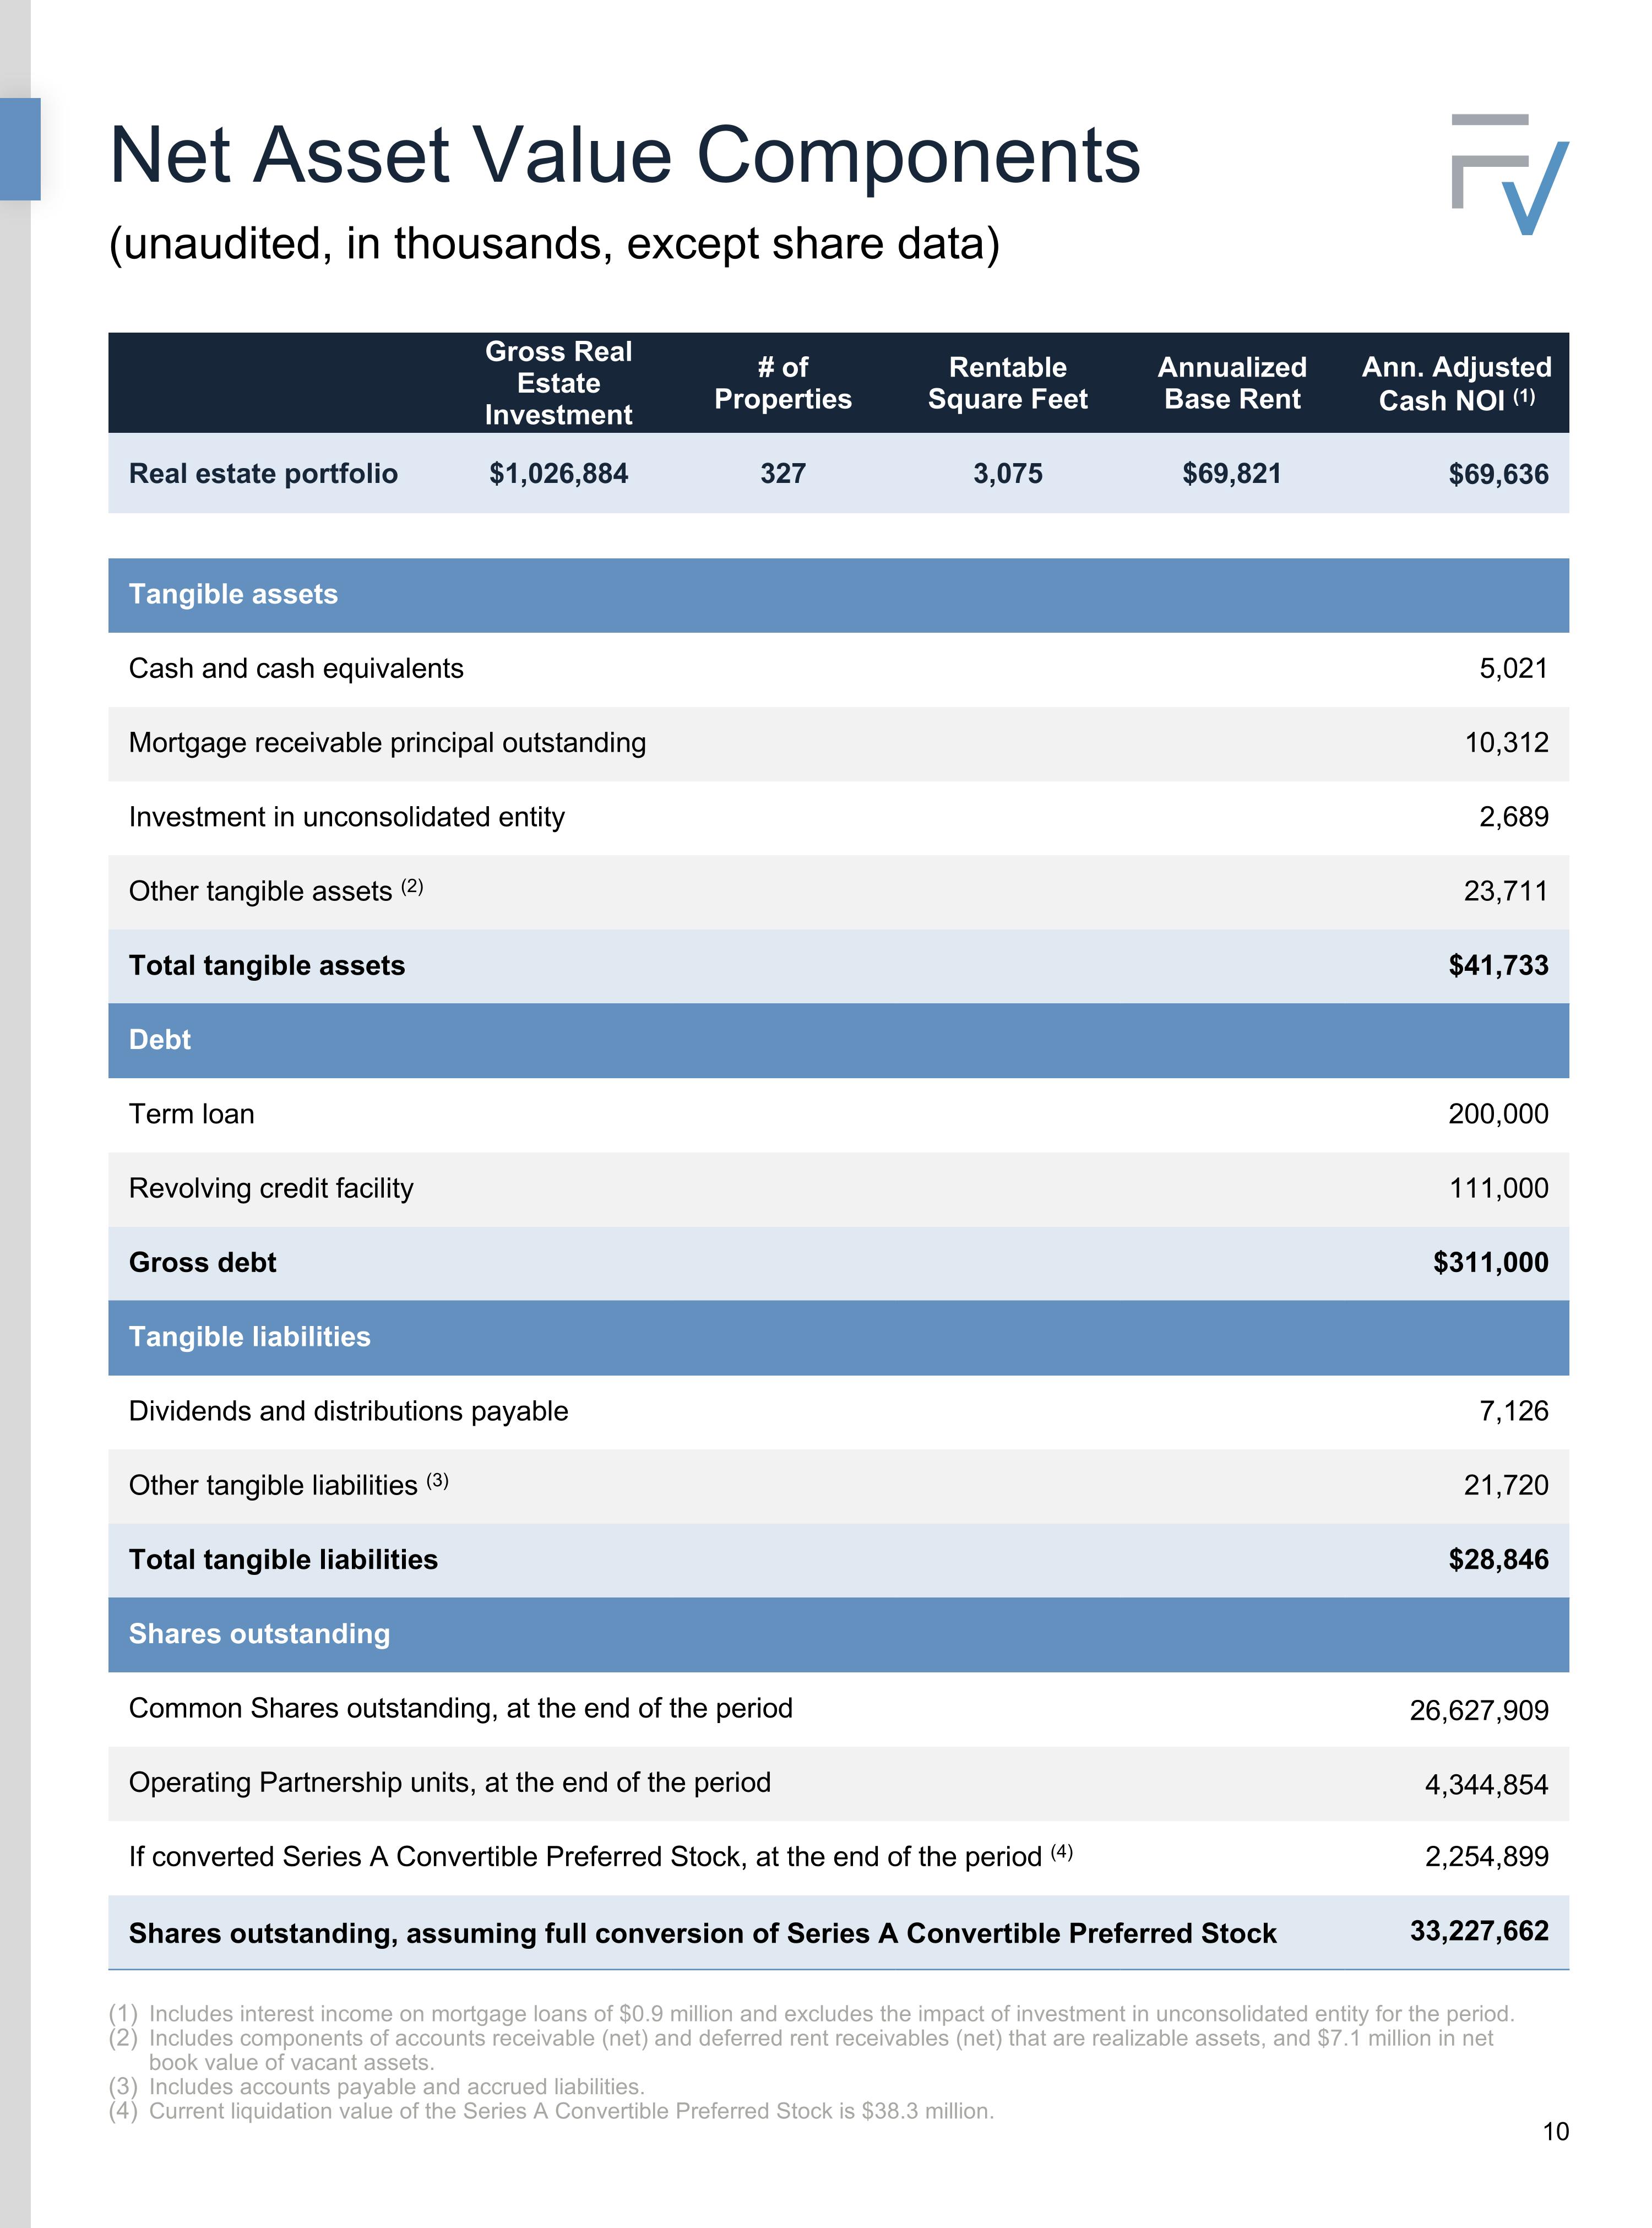
Net Asset Value Components (unaudited, in thousands, except share data) Includes interest income on mortgage loans of $0.9 million and excludes the impact of investment in unconsolidated entity for the period. Includes components of accounts receivable (net) and deferred rent receivables (net) that are realizable assets, and $7.1 million in net book value of vacant assets. Includes accounts payable and accrued liabilities. Current liquidation value of the Series A Convertible Preferred Stock is $38.3 million. Gross Real Estate Investment # of Properties Rentable Square Feet Annualized Base Rent Ann. Adjusted Cash NOI (1) Real estate portfolio $1,026,884 327 3,075 $69,821 $69,636 Tangible assets Cash and cash equivalents 5,021 Mortgage receivable principal outstanding 10,312 Investment in unconsolidated entity 2,689 Other tangible assets (2) 23,711 Total tangible assets $41,733 Debt Term loan 200,000 Revolving credit facility 111,000 Gross debt $311,000 Tangible liabilities Dividends and distributions payable 7,126 Other tangible liabilities (3) 21,720 Total tangible liabilities $28,846 Shares outstanding Common Shares outstanding, at the end of the period 26,627,909 Operating Partnership units, at the end of the period 4,344,854 If converted Series A Convertible Preferred Stock, at the end of the period (4) 2,254,899 Shares outstanding, assuming full conversion of Series A Convertible Preferred Stock 33,227,662
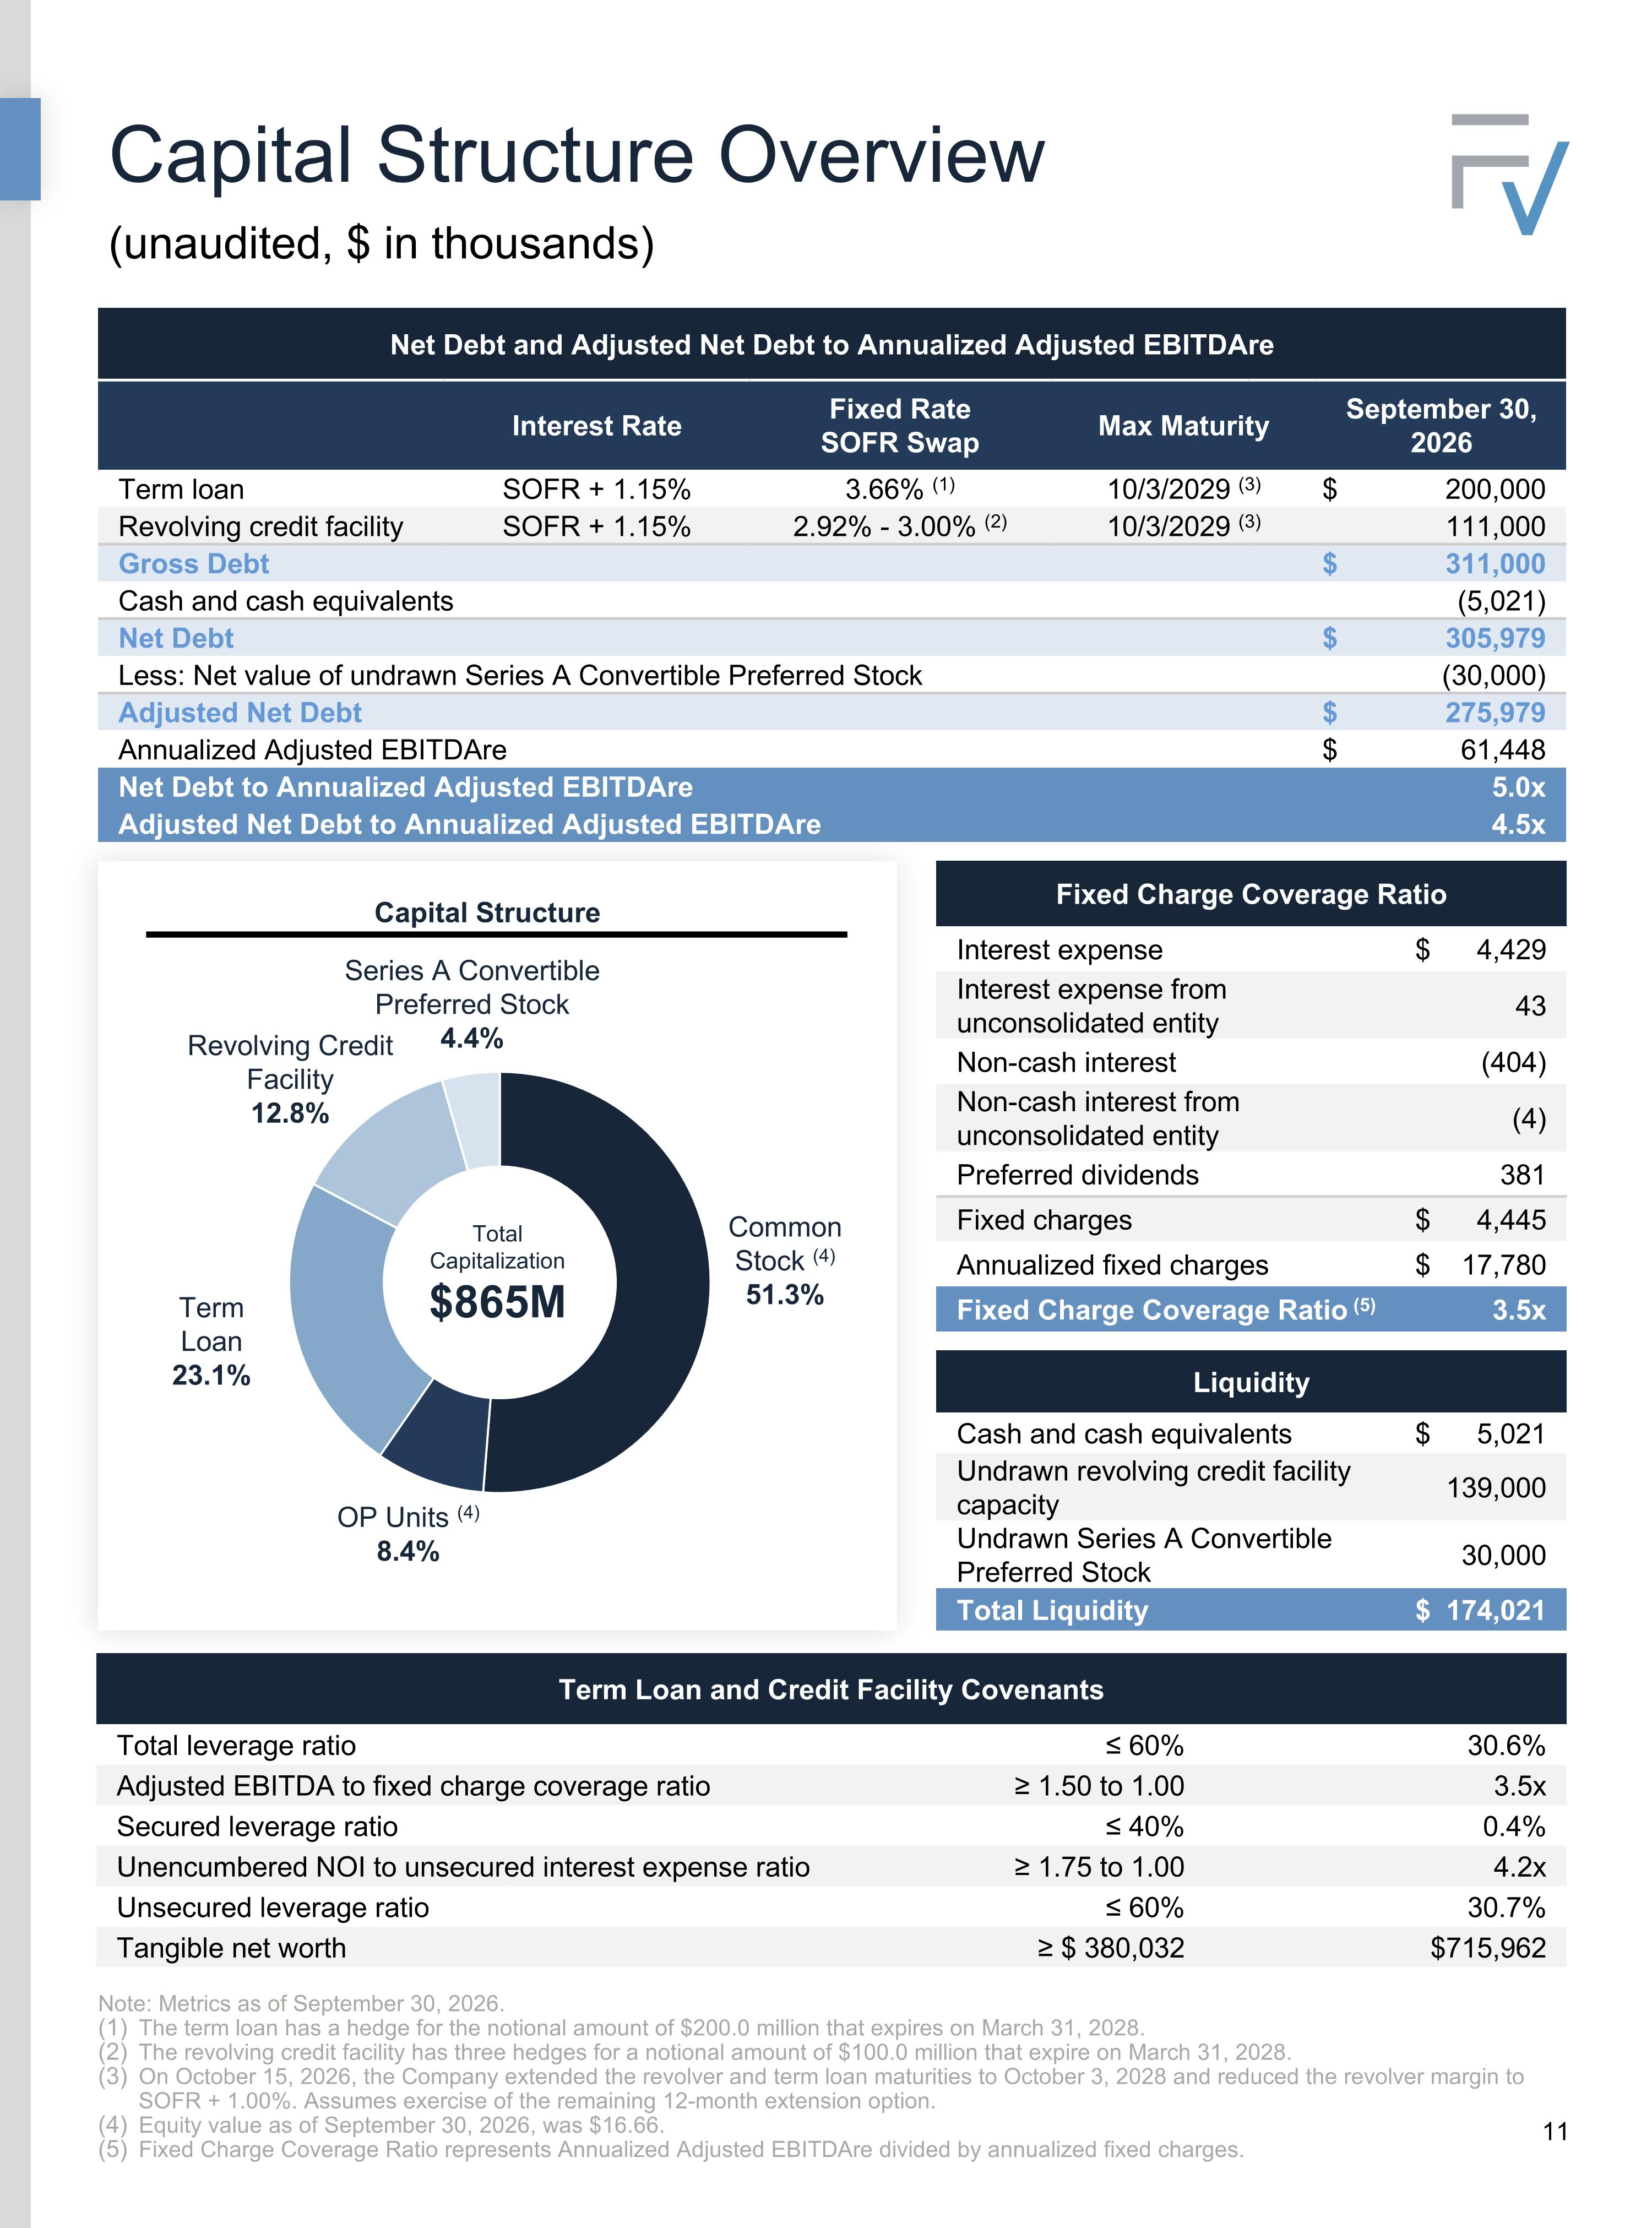
Capital Structure Overview Note: Metrics as of September 30, 2026. The term loan has a hedge for the notional amount of $200.0 million that expires on March 31, 2028. The revolving credit facility has three hedges for a notional amount of $100.0 million that expire on March 31, 2028. On October 15, 2026, the Company extended the revolver and term loan maturities to October 3, 2028 and reduced the revolver margin to SOFR + 1.00%. Assumes exercise of the remaining 12-month extension option. Equity value as of September 30, 2026, was $16.66. Fixed Charge Coverage Ratio represents Annualized Adjusted EBITDAre divided by annualized fixed charges. Net Debt and Adjusted Net Debt to Annualized Adjusted EBITDAre Interest Rate Fixed Rate SOFR Swap Fixed rate SOFR swap Max Maturity September 30, 2026 Term loan SOFR + 1.15% 3.66% (1) 3.66% 10/3/2029 (3) $ 200,000 Revolving credit facility SOFR + 1.15% 2.92% - 3.00% (2) 2.92% - 3.28% (1) 10/3/2029 (3) 111,000 Gross Debt $ 311,000 Cash and cash equivalents (5,021) Net Debt $ 305,979 Less: Net value of undrawn Series A Convertible Preferred Stock (30,000) Adjusted Net Debt $ 275,979 Annualized Adjusted EBITDAre $ 61,448 Net Debt to Annualized Adjusted EBITDAre 5.0x Adjusted Net Debt to Annualized Adjusted EBITDAre 4.5x Fixed Charge Coverage Ratio Interest expense $ 4,429 Interest expense from unconsolidated entity 43 Non-cash interest (404) Non-cash interest from unconsolidated entity (4) Preferred dividends 381 Fixed charges $ 4,445 Annualized fixed charges $ 17,780 Fixed Charge Coverage Ratio (5) 3.5x Liquidity Cash and cash equivalents $ 5,021 Undrawn revolving credit facility capacity 139,000 Undrawn Series A Convertible Preferred Stock 30,000 Total Liquidity $ 174,021 Term Loan and Credit Facility Covenants Total leverage ratio ≤ 60% 30.6% Adjusted EBITDA to fixed charge coverage ratio ≥ 1.50 to 1.00 3.5x Secured leverage ratio ≤ 40% 0.4% Unencumbered NOI to unsecured interest expense ratio ≥ 1.75 to 1.00 4.2x Unsecured leverage ratio ≤ 60% 30.7% Tangible net worth ≥ $ 380,032 $715,962 Capital Structure Total Capitalization $865M Common Stock (4) 51.3% OP Units (4) 8.4% Series A Convertible Preferred Stock 4.4% (unaudited, $ in thousands)
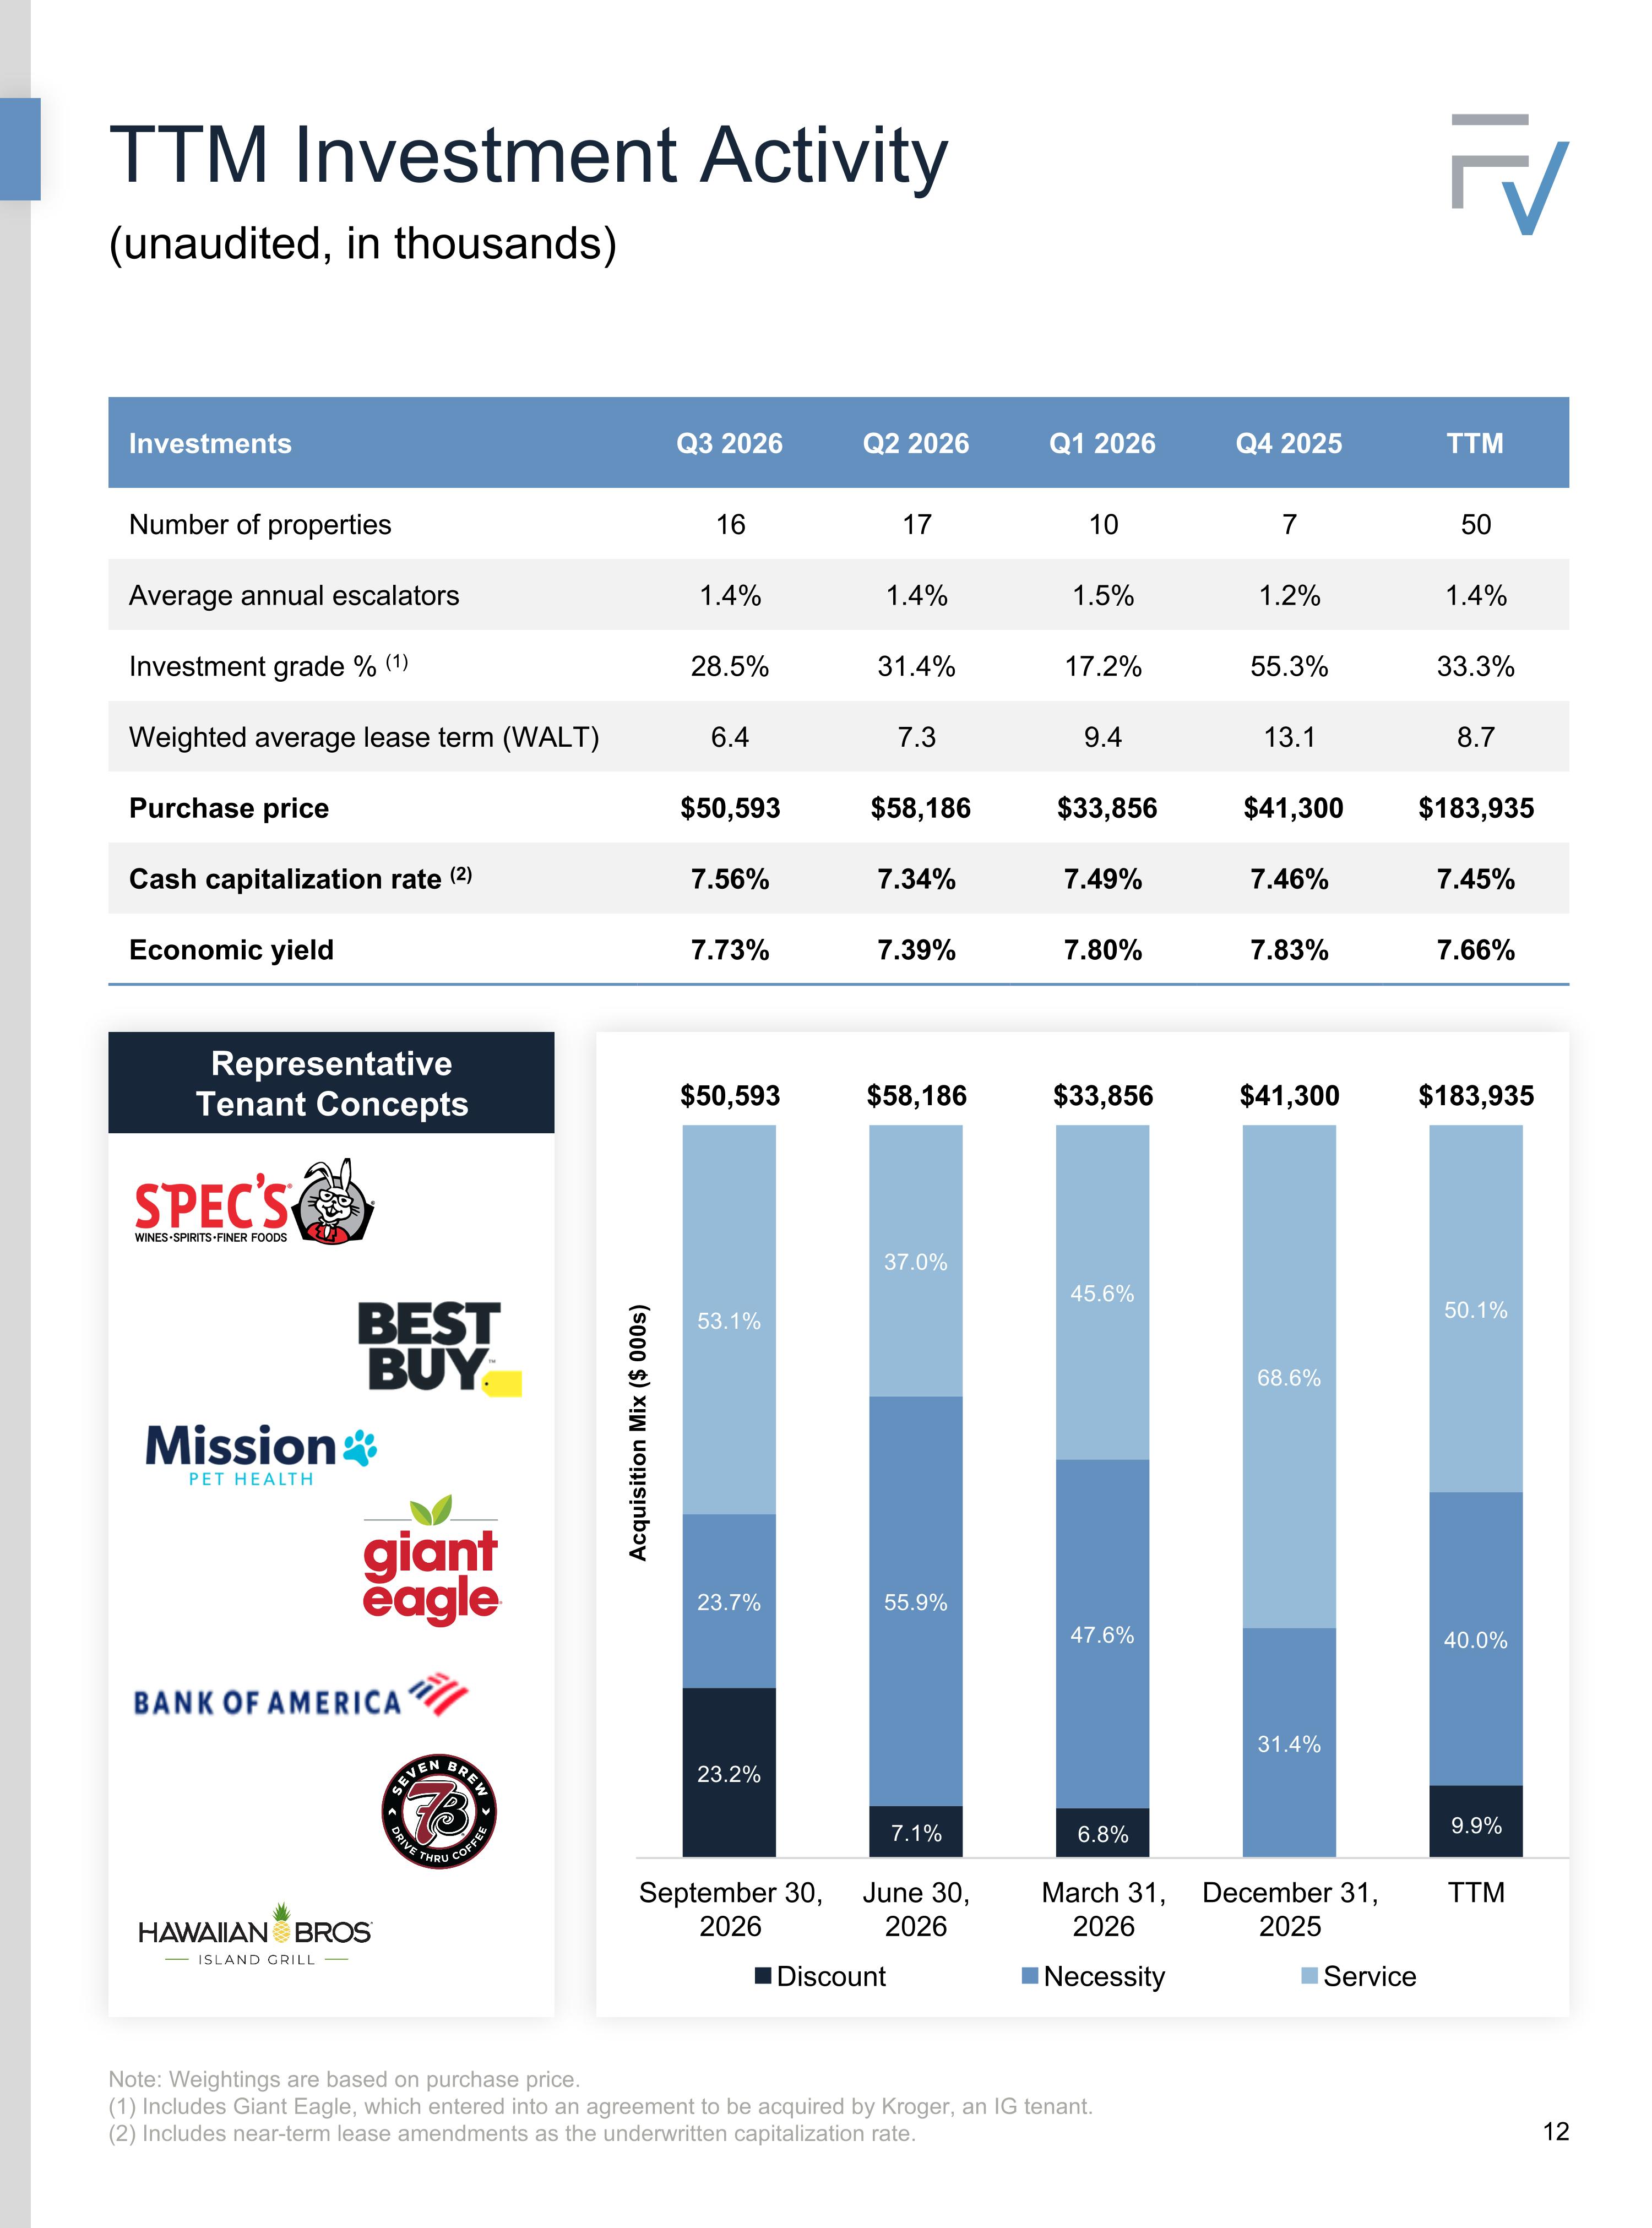
TTM Investment Activity Note: Weightings are based on purchase price. (1) Includes Giant Eagle, which entered into an agreement to be acquired by Kroger, an IG tenant. (2) Includes near-term lease amendments as the underwritten capitalization rate. Investments Q3 2026 Q2 2026 Q1 2026 Q4 2025 TTM Number of properties 16 17 10 7 50 Average annual escalators 1.4% 1.4% 1.5% 1.2% 1.4% Investment grade % (1) 28.5% 31.4% 17.2% 55.3% 33.3% Weighted average lease term (WALT) 6.4 7.3 9.4 13.1 8.7 Purchase price $50,593 $58,186 $33,856 $41,300 $183,935 Cash capitalization rate (2) 7.56% 7.34% 7.49% 7.46% 7.45% Economic yield 7.73% 7.39% 7.80% 7.83% 7.66% Representative Tenant Concepts $50,593 $58,186 $33,856 $41,300 $183,935 (unaudited, in thousands)
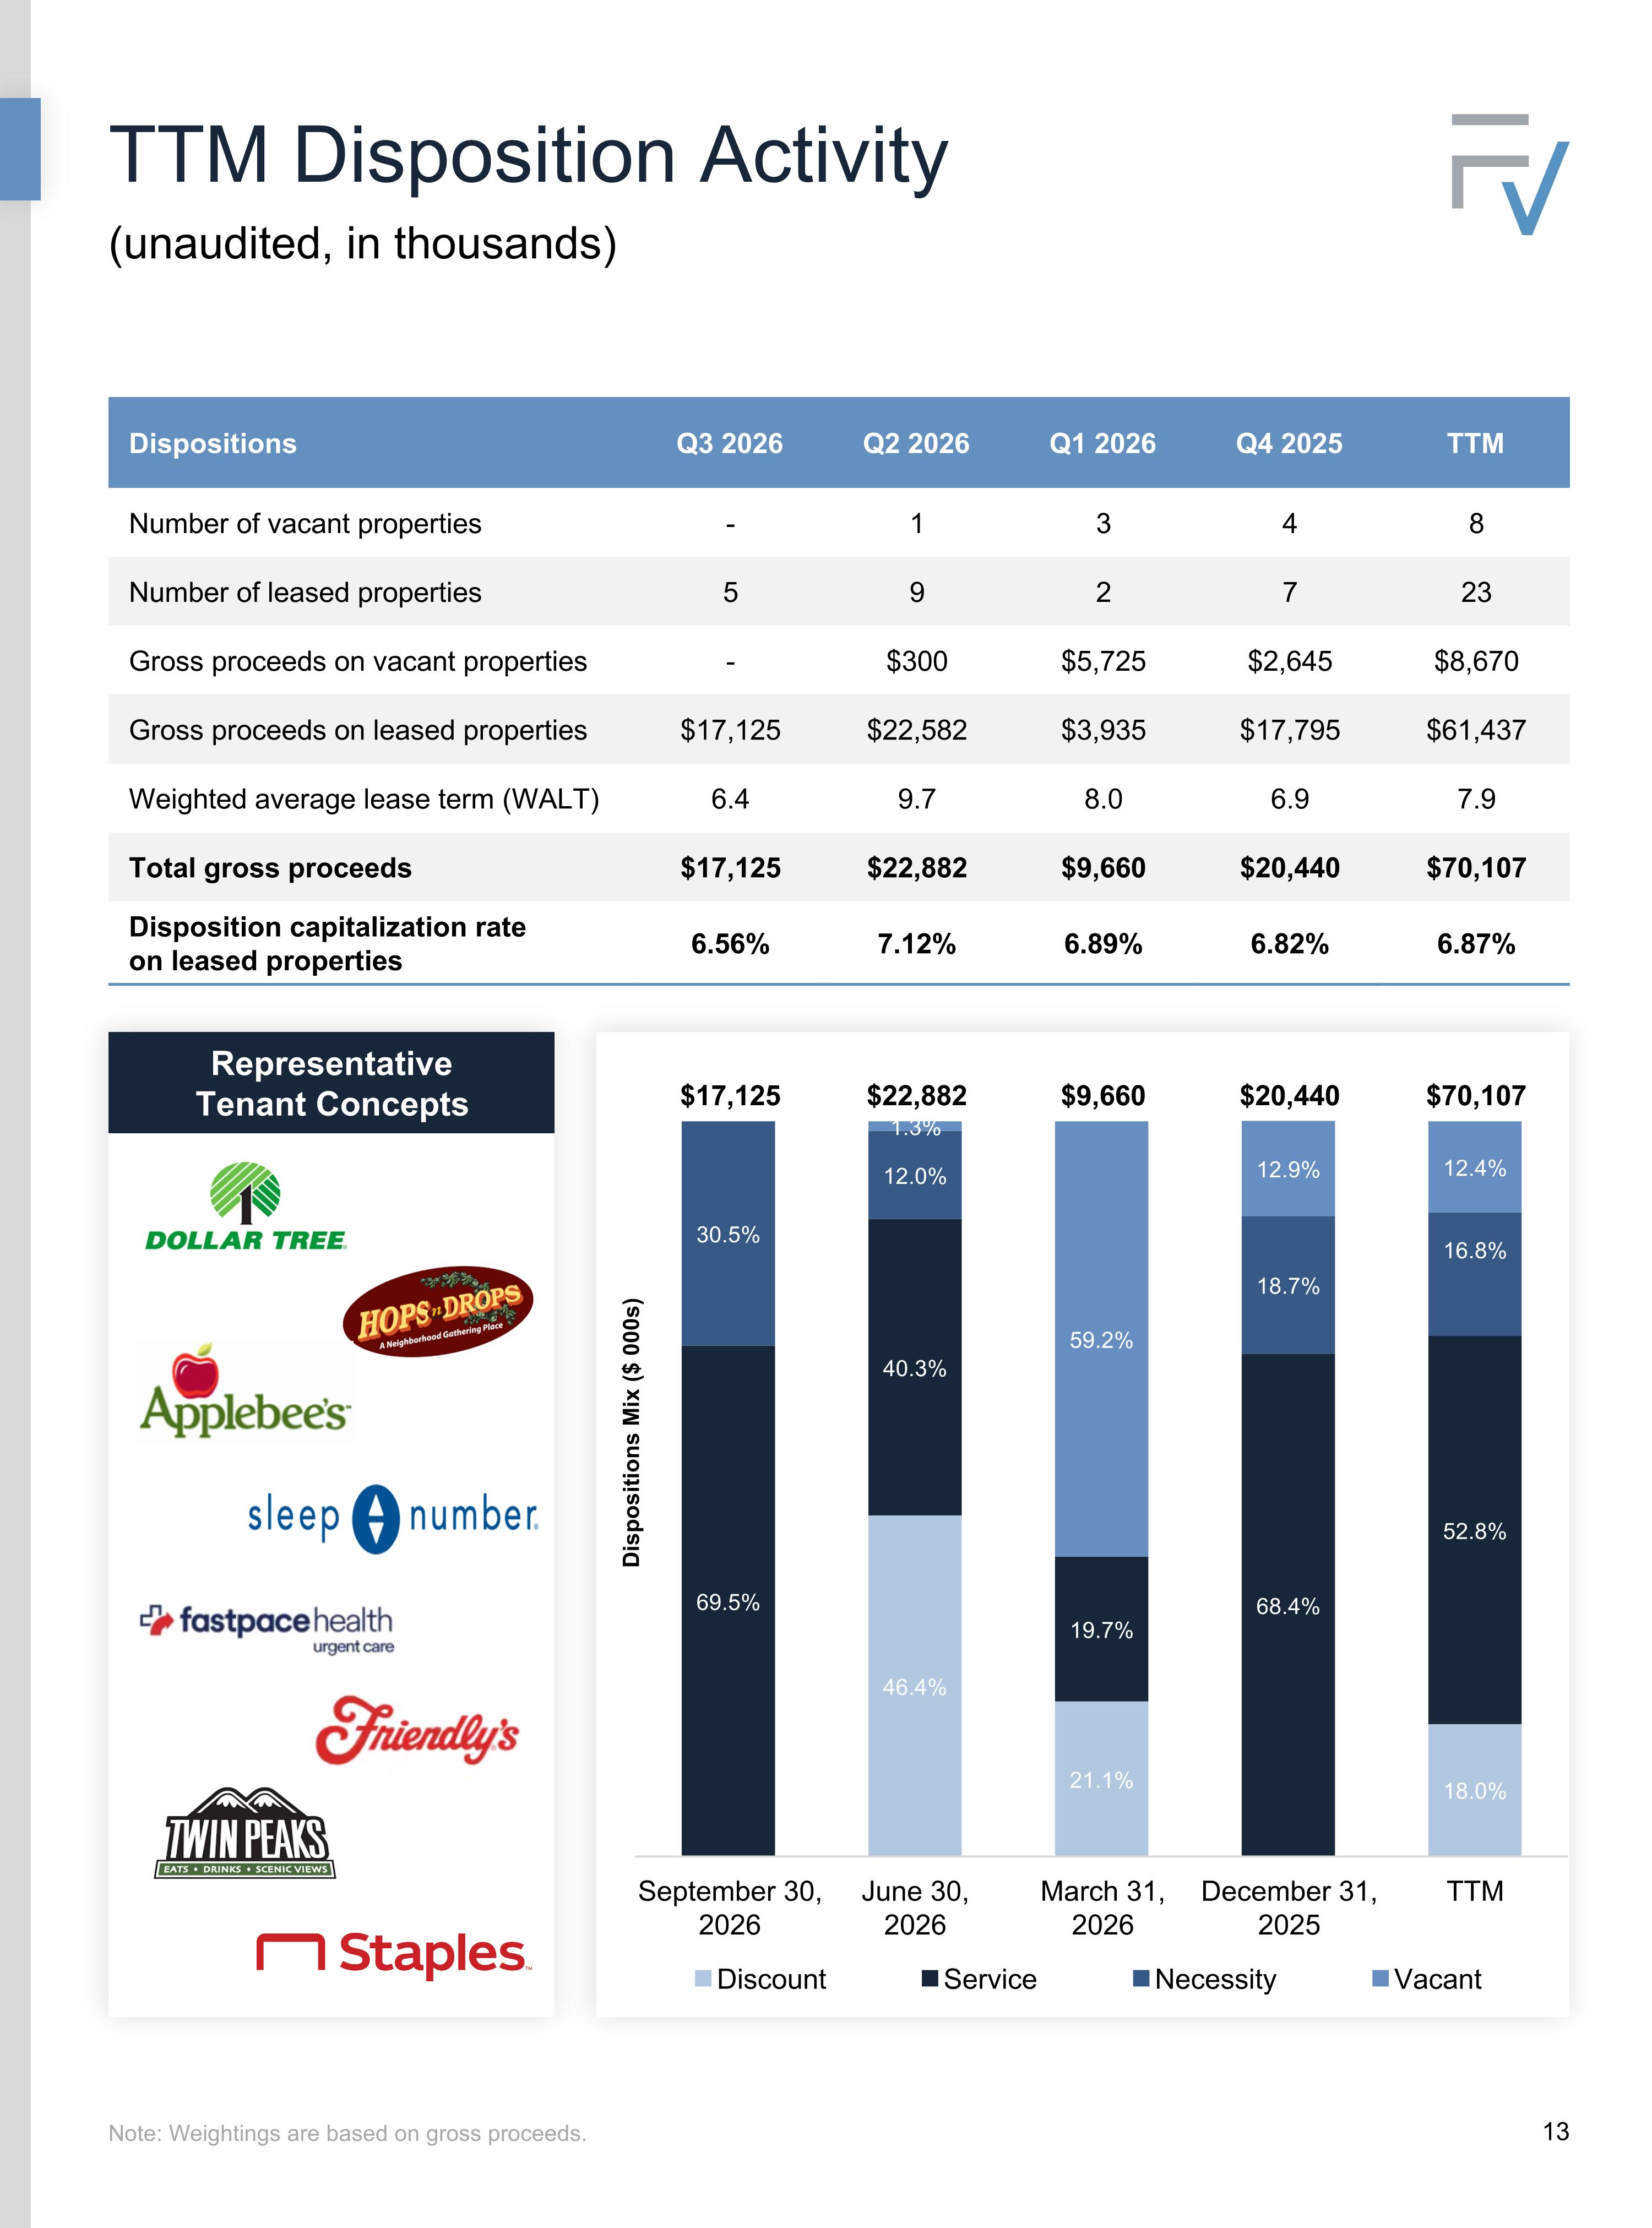
TTM Disposition Activity Note: Weightings are based on gross proceeds. Dispositions Q3 2026 Q2 2026 Q1 2026 Q4 2025 TTM Number of vacant properties - 1 3 4 8 Number of leased properties 5 9 2 7 23 Gross proceeds on vacant properties - $300 $5,725 $2,645 $8,670 Gross proceeds on leased properties $17,125 $22,582 $3,935 $17,795 $61,437 Weighted average lease term (WALT) 6.4 9.7 8.0 6.9 7.9 Total gross proceeds $17,125 $22,882 $9,660 $20,440 $70,107 Disposition capitalization rate on leased properties 6.56% 7.12% 6.89% 6.82% 6.87% Representative Tenant Concepts $17,125 $22,882 $9,660 $20,440 $70,107 (unaudited, in thousands)
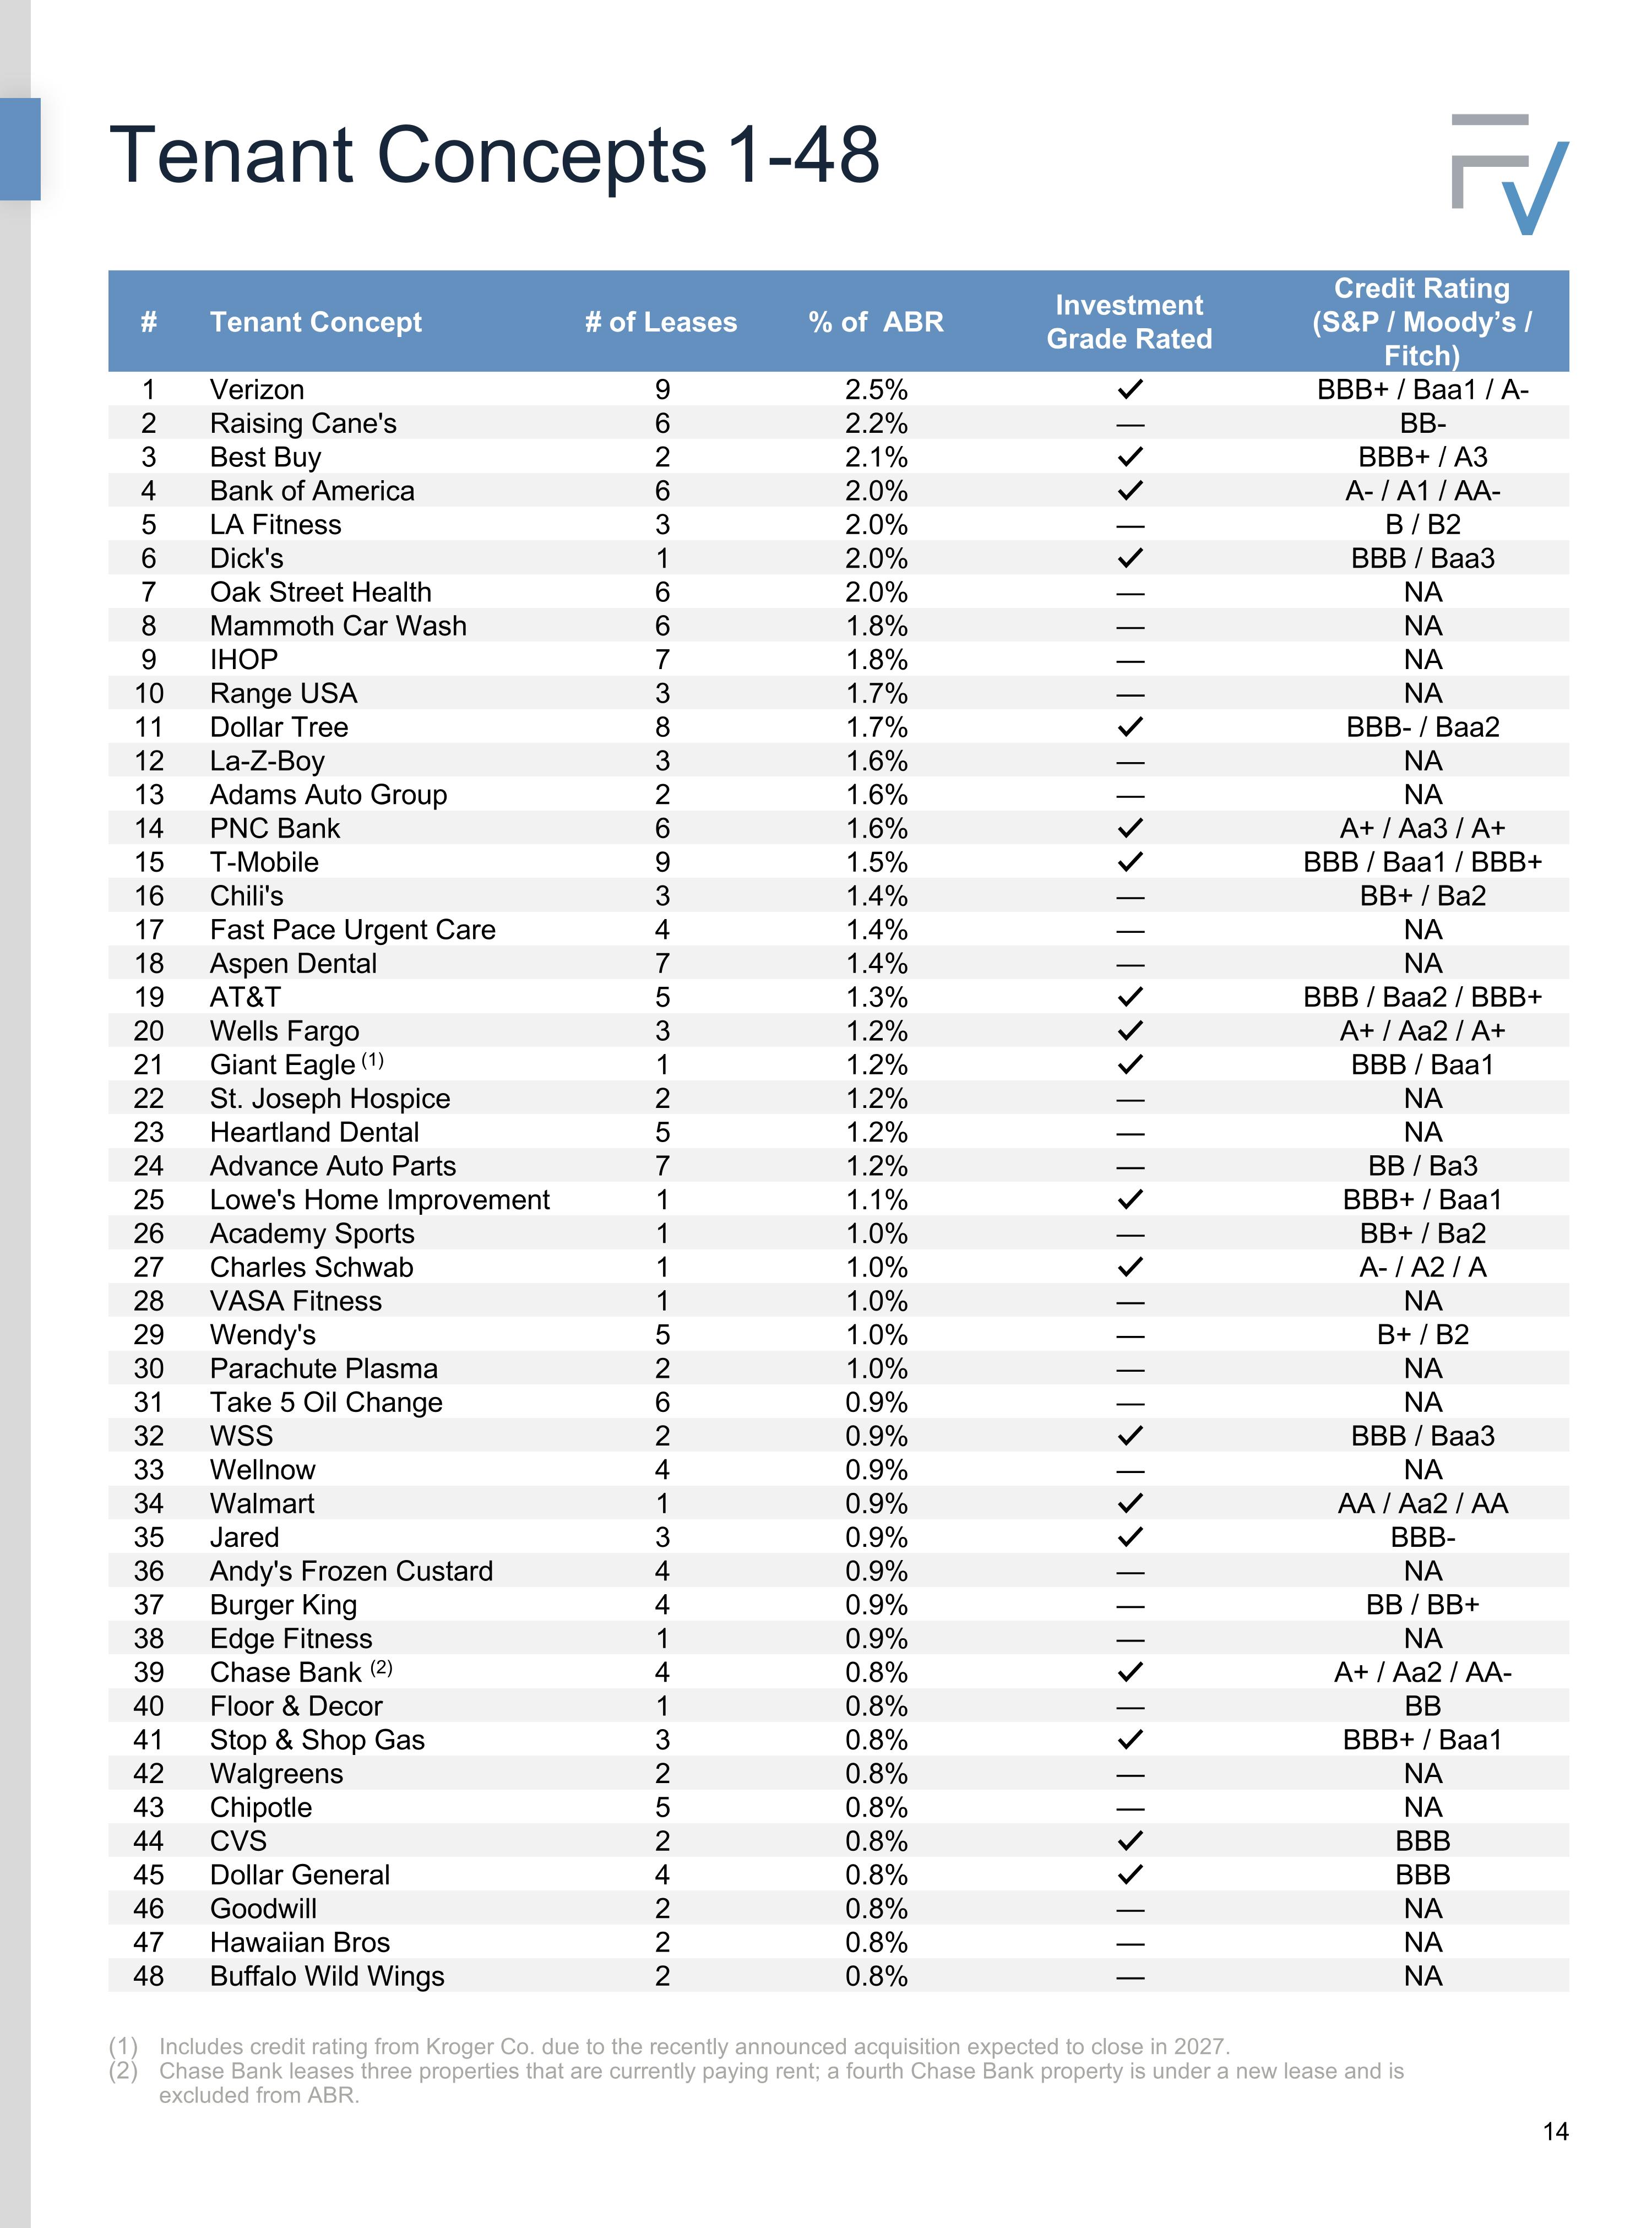
Tenant Concepts 1-48 # Tenant Concept # of Leases % of ABR Investment Grade Rated Credit Rating (S&P / Moody’s / Fitch) 1 Verizon 9 2.5% ✓ BBB+ / Baa1 / A- 2 Raising Cane's 6 2.2% — BB- 3 Best Buy 2 2.1% ✓ BBB+ / A3 4 Bank of America 6 2.0% ✓ A- / A1 / AA- 5 LA Fitness 3 2.0% — B / B2 6 Dick's 1 2.0% ✓ BBB / Baa3 7 Oak Street Health 6 2.0% — NA 8 Mammoth Car Wash 6 1.8% — NA 9 IHOP 7 1.8% — NA 10 Range USA 3 1.7% — NA 11 Dollar Tree 8 1.7% ✓ BBB- / Baa2 12 La-Z-Boy 3 1.6% — NA 13 Adams Auto Group 2 1.6% — NA 14 PNC Bank 6 1.6% ✓ A+ / Aa3 / A+ 15 T-Mobile 9 1.5% ✓ BBB / Baa1 / BBB+ 16 Chili's 3 1.4% — BB+ / Ba2 17 Fast Pace Urgent Care 4 1.4% — NA 18 Aspen Dental 7 1.4% — NA 19 AT&T 5 1.3% ✓ BBB / Baa2 / BBB+ 20 Wells Fargo 3 1.2% ✓ A+ / Aa2 / A+ 21 Giant Eagle (1) 1 1.2% ✓ BBB / Baa1 22 St. Joseph Hospice 2 1.2% — NA 23 Heartland Dental 5 1.2% — NA 24 Advance Auto Parts 7 1.2% — BB / Ba3 25 Lowe's Home Improvement 1 1.1% ✓ BBB+ / Baa1 26 Academy Sports 1 1.0% — BB+ / Ba2 27 Charles Schwab 1 1.0% ✓ A- / A2 / A 28 VASA Fitness 1 1.0% — NA 29 Wendy's 5 1.0% — B+ / B2 30 Parachute Plasma 2 1.0% — NA 31 Take 5 Oil Change 6 0.9% — NA 32 WSS 2 0.9% ✓ BBB / Baa3 33 Wellnow 4 0.9% — NA 34 Walmart 1 0.9% ✓ AA / Aa2 / AA 35 Jared 3 0.9% ✓ BBB- 36 Andy's Frozen Custard 4 0.9% — NA 37 Burger King 4 0.9% — BB / BB+ 38 Edge Fitness 1 0.9% — NA 39 Chase Bank (2) 4 0.8% ✓ A+ / Aa2 / AA- 40 Floor & Decor 1 0.8% — BB 41 Stop & Shop Gas 3 0.8% ✓ BBB+ / Baa1 42 Walgreens 2 0.8% — NA 43 Chipotle 5 0.8% — NA 44 CVS 2 0.8% ✓ BBB 45 Dollar General 4 0.8% ✓ BBB 46 Goodwill 2 0.8% — NA 47 Hawaiian Bros 2 0.8% — NA 48 Buffalo Wild Wings 2 0.8% — NA Includes credit rating from Kroger Co. due to the recently announced acquisition expected to close in 2027. Chase Bank leases three properties that are currently paying rent; a fourth Chase Bank property is under a new lease and is excluded from ABR.
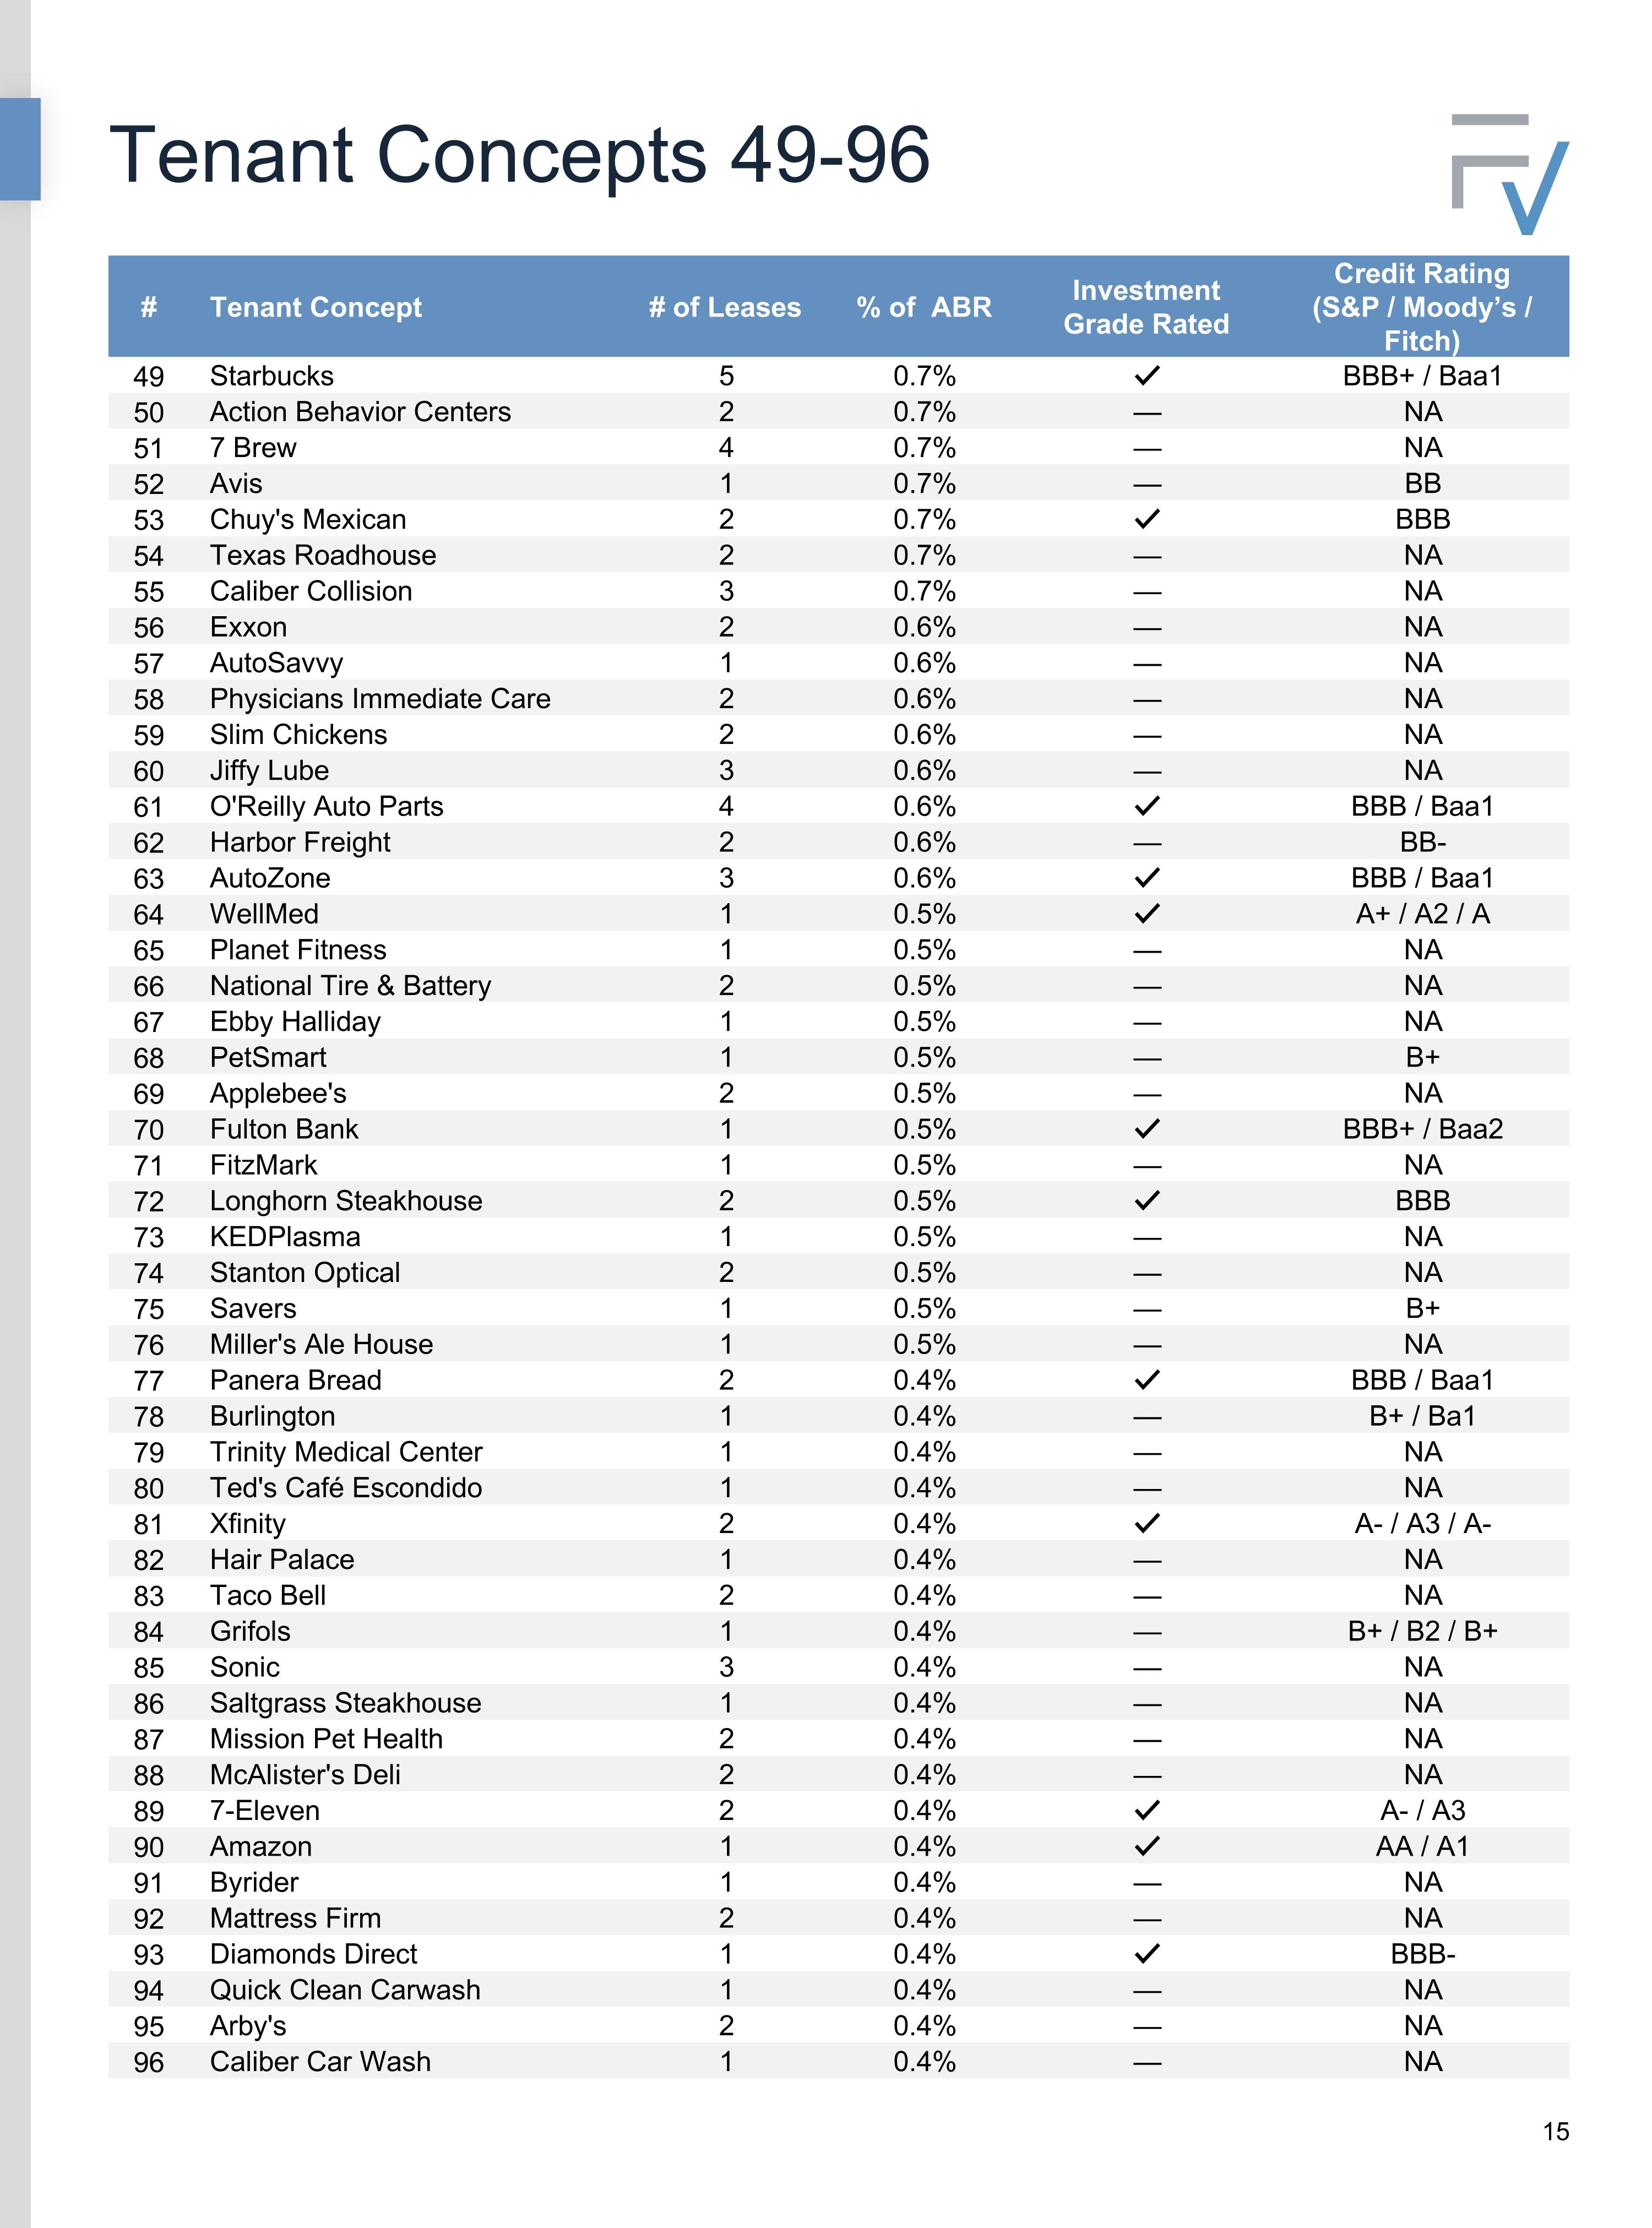
Tenant Concepts 49-96 # Tenant Concept # of Leases % of ABR Investment Grade Rated Credit Rating (S&P / Moody’s / Fitch) 49 Starbucks 5 0.7% ✓ BBB+ / Baa1 50 Action Behavior Centers 2 0.7% — NA 51 7 Brew 4 0.7% — NA 52 Avis 1 0.7% — BB 53 Chuy's Mexican 2 0.7% ✓ BBB 54 Texas Roadhouse 2 0.7% — NA 55 Caliber Collision 3 0.7% — NA 56 Exxon 2 0.6% — NA 57 AutoSavvy 1 0.6% — NA 58 Physicians Immediate Care 2 0.6% — NA 59 Slim Chickens 2 0.6% — NA 60 Jiffy Lube 3 0.6% — NA 61 O'Reilly Auto Parts 4 0.6% ✓ BBB / Baa1 62 Harbor Freight 2 0.6% — BB- 63 AutoZone 3 0.6% ✓ BBB / Baa1 64 WellMed 1 0.5% ✓ A+ / A2 / A 65 Planet Fitness 1 0.5% — NA 66 National Tire & Battery 2 0.5% — NA 67 Ebby Halliday 1 0.5% — NA 68 PetSmart 1 0.5% — B+ 69 Applebee's 2 0.5% — NA 70 Fulton Bank 1 0.5% ✓ BBB+ / Baa2 71 FitzMark 1 0.5% — NA 72 Longhorn Steakhouse 2 0.5% ✓ BBB 73 KEDPlasma 1 0.5% — NA 74 Stanton Optical 2 0.5% — NA 75 Savers 1 0.5% — B+ 76 Miller's Ale House 1 0.5% — NA 77 Panera Bread 2 0.4% ✓ BBB / Baa1 78 Burlington 1 0.4% — B+ / Ba1 79 Trinity Medical Center 1 0.4% — NA 80 Ted's Café Escondido 1 0.4% — NA 81 Xfinity 2 0.4% ✓ A- / A3 / A- 82 Hair Palace 1 0.4% — NA 83 Taco Bell 2 0.4% — NA 84 Grifols 1 0.4% — B+ / B2 / B+ 85 Sonic 3 0.4% — NA 86 Saltgrass Steakhouse 1 0.4% — NA 87 Mission Pet Health 2 0.4% — NA 88 McAlister's Deli 2 0.4% — NA 89 7-Eleven 2 0.4% ✓ A- / A3 90 Amazon 1 0.4% ✓ AA / A1 91 Byrider 1 0.4% — NA 92 Mattress Firm 2 0.4% — NA 93 Diamonds Direct 1 0.4% ✓ BBB- 94 Quick Clean Carwash 1 0.4% — NA 95 Arby's 2 0.4% — NA 96 Caliber Car Wash 1 0.4% — NA
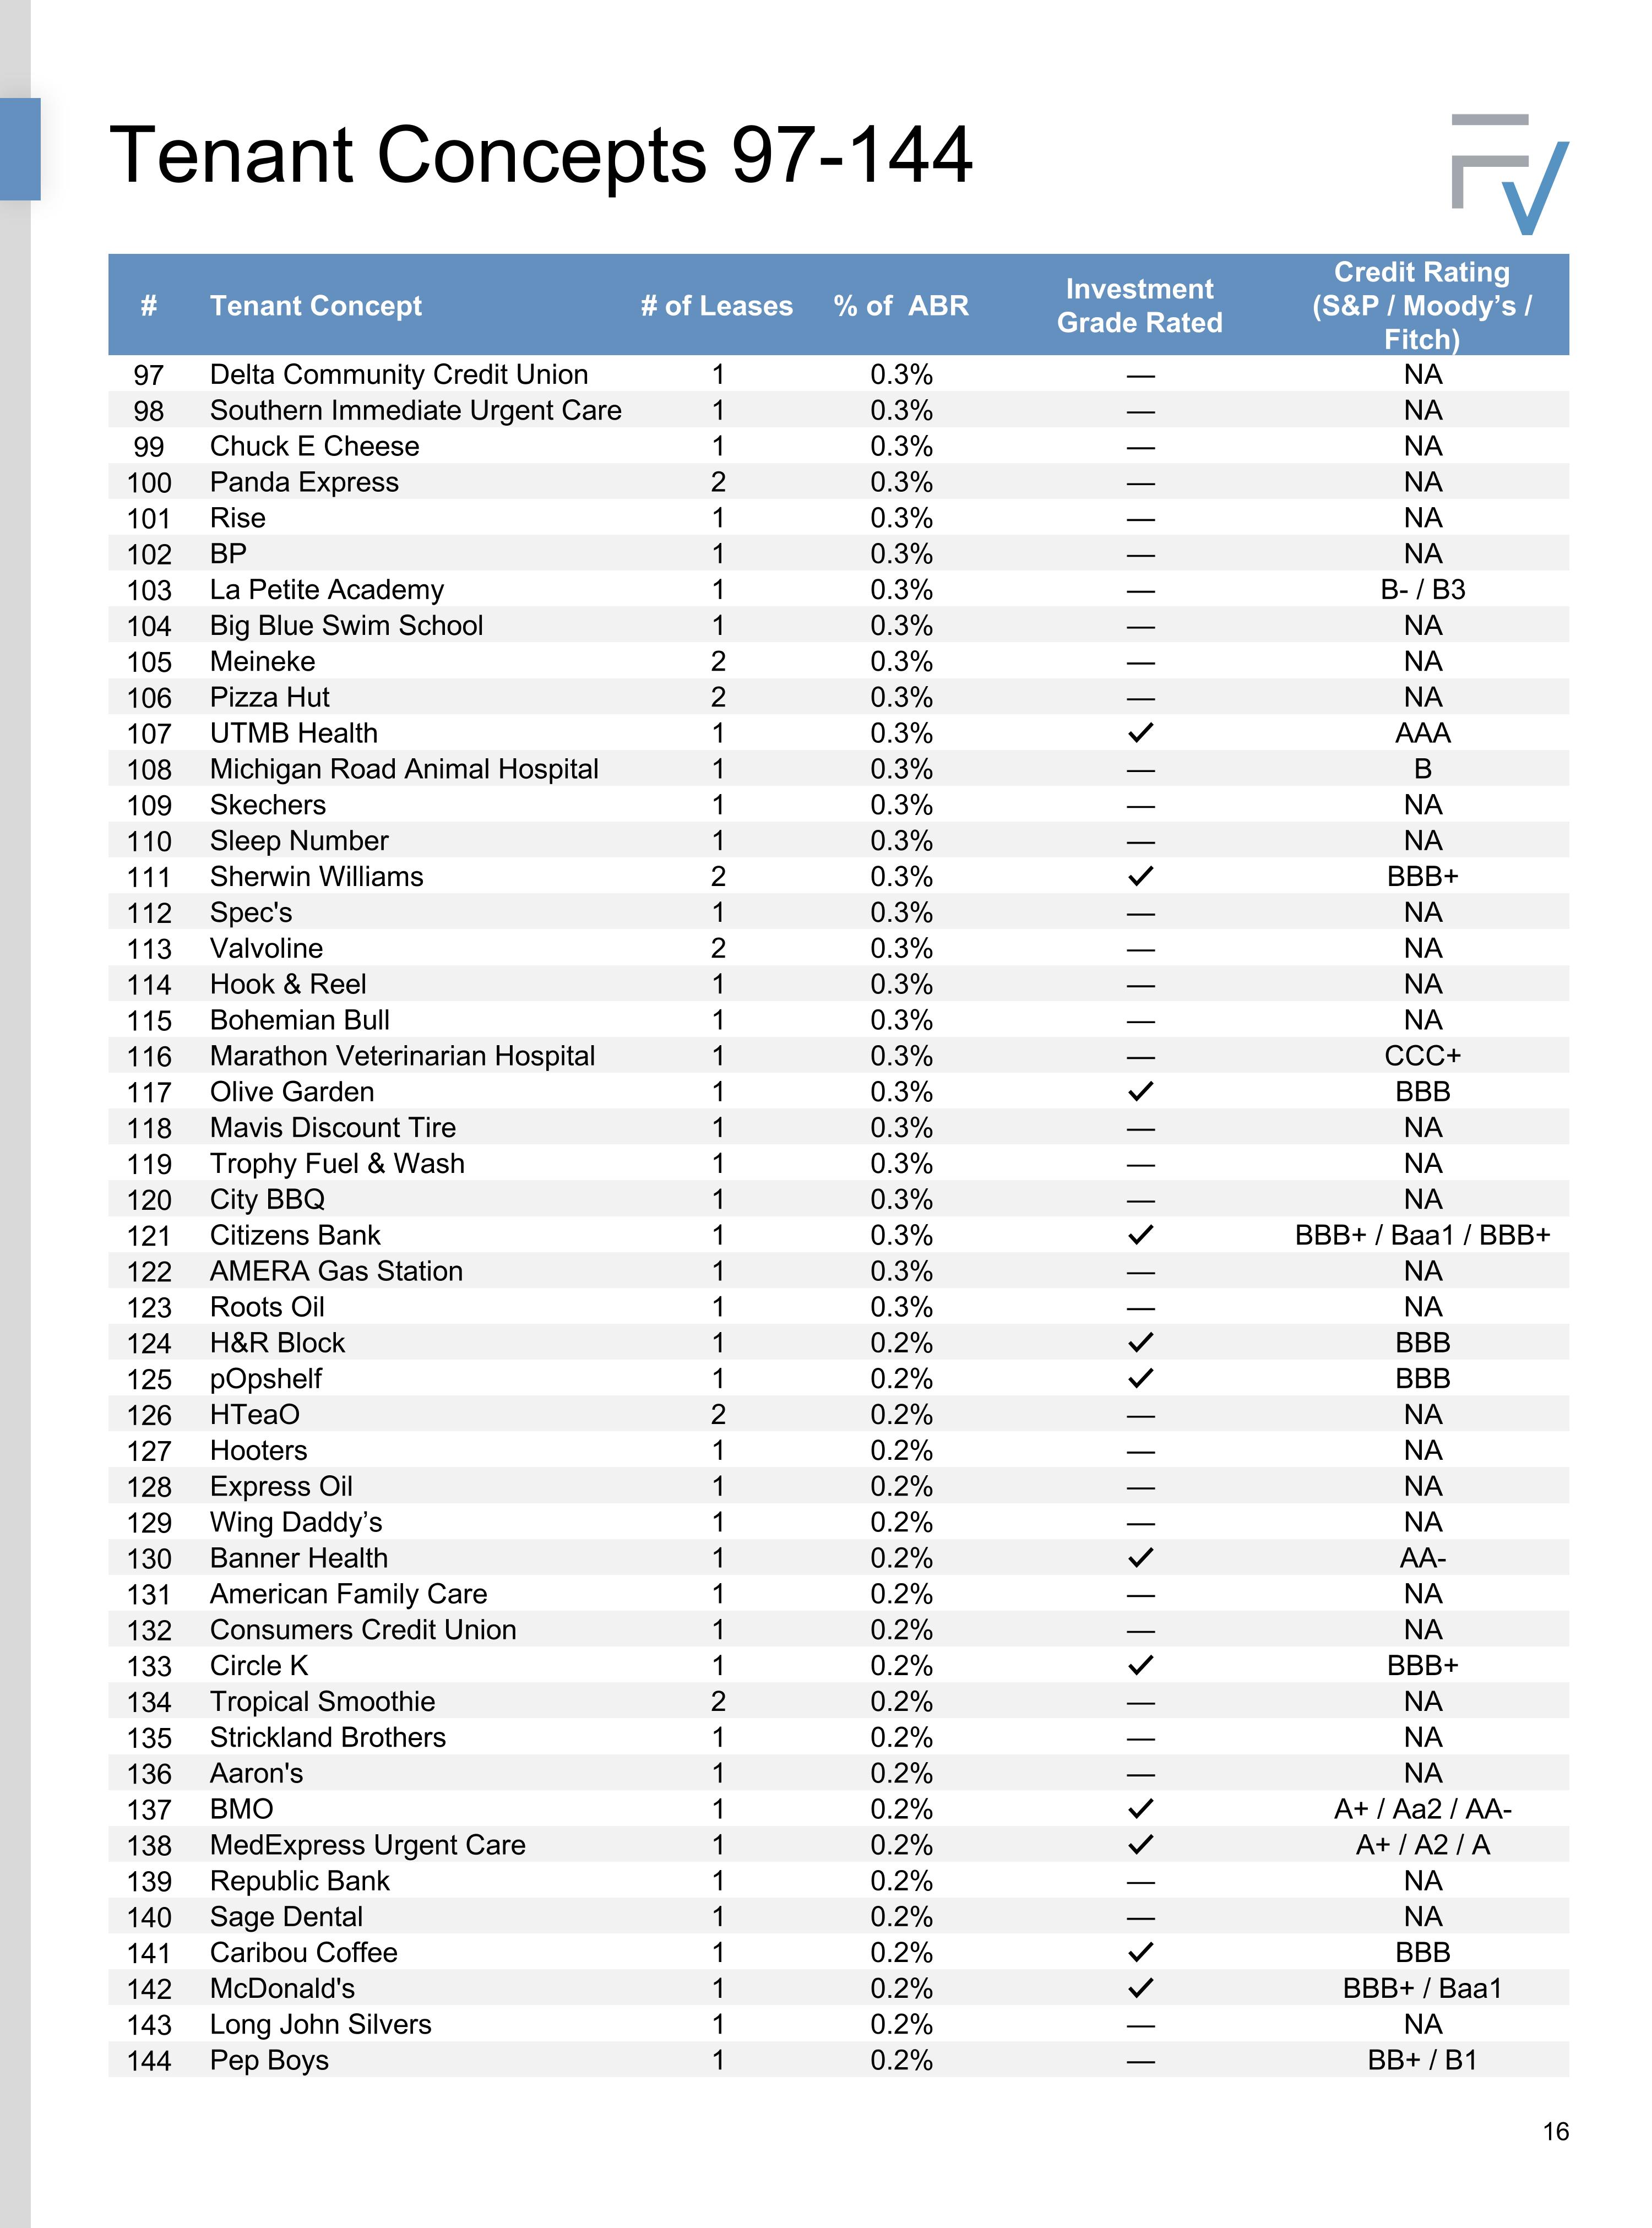
Tenant Concepts 97-144 # Tenant Concept # of Leases % of ABR Investment Grade Rated Credit Rating (S&P / Moody’s / Fitch) 97 Delta Community Credit Union 1 0.3% — NA 98 Southern Immediate Urgent Care 1 0.3% — NA 99 Chuck E Cheese 1 0.3% — NA 100 Panda Express 2 0.3% — NA 101 Rise 1 0.3% — NA 102 BP 1 0.3% — NA 103 La Petite Academy 1 0.3% — B- / B3 104 Big Blue Swim School 1 0.3% — NA 105 Meineke 2 0.3% — NA 106 Pizza Hut 2 0.3% — NA 107 UTMB Health 1 0.3% ✓ AAA 108 Michigan Road Animal Hospital 1 0.3% — B 109 Skechers 1 0.3% — NA 110 Sleep Number 1 0.3% — NA 111 Sherwin Williams 2 0.3% ✓ BBB+ 112 Spec's 1 0.3% — NA 113 Valvoline 2 0.3% — NA 114 Hook & Reel 1 0.3% — NA 115 Bohemian Bull 1 0.3% — NA 116 Marathon Veterinarian Hospital 1 0.3% — CCC+ 117 Olive Garden 1 0.3% ✓ BBB 118 Mavis Discount Tire 1 0.3% — NA 119 Trophy Fuel & Wash 1 0.3% — NA 120 City BBQ 1 0.3% — NA 121 Citizens Bank 1 0.3% ✓ BBB+ / Baa1 / BBB+ 122 AMERA Gas Station 1 0.3% — NA 123 Roots Oil 1 0.3% — NA 124 H&R Block 1 0.2% ✓ BBB 125 pOpshelf 1 0.2% ✓ BBB 126 HTeaO 2 0.2% — NA 127 Hooters 1 0.2% — NA 128 Express Oil 1 0.2% — NA 129 Wing Daddy’s 1 0.2% — NA 130 Banner Health 1 0.2% ✓ AA- 131 American Family Care 1 0.2% — NA 132 Consumers Credit Union 1 0.2% — NA 133 Circle K 1 0.2% ✓ BBB+ 134 Tropical Smoothie 2 0.2% — NA 135 Strickland Brothers 1 0.2% — NA 136 Aaron's 1 0.2% — NA 137 BMO 1 0.2% ✓ A+ / Aa2 / AA- 138 MedExpress Urgent Care 1 0.2% ✓ A+ / A2 / A 139 Republic Bank 1 0.2% — NA 140 Sage Dental 1 0.2% — NA 141 Caribou Coffee 1 0.2% ✓ BBB 142 McDonald's 1 0.2% ✓ BBB+ / Baa1 143 Long John Silvers 1 0.2% — NA 144 Pep Boys 1 0.2% — BB+ / B1
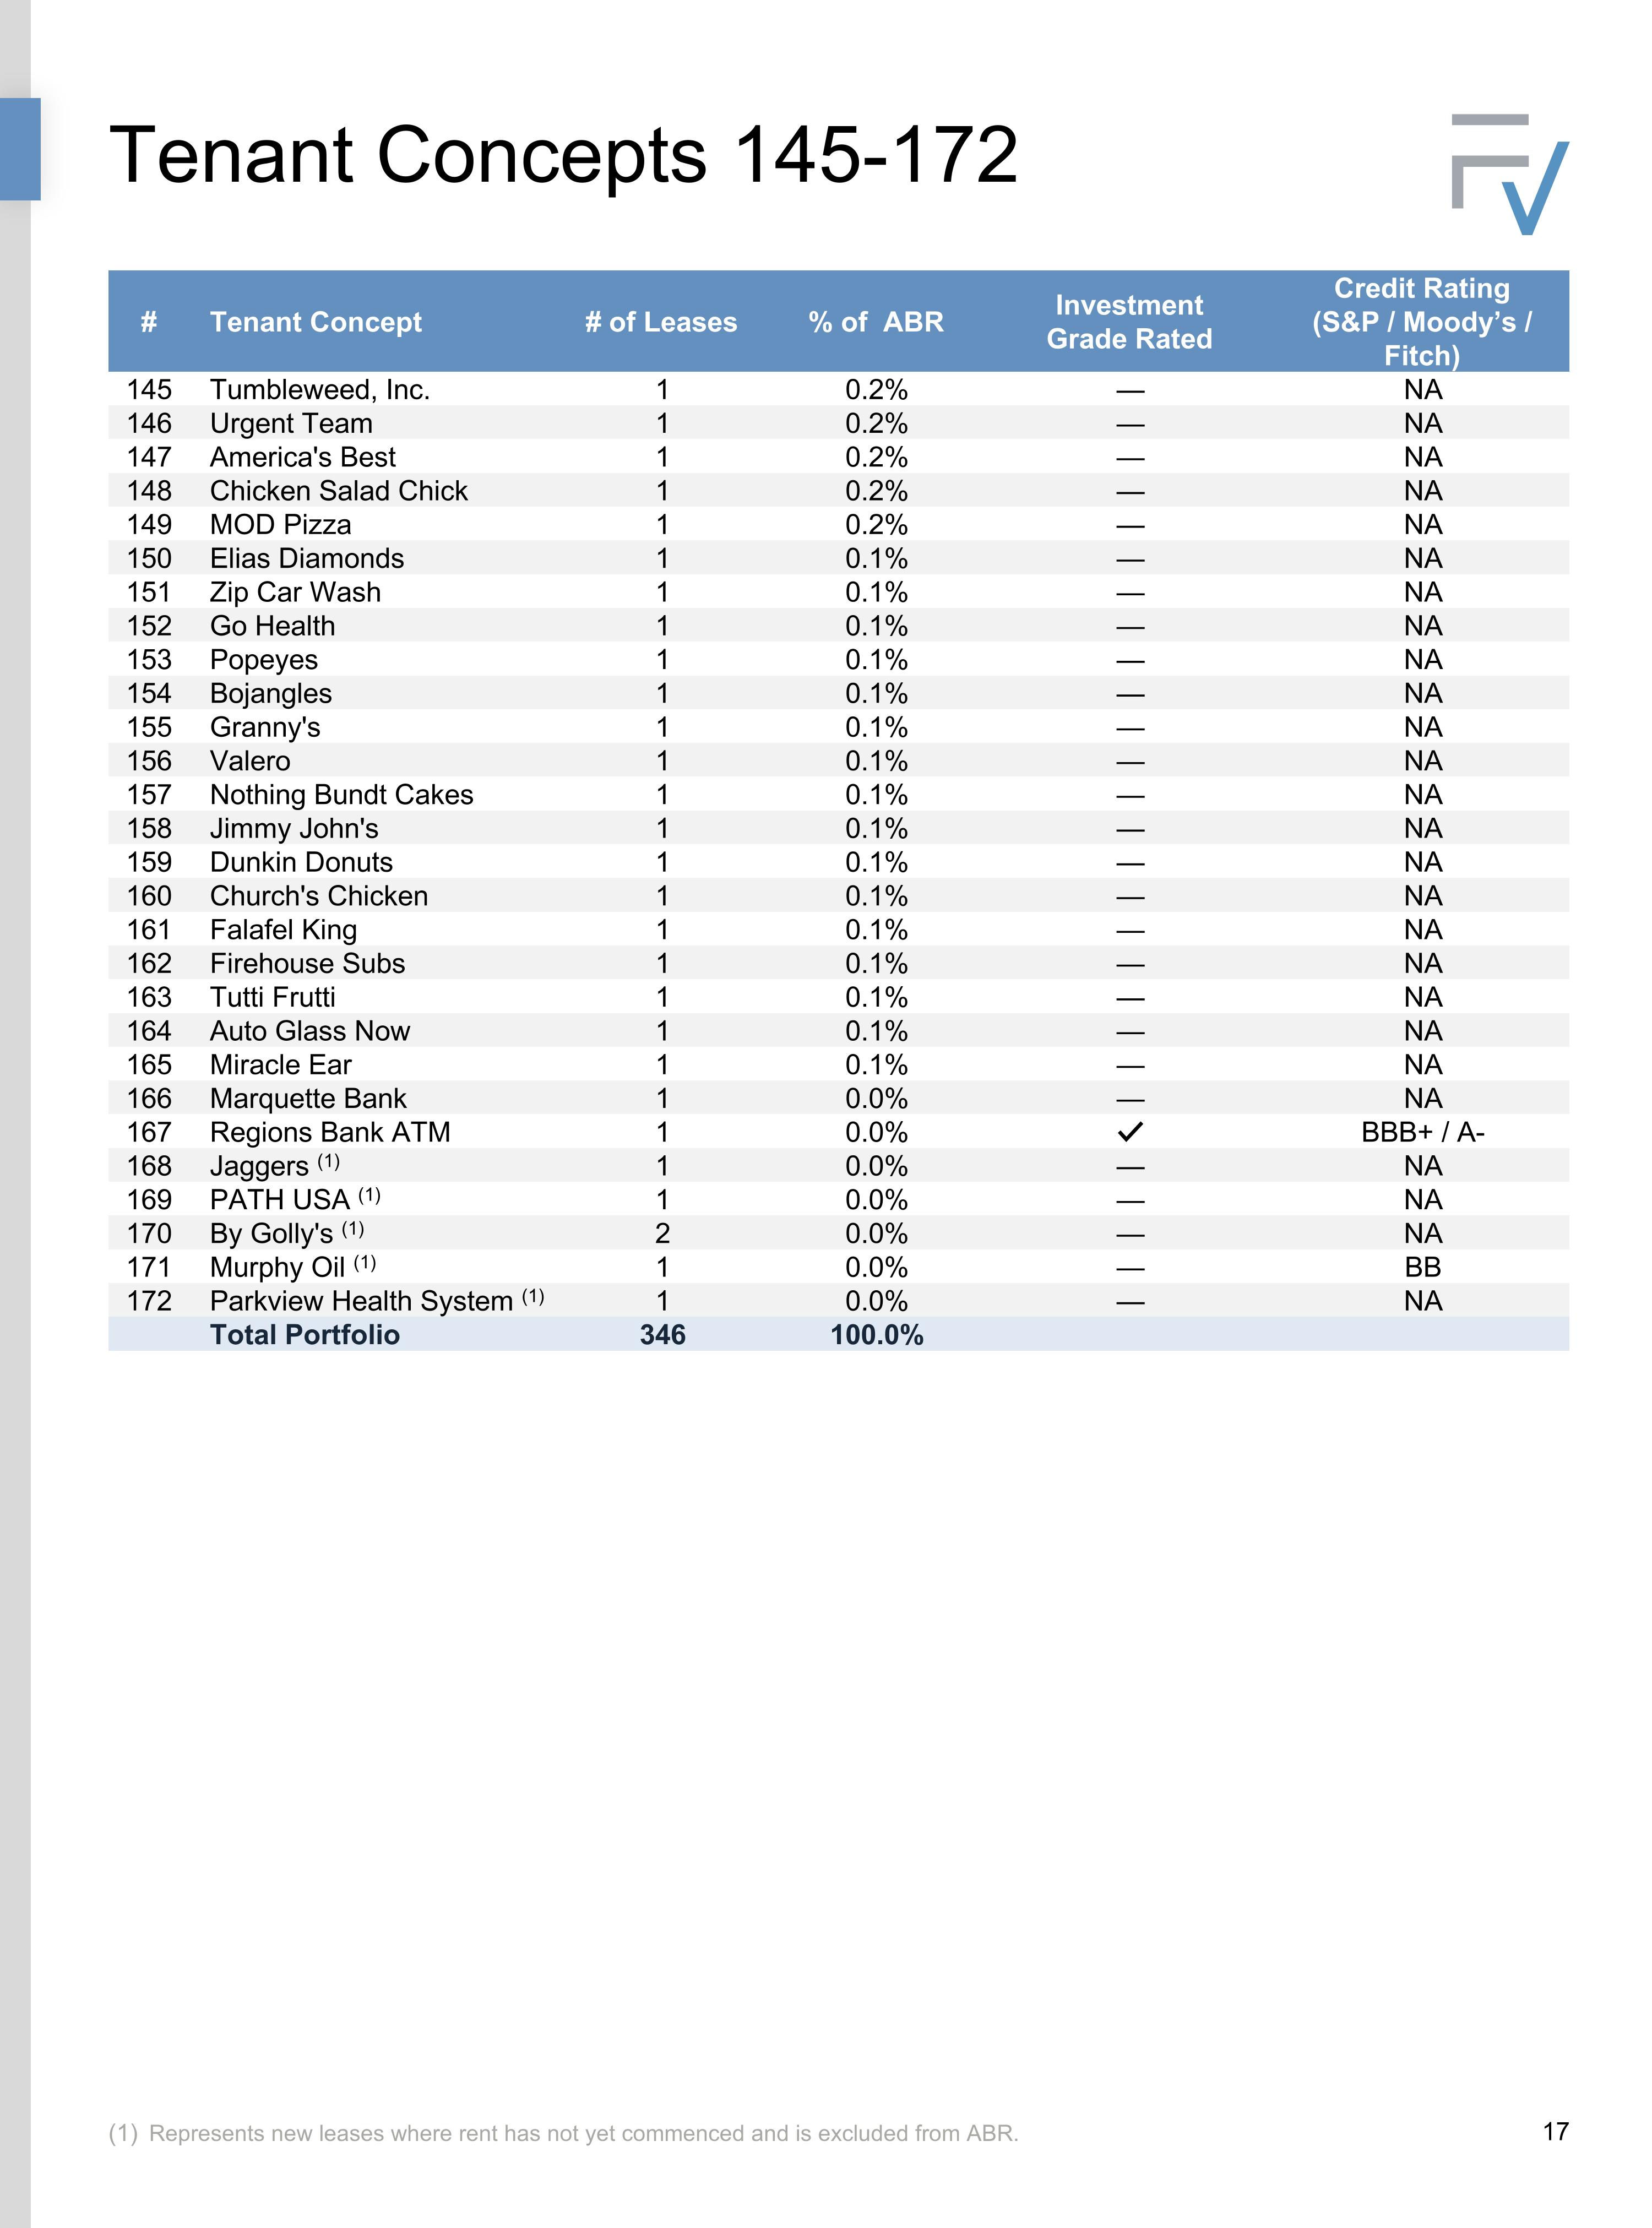
Tenant Concepts 145-172 # Tenant Concept # of Leases % of ABR Investment Grade Rated Credit Rating (S&P / Moody’s / Fitch) 145 Tumbleweed, Inc. 1 0.2% — NA 146 Urgent Team 1 0.2% — NA 147 America's Best 1 0.2% — NA 148 Chicken Salad Chick 1 0.2% — NA 149 MOD Pizza 1 0.2% — NA 150 Elias Diamonds 1 0.1% — NA 151 Zip Car Wash 1 0.1% — NA 152 Go Health 1 0.1% — NA 153 Popeyes 1 0.1% — NA 154 Bojangles 1 0.1% — NA 155 Granny's 1 0.1% — NA 156 Valero 1 0.1% — NA 157 Nothing Bundt Cakes 1 0.1% — NA 158 Jimmy John's 1 0.1% — NA 159 Dunkin Donuts 1 0.1% — NA 160 Church's Chicken 1 0.1% — NA 161 Falafel King 1 0.1% — NA 162 Firehouse Subs 1 0.1% — NA 163 Tutti Frutti 1 0.1% — NA 164 Auto Glass Now 1 0.1% — NA 165 Miracle Ear 1 0.1% — NA 166 Marquette Bank 1 0.0% — NA 167 Regions Bank ATM 1 0.0% ✓ BBB+ / A- 168 Jaggers (1) 1 0.0% — NA 169 PATH USA (1) 1 0.0% — NA 170 By Golly's (1) 2 0.0% — NA 171 Murphy Oil (1) 1 0.0% — BB 172 Parkview Health System (1) 1 0.0% — NA Total Portfolio 346 100.0% Represents new leases where rent has not yet commenced and is excluded from ABR.
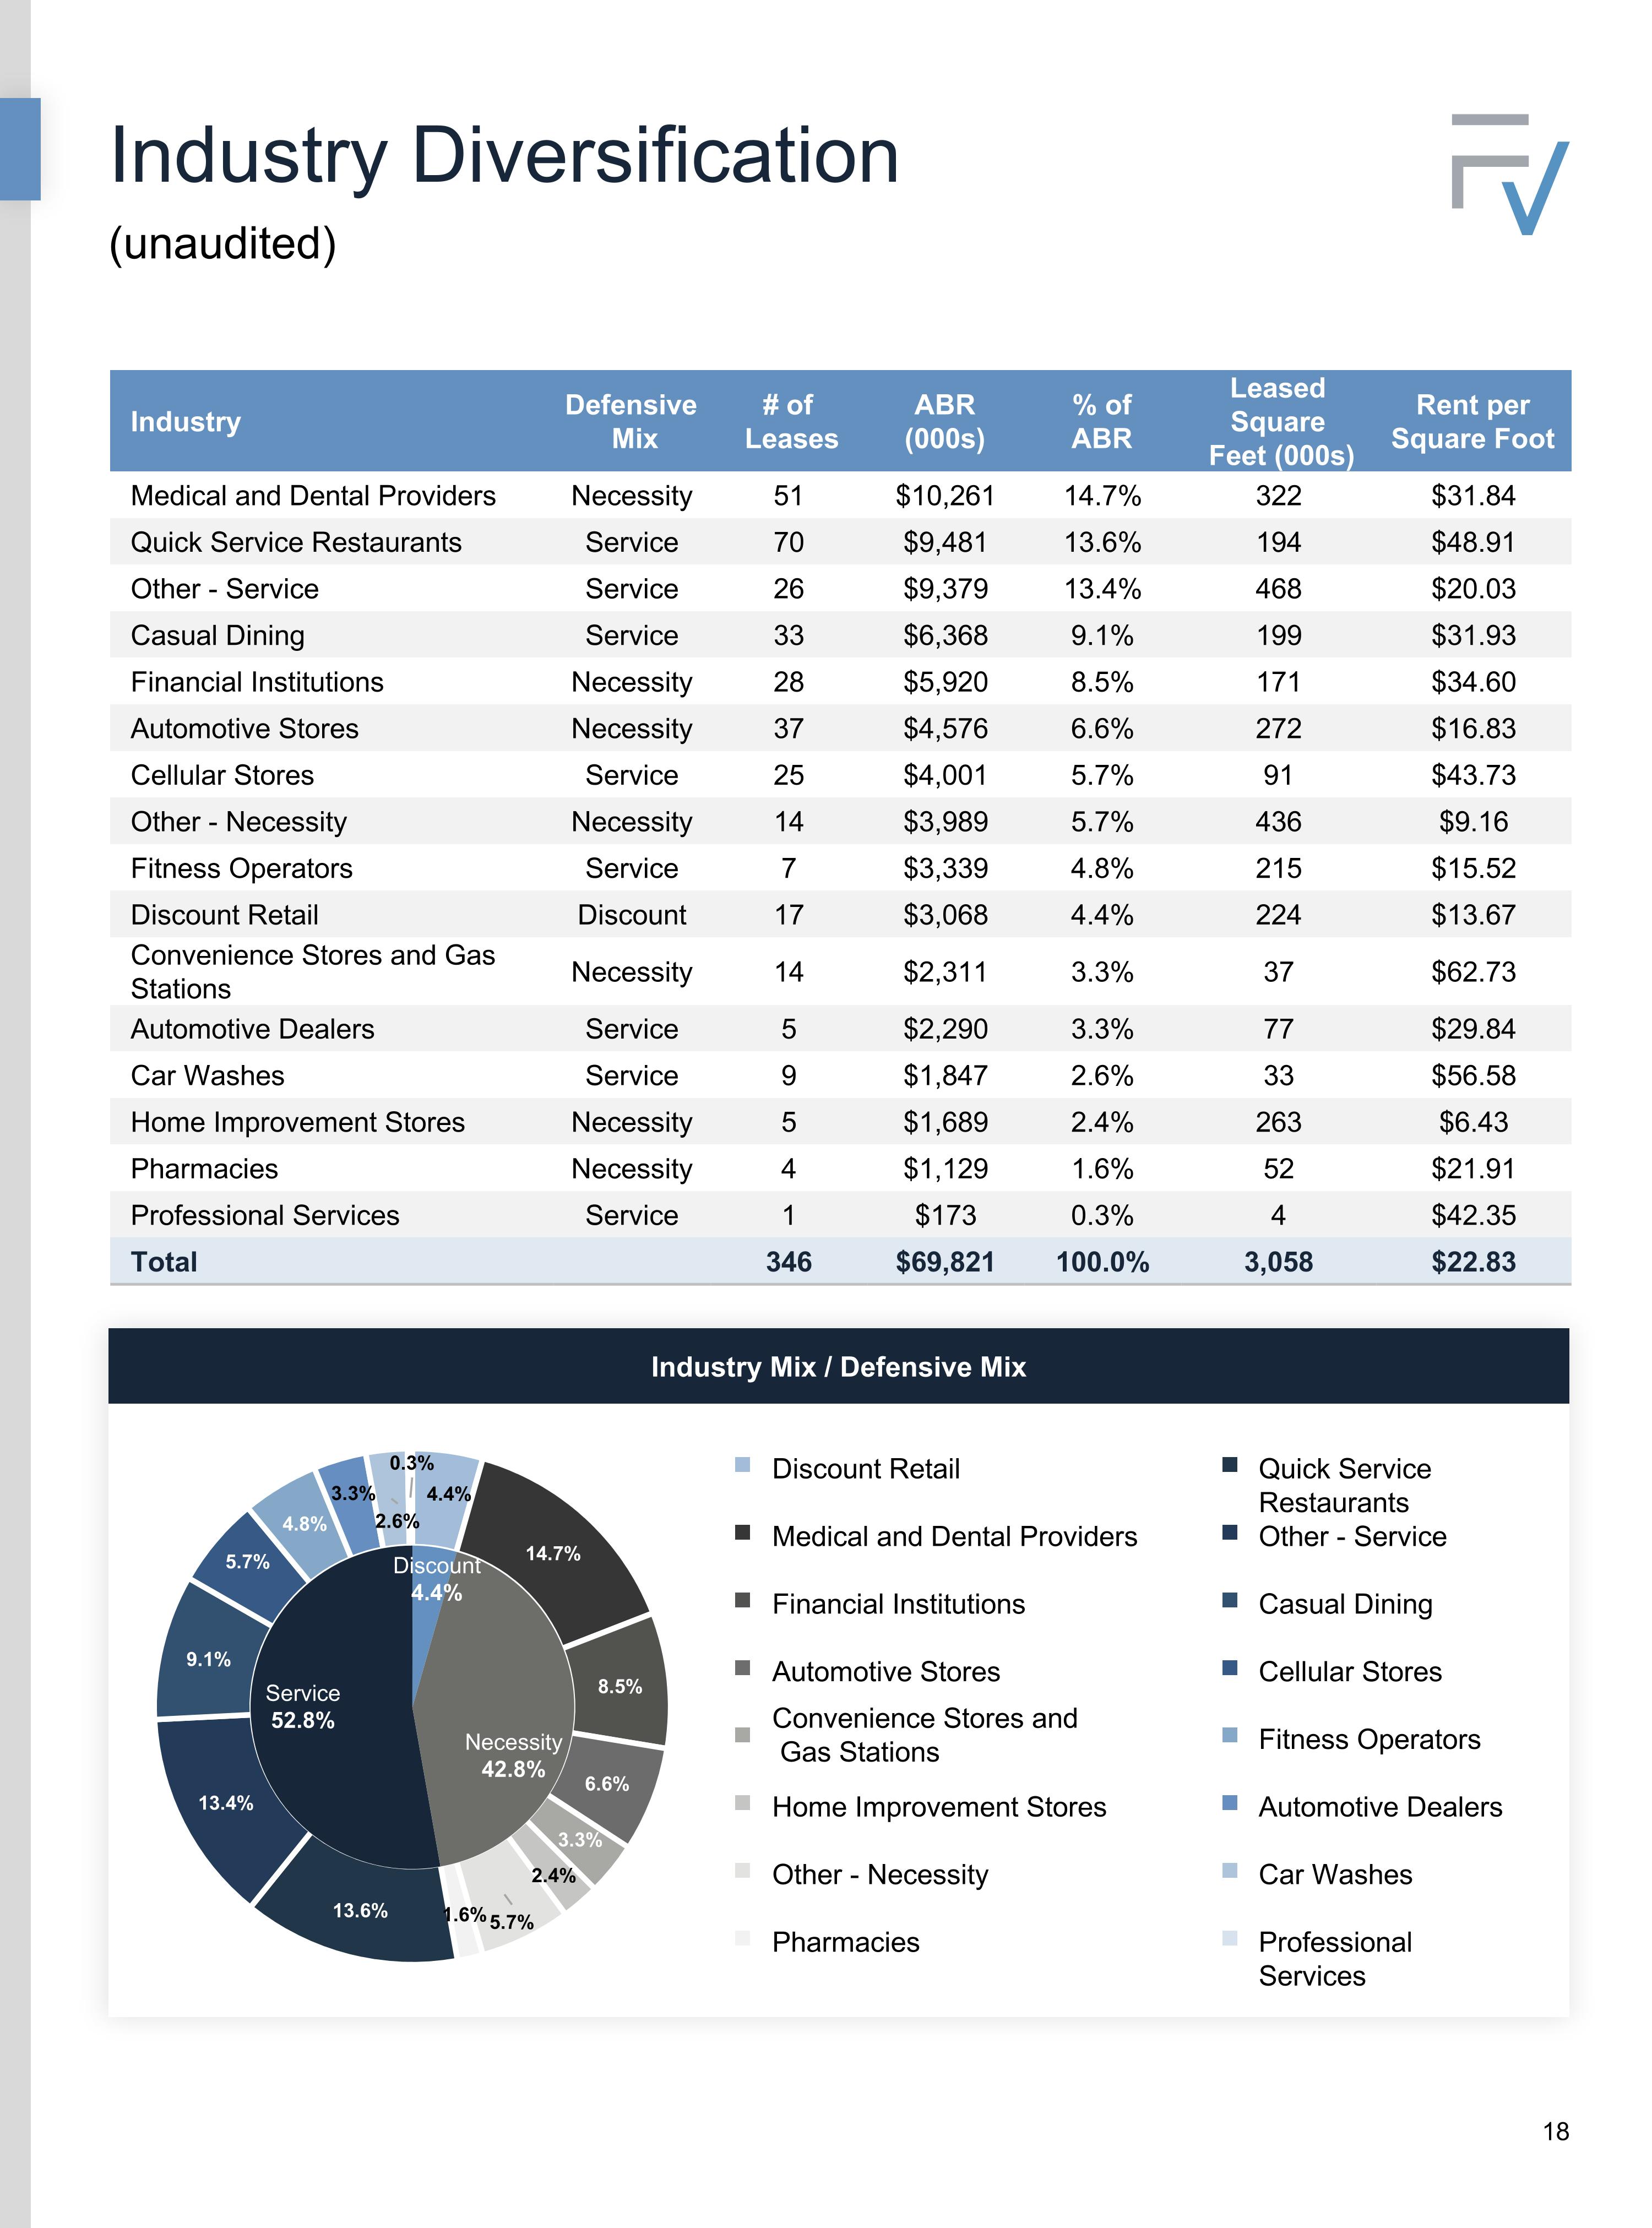
Industry Diversification (unaudited) Industry Defensive Mix # of Leases ABR (000s) % of ABR Leased Square Feet (000s) Rent per Square Foot Medical and Dental Providers Necessity 51 $10,261 14.7% 322 $31.84 Quick Service Restaurants Service 70 $9,481 13.6% 194 $48.91 Other - Service Service 26 $9,379 13.4% 468 $20.03 Casual Dining Service 33 $6,368 9.1% 199 $31.93 Financial Institutions Necessity 28 $5,920 8.5% 171 $34.60 Automotive Stores Necessity 37 $4,576 6.6% 272 $16.83 Cellular Stores Service 25 $4,001 5.7% 91 $43.73 Other - Necessity Necessity 14 $3,989 5.7% 436 $9.16 Fitness Operators Service 7 $3,339 4.8% 215 $15.52 Discount Retail Discount 17 $3,068 4.4% 224 $13.67 Convenience Stores and Gas Stations Necessity 14 $2,311 3.3% 37 $62.73 Automotive Dealers Service 5 $2,290 3.3% 77 $29.84 Car Washes Service 9 $1,847 2.6% 33 $56.58 Home Improvement Stores Necessity 5 $1,689 2.4% 263 $6.43 Pharmacies Necessity 4 $1,129 1.6% 52 $21.91 Professional Services Service 1 $173 0.3% 4 $42.35 Total 346 $69,821 100.0% 3,058 $22.83 Industry Mix / Defensive Mix Convenience Stores and Gas Stations Discount Retail Medical and Dental Providers Financial Institutions Automotive Stores Home Improvement Stores Other - Necessity Pharmacies Casual Dining Quick Service Restaurants Other - Service Cellular Stores Fitness Operators Automotive Dealers Car Washes Professional Services
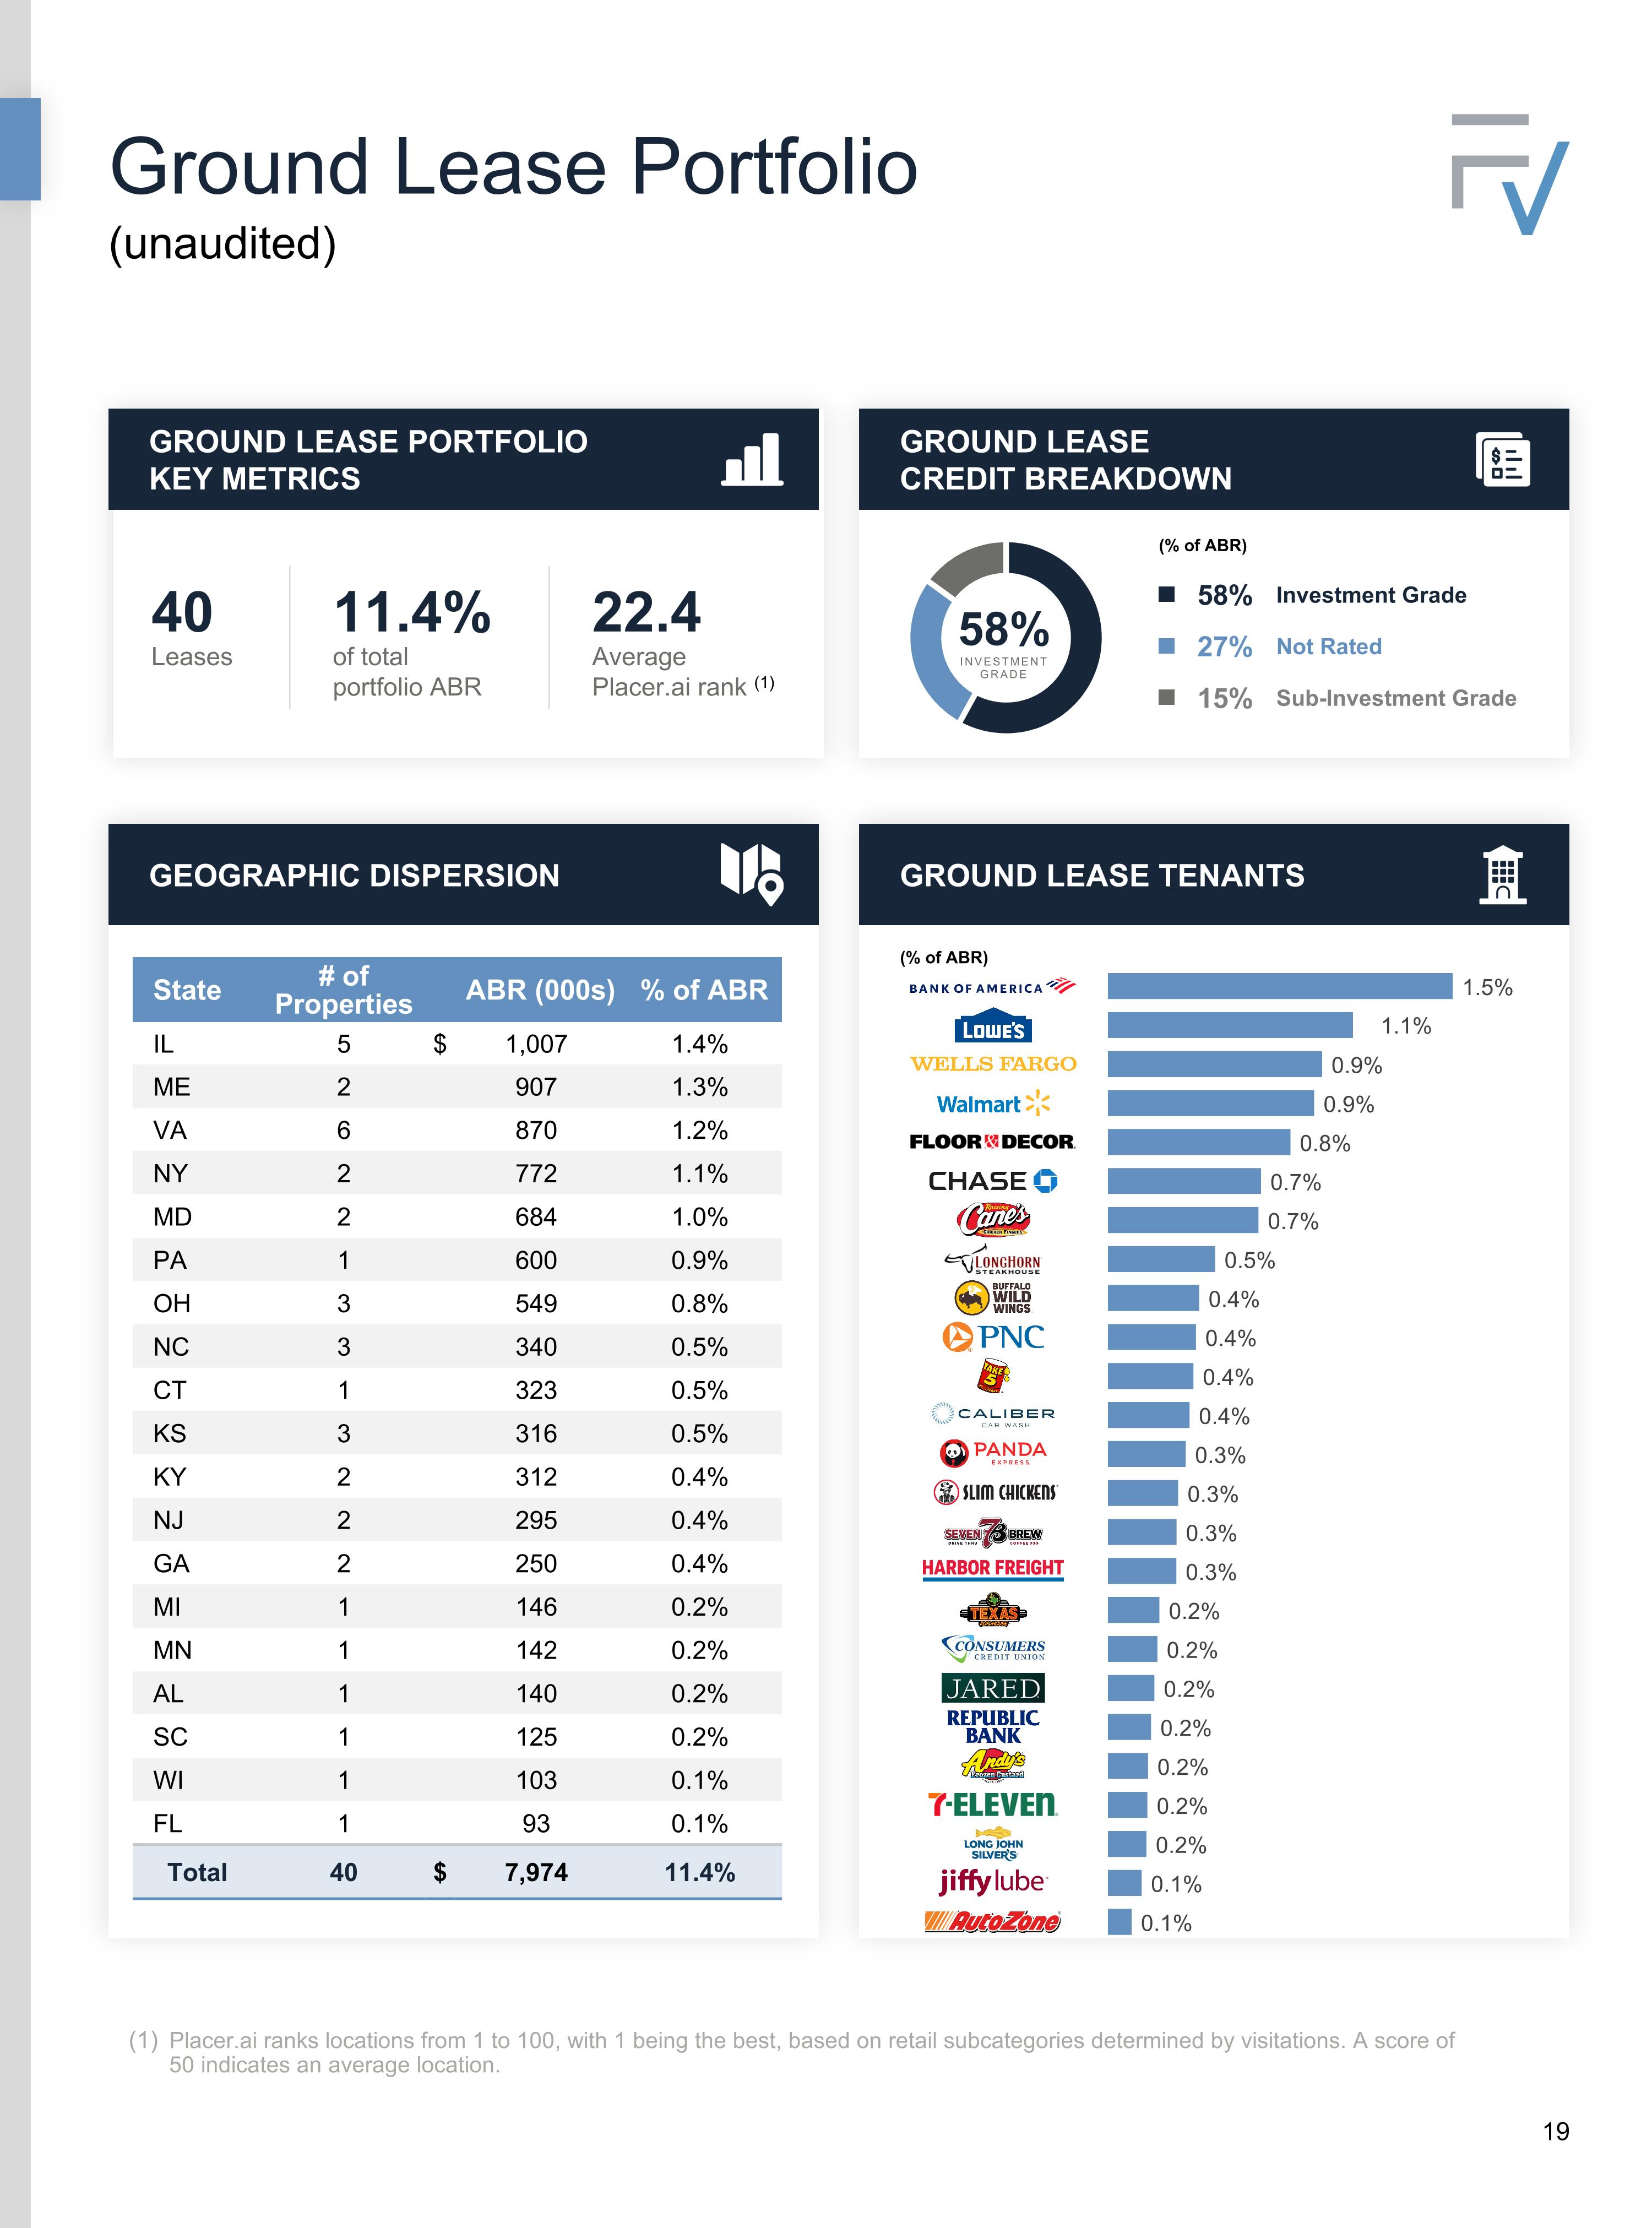
Ground Lease Portfolio GROUND LEASE PORTFOLIO KEY METRICS 40 Leases 11.4% of total portfolio ABR 22.4 Average Placer.ai rank (1) 58% INVESTMENT GRADE 58% Investment Grade 27% Not Rated 15% Sub-Investment Grade (% of ABR) GROUND LEASE CREDIT BREAKDOWN GROUND LEASE TENANTS GEOGRAPHIC DISPERSION (% of ABR) State # of Properties ABR (000s) % of ABR IL 5 $ 1,007 1.4% ME 2 907 1.3% VA 6 870 1.2% NY 2 772 1.1% MD 2 684 1.0% PA 1 600 0.9% OH 3 549 0.8% NC 3 340 0.5% CT 1 323 0.5% KS 3 316 0.5% KY 2 312 0.4% NJ 2 295 0.4% GA 2 250 0.4% MI 1 146 0.2% MN 1 142 0.2% AL 1 140 0.2% SC 1 125 0.2% WI 1 103 0.1% FL 1 93 0.1% Total 40 $ 7,974 11.4% Placer.ai ranks locations from 1 to 100, with 1 being the best, based on retail subcategories determined by visitations. A score of 50 indicates an average location. (unaudited)
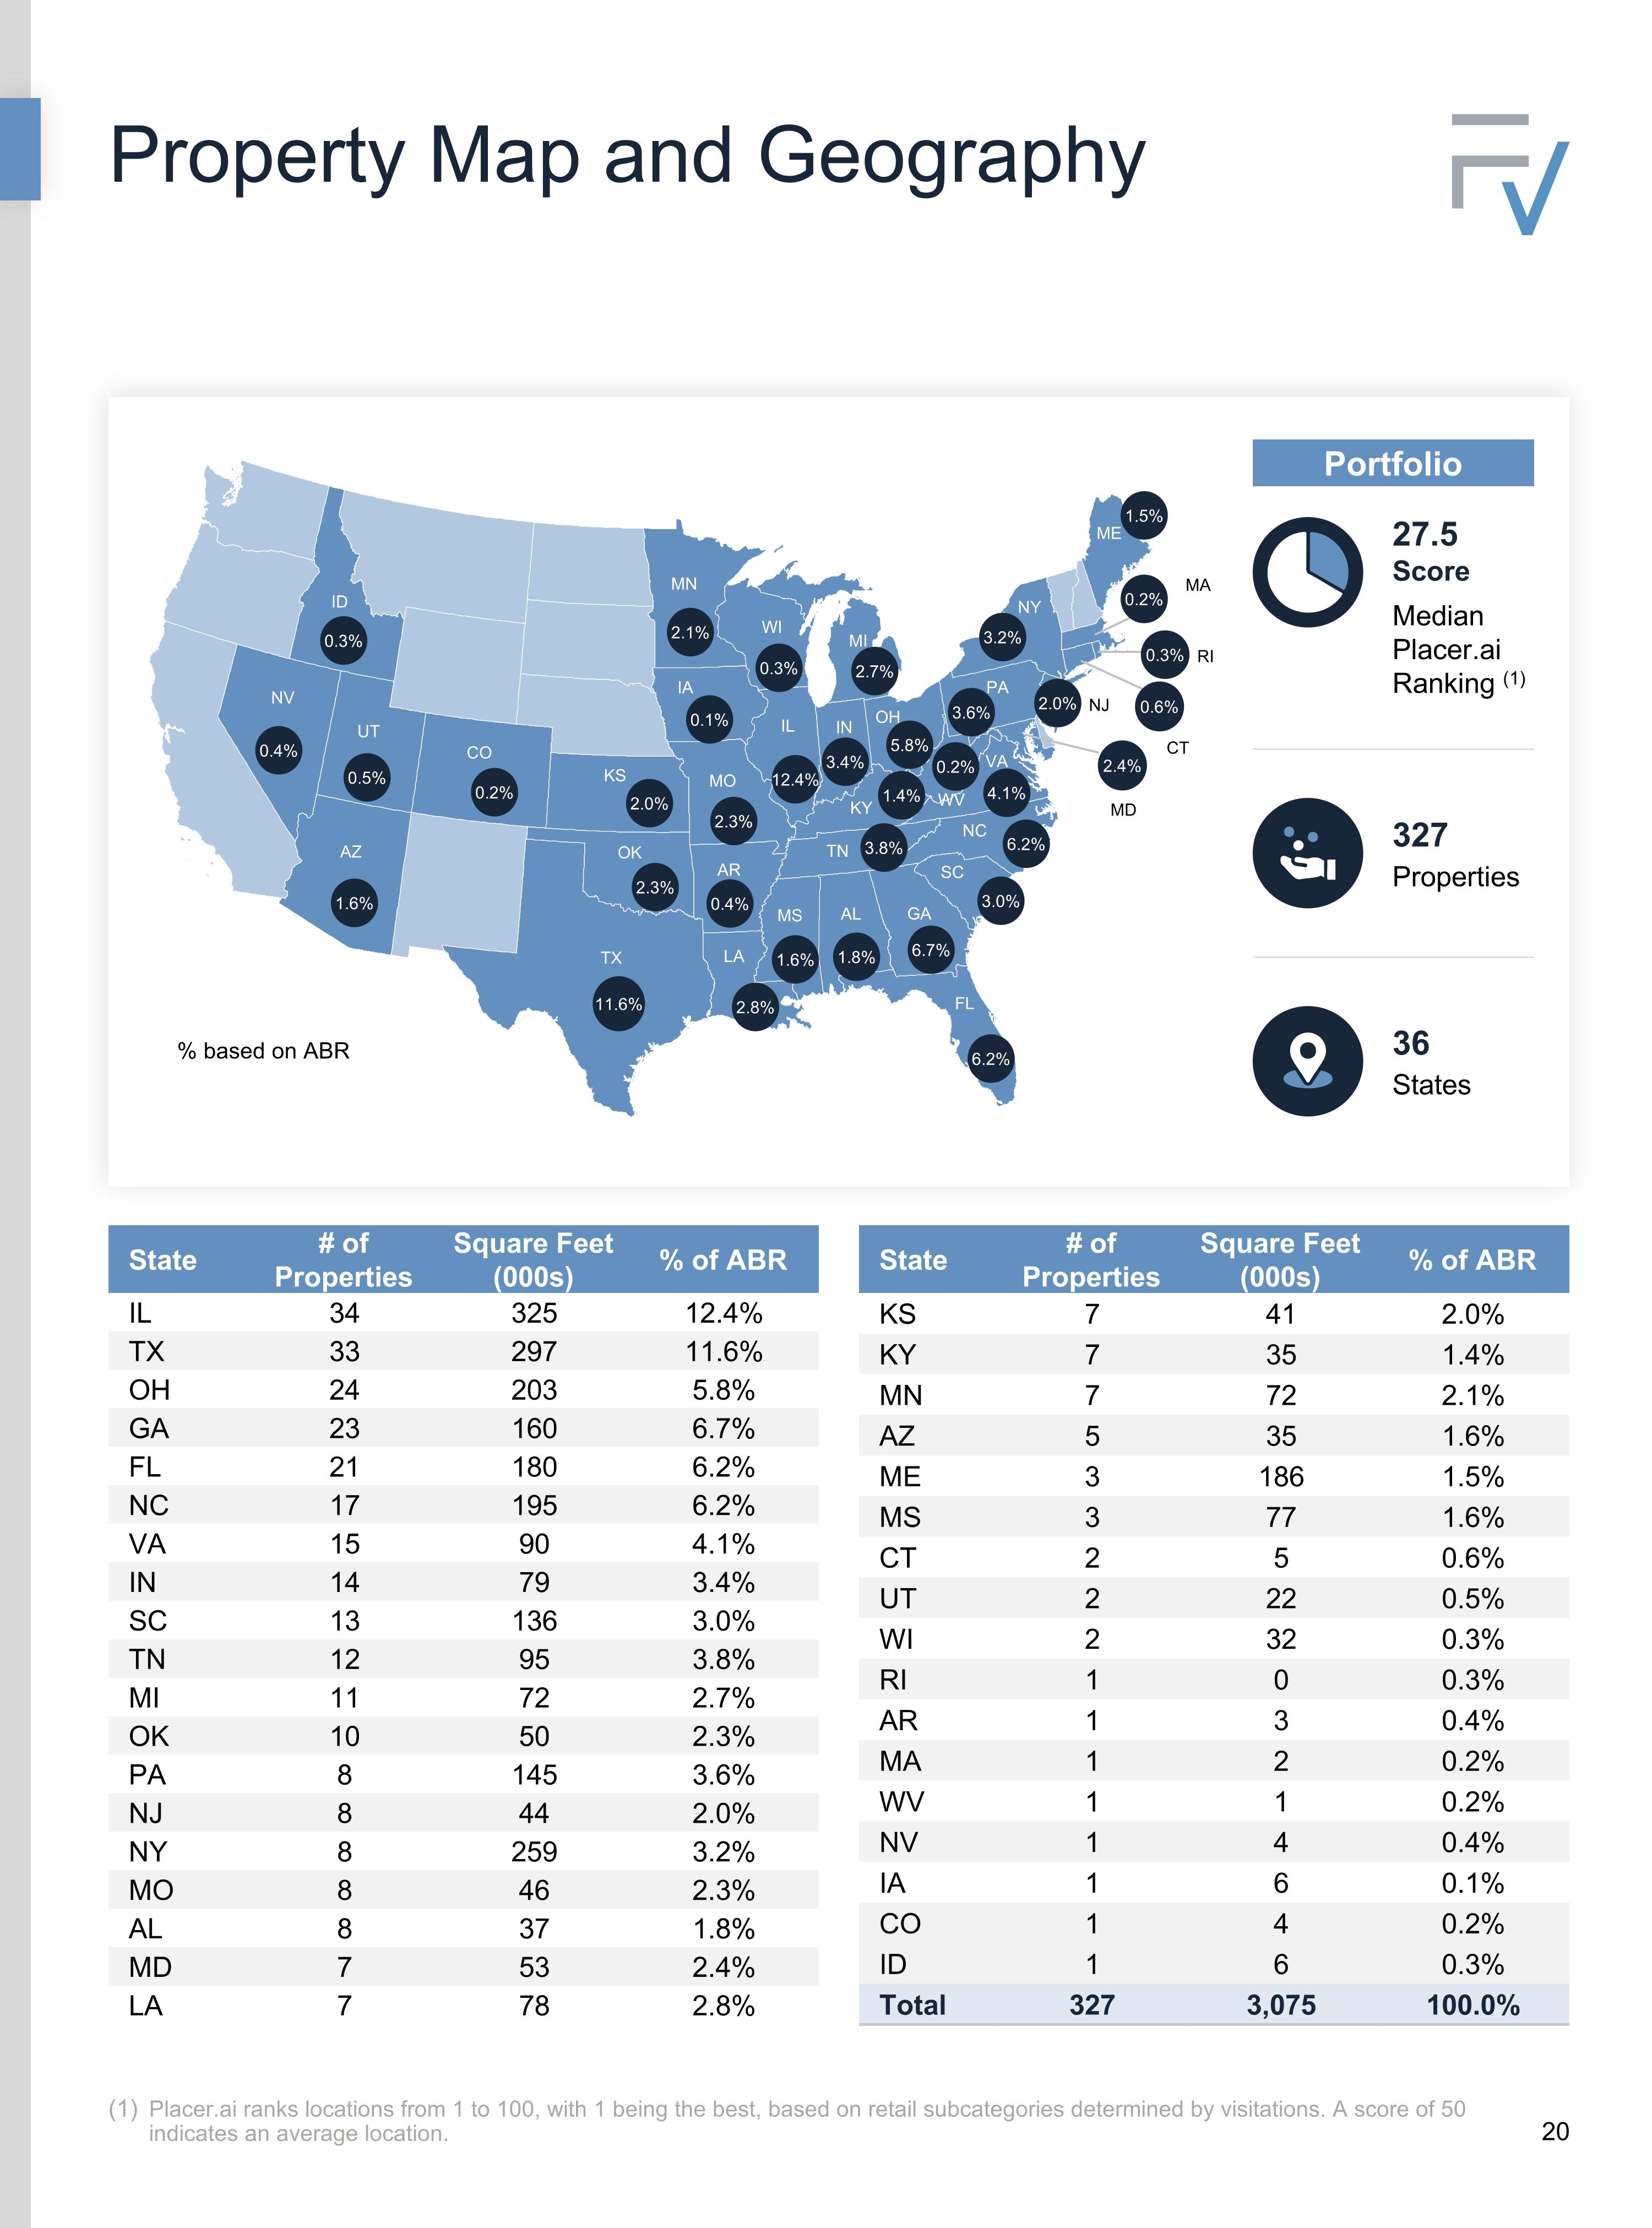
Property Map and Geography Placer.ai ranks locations from 1 to 100, with 1 being the best, based on retail subcategories determined by visitations. A score of 50 indicates an average location. MA MN ID AZ CO NV UT AR KS MO OK LA TX CT RI AL FL GA MS SC IL IN KY NC OH TN VA WI IA MD NJ NY PA ME WV 11.6% MI 2.4% 0.6% 1.6% 0.4% 0.5% 0.3% 2.3% 2.0% 2.1% 0.3% 0.1% 12.4% 2.3% 0.4% 2.8% 1.6% 1.8% 6.2% 6.7% 3.0% 6.2% 3.8% 1.4% 4.1% 0.2% 0.2% 2.7% 3.4% 5.8% 3.6% 3.2% 1.5% 2.0% 0.2% 0.3% % based on ABR State # of Properties Square Feet (000s) % of ABR IL 34 325 12.4% TX 33 297 11.6% OH 24 203 5.8% GA 23 160 6.7% FL 21 180 6.2% NC 17 195 6.2% VA 15 90 4.1% IN 14 79 3.4% SC 13 136 3.0% TN 12 95 3.8% MI 11 72 2.7% OK 10 50 2.3% PA 8 145 3.6% NJ 8 44 2.0% NY 8 259 3.2% MO 8 46 2.3% AL 8 37 1.8% MD 7 53 2.4% LA 7 78 2.8% State # of Properties Square Feet (000s) % of ABR KS 7 41 2.0% KY 7 35 1.4% MN 7 72 2.1% AZ 5 35 1.6% ME 3 186 1.5% MS 3 77 1.6% CT 2 5 0.6% UT 2 22 0.5% WI 2 32 0.3% RI 1 0 0.3% AR 1 3 0.4% MA 1 2 0.2% WV 1 1 0.2% NV 1 4 0.4% IA 1 6 0.1% CO 1 4 0.2% ID 1 6 0.3% Total 327 3,075 100.0% Portfolio 327 Properties 36 States 27.5 Score Median Placer.ai Ranking (1)
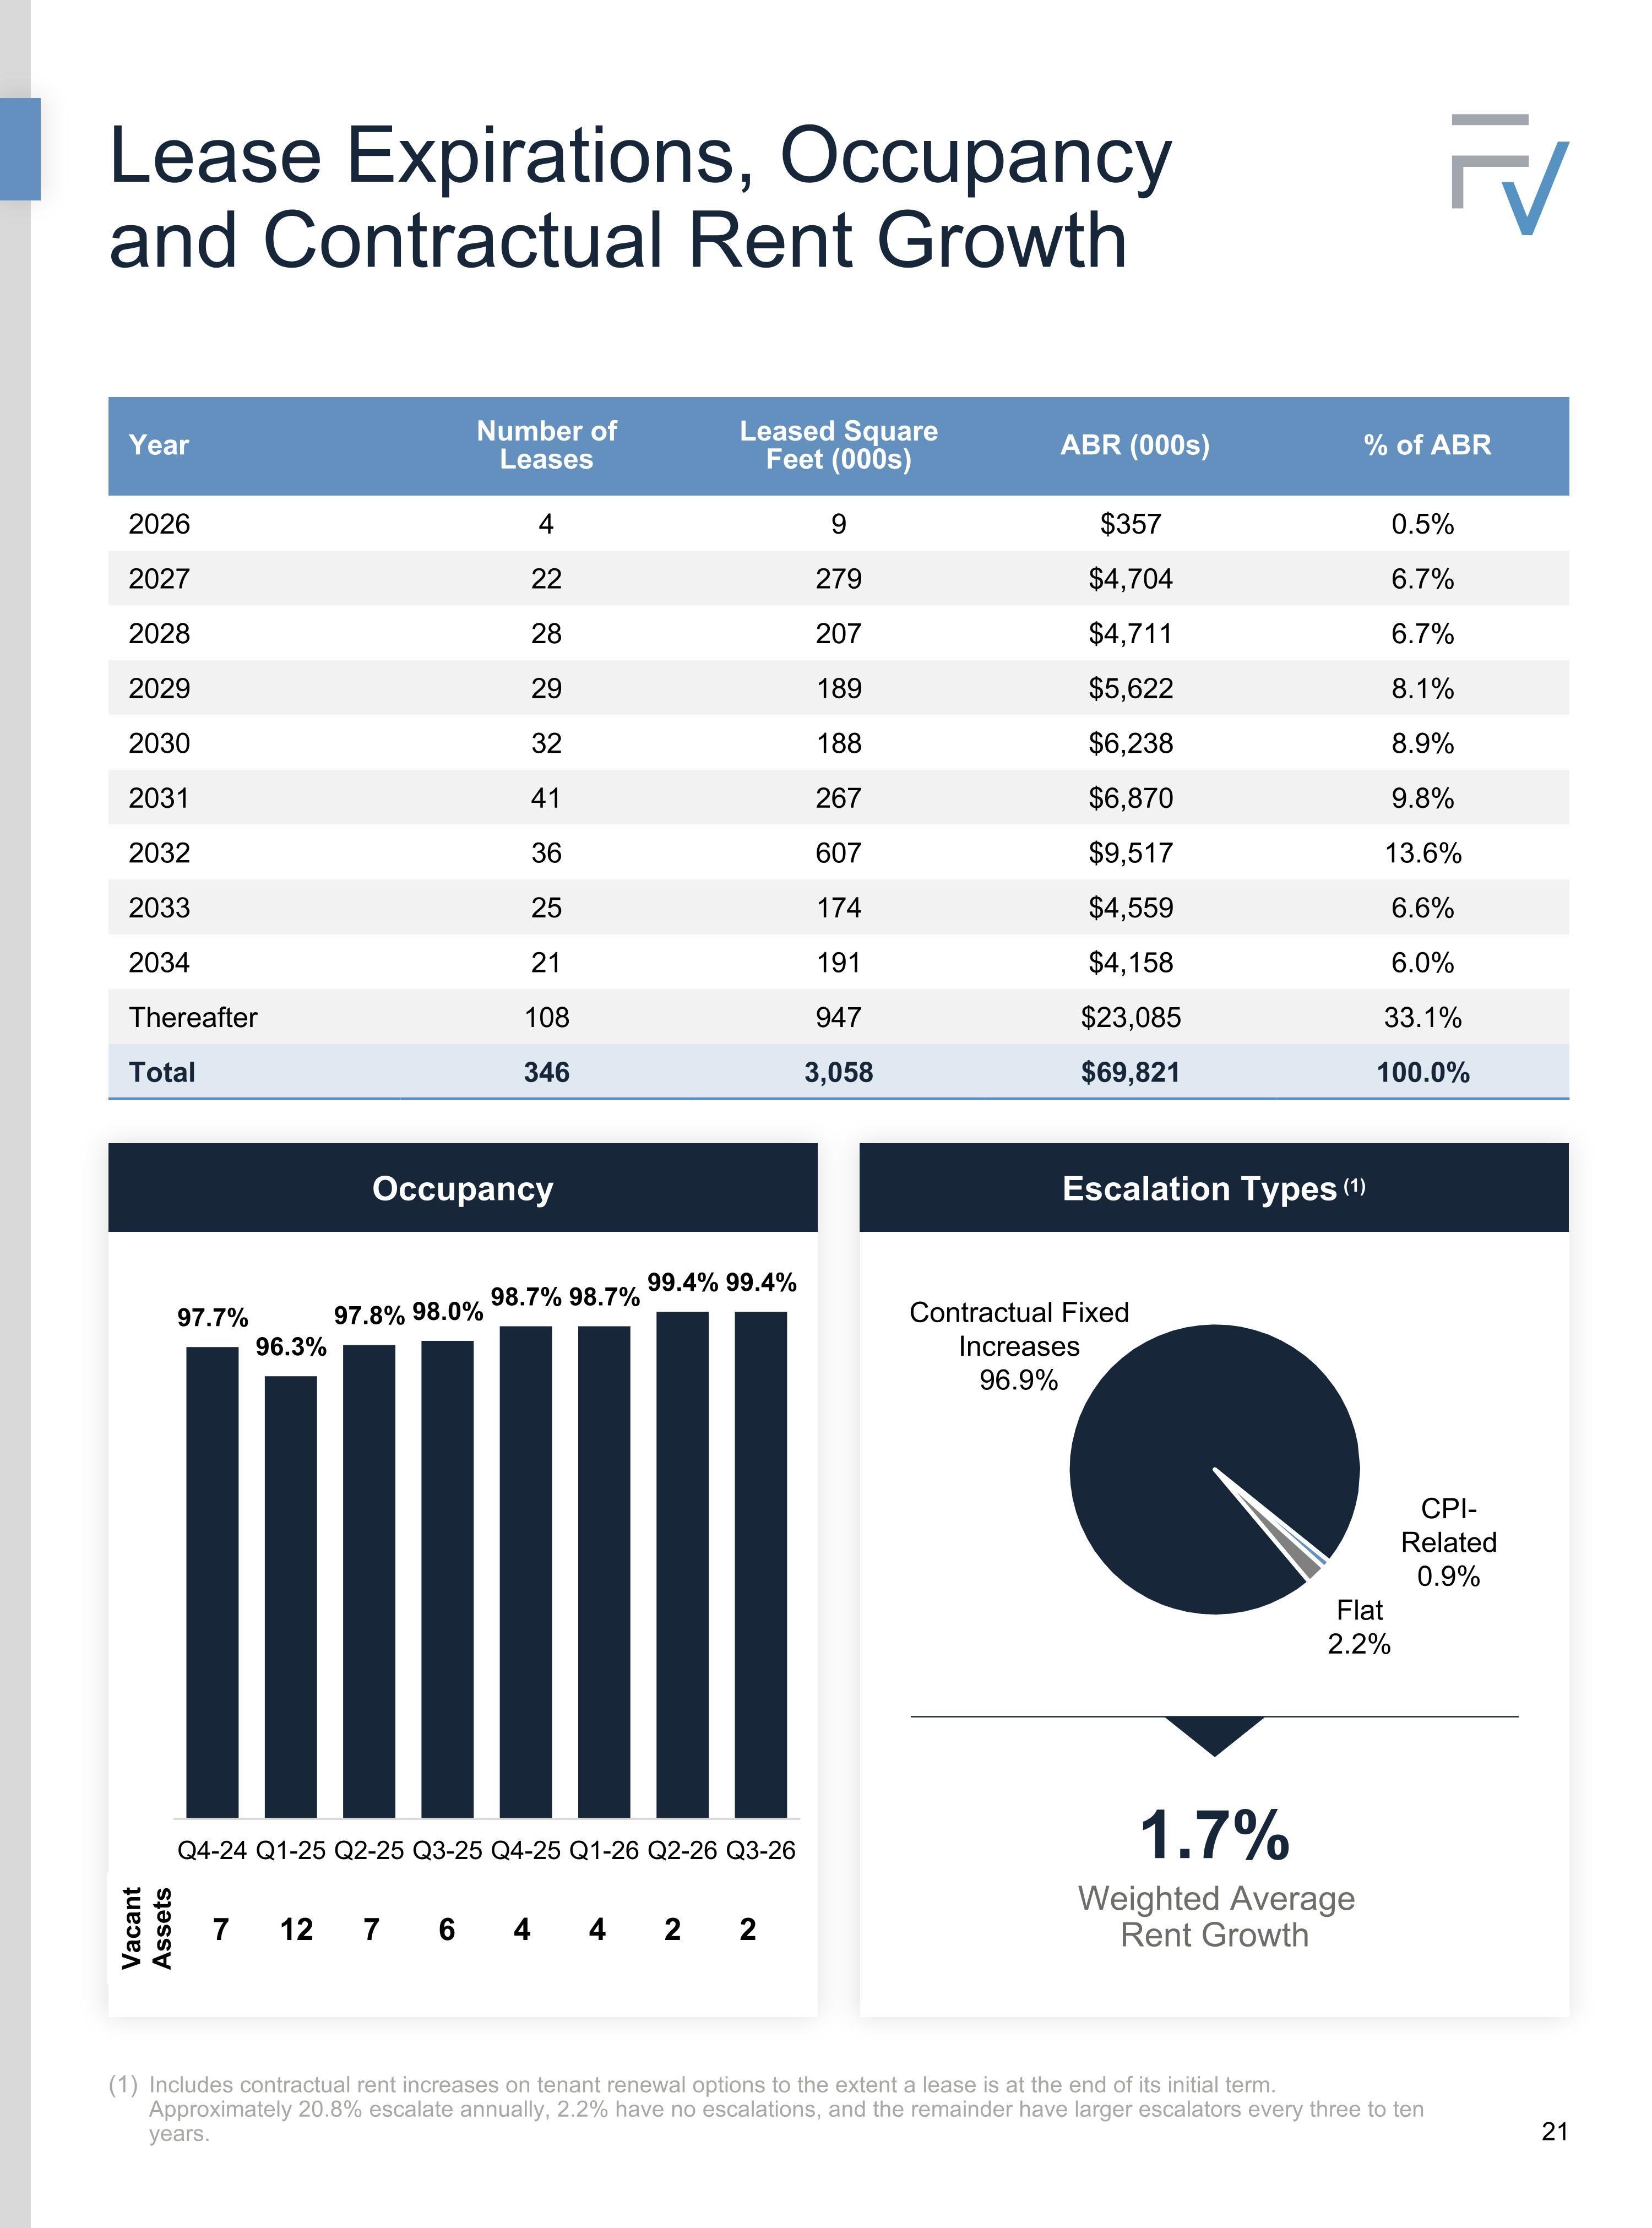
Occupancy Lease Expirations, Occupancy and Contractual Rent Growth Includes contractual rent increases on tenant renewal options to the extent a lease is at the end of its initial term. Approximately 20.8% escalate annually, 2.2% have no escalations, and the remainder have larger escalators every three to ten years. Year Number of Leases Leased Square Feet (000s) ABR (000s) % of ABR 2026 4 9 $357 0.5% 2027 22 279 $4,704 6.7% 2028 28 207 $4,711 6.7% 2029 29 189 $5,622 8.1% 2030 32 188 $6,238 8.9% 2031 41 267 $6,870 9.8% 2032 36 607 $9,517 13.6% 2033 25 174 $4,559 6.6% 2034 21 191 $4,158 6.0% Thereafter 108 947 $23,085 33.1% Total 346 3,058 $69,821 100.0% Vacant Assets 7 12 7 6 4 4 2 2 Escalation Types (1) 1.7% Weighted Average Rent Growth
Appendix Definitions and Forward-Looking Statements
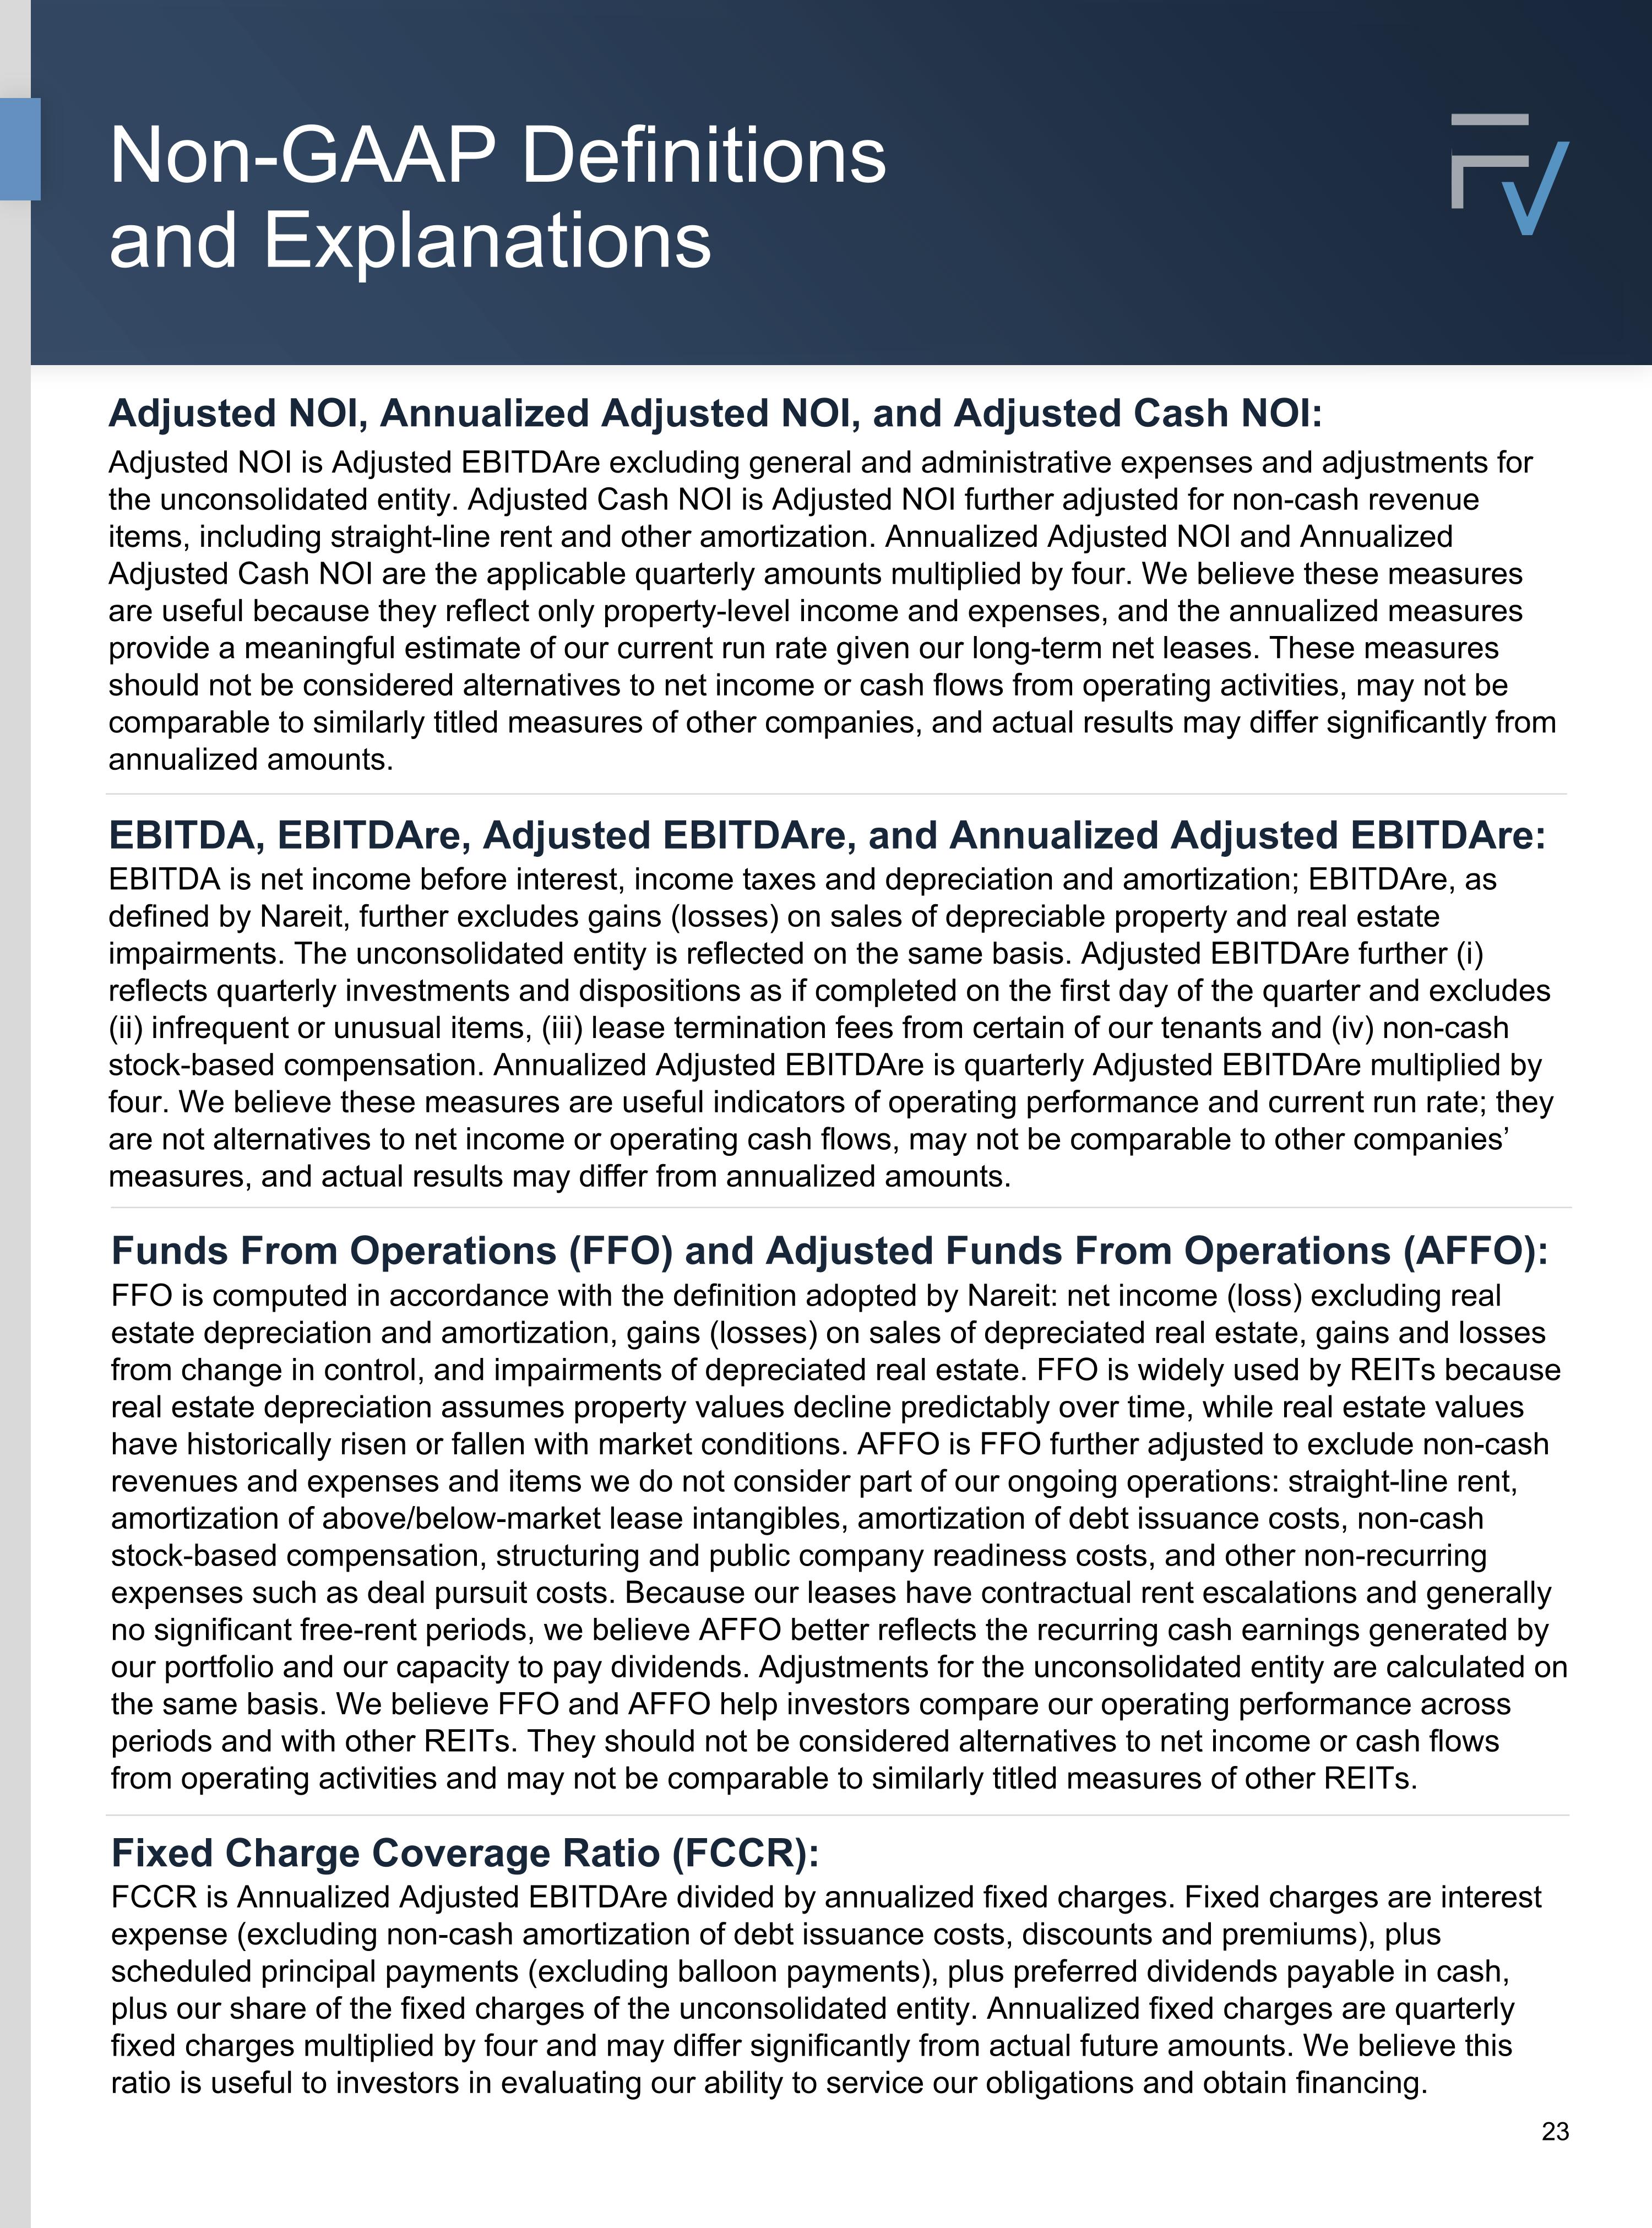
EBITDA, EBITDAre, Adjusted EBITDAre, and Annualized Adjusted EBITDAre: EBITDA is net income before interest, income taxes and depreciation and amortization; EBITDAre, as defined by Nareit, further excludes gains (losses) on sales of depreciable property and real estate impairments. The unconsolidated entity is reflected on the same basis. Adjusted EBITDAre further (i) reflects quarterly investments and dispositions as if completed on the first day of the quarter and excludes (ii) infrequent or unusual items, (iii) lease termination fees from certain of our tenants and (iv) non-cash stock-based compensation. Annualized Adjusted EBITDAre is quarterly Adjusted EBITDAre multiplied by four. We believe these measures are useful indicators of operating performance and current run rate; they are not alternatives to net income or operating cash flows, may not be comparable to other companies’ measures, and actual results may differ from annualized amounts. Funds From Operations (FFO) and Adjusted Funds From Operations (AFFO): FFO is computed in accordance with the definition adopted by Nareit: net income (loss) excluding real estate depreciation and amortization, gains (losses) on sales of depreciated real estate, gains and losses from change in control, and impairments of depreciated real estate. FFO is widely used by REITs because real estate depreciation assumes property values decline predictably over time, while real estate values have historically risen or fallen with market conditions. AFFO is FFO further adjusted to exclude non-cash revenues and expenses and items we do not consider part of our ongoing operations: straight-line rent, amortization of above/below-market lease intangibles, amortization of debt issuance costs, non-cash stock-based compensation, structuring and public company readiness costs, and other non-recurring expenses such as deal pursuit costs. Because our leases have contractual rent escalations and generally no significant free-rent periods, we believe AFFO better reflects the recurring cash earnings generated by our portfolio and our capacity to pay dividends. Adjustments for the unconsolidated entity are calculated on the same basis. We believe FFO and AFFO help investors compare our operating performance across periods and with other REITs. They should not be considered alternatives to net income or cash flows from operating activities and may not be comparable to similarly titled measures of other REITs. Adjusted NOI, Annualized Adjusted NOI, and Adjusted Cash NOI: Adjusted NOI is Adjusted EBITDAre excluding general and administrative expenses and adjustments for the unconsolidated entity. Adjusted Cash NOI is Adjusted NOI further adjusted for non-cash revenue items, including straight-line rent and other amortization. Annualized Adjusted NOI and Annualized Adjusted Cash NOI are the applicable quarterly amounts multiplied by four. We believe these measures are useful because they reflect only property-level income and expenses, and the annualized measures provide a meaningful estimate of our current run rate given our long-term net leases. These measures should not be considered alternatives to net income or cash flows from operating activities, may not be comparable to similarly titled measures of other companies, and actual results may differ significantly from annualized amounts. Fixed Charge Coverage Ratio (FCCR): FCCR is Annualized Adjusted EBITDAre divided by annualized fixed charges. Fixed charges are interest expense (excluding non-cash amortization of debt issuance costs, discounts and premiums), plus scheduled principal payments (excluding balloon payments), plus preferred dividends payable in cash, plus our share of the fixed charges of the unconsolidated entity. Annualized fixed charges are quarterly fixed charges multiplied by four and may differ significantly from actual future amounts. We believe this ratio is useful to investors in evaluating our ability to service our obligations and obtain financing. Non-GAAP Definitions and Explanations
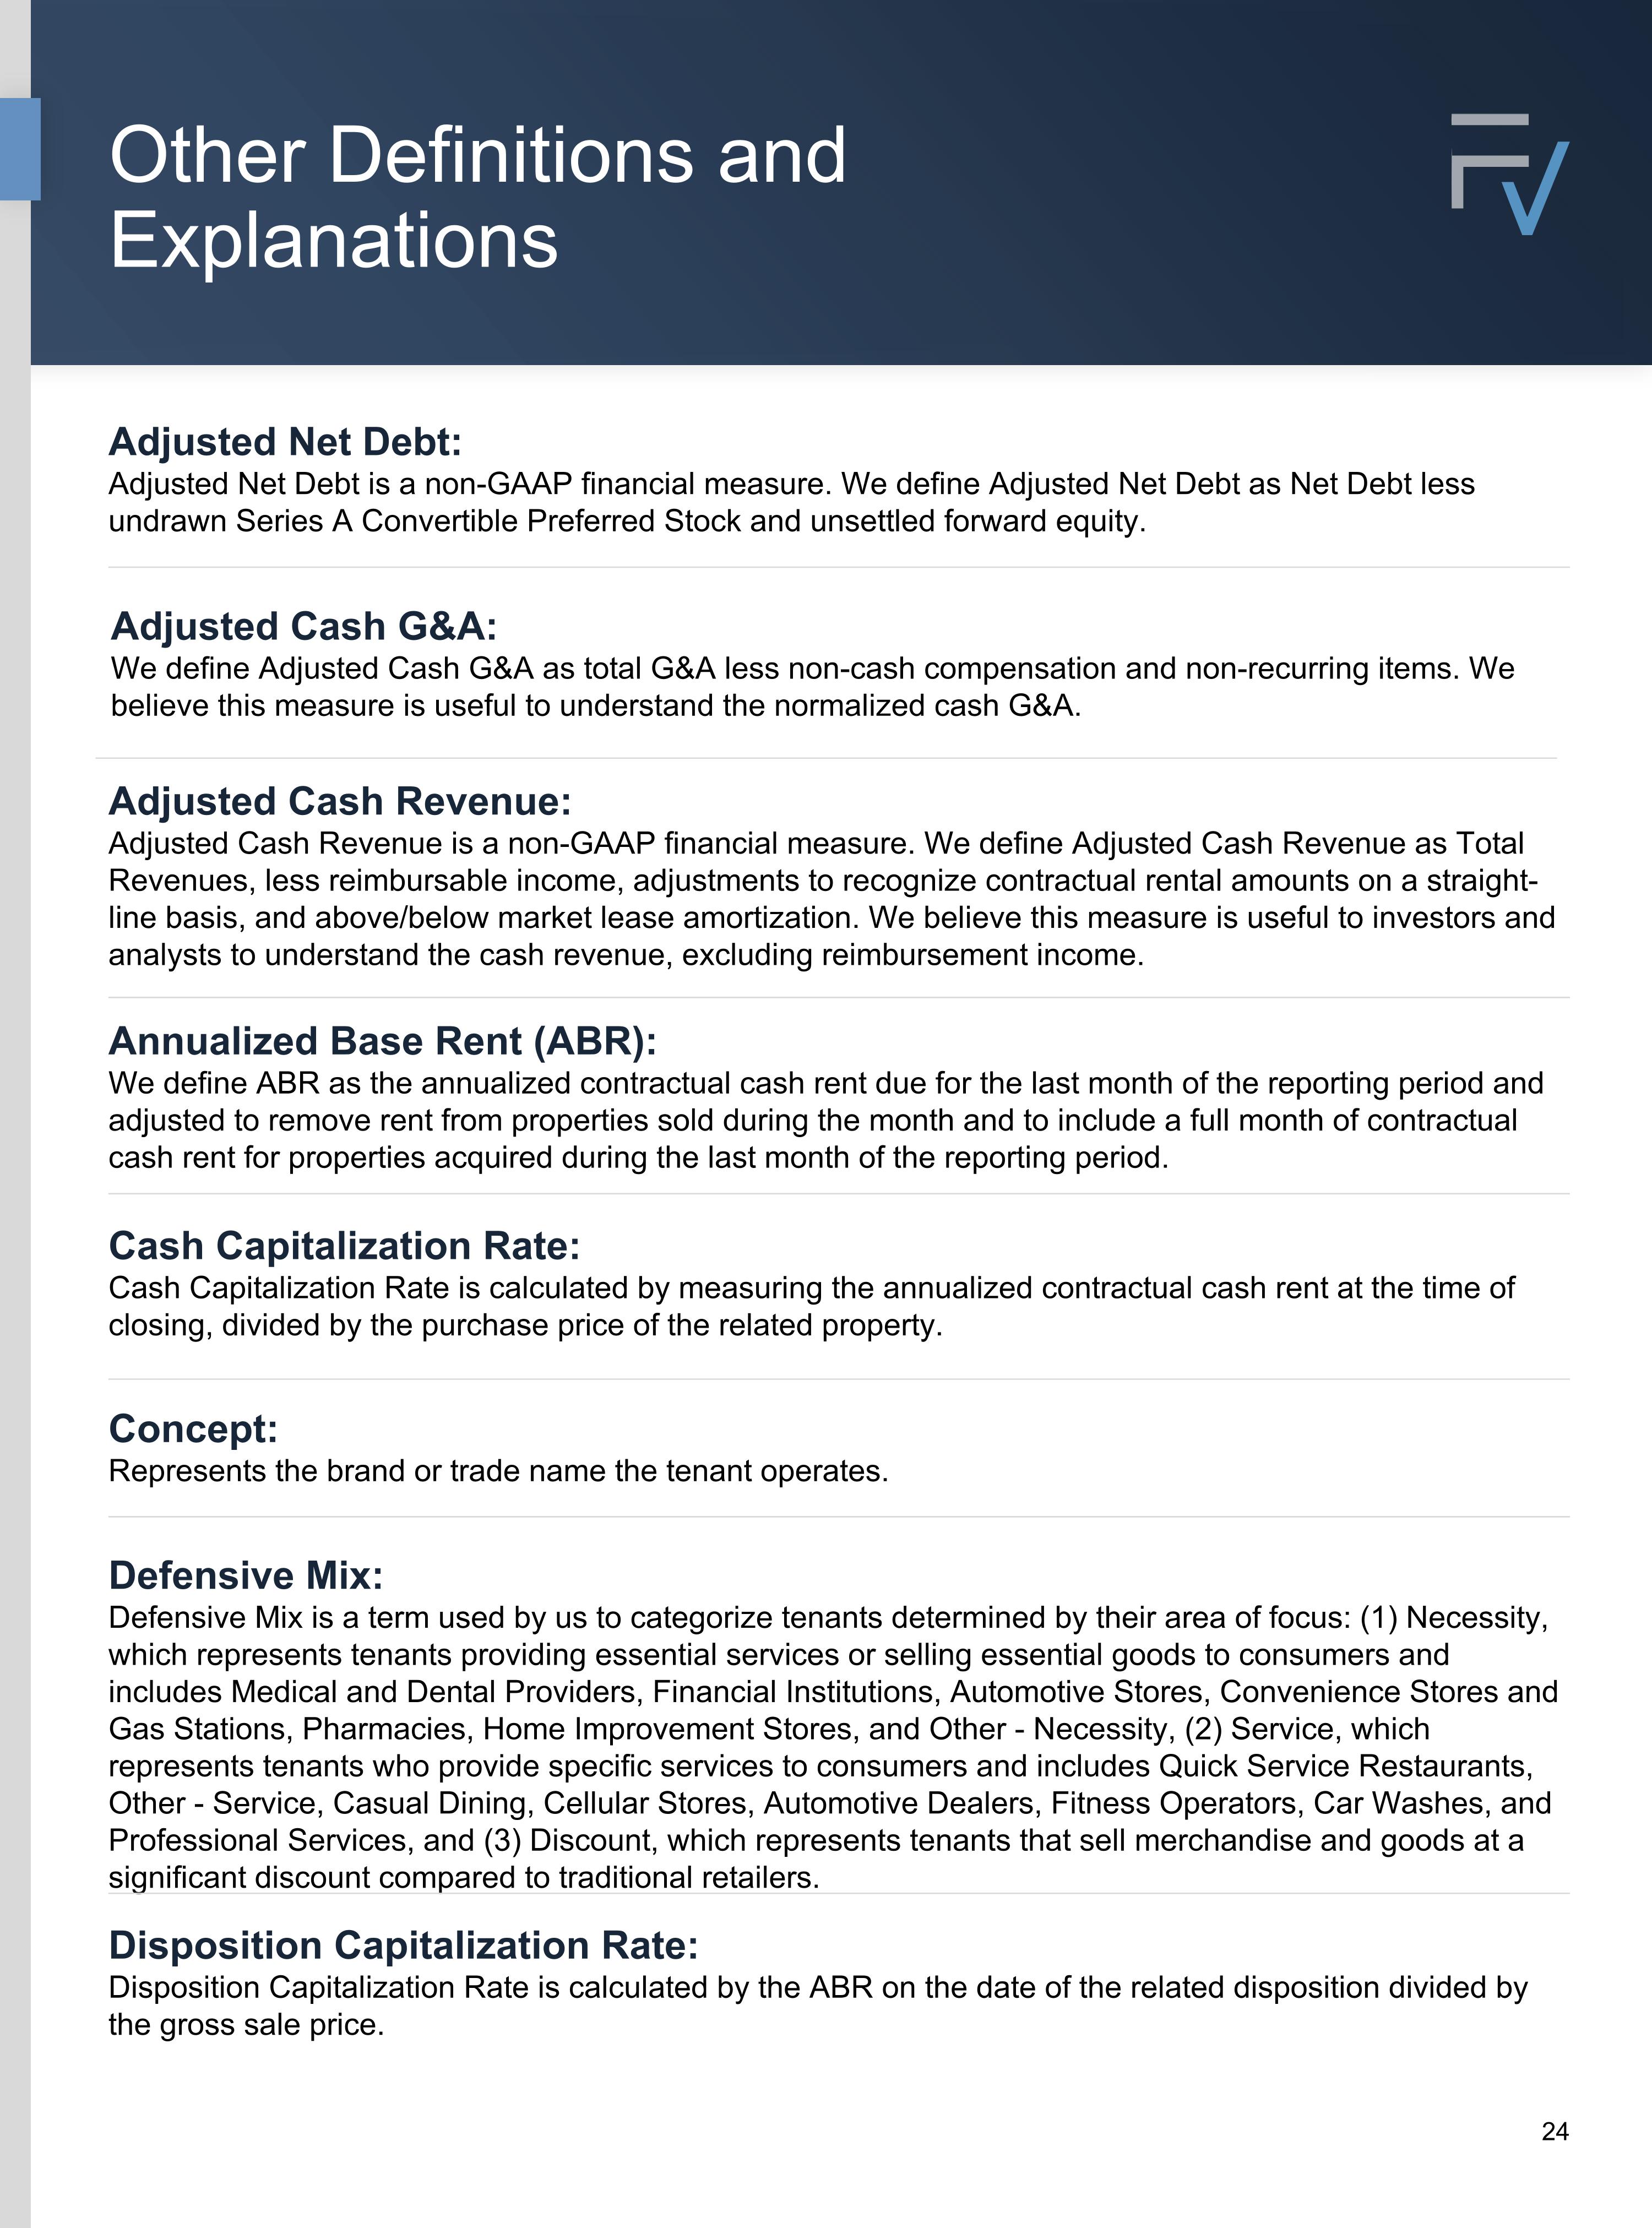
Other Definitions and Explanations Cash Capitalization Rate: Cash Capitalization Rate is calculated by measuring the annualized contractual cash rent at the time of closing, divided by the purchase price of the related property. Concept: Represents the brand or trade name the tenant operates. Disposition Capitalization Rate: Disposition Capitalization Rate is calculated by the ABR on the date of the related disposition divided by the gross sale price. Defensive Mix: Defensive Mix is a term used by us to categorize tenants determined by their area of focus: (1) Necessity, which represents tenants providing essential services or selling essential goods to consumers and includes Medical and Dental Providers, Financial Institutions, Automotive Stores, Convenience Stores and Gas Stations, Pharmacies, Home Improvement Stores, and Other - Necessity, (2) Service, which represents tenants who provide specific services to consumers and includes Quick Service Restaurants, Other - Service, Casual Dining, Cellular Stores, Automotive Dealers, Fitness Operators, Car Washes, and Professional Services, and (3) Discount, which represents tenants that sell merchandise and goods at a significant discount compared to traditional retailers. Annualized Base Rent (ABR): We define ABR as the annualized contractual cash rent due for the last month of the reporting period and adjusted to remove rent from properties sold during the month and to include a full month of contractual cash rent for properties acquired during the last month of the reporting period. Adjusted Net Debt: Adjusted Net Debt is a non-GAAP financial measure. We define Adjusted Net Debt as Net Debt less undrawn Series A Convertible Preferred Stock and unsettled forward equity. Adjusted Cash Revenue: Adjusted Cash Revenue is a non-GAAP financial measure. We define Adjusted Cash Revenue as Total Revenues, less reimbursable income, adjustments to recognize contractual rental amounts on a straight-line basis, and above/below market lease amortization. We believe this measure is useful to investors and analysts to understand the cash revenue, excluding reimbursement income. Adjusted Cash G&A: We define Adjusted Cash G&A as total G&A less non-cash compensation and non-recurring items. We believe this measure is useful to understand the normalized cash G&A.
Other Definitions and Explanations (Continued) WALT: WALT represents the remaining average lease term of our leases, weighted by rent, and excluding lease renewal options and investments in mortgage loans. Purchase Price: Purchase Price is represented by the contractual acquisition price of the related property, excluding any transaction costs or other capital expenditures. Tenant: Tenant represents the legal entity responsible for fulfilling obligations under the lease agreement. Gross Debt: We define Gross Debt as total debt, net plus debt issuance costs and original issuance discount. Net Debt: Net Debt is a non-GAAP financial measure. We define Net Debt as our Gross Debt less cash and cash equivalents. Occupancy: Occupancy or a specified percentage of our portfolio that is “occupied” or “leased” means as of a specified date (i) the number of properties that are subject to a signed lease divided by (ii) the total number of properties in our portfolio. Secured Overnight Financing Rate (SOFR): We define SOFR as the current one-month term SOFR. GAAP: GAAP is the Generally Accepted Accounting Principles in the United States. Economic Yield: Economic Yield is defined as the sum of contractual fixed annual rents computed on a straight-line basis over the primary lease terms, divided by the purchase price.
Forward-Looking and Cautionary Statements IP Disclaimer This document contains references to copyrights, trademarks, trade names, and service marks that belong to other companies. FrontView REIT, Inc. is not affiliated or associated with, and is not endorsed by and does not endorse, such companies or their products or services. This presentation contains forward-looking statements, which reflect our current views regarding our business, financial performance, growth prospects and strategies, market opportunities, and market trends. Forward-looking statements include all statements that are not historical facts. In some cases, you can identify these forward-looking statements by the use of words such as “outlook,” “believes,” “expects,” “potential,” “continues,” “may,” “will,” “should,” “could,” “would be,” “seeks,” “approximately,” “projects,” “predicts,” “intends,” “plans,” “estimates,” “anticipates,” or the negative version of these words or other comparable words. All of the forward-looking statements herein are subject to various risks and uncertainties. Assumptions relating to the foregoing involve judgments with respect to, among other things, future economic, competitive and market conditions, and future business decisions, all of which are difficult or impossible to predict accurately and many of which are beyond our control. Although we believe that the expectations reflected in such forward-looking statements are based on reasonable assumptions, our actual results, performance, and achievements could differ materially from those expressed in or by the forward-looking statements and may be affected by a variety of risks and other factors. Accordingly, there are or will be important factors that could cause actual outcomes or results to differ materially from such forward-looking statements. These factors include, but are not limited to, risks and uncertainties related to general economic conditions, including but not limited to increases in the rate of inflation and/or interest rates, local real estate conditions, tenant financial health, and property acquisitions and the timing of these investments and acquisitions. These and other risks, assumptions, and uncertainties are described in our filings with the SEC, which are available on the SEC’s website at www.sec.gov. You are cautioned not to place undue reliance on any forward-looking statements included herein. All forward-looking statements are made as of the date of this document and the risk that actual results, performance, and achievements will differ materially from the expectations expressed or referenced herein will increase with the passage of time. We undertake no obligation to publicly update or review any forward-looking statement, whether as a result of new information, future developments, or otherwise, except as required by law. Forward Looking Statements This data and other information described herein are as of and for the three and nine months ended September 30, 2026, unless otherwise indicated. Future performance may not be consistent with past performance and is subject to change, involving inherent risks and uncertainties. This information should be read in conjunction with FrontView’s Annual Report on Form 10-K as of and for the year ended December 31, 2025 and Form 10-Q for the period ended September 30, 2026, including the financial statements and the management’s discussion and analysis of financial condition and results of operations sections. About the Data