The bar chart and accompanying table shown below provide an indication of the risks of investing in the Fund. The bar chart shows the total return of the Fund’s Class A shares for each of the last ten full calendar years. Although Class C and Class I shares have similar annual returns to Class A shares because the classes are invested in the same portfolio of securities, the returns for Class C and Class I shares are different from Class A shares because Class C and Class I shares have different expenses than Class A shares. The performance table shows how the average annual total returns for Class A, Class C and Class I shares compare over time with those of a broad-based market index and the Benchmark. Sales charges are reflected in the information shown below in the table, but the information shown in the bar chart does not reflect sales charges, and, if it did, returns would be lower. How the Fund has performed in the past (before and after taxes) is not necessarily an indication of how it will perform in the future. Updated performance information and daily NAV is available at no cost by calling 1-866-447-4228 and on the Fund’s website at www.CatalystMF.com.
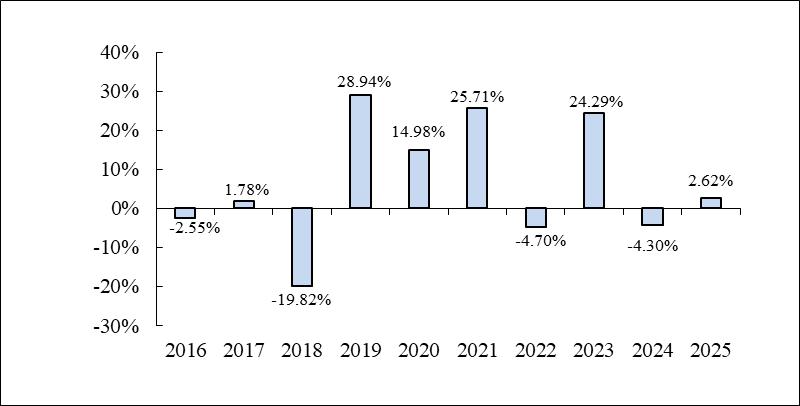
During the period shown in the bar chart, the highest return for a quarter was 14.20% (quarter June 30, 2023), and the lowest return for a quarter was (13.42)% (quarter ended December 31, 2018). The Class A shares’ year-to-date return as of September 30, 2026 was 6.84%.
| 1 Year | 5 Year | 10 Year | |
| Class A | |||
| Return Before Taxes | (3.26)% | 6.62% | 4.97% |
| Return After Taxes on Distributions | (3.48)% | 4.75% | 3.23% |
| Return After Taxes on Distributions and Sale of Fund Shares | (1.94)% | 4.34% | 3.08% |
| Class C | |||
| Return Before Taxes | 1.84% | 7.09% | 4.77% |
| Class I | |||
| Return Before Taxes | 2.95% | 8.15% | 5.84% |
| S&P 500 Index (reflects no deduction for fees, expenses or taxes)* | 17.88% | 14.42% | 14.82% |
| BNP Paribas Catalyst Systematic Alpha Index III (reflects no deduction for fees, expenses or taxes)** | 0.36% | 11.00% | 17.05% |
| * | The S&P 500 Index is the total return index. This index differs from the “S&P 500” price index by including the contribution of dividends to total return. | |
| ** | The BNP Paribas Catalyst Systematic Alpha Index III (the “Benchmark”) was established on November 3, 2024. The index provider has produced historical returns for the Benchmark for periods prior to November 3, 2024 by applying the Benchmark methodology and protocols to historical market data. While believed to be reliable, performance data prior to November 3, 2024 should be considered hypothetical and, consequently, less pertinent for investors when evaluating the Fund’s performance. |
After-tax returns are calculated using the highest historical individual federal marginal income tax rate and do not reflect the impact of state and local taxes. Actual after-tax returns depend on a shareholder’s tax situation and may differ from those shown. After-tax returns are not relevant for shareholders who hold Fund shares in tax-deferred accounts or to shares held by non-taxable entities. After-tax returns are only shown for Class A shares. After-tax returns for other share classes will vary.
The bar chart and accompanying table shown below provide an indication of the risks of investing in the Fund. The bar chart shows the total return of the Fund’s Class A shares for each of the last ten full calendar years. Although Class Cand Class I shares have similar annual returns to Class A shares because the classes are invested in the same portfolio of securities, the returns for Class Cand Class I shares are different from Class A shares because Class C and Class I shares have different expenses than Class A shares. The performance table shows how the average annual total returns for Class A, Class C and Class I shares compare over time with those of a broad-based market index. Sales charges are reflected in the information shown below in the table, but the information shown in the bar chart does not reflect sales charges, and, if it did, returns would be lower.
The Fund acquired all of the assets and liabilities of Harbor Assets, LLC (the “Predecessor Fund”) in a tax-free reorganization on August 30, 2013 (the “Reorganization”). In connection with the Reorganization, shares of the Predecessor Fund were exchanged for Class A shares of the Fund. Prior to November 1, 2025, the Fund was managed by a sub-advisor with different investment strategies and policies. The performance data below for periods prior to November 1, 2025 reflects a different sub-advisor with a different investment strategy. Consequently, the performance record may be less pertinent for investors considering whether to purchase shares of the Fund. The Fund’s performance may have been different if the Fund’s portfolio was managed under the current investment objective, strategies and policies.
Fund performance was materially impacted by a nonrecurring litigation settlement of $1.96 million booked to the Fund on June 19, 2023. The positive impact was $0.1482/share, or 1.65% of the Fund’s NAV.
How the Fund has performed in the past (before and after taxes) is not necessarily an indication of how it will perform in the future.
Updated performance information and daily NAV is available at no cost by calling 1-866-447-4228 and on the Fund’s website at www.CatalystMF.com.
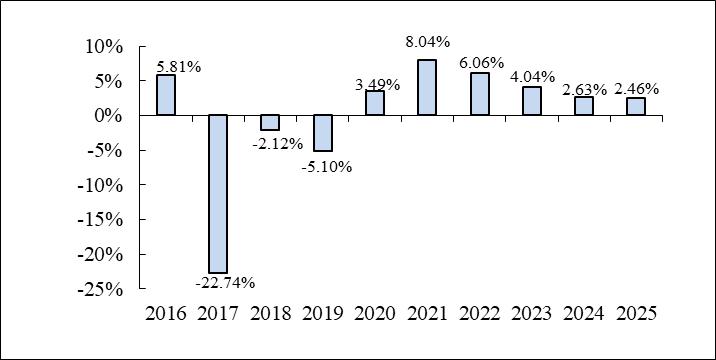
During the period shown in the bar chart, the highest return for a quarter was 6.22% (quarter ended September 30. 2016), and the lowest return for a quarter was (16.96)% (quarter ended March 31, 2017). The Class A shares year-to-date return as of September 30, 2026 was 10.12%.
| 1 Year | 5 Years | 10 Years | |
| Class A | |||
| Return Before Taxes | (3.42)% | 3.39% | (0.74)% |
| Return After Taxes on Distributions | (4.32)% | 2.83% | (1.30)% |
| Return After Taxes on Distributions and Sale of Fund Shares | (2.03)% | 2.38% | (0.72)% |
| Class C | |||
| Return Before Taxes | 1.78% | 3.86% | (0.88)% |
| Class I | |||
| Return Before Taxes | 2.69% | 4.91% | 0.11% |
| S&P 500 Index (reflects no deduction for fees, expenses or taxes) | 17.88% | 14.42% | 14.82% |
After-tax returns for the Fund are calculated using the highest historical individual federal marginal income tax rate and do not reflect the impact of state and local taxes. Actual after-tax returns depend on a shareholder’s tax situation and may differ from those shown. After-tax returns are not relevant for shareholders who hold Fund shares in tax-deferred accounts or to shares held by non-taxable entities. After-tax returns are only shown for Class A shares. After-tax returns for other share classes will vary.
The bar chart and accompanying table shown below provide an indication of the risks of investing in the Fund. The bar chart shows performance of the Fund’s Class I shares for each of the last ten full calendar years. Although Class A and Class C shares have similar annual returns to Class I shares because the classes are invested in the same portfolio of securities, the returns for Class A shares and Class C shares are different than Class I shares because Class A and Class C shares have different expenses than Class I shares. The performance table shows how the average annual total returns for Class I, Class A and Class C shares compare over time with those of a broad-based market index.
The Fund acquired all of the assets and liabilities of Exceed Defined Shield Index Fund, a series of Forum Funds, (the “Predecessor Fund”) in a tax-free reorganization on September 1, 2017 (the “Reorganization”). In connection with this Reorganization, shares of the Predecessor Fund’s Investor Shares and Institutional Shares were exchanged for Class A shares and Class I shares of the Fund, respectively. The Predecessor Fund had an investment objective and strategies that were, in all material respects, the same as those of the Fund, and was managed in a manner that, in all material respects, complied with the investment guidelines and restrictions of the Fund. The performance information set forth below for periods prior to September 1, 2017 reflects the historical performance of the Predecessor Fund shares. Neither Investor Class nor Institutional Class shares of the Predecessor Fund charged a sales load and, therefore, the impact of a sales load is not reflected in the Fund’s performance for the periods prior to September 1, 2017. Additionally, because the 1 Year Average Annual Total Returns assume investment in the Fund on December 31, 2016, which was prior to the Reorganization, the impact of a sales load is not reflected in the performance information provided.
How the Fund has performed in the past (before and after taxes) is not necessarily an indication of how it will perform in the future.
Updated performance information is available at no cost by calling 1-866-447-4228 and on the Fund’s website at www.CatalystMF.com.
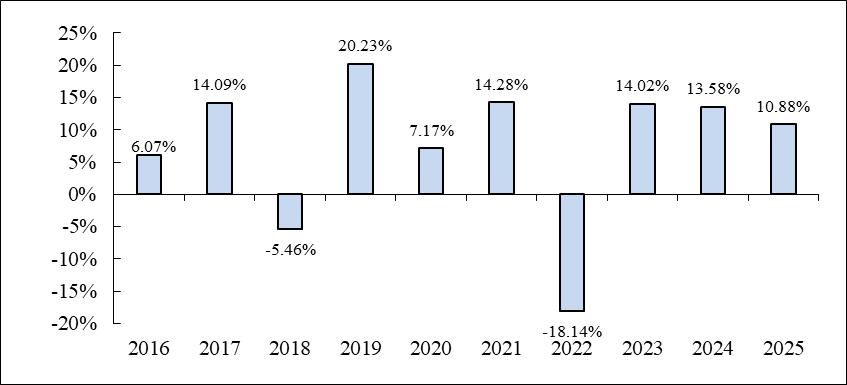
During the period shown in the bar chart, the highest return for a quarter was 9.68% (quarter ended March 31, 2019), and the lowest return for a quarter was (11.45)% (quarter ended December 31, 2018). The Fund’s Class I year-to-date return as of September 30, 2026 was 5.61%.
| 1 Year | 5 Year | 10 Year | |
| Class I | |||
| Return Before Taxes | 10.88% | 6.08% | 7.07% |
| Return After Taxes on Distributions | 9.55% | 3.98% | 4.64% |
| Return After Taxes on Distributions and Sale of Fund Shares | 6.44% | 3.74% | 4.38% |
| Class A | |||
| Return Before Taxes | 4.24% | 4.57% | 6.19% |
| S&P 500 Index (reflects no deduction for fees, expenses or taxes) | 17.88% | 14.42% | 14.82% |
| 1 Year | 5 Year | Since inception (9/5/2017) | |
| Class C | |||
| Return Before Taxes | 9.70% | 5.02% | 5.82% |
| S&P 500 Index (reflects no deduction for fees, expenses or taxes) | 17.88% | 14.42% | 14.99% |
After-tax returns for the Fund are calculated using the highest historical individual federal marginal income tax rate and do not reflect the impact of state and local taxes. Actual after-tax returns depend on a shareholder’s tax situation and may differ from those shown. After-tax returns are not relevant for shareholders who hold Fund shares in tax-deferred accounts or to shares held by non-taxable entities. After-tax returns are only shown for Class I shares. After-tax returns for other share classes will vary.
The bar chart and accompanying table shown below provide an indication of the risks of investing in the Fund. The bar chart shows performance of the Fund’s Class I shares for each of the last ten full calendar years. Although Class A, C and Class C-1 shares have similar annual returns to Class I shares because the classes are invested in the same portfolio of securities, the returns for Class A, Class C and Class C-1 shares are different from Class I shares because Class A, Class C and Class C-1 shares have different expenses than Class I shares. The performance table shows how the average annual total returns for Class I, Class A, Class C and Class C-1 shares compared over time with those of a broad-based market index, a supplemental index, as well as a hedge fund index comprised of funds with similar objectives as the Fund and a treasury bill index.
How the Fund has performed in the past (before and after taxes) is not necessarily an indication of how it will perform in the future.
Updated performance information and daily NAV is available at no cost by calling 1-866-447-4228 and on the Fund’s website at www.CatalystMF.com.
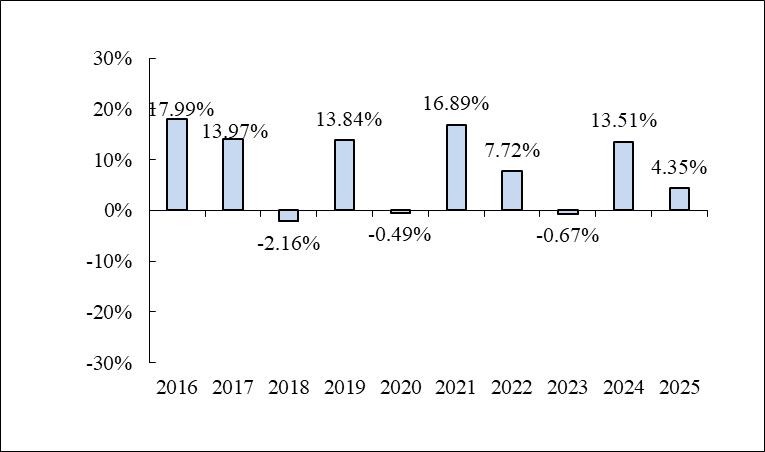
During the period shown in the bar chart, the highest return for a quarter was 12.20% (quarter ended June 30, 2020), and the lowest return for a quarter was (23.74)% (quarter ended March 31, 2020). The Fund’s Class I year-to-date return as of September 30, 2026 was 19.67%.
| 1 Year | 5 Year | 10 Year* | |
| Class I | |||
| Return Before Taxes | 4.35% | 8.18% | 8.24% |
| Return After Taxes on Distributions** | 4.35% | 7.23% | 7.07% |
| Return After Taxes on Distributions and Sale of Fund Shares** | 2.58% | 6.05% | 6.13% |
| Class A | |||
| Return Before Taxes | (1.86)% | 6.65% | 7.35% |
| Class C | |||
| Return Before Taxes | 3.36% | 7.11% | 7.17% |
| 1 Year | 5 Year | Since Inception* (10/30/2020) | |
| Class C-1 | |||
| Return Before Taxes | 3.33% | 7.11% | 9.70% |
| S&P 500 Index (reflects no deduction for fees, expenses or taxes) | 17.88% | 14.42% | 14.82% (10 Year) 17.08% (Since 10/30/2020) |
| BofA Merrill Lynch 3-Month U.S. Treasury Bill Index (reflects no deduction for fees, expenses or taxes) | 4.21% | 3.19% | 2.19% (10 Year) 3.09% (Since 10/30/2020) |
| Credit Suisse Managed Futures Index (reflects no deduction for fees, expenses or taxes) | 2.26% | 5.68% | 2.77% (10 Year) 6.69% (Since 10/30/2020) |
| MSCI ACWI Net (USD) Index (reflects no deduction for fees, expenses or taxes) | 22.34% | 11.19 | 11.72% (10 Year) 14.32% (Since 10/30/2020) |
| * | Includes the effect of performance fees paid by the investors of the Predecessor Fund. |
| ** | After-Tax Returns for Class I shares are for the period beginning December 29, 2015. As a result of the different tax treatment of the Predecessor Fund, we are unable to show the after-tax returns for the Predecessor Fund. The Predecessor Fund did not have a distribution policy. It was an unregistered limited liability partnership, did not qualify as a regulated investment company for federal income tax purposes, and it did not pay dividends and distributions. After-tax returns shown are a blend of after-tax returns from December 29, 2015 and returns before taxes for preceding periods. |
After-tax returns are calculated using the highest historical individual federal marginal income tax rate and do not reflect the impact of state and local taxes. Actual after-tax returns depend on a shareholder’s tax situation and may differ from those shown. After-tax returns are not relevant for shareholders who hold Fund shares in tax-deferred accounts or to shares held by non-taxable entities. After-tax returns are only shown for Class I shares. After-tax returns for other share classes will vary.
The bar chart and accompanying table shown below provides an indication of the risks of investing in the Fund. The bar chart shows the total return of its Class A shares for each of the last ten full calendar years. Although Class C and Class I shares have similar annual returns to Class A shares because the classes are invested in the same portfolio of securities, the returns for Class C and Class I shares are different from Class A shares because Class C and Class I shares have different expenses than Class A shares. The performance table shows how the average annual total returns for Class A, Class C and Class I shares compare over time with those of a broad-based market index and a supplemental index. Sales charges are reflected in the information shown below in the table, but the information shown in the bar chart does not reflect sales charges, and, if it did, returns would be lower. The Fund’s investment strategy changed on November 1, 2026. The performance data below for periods prior to November 1, 2026 reflects a different investment strategy. Consequently, the performance record may be less pertinent for investors considering whether to purchase shares of the Fund. How the Fund has performed in the past (before and after taxes) is not necessarily an indication of how it will perform in the future.
Updated performance information and daily NAV is available at no cost by calling 1-866-447-4228 and on the Fund’s website at www.CatalystMF.com.
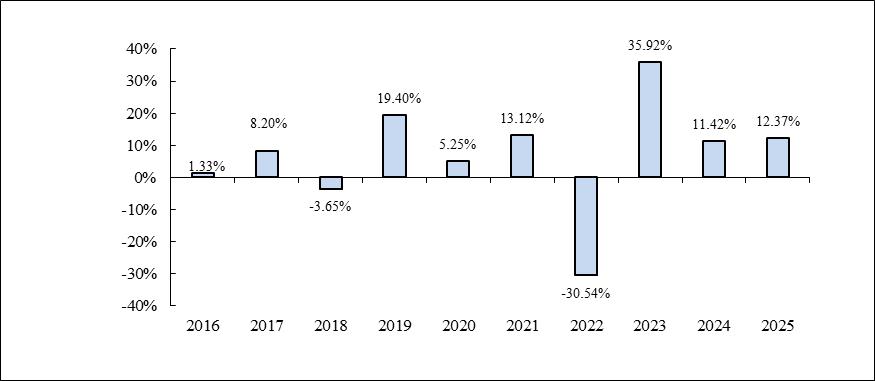
During the period shown in the bar chart, the highest return for a quarter was 16.11% (quarter ended June 30, 2025), and the lowest return for a quarter was (19.33)% (quarter ended June 30, 2022). The Class A shares year-to-date return as of September 30, 2026 was 15.52%.
| 1 Year | 5 Year | 10 Year | |
| Class A | |||
| Return Before Taxes | 5.89% | 4.73% | 5.28% |
| Return After Taxes on Distributions | 3.80% | 4.14% | 4.73% |
| Return After Taxes on Distributions and Sale of Fund Shares | 5.00% | 3.61% | 4.05% |
| Class C | |||
| Return Before Taxes | 11.57% | 5.19% | 5.09% |
| Class I | |||
| Return Before Taxes | 12.68% | 6.25% | 6.15% |
| S&P 500 Index (reflects no deduction for fees, expenses or taxes) | 17.88% | 14.42% | 14.82% |
| NASDAQ – 100 Total Return Index (reflects no deduction for fees, expenses or taxes) | 21.02% | 15.30% | 19.70% |
After-tax returns are calculated using the highest historical individual federal marginal income tax rate and do not reflect the impact of state and local taxes. Actual after-tax returns depend on a shareholder’s tax situation and may differ from those shown. After-tax returns are not relevant for shareholders who hold Fund shares in tax-deferred accounts or to shares held by non-taxable entities. After-tax returns are only shown for Class A shares. After-tax returns for other share classes will vary.
The bar chart and accompanying table shown below provide an indication of the risks of investing in the Fund. The bar chart shows the total returns of the Fund’s Class A shares for each full calendar year since the Fund’s inception. Although Class C and Class I shares have similar annual returns to Class A shares because the classes are invested in the same portfolio of securities, the returns for Class C and Class I shares are different from Class A shares because Class C and Class I shares have different expenses than Class A shares. The performance table shows the average annual total returns for Class A, Class C and Class I shares compared over time with those of a broad-based market index. Sales charges are reflected in the information shown below in the table, but the information shown in the bar chart does not reflect sales charges, and, if it did, returns would be lower.
How the Fund has performed in the past (before and after taxes) is not necessarily an indication of how it will perform in the future.
Updated performance information and daily NAV is available at no cost by calling 1-866-447-4228 and on the Fund’s website at www.CatalystMF.com.
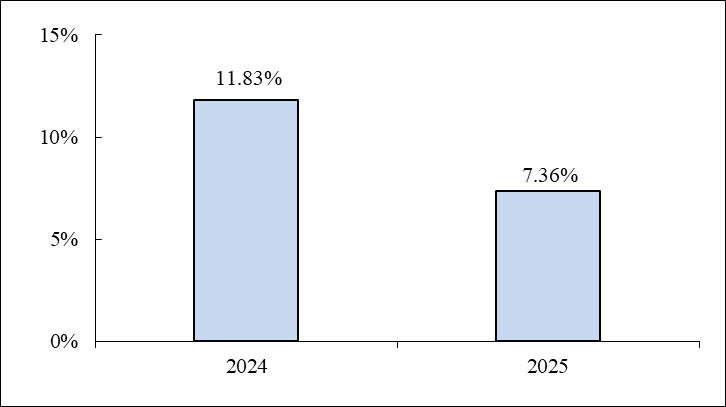
During the period shown in the bar chart, the highest return for a quarter was 17.90% (quarter ended March 31, 2024), and the lowest return for a quarter was (5.95)% (quarter ended March 31, 2025). The Class A shares year-to-date return as of September 30, 2026 was 17.83%.
| 1 Year | Since Inception (12/28/23) | |
| Class A | ||
| Return Before Taxes | 1.22% | 6.35% |
| Return After Taxes on Distributions | 0.66% | 3.62% |
| Return After Taxes on Distributions and Sale of Fund Shares | 1.12% | 4.03% |
| Class C | ||
| Return Before Taxes | 6.56% | 8.69% |
| Class I | ||
| Return Before Taxes | 7.65% | 9.80% |
| S&P 500 Index (reflects no deduction for fees, expenses or taxes) | 17.88% | 21.13% |
After-tax returns for the Fund are calculated using the highest historical individual federal marginal income tax rate and do not reflect the impact of state and local taxes. Actual after-tax returns depend on a shareholder’s tax situation and may differ from those shown. After-tax returns are not relevant for shareholders who hold Fund shares in tax-deferred accounts or to shares held by non-taxable entities. After-tax returns are shown for Class A shares only. After-tax returns for other share classes will vary.