(NASDAQ: IBCP) November 2026 Investor Conference
Cautionary note regarding forward-looking statements This presentation contains forward-looking statements, which are any statements or information that are not historical facts. These forward-looking statements include statements about our anticipated future revenue and expenses and our future plans and prospects. Forward-looking statements involve inherent risks and uncertainties, and important factors could cause actual results to differ materially from those anticipated. For example, deterioration in general business and economic conditions or turbulence in domestic or global financial markets could adversely affect our revenues and the values of our assets and liabilities, reduce the availability of funding to us, lead to a tightening of credit, and increase stock price volatility. Our results could also be adversely affected by changes in interest rates; increases in unemployment rates; deterioration in the credit quality of our loan portfolios or in the value of the collateral securing those loans; deterioration in the value of our investment securities; legal and regulatory developments; changes in customer behavior and preferences; breaches in data security; and management’s ability to effectively manage the multitude of risks facing our business. Key risk factors that could affect our future results are described in more detail in our Annual Report on Form 10-K for the year ended December 31, 2025 and the other reports we file with the SEC, including under the heading “Risk Factors.” Investors should not place undue reliance on forward-looking statements as a prediction of our future results. Any forward-looking statement speaks only as of the date on which it is made, and we undertake no obligation to update any forward-looking statement, whether as a result of new information, future events, or otherwise. 2 2
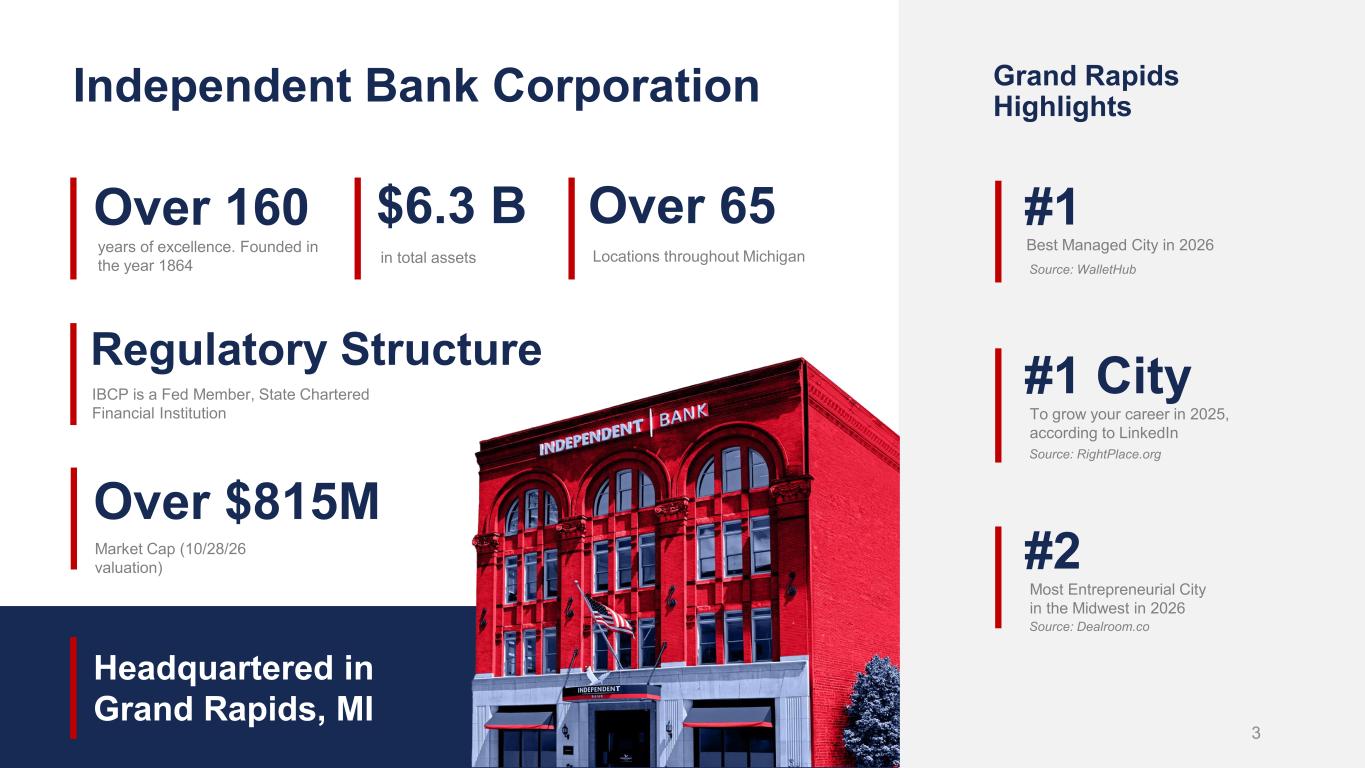
Independent Bank Corporation 3 years of excellence. Founded in the year 1864 $6.3 B in total assets Over 160 Over 65 Locations throughout Michigan IBCP is a Fed Member, State Chartered Financial Institution Regulatory Structure #1 Best Managed City in 2026 Over $815M Market Cap (10/28/26 valuation) #1 City To grow your career in 2025, according to LinkedIn #2 Most Entrepreneurial City in the Midwest in 2026 Source: Dealroom.co Headquartered in Grand Rapids, MI Grand Rapids Highlights Source: RightPlace.org Source: WalletHub
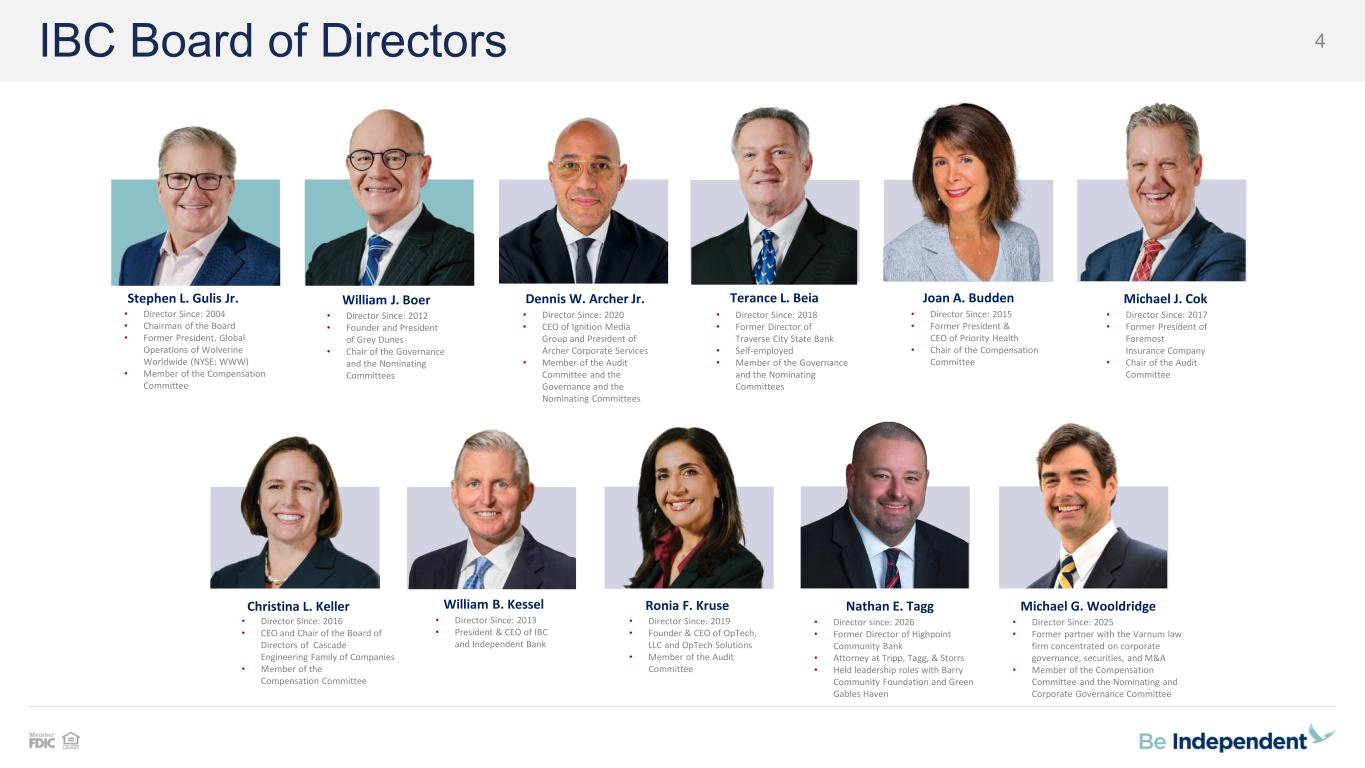
4IBC Board of Directors • Director Since: 2013 • President & CEO of IBC and Independent Bank • Director Since: 2019 • Founder & CEO of OpTech, LLC and OpTech Solutions • Member of the Audit Committee • Director Since: 2016 • CEO and Chair of the Board of Directors of Cascade Engineering Family of Companies • Member of the Compensation Committee • Director Since: 2004 • Chairman of the Board • Former President, Global Operations of Wolverine Worldwide (NYSE: WWW) • Member of the Compensation Committee • Director Since: 2017 • Former President of Foremost Insurance Company • Chair of the Audit Committee • Director Since: 2025 • Former partner with the Varnum law firm concentrated on corporate governance, securities, and M&A • Member of the Compensation Committee and the Nominating and Corporate Governance Committee • Director Since: 2015 • Former President & CEO of Priority Health • Chair of the Compensation Committee • Director Since: 2012 • Founder and President of Grey Dunes • Chair of the Governance and the Nominating Committees • Director Since: 2018 • Former Director of Traverse City State Bank • Self-employed • Member of the Governance and the Nominating Committees • Director Since: 2020 • CEO of Ignition Media Group and President of Archer Corporate Services • Member of the Audit Committee and the Governance and the Nominating Committees Michael J. CokStephen L. Gulis Jr. Christina L. Keller William B. Kessel Ronia F. Kruse Michael G. Wooldridge Dennis W. Archer Jr. Terance L. BeiaWilliam J. Boer Joan A. Budden • Director since: 2026 • Former Director of Highpoint Community Bank • Attorney at Tripp, Tagg, & Storrs • Held leadership roles with Barry Community Foundation and Green Gables Haven Nathan E. Tagg
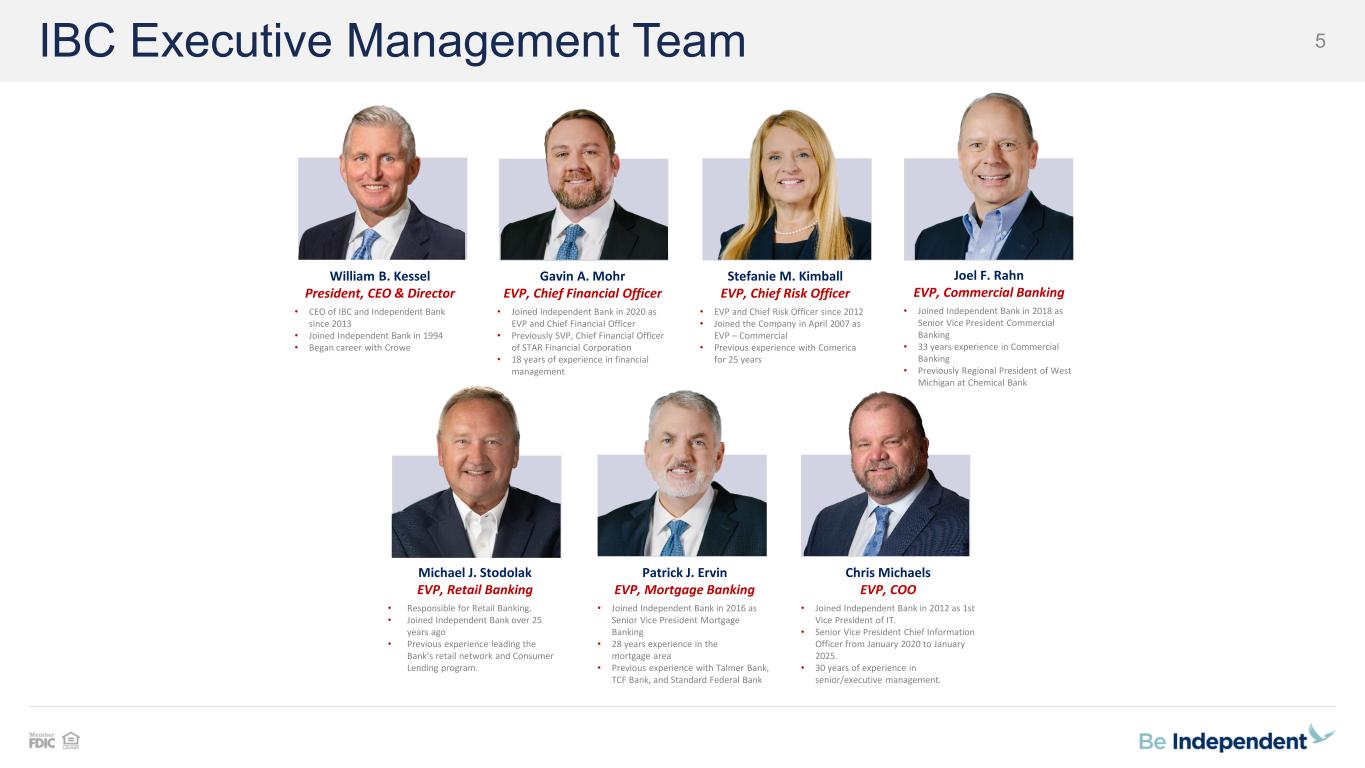
5IBC Executive Management Team • CEO of IBC and Independent Bank since 2013 • Joined Independent Bank in 1994 • Began career with Crowe William B. Kessel President, CEO & Director • Joined Independent Bank in 2020 as EVP and Chief Financial Officer • Previously SVP, Chief Financial Officer of STAR Financial Corporation • 18 years of experience in financial management Gavin A. Mohr EVP, Chief Financial Officer • EVP and Chief Risk Officer since 2012 • Joined the Company in April 2007 as EVP – Commercial • Previous experience with Comerica for 25 years Stefanie M. Kimball EVP, Chief Risk Officer • Joined Independent Bank in 2018 as Senior Vice President Commercial Banking • 33 years experience in Commercial Banking • Previously Regional President of West Michigan at Chemical Bank Joel F. Rahn EVP, Commercial Banking • Joined Independent Bank in 2016 as Senior Vice President Mortgage Banking • 28 years experience in the mortgage area • Previous experience with Talmer Bank, TCF Bank, and Standard Federal Bank Patrick J. Ervin EVP, Mortgage Banking • Joined Independent Bank in 2012 as 1st Vice President of IT. • Senior Vice President Chief Information Officer from January 2020 to January 2025. • 30 years of experience in senior/executive management. Chris Michaels EVP, COO • Responsible for Retail Banking. • Joined Independent Bank over 25 years ago • Previous experience leading the Bank’s retail network and Consumer Lending program. Michael J. Stodolak EVP, Retail Banking
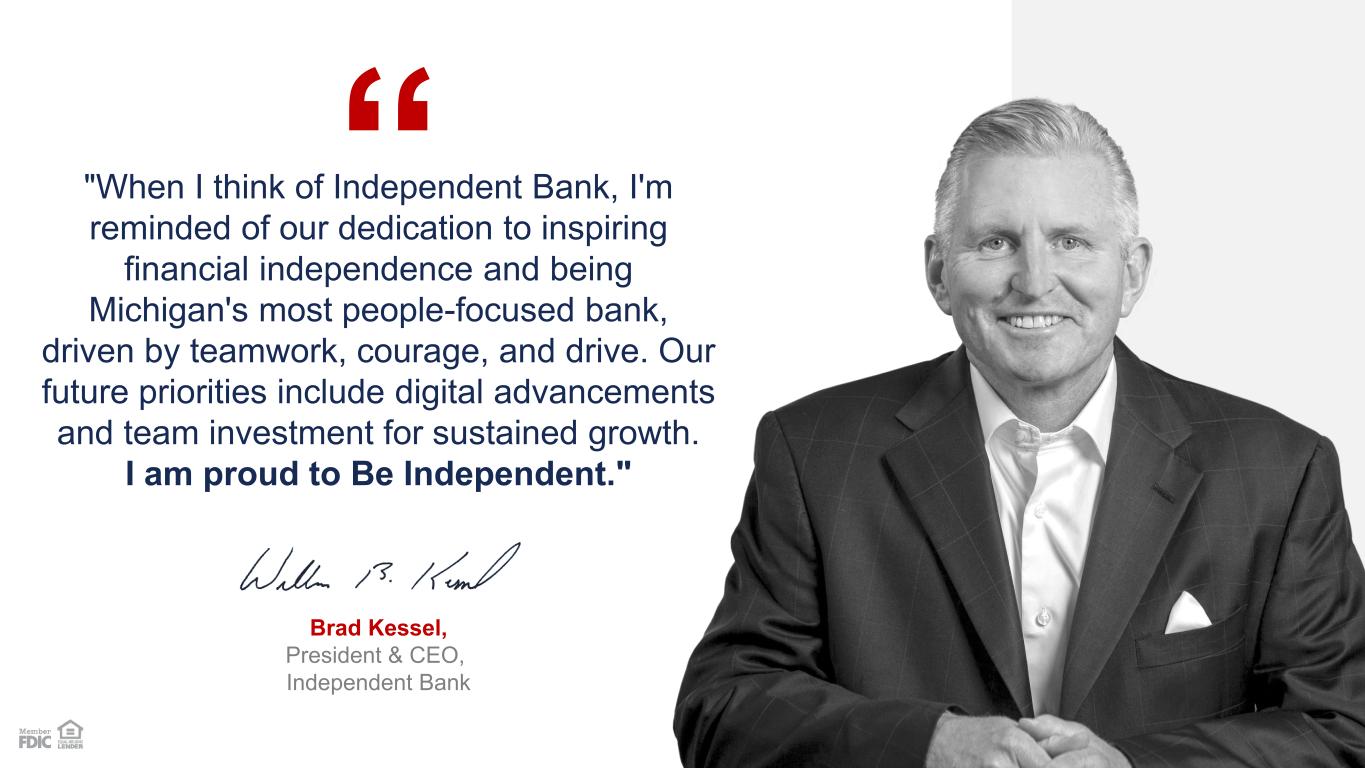
6 “"When I think of Independent Bank, I'm reminded of our dedication to inspiring financial independence and being Michigan's most people-focused bank, driven by teamwork, courage, and drive. Our future priorities include digital advancements and team investment for sustained growth. I am proud to Be Independent." Brad Kessel, President & CEO, Independent Bank

7
Franchise Overview and Growth Strategies
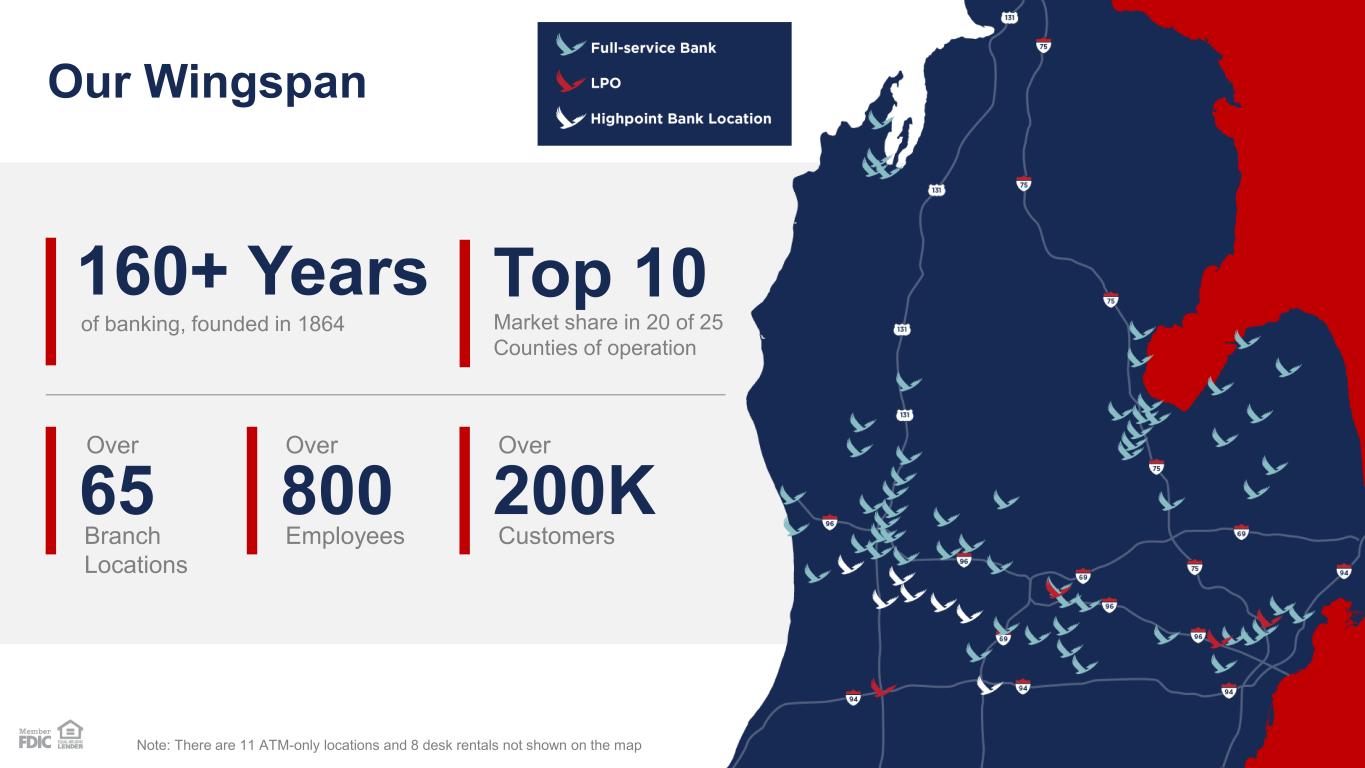
9 Our Wingspan 65 Branch Locations Over 800 Employees Over 200K Customers Top 10 Market share in 20 of 25 Counties of operation 160+ Years of banking, founded in 1864 Over Note: There are 11 ATM-only locations and 8 desk rentals not shown on the map
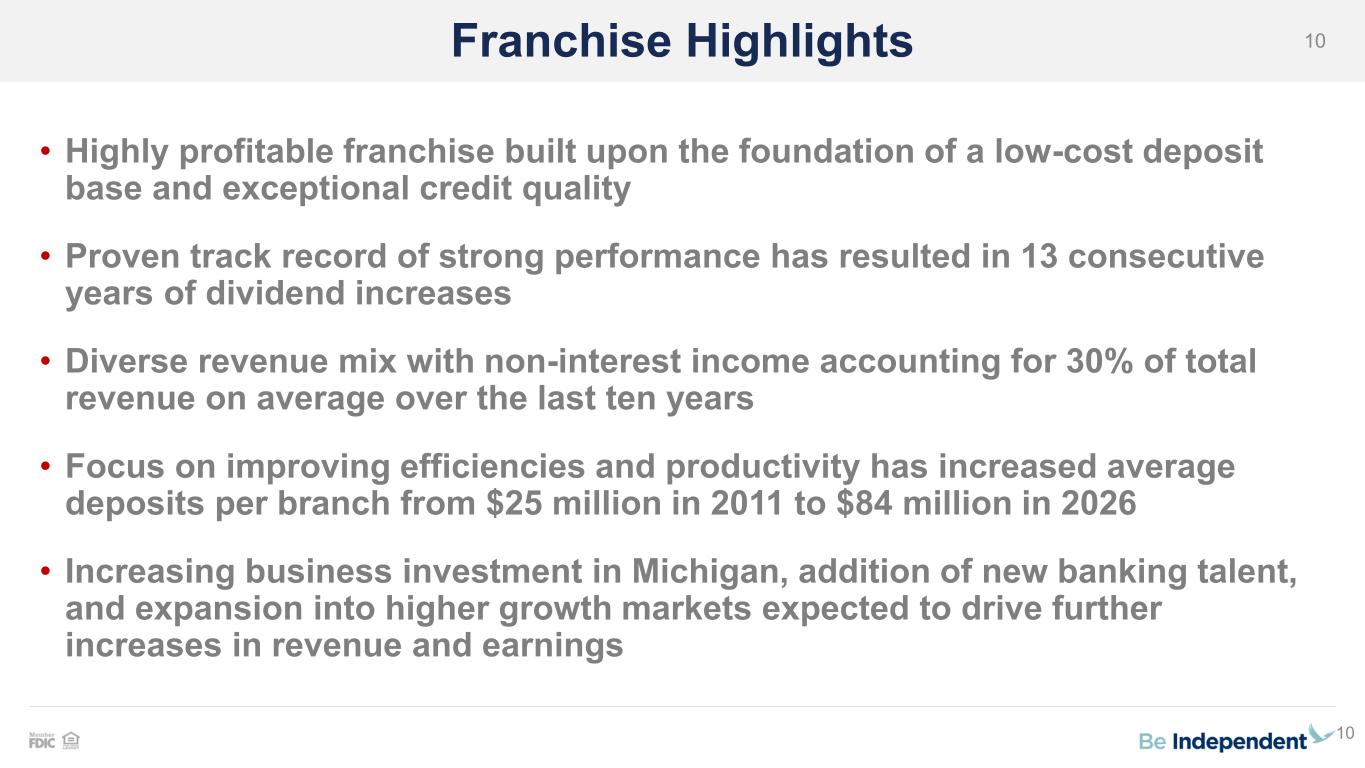
10Franchise Highlights • Highly profitable franchise built upon the foundation of a low-cost deposit base and exceptional credit quality • Proven track record of strong performance has resulted in 13 consecutive years of dividend increases • Diverse revenue mix with non-interest income accounting for 30% of total revenue on average over the last ten years • Focus on improving efficiencies and productivity has increased average deposits per branch from $25 million in 2011 to $84 million in 2026 • Increasing business investment in Michigan, addition of new banking talent, and expansion into higher growth markets expected to drive further increases in revenue and earnings 10
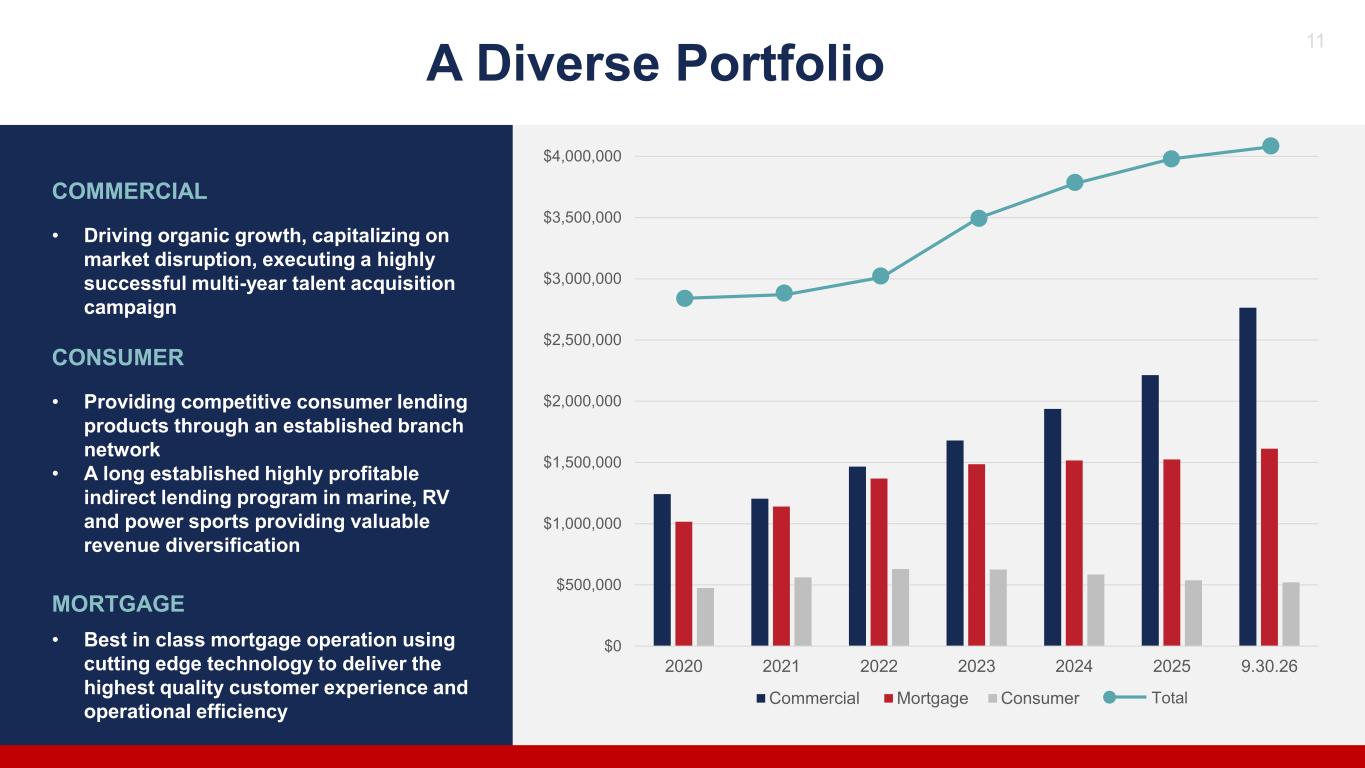
11 A Diverse Portfolio $0 $500,000 $1,000,000 $1,500,000 $2,000,000 $2,500,000 $3,000,000 $3,500,000 $4,000,000 2020 2021 2022 2023 2024 2025 9.30.26 Commercial Mortgage Consumer COMMERCIAL • Driving organic growth, capitalizing on market disruption, executing a highly successful multi-year talent acquisition campaign CONSUMER • Providing competitive consumer lending products through an established branch network • A long established highly profitable indirect lending program in marine, RV and power sports providing valuable revenue diversification MORTGAGE Total • Best in class mortgage operation using cutting edge technology to deliver the highest quality customer experience and operational efficiency
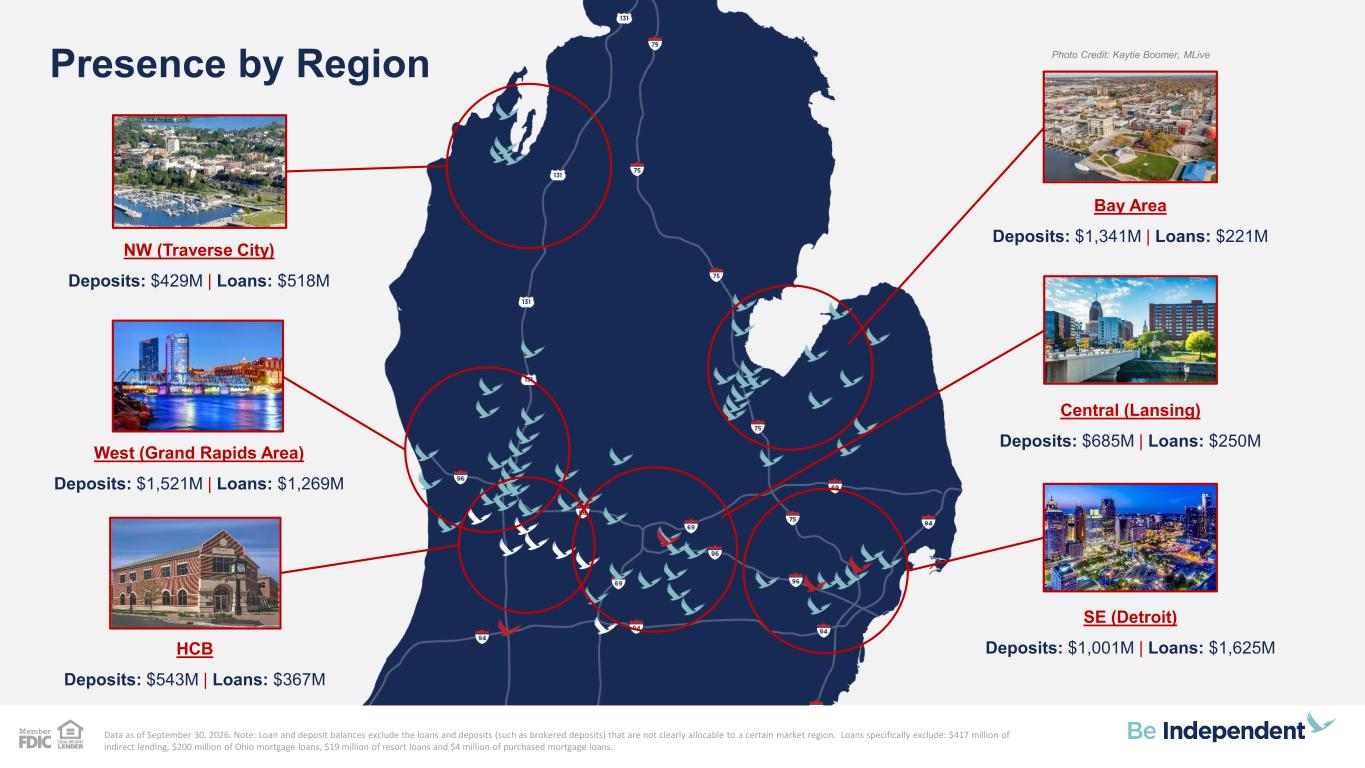
Data as of September 30, 2026. Note: Loan and deposit balances exclude the loans and deposits (such as brokered deposits) that are not clearly allocable to a certain market region. Loans specifically exclude: $417 million of indirect lending, $200 million of Ohio mortgage loans, $19 million of resort loans and $4 million of purchased mortgage loans. SE (Detroit) Deposits: $1,001M | Loans: $1,625M NW (Traverse City) Deposits: $429M | Loans: $518M Bay Area Deposits: $1,341M | Loans: $221M Central (Lansing) Deposits: $685M | Loans: $250M West (Grand Rapids Area) Deposits: $1,521M | Loans: $1,269M Presence by Region Photo Credit: Kaytie Boomer, MLive HCB Deposits: $543M | Loans: $367M
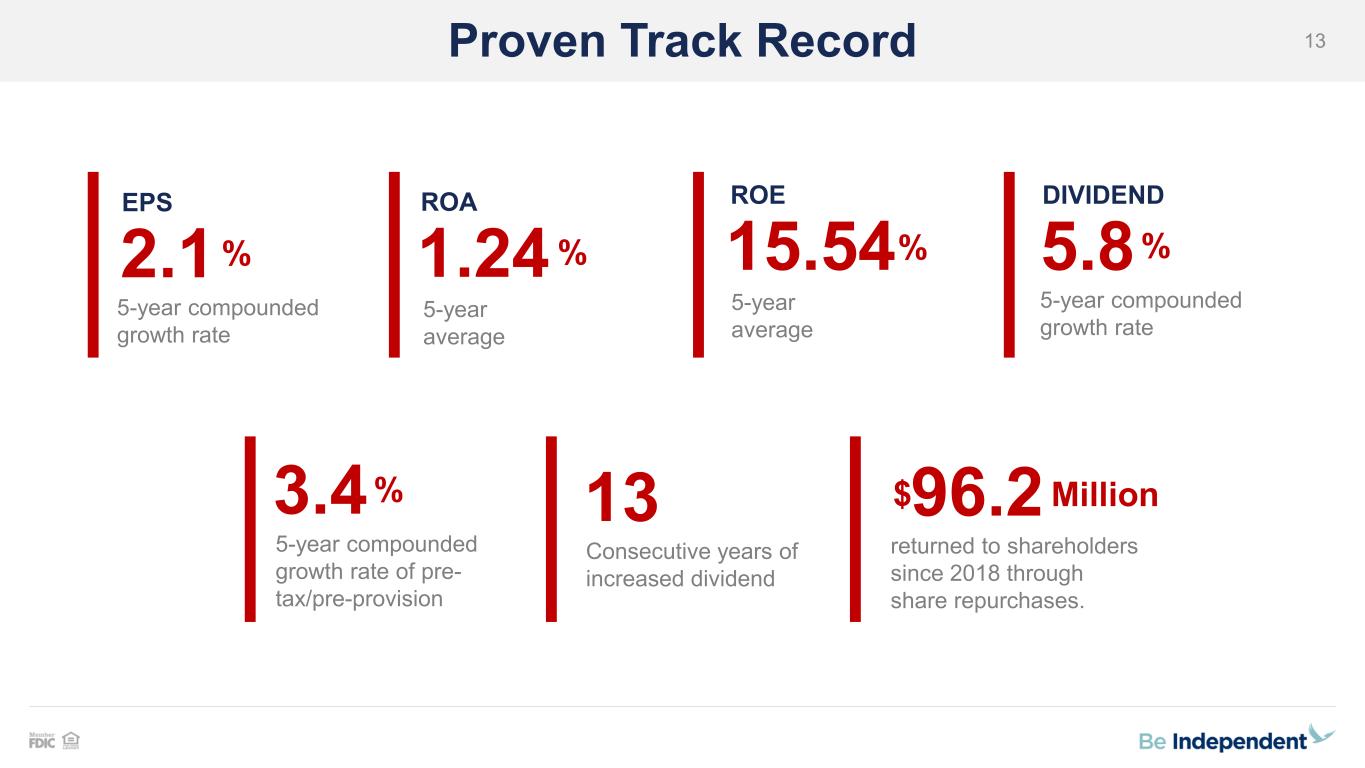
13Proven Track Record EPS 5-year compounded growth rate 2.1% ROA 5-year average 1.24 % ROE 5-year average 15.54% DIVIDEND 5.8% 5-year compounded growth rate 3.4% 5-year compounded growth rate of pre- tax/pre-provision 13 Consecutive years of increased dividend 96.2$ returned to shareholders since 2018 through share repurchases. Million
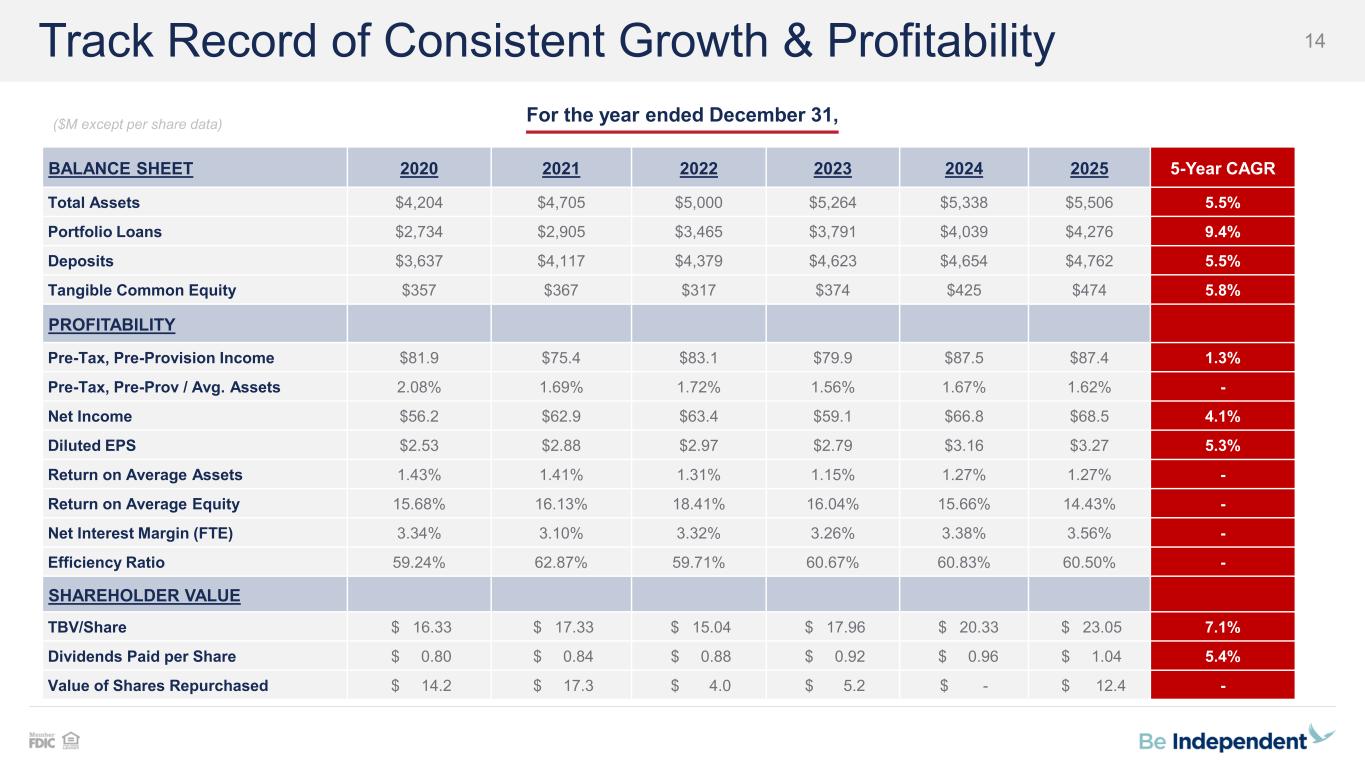
14Track Record of Consistent Growth & Profitability BALANCE SHEET 2020 2021 2022 2023 2024 2025 5-Year CAGR Total Assets $4,204 $4,705 $5,000 $5,264 $5,338 $5,506 5.5% Portfolio Loans $2,734 $2,905 $3,465 $3,791 $4,039 $4,276 9.4% Deposits $3,637 $4,117 $4,379 $4,623 $4,654 $4,762 5.5% Tangible Common Equity $357 $367 $317 $374 $425 $474 5.8% PROFITABILITY Pre-Tax, Pre-Provision Income $81.9 $75.4 $83.1 $79.9 $87.5 $87.4 1.3% Pre-Tax, Pre-Prov / Avg. Assets 2.08% 1.69% 1.72% 1.56% 1.67% 1.62% - Net Income $56.2 $62.9 $63.4 $59.1 $66.8 $68.5 4.1% Diluted EPS $2.53 $2.88 $2.97 $2.79 $3.16 $3.27 5.3% Return on Average Assets 1.43% 1.41% 1.31% 1.15% 1.27% 1.27% - Return on Average Equity 15.68% 16.13% 18.41% 16.04% 15.66% 14.43% - Net Interest Margin (FTE) 3.34% 3.10% 3.32% 3.26% 3.38% 3.56% - Efficiency Ratio 59.24% 62.87% 59.71% 60.67% 60.83% 60.50% - SHAREHOLDER VALUE TBV/Share $ 16.33 $ 17.33 $ 15.04 $ 17.96 $ 20.33 $ 23.05 7.1% Dividends Paid per Share $ 0.80 $ 0.84 $ 0.88 $ 0.92 $ 0.96 $ 1.04 5.4% Value of Shares Repurchased $ 14.2 $ 17.3 $ 4.0 $ 5.2 $ - $ 12.4 - For the year ended December 31, ($M except per share data)
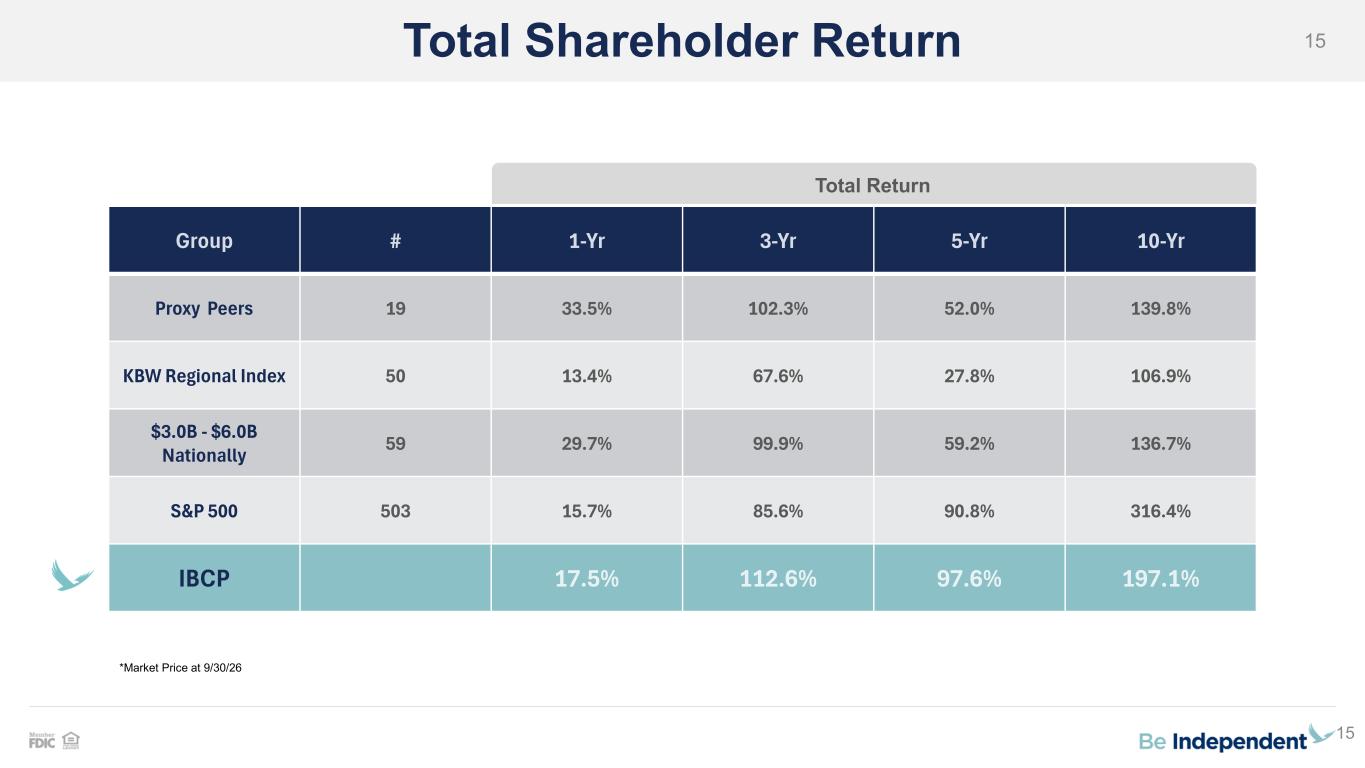
15Total Shareholder Return Group # 1-Yr 3-Yr 5-Yr 10-Yr Proxy Peers 19 33.5% 102.3% 52.0% 139.8% KBW Regional Index 50 13.4% 67.6% 27.8% 106.9% $3.0B - $6.0B Nationally 59 29.7% 99.9% 59.2% 136.7% S&P 500 503 15.7% 85.6% 90.8% 316.4% IBCP 17.5% 112.6% 97.6% 197.1% 15 Total Return *Market Price at 9/30/26
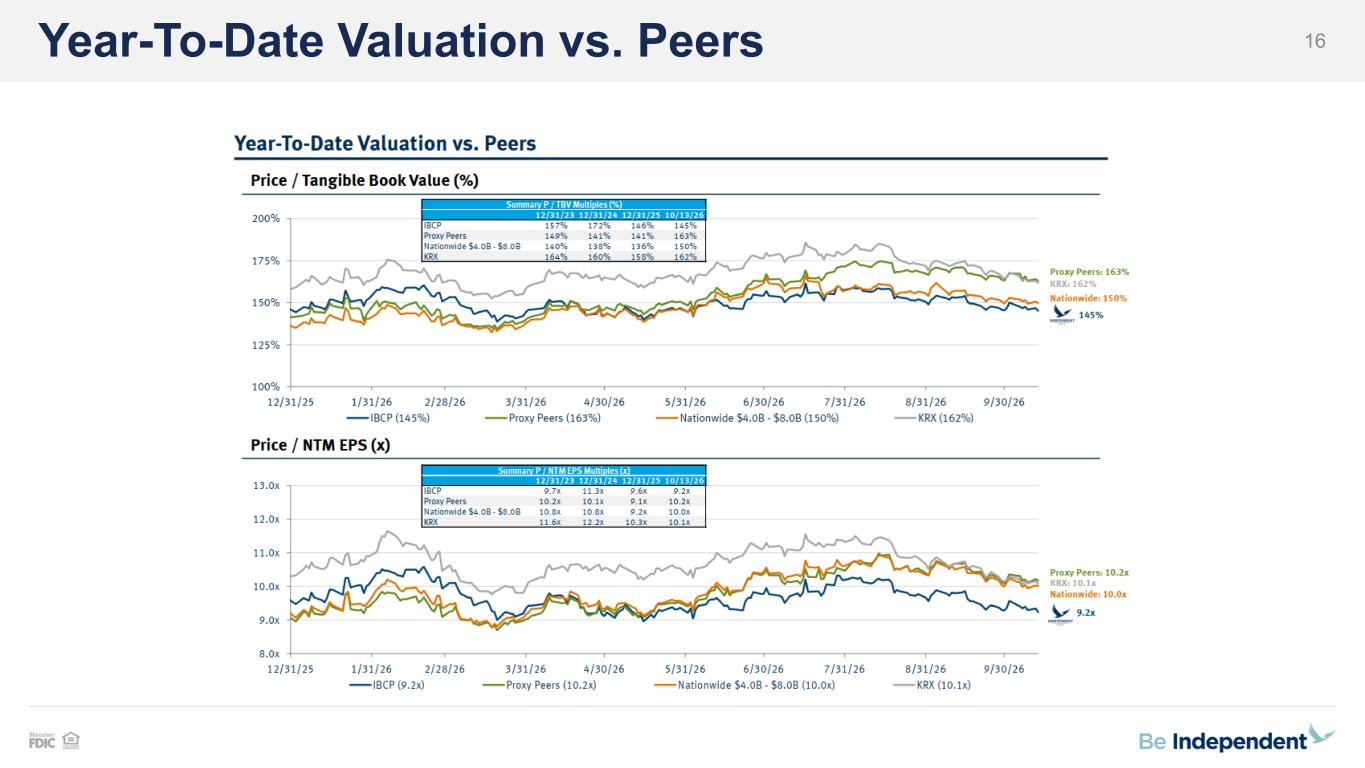
16Year-To-Date Valuation vs. Peers
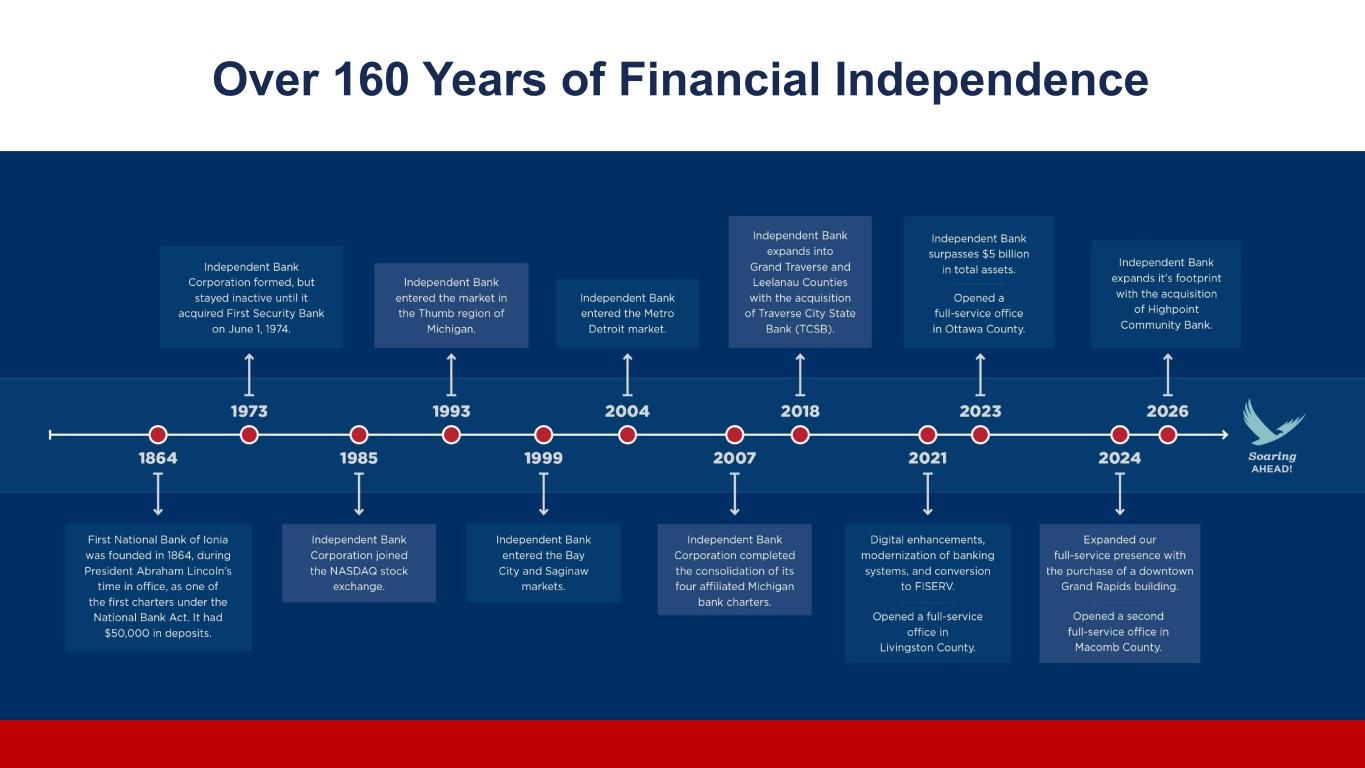
17 Over 160 Years of Financial Independence
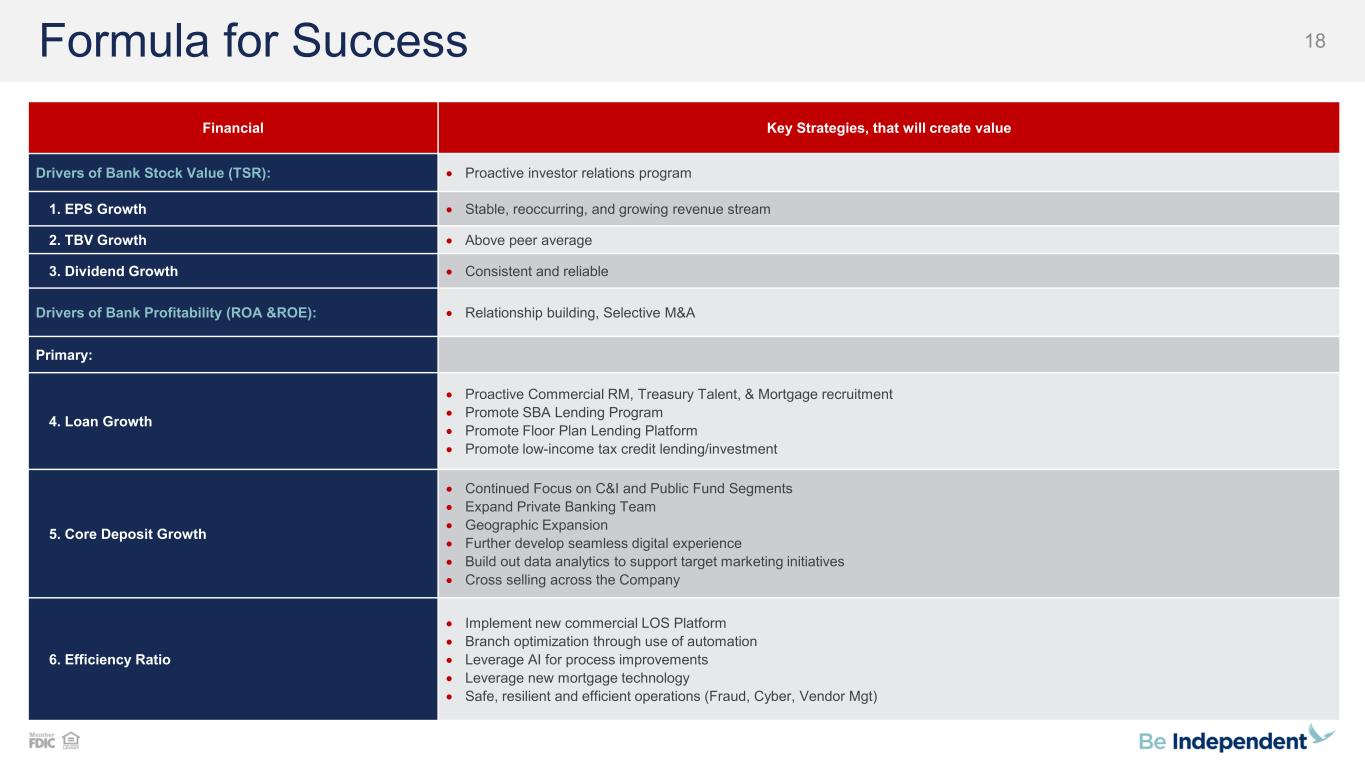
18Formula for Success Financial Key Strategies, that will create value Drivers of Bank Stock Value (TSR): • Proactive investor relations program 1. EPS Growth • Stable, reoccurring, and growing revenue stream 2. TBV Growth • Above peer average 3. Dividend Growth • Consistent and reliable Drivers of Bank Profitability (ROA &ROE): • Relationship building, Selective M&A Primary: 4. Loan Growth • Proactive Commercial RM, Treasury Talent, & Mortgage recruitment • Promote SBA Lending Program • Promote Floor Plan Lending Platform • Promote low-income tax credit lending/investment 5. Core Deposit Growth • Continued Focus on C&I and Public Fund Segments • Expand Private Banking Team • Geographic Expansion • Further develop seamless digital experience • Build out data analytics to support target marketing initiatives • Cross selling across the Company 6. Efficiency Ratio • Implement new commercial LOS Platform • Branch optimization through use of automation • Leverage AI for process improvements • Leverage new mortgage technology • Safe, resilient and efficient operations (Fraud, Cyber, Vendor Mgt)
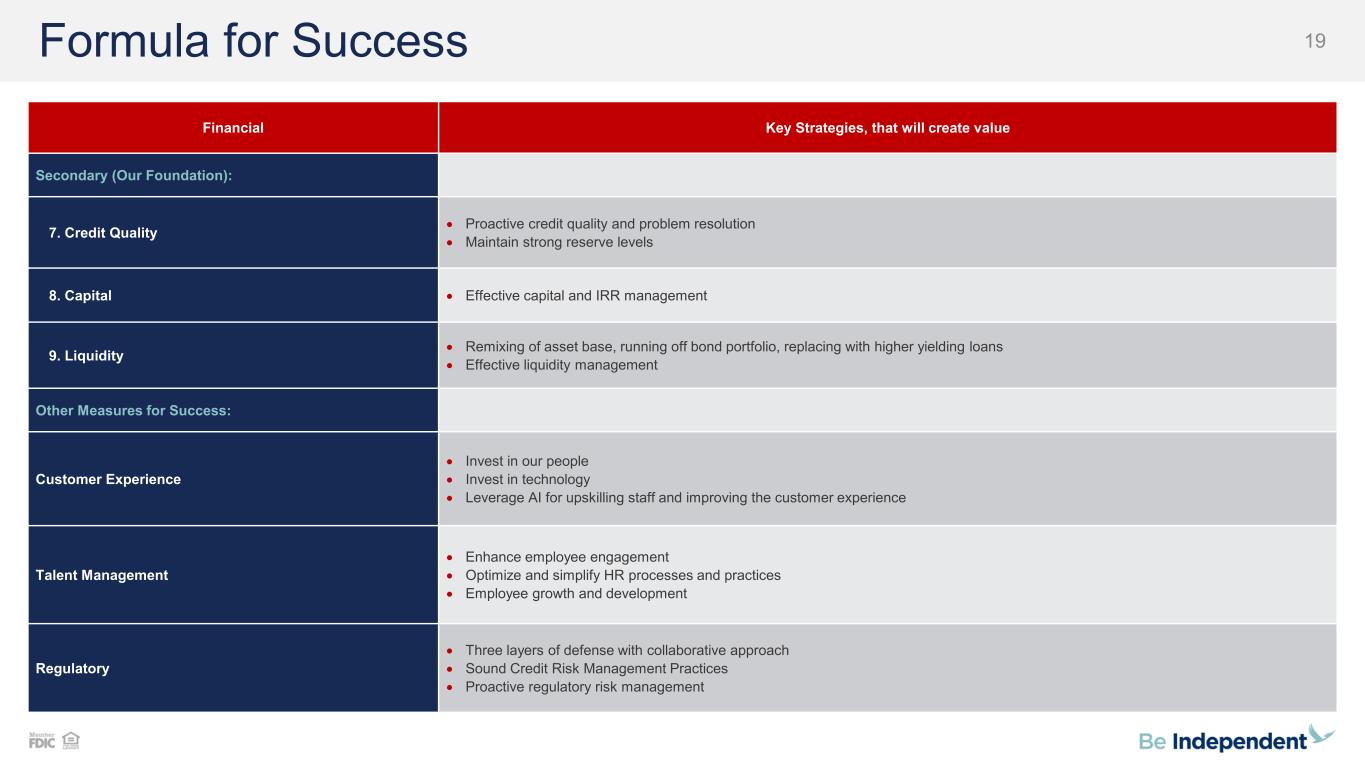
19Formula for Success Financial Key Strategies, that will create value Secondary (Our Foundation): 7. Credit Quality • Proactive credit quality and problem resolution • Maintain strong reserve levels 8. Capital • Effective capital and IRR management 9. Liquidity • Remixing of asset base, running off bond portfolio, replacing with higher yielding loans • Effective liquidity management Other Measures for Success: Customer Experience • Invest in our people • Invest in technology • Leverage AI for upskilling staff and improving the customer experience Talent Management • Enhance employee engagement • Optimize and simplify HR processes and practices • Employee growth and development Regulatory • Three layers of defense with collaborative approach • Sound Credit Risk Management Practices • Proactive regulatory risk management
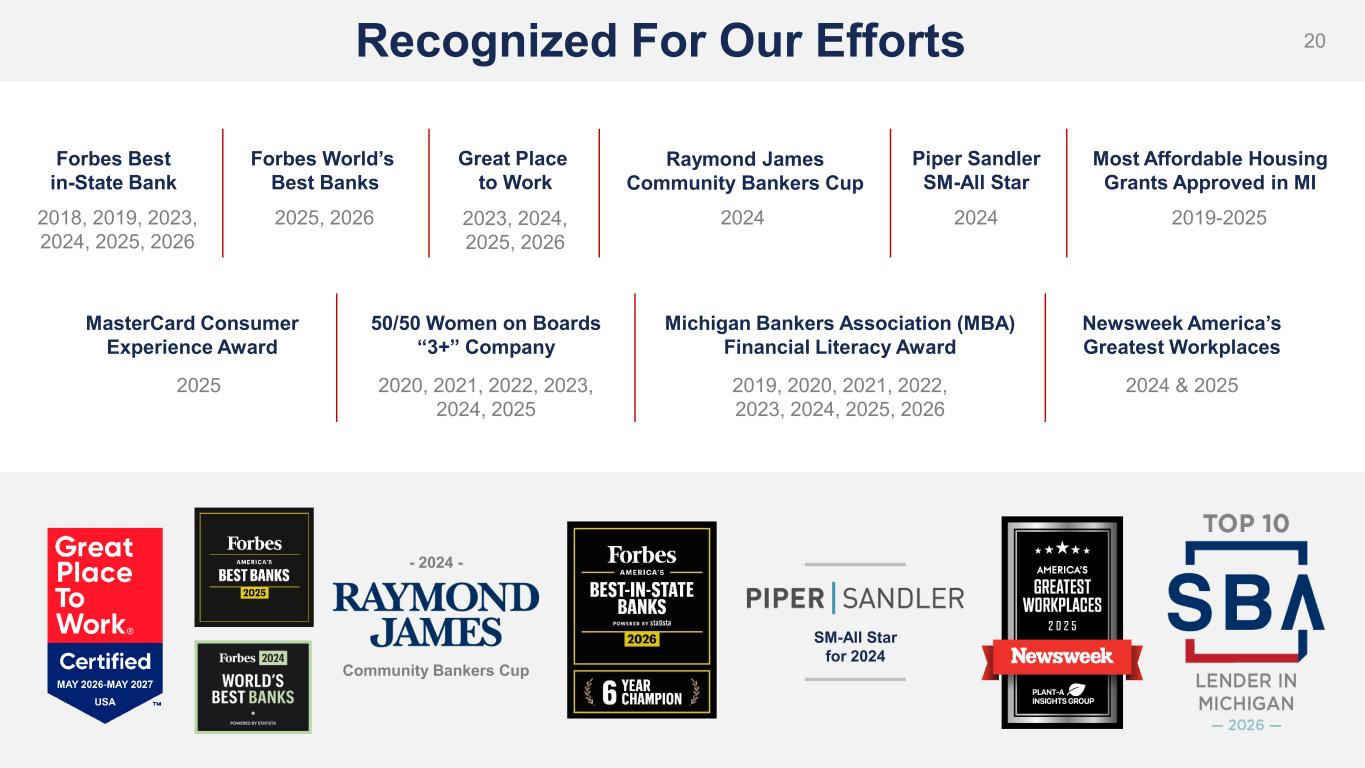
20Recognized For Our Efforts SM-All Star for 2024 Community Bankers Cup - 2024 - Forbes Best in-State Bank 2018, 2019, 2023, 2024, 2025, 2026 Great Place to Work 2023, 2024, 2025, 2026 Raymond James Community Bankers Cup 2024 Piper Sandler SM-All Star 2024 Most Affordable Housing Grants Approved in MI 2019-2025 MasterCard Consumer Experience Award 2025 50/50 Women on Boards “3+” Company 2020, 2021, 2022, 2023, 2024, 2025 Michigan Bankers Association (MBA) Financial Literacy Award 2019, 2020, 2021, 2022, 2023, 2024, 2025, 2026 Newsweek America’s Greatest Workplaces 2024 & 2025 Forbes World’s Best Banks 2025, 2026
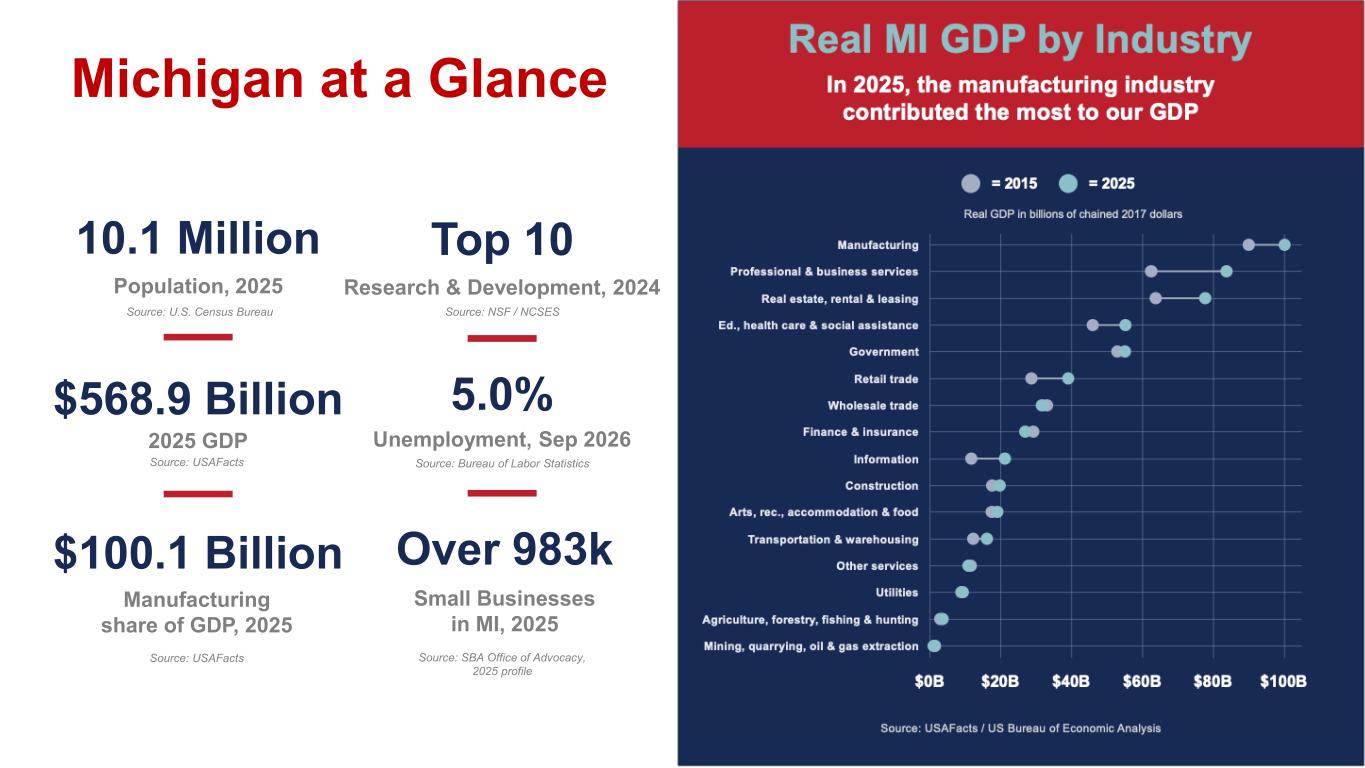
22 Michigan at a Glance 10.1 Million Population, 2025 Top 10 Research & Development, 2024 5.0% Unemployment, Sep 2026 Over 983k Small Businesses in MI, 2025 $568.9 Billion 2025 GDP Source: USAFacts $100.1 Billion Manufacturing share of GDP, 2025 Source: USAFacts Source: Bureau of Labor Statistics Source: NSF / NCSES Source: SBA Office of Advocacy, 2025 profile Source: U.S. Census Bureau
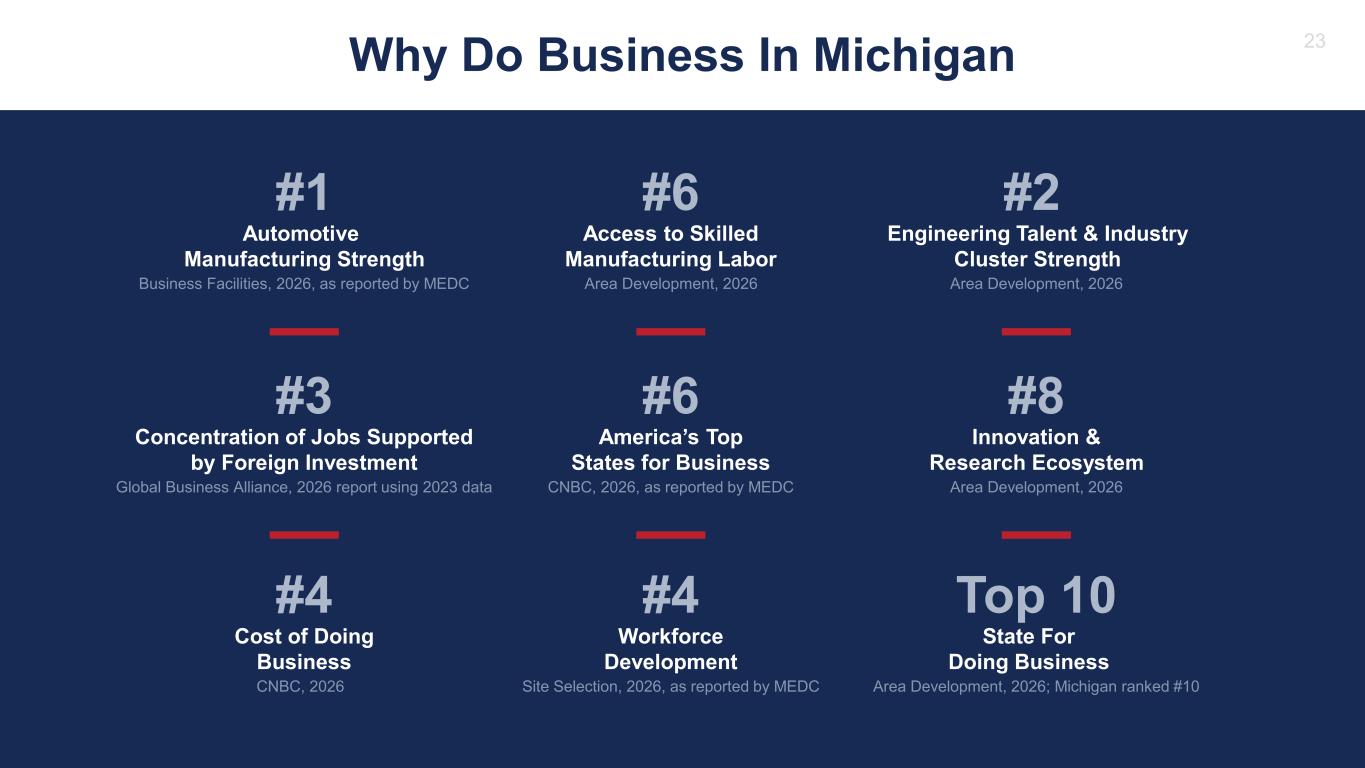
23 #1 Automotive Manufacturing Strength Business Facilities, 2026, as reported by MEDC #3 Concentration of Jobs Supported by Foreign Investment Global Business Alliance, 2026 report using 2023 data #4 Cost of Doing Business #6 Access to Skilled Manufacturing Labor Area Development, 2026 #6 America’s Top States for Business CNBC, 2026, as reported by MEDC #4 Workforce Development Site Selection, 2026, as reported by MEDC Engineering Talent & Industry Cluster Strength Area Development, 2026 #8 Innovation & Research Ecosystem Top 10 State For Doing Business Area Development, 2026; Michigan ranked #10 Why Do Business In Michigan #2 Area Development, 2026 CNBC, 2026
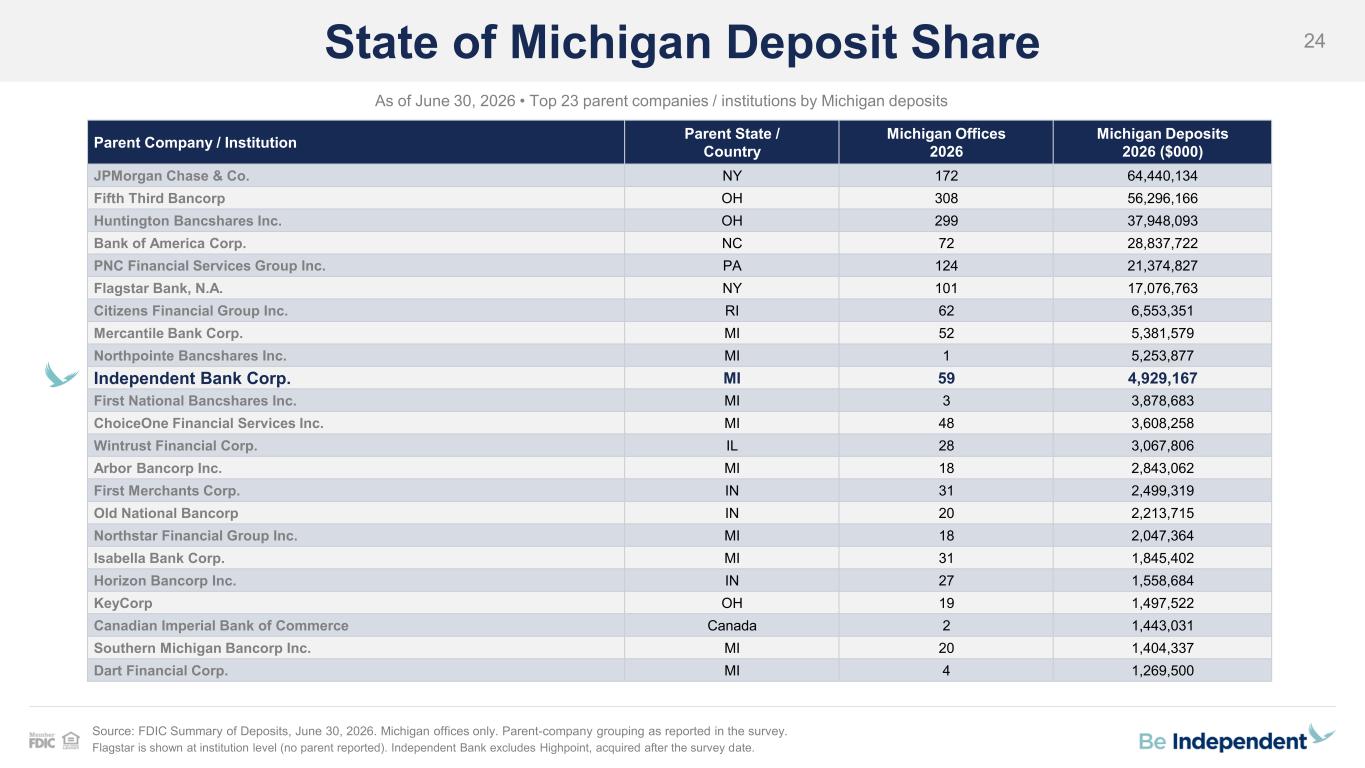
24State of Michigan Deposit Share As of June 30, 2026 • Top 23 parent companies / institutions by Michigan deposits Parent Company / Institution Parent State / Country Michigan Offices 2026 Michigan Deposits 2026 ($000) JPMorgan Chase & Co. NY 172 64,440,134 Fifth Third Bancorp OH 308 56,296,166 Huntington Bancshares Inc. OH 299 37,948,093 Bank of America Corp. NC 72 28,837,722 PNC Financial Services Group Inc. PA 124 21,374,827 Flagstar Bank, N.A. NY 101 17,076,763 Citizens Financial Group Inc. RI 62 6,553,351 Mercantile Bank Corp. MI 52 5,381,579 Northpointe Bancshares Inc. MI 1 5,253,877 Independent Bank Corp. MI 59 4,929,167 First National Bancshares Inc. MI 3 3,878,683 ChoiceOne Financial Services Inc. MI 48 3,608,258 Wintrust Financial Corp. IL 28 3,067,806 Arbor Bancorp Inc. MI 18 2,843,062 First Merchants Corp. IN 31 2,499,319 Old National Bancorp IN 20 2,213,715 Northstar Financial Group Inc. MI 18 2,047,364 Isabella Bank Corp. MI 31 1,845,402 Horizon Bancorp Inc. IN 27 1,558,684 KeyCorp OH 19 1,497,522 Canadian Imperial Bank of Commerce Canada 2 1,443,031 Southern Michigan Bancorp Inc. MI 20 1,404,337 Dart Financial Corp. MI 4 1,269,500 Source: FDIC Summary of Deposits, June 30, 2026. Michigan offices only. Parent-company grouping as reported in the survey. Flagstar is shown at institution level (no parent reported). Independent Bank excludes Highpoint, acquired after the survey date.
Earnings Call: Third Quarter 2026 October 27, 2026 (NASDAQ: IBCP)
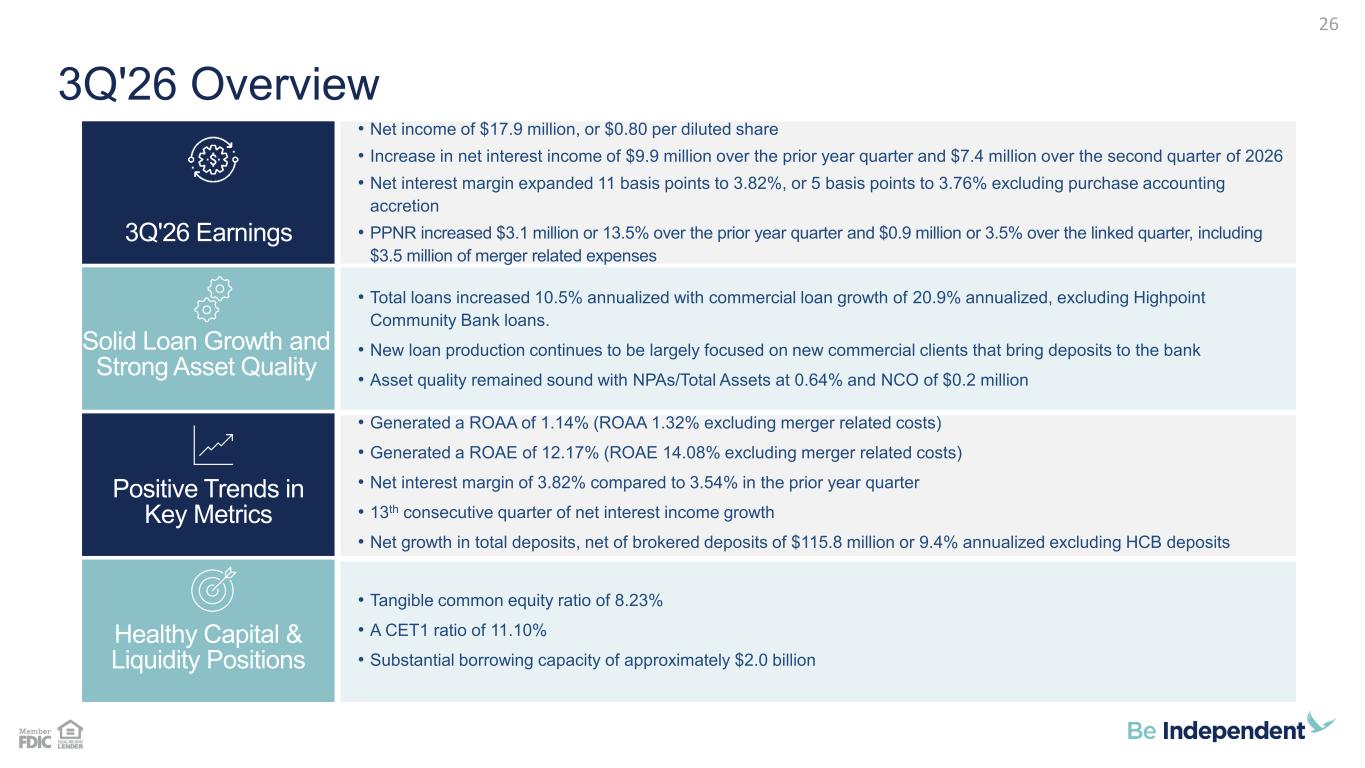
26 3Q'26 Overview • Total loans increased 10.5% annualized with commercial loan growth of 20.9% annualized, excluding Highpoint Community Bank loans. • New loan production continues to be largely focused on new commercial clients that bring deposits to the bank • Asset quality remained sound with NPAs/Total Assets at 0.64% and NCO of $0.2 million • Generated a ROAA of 1.14% (ROAA 1.32% excluding merger related costs) • Generated a ROAE of 12.17% (ROAE 14.08% excluding merger related costs) • Net interest margin of 3.82% compared to 3.54% in the prior year quarter • 13th consecutive quarter of net interest income growth • Net growth in total deposits, net of brokered deposits of $115.8 million or 9.4% annualized excluding HCB deposits • Tangible common equity ratio of 8.23% • A CET1 ratio of 11.10% • Substantial borrowing capacity of approximately $2.0 billion • Net income of $17.9 million, or $0.80 per diluted share • Increase in net interest income of $9.9 million over the prior year quarter and $7.4 million over the second quarter of 2026 • Net interest margin expanded 11 basis points to 3.82%, or 5 basis points to 3.76% excluding purchase accounting accretion • PPNR increased $3.1 million or 13.5% over the prior year quarter and $0.9 million or 3.5% over the linked quarter, including $3.5 million of merger related expenses Healthy Capital & Liquidity Positions Positive Trends in Key Metrics Solid Loan Growth and Strong Asset Quality 3Q'26 Earnings
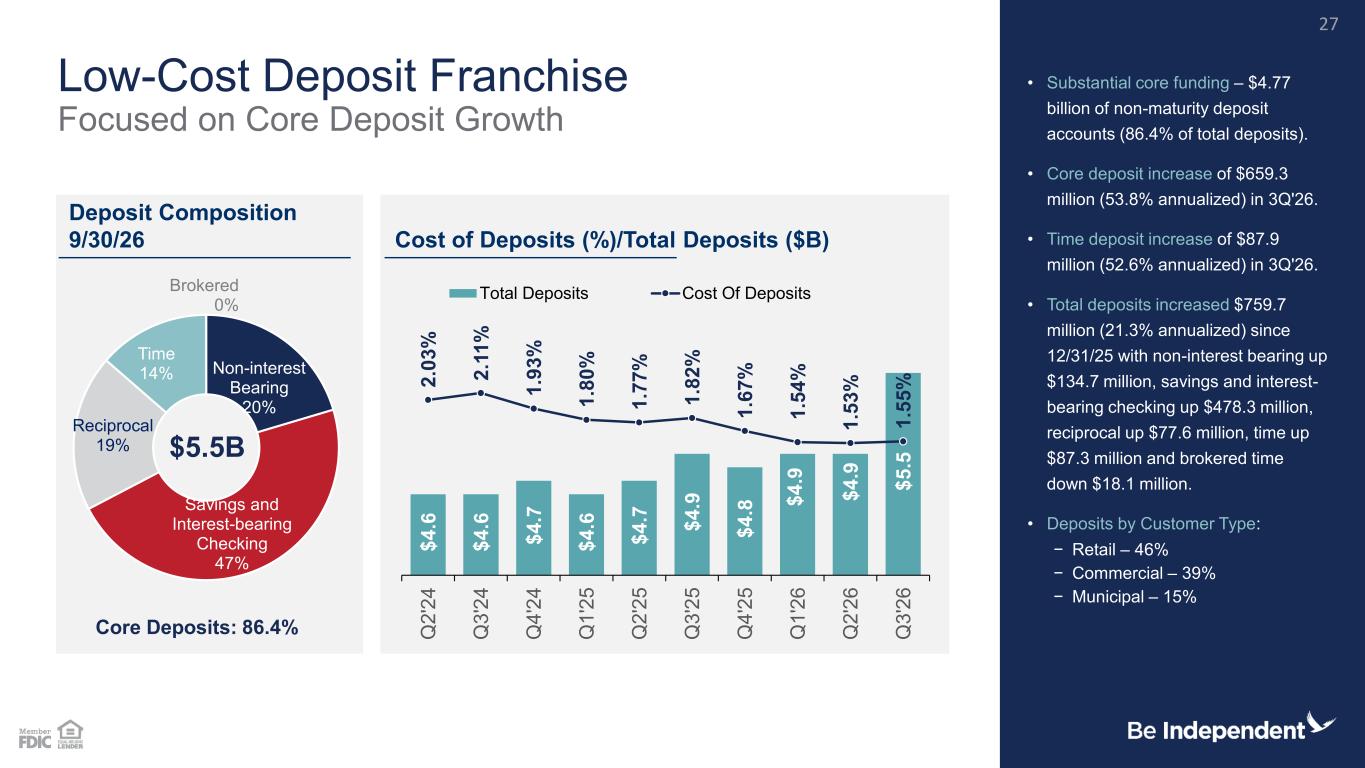
27 $ 4 .6 $ 4 .6 $ 4 .7 $ 4 .6 $ 4 .7 $ 4 .9 $ 4 .8 $ 4 .9 $ 4 .9 $ 5 .5 2 .0 3 % 2 .1 1 % 1 .9 3 % 1 .8 0 % 1 .7 7 % 1 .8 2 % 1 .6 7 % 1 .5 4 % 1 .5 3 % 1 .5 5 % Q 2 '2 4 Q 3 '2 4 Q 4 '2 4 Q 1 '2 5 Q 2 '2 5 Q 3 '2 5 Q 4 '2 5 Q 1 '2 6 Q 2 '2 6 Q 3 '2 6 Total Deposits Cost Of Deposits Non-interest Bearing 20% Savings and Interest-bearing Checking 47% Reciprocal 19% Time 14% Brokered 0% Low-Cost Deposit Franchise Focused on Core Deposit Growth • Substantial core funding – $4.77 billion of non-maturity deposit accounts (86.4% of total deposits). • Core deposit increase of $659.3 million (53.8% annualized) in 3Q'26. • Time deposit increase of $87.9 million (52.6% annualized) in 3Q'26. • Total deposits increased $759.7 million (21.3% annualized) since 12/31/25 with non-interest bearing up $134.7 million, savings and interest- bearing checking up $478.3 million, reciprocal up $77.6 million, time up $87.3 million and brokered time down $18.1 million. • Deposits by Customer Type: − Retail – 46% − Commercial – 39% − Municipal – 15% Deposit Composition 9/30/26 Cost of Deposits (%)/Total Deposits ($B) Core Deposits: 86.4% $5.5B
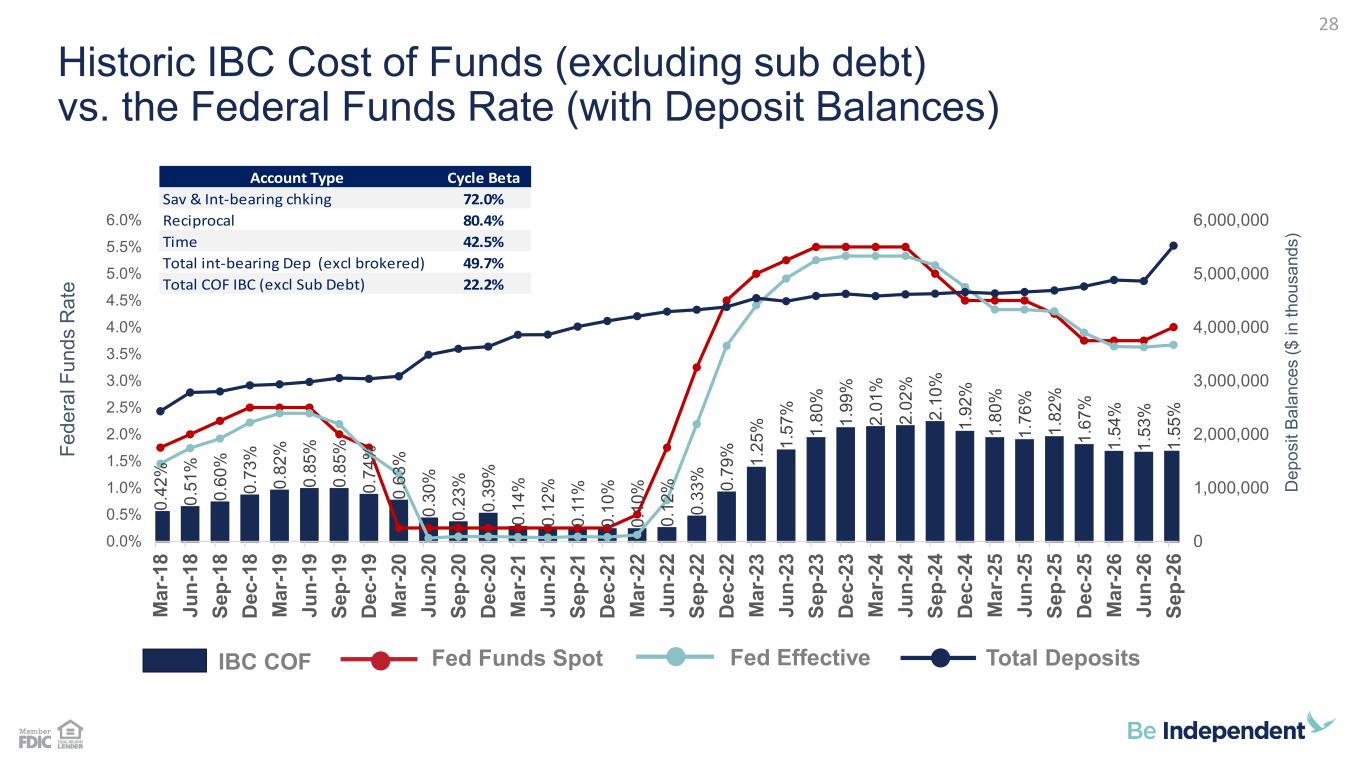
28 Historic IBC Cost of Funds (excluding sub debt) vs. the Federal Funds Rate (with Deposit Balances) D e p o s it B a la n c e s ( $ i n t h o u s a n d s ) F e d e ra l F u n d s R a te Account Type Cycle Beta Sav & Int-bearing chking 72.0% Reciprocal 80.4% Time 42.5% Total int-bearing Dep (excl brokered) 49.7% Total COF IBC (excl Sub Debt) 22.2% IBC COF Fed Funds Spot Fed Effective Total Deposits 0 .4 2 % 0 .5 1 % 0 .6 0 % 0 .7 3 % 0 .8 2 % 0 .8 5 % 0 .8 5 % 0 .7 4 % 0 .6 3 % 0 .3 0 % 0 .2 3 % 0 .3 9 % 0 .1 4 % 0 .1 2 % 0 .1 1 % 0 .1 0 % 0 .1 0 % 0 .1 2 % 0 .3 3 % 0 .7 9 % 1 .2 5 % 1 .5 7 % 1 .8 0 % 1 .9 9 % 2 .0 1 % 2 .0 2 % 2 .1 0 % 1 .9 2 % 1 .8 0 % 1 .7 6 % 1 .8 2 % 1 .6 7 % 1 .5 4 % 1 .5 3 % 1 .5 5 % 0 1,000,000 2,000,000 3,000,000 4,000,000 5,000,000 6,000,000 0.0% 0.5% 1.0% 1.5% 2.0% 2.5% 3.0% 3.5% 4.0% 4.5% 5.0% 5.5% 6.0% M a r- 1 8 J u n -1 8 S e p -1 8 D e c -1 8 M a r- 1 9 J u n -1 9 S e p -1 9 D e c -1 9 M a r- 2 0 J u n -2 0 S e p -2 0 D e c -2 0 M a r- 2 1 J u n -2 1 S e p -2 1 D e c -2 1 M a r- 2 2 J u n -2 2 S e p -2 2 D e c -2 2 M a r- 2 3 J u n -2 3 S e p -2 3 D e c -2 3 M a r- 2 4 J u n -2 4 S e p -2 4 D e c -2 4 M a r- 2 5 J u n -2 5 S e p -2 5 D e c -2 5 M a r- 2 6 J u n -2 6 S e p -2 6
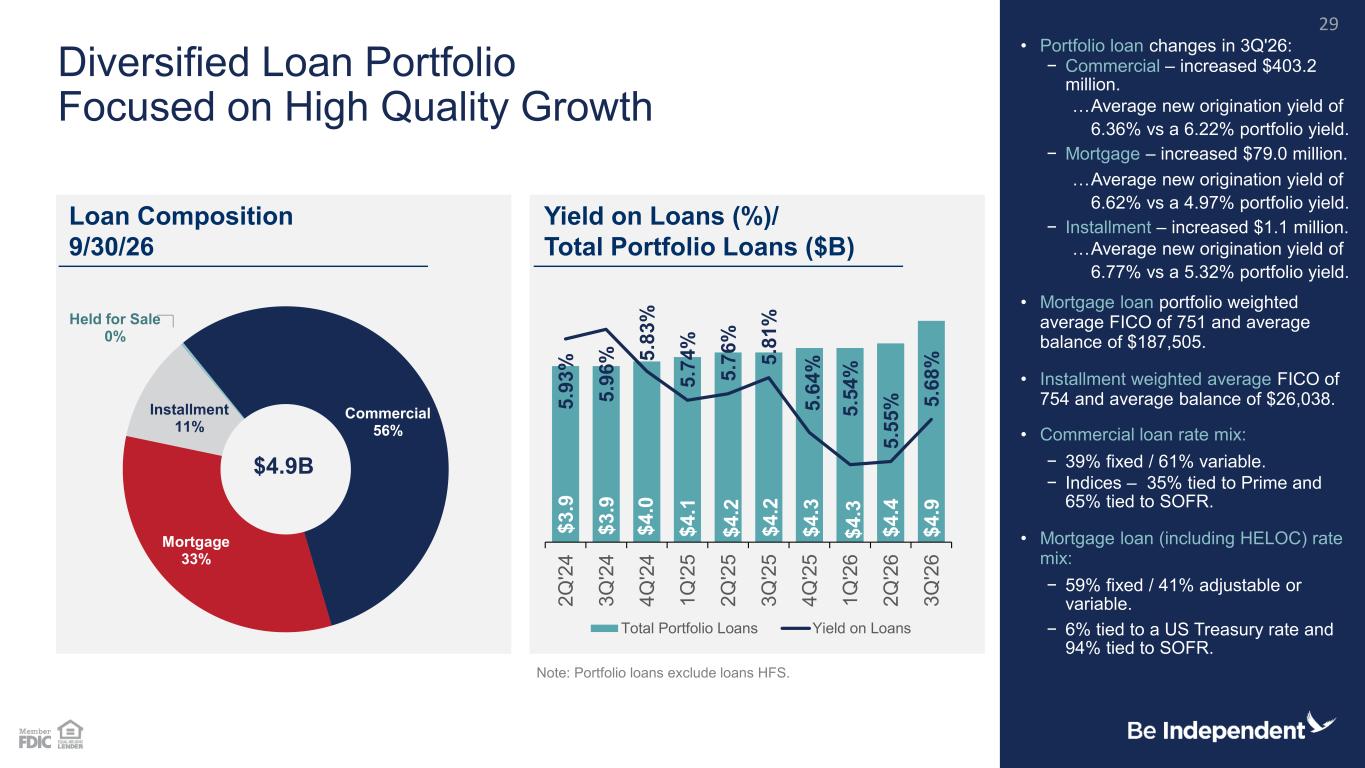
29 Commercial 56% Mortgage 33% Installment 11% Held for Sale 0% Diversified Loan Portfolio Focused on High Quality Growth • Portfolio loan changes in 3Q'26: − Commercial – increased $403.2 million. …Average new origination yield of 6.36% vs a 6.22% portfolio yield. − Mortgage – increased $79.0 million. …Average new origination yield of 6.62% vs a 4.97% portfolio yield. − Installment – increased $1.1 million. …Average new origination yield of 6.77% vs a 5.32% portfolio yield. • Mortgage loan portfolio weighted average FICO of 751 and average balance of $187,505. • Installment weighted average FICO of 754 and average balance of $26,038. • Commercial loan rate mix: − 39% fixed / 61% variable. − Indices – 35% tied to Prime and 65% tied to SOFR. • Mortgage loan (including HELOC) rate mix: − 59% fixed / 41% adjustable or variable. − 6% tied to a US Treasury rate and 94% tied to SOFR. Note: Portfolio loans exclude loans HFS. Loan Composition 9/30/26 Yield on Loans (%)/ Total Portfolio Loans ($B) $4.9B $ 3 .9 $ 3 .9 $ 4 .0 $ 4 .1 $ 4 .2 $ 4 .2 $ 4 .3 $ 4 .3 $ 4 .4 $ 4 .9 5 .9 3 % 5 .9 6 % 5 .8 3 % 5 .7 4 % 5 .7 6 % 5 .8 1 % 5 .6 4 % 5 .5 4 % 5 .5 5 % 5 .6 8 % 2 Q '2 4 3 Q '2 4 4 Q '2 4 1 Q '2 5 2 Q '2 5 3 Q '2 5 4 Q '2 5 1 Q '2 6 2 Q '2 6 3 Q '2 6 Total Portfolio Loans Yield on Loans
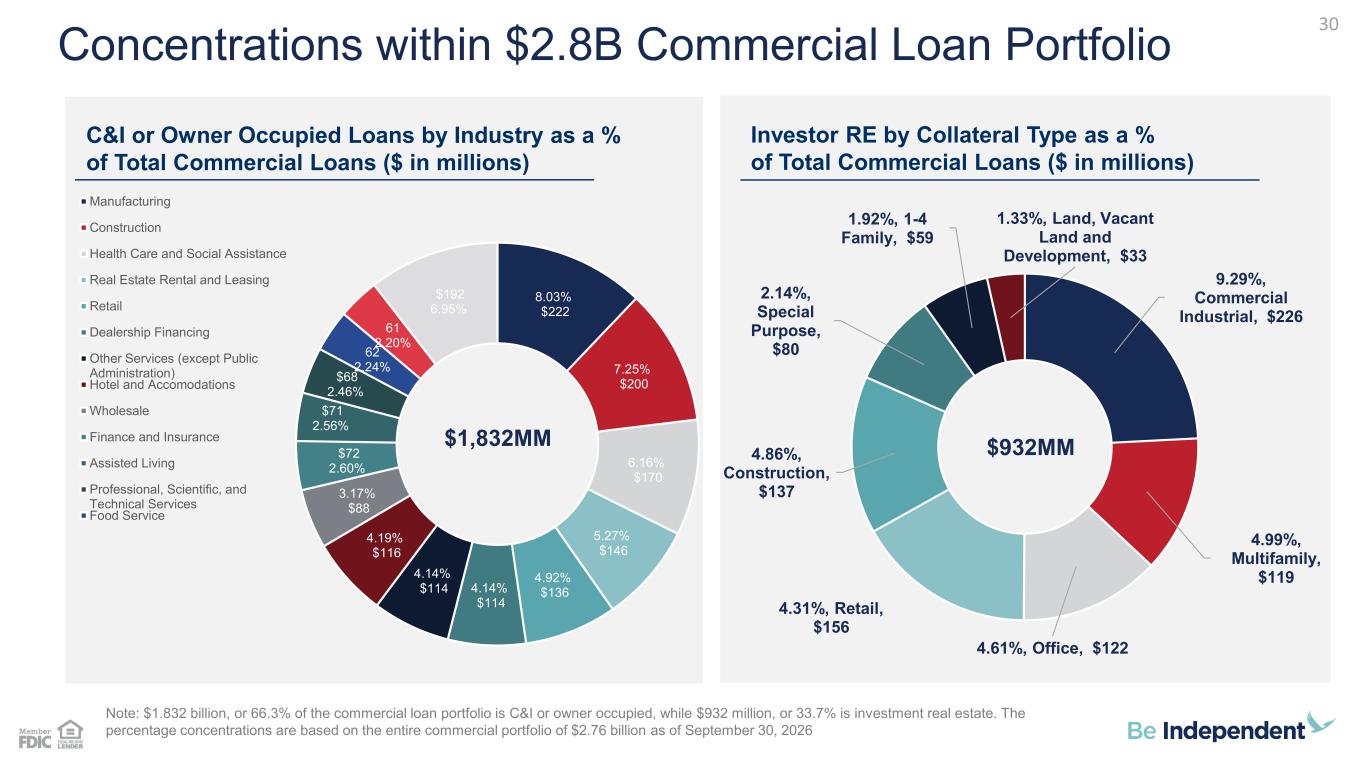
8.03% $222 7.25% $200 6.16% $170 5.27% $146 4.92% $136 4.14% $114 4.14% $114 4.19% $116 3.17% $88 $72 2.60% $71 2.56% $68 2.46% 62 2.24% 61 2.20% $192 6.95% Manufacturing Construction Health Care and Social Assistance Real Estate Rental and Leasing Retail Dealership Financing Other Services (except Public Administration) Hotel and Accomodations Wholesale Finance and Insurance Assisted Living Professional, Scientific, and Technical Services Food Service Concentrations within $2.8B Commercial Loan Portfolio C&I or Owner Occupied Loans by Industry as a % of Total Commercial Loans ($ in millions) Investor RE by Collateral Type as a % of Total Commercial Loans ($ in millions) Note: $1.832 billion, or 66.3% of the commercial loan portfolio is C&I or owner occupied, while $932 million, or 33.7% is investment real estate. The percentage concentrations are based on the entire commercial portfolio of $2.76 billion as of September 30, 2026 30 $1,832MM 9.29%, Commercial Industrial, $226 4.99%, Multifamily, $119 4.61%, Office, $122 4.31%, Retail, $156 4.86%, Construction, $137 2.14%, Special Purpose, $80 1.92%, 1-4 Family, $59 1.33%, Land, Vacant Land and Development, $33 $932MM
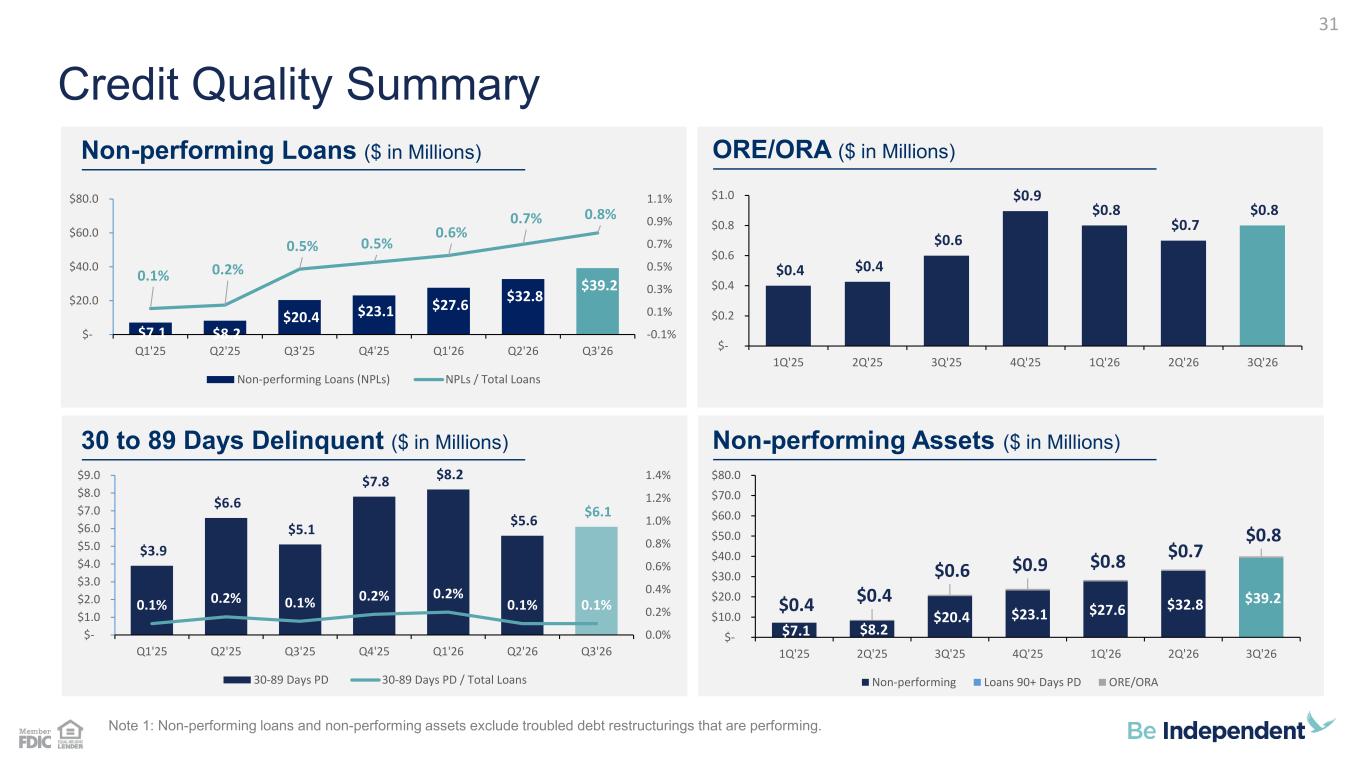
$7.1 $8.2 $20.4 $23.1 $27.6 $32.8 $39.2 $0.4 $0.4 $0.6 $0.9 $0.8 $0.7 $0.8 $- $10.0 $20.0 $30.0 $40.0 $50.0 $60.0 $70.0 $80.0 1Q'25 2Q'25 3Q'25 4Q'25 1Q'26 2Q'26 3Q'26 Non-performing Loans 90+ Days PD ORE/ORA $3.9 $6.6 $5.1 $7.8 $8.2 $5.6 $6.1 0.1% 0.2% 0.1% 0.2% 0.2% 0.1% 0.1% 0.0% 0.2% 0.4% 0.6% 0.8% 1.0% 1.2% 1.4% $- $1.0 $2.0 $3.0 $4.0 $5.0 $6.0 $7.0 $8.0 $9.0 Q1'25 Q2'25 Q3'25 Q4'25 Q1'26 Q2'26 Q3'26 30-89 Days PD 30-89 Days PD / Total Loans $0.4 $0.4 $0.6 $0.9 $0.8 $0.7 $0.8 $- $0.2 $0.4 $0.6 $0.8 $1.0 1Q'25 2Q'25 3Q'25 4Q'25 1Q'26 2Q'26 3Q'26 $7.1 $8.2 $20.4 $23.1 $27.6 $32.8 $39.2 0.1% 0.2% 0.5% 0.5% 0.6% 0.7% 0.8% -0.1% 0.1% 0.3% 0.5% 0.7% 0.9% 1.1% $- $20.0 $40.0 $60.0 $80.0 Q1'25 Q2'25 Q3'25 Q4'25 Q1'26 Q2'26 Q3'26 Non-performing Loans (NPLs) NPLs / Total Loans Note 1: Non-performing loans and non-performing assets exclude troubled debt restructurings that are performing. Credit Quality Summary Non-performing Loans ($ in Millions) ORE/ORA ($ in Millions) 30 to 89 Days Delinquent ($ in Millions) Non-performing Assets ($ in Millions) 31
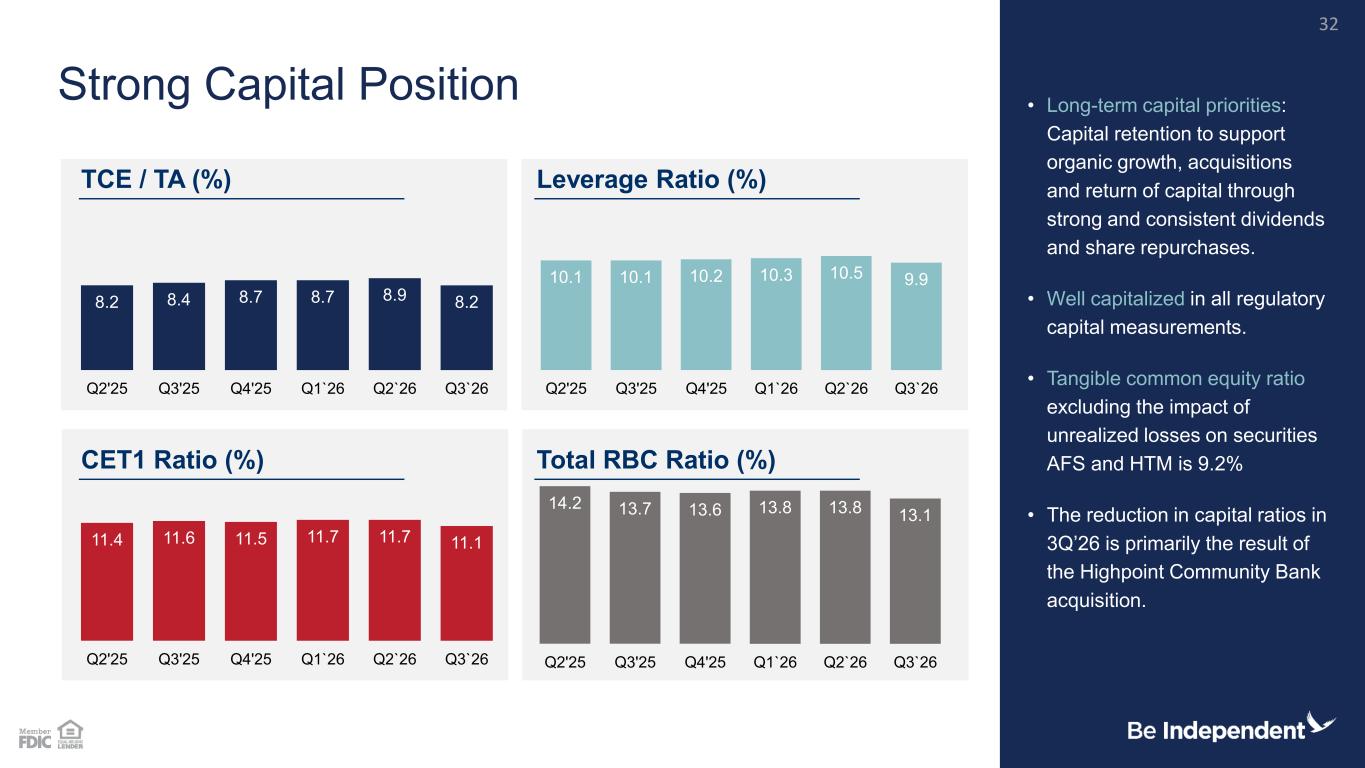
14.2 13.7 13.6 13.8 13.8 13.1 Q2'25 Q3'25 Q4'25 Q1`26 Q2`26 Q3`26 11.4 11.6 11.5 11.7 11.7 11.1 Q2'25 Q3'25 Q4'25 Q1`26 Q2`26 Q3`26 10.1 10.1 10.2 10.3 10.5 9.9 Q2'25 Q3'25 Q4'25 Q1`26 Q2`26 Q3`26 8.2 8.4 8.7 8.7 8.9 8.2 Q2'25 Q3'25 Q4'25 Q1`26 Q2`26 Q3`26 • Long-term capital priorities: Capital retention to support organic growth, acquisitions and return of capital through strong and consistent dividends and share repurchases. • Well capitalized in all regulatory capital measurements. • Tangible common equity ratio excluding the impact of unrealized losses on securities AFS and HTM is 9.2% • The reduction in capital ratios in 3Q’26 is primarily the result of the Highpoint Community Bank acquisition. Strong Capital Position TCE / TA (%) Leverage Ratio (%) CET1 Ratio (%) Total RBC Ratio (%) 32
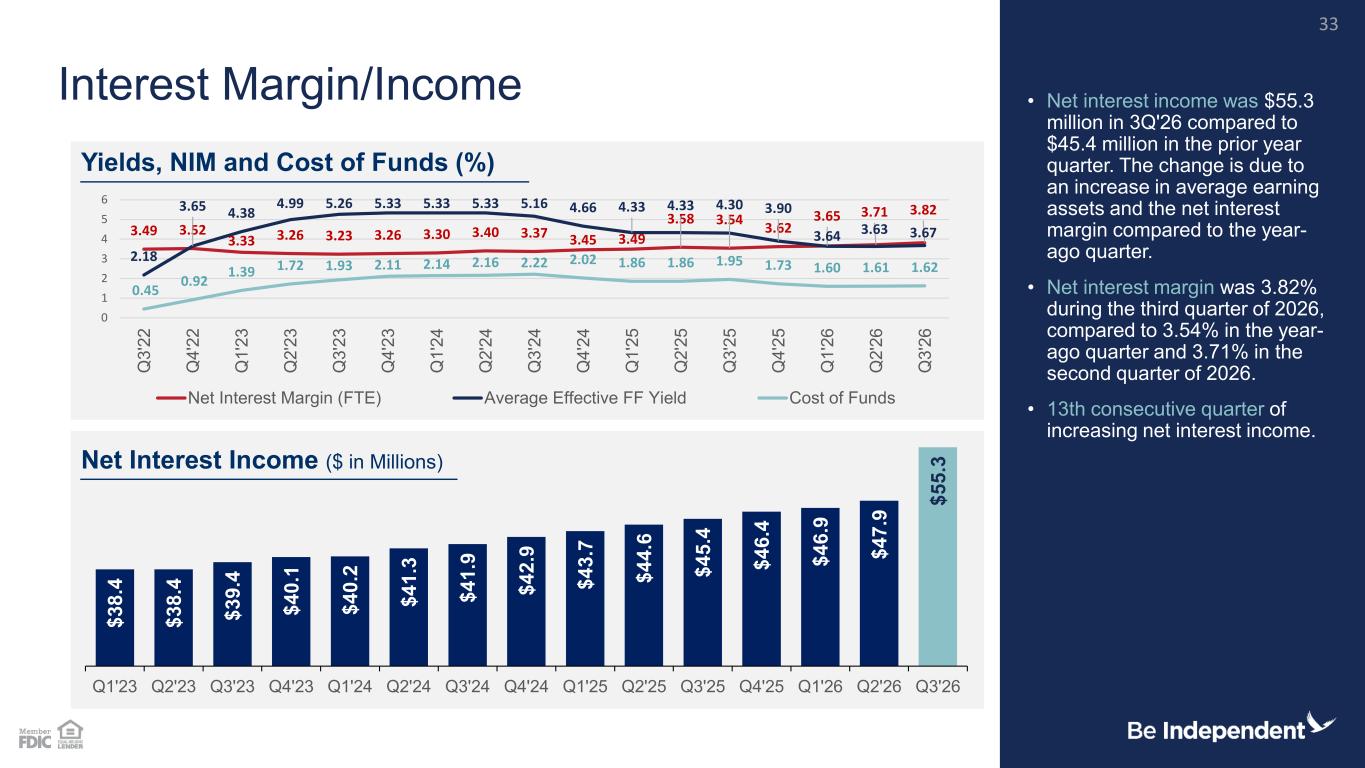
$ 3 8 .4 $ 3 8 .4 $ 3 9 .4 $ 4 0 .1 $ 4 0 .2 $ 4 1 .3 $ 4 1 .9 $ 4 2 .9 $ 4 3 .7 $ 4 4 .6 $ 4 5 .4 $ 4 6 .4 $ 4 6 .9 $ 4 7 .9 $ 5 5 .3 Q1'23 Q2'23 Q3'23 Q4'23 Q1'24 Q2'24 Q3'24 Q4'24 Q1'25 Q2'25 Q3'25 Q4'25 Q1'26 Q2'26 Q3'26 3.49 3.52 3.33 3.26 3.23 3.26 3.30 3.40 3.37 3.45 3.49 3.58 3.54 3.62 3.65 3.71 3.82 2.18 3.65 4.38 4.99 5.26 5.33 5.33 5.33 5.16 4.66 4.33 4.33 4.30 3.90 3.64 3.63 3.67 0.45 0.92 1.39 1.72 1.93 2.11 2.14 2.16 2.22 2.02 1.86 1.86 1.95 1.73 1.60 1.61 1.62 0 1 2 3 4 5 6 Q 3 '2 2 Q 4 '2 2 Q 1 '2 3 Q 2 '2 3 Q 3 '2 3 Q 4 '2 3 Q 1 '2 4 Q 2 '2 4 Q 3 '2 4 Q 4 '2 4 Q 1 '2 5 Q 2 '2 5 Q 3 '2 5 Q 4 '2 5 Q 1 '2 6 Q 2 '2 6 Q 3 '2 6 Net Interest Margin (FTE) Average Effective FF Yield Cost of Funds Net Interest Margin/Income • Net interest income was $55.3 million in 3Q'26 compared to $45.4 million in the prior year quarter. The change is due to an increase in average earning assets and the net interest margin compared to the year- ago quarter. • Net interest margin was 3.82% during the third quarter of 2026, compared to 3.54% in the year- ago quarter and 3.71% in the second quarter of 2026. • 13th consecutive quarter of increasing net interest income. Yields, NIM and Cost of Funds (%) Net Interest Income ($ in Millions) 33
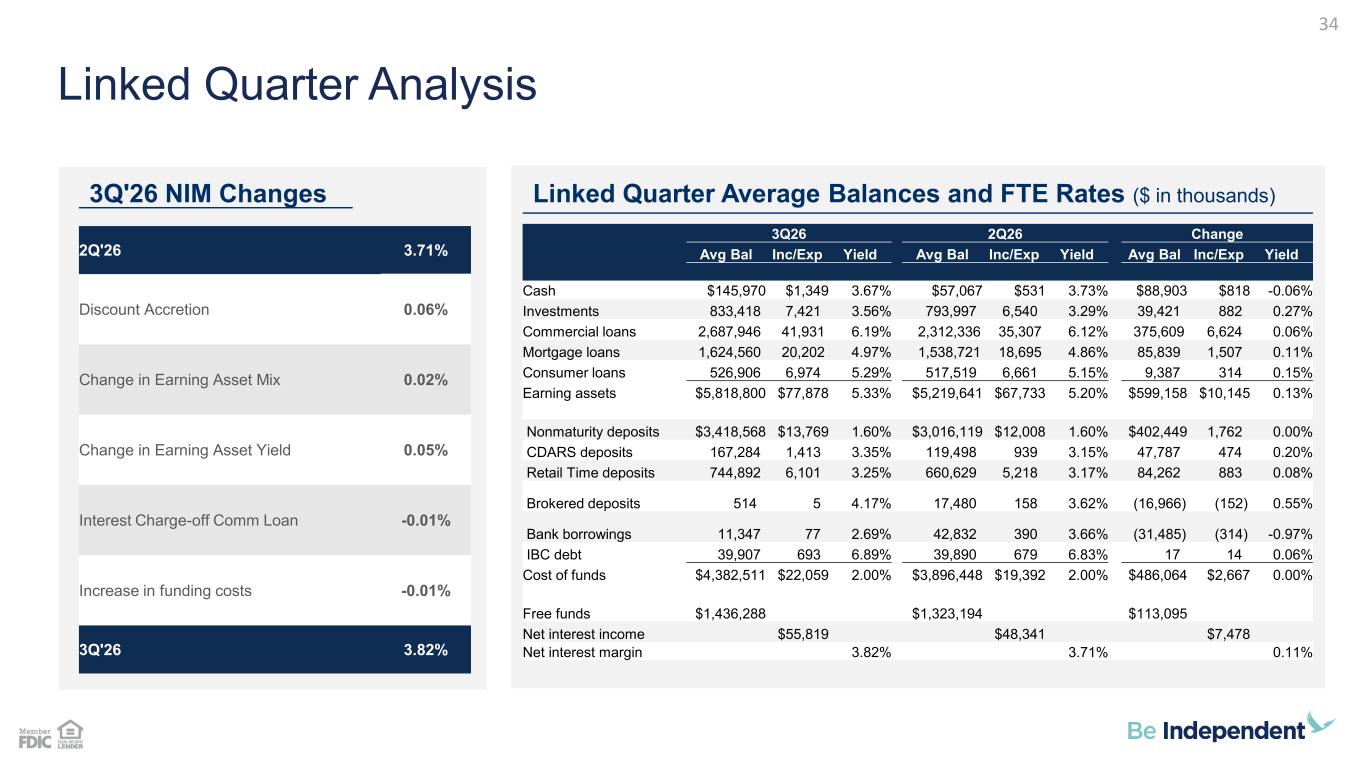
3Q26 2Q26 Change Avg Bal Inc/Exp Yield Avg Bal Inc/Exp Yield Avg Bal Inc/Exp Yield Cash $145,970 $1,349 3.67% $57,067 $531 3.73% $88,903 $818 -0.06% Investments 833,418 7,421 3.56% 793,997 6,540 3.29% 39,421 882 0.27% Commercial loans 2,687,946 41,931 6.19% 2,312,336 35,307 6.12% 375,609 6,624 0.06% Mortgage loans 1,624,560 20,202 4.97% 1,538,721 18,695 4.86% 85,839 1,507 0.11% Consumer loans 526,906 6,974 5.29% 517,519 6,661 5.15% 9,387 314 0.15% Earning assets $5,818,800 $77,878 5.33% $5,219,641 $67,733 5.20% $599,158 $10,145 0.13% Nonmaturity deposits $3,418,568 $13,769 1.60% $3,016,119 $12,008 1.60% $402,449 1,762 0.00% CDARS deposits 167,284 1,413 3.35% 119,498 939 3.15% 47,787 474 0.20% Retail Time deposits 744,892 6,101 3.25% 660,629 5,218 3.17% 84,262 883 0.08% Brokered deposits 514 5 4.17% 17,480 158 3.62% (16,966) (152) 0.55% Bank borrowings 11,347 77 2.69% 42,832 390 3.66% (31,485) (314) -0.97% IBC debt 39,907 693 6.89% 39,890 679 6.83% 17 14 0.06% Cost of funds $4,382,511 $22,059 2.00% $3,896,448 $19,392 2.00% $486,064 $2,667 0.00% Free funds $1,436,288 $1,323,194 $113,095 Net interest income $55,819 $48,341 $7,478 Net interest margin 3.82% 3.71% 0.11% 3Q'26 NIM Changes Linked Quarter Average Balances and FTE Rates ($ in thousands) Linked Quarter Analysis 34 2Q'26 3.71% Discount Accretion 0.06% Change in Earning Asset Mix 0.02% Change in Earning Asset Yield 0.05% Interest Charge-off Comm Loan -0.01% Increase in funding costs -0.01% 3Q'26 3.82%
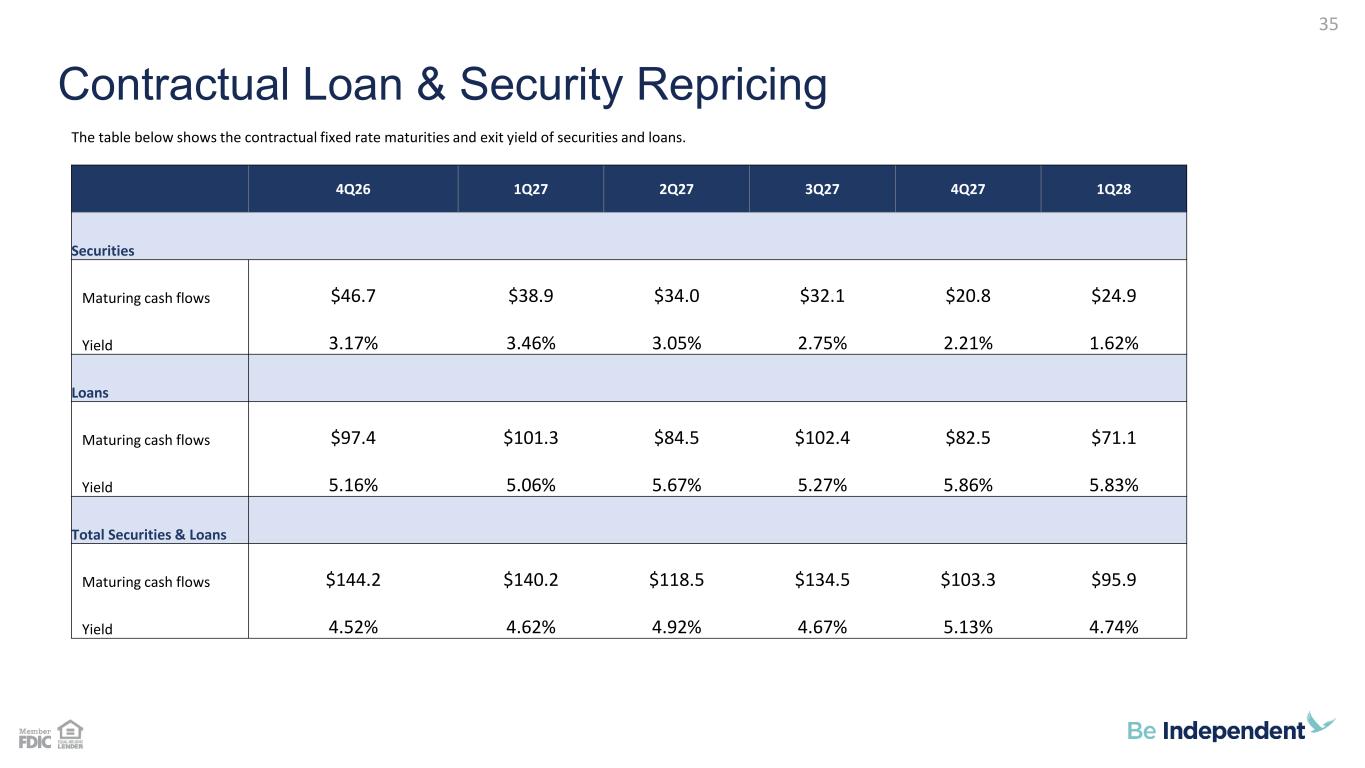
Contractual Loan & Security Repricing 35 The table below shows the contractual fixed rate maturities and exit yield of securities and loans. 4Q26 1Q27 2Q27 3Q27 4Q27 1Q28 Securities Maturing cash flows $46.7 $38.9 $34.0 $32.1 $20.8 $24.9 Yield 3.17% 3.46% 3.05% 2.75% 2.21% 1.62% Loans Maturing cash flows $97.4 $101.3 $84.5 $102.4 $82.5 $71.1 Yield 5.16% 5.06% 5.67% 5.27% 5.86% 5.83% Total Securities & Loans Maturing cash flows $144.2 $140.2 $118.5 $134.5 $103.3 $95.9 Yield 4.52% 4.62% 4.92% 4.67% 5.13% 4.74%
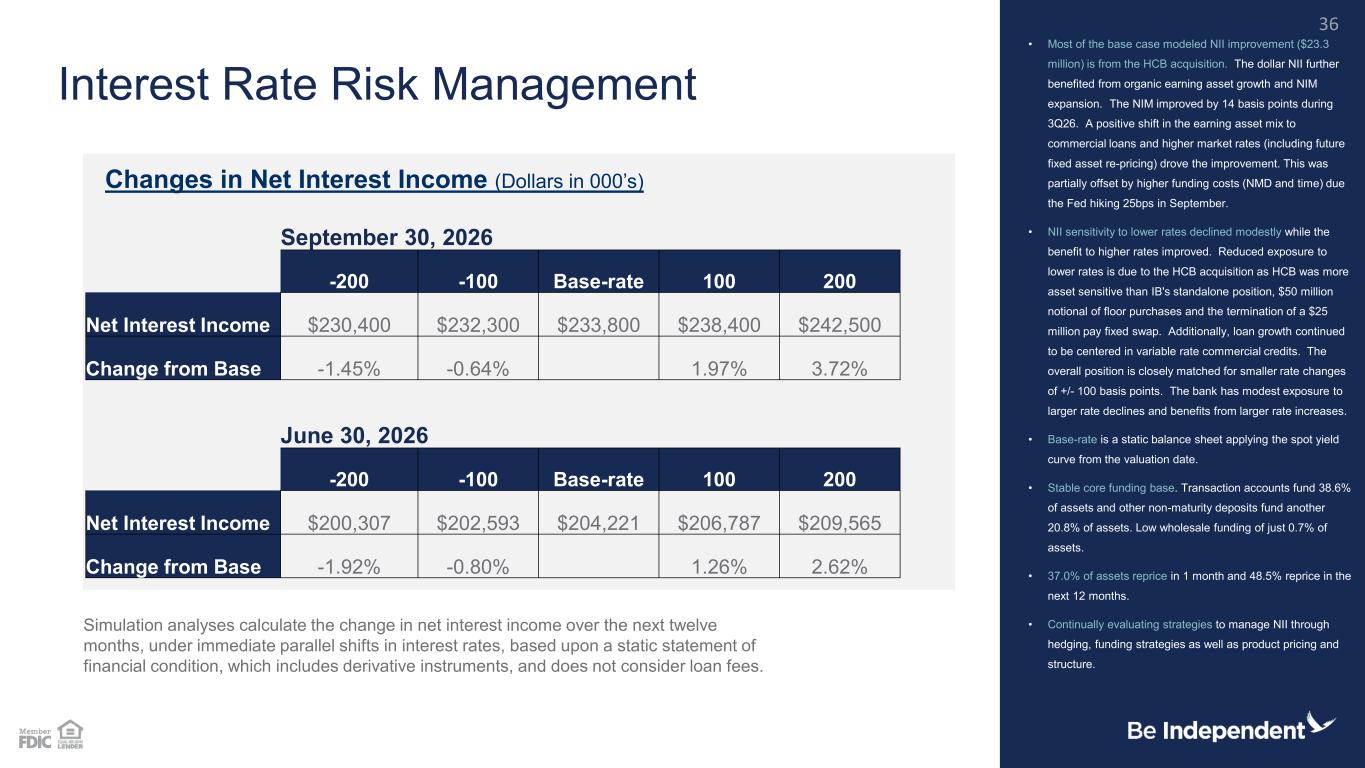
September 30, 2026 -200 -100 Base-rate 100 200 Net Interest Income $230,400 $232,300 $233,800 $238,400 $242,500 Change from Base -1.45% -0.64% 1.97% 3.72% June 30, 2026 -200 -100 Base-rate 100 200 Net Interest Income $200,307 $202,593 $204,221 $206,787 $209,565 Change from Base -1.92% -0.80% 1.26% 2.62% Interest Rate Risk Management • Most of the base case modeled NII improvement ($23.3 million) is from the HCB acquisition. The dollar NII further benefited from organic earning asset growth and NIM expansion. The NIM improved by 14 basis points during 3Q26. A positive shift in the earning asset mix to commercial loans and higher market rates (including future fixed asset re-pricing) drove the improvement. This was partially offset by higher funding costs (NMD and time) due the Fed hiking 25bps in September. • NII sensitivity to lower rates declined modestly while the benefit to higher rates improved. Reduced exposure to lower rates is due to the HCB acquisition as HCB was more asset sensitive than IB's standalone position, $50 million notional of floor purchases and the termination of a $25 million pay fixed swap. Additionally, loan growth continued to be centered in variable rate commercial credits. The overall position is closely matched for smaller rate changes of +/- 100 basis points. The bank has modest exposure to larger rate declines and benefits from larger rate increases. • Base-rate is a static balance sheet applying the spot yield curve from the valuation date. • Stable core funding base. Transaction accounts fund 38.6% of assets and other non-maturity deposits fund another 20.8% of assets. Low wholesale funding of just 0.7% of assets. • 37.0% of assets reprice in 1 month and 48.5% reprice in the next 12 months. • Continually evaluating strategies to manage NII through hedging, funding strategies as well as product pricing and structure. Changes in Net Interest Income (Dollars in 000’s) Simulation analyses calculate the change in net interest income over the next twelve months, under immediate parallel shifts in interest rates, based upon a static statement of financial condition, which includes derivative instruments, and does not consider loan fees. 36
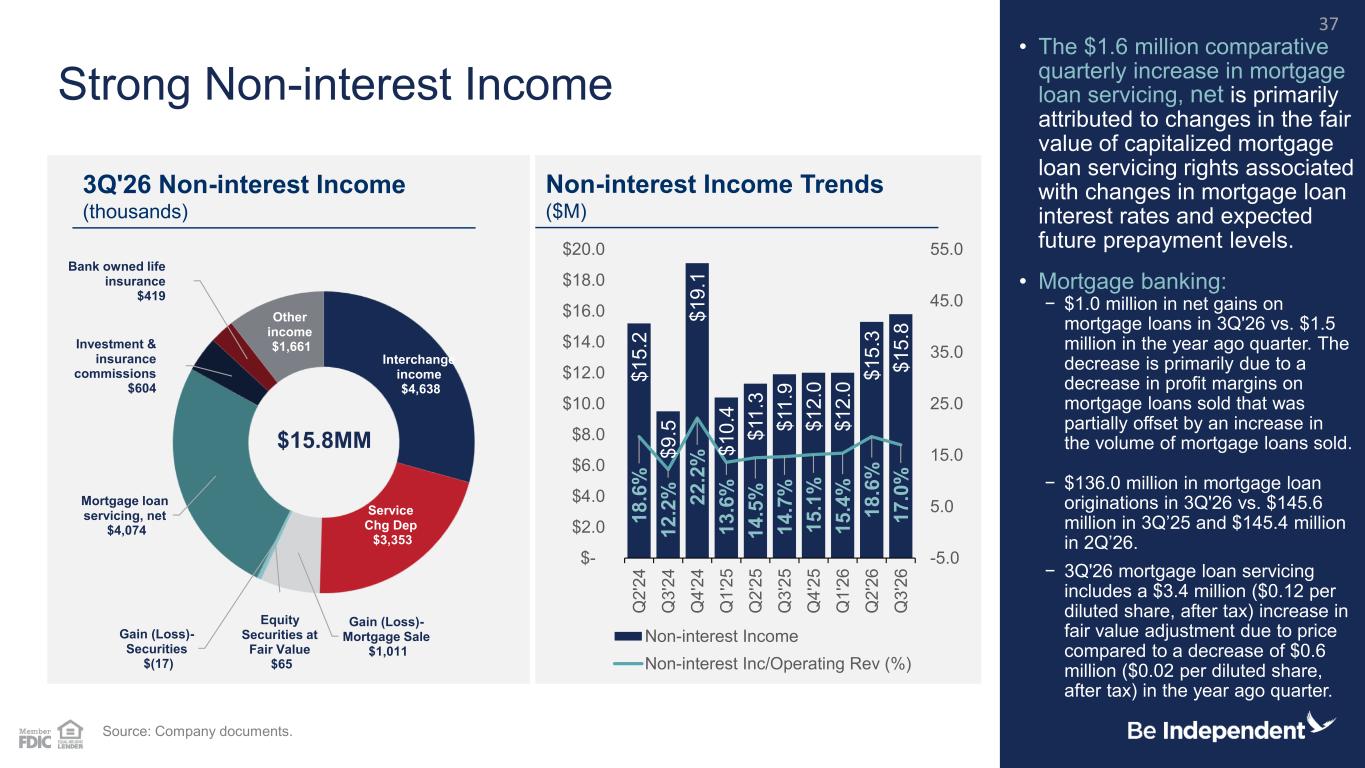
$ 1 5 .2 $ 9 .5 $ 1 9 .1 $ 1 0 .4 $ 1 1 .3 $ 1 1 .9 $ 1 2 .0 $ 1 2 .0 $ 1 5 .3 $ 1 5 .8 1 8 .6 % 1 2 .2 % 2 2 .2 % 1 3 .6 % 1 4 .5 % 1 4 .7 % 1 5 .1 % 1 5 .4 % 1 8 .6 % 1 7 .0 % -5.0 5.0 15.0 25.0 35.0 45.0 55.0 $- $2.0 $4.0 $6.0 $8.0 $10.0 $12.0 $14.0 $16.0 $18.0 $20.0 Q 2 '2 4 Q 3 '2 4 Q 4 '2 4 Q 1 '2 5 Q 2 '2 5 Q 3 '2 5 Q 4 '2 5 Q 1 '2 6 Q 2 '2 6 Q 3 '2 6 Non-interest Income Non-interest Inc/Operating Rev (%) Interchange income $4,638 Service Chg Dep $3,353 Gain (Loss)- Mortgage Sale $1,011 Equity Securities at Fair Value $65 Gain (Loss)- Securities $(17) Mortgage loan servicing, net $4,074 Investment & insurance commissions $604 Bank owned life insurance $419 Other income $1,661 Strong Non-interest Income • The $1.6 million comparative quarterly increase in mortgage loan servicing, net is primarily attributed to changes in the fair value of capitalized mortgage loan servicing rights associated with changes in mortgage loan interest rates and expected future prepayment levels. • Mortgage banking: − $1.0 million in net gains on mortgage loans in 3Q'26 vs. $1.5 million in the year ago quarter. The decrease is primarily due to a decrease in profit margins on mortgage loans sold that was partially offset by an increase in the volume of mortgage loans sold. − $136.0 million in mortgage loan originations in 3Q'26 vs. $145.6 million in 3Q’25 and $145.4 million in 2Q’26. − 3Q'26 mortgage loan servicing includes a $3.4 million ($0.12 per diluted share, after tax) increase in fair value adjustment due to price compared to a decrease of $0.6 million ($0.02 per diluted share, after tax) in the year ago quarter. Source: Company documents. 3Q'26 Non-interest Income (thousands) Non-interest Income Trends ($M) 37 $15.8MM
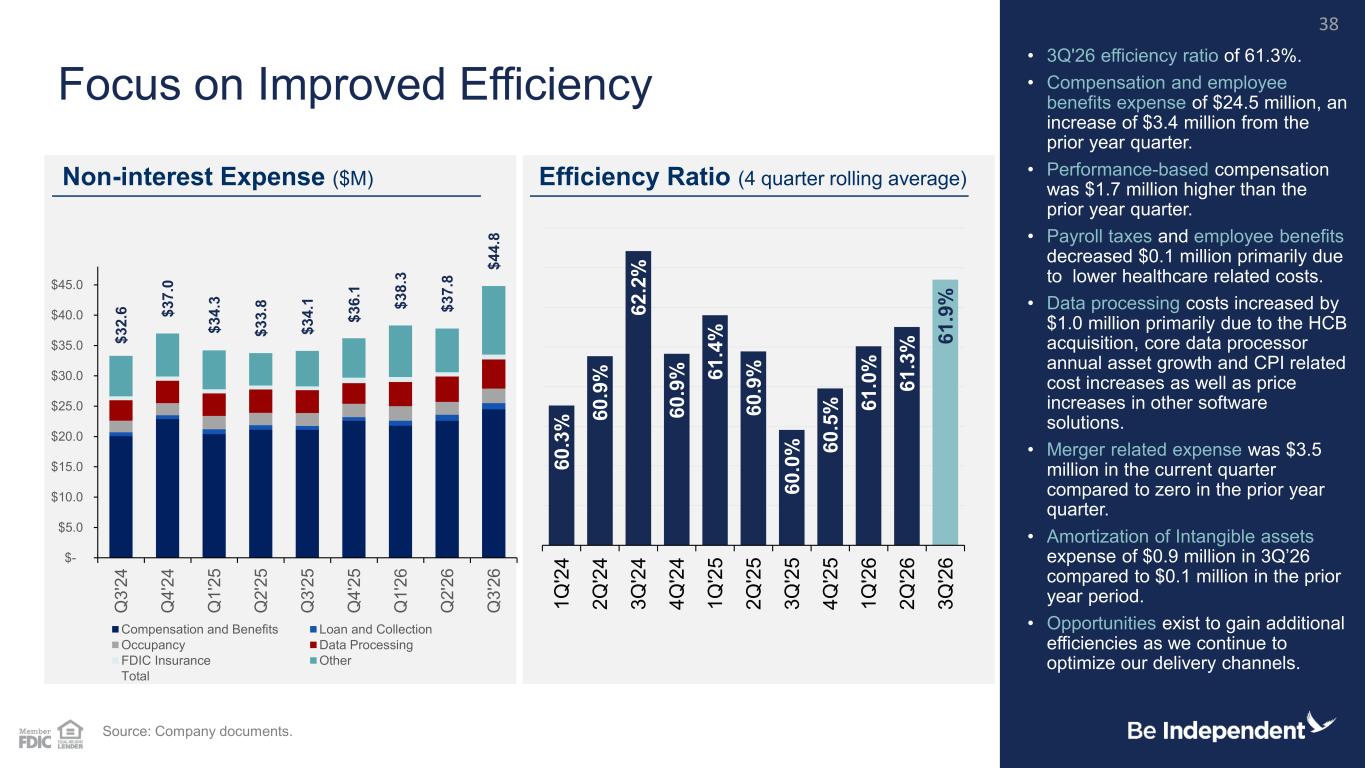
6 0 .3 % 6 0 .9 % 6 2 .2 % 6 0 .9 % 6 1 .4 % 6 0 .9 % 6 0 .0 % 6 0 .5 % 6 1 .0 % 6 1 .3 % 6 1 .9 % 1 Q '2 4 2 Q '2 4 3 Q '2 4 4 Q '2 4 1 Q '2 5 2 Q '2 5 3 Q '2 5 4 Q '2 5 1 Q '2 6 2 Q '2 6 3 Q '2 6 $ 3 2 .6 $ 3 7 .0 $ 3 4 .3 $ 3 3 .8 $ 3 4 .1 $ 3 6 .1 $ 3 8 .3 $ 3 7 .8 $ 4 4 .8 $- $5.0 $10.0 $15.0 $20.0 $25.0 $30.0 $35.0 $40.0 $45.0 Q 3 '2 4 Q 4 '2 4 Q 1 '2 5 Q 2 '2 5 Q 3 '2 5 Q 4 '2 5 Q 1 '2 6 Q 2 '2 6 Q 3 '2 6 Compensation and Benefits Loan and Collection Occupancy Data Processing FDIC Insurance Other Total Focus on Improved Efficiency • 3Q'26 efficiency ratio of 61.3%. • Compensation and employee benefits expense of $24.5 million, an increase of $3.4 million from the prior year quarter. • Performance-based compensation was $1.7 million higher than the prior year quarter. • Payroll taxes and employee benefits decreased $0.1 million primarily due to lower healthcare related costs. • Data processing costs increased by $1.0 million primarily due to the HCB acquisition, core data processor annual asset growth and CPI related cost increases as well as price increases in other software solutions. • Merger related expense was $3.5 million in the current quarter compared to zero in the prior year quarter. • Amortization of Intangible assets expense of $0.9 million in 3Q’26 compared to $0.1 million in the prior year period. • Opportunities exist to gain additional efficiencies as we continue to optimize our delivery channels. Non-interest Expense ($M) Efficiency Ratio (4 quarter rolling average) Source: Company documents. 38
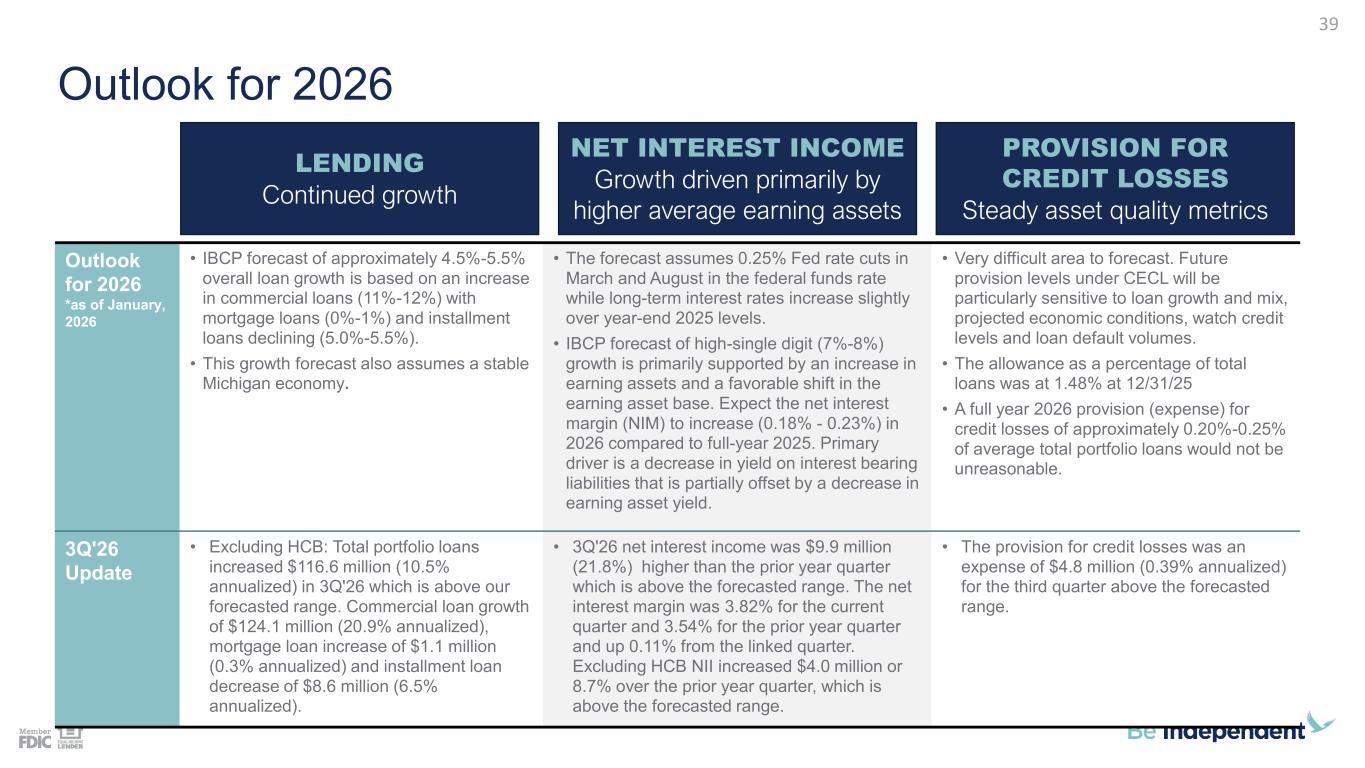
Outlook for 2026 Outlook for 2026 *as of January, 2026 • IBCP forecast of approximately 4.5%-5.5% overall loan growth is based on an increase in commercial loans (11%-12%) with mortgage loans (0%-1%) and installment loans declining (5.0%-5.5%). • This growth forecast also assumes a stable Michigan economy. • The forecast assumes 0.25% Fed rate cuts in March and August in the federal funds rate while long-term interest rates increase slightly over year-end 2025 levels. • IBCP forecast of high-single digit (7%-8%) growth is primarily supported by an increase in earning assets and a favorable shift in the earning asset base. Expect the net interest margin (NIM) to increase (0.18% - 0.23%) in 2026 compared to full-year 2025. Primary driver is a decrease in yield on interest bearing liabilities that is partially offset by a decrease in earning asset yield. • Very difficult area to forecast. Future provision levels under CECL will be particularly sensitive to loan growth and mix, projected economic conditions, watch credit levels and loan default volumes. • The allowance as a percentage of total loans was at 1.48% at 12/31/25 • A full year 2026 provision (expense) for credit losses of approximately 0.20%-0.25% of average total portfolio loans would not be unreasonable. 3Q'26 Update • Excluding HCB: Total portfolio loans increased $116.6 million (10.5% annualized) in 3Q'26 which is above our forecasted range. Commercial loan growth of $124.1 million (20.9% annualized), mortgage loan increase of $1.1 million (0.3% annualized) and installment loan decrease of $8.6 million (6.5% annualized). • 3Q'26 net interest income was $9.9 million (21.8%) higher than the prior year quarter which is above the forecasted range. The net interest margin was 3.82% for the current quarter and 3.54% for the prior year quarter and up 0.11% from the linked quarter. Excluding HCB NII increased $4.0 million or 8.7% over the prior year quarter, which is above the forecasted range. • The provision for credit losses was an expense of $4.8 million (0.39% annualized) for the third quarter above the forecasted range. LENDING Continued growth NET INTEREST INCOME Growth driven primarily by higher average earning assets PROVISION FOR CREDIT LOSSES Steady asset quality metrics 39
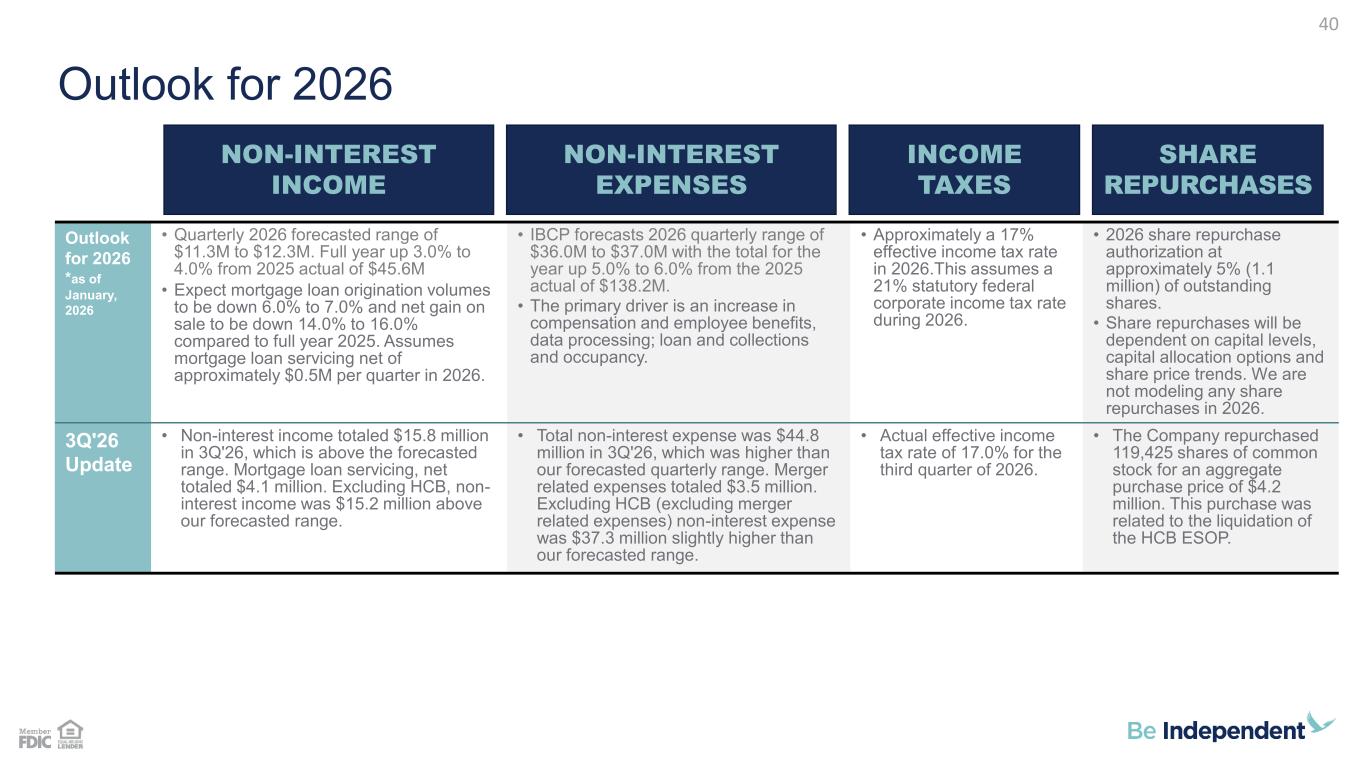
Outlook for 2026 Outlook for 2026 *as of January, 2026 • Quarterly 2026 forecasted range of $11.3M to $12.3M. Full year up 3.0% to 4.0% from 2025 actual of $45.6M • Expect mortgage loan origination volumes to be down 6.0% to 7.0% and net gain on sale to be down 14.0% to 16.0% compared to full year 2025. Assumes mortgage loan servicing net of approximately $0.5M per quarter in 2026. • IBCP forecasts 2026 quarterly range of $36.0M to $37.0M with the total for the year up 5.0% to 6.0% from the 2025 actual of $138.2M. • The primary driver is an increase in compensation and employee benefits, data processing; loan and collections and occupancy. • Approximately a 17% effective income tax rate in 2026.This assumes a 21% statutory federal corporate income tax rate during 2026. • 2026 share repurchase authorization at approximately 5% (1.1 million) of outstanding shares. • Share repurchases will be dependent on capital levels, capital allocation options and share price trends. We are not modeling any share repurchases in 2026. 3Q'26 Update • Non-interest income totaled $15.8 million in 3Q'26, which is above the forecasted range. Mortgage loan servicing, net totaled $4.1 million. Excluding HCB, non- interest income was $15.2 million above our forecasted range. • Total non-interest expense was $44.8 million in 3Q'26, which was higher than our forecasted quarterly range. Merger related expenses totaled $3.5 million. Excluding HCB (excluding merger related expenses) non-interest expense was $37.3 million slightly higher than our forecasted range. • Actual effective income tax rate of 17.0% for the third quarter of 2026. • The Company repurchased 119,425 shares of common stock for an aggregate purchase price of $4.2 million. This purchase was related to the liquidation of the HCB ESOP. NON-INTEREST INCOME NON-INTEREST EXPENSES INCOME TAXES SHARE REPURCHASES 40
Appendix Additional Financial Data and Non-GAAP Reconciliations 41
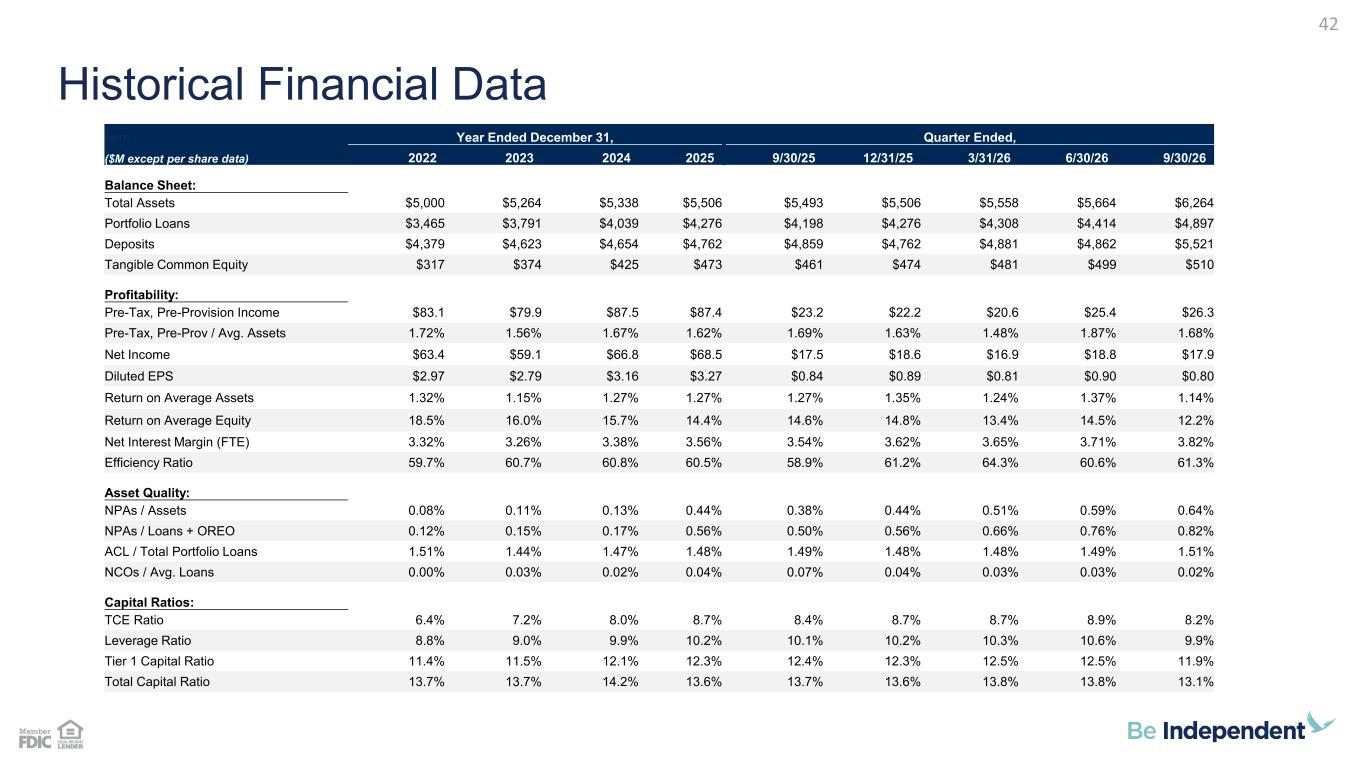
Historical Financial Data 42 here Year Ended December 31, Quarter Ended, ($M except per share data) 2022 2023 2024 2025 9/30/25 12/31/25 3/31/26 6/30/26 9/30/26 Balance Sheet: Total Assets $5,000 $5,264 $5,338 $5,506 $5,493 $5,506 $5,558 $5,664 $6,264 Portfolio Loans $3,465 $3,791 $4,039 $4,276 $4,198 $4,276 $4,308 $4,414 $4,897 Deposits $4,379 $4,623 $4,654 $4,762 $4,859 $4,762 $4,881 $4,862 $5,521 Tangible Common Equity $317 $374 $425 $473 $461 $474 $481 $499 $510 Profitability: Pre-Tax, Pre-Provision Income $83.1 $79.9 $87.5 $87.4 $23.2 $22.2 $20.6 $25.4 $26.3 Pre-Tax, Pre-Prov / Avg. Assets 1.72% 1.56% 1.67% 1.62% 1.69% 1.63% 1.48% 1.87% 1.68% Net Income $63.4 $59.1 $66.8 $68.5 $17.5 $18.6 $16.9 $18.8 $17.9 Diluted EPS $2.97 $2.79 $3.16 $3.27 $0.84 $0.89 $0.81 $0.90 $0.80 Return on Average Assets 1.32% 1.15% 1.27% 1.27% 1.27% 1.35% 1.24% 1.37% 1.14% Return on Average Equity 18.5% 16.0% 15.7% 14.4% 14.6% 14.8% 13.4% 14.5% 12.2% Net Interest Margin (FTE) 3.32% 3.26% 3.38% 3.56% 3.54% 3.62% 3.65% 3.71% 3.82% Efficiency Ratio 59.7% 60.7% 60.8% 60.5% 58.9% 61.2% 64.3% 60.6% 61.3% Asset Quality: NPAs / Assets 0.08% 0.11% 0.13% 0.44% 0.38% 0.44% 0.51% 0.59% 0.64% NPAs / Loans + OREO 0.12% 0.15% 0.17% 0.56% 0.50% 0.56% 0.66% 0.76% 0.82% ACL / Total Portfolio Loans 1.51% 1.44% 1.47% 1.48% 1.49% 1.48% 1.48% 1.49% 1.51% NCOs / Avg. Loans 0.00% 0.03% 0.02% 0.04% 0.07% 0.04% 0.03% 0.03% 0.02% Capital Ratios: TCE Ratio 6.4% 7.2% 8.0% 8.7% 8.4% 8.7% 8.7% 8.9% 8.2% Leverage Ratio 8.8% 9.0% 9.9% 10.2% 10.1% 10.2% 10.3% 10.6% 9.9% Tier 1 Capital Ratio 11.4% 11.5% 12.1% 12.3% 12.4% 12.3% 12.5% 12.5% 11.9% Total Capital Ratio 13.7% 13.7% 14.2% 13.6% 13.7% 13.6% 13.8% 13.8% 13.1%
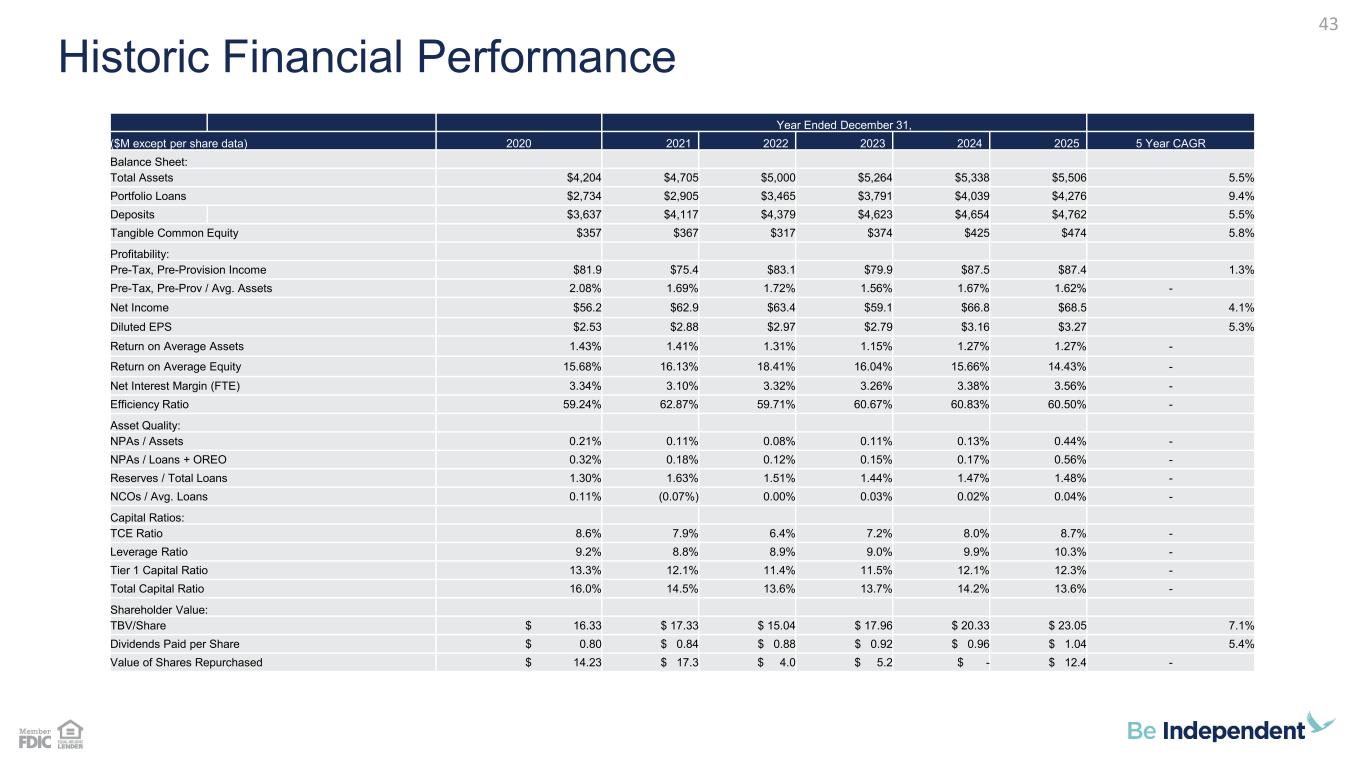
43 Historic Financial Performance Year Ended December 31, ($M except per share data) 2020 2021 2022 2023 2024 2025 5 Year CAGR Balance Sheet: Total Assets $4,204 $4,705 $5,000 $5,264 $5,338 $5,506 5.5% Portfolio Loans $2,734 $2,905 $3,465 $3,791 $4,039 $4,276 9.4% Deposits $3,637 $4,117 $4,379 $4,623 $4,654 $4,762 5.5% Tangible Common Equity $357 $367 $317 $374 $425 $474 5.8% Profitability: Pre-Tax, Pre-Provision Income $81.9 $75.4 $83.1 $79.9 $87.5 $87.4 1.3% Pre-Tax, Pre-Prov / Avg. Assets 2.08% 1.69% 1.72% 1.56% 1.67% 1.62% - Net Income $56.2 $62.9 $63.4 $59.1 $66.8 $68.5 4.1% Diluted EPS $2.53 $2.88 $2.97 $2.79 $3.16 $3.27 5.3% Return on Average Assets 1.43% 1.41% 1.31% 1.15% 1.27% 1.27% - Return on Average Equity 15.68% 16.13% 18.41% 16.04% 15.66% 14.43% - Net Interest Margin (FTE) 3.34% 3.10% 3.32% 3.26% 3.38% 3.56% - Efficiency Ratio 59.24% 62.87% 59.71% 60.67% 60.83% 60.50% - Asset Quality: NPAs / Assets 0.21% 0.11% 0.08% 0.11% 0.13% 0.44% - NPAs / Loans + OREO 0.32% 0.18% 0.12% 0.15% 0.17% 0.56% - Reserves / Total Loans 1.30% 1.63% 1.51% 1.44% 1.47% 1.48% - NCOs / Avg. Loans 0.11% (0.07%) 0.00% 0.03% 0.02% 0.04% - Capital Ratios: TCE Ratio 8.6% 7.9% 6.4% 7.2% 8.0% 8.7% - Leverage Ratio 9.2% 8.8% 8.9% 9.0% 9.9% 10.3% - Tier 1 Capital Ratio 13.3% 12.1% 11.4% 11.5% 12.1% 12.3% - Total Capital Ratio 16.0% 14.5% 13.6% 13.7% 14.2% 13.6% - Shareholder Value: TBV/Share $ 16.33 $ 17.33 $ 15.04 $ 17.96 $ 20.33 $ 23.05 7.1% Dividends Paid per Share $ 0.80 $ 0.84 $ 0.88 $ 0.92 $ 0.96 $ 1.04 5.4% Value of Shares Repurchased $ 14.23 $ 17.3 $ 4.0 $ 5.2 $ - $ 12.4 -
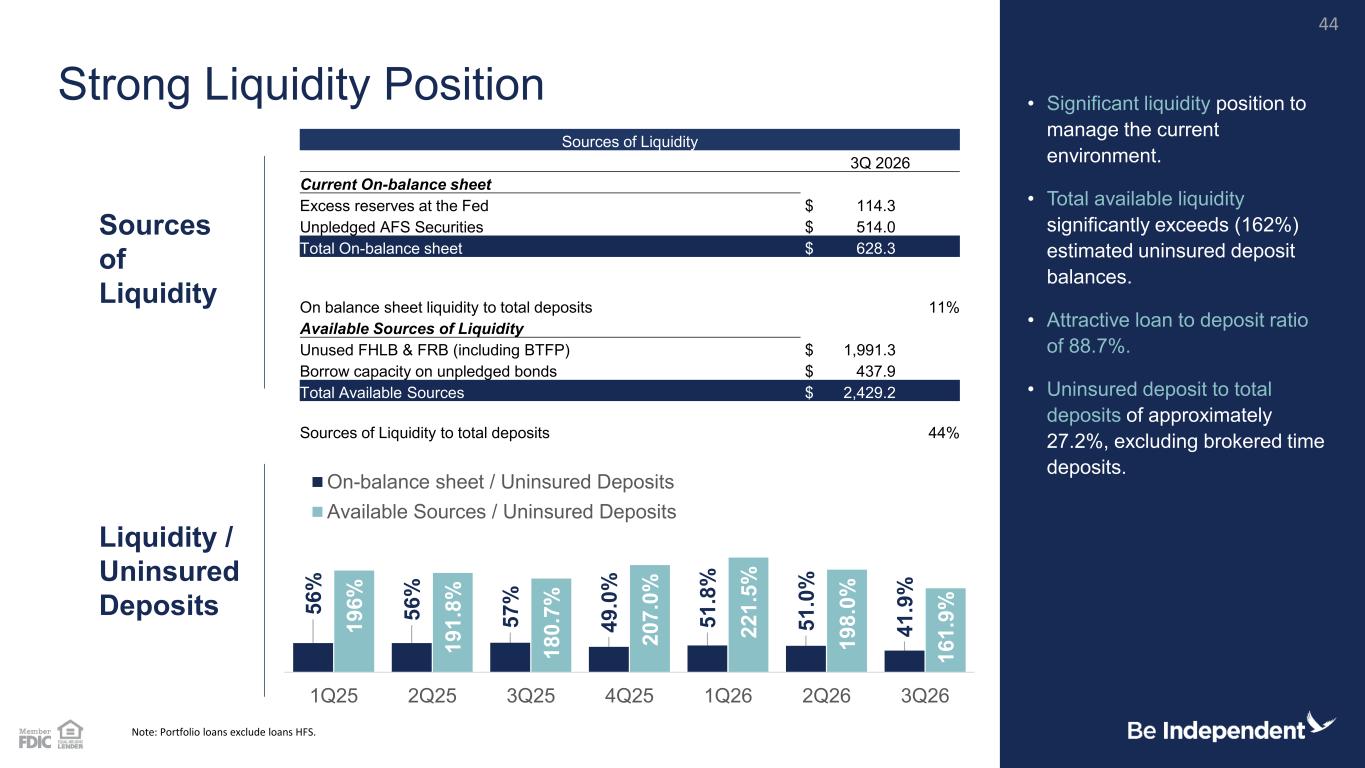
5 6 % 5 6 % 5 7 % 4 9 .0 % 5 1 .8 % 5 1 .0 % 4 1 .9 % 1 9 6 % 1 9 1 .8 % 1 8 0 .7 % 2 0 7 .0 % 2 2 1 .5 % 1 9 8 .0 % 1 6 1 .9 % 1Q25 2Q25 3Q25 4Q25 1Q26 2Q26 3Q26 On-balance sheet / Uninsured Deposits Available Sources / Uninsured Deposits Sources of Liquidity 3Q 2026 Current On-balance sheet Excess reserves at the Fed $ 114.3 Unpledged AFS Securities $ 514.0 Total On-balance sheet $ 628.3 On balance sheet liquidity to total deposits 11% Available Sources of Liquidity Unused FHLB & FRB (including BTFP) $ 1,991.3 Borrow capacity on unpledged bonds $ 437.9 Total Available Sources $ 2,429.2 Sources of Liquidity to total deposits 44% Note: Portfolio loans exclude loans HFS. Liquidity / Uninsured Deposits Strong Liquidity Position • Significant liquidity position to manage the current environment. • Total available liquidity significantly exceeds (162%) estimated uninsured deposit balances. • Attractive loan to deposit ratio of 88.7%. • Uninsured deposit to total deposits of approximately 27.2%, excluding brokered time deposits. Sources of Liquidity 44
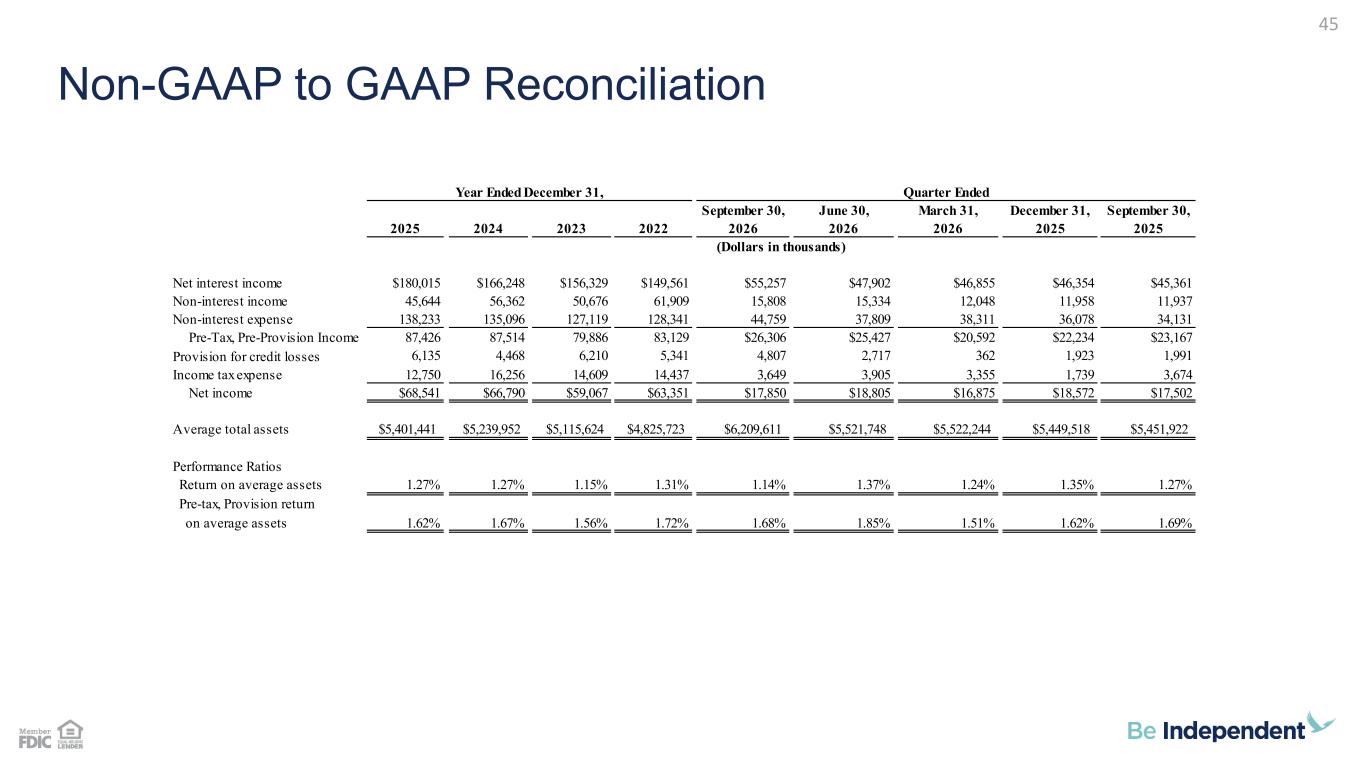
Non-GAAP to GAAP Reconciliation 45 September 30, June 30, March 31, December 31, September 30, 2025 2024 2023 2022 2026 2026 2026 2025 2025 Net interest income $180,015 $166,248 $156,329 $149,561 $55,257 $47,902 $46,855 $46,354 $45,361 Non-interest income 45,644 56,362 50,676 61,909 15,808 15,334 12,048 11,958 11,937 Non-interest expense 138,233 135,096 127,119 128,341 44,759 37,809 38,311 36,078 34,131 Pre-Tax, Pre-Provision Income 87,426 87,514 79,886 83,129 $26,306 $25,427 $20,592 $22,234 $23,167 Provision for credit losses 6,135 4,468 6,210 5,341 4,807 2,717 362 1,923 1,991 Income tax expense 12,750 16,256 14,609 14,437 3,649 3,905 3,355 1,739 3,674 Net income $68,541 $66,790 $59,067 $63,351 $17,850 $18,805 $16,875 $18,572 $17,502 Average total assets $5,401,441 $5,239,952 $5,115,624 $4,825,723 $6,209,611 $5,521,748 $5,522,244 $5,449,518 $5,451,922 Performance Ratios Return on average assets 1.27% 1.27% 1.15% 1.31% 1.14% 1.37% 1.24% 1.35% 1.27% Pre-tax, Provision return on average assets 1.62% 1.67% 1.56% 1.72% 1.68% 1.85% 1.51% 1.62% 1.69% Year Ended December 31, (Dollars in thousands) Quarter Ended
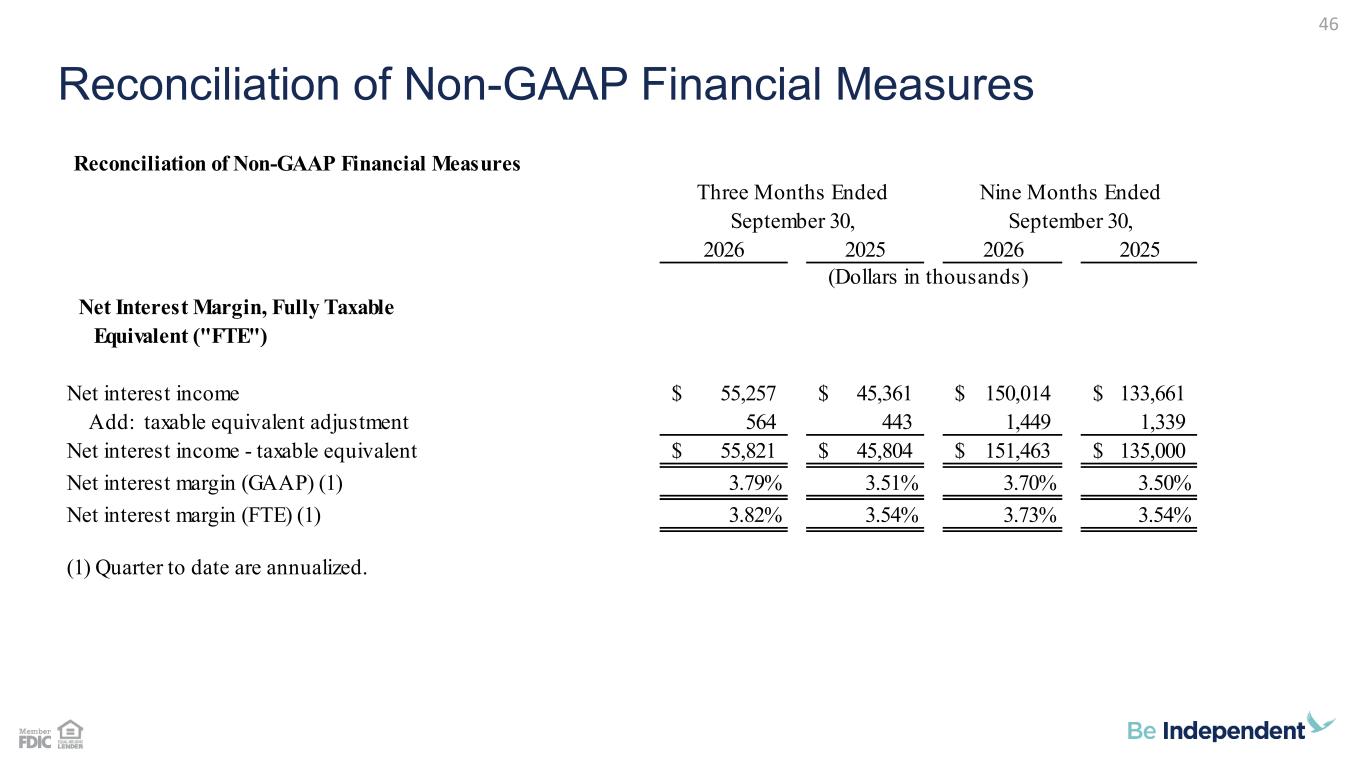
Reconciliation of Non-GAAP Financial Measures 46 Reconciliation of Non-GAAP Financial Measures 2026 2025 2026 2025 Net Interest Margin, Fully Taxable Equivalent ("FTE") Net interest income 55,257$ 45,361$ 150,014$ 133,661$ Add: taxable equivalent adjustment 564 443 1,449 1,339 Net interest income - taxable equivalent 55,821$ 45,804$ 151,463$ 135,000$ Net interest margin (GAAP) (1) 3.79% 3.51% 3.70% 3.50% Net interest margin (FTE) (1) 3.82% 3.54% 3.73% 3.54% (1) Quarter to date are annualized. Three Months Ended Nine Months Ended September 30, September 30, (Dollars in thousands)
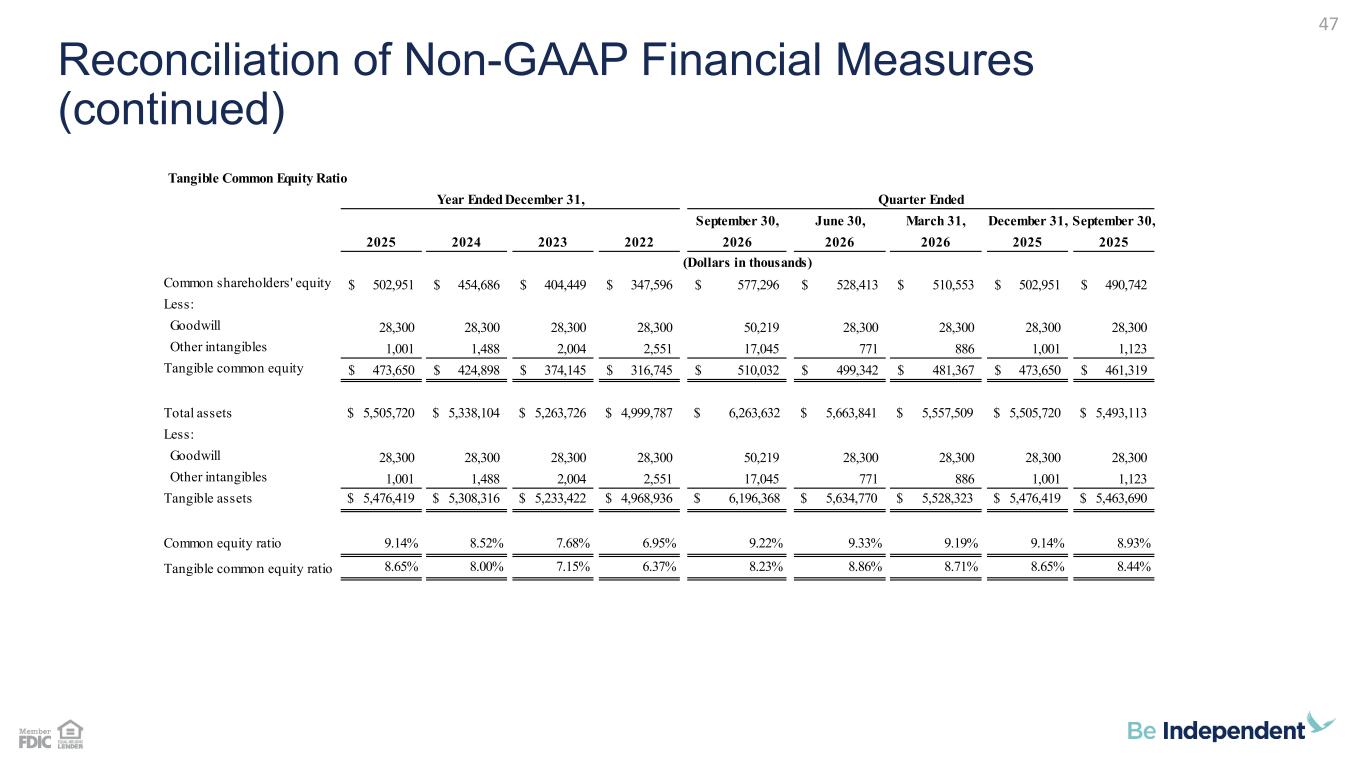
Reconciliation of Non-GAAP Financial Measures (continued) 47 Tangible Common Equity Ratio September 30, June 30, March 31, December 31, September 30, 2025 2024 2023 2022 2026 2026 2026 2025 2025 Common shareholders' equity 502,951$ 454,686$ 404,449$ 347,596$ 577,296$ 528,413$ 510,553$ 502,951$ 490,742$ Less: Goodwill 28,300 28,300 28,300 28,300 50,219 28,300 28,300 28,300 28,300 Other intangibles 1,001 1,488 2,004 2,551 17,045 771 886 1,001 1,123 Tangible common equity 473,650$ 424,898$ 374,145$ 316,745$ 510,032$ 499,342$ 481,367$ 473,650$ 461,319$ Total assets $ 5,505,720 $ 5,338,104 $ 5,263,726 $ 4,999,787 $ 6,263,632 $ 5,663,841 $ 5,557,509 $ 5,505,720 $ 5,493,113 Less: Goodwill 28,300 28,300 28,300 28,300 50,219 28,300 28,300 28,300 28,300 Other intangibles 1,001 1,488 2,004 2,551 17,045 771 886 1,001 1,123 Tangible assets $ 5,476,419 $ 5,308,316 $ 5,233,422 $ 4,968,936 $ 6,196,368 $ 5,634,770 $ 5,528,323 $ 5,476,419 $ 5,463,690 Common equity ratio 9.14% 8.52% 7.68% 6.95% 9.22% 9.33% 9.19% 9.14% 8.93% Tangible common equity ratio 8.65% 8.00% 7.15% 6.37% 8.23% 8.86% 8.71% 8.65% 8.44% Year Ended December 31, (Dollars in thousands) Quarter Ended
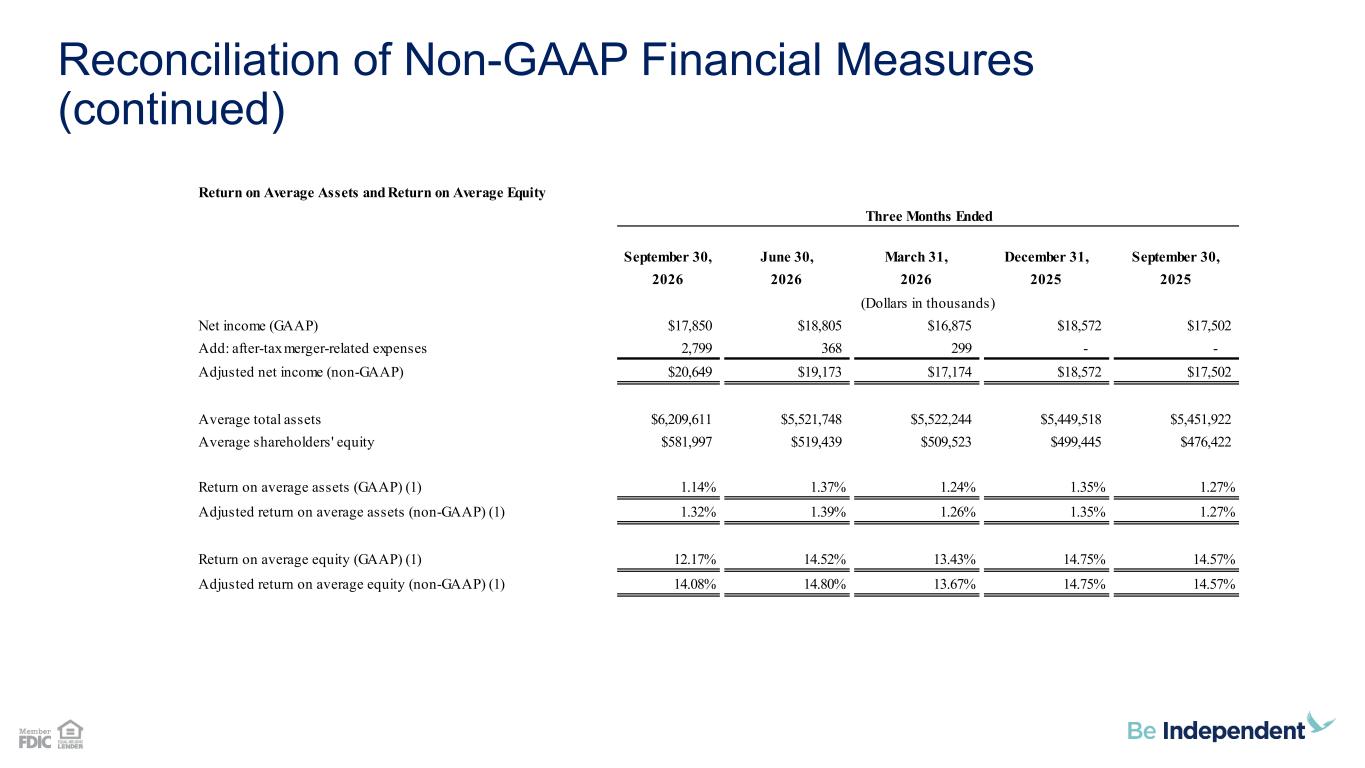
Reconciliation of Non-GAAP Financial Measures (continued) Return on Average Assets and Return on Average Equity September 30, June 30, March 31, December 31, September 30, 2026 2026 2026 2025 2025 Net income (GAAP) $17,850 $18,805 $16,875 $18,572 $17,502 Add: after-tax merger-related expenses 2,799 368 299 - - Adjusted net income (non-GAAP) $20,649 $19,173 $17,174 $18,572 $17,502 Average total assets $6,209,611 $5,521,748 $5,522,244 $5,449,518 $5,451,922 Average shareholders' equity $581,997 $519,439 $509,523 $499,445 $476,422 Return on average assets (GAAP) (1) 1.14% 1.37% 1.24% 1.35% 1.27% Adjusted return on average assets (non-GAAP) (1) 1.32% 1.39% 1.26% 1.35% 1.27% Return on average equity (GAAP) (1) 12.17% 14.52% 13.43% 14.75% 14.57% Adjusted return on average equity (non-GAAP) (1) 14.08% 14.80% 13.67% 14.75% 14.57% Three Months Ended (Dollars in thousands)
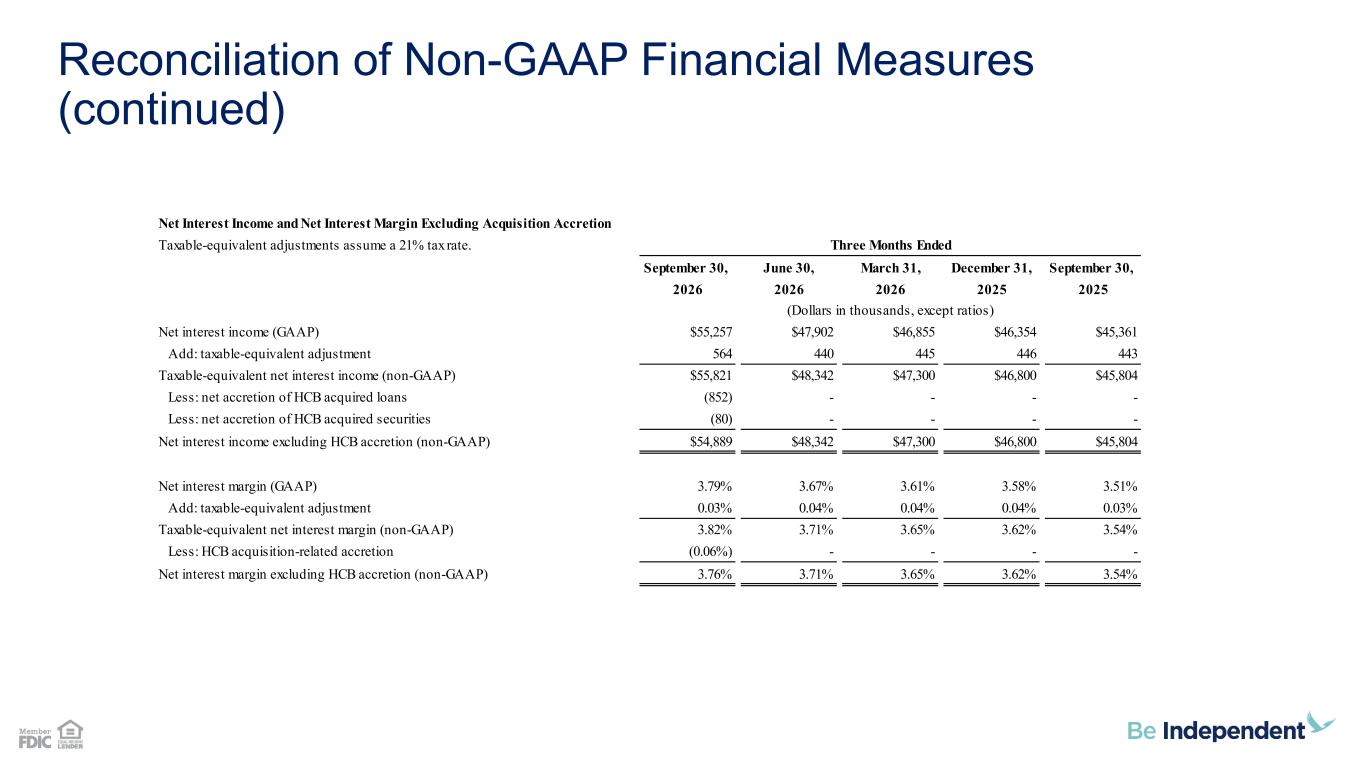
Reconciliation of Non-GAAP Financial Measures (continued) Net Interest Income and Net Interest Margin Excluding Acquisition Accretion Taxable-equivalent adjustments assume a 21% tax rate. September 30, June 30, March 31, December 31, September 30, 2026 2026 2026 2025 2025 Net interest income (GAAP) $55,257 $47,902 $46,855 $46,354 $45,361 Add: taxable-equivalent adjustment 564 440 445 446 443 Taxable-equivalent net interest income (non-GAAP) $55,821 $48,342 $47,300 $46,800 $45,804 Less: net accretion of HCB acquired loans (852) - - - - Less: net accretion of HCB acquired securities (80) - - - - Net interest income excluding HCB accretion (non-GAAP) $54,889 $48,342 $47,300 $46,800 $45,804 Net interest margin (GAAP) 3.79% 3.67% 3.61% 3.58% 3.51% Add: taxable-equivalent adjustment 0.03% 0.04% 0.04% 0.04% 0.03% Taxable-equivalent net interest margin (non-GAAP) 3.82% 3.71% 3.65% 3.62% 3.54% Less: HCB acquisition-related accretion (0.06%) - - - - Net interest margin excluding HCB accretion (non-GAAP) 3.76% 3.71% 3.65% 3.62% 3.54% Three Months Ended (Dollars in thousands, except ratios)