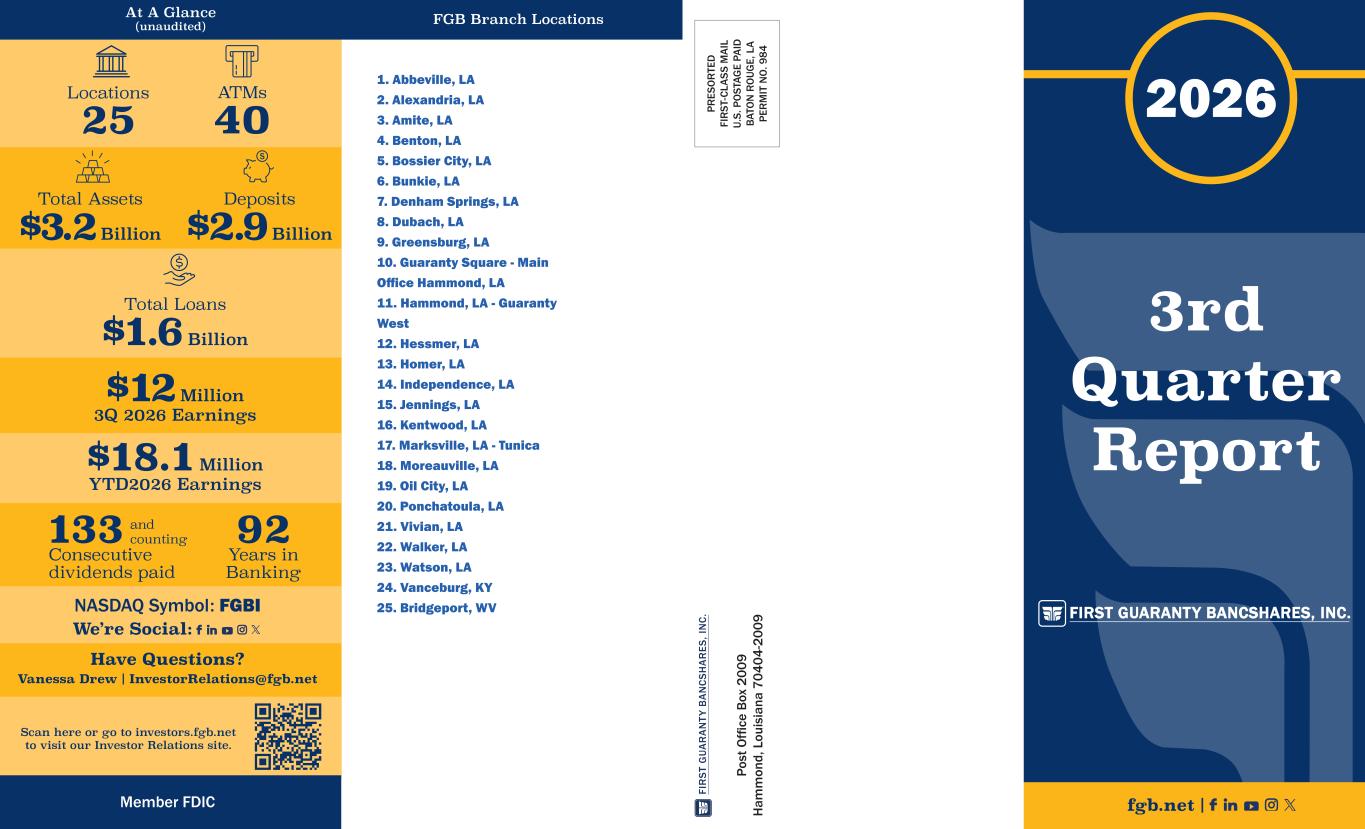
PR ES O R TE D FI R ST -C LA SS M A IL U. S. P O ST AG E PA ID B AT O N R O UG E, L A PE R M IT N O . 9 84 Total Assets $3.2 Billion Deposits $2.9 Billion Locations 25 ATMs 40 $12 Million 3Q 2026 Earnings $18.1 Million YTD2026 Earnings 133 Consecutive dividends paid and counting 92 Years in Banking Total Loans $1.6 Billion Member FDIC FIRST GUARANTY BANCSHARES, INC. 3rd Quarter Report 2026 fgb.net | FI R ST G UA R A N TY B A N CS H A R ES , I N C. Po st O ffi ce B ox 2 00 9 H am m on d, L ou is ia na 7 04 04 -2 00 9 NASDAQ Symbol: FGBI We’re Social: Scan here or go to investors.fgb.net to visit our Investor Relations site. Have Questions? Vanessa Drew | InvestorRelations@fgb.net At A Glance (unaudited) FGB Branch Locations 1. Abbeville, LA 2. Alexandria, LA 3. Amite, LA 4. Benton, LA 5. Bossier City, LA 6. Bunkie, LA 7. Denham Springs, LA 8. Dubach, LA 9. Greensburg, LA 10. Guaranty Square - Main Office Hammond, LA 11. Hammond, LA - Guaranty West 12. Hessmer, LA 13. Homer, LA 14. Independence, LA 15. Jennings, LA 16. Kentwood, LA 17. Marksville, LA - Tunica 18. Moreauville, LA 19. Oil City, LA 20. Ponchatoula, LA 21. Vivian, LA 22. Walker, LA 23. Watson, LA 24. Vanceburg, KY 25. Bridgeport, WV
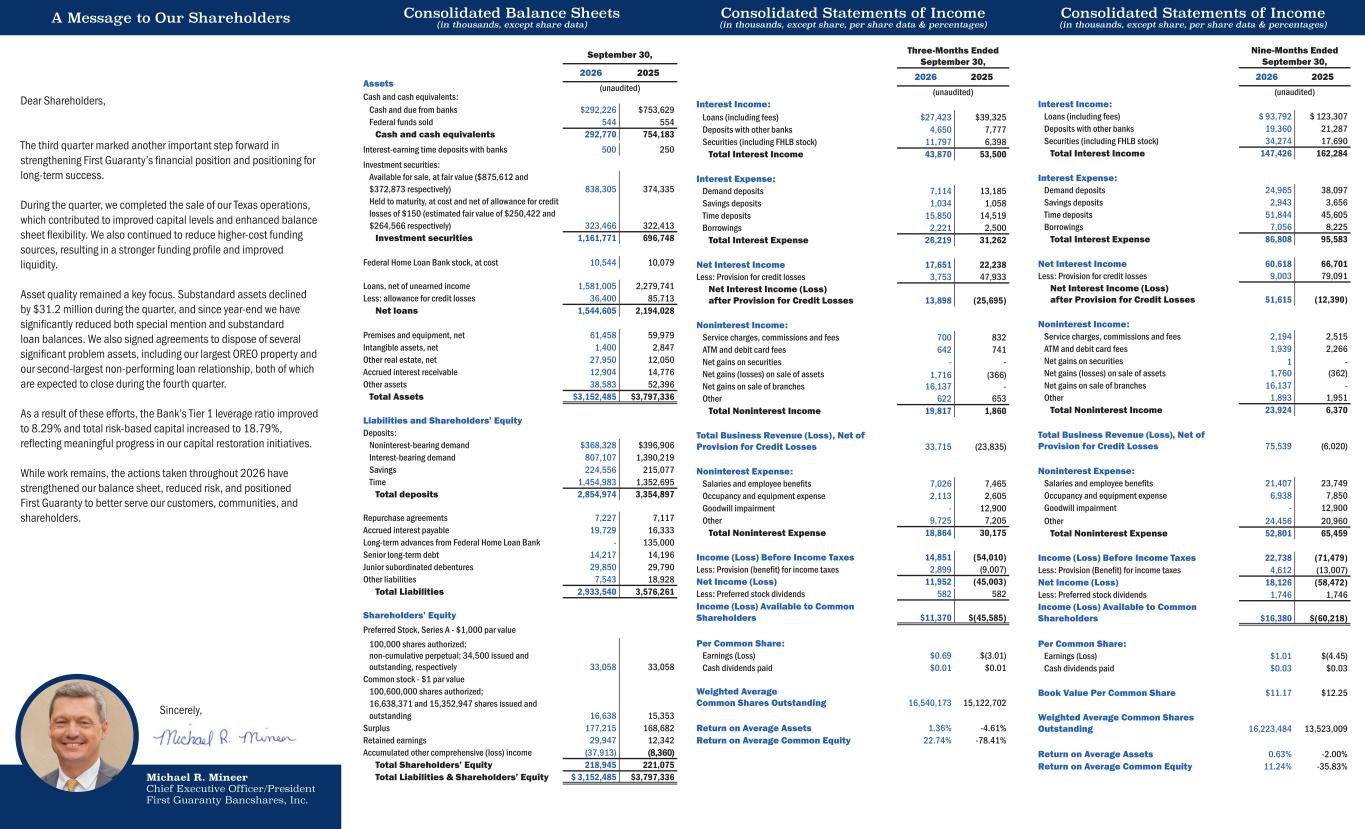
A Message to Our Shareholders Consolidated Balance Sheets (in thousands, except share data) Consolidated Statements of Income (in thousands, except share, per share data & percentages) Consolidated Statements of Income (in thousands, except share, per share data & percentages) Nine-Months Ended September 30, 2026 2025 (unaudited) Interest Income: Loans (including fees) $ 93,792 $ 123,307 Deposits with other banks 19,360 21,287 Securities (including FHLB stock) 34,274 17,690 Total Interest Income 147,426 162,284 Interest Expense: Demand deposits 24,965 38,097 Savings deposits 2,943 3,656 Time deposits 51,844 45,605 Borrowings 7,056 8,225 Total Interest Expense 86,808 95,583 Net Interest Income 60,618 66,701 Less: Provision for credit losses 9,003 79,091 Net Interest Income (Loss) after Provision for Credit Losses 51,615 (12,390) Noninterest Income: Service charges, commissions and fees 2,194 2,515 ATM and debit card fees 1,939 2,266 Net gains on securities Net gains (losses) on sale of assets 1 1,760 - (362) Net gains on sale of branches 16,137 - Other 1,893 1,951 Total Noninterest Income 23,924 6,370 Total Business Revenue (Loss), Net of Provision for Credit Losses 75,539 (6,020) Noninterest Expense: Salaries and employee benefits 21,407 23,749 Occupancy and equipment expense 6,938 7,850 Goodwill impairment - 12,900 Other 24,456 20,960 Total Noninterest Expense 52,801 65,459 Income (Loss) Before Income Taxes 22,738 (71,479) Less: Provision (Benefit) for income taxes 4,612 (13,007) Net Income (Loss) 18,126 (58,472) Less: Preferred stock dividends 1,746 1,746 Income (Loss) Available to Common Shareholders $16,380 $(60,218) Per Common Share: Earnings (Loss) $1.01 $(4.45) Cash dividends paid $0.03 $0.03 Book Value Per Common Share $11.17 $12.25 Weighted Average Common Shares Outstanding 16,223,484 13,523,009 Return on Average Assets 0.63% -2.00% Return on Average Common Equity 11.24% -35.83% Three-Months Ended September 30, 2026 2025 (unaudited) Interest Income: Loans (including fees) $27,423 $39,325 Deposits with other banks 4,650 7,777 Securities (including FHLB stock) 11,797 6,398 Total Interest Income 43,870 53,500 Interest Expense: Demand deposits 7,114 13,185 Savings deposits 1,034 1,058 Time deposits 15,850 14,519 Borrowings 2,221 2,500 Total Interest Expense 26,219 31,262 Net Interest Income 17,651 22,238 Less: Provision for credit losses 3,753 47,933 Net Interest Income (Loss) after Provision for Credit Losses 13,898 (25,695) Noninterest Income: Service charges, commissions and fees 700 832 ATM and debit card fees 642 741 Net gains on securities - - Net gains (losses) on sale of assets Net gains on sale of branches 1,716 16,137 (366) - Other 622 653 Total Noninterest Income 19,817 1,860 Total Business Revenue (Loss), Net of Provision for Credit Losses 33,715 (23,835) Noninterest Expense: Salaries and employee benefits 7,026 7,465 Occupancy and equipment expense 2,113 2,605 Goodwill impairment - 12,900 Other 9,725 7,205 Total Noninterest Expense 18,864 30,175 Income (Loss) Before Income Taxes 14,851 (54,010) Less: Provision (benefit) for income taxes 2,899 (9,007) Net Income (Loss) 11,952 (45,003) Less: Preferred stock dividends 582 582 Income (Loss) Available to Common Shareholders $11,370 $(45,585) Per Common Share: Earnings (Loss) $0.69 $(3.01) Cash dividends paid $0.01 $0.01 Weighted Average Common Shares Outstanding 16,540,173 15,122,702 Return on Average Assets 1.36% -4.61% Return on Average Common Equity 22.74% -78.41% Michael R. Mineer Chief Executive Officer/President First Guaranty Bancshares, Inc. Dear Shareholders, The third quarter marked another important step forward in strengthening First Guaranty’s financial position and positioning for long-term success. During the quarter, we completed the sale of our Texas operations, which contributed to improved capital levels and enhanced balance sheet flexibility. We also continued to reduce higher-cost funding sources, resulting in a stronger funding profile and improved liquidity. Asset quality remained a key focus. Substandard assets declined by $31.2 million during the quarter, and since year-end we have significantly reduced both special mention and substandard loan balances. We also signed agreements to dispose of several significant problem assets, including our largest OREO property and our second-largest non-performing loan relationship, both of which are expected to close during the fourth quarter. As a result of these efforts, the Bank’s Tier 1 leverage ratio improved to 8.29% and total risk-based capital increased to 18.79%, reflecting meaningful progress in our capital restoration initiatives. While work remains, the actions taken throughout 2026 have strengthened our balance sheet, reduced risk, and positioned First Guaranty to better serve our customers, communities, and shareholders. Sincerely, Assets Cash and cash equivalents: Cash and due from banks $292,226 $753,629 Federal funds sold 544 554 Cash and cash equivalents 292,770 754,183 Interest-earning time deposits with banks 500 250 Investment securities: Available for sale, at fair value ($875,612 and $372,873 respectively) 838,305 374,335 Held to maturity, at cost and net of allowance for credit losses of $150 (estimated fair value of $250,422 and $264,566 respectively) 323,466 322,413 Investment securities 1,161,771 696,748 Federal Home Loan Bank stock, at cost 10,544 10,079 Loans, net of unearned income 1,581,005 2,279,741 Less: allowance for credit losses 36,400 85,713 Net loans 1,544,605 2,194,028 Premises and equipment, net 61,458 59,979 Intangible assets, net 1,400 2,847 Other real estate, net 27,950 12,050 Accrued interest receivable 12,904 14,776 Other assets 38,583 52,396 Total Assets $3,152,485 $3,797,336 Liabilities and Shareholders’ Equity Deposits: Noninterest-bearing demand $368,328 $396,906 Interest-bearing demand 807,107 1,390,219 Savings 224,556 215,077 Time 1,454,983 1,352,695 Total deposits 2,854,974 3,354,897 Repurchase agreements 7,227 7,117 Accrued interest payable 19,729 16,333 Long-term advances from Federal Home Loan Bank - 135,000 Senior long-term debt 14,217 14,196 Junior subordinated debentures 29,850 29,790 Other liabilities 7,543 18,928 Total Liabilities 2,933,540 3,576,261 Shareholders’ Equity Preferred Stock, Series A - $1,000 par value 100,000 shares authorized; non-cumulative perpetual; 34,500 issued and outstanding, respectively 33,058 33,058 Common stock - $1 par value 100,600,000 shares authorized; 16,638,371 and 15,352,947 shares issued and outstanding 16,638 15,353 Surplus 177,215 168,682 Retained earnings 29,947 12,342 Accumulated other comprehensive (loss) income (37,913) (8,360) Total Shareholders’ Equity 218,945 221,075 Total Liabilities & Shareholders’ Equity $ 3,152,485 $3,797,336 September 30, 2026 2025 (unaudited)