Shareholder Report
Aug. 31, 2026
USD ($)
Holding
WHAT WERE THE FUND COSTS FOR THE LAST YEAR?
(Based on a hypothetical $10,000 investment)
Costs of a $10,000 investment |
Costs paid as a percentage of a $10,000 investment | |
PGIM Jennison Blend Fund—Class A |
$99 |
0.90% |
WHAT AFFECTED THE FUND’S PERFORMANCE DURING THE REPORTING PERIOD?
■ During the reporting period, equities generally advanced but experienced bouts of volatility. Despite sticky inflation, higher longer-term rates, changing expectations for U.S. Federal Reserve policy, concerns about artificial intelligence (AI) capital spending, and geopolitical uncertainty (primarily the U.S. war with Iran), equities gained ground due to a broadening of market leadership beyond mega-cap technology stocks that was supported by resilient earnings, as many areas of the market saw growth accelerate off weak, year-ago comparisons after several years of sub-trend fundamentals. Generally speaking, small caps outperformed large caps, and value outperformed growth over the period.
■
Stock selection within the healthcare (led by biotechnology) and financials (driven by capital markets) sectors contributed the most to the
Fund’s performance relative to its benchmark, the Russell 3000 Index (the “Index”).
■
Conversely, security selection within the communication services sector broadly, along with an underweight to information technology, detracted
the most from relative results.
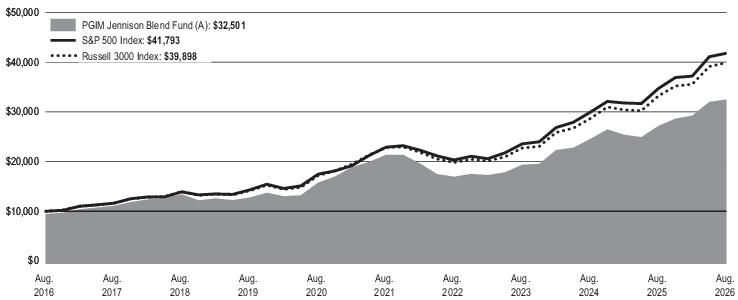
Average Annual Total Returns as of 8/31/2026 | |||
One Year (%) |
Five Years (%) |
Ten Years (%) | |
Class A with sales charges |
13.00% |
7.52% |
12.51% |
Class A without sales charges |
19.57% |
8.75% |
13.15% |
S&P 500 Index |
20.38% |
12.79% |
15.37% |
Russell 3000 Index |
20.10% |
11.80% |
14.84% |
WHAT ARE SOME KEY FUND STATISTICS AS OF 8/31/2026?
Fund’s net assets |
$ 1,162,213,356 |
Number of fund holdings |
280 |
Total advisory fees paid for the year |
$ 5,390,909 |
Portfolio turnover rate for the year |
69% |
WHAT ARE SOME CHARACTERISTICS OF THE FUND’S HOLDINGS AS OF 8/31/2026?
Industry Classification |
% of Net Assets |
Semiconductors & Semiconductor Equipment |
13.1% |
Software |
7.9% |
Banks |
7.7% |
Interactive Media & Services |
5.0% |
Technology Hardware, Storage & Peripherals |
4.7% |
Aerospace & Defense |
4.6% |
Pharmaceuticals |
4.4% |
Biotechnology |
4.1% |
Oil, Gas & Consumable Fuels |
3.9% |
Broadline Retail |
3.1% |
Machinery |
2.5% |
Entertainment |
2.3% |
Affiliated Mutual Fund - Short-Term Investment (1.0% represents investments purchased with collateral from securities on loan) |
2.3% |
Insurance |
2.2% |
Automobiles |
2.0% |
Health Care Providers & Services |
1.9% |
Consumer Staples Distribution & Retail |
1.7% |
Financial Services |
1.6% |
Capital Markets |
1.6% |
Electrical Equipment |
1.6% |
Hotels, Restaurants & Leisure |
1.5% |
Multi-Utilities |
1.3% |
Energy Equipment & Services |
1.3% |
Electronic Equipment, Instruments & Components |
1.1% |
Industry Classification |
% of Net Assets |
Specialty Retail |
1.1% |
Chemicals |
1.0% |
IT Services |
1.0% |
Household Durables |
1.0% |
Metals & Mining |
0.9% |
Building Products |
0.9% |
Communications Equipment |
0.9% |
Ground Transportation |
0.7% |
Professional Services |
0.6% |
Health Care Equipment & Supplies |
0.6% |
Retail REITs |
0.6% |
Mortgage Real Estate Investment Trusts (REITs) |
0.6% |
Industrial Conglomerates |
0.6% |
Textiles, Apparel & Luxury Goods |
0.6% |
Residential REITs |
0.5% |
Trading Companies & Distributors |
0.5% |
Life Sciences Tools & Services |
0.5% |
Industrial REITs |
0.5% |
Electric Utilities |
0.5% |
Others* |
4.1% |
101.1% | |
Liabilities in excess of other assets |
(1.1)% |
100.0% |
* |
Consists of Industries that each make up less than 0.5% of the Fund's net assets |
WHAT WERE THE FUND COSTS FOR THE LAST YEAR?
(Based on a hypothetical $10,000 investment)
Costs of a $10,000 investment |
Costs paid as a percentage of a $10,000 investment | |
PGIM Jennison Blend Fund—Class C |
$198 |
1.81% |
WHAT AFFECTED THE FUND’S PERFORMANCE DURING THE REPORTING PERIOD?
■ During the reporting period, equities generally advanced but experienced bouts of volatility. Despite sticky inflation, higher longer-term rates, changing expectations for U.S. Federal Reserve policy, concerns about artificial intelligence (AI) capital spending, and geopolitical uncertainty (primarily the U.S. war with Iran), equities gained ground due to a broadening of market leadership beyond mega-cap technology stocks that was supported by resilient earnings, as many areas of the market saw growth accelerate off weak, year-ago comparisons after several years of sub-trend fundamentals. Generally speaking, small caps outperformed large caps, and value outperformed growth over the period.
■
Stock selection within the healthcare (led by biotechnology) and financials (driven by capital markets) sectors contributed the most to the
Fund’s performance relative to its benchmark, the Russell 3000 Index (the “Index”).
■
Conversely, security selection within the communication services sector broadly, along with an underweight to information technology, detracted
the most from relative results.
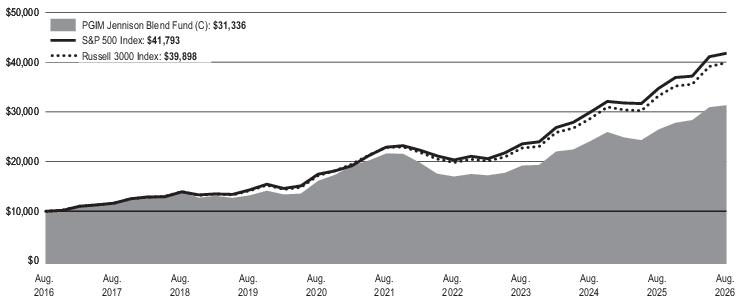
Average Annual Total Returns as of 8/31/2026 | |||
One Year (%) |
Five Years (%) |
Ten Years (%) | |
Class C with sales charges |
17.50% |
7.71% |
12.10% |
Class C without sales charges |
18.50% |
7.71% |
12.10% |
S&P 500 Index |
20.38% |
12.79% |
15.37% |
Russell 3000 Index |
20.10% |
11.80% |
14.84% |
WHAT ARE SOME KEY FUND STATISTICS AS OF 8/31/2026?
Fund’s net assets |
$ 1,162,213,356 |
Number of fund holdings |
280 |
Total advisory fees paid for the year |
$ 5,390,909 |
Portfolio turnover rate for the year |
69% |
WHAT ARE SOME CHARACTERISTICS OF THE FUND’S HOLDINGS AS OF 8/31/2026?
Industry Classification |
% of Net Assets |
Semiconductors & Semiconductor Equipment |
13.1% |
Software |
7.9% |
Banks |
7.7% |
Interactive Media & Services |
5.0% |
Technology Hardware, Storage & Peripherals |
4.7% |
Aerospace & Defense |
4.6% |
Pharmaceuticals |
4.4% |
Biotechnology |
4.1% |
Oil, Gas & Consumable Fuels |
3.9% |
Broadline Retail |
3.1% |
Machinery |
2.5% |
Entertainment |
2.3% |
Affiliated Mutual Fund - Short-Term Investment (1.0% represents investments purchased with collateral from securities on loan) |
2.3% |
Insurance |
2.2% |
Automobiles |
2.0% |
Health Care Providers & Services |
1.9% |
Consumer Staples Distribution & Retail |
1.7% |
Financial Services |
1.6% |
Capital Markets |
1.6% |
Electrical Equipment |
1.6% |
Hotels, Restaurants & Leisure |
1.5% |
Multi-Utilities |
1.3% |
Energy Equipment & Services |
1.3% |
Electronic Equipment, Instruments & Components |
1.1% |
Industry Classification |
% of Net Assets |
Specialty Retail |
1.1% |
Chemicals |
1.0% |
IT Services |
1.0% |
Household Durables |
1.0% |
Metals & Mining |
0.9% |
Building Products |
0.9% |
Communications Equipment |
0.9% |
Ground Transportation |
0.7% |
Professional Services |
0.6% |
Health Care Equipment & Supplies |
0.6% |
Retail REITs |
0.6% |
Mortgage Real Estate Investment Trusts (REITs) |
0.6% |
Industrial Conglomerates |
0.6% |
Textiles, Apparel & Luxury Goods |
0.6% |
Residential REITs |
0.5% |
Trading Companies & Distributors |
0.5% |
Life Sciences Tools & Services |
0.5% |
Industrial REITs |
0.5% |
Electric Utilities |
0.5% |
Others* |
4.1% |
101.1% | |
Liabilities in excess of other assets |
(1.1)% |
100.0% |
* |
Consists of Industries that each make up less than 0.5% of the Fund's net assets |
WHAT WERE THE FUND COSTS FOR THE LAST YEAR?
(Based on a hypothetical $10,000 investment)
Costs of a $10,000 investment |
Costs paid as a percentage of a $10,000 investment | |
PGIM Jennison Blend Fund—Class Z |
$69 |
0.63% |
WHAT AFFECTED THE FUND’S PERFORMANCE DURING THE REPORTING PERIOD?
■ During the reporting period, equities generally advanced but experienced bouts of volatility. Despite sticky inflation, higher longer-term rates, changing expectations for U.S. Federal Reserve policy, concerns about artificial intelligence (AI) capital spending, and geopolitical uncertainty (primarily the U.S. war with Iran), equities gained ground due to a broadening of market leadership beyond mega-cap technology stocks that was supported by resilient earnings, as many areas of the market saw growth accelerate off weak, year-ago comparisons after several years of sub-trend fundamentals. Generally speaking, small caps outperformed large caps, and value outperformed growth over the period.
■
Stock selection within the healthcare (led by biotechnology) and financials (driven by capital markets) sectors contributed the most to the
Fund’s performance relative to its benchmark, the Russell 3000 Index (the “Index”).
■
Conversely, security selection within the communication services sector broadly, along with an underweight to information technology, detracted
the most from relative results.
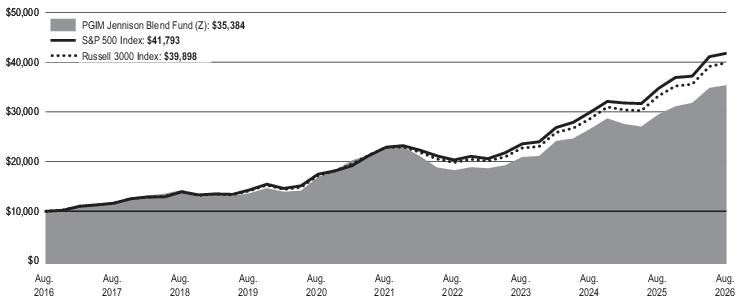
Average Annual Total Returns as of 8/31/2026 | |||
One Year (%) |
Five Years (%) |
Ten Years (%) | |
Class Z |
19.94% |
9.06% |
13.47% |
S&P 500 Index |
20.38% |
12.79% |
15.37% |
Russell 3000 Index |
20.10% |
11.80% |
14.84% |
WHAT ARE SOME KEY FUND STATISTICS AS OF 8/31/2026?
Fund’s net assets |
$1,162,213,356 |
Number of fund holdings |
280 |
Total advisory fees paid for the year |
$5,390,909 |
Portfolio turnover rate for the year |
69% |
WHAT ARE SOME CHARACTERISTICS OF THE FUND’S HOLDINGS AS OF 8/31/2026?
Industry Classification |
% of Net Assets |
Semiconductors & Semiconductor Equipment |
13.1% |
Software |
7.9% |
Banks |
7.7% |
Interactive Media & Services |
5.0% |
Technology Hardware, Storage & Peripherals |
4.7% |
Aerospace & Defense |
4.6% |
Pharmaceuticals |
4.4% |
Biotechnology |
4.1% |
Oil, Gas & Consumable Fuels |
3.9% |
Broadline Retail |
3.1% |
Machinery |
2.5% |
Entertainment |
2.3% |
Affiliated Mutual Fund - Short-Term Investment (1.0% represents investments purchased with collateral from securities on loan) |
2.3% |
Insurance |
2.2% |
Automobiles |
2.0% |
Health Care Providers & Services |
1.9% |
Consumer Staples Distribution & Retail |
1.7% |
Financial Services |
1.6% |
Capital Markets |
1.6% |
Electrical Equipment |
1.6% |
Hotels, Restaurants & Leisure |
1.5% |
Multi-Utilities |
1.3% |
Energy Equipment & Services |
1.3% |
Electronic Equipment, Instruments & Components |
1.1% |
Industry Classification |
% of Net Assets |
Specialty Retail |
1.1% |
Chemicals |
1.0% |
IT Services |
1.0% |
Household Durables |
1.0% |
Metals & Mining |
0.9% |
Building Products |
0.9% |
Communications Equipment |
0.9% |
Ground Transportation |
0.7% |
Professional Services |
0.6% |
Health Care Equipment & Supplies |
0.6% |
Retail REITs |
0.6% |
Mortgage Real Estate Investment Trusts (REITs) |
0.6% |
Industrial Conglomerates |
0.6% |
Textiles, Apparel & Luxury Goods |
0.6% |
Residential REITs |
0.5% |
Trading Companies & Distributors |
0.5% |
Life Sciences Tools & Services |
0.5% |
Industrial REITs |
0.5% |
Electric Utilities |
0.5% |
Others* |
4.1% |
101.1% | |
Liabilities in excess of other assets |
(1.1)% |
100.0% |
* |
Consists of Industries that each make up less than 0.5% of the Fund's net assets |
WHAT WERE THE FUND COSTS FOR THE LAST YEAR?
(Based on a hypothetical $10,000 investment)
Costs of a $10,000 investment |
Costs paid as a percentage of a $10,000 investment | |
PGIM Jennison Blend Fund—Class R6 |
$69 |
0.63% |
WHAT AFFECTED THE FUND’S PERFORMANCE DURING THE REPORTING PERIOD?
■ During the reporting period, equities generally advanced but experienced bouts of volatility. Despite sticky inflation, higher longer-term rates, changing expectations for U.S. Federal Reserve policy, concerns about artificial intelligence (AI) capital spending, and geopolitical uncertainty (primarily the U.S. war with Iran), equities gained ground due to a broadening of market leadership beyond mega-cap technology stocks that was supported by resilient earnings, as many areas of the market saw growth accelerate off weak, year-ago comparisons after several years of sub-trend fundamentals. Generally speaking, small caps outperformed large caps, and value outperformed growth over the period.
■
Stock selection within the healthcare (led by biotechnology) and financials (driven by capital markets) sectors contributed the most to the
Fund’s performance relative to its benchmark, the Russell 3000 Index (the “Index”).
■
Conversely, security selection within the communication services sector broadly, along with an underweight to information technology, detracted
the most from relative results.
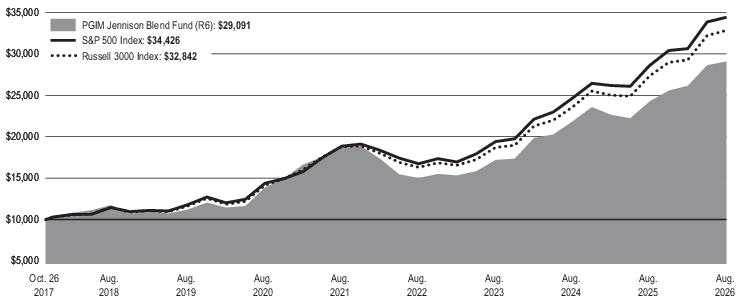
Average Annual Total Returns as of 8/31/2026 | |||
One Year (%) |
Five Years (%) |
Since Inception (%) | |
Class R6 |
19.93% |
9.07% |
12.83% (10/26/2017) |
S&P 500 Index |
20.38% |
12.79% |
15.02% |
Russell 3000 Index |
20.10% |
11.80% |
14.41% |
WHAT ARE SOME KEY FUND STATISTICS AS OF 8/31/2026?
Fund’s net assets |
$1,162,213,356 |
Number of fund holdings |
280 |
Total advisory fees paid for the year |
$5,390,909 |
Portfolio turnover rate for the year |
69% |
Industry Classification |
% of Net Assets |
Semiconductors & Semiconductor Equipment |
13.1% |
Software |
7.9% |
Banks |
7.7% |
Interactive Media & Services |
5.0% |
Technology Hardware, Storage & Peripherals |
4.7% |
Aerospace & Defense |
4.6% |
Pharmaceuticals |
4.4% |
Biotechnology |
4.1% |
Oil, Gas & Consumable Fuels |
3.9% |
Broadline Retail |
3.1% |
Machinery |
2.5% |
Entertainment |
2.3% |
Affiliated Mutual Fund - Short-Term Investment (1.0% represents investments purchased with collateral from securities on loan) |
2.3% |
Insurance |
2.2% |
Automobiles |
2.0% |
Health Care Providers & Services |
1.9% |
Consumer Staples Distribution & Retail |
1.7% |
Financial Services |
1.6% |
Capital Markets |
1.6% |
Electrical Equipment |
1.6% |
Hotels, Restaurants & Leisure |
1.5% |
Multi-Utilities |
1.3% |
Energy Equipment & Services |
1.3% |
Electronic Equipment, Instruments & Components |
1.1% |
Industry Classification |
% of Net Assets |
Specialty Retail |
1.1% |
Chemicals |
1.0% |
IT Services |
1.0% |
Household Durables |
1.0% |
Metals & Mining |
0.9% |
Building Products |
0.9% |
Communications Equipment |
0.9% |
Ground Transportation |
0.7% |
Professional Services |
0.6% |
Health Care Equipment & Supplies |
0.6% |
Retail REITs |
0.6% |
Mortgage Real Estate Investment Trusts (REITs) |
0.6% |
Industrial Conglomerates |
0.6% |
Textiles, Apparel & Luxury Goods |
0.6% |
Residential REITs |
0.5% |
Trading Companies & Distributors |
0.5% |
Life Sciences Tools & Services |
0.5% |
Industrial REITs |
0.5% |
Electric Utilities |
0.5% |
Others* |
4.1% |
101.1% | |
Liabilities in excess of other assets |
(1.1)% |
100.0% |
* |
Consists of Industries that each make up less than 0.5% of the Fund's net assets |