Shareholder Report
Aug. 31, 2026
USD ($)
$ / shares
WHAT WERE THE FUND COSTS FOR THE PAST YEAR? (based on a hypothetical $10,000 investment)
|
Class Name
|
Costs of a $10,000 investment
|
Costs paid as a percentage of a $10,000 investment
|
|
Class A
|
$100
|
0.99%
|
HOW DID THE FUND PERFORM LAST YEAR AND WHAT AFFECTED ITS PERFORMANCE?
POSITIONING
Other than the very front end of the yield curve, interest rates rose during the Fund’s fiscal year ended August 31, 2026 (the “fiscal year” or “period”). The U.S. Treasury yield curve flattened with the 3-year point rising 0.83% while the 30-year point rose only 0.31%. Interest rates on treasury bills inside six months fell as the Federal Reserve (Fed) cut the Federal Funds Target Rate on three occasions early in the period for a total reduction of 0.75%. Interest rates were relatively stable during the first half of the fiscal year, but rose in the second half of the fiscal year as the U.S. conflict with Iran impacted energy prices, inflation remained elevated, and the Fed ceased its interest rate cutting cycle.
Credit spreads tightened modestly during the period interrupted only by a brief bout of widening following the onset of the U.S./Iran conflict in the middle of the fiscal year. Around that same time, there were also heightened concerns surrounding negative ramifications of Artificial Intelligence on software companies and private credit lenders. High-yield corporate (HY) spreads tightened 0.11% and ended the period at 2.61%. Investment grade corporate (IG) spreads tightened 0.01% to end the period at 0.78% (Source: Bloomberg).
Within sectors we term Interest Rate Defense, the Fund increased exposure to Asset Backed Securities (ABS), Non-Agency Commercial Mortgage-Backed Securities (CMBS), and HY Corporates. Yields from the 2-year to the 5-year part of the U.S. Treasury yield curve rose significantly during the period and these sectors are largely fixed rate bonds pricing off that part of the curve. HY bonds were also added opportunistically throughout the period, such as during the brief bout of volatility in the middle of the fiscal year. The Fund reduced its Collateralized Loan Obligations (CLOs), which are primarily floating rate securities, as well as Agency CMBS and Non-Agency Residential Mortgage-Backed Securities (RMBS), which benefit less from higher front-end interest rates.
Within sectors we term Interest Rate Offense, the Fund decreased its exposure to Tax-Exempt Municipal bonds as that sector rallied significantly and became less attractive relative to taxable alternatives. The Fund chose to add to 15- to 20-year U.S. Treasuries and IG Corporates. We find treasuries attractive with the 20-year U.S. Treasury approaching record high yield levels and spreads remaining relatively tight. However, opportunities did present themselves during the period to invest in reasonably priced corporate bonds with some exposure added to the intermediate part of the curve and some farther out the curve.
|
Top Contributors
|
|
|
↑
|
Non-Agency Residential Mortgage-Backed Securities, High-Yield Corporates, Agency and Non-Agency Commercial Mortgage-Backed Securities, Collateralized Loan Obligations, Asset Backed Securities, and the Fund’s Investment Grade Corporate exposure to banks
|
|
Top Detractors
|
|
|
↓
|
U.S. Treasuries and Investment-Grade Corporates (primarily non-banks)
|
PERFORMANCE
The Fund’s underperformance relative to the Bloomberg U.S. Aggregate Bond Index (the “Index”) was driven by two primary factors. First, the Fund benefited from strong performance from less interest rate-sensitive sectors or what we term Interest Rate Defense. Non-Agency RMBS, HY Corporates, Agency and Non-Agency CMBS, CLOs, ABS, and the Fund’s IG Corporate exposure to banks all contributed meaningfully to the Fund’s outperformance. Despite these sectors being largely positioned on the front end of the U.S. Treasury yield curve where interest rates rose more meaningfully, higher coupon interest income, tighter credit spreads, and overall less interest rate sensitivity helped offset interest rate increases.
Second, the Fund’s more interest rate-sensitive sectors, or what we term Interest Rate Offense, were primarily positioned in the 15- to 20-year part of the U.S. Treasury yield curve where interest rate movements were more muted relative to the intermediate part of the curve. This yield curve positioning and credit spread tightening led to outperformance within the Fund’s Tax-Exempt and Taxable Municipal bond allocations.
Detracting somewhat from performance were the Fund’s U.S. Treasuries and IG Corporates (primarily non-banks), which have relatively long maturities and thus more interest-rate sensitivity, but also did not exhibit spread tightening to offset interest rate increases.
Of the major components of the Index, U.S. Treasuries (approximately 46% of the Index) and IG Corporates (approximately 24% of the Index) detracted from Index performance. These sectors were more heavily weighted to the intermediate part of the U.S. Treasury yield curve where interest rate increases were more pronounced. While Agency Mortgage Backed Securities (MBS) (approximately 23% of the Index) were similarly more exposed to the intermediate part of the curve, the sector benefited from spread tightening that helped to offset interest rate moves.
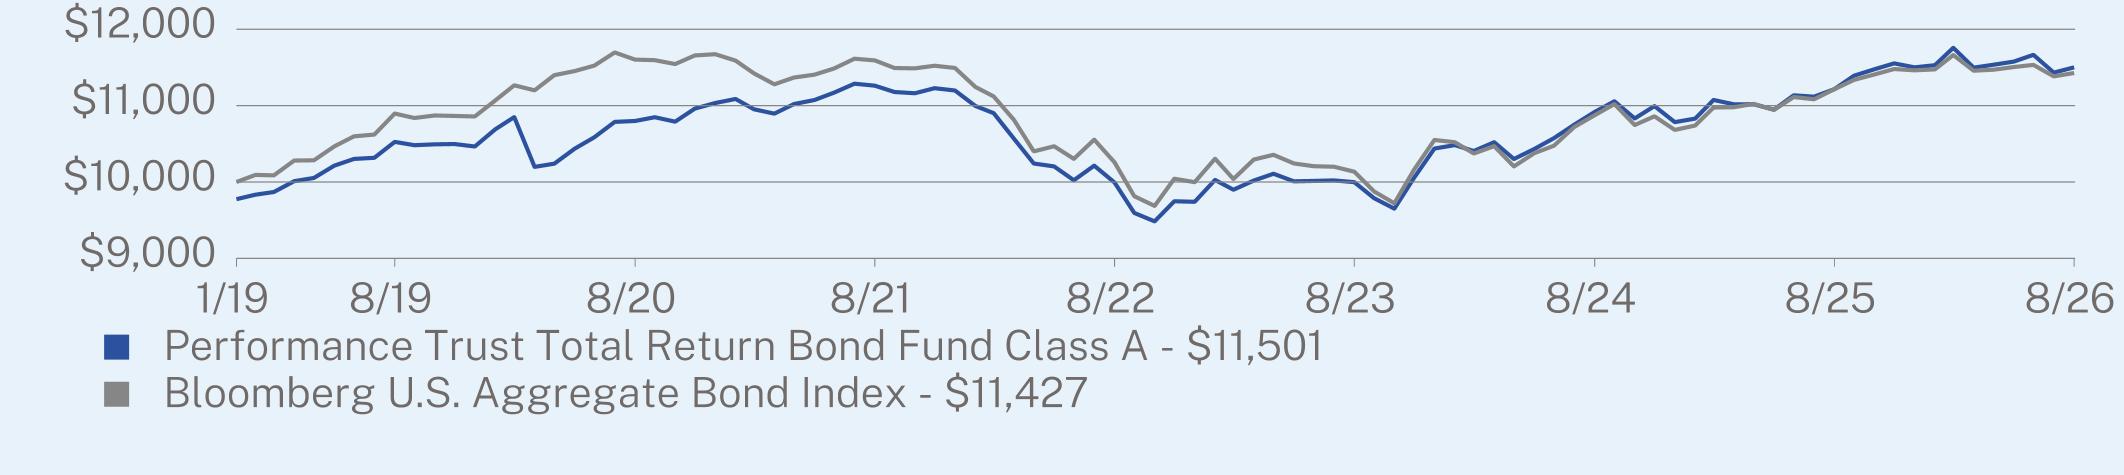
ANNUAL AVERAGE TOTAL RETURN (%)
|
|
1 Year
|
5 Year
|
Since Inception
(01/02/2019) |
|
Class A (without sales charge)
|
2.59
|
0.43
|
2.15
|
|
Class A (with sales charge)
|
0.26
|
-0.02
|
1.85
|
|
Bloomberg U.S. Aggregate Bond Index
|
1.89
|
-0.29
|
1.76
|
Visit https://ptam.com/resources/ for more recent performance information.
KEY FUND STATISTICS (as of August 31, 2026)
|
Net Assets
|
$10,359,939,823
|
|
Number of Holdings
|
1,852
|
|
Net Advisory Fee
|
$61,304,426
|
|
Portfolio Turnover
|
35%
|
|
Average Credit Quality
|
A+
|
|
Effective Duration
|
6.72 years
|
|
30-Day SEC Yield
|
4.44%
|
|
30-Day SEC Yield Unsubsidized
|
4.44%
|
|
Weighted Average Life
|
12.92 years
|
|
Distribution Yield
|
4.56%
|
WHAT DID THE FUND INVEST IN? (% of net assets as of August 31, 2026)
|
Top 10 Issuers
|
(%)
|
|
|
United States Treasury Notes/Bonds
|
7.8
|
%
|
|
United States Treasury Strip Principal
|
5.4
|
%
|
|
Freddie Mac Multifamily Structured Pass Through Certificates
|
3.0
|
%
|
|
Benchmark Mortgage Trust
|
3.0
|
%
|
|
BBCMS Trust
|
2.3
|
%
|
|
Wells Fargo Commercial Mortgage Trust
|
2.2
|
%
|
|
BANK
|
1.7
|
%
|
|
BANK5 Trust
|
1.3
|
%
|
|
BMO Mortgage Trust
|
1.3
|
%
|
|
GLS Auto Receivables Trust
|
1.3
|
%
|
|
Top Sectors
|
(%)
|
|
|
Mortgage Securities
|
26.2
|
%
|
|
U.S. Municipal
|
21.1
|
%
|
|
Asset Backed Securities
|
17.4
|
%
|
|
Government
|
13.2
|
%
|
|
Financials*
|
6.2
|
%
|
|
Consumer Discretionary*
|
6.0
|
%
|
|
Health Care*
|
3.1
|
%
|
|
Industrials*
|
1.3
|
%
|
|
Communication Services*
|
0.9
|
%
|
|
Cash & Other
|
4.6
|
%
|
|
Credit Breakdown**
|
(%)
|
|
|
AAA
|
22.2
|
%
|
|
AA
|
41.7
|
%
|
|
A
|
13.3
|
%
|
|
BBB
|
11.2
|
%
|
|
BB
|
6.4
|
%
|
|
B
|
1.8
|
%
|
|
CCC
|
1.0
|
%
|
|
CC
|
0.0
|
%
|
|
C
|
0.1
|
%
|
|
D
|
0.0
|
%
|
|
Not Rated
|
2.3
|
%
|
WHAT WERE THE FUND COSTS FOR THE PAST YEAR? (based on a hypothetical $10,000 investment)
|
Class Name
|
Costs of a $10,000 investment
|
Costs paid as a percentage of a $10,000 investment
|
|
Class C
|
$176
|
1.74%
|
HOW DID THE FUND PERFORM LAST YEAR AND WHAT AFFECTED ITS PERFORMANCE?
POSITIONING
Other than the very front end of the yield curve, interest rates rose during the Fund’s fiscal year ended August 31, 2026 (the “fiscal year” or “period”). The U.S. Treasury yield curve flattened with the 3-year point rising 0.83% while the 30-year point rose only 0.31%. Interest rates on treasury bills inside six months fell as the Federal Reserve (Fed) cut the Federal Funds Target Rate on three occasions early in the period for a total reduction of 0.75%. Interest rates were relatively stable during the first half of the fiscal year, but rose in the second half of the fiscal year as the U.S. conflict with Iran impacted energy prices, inflation remained elevated, and the Fed ceased its interest rate cutting cycle.
Credit spreads tightened modestly during the period interrupted only by a brief bout of widening following the onset of the U.S./Iran conflict in the middle of the fiscal year. Around that same time, there were also heightened concerns surrounding negative ramifications of Artificial Intelligence on software companies and private credit lenders. High-yield corporate (HY) spreads tightened 0.11% and ended the period at 2.61%. Investment grade corporate (IG) spreads tightened 0.01% to end the period at 0.78% (Source: Bloomberg).
Within sectors we term Interest Rate Defense, the Fund increased exposure to Asset Backed Securities (ABS), Non-Agency Commercial Mortgage-Backed Securities (CMBS), and HY Corporates. Yields from the 2-year to the 5-year part of the U.S. Treasury yield curve rose significantly during the period and these sectors are largely fixed rate bonds pricing off that part of the curve. HY bonds were also added opportunistically throughout the period, such as during the brief bout of volatility in the middle of the fiscal year. The Fund reduced its Collateralized Loan Obligations (CLOs), which are primarily floating rate securities, as well as Agency CMBS and Non-Agency Residential Mortgage-Backed Securities (RMBS), which benefit less from higher front-end interest rates.
Within sectors we term Interest Rate Offense, the Fund decreased its exposure to Tax-Exempt Municipal bonds as that sector rallied significantly and became less attractive relative to taxable alternatives. The Fund chose to add to 15- to 20-year U.S. Treasuries and IG Corporates. We find treasuries attractive with the 20-year U.S. Treasury approaching record high yield levels and spreads remaining relatively tight. However, opportunities did present themselves during the period to invest in reasonably priced corporate bonds with some exposure added to the intermediate part of the curve and some farther out the curve.
|
Top Contributors
|
|
|
↑
|
Non-Agency Residential Mortgage-Backed Securities, High-Yield Corporates, Agency and Non-Agency Commercial Mortgage-Backed Securities, Collateralized Loan Obligations, Asset Backed Securities, and the Fund’s Investment Grade Corporate exposure to banks
|
|
Top Detractors
|
|
|
↓
|
U.S. Treasuries and Investment-Grade Corporates (primarily non-banks)
|
PERFORMANCE
The Fund’s underperformance relative to the Bloomberg U.S. Aggregate Bond Index (the “Index”) was driven by two primary factors. First, the Fund benefited from strong performance from less interest rate-sensitive sectors or what we term Interest Rate Defense. Non-Agency RMBS, HY Corporates, Agency and Non-Agency CMBS, CLOs, ABS, and the Fund’s IG Corporate exposure to banks all contributed meaningfully to the Fund’s outperformance. Despite these sectors being largely positioned on the front end of the U.S. Treasury yield curve where interest rates rose more meaningfully, higher coupon interest income, tighter credit spreads, and overall less interest rate sensitivity helped offset interest rate increases.
Second, the Fund’s more interest rate-sensitive sectors, or what we term Interest Rate Offense, were primarily positioned in the 15- to 20-year part of the U.S. Treasury yield curve where interest rate movements were more muted relative to the intermediate part of the curve. This yield curve positioning and credit spread tightening led to outperformance within the Fund’s Tax-Exempt and Taxable Municipal bond allocations.
Detracting somewhat from performance were the Fund’s U.S. Treasuries and IG Corporates (primarily non-banks), which have relatively long maturities and thus more interest-rate sensitivity, but also did not exhibit spread tightening to offset interest rate increases.
Of the major components of the Index, U.S. Treasuries (approximately 46% of the Index) and IG Corporates (approximately 24% of the Index) detracted from Index performance. These sectors were more heavily weighted to the intermediate part of the U.S. Treasury yield curve where interest rate increases were more pronounced. While Agency Mortgage Backed Securities (MBS) (approximately 23% of the Index) were similarly more exposed to the intermediate part of the curve, the sector benefited from spread tightening that helped to offset interest rate moves.
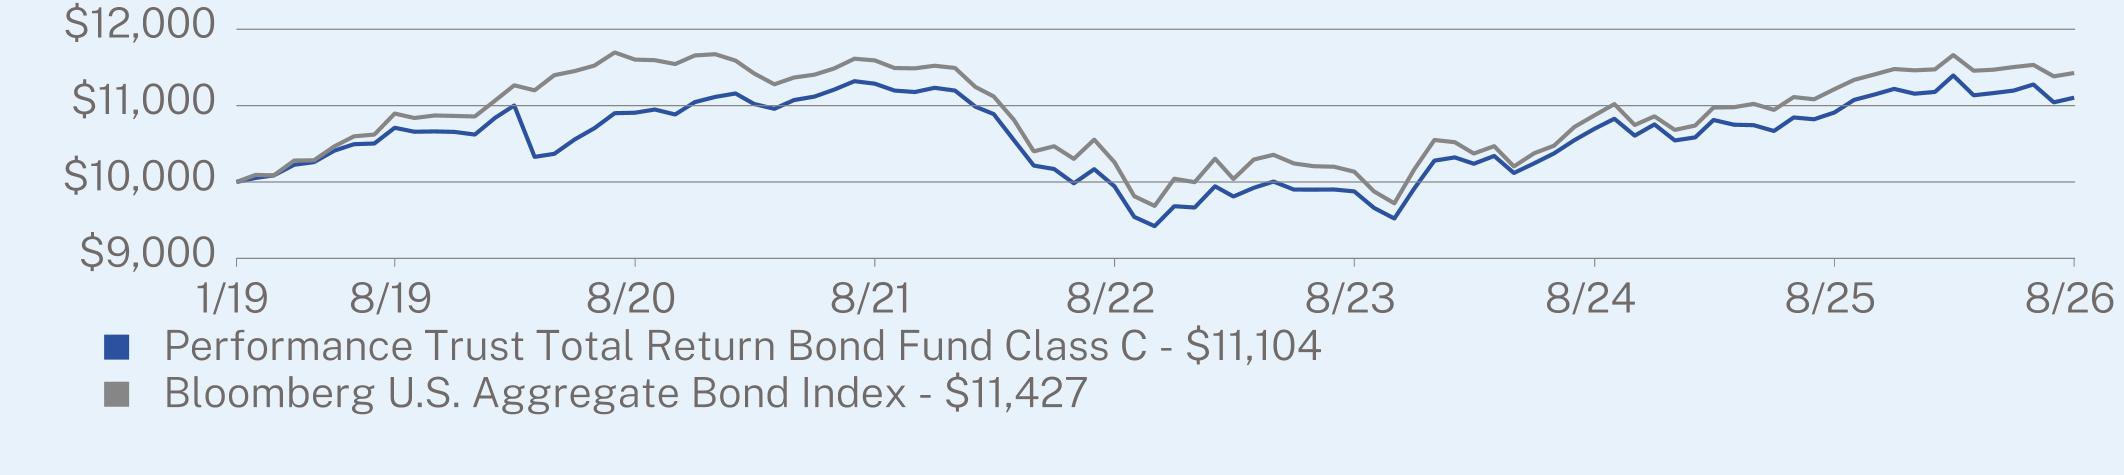
ANNUAL AVERAGE TOTAL RETURN (%)
|
|
1 Year
|
5 Year
|
Since Inception
(01/02/2019) |
|
Class C
|
1.82
|
-0.32
|
1.38
|
|
Bloomberg U.S. Aggregate Bond Index
|
1.89
|
-0.29
|
1.76
|
Visit https://ptam.com/resources/ for more recent performance information.
KEY FUND STATISTICS (as of August 31, 2026)
|
Net Assets
|
$10,359,939,823
|
|
Number of Holdings
|
1,852
|
|
Net Advisory Fee
|
$61,304,426
|
|
Portfolio Turnover
|
35%
|
|
Average Credit Quality
|
A+
|
|
Effective Duration
|
6.72 years
|
|
30-Day SEC Yield
|
3.79%
|
|
30-Day SEC Yield Unsubsidized
|
3.79%
|
|
Weighted Average Life
|
12.92 years
|
|
Distribution Yield
|
3.79%
|
WHAT DID THE FUND INVEST IN? (% of net assets as of August 31, 2026)
|
Top 10 Issuers
|
(%)
|
|
|
United States Treasury Notes/Bonds
|
7.8
|
%
|
|
United States Treasury Strip Principal
|
5.4
|
%
|
|
Freddie Mac Multifamily Structured Pass Through Certificates
|
3.0
|
%
|
|
Benchmark Mortgage Trust
|
3.0
|
%
|
|
BBCMS Trust
|
2.3
|
%
|
|
Wells Fargo Commercial Mortgage Trust
|
2.2
|
%
|
|
BANK
|
1.7
|
%
|
|
BANK5 Trust
|
1.3
|
%
|
|
BMO Mortgage Trust
|
1.3
|
%
|
|
GLS Auto Receivables Trust
|
1.3
|
%
|
|
Top Sectors
|
(%)
|
|
|
Mortgage Securities
|
26.2
|
%
|
|
U.S. Municipal
|
21.1
|
%
|
|
Asset Backed Securities
|
17.4
|
%
|
|
Government
|
13.2
|
%
|
|
Financials*
|
6.2
|
%
|
|
Consumer Discretionary*
|
6.0
|
%
|
|
Health Care*
|
3.1
|
%
|
|
Industrials*
|
1.3
|
%
|
|
Communication Services*
|
0.9
|
%
|
|
Cash & Other
|
4.6
|
%
|
|
Credit Breakdown**
|
(%)
|
|
|
AAA
|
22.2
|
%
|
|
AA
|
41.7
|
%
|
|
A
|
13.3
|
%
|
|
BBB
|
11.2
|
%
|
|
BB
|
6.4
|
%
|
|
B
|
1.8
|
%
|
|
CCC
|
1.0
|
%
|
|
CC
|
0.0
|
%
|
|
C
|
0.1
|
%
|
|
D
|
0.0
|
%
|
|
Not Rated
|
2.3
|
%
|
WHAT WERE THE FUND COSTS FOR THE PAST YEAR? (based on a hypothetical $10,000 investment)
|
Class Name
|
Costs of a $10,000 investment
|
Costs paid as a percentage of a $10,000 investment
|
|
Institutional Class
|
$75
|
0.74%
|
HOW DID THE FUND PERFORM LAST YEAR AND WHAT AFFECTED ITS PERFORMANCE?
POSITIONING
Other than the very front end of the yield curve, interest rates rose during the Fund’s fiscal year ended August 31, 2026 (the “fiscal year” or “period”). The U.S. Treasury yield curve flattened with the 3-year point rising 0.83% while the 30-year point rose only 0.31%. Interest rates on treasury bills inside six months fell as the Federal Reserve (Fed) cut the Federal Funds Target Rate on three occasions early in the period for a total reduction of 0.75%. Interest rates were relatively stable during the first half of the fiscal year, but rose in the second half of the fiscal year as the U.S. conflict with Iran impacted energy prices, inflation remained elevated, and the Fed ceased its interest rate cutting cycle.
Credit spreads tightened modestly during the period interrupted only by a brief bout of widening following the onset of the U.S./Iran conflict in the middle of the fiscal year. Around that same time, there were also heightened concerns surrounding negative ramifications of Artificial Intelligence on software companies and private credit lenders. High-yield corporate (HY) spreads tightened 0.11% and ended the period at 2.61%. Investment grade corporate (IG) spreads tightened 0.01% to end the period at 0.78% (Source: Bloomberg).
Within sectors we term Interest Rate Defense, the Fund increased exposure to Asset Backed Securities (ABS), Non-Agency Commercial Mortgage-Backed Securities (CMBS), and HY Corporates. Yields from the 2-year to the 5-year part of the U.S. Treasury yield curve rose significantly during the period and these sectors are largely fixed rate bonds pricing off that part of the curve. HY bonds were also added opportunistically throughout the period, such as during the brief bout of volatility in the middle of the fiscal year. The Fund reduced its Collateralized Loan Obligations (CLOs), which are primarily floating rate securities, as well as Agency CMBS and Non-Agency Residential Mortgage-Backed Securities (RMBS), which benefit less from higher front-end interest rates.
Within sectors we term Interest Rate Offense, the Fund decreased its exposure to Tax-Exempt Municipal bonds as that sector rallied significantly and became less attractive relative to taxable alternatives. The Fund chose to add to 15- to 20-year U.S. Treasuries and IG Corporates. We find treasuries attractive with the 20-year U.S. Treasury approaching record high yield levels and spreads remaining relatively tight. However, opportunities did present themselves during the period to invest in reasonably priced corporate bonds with some exposure added to the intermediate part of the curve and some farther out the curve.
|
Top Contributors
|
|
|
↑
|
Non-Agency Residential Mortgage-Backed Securities, High-Yield Corporates, Agency and Non-Agency Commercial Mortgage-Backed Securities, Collateralized Loan Obligations, Asset Backed Securities, and the Fund’s Investment Grade Corporate exposure to banks
|
|
Top Detractors
|
|
|
↓
|
U.S. Treasuries and Investment-Grade Corporates (primarily non-banks)
|
PERFORMANCE
The Fund’s underperformance relative to the Bloomberg U.S. Aggregate Bond Index (the “Index”) was driven by two primary factors. First, the Fund benefited from strong performance from less interest rate-sensitive sectors or what we term Interest Rate Defense. Non-Agency RMBS, HY Corporates, Agency and Non-Agency CMBS, CLOs, ABS, and the Fund’s IG Corporate exposure to banks all contributed meaningfully to the Fund’s outperformance. Despite these sectors being largely positioned on the front end of the U.S. Treasury yield curve where interest rates rose more meaningfully, higher coupon interest income, tighter credit spreads, and overall less interest rate sensitivity helped offset interest rate increases.
Second, the Fund’s more interest rate-sensitive sectors, or what we term Interest Rate Offense, were primarily positioned in the 15- to 20-year part of the U.S. Treasury yield curve where interest rate movements were more muted relative to the intermediate part of the curve. This yield curve positioning and credit spread tightening led to outperformance within the Fund’s Tax-Exempt and Taxable Municipal bond allocations.
Detracting somewhat from performance were the Fund’s U.S. Treasuries and IG Corporates (primarily non-banks), which have relatively long maturities and thus more interest-rate sensitivity, but also did not exhibit spread tightening to offset interest rate increases.
Of the major components of the Index, U.S. Treasuries (approximately 46% of the Index) and IG Corporates (approximately 24% of the Index) detracted from Index performance. These sectors were more heavily weighted to the intermediate part of the U.S. Treasury yield curve where interest rate increases were more pronounced. While Agency Mortgage Backed Securities (MBS) (approximately 23% of the Index) were similarly more exposed to the intermediate part of the curve, the sector benefited from spread tightening that helped to offset interest rate moves.
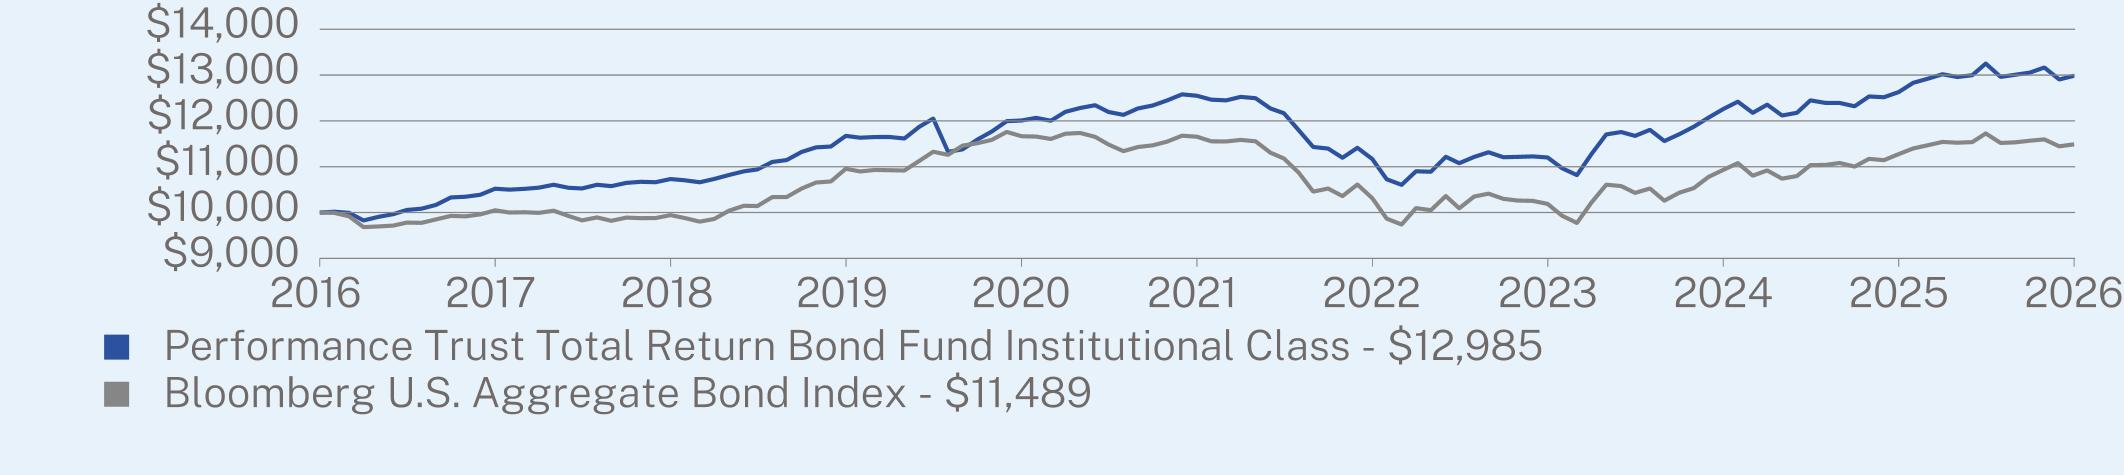
ANNUAL AVERAGE TOTAL RETURN (%)
|
|
1 Year
|
5 Year
|
10 Year
|
|
Institutional Class
|
2.81
|
0.69
|
2.65
|
|
Bloomberg U.S. Aggregate Bond Index
|
1.89
|
-0.29
|
1.40
|
Visit https://ptam.com/resources/ for more recent performance information.
KEY FUND STATISTICS (as of August 31, 2026)
|
Net Assets
|
$10,359,939,823
|
|
Number of Holdings
|
1,852
|
|
Net Advisory Fee
|
$61,304,426
|
|
Portfolio Turnover
|
35%
|
|
Average Credit Quality
|
A+
|
|
Effective Duration
|
6.72 years
|
|
30-Day SEC Yield
|
4.80%
|
|
30-Day SEC Yield Unsubsidized
|
4.80%
|
|
Weighted Average Life
|
12.92 years
|
|
Distribution Yield
|
4.83%
|
WHAT DID THE FUND INVEST IN? (% of net assets as of August 31, 2026)
|
Top 10 Issuers
|
(%)
|
|
|
United States Treasury Notes/Bonds
|
7.8
|
%
|
|
United States Treasury Strip Principal
|
5.4
|
%
|
|
Freddie Mac Multifamily Structured Pass Through Certificates
|
3.0
|
%
|
|
Benchmark Mortgage Trust
|
3.0
|
%
|
|
BBCMS Trust
|
2.3
|
%
|
|
Wells Fargo Commercial Mortgage Trust
|
2.2
|
%
|
|
BANK
|
1.7
|
%
|
|
BANK5 Trust
|
1.3
|
%
|
|
BMO Mortgage Trust
|
1.3
|
%
|
|
GLS Auto Receivables Trust
|
1.3
|
%
|
|
Top Sectors
|
(%)
|
|
|
Mortgage Securities
|
26.2
|
%
|
|
U.S. Municipal
|
21.1
|
%
|
|
Asset Backed Securities
|
17.4
|
%
|
|
Government
|
13.2
|
%
|
|
Financials*
|
6.2
|
%
|
|
Consumer Discretionary*
|
6.0
|
%
|
|
Health Care*
|
3.1
|
%
|
|
Industrials*
|
1.3
|
%
|
|
Communication Services*
|
0.9
|
%
|
|
Cash & Other
|
4.6
|
%
|
|
Credit Breakdown**
|
(%)
|
|
|
AAA
|
22.2
|
%
|
|
AA
|
41.7
|
%
|
|
A
|
13.3
|
%
|
|
BBB
|
11.2
|
%
|
|
BB
|
6.4
|
%
|
|
B
|
1.8
|
%
|
|
CCC
|
1.0
|
%
|
|
CC
|
0.0
|
%
|
|
C
|
0.1
|
%
|
|
D
|
0.0
|
%
|
|
Not Rated
|
2.3
|
%
|
WHAT WERE THE FUND COSTS FOR THE PAST YEAR? (based on a hypothetical $10,000 investment)
|
Class Name
|
Costs of a $10,000 investment
|
Costs paid as a percentage of a $10,000 investment
|
|
Class A
|
$74
|
0.72%
|
HOW DID THE FUND PERFORM LAST YEAR AND WHAT AFFECTED ITS PERFORMANCE?
POSITIONING
Given the steepness of the yield curve during the Fund’s fiscal year ended August 31, 2026 (the “fiscal year”) (for example the 20-year point yields 0.91% more than the 10-year point), the Fund continues to overweight the 16- to 20-year area of the curve while holding very little exposure to the 5- to 10-year part of the curve. This approach focused on the highest yielding parts of the municipal benchmark curve along with the additional potential return derived from “rolling down” a portion of the yield that is very steep in relation to history.
Furthermore, considering the historically relative high yield environment for municipal bonds, the Fund also targeted a higher allocation to bonds that carry more call protection and price off a longer part of the yield curve.
|
Top Contributors
|
|
|
↑
|
Yield Curve Positioning, Bond Structure (more Call Protection), Longer Maturities
|
PERFORMANCE
The Fund posted a positive return for the fiscal year as rates rose across the AAA curve (all municipal bond yields quoted are sourced from the MMD AAA scale) “flattened” with yields for maturities 15-years and less increasing while yields for maturities greater than 15-years decreased. Outperformance relative to the benchmark (Bloomberg Municipal Bond Index) and the Morningstar Category (Morningstar Municipal National Intermediate) for the fiscal year can generally be attributed to the Fund’s differentiated yield curve positioning and higher allocation to bonds that carry more call protection and price off a longer part of the yield curve, making the Fund more responsive to movements in interest rates.
The “flattening” of the yield curve contributed to the Fund’s performance as yields decreased in the 16- to 20-year part of the yield curve where the Fund was overweight while yields rose in the area of the yield curve where the Fund had very little exposure.
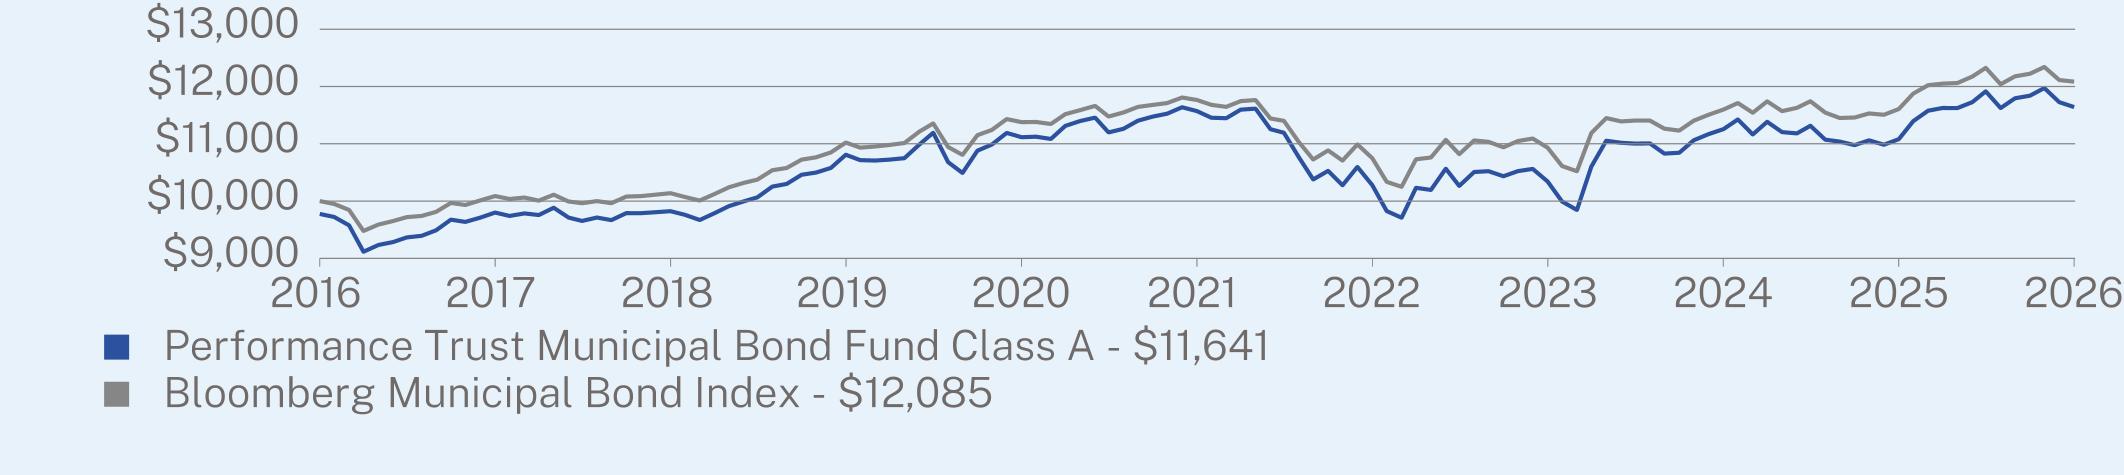
ANNUAL AVERAGE TOTAL RETURN (%)
|
|
1 Year
|
5 Year
|
10 Year
|
|
Class A (without sales charge)
|
5.19
|
0.15
|
1.77
|
|
Class A (with sales charge)
|
2.81
|
-0.31
|
1.54
|
|
Bloomberg Municipal Bond Index
|
4.12
|
0.54
|
1.91
|
Visit https://ptam.com/resources/ for more recent performance information.
KEY FUND STATISTICS (as of August 31, 2026)
|
Net Assets
|
$757,190,943
|
|
Number of Holdings
|
226
|
|
Net Advisory Fee
|
$2,883,217
|
|
Portfolio Turnover
|
34%
|
|
Average Credit Quality
|
AA
|
|
Effective Duration
|
6.91 years
|
|
30-Day SEC Yield
|
3.68%
|
|
30-Day SEC Yield Unsubsidized
|
3.68%
|
|
Weighted Average Life
|
8.11 years
|
|
Distribution Yield
|
3.70%
|
WHAT DID THE FUND INVEST IN? (% of net assets as of August 31, 2026)
|
Top 10 Issuers
|
(%)
|
|
|
First American Government Obligations Fund
|
6.0
|
%
|
|
Freddie Mac Multifamily ML Certificates
|
5.2
|
%
|
|
Omaha Public Power District
|
2.1
|
%
|
|
University of North Carolina at Chapel Hill
|
2.0
|
%
|
|
Denver City & County School District No. 1
|
1.9
|
%
|
|
Indianapolis Local Public Improvement Bond Bank
|
1.6
|
%
|
|
Greater Orlando Aviation Authority
|
1.6
|
%
|
|
Arapahoe County School District No 5 Cherry Creek
|
1.6
|
%
|
|
San Diego Unified School District
|
1.5
|
%
|
|
Central Puget Sound Regional Transit Authority
|
1.5
|
%
|
|
Top Sectors
|
(%)
|
|
|
U.S. Municipal
|
88.4
|
%
|
|
Mortgage Securities
|
6.7
|
%
|
|
Cash & Other
|
4.9
|
%
|
|
Credit Breakdown**
|
(%)
|
|
|
AAA
|
17.7
|
%
|
|
AA
|
66.7
|
%
|
|
A
|
8.8
|
%
|
|
BBB
|
1.9
|
%
|
|
BB
|
1.1
|
%
|
|
B
|
0.0
|
%
|
|
CCC
|
0.0
|
%
|
|
CC
|
0.0
|
%
|
|
C
|
0.0
|
%
|
|
D
|
0.0
|
%
|
|
Not Rated
|
3.9
|
%
|
WHAT WERE THE FUND COSTS FOR THE PAST YEAR? (based on a hypothetical $10,000 investment)
|
Class Name
|
Costs of a $10,000 investment
|
Costs paid as a percentage of a $10,000 investment
|
|
Institutional Class
|
$48
|
0.47%
|
HOW DID THE FUND PERFORM LAST YEAR AND WHAT AFFECTED ITS PERFORMANCE?
POSITIONING
Given the steepness of the yield curve during the Fund’s fiscal year ended August 31, 2026 (the “fiscal year”) (for example the 20-year point yields 0.91% more than the 10-year point), the Fund continues to overweight the 16- to 20-year area of the curve while holding very little exposure to the 5- to 10-year part of the curve. This approach focused on the highest yielding parts of the municipal benchmark curve along with the additional potential return derived from “rolling down” a portion of the yield that is very steep in relation to history.
Furthermore, considering the historically relative high yield environment for municipal bonds, the Fund also targeted a higher allocation to bonds that carry more call protection and price off a longer part of the yield curve.
|
Top Contributors
|
|
|
↑
|
Yield Curve Positioning, Bond Structure (more Call Protection), Longer Maturities
|
PERFORMANCE
The Fund posted a positive return for the fiscal year as rates rose across the AAA curve (all municipal bond yields quoted are sourced from the MMD AAA scale) “flattened” with yields for maturities 15-years and less increasing while yields for maturities greater than 15-years decreased. Outperformance relative to the benchmark (Bloomberg Municipal Bond Index) and the Morningstar Category (Morningstar Municipal National Intermediate) for the fiscal year can generally be attributed to the Fund’s differentiated yield curve positioning and higher allocation to bonds that carry more call protection and price off a longer part of the yield curve, making the Fund more responsive to movements in interest rates.
The “flattening” of the yield curve contributed to the Fund’s performance as yields decreased in the 16- to 20-year part of the yield curve where the Fund was overweight while yields rose in the area of the yield curve where the Fund had very little exposure.
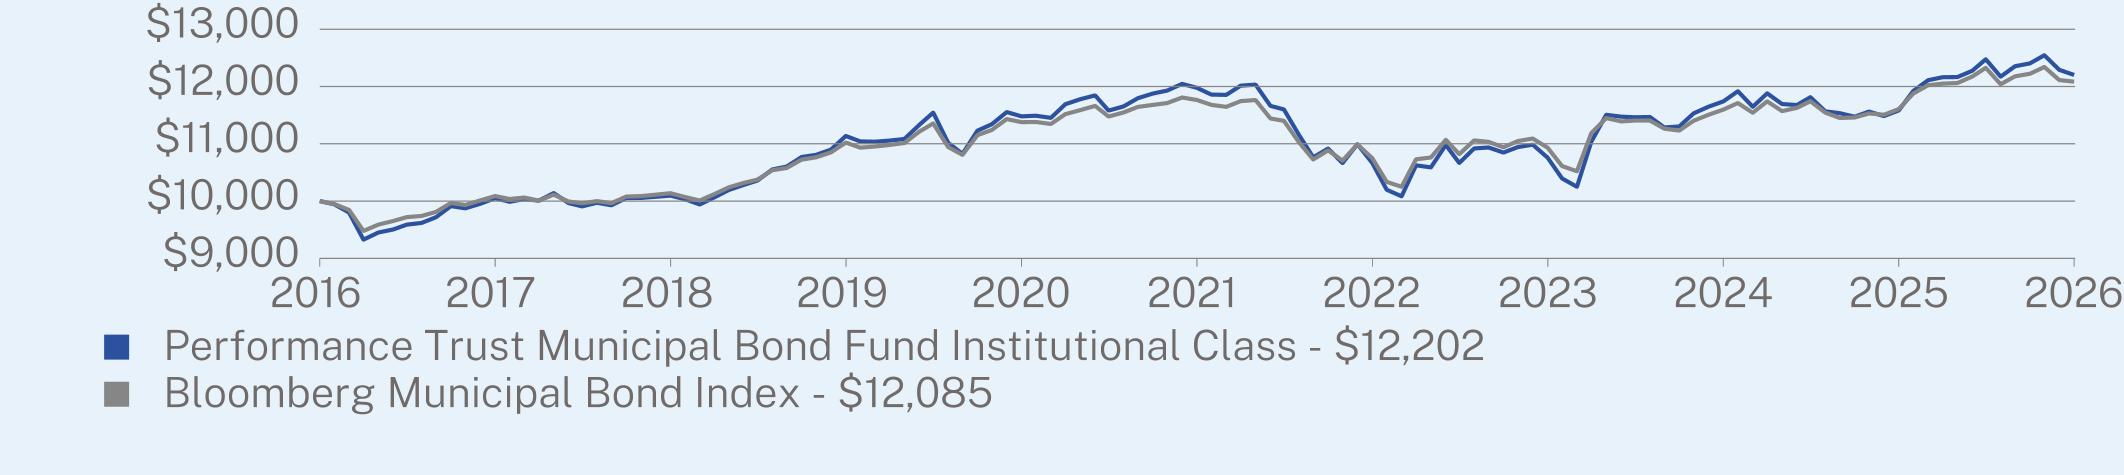
ANNUAL AVERAGE TOTAL RETURN (%)
|
|
1 Year
|
5 Year
|
10 Year
|
|
Institutional Class
|
5.48
|
0.40
|
2.02
|
|
Bloomberg Municipal Bond Index
|
4.12
|
0.54
|
1.91
|
Visit https://ptam.com/resources/ for more recent performance information.
KEY FUND STATISTICS (as of August 31, 2026)
|
Net Assets
|
$757,190,943
|
|
Number of Holdings
|
226
|
|
Net Advisory Fee
|
$2,883,217
|
|
Portfolio Turnover
|
34%
|
|
Average Credit Quality
|
AA
|
|
Effective Duration
|
6.91 years
|
|
30-Day SEC Yield
|
4.01%
|
|
30-Day SEC Yield Unsubsidized
|
4.01%
|
|
Weighted Average Life
|
8.11 years
|
|
Distribution Yield
|
3.98%
|
WHAT DID THE FUND INVEST IN? (% of net assets as of August 31, 2026)
|
Top 10 Issuers
|
(%)
|
|
|
First American Government Obligations Fund
|
6.0
|
%
|
|
Freddie Mac Multifamily ML Certificates
|
5.2
|
%
|
|
Omaha Public Power District
|
2.1
|
%
|
|
University of North Carolina at Chapel Hill
|
2.0
|
%
|
|
Denver City & County School District No. 1
|
1.9
|
%
|
|
Indianapolis Local Public Improvement Bond Bank
|
1.6
|
%
|
|
Greater Orlando Aviation Authority
|
1.6
|
%
|
|
Arapahoe County School District No 5 Cherry Creek
|
1.6
|
%
|
|
San Diego Unified School District
|
1.5
|
%
|
|
Central Puget Sound Regional Transit Authority
|
1.5
|
%
|
|
Top Sectors
|
(%)
|
|
|
U.S. Municipal
|
88.4
|
%
|
|
Mortgage Securities
|
6.7
|
%
|
|
Cash & Other
|
4.9
|
%
|
|
Credit Breakdown**
|
(%)
|
|
|
AAA
|
17.7
|
%
|
|
AA
|
66.7
|
%
|
|
A
|
8.8
|
%
|
|
BBB
|
1.9
|
%
|
|
BB
|
1.1
|
%
|
|
B
|
0.0
|
%
|
|
CCC
|
0.0
|
%
|
|
CC
|
0.0
|
%
|
|
C
|
0.0
|
%
|
|
D
|
0.0
|
%
|
|
Not Rated
|
3.9
|
%
|
WHAT WERE THE FUND COSTS FOR THE PAST YEAR? (based on a hypothetical $10,000 investment)
|
Class Name
|
Costs of a $10,000 investment
|
Costs paid as a percentage of a $10,000 investment
|
|
Institutional Class
|
$99
|
0.97%
|
HOW DID THE FUND PERFORM LAST YEAR AND WHAT AFFECTED ITS PERFORMANCE?
POSITIONING
The Federal Reserve cut the Federal Funds Target Rate on three occasions early in the Fund’s fiscal year ended August 31, 2026 (the “fiscal year” or “period”), for a total reduction of 0.75%, bringing the targeted range to 3.50%-3.75%. Interest rates inside six months fell alongside the Fed’s rate cuts, while interest rates further out the curve rose over the course of the fiscal year. Interest rates were relatively stable during the first half of the fiscal year but rose in the second half as the U.S. conflict with Iran impacted energy prices, inflation remained elevated, and the Fed ended its interest rate cutting cycle. Other than the very front end of the curve, interest rates rose during the period, with the U.S. Treasury yield curve flattening as the 3-year point rose 0.83% while the 30-year point rose only 0.31%.
Credit spreads tightened modestly during the period, interrupted by a bout of widening coinciding with the onset of the U.S./Iran conflict and heightened concerns surrounding the impact of Artificial Intelligence on software companies and private credit lenders. High yield corporate (HY) spreads and investment grade corporate (IG) spreads started the fiscal year at 2.72% and 0.79% respectively, reached respective annual highs of 3.35% and 0.93% in mid-March, and ended the fiscal year at 2.61% and 0.78% respectively.
The Fund increased its allocation to Asset Backed Securities (ABS), Collateralized Loan Obligations (CLOs), Agency and Non-Agency CMBS, U.S. Treasuries, and Taxable Municipal debt. The Fund reduced its exposure to Cash, Non-Agency Residential Mortgage-Backed Securities (RMBS), and Tax-Exempt Municipals. Corporate debt was also reduced over the fiscal year, despite some opportunistic buying activity amidst the volatility seen in March of 2026. The CLOs, Commercial Mortgage-Backed Securities (CMBS), and ABS that the Fund added were primarily either short, or incorporated a floating rate, to offer greater protection against potential interest rate increases. The Fund’s focus on these shorter asset classes also comes from a desire to help minimize any price volatility that may occur in a spread widening environment.
The Fund was able to balance purchases in these more defensive sectors by adding what we term high-quality Interest Rate Offense, including Taxable Municipals and longer dated U.S. Treasuries, which, despite lower performance throughout the fiscal year, now have higher levels of starting rates, as well as a continued level of steepness seen in the longer segment of the yield curve. Due to the tight credit spreads broadly seen in the corporate space, the Fund has also lowered the percentage of High Yield (HY) Corporate Assets, choosing to increase the overall credit quality of the Fund, and skew shorter in duration within that sector. While we do not know when a credit event may occur, the amount of compensation offered to take on additional credit risk is lower than it has been historically, making higher credit quality assets (e.g., Treasuries, Taxable Municipals), from a relative value perspective, more attractive.
|
Top Contributors
|
|
|
↑
|
Investment Grade Corporate debt (in particular, Banks), Agency and Non-Agency Commercial Mortgage-Backed Securities, Collateralized Loan Obligations, Asset Backed Securities, Non-Agency Residential Mortgage-Backed Securities, High Yield Corporates
|
|
Top Detractors
|
|
|
↓
|
U.S. Treasuries and Tax-Exempt Municipals
|
PERFORMANCE
Investment Grade Corporate debt (in particular, Banks), CMBS (both Agency and Non-Agency), CLOs, ABS, Non-Agency RMBS, HY Corporates, and Taxable Municipals all made strong contributions to the Fund’s outperformance. The CLO, ABS, and shorter CMBS and Corporate positions, due to their locations on the front end of the benchmark curve, saw price volatility mitigated.
For those assets priced longer on the curve (certain Corporate debt and Taxable Municipal debt), the higher starting levels of income that these securities held, in addition to marginal spread tightening, were able to offer a bulwark against the negative price impacts of higher benchmark rates. Due to the increase in the long end of the Treasury curve throughout the fiscal year, U.S. Treasury positions detracted from the Fund’s performance. The Fund’s relatively small exposure to Tax-Exempt Municipal debt also detracted from performance.
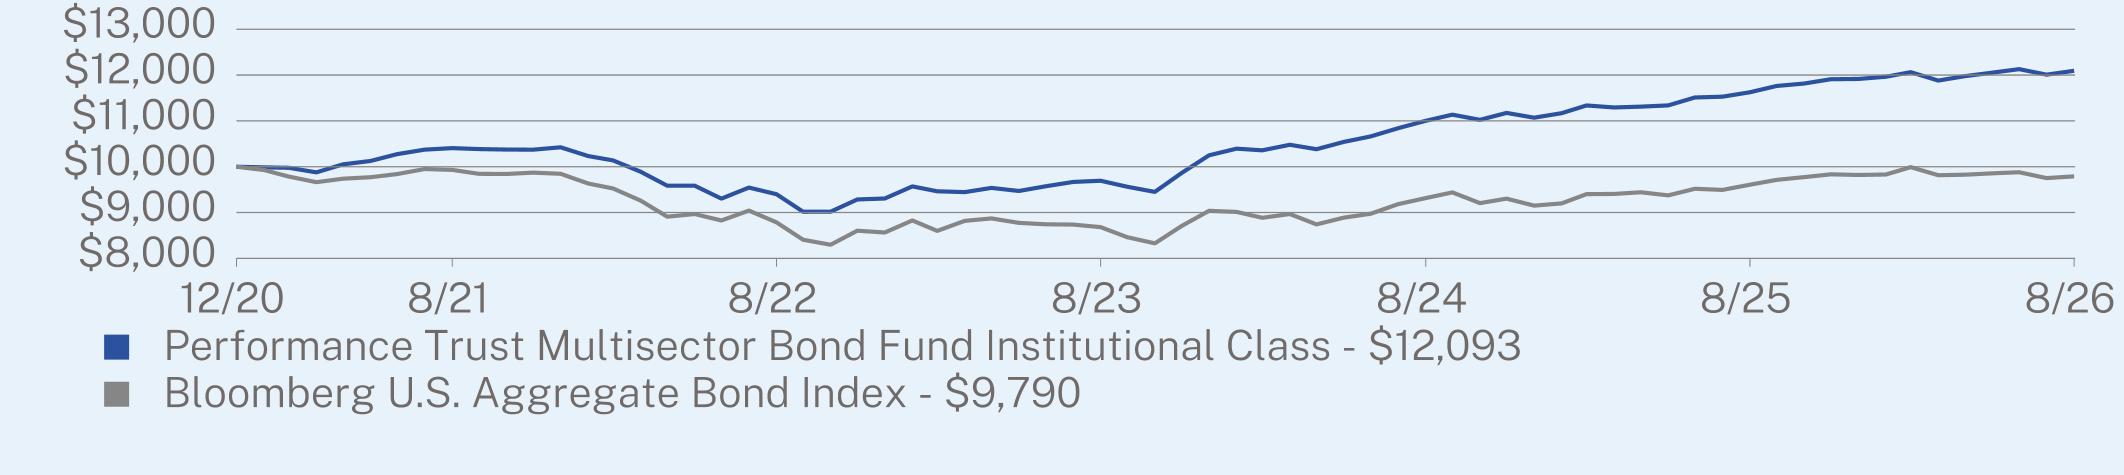
ANNUAL AVERAGE TOTAL RETURN (%)
|
|
1 Year
|
5 Year
|
Since Inception
(12/31/2020) |
|
Institutional Class
|
4.03
|
3.05
|
3.41
|
|
Bloomberg U.S. Aggregate Bond Index
|
1.89
|
-0.29
|
-0.37
|
Visit https://ptam.com/resources/ for more recent performance information.
KEY FUND STATISTICS (as of August 31, 2026)
|
Net Assets
|
$493,632,595
|
|
Number of Holdings
|
399
|
|
Net Advisory Fee
|
$3,406,304
|
|
Portfolio Turnover
|
31%
|
|
Average Credit Quality
|
BBB+
|
|
Effective Duration
|
4.64 years
|
|
30-Day SEC Yield
|
5.10%
|
|
30-Day SEC Yield Unsubsidized
|
5.09%
|
|
Weighted Average Life
|
10.25 years
|
|
Distribution Yield
|
5.48%
|
WHAT DID THE FUND INVEST IN? (% of net assets as of August 31, 2026)
|
Top 10 Issuers
|
(%)
|
|
|
United States Treasury Notes/Bonds
|
7.5
|
%
|
|
Magnetite CLO Ltd.
|
3.3
|
%
|
|
Exeter Automobile Receivables Trust
|
2.6
|
%
|
|
Wells Fargo Commercial Mortgage Trust
|
2.3
|
%
|
|
Benchmark Mortgage Trust
|
2.3
|
%
|
|
Neuberger Berman CLO Ltd.
|
2.2
|
%
|
|
Apidos CLO
|
2.0
|
%
|
|
BANK
|
1.9
|
%
|
|
BBCMS Trust
|
1.8
|
%
|
|
ARES CLO
|
1.7
|
%
|
|
Top Sectors
|
(%)
|
|
|
Asset Backed Securities
|
22.0
|
%
|
|
Mortgage Securities
|
21.5
|
%
|
|
Financials*
|
15.0
|
%
|
|
Consumer Discretionary*
|
10.6
|
%
|
|
U.S. Municipal
|
9.0
|
%
|
|
Government
|
9.0
|
%
|
|
Industrials*
|
2.8
|
%
|
|
Communication Services*
|
1.9
|
%
|
|
Technology*
|
1.7
|
%
|
|
Cash & Other
|
6.5
|
%
|
|
Credit Breakdown**
|
(%)
|
|
|
AAA
|
8.5
|
%
|
|
AA
|
18.8
|
%
|
|
A
|
11.0
|
%
|
|
BBB
|
30.8
|
%
|
|
BB
|
23.1
|
%
|
|
B
|
5.1
|
%
|
|
CCC
|
0.4
|
%
|
|
CC
|
0.0
|
%
|
|
C
|
0.0
|
%
|
|
D
|
0.0
|
%
|
|
Not Rated
|
2.3
|
%
|
WHAT WERE THE FUND COSTS FOR THE PAST YEAR? (based on a hypothetical $10,000 investment)
|
Fund Name
|
Costs of a $10,000 investment
|
Costs paid as a percentage of a $10,000 investment
|
|
Performance Trust Short Term Bond ETF
|
$66
|
0.65%
|
HOW DID THE FUND PERFORM LAST YEAR AND WHAT AFFECTED ITS PERFORMANCE?
POSITIONING
The Federal Reserve delivered three 25 basis point (0.25%) rate cuts in September, October, and December 2025 before holding the Fed Funds rate steady through the remainder of the Fund’s fiscal year ended August 31, 2026 (the “fiscal year” or “period”). Yields on U.S. Treasury bills (1-month through 6-month) fell in step with the realized cuts, while yields 1-year and beyond rose meaningfully, with the largest increases concentrated in the 2- to 7-year portion of the curve (up 0.70% to 0.83%). These moves dramatically changed the shape of the yield curve at the short end. At the start of the fiscal year, the front end of the yield curve was inverted. As of August 31, 2026, the curve was sloped upward across every maturity, and the 2-year/10-year spread compressed from 0.57% to 0.41%.
Credit spreads tightened modestly during the period, interrupted by a brief bout of widening following the onset of the U.S./Iran conflict in the middle of the fiscal year. Period over period, Investment Grade (IG) corporate credit spreads ended roughly flat (wider by approximately 0.01%), while High-Yield (HY) corporate credit spreads were tighter by approximately 0.11%.
The main changes in relative allocation were primarily in Asset Backed Securities (ABS), which grew from 13.60% of the Fund’s portfolio at the start of the fiscal year to 23.30% by fiscal year-end, and Non-Agency Commercial Mortgage-Backed Securities (CMBS), which fell from 25.4% of the portfolio to 18.5%. This pivot was primarily due to the changing shape of the yield curve over the fiscal year, and the horizon over which the Fund is managed. Yields from the 2-year to the 5-year part of the U.S. Treasury yield curve rose significantly during the period, dramatically changing the slope profile along the short end of the treasury curve. Because the Fund is generally managed with a one-year investment horizon, assets pricing on the shorter end of the yield curve (between 2 and 4 years) would benefit more from roll dynamics than slightly longer assets. The Fund’s ABS holdings, due to the shorter natures of their underlying collateral, price off a shorter segment of the treasury curve relative to the Non-Agency CMBS positions held. This positive slope dynamic of the shorter portion of the Treasury curve has led to more ABS structured credit relative to the slightly longer CMBS holdings.
|
Top Contributors
|
|
|
↑
|
High Yield Corporates, Investment Grade Corporates, Collateralized Loan Obligations, Non-Agency Commercial Mortgage-Backed Interest Only Securities, Asset-Backed Securities, and Agency CMBS
|
|
Top Detractors
|
|
|
↓
|
Longer-duration U.S. Treasuries
|
PERFORMANCE
The Fund outperformed both the Bloomberg U.S. Aggregate 1-3 Year Index (the “Index”) and the Morningstar Category over the fiscal year. Outperformance was primarily driven by allocations to HY Corporates, IG Corporates, Collateralized Loan Obligations (CLOs), Non-Agency Commercial Mortgage-Backed Interest Only Securities (CMBS IOs), ABS, and Agency CMBS, which benefited primarily from carry and credit spread tightening during the period. Certain longer-duration Treasury and Conduit CMBS positions detracted modestly from performance, due to their greater sensitivity to interest rate volatility.
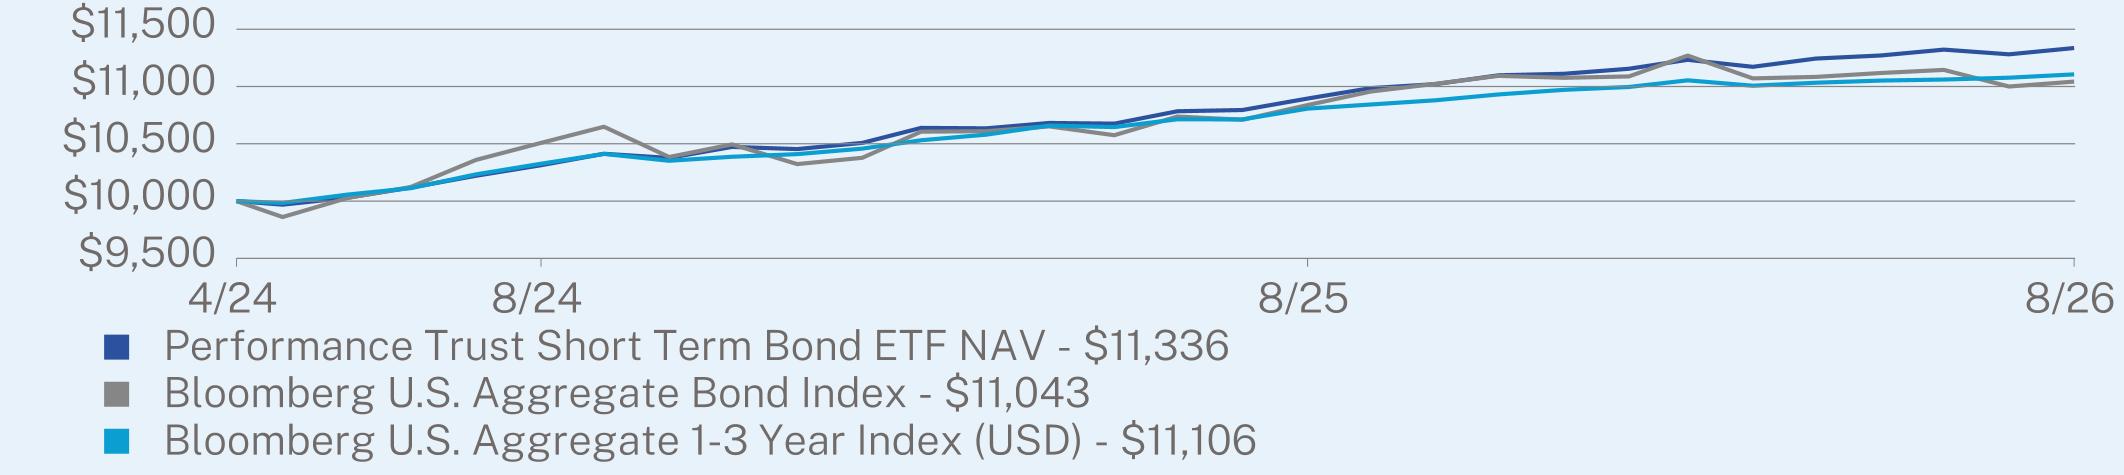
ANNUAL AVERAGE TOTAL RETURN (%)
|
|
1 Year
|
Since Inception
(04/08/2024) |
|
Performance Trust Short Term Bond ETF NAV
|
4.04
|
5.37
|
|
Bloomberg U.S. Aggregate Bond Index
|
1.89
|
4.22
|
|
Bloomberg U.S. Aggregate 1-3 Year Index (USD)
|
2.77
|
4.47
|
Visit https://ptam.com/resources/ for more recent performance information.
KEY FUND STATISTICS (as of August 31, 2026)
|
Net Assets
|
$74,537,346
|
|
Number of Holdings
|
259
|
|
Net Advisory Fee
|
$289,087
|
|
Portfolio Turnover
|
39%
|
|
Average Credit Quality
|
A+
|
|
Effective Duration
|
2.42 years
|
|
30-Day SEC Yield
|
4.71%
|
|
30-Day SEC Yield Unsubsidized
|
4.71%
|
|
Weighted Average Life
|
4.28 years
|
|
Distribution Yield
|
4.67%
|
WHAT DID THE FUND INVEST IN? (% of net assets as of August 31, 2026)
|
Top 10 Issuers
|
(%)
|
|
|
United States Treasury Notes/Bonds
|
11.0
|
%
|
|
Federal Home Loan Mortgage Corp.
|
5.5
|
%
|
|
Freddie Mac Multifamily Structured Pass Through Certificates
|
4.0
|
%
|
|
GLS Auto Receivables Trust
|
3.3
|
%
|
|
Santander Consumer USA Holdings, Inc.
|
3.2
|
%
|
|
American Credit Acceptance Receivables Trust
|
3.2
|
%
|
|
Exeter Automobile Receivables Trust
|
3.2
|
%
|
|
Benchmark Mortgage Trust
|
2.7
|
%
|
|
CPS Auto Trust
|
2.5
|
%
|
|
Wells Fargo Commercial Mortgage Trust
|
2.2
|
%
|
|
Top Sectors
|
(%)
|
|
|
Asset Backed Securities
|
40.6
|
%
|
|
Mortgage Securities
|
28.6
|
%
|
|
Government
|
11.5
|
%
|
|
Financials*
|
7.1
|
%
|
|
Consumer Discretionary*
|
3.7
|
%
|
|
U.S. Municipal
|
2.2
|
%
|
|
Health Care*
|
0.6
|
%
|
|
Consumer Staples*
|
0.6
|
%
|
|
Communications*
|
0.6
|
%
|
|
Cash & Other
|
4.5
|
%
|
|
Credit Breakdown**
|
(%)
|
|
|
AAA
|
29.2
|
%
|
|
AA
|
33.6
|
%
|
|
A
|
12.4
|
%
|
|
BBB
|
14.6
|
%
|
|
BB
|
7.0
|
%
|
|
B
|
2.4
|
%
|
|
CCC
|
0.1
|
%
|
|
CC
|
0.0
|
%
|
|
C
|
0.0
|
%
|
|
D
|
0.0
|
%
|
|
Not Rated
|
0.7
|
%
|
| [1] |
|
||
| [2] |
|
||
| [3] |
|
||
| [4] |
|
||
| [5] |
|
||
| [6] |
|
||
| [7] |
|
||
| [8] |
|
||
| [9] |
|
||
| [10] |
|
||
| [11] |
|
||
| [12] |
|