
Investor Presentation Third Quarter 2026 Nasdaq: CARE
Forward-Looking Statement 2 This information contains certain forward-looking statements within the meaning of the Private Securities Litigation Reform Act of 1995. Forward-looking statements are typically identified by words or phrases such as “will likely result,” “expect,” “anticipate,” “estimate,” “forecast,” “project,” “intend,” “believe,” “assume,” “strategy,” “trend,” “plan,” “outlook,” “outcome,” “continue,” “remain,” “potential,” “opportunity,” “comfortable,” “current,” “position,” “maintain,” “sustain,” “seek,” “achieve” and variations of such words and similar expressions, or future or conditional verbs such as will, would, should, could or may. These statements are not guarantees of future results or performance and involve certain risks, uncertainties and assumptions that are difficult to predict and often are beyond the Company’s control. Although the Company believes the assumptions upon which these forward-looking statements are based are reasonable, any of these assumptions could prove to be inaccurate and the forward-looking statements based on these assumptions could be incorrect. Actual results may differ significantly from those expressed in or implied by these forward-looking statements. The matters discussed in these forward-looking statements are subject to various risks, uncertainties and other factors that could cause actual results and trends to differ materially from those made, projected, or implied in or by the forward-looking statements including, but not limited to the effects of: market interest rates and the impacts of market interest rates on economic conditions, customer behavior, and the Company’s net interest margin, net interest income, funding costs and its deposit, loan and securities portfolios; inflation, market and monetary fluctuations; changes in trade policies, tariffs, monetary and fiscal policies and laws of the U.S. government and the related impacts on economic conditions and financial markets, and changes in policies of the Federal Reserve, FDIC and U.S. Department of the Treasury; changes in accounting policies, practices, or guidance; cyber-security threats, attacks or events; rapid technological developments and changes, including emerging issues related to the development and use of artificial intelligence that could give rise to legal or regulatory action or increase cybersecurity threats; our ability to resolve our nonperforming assets and our ability to secure collateral on loans that have entered nonaccrual status due to loan maturities and failure to pay in full; changes in the Company’s liquidity and capital positions; concentrations of loans secured by real estate, particularly commercial real estate loans, and the potential impacts of changes in market conditions on the value of real estate collateral; increased delinquency and foreclosure rates on commercial real estate loans; an insufficient allowance for credit losses; the potential adverse effects of unusual and infrequently occurring events, such as weather-related disasters, terrorist acts, war and other geopolitical conflicts or public health events (such as pandemics), and of any governmental and societal responses thereto; these potential adverse effects may include, without limitation, adverse effects on macroeconomic conditions, the ability of the Company's borrowers to satisfy their obligations to the Company, on the value of collateral securing loans, on the demand for the Company's loans or its other products and services, on incidents of cyberattack and fraud, on the Company’s liquidity or capital positions, on risks posed by reliance on third- party service providers, on other aspects of the Company's business operations and on financial markets and economic growth; a change in spreads on interest-earning assets and interest-bearing liabilities; regulatory supervision and oversight, including our relationship with regulators and any actions that may be initiated by our regulators; legislation affecting the financial services industry as a whole, and the Company and the Bank, in particular and changes impacting the rulemaking, supervision, examination and enforcement priorities of the federal banking agencies; the outcome of pending and future litigation and/or governmental proceedings; increasing price and product/service competition; the ability to continue to introduce competitive new products and services on a timely, cost-effective basis; managing our internal growth and acquisitions; the possibility that the anticipated benefits from acquisitions cannot be fully realized in a timely manner or at all, or that integrating acquired operations will be more difficult, disruptive or more costly than anticipated; the soundness of other financial institutions and any indirect exposure related to large bank failures and their impact on the broader market through other customers, suppliers and partners or that the conditions which resulted in the liquidity concerns with those failed banks may also adversely impact, directly or indirectly, other financial institutions and market participants with which the Company has commercial or deposit relationships; material increases in costs and expenses; reliance on significant customer relationships; general economic or business conditions, including unemployment levels, supply chain disruptions, slowdowns in economic growth, government shutdowns and geopolitical instability and tensions; significant weakening of the local economies in which the Company operates; changes in customer behaviors, including consumer spending, borrowing and saving habits; changes in deposit flows and loan demand; our failure to attract or retain key associates; expansions or consolidations in the Company’s branch network, including that the anticipated benefits of the Company’s branch acquisitions or the Company’s branch network optimization project are not fully realized in a timely manner or at all; deterioration of the housing market and reduced demand for mortgages; and turbulence in significant portions of the global financial and real estate markets that could impact our performance, both directly, by affecting our revenues and the value of our assets and liabilities, and indirectly, by affecting the economy generally and access to capital in the amounts, at the times and on the terms required to support our future businesses. Many of these factors, as well as other factors, are described in our filings with the Securities and Exchange Commission, including in the “Risk Factors” in the Company’s Annual Report on Form 10-K for the year ended December 31, 2025. All risk factors and uncertainties described herein and therein should be considered in evaluating the Company’s forward-looking statements. Forward-looking statements are based on beliefs and assumptions using information available at the time the statements are made. The Company cautions you not to unduly rely on forward-looking statements because the assumptions, beliefs, expectations and projections about future events that are expressed in or implied by a forward-looking statement may, and often do, differ materially from actual results. Any forward-looking statement speaks only as to the date on which it is made, and the Company undertakes no obligation to update, revise or clarify any forward-looking statement to reflect developments occurring after the statement is made, except as required by law.
Table of Contents 3 SECTION 01 Overview 4-13 SECTION 02 Financial Highlights 14-27 SECTION 03 Asset Quality 28-34 SECTION 04 Deposit Mix 35-37 SECTION 05 Commercial Loans 38-47 SECTION 06 Non-GAAP Reconciliation 48-54

Overview SECTION 01
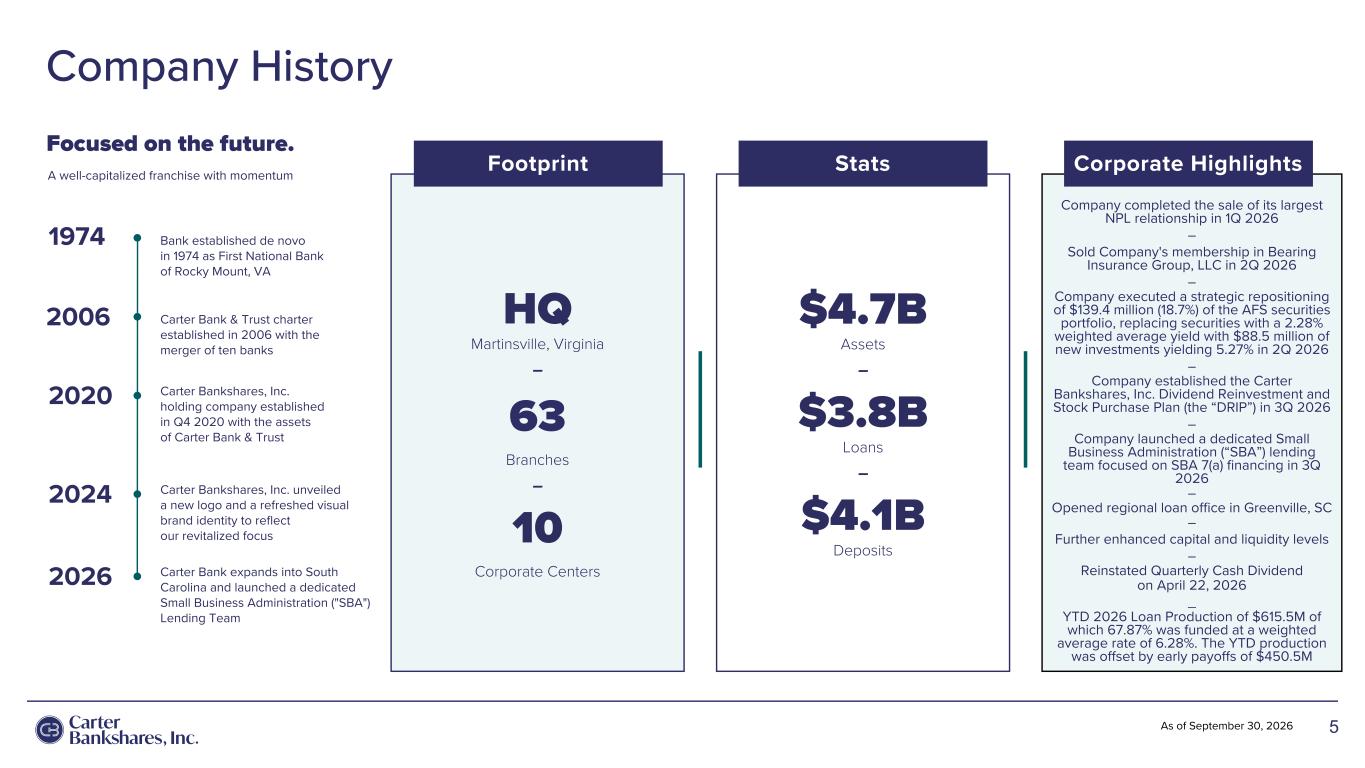
5As of September 30, 2026 Company History Focused on the future. A well-capitalized franchise with momentum 1974 Bank established de novo in 1974 as First National Bank of Rocky Mount, VA 2006 Carter Bank & Trust charter established in 2006 with the merger of ten banks 2020 Carter Bankshares, Inc. holding company established in Q4 2020 with the assets of Carter Bank & Trust 2024 Carter Bankshares, Inc. unveiled a new logo and a refreshed visual brand identity to reflect our revitalized focus Company completed the sale of its largest NPL relationship in 1Q 2026 – Sold Company's membership in Bearing Insurance Group, LLC in 2Q 2026 – Company executed a strategic repositioning of $139.4 million (18.7%) of the AFS securities portfolio, replacing securities with a 2.28% weighted average yield with $88.5 million of new investments yielding 5.27% in 2Q 2026 – Company established the Carter Bankshares, Inc. Dividend Reinvestment and Stock Purchase Plan (the “DRIP”) in 3Q 2026 – Company launched a dedicated Small Business Administration (“SBA”) lending team focused on SBA 7(a) financing in 3Q 2026 – Opened regional loan office in Greenville, SC – Further enhanced capital and liquidity levels – Reinstated Quarterly Cash Dividend on April 22, 2026 _ YTD 2026 Loan Production of $615.5M of which 67.87% was funded at a weighted average rate of 6.28%. The YTD production was offset by early payoffs of $450.5M Corporate Highlights $4.7B Assets – $3.8B Loans – $4.1B Deposits HQ Martinsville, Virginia – 63 Branches – 10 Corporate Centers Footprint Stats 2026 Carter Bank expands into South Carolina and launched a dedicated Small Business Administration ("SBA") Lending Team
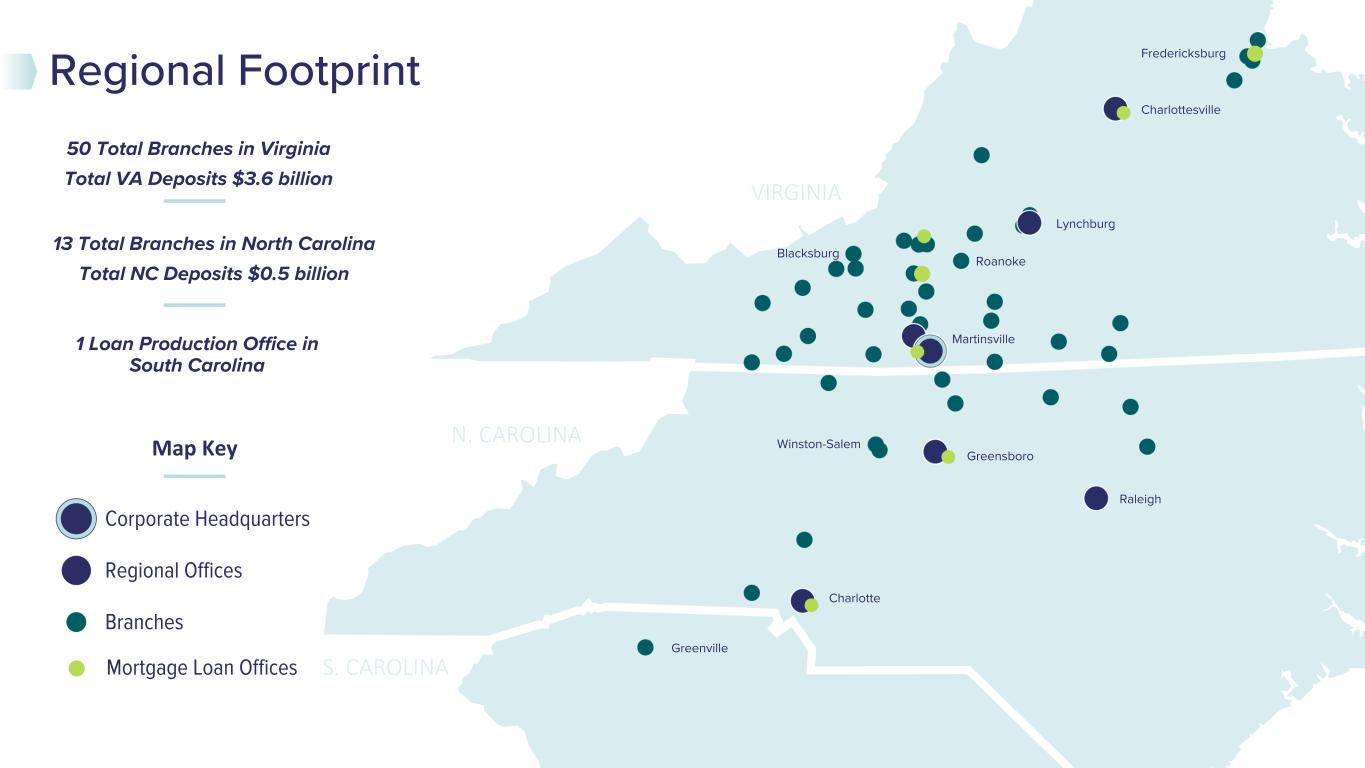
Corporate Headquarters Regional Offices Branches Map Key 50 Total Branches in Virginia Total VA Deposits $3.6 billion 13 Total Branches in North Carolina Total NC Deposits $0.5 billion Regional Footprint VIRGINIA Charlotte Martinsville Raleigh Greensboro Lynchburg Charlottesville Roanoke N. CAROLINA S. CAROLINA Greenville Winston-Salem 1 Loan Production Office in South Carolina Mortgage Loan Offices Blacksburg Fredericksburg

Leadership Team 7 Loran Adams Executive Vice President Director of Regulatory Risk Management 43 years in Industry 9 years at the Bank Tami Buttrey Executive Vice President Chief Retail Banking Officer 43 years in Industry 7 years at the Bank Jane Ann Davis Executive Vice President Chief Administrative Officer 42 years in Industry 42 years at the Bank Tony Kallsen Senior Executive Vice President Chief Credit Risk Officer 35 years in Industry 8 years at the Bank Chrystal Parnell Executive Vice President Chief Marketing & Communications Officer 23 years in Industry 4 years at the Bank Matt Speare Senior Executive Vice President Chief Operations Officer 24 years in Industry 9 years at the Bank Rich Spiker Senior Executive Vice President Chief Lending Officer 37 years in Industry 9 years at the Bank Litz Van Dyke Chief Executive Officer 41 years in Industry 10 years at the Bank Bradford Langs President Chief Strategy Officer 40 years in Industry 9 years at the Bank Wendy Bell Senior Executive Vice President Chief Financial Officer 41 years in Industry 9 years at the Bank Kimberly Schaufenbuel Executive Vice President Chief Human Resources Officer 7 years in Industry <1 year at the Bank


As of Month XX, XXXX Rewarding Relationships 9 Regulators Customers Community Associates Investors Nurturing relationships and rewarding customers, associates, and shareholders. As of September 30, 2026
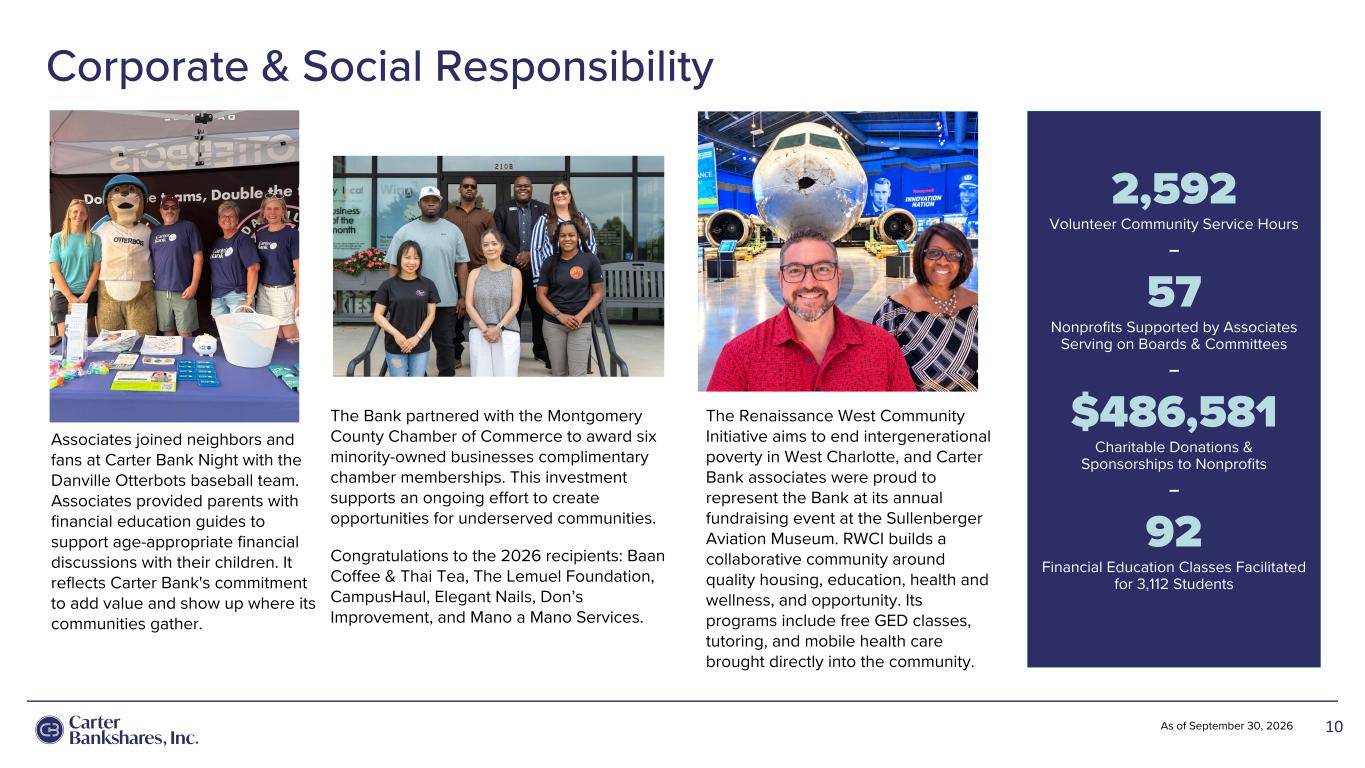
Corporate & Social Responsibility 10As of September 30, 2026 2,592 Volunteer Community Service Hours – 57 Nonprofits Supported by Associates Serving on Boards & Committees – $486,581 Charitable Donations & Sponsorships to Nonprofits – 92 Financial Education Classes Facilitated for 3,112 Students Associates joined neighbors and fans at Carter Bank Night with the Danville Otterbots baseball team. Associates provided parents with financial education guides to support age-appropriate financial discussions with their children. It reflects Carter Bank's commitment to add value and show up where its communities gather. The Bank partnered with the Montgomery County Chamber of Commerce to award six minority-owned businesses complimentary chamber memberships. This investment supports an ongoing effort to create opportunities for underserved communities. Congratulations to the 2026 recipients: Baan Coffee & Thai Tea, The Lemuel Foundation, CampusHaul, Elegant Nails, Don’s Improvement, and Mano a Mano Services. The Renaissance West Community Initiative aims to end intergenerational poverty in West Charlotte, and Carter Bank associates were proud to represent the Bank at its annual fundraising event at the Sullenberger Aviation Museum. RWCI builds a collaborative community around quality housing, education, health and wellness, and opportunity. Its programs include free GED classes, tutoring, and mobile health care brought directly into the community.
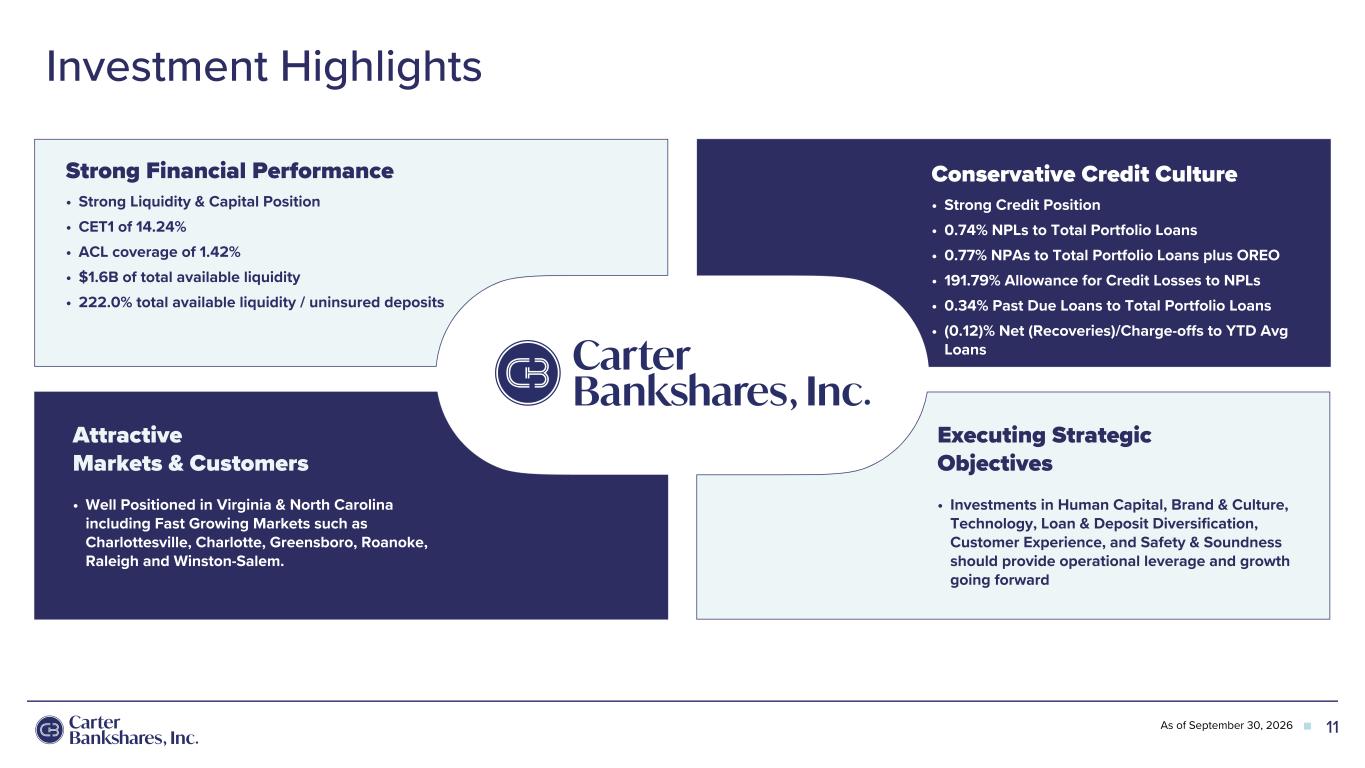
As of Month XX, XXXX Investment Highlights Strong Financial Performance • Strong Liquidity & Capital Position • CET1 of 14.24% • ACL coverage of 1.42% • $1.6B of total available liquidity • 222.0% total available liquidity / uninsured deposits Attractive Markets & Customers • Well Positioned in Virginia & North Carolina including Fast Growing Markets such as Charlottesville, Charlotte, Greensboro, Roanoke, Raleigh and Winston-Salem. Executing Strategic Objectives • Investments in Human Capital, Brand & Culture, Technology, Loan & Deposit Diversification, Customer Experience, and Safety & Soundness should provide operational leverage and growth going forward Strong Financial PerformanceConservative Credit Culture • Strong Credit Position • 0.74% NPLs to Total Portfolio Loans • 0.77% NPAs to Total Portfolio Loans plus OREO • 191.79% Allowance for Credit Losses to NPLs • 0.34% Past Due Loans to Total Portfolio Loans • (0.12)% Net (Recoveries)/Charge-offs to YTD Avg Loans 11As of September 30, 2026
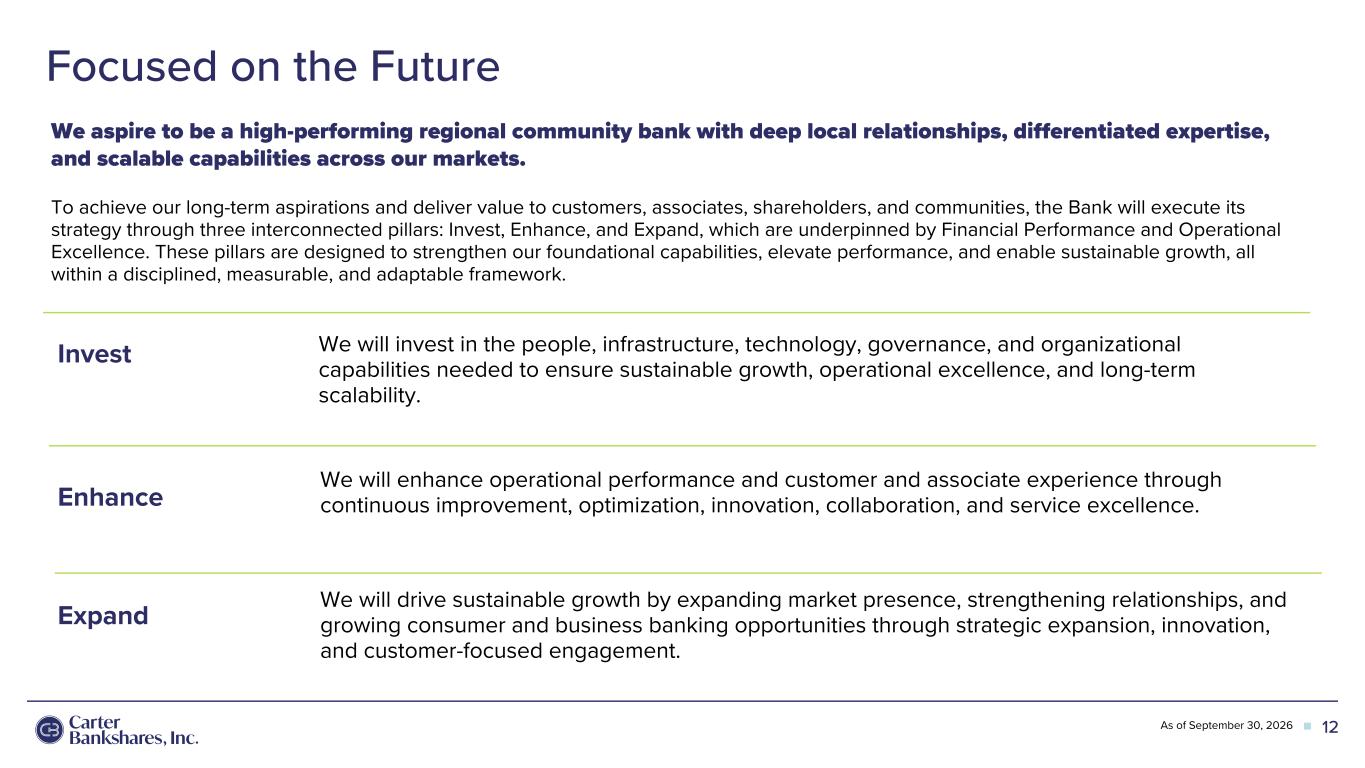
As of Month XX, XXXX Focused on the Future 12 We aspire to be a high-performing regional community bank with deep local relationships, differentiated expertise, and scalable capabilities across our markets. To achieve our long-term aspirations and deliver value to customers, associates, shareholders, and communities, the Bank will execute its strategy through three interconnected pillars: Invest, Enhance, and Expand, which are underpinned by Financial Performance and Operational Excellence. These pillars are designed to strengthen our foundational capabilities, elevate performance, and enable sustainable growth, all within a disciplined, measurable, and adaptable framework. We will invest in the people, infrastructure, technology, governance, and organizational capabilities needed to ensure sustainable growth, operational excellence, and long-term scalability. Invest Enhance Expand We will enhance operational performance and customer and associate experience through continuous improvement, optimization, innovation, collaboration, and service excellence. We will drive sustainable growth by expanding market presence, strengthening relationships, and growing consumer and business banking opportunities through strategic expansion, innovation, and customer-focused engagement. As of September 30, 2026
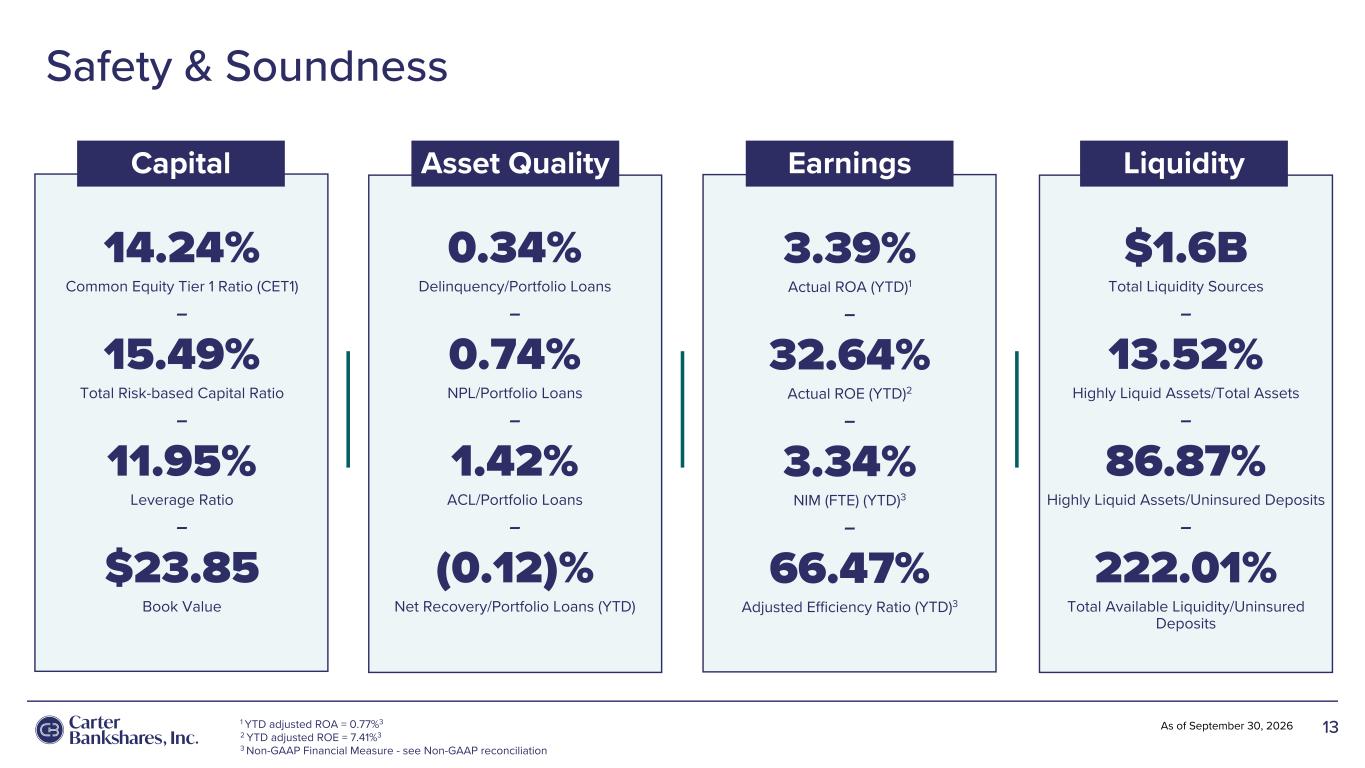
Safety & Soundness 13As of September 30, 2026 Capital Asset Quality Earnings 14.24% Common Equity Tier 1 Ratio (CET1) – 15.49% Total Risk-based Capital Ratio – 11.95% Leverage Ratio – $23.85 Book Value 0.34% Delinquency/Portfolio Loans – 0.74% NPL/Portfolio Loans – 1.42% ACL/Portfolio Loans – (0.12)% Net Recovery/Portfolio Loans (YTD) 3.39% Actual ROA (YTD)1 – 32.64% Actual ROE (YTD)2 – 3.34% NIM (FTE) (YTD)3 – 66.47% Adjusted Efficiency Ratio (YTD)3 $1.6B Total Liquidity Sources – 13.52% Highly Liquid Assets/Total Assets – 86.87% Highly Liquid Assets/Uninsured Deposits – 222.01% Total Available Liquidity/Uninsured Deposits Liquidity 1 YTD adjusted ROA = 0.77%3 2 YTD adjusted ROE = 7.41%3 3 Non-GAAP Financial Measure - see Non-GAAP reconciliation

Financial SECTION 02
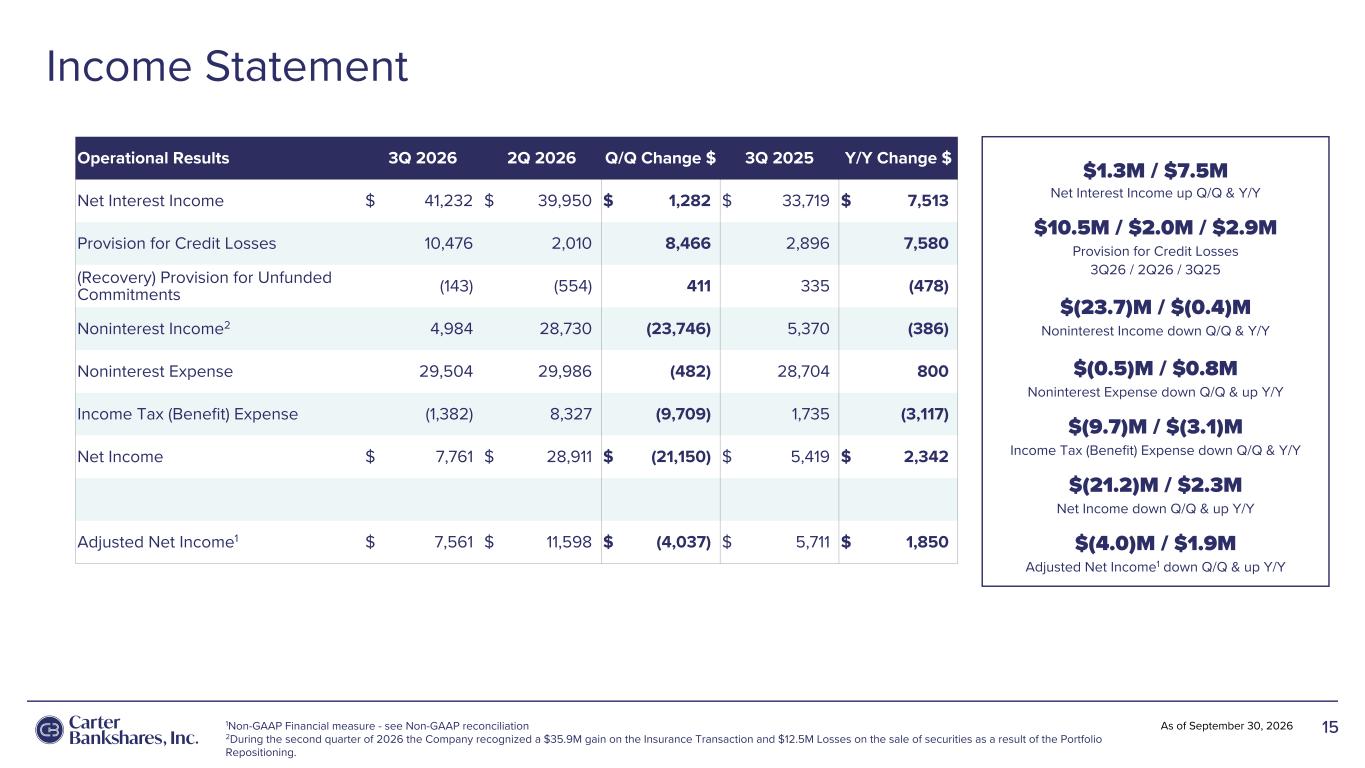
Income Statement 15As of September 30, 2026 Operational Results 3Q 2026 2Q 2026 Q/Q Change $ 3Q 2025 Y/Y Change $ Net Interest Income $ 41,232 $ 39,950 $ 1,282 $ 33,719 $ 7,513 Provision for Credit Losses 10,476 2,010 8,466 2,896 7,580 (Recovery) Provision for Unfunded Commitments (143) (554) 411 335 (478) Noninterest Income2 4,984 28,730 (23,746) 5,370 (386) Noninterest Expense 29,504 29,986 (482) 28,704 800 Income Tax (Benefit) Expense (1,382) 8,327 (9,709) 1,735 (3,117) Net Income $ 7,761 $ 28,911 $ (21,150) $ 5,419 $ 2,342 Adjusted Net Income1 $ 7,561 $ 11,598 $ (4,037) $ 5,711 $ 1,850 1Non-GAAP Financial measure - see Non-GAAP reconciliation 2During the second quarter of 2026 the Company recognized a $35.9M gain on the Insurance Transaction and $12.5M Losses on the sale of securities as a result of the Portfolio Repositioning. $1.3M / $7.5M Net Interest Income up Q/Q & Y/Y $10.5M / $2.0M / $2.9M Provision for Credit Losses 3Q26 / 2Q26 / 3Q25 $(23.7)M / $(0.4)M Noninterest Income down Q/Q & Y/Y $(0.5)M / $0.8M Noninterest Expense down Q/Q & up Y/Y $(9.7)M / $(3.1)M Income Tax (Benefit) Expense down Q/Q & Y/Y $(21.2)M / $2.3M Net Income down Q/Q & up Y/Y $(4.0)M / $1.9M Adjusted Net Income1 down Q/Q & up Y/Y
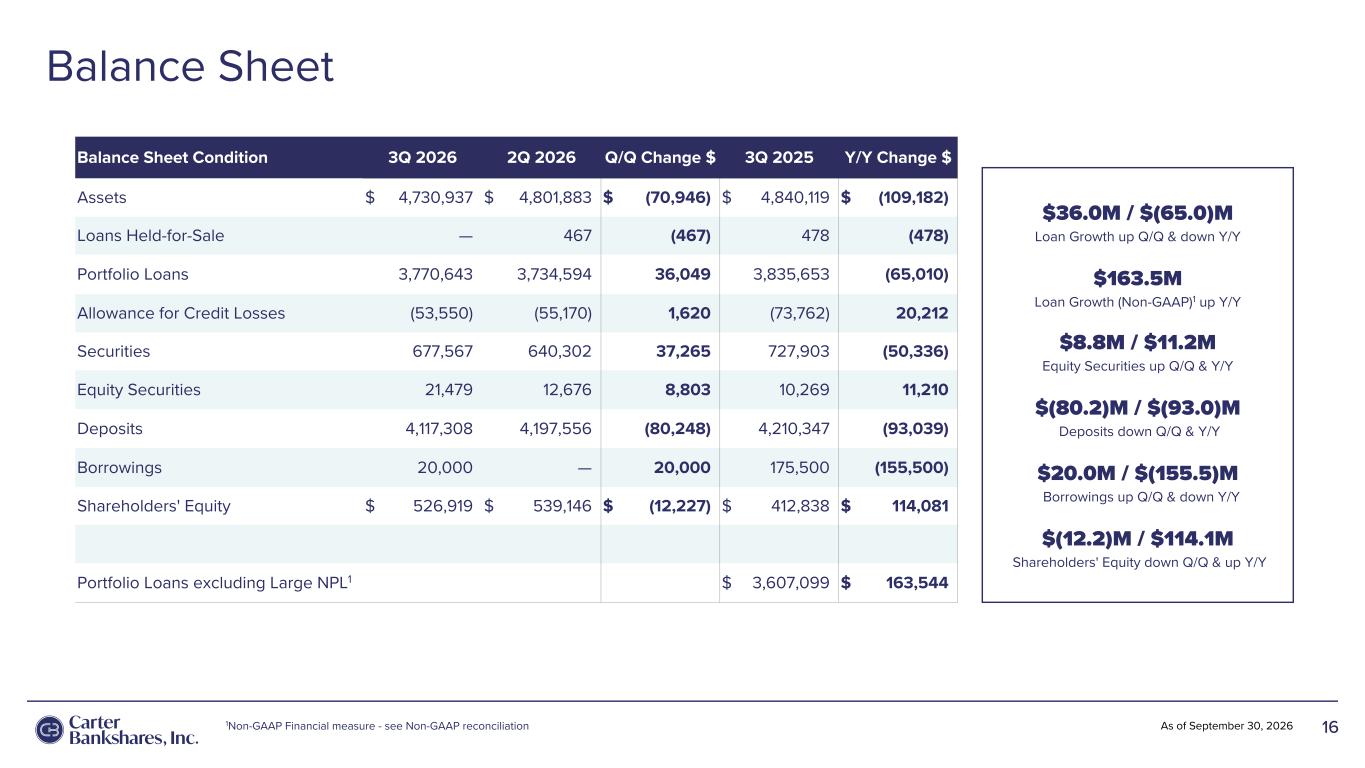
Balance Sheet 16As of September 30, 2026 Balance Sheet Condition 3Q 2026 2Q 2026 Q/Q Change $ 3Q 2025 Y/Y Change $ Assets $ 4,730,937 $ 4,801,883 $ (70,946) $ 4,840,119 $ (109,182) Loans Held-for-Sale — 467 (467) 478 (478) Portfolio Loans 3,770,643 3,734,594 36,049 3,835,653 (65,010) Allowance for Credit Losses (53,550) (55,170) 1,620 (73,762) 20,212 Securities 677,567 640,302 37,265 727,903 (50,336) Equity Securities 21,479 12,676 8,803 10,269 11,210 Deposits 4,117,308 4,197,556 (80,248) 4,210,347 (93,039) Borrowings 20,000 — 20,000 175,500 (155,500) Shareholders' Equity $ 526,919 $ 539,146 $ (12,227) $ 412,838 $ 114,081 Portfolio Loans excluding Large NPL1 $ 3,607,099 $ 163,544 1Non-GAAP Financial measure - see Non-GAAP reconciliation $36.0M / $(65.0)M Loan Growth up Q/Q & down Y/Y $163.5M Loan Growth (Non-GAAP)1 up Y/Y $8.8M / $11.2M Equity Securities up Q/Q & Y/Y $(80.2)M / $(93.0)M Deposits down Q/Q & Y/Y $20.0M / $(155.5)M Borrowings up Q/Q & down Y/Y $(12.2)M / $114.1M Shareholders' Equity down Q/Q & up Y/Y
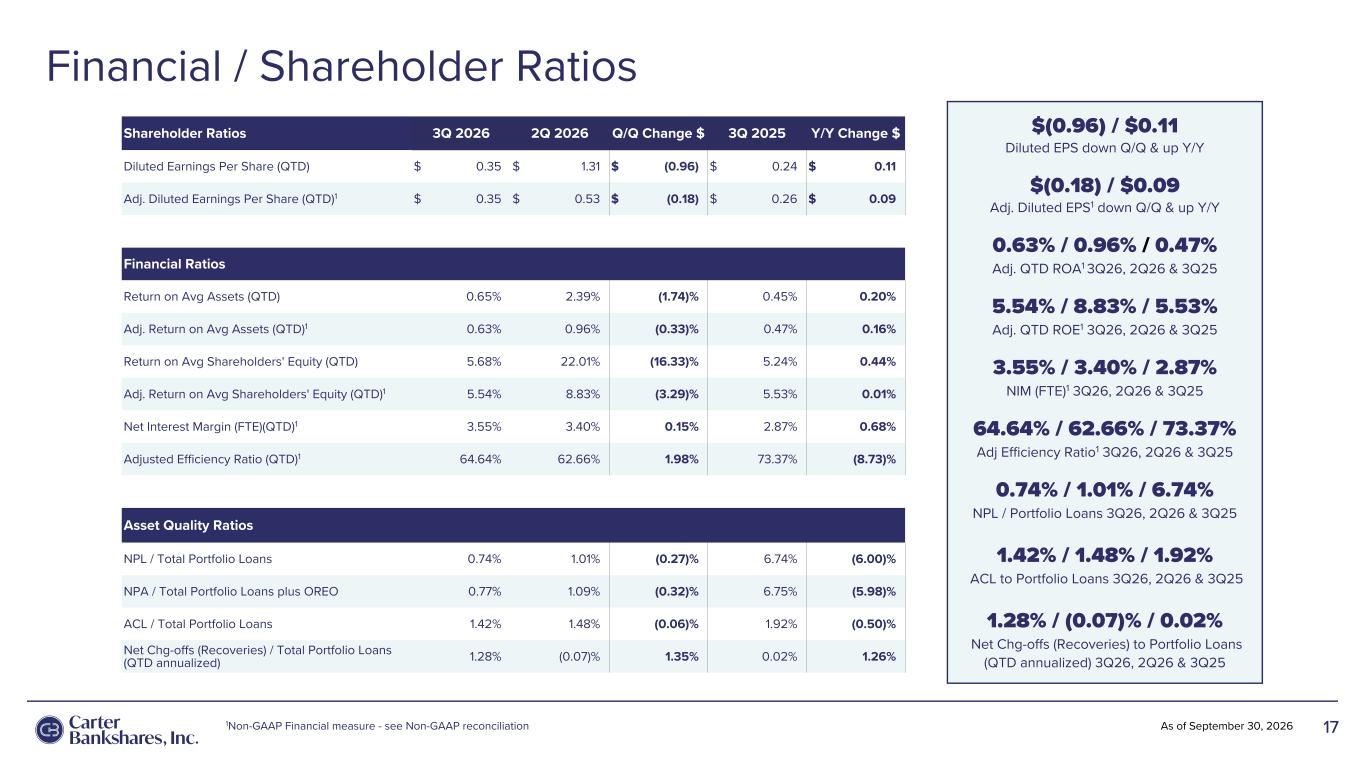
Financial / Shareholder Ratios 17As of September 30, 2026 Shareholder Ratios 3Q 2026 2Q 2026 Q/Q Change $ 3Q 2025 Y/Y Change $ Diluted Earnings Per Share (QTD) $ 0.35 $ 1.31 $ (0.96) $ 0.24 $ 0.11 Adj. Diluted Earnings Per Share (QTD)1 $ 0.35 $ 0.53 $ (0.18) $ 0.26 $ 0.09 Financial Ratios Return on Avg Assets (QTD) 0.65 % 2.39 % (1.74) % 0.45 % 0.20 % Adj. Return on Avg Assets (QTD)1 0.63 % 0.96 % (0.33) % 0.47 % 0.16 % Return on Avg Shareholders' Equity (QTD) 5.68 % 22.01 % (16.33) % 5.24 % 0.44 % Adj. Return on Avg Shareholders' Equity (QTD)1 5.54 % 8.83 % (3.29) % 5.53 % 0.01 % Net Interest Margin (FTE)(QTD)1 3.55 % 3.40 % 0.15 % 2.87 % 0.68 % Adjusted Efficiency Ratio (QTD)1 64.64 % 62.66 % 1.98 % 73.37 % (8.73) % Asset Quality Ratios NPL / Total Portfolio Loans 0.74 % 1.01 % (0.27) % 6.74 % (6.00) % NPA / Total Portfolio Loans plus OREO 0.77 % 1.09 % (0.32) % 6.75 % (5.98) % ACL / Total Portfolio Loans 1.42 % 1.48 % (0.06) % 1.92 % (0.50) % Net Chg-offs (Recoveries) / Total Portfolio Loans (QTD annualized) 1.28 % (0.07) % 1.35 % 0.02 % 1.26 % $(0.96) / $0.11 Diluted EPS down Q/Q & up Y/Y $(0.18) / $0.09 Adj. Diluted EPS1 down Q/Q & up Y/Y 0.63% / 0.96% / 0.47% Adj. QTD ROA1 3Q26, 2Q26 & 3Q25 5.54% / 8.83% / 5.53% Adj. QTD ROE1 3Q26, 2Q26 & 3Q25 3.55% / 3.40% / 2.87% NIM (FTE)1 3Q26, 2Q26 & 3Q25 64.64% / 62.66% / 73.37% Adj Efficiency Ratio1 3Q26, 2Q26 & 3Q25 0.74% / 1.01% / 6.74% NPL / Portfolio Loans 3Q26, 2Q26 & 3Q25 1.42% / 1.48% / 1.92% ACL to Portfolio Loans 3Q26, 2Q26 & 3Q25 1.28% / (0.07)% / 0.02% Net Chg-offs (Recoveries) to Portfolio Loans (QTD annualized) 3Q26, 2Q26 & 3Q25 1Non-GAAP Financial measure - see Non-GAAP reconciliation
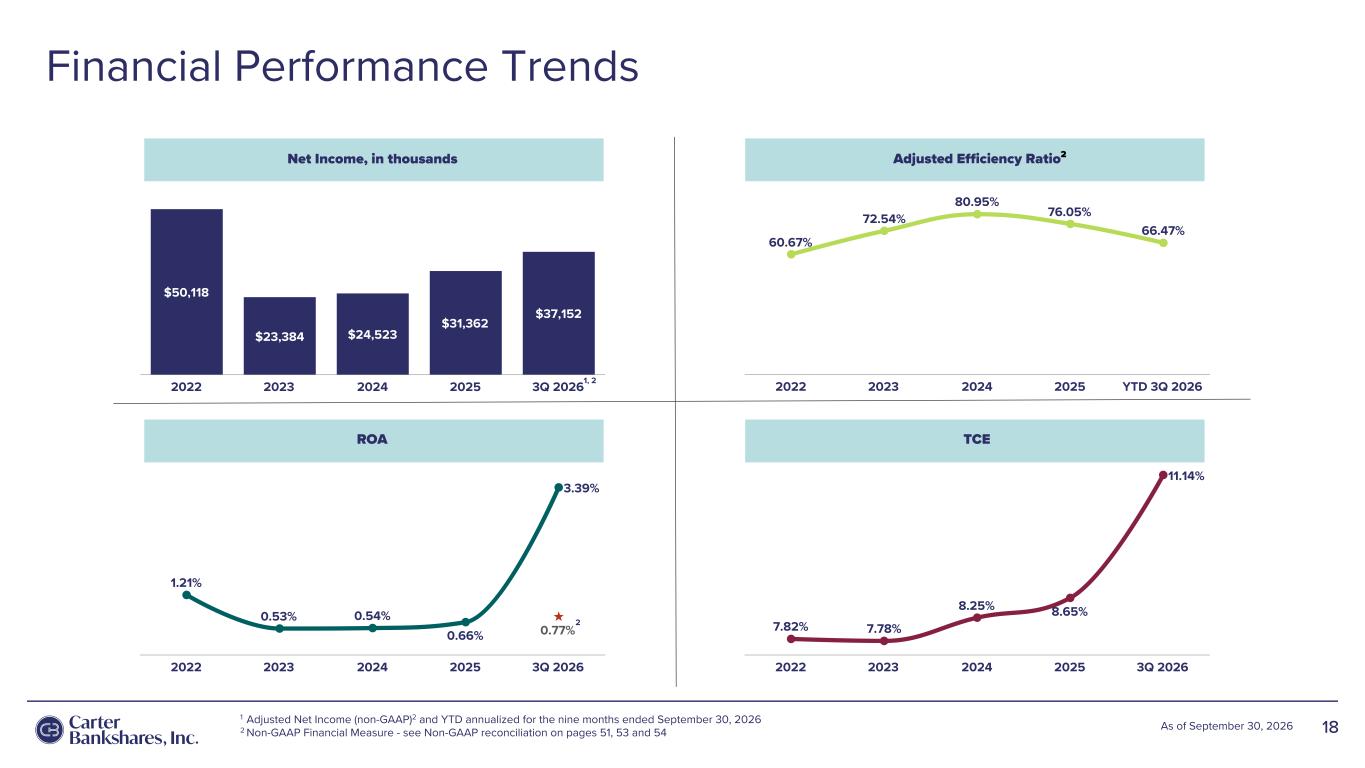
Financial Performance Trends 18As of September 30, 2026 Net Income, in thousands $50,118 $23,384 $24,523 $31,362 $37,152 2022 2023 2024 2025 3Q 2026 Adjusted Efficiency Ratio 60.67% 72.54% 80.95% 76.05% 66.47% 2022 2023 2024 2025 YTD 3Q 2026 ROA 1.21% 0.53% 0.54% 0.66% 3.39% 0.77% 2022 2023 2024 2025 3Q 2026 TCE 7.82% 7.78% 8.25% 8.65% 11.14% 2022 2023 2024 2025 3Q 2026 2 1 Adjusted Net Income (non-GAAP)2 and YTD annualized for the nine months ended September 30, 2026 2 Non-GAAP Financial Measure - see Non-GAAP reconciliation on pages 51, 53 and 54 1, 2 2
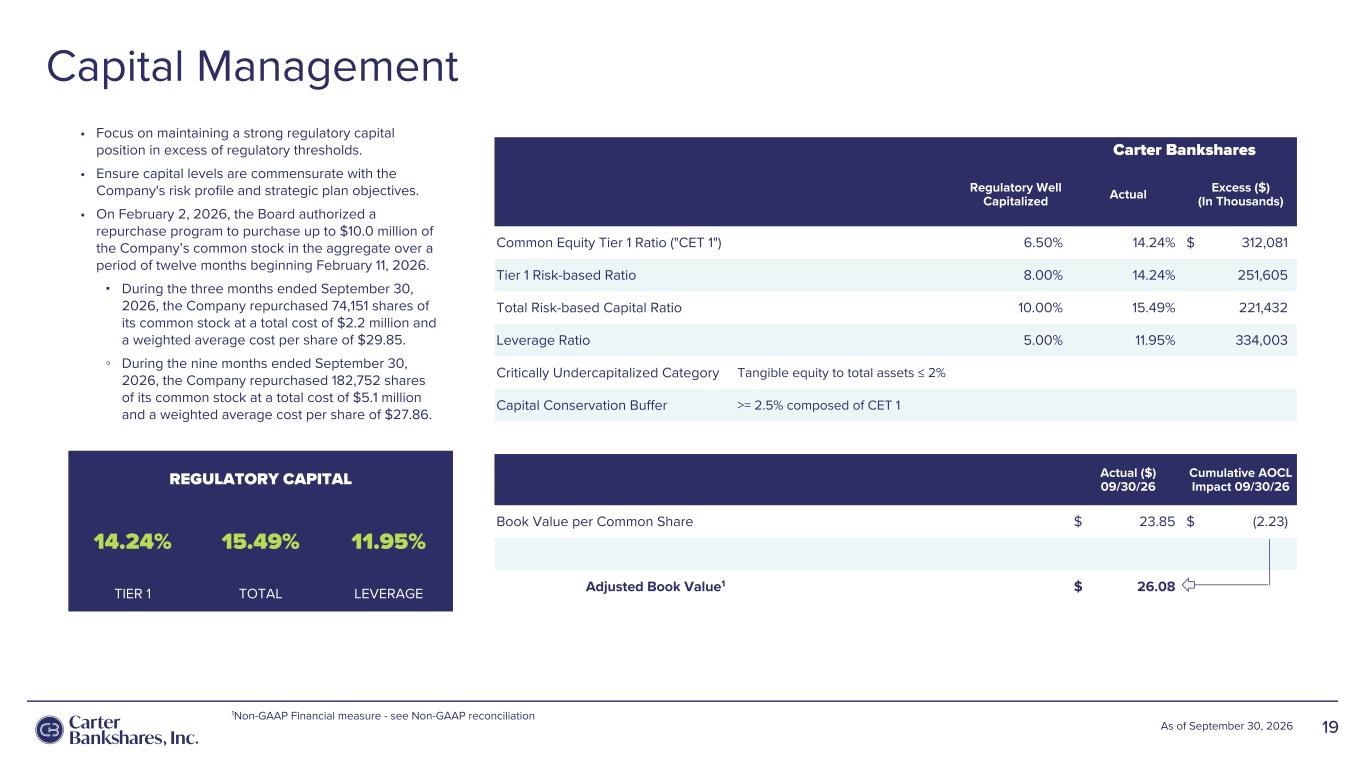
Carter Bankshares Regulatory Well Capitalized Actual Excess ($) (In Thousands) Common Equity Tier 1 Ratio ("CET 1") 6.50 % 14.24 % $ 312,081 Tier 1 Risk-based Ratio 8.00 % 14.24 % 251,605 Total Risk-based Capital Ratio 10.00 % 15.49 % 221,432 Leverage Ratio 5.00 % 11.95 % 334,003 Critically Undercapitalized Category Tangible equity to total assets ≤ 2% Capital Conservation Buffer >= 2.5% composed of CET 1 Actual ($) 09/30/26 Cumulative AOCL Impact 09/30/26 Book Value per Common Share $ 23.85 $ (2.23) Adjusted Book Value1 $ 26.08 Capital Management 19As of September 30, 2026 • Focus on maintaining a strong regulatory capital position in excess of regulatory thresholds. • Ensure capital levels are commensurate with the Company's risk profile and strategic plan objectives. • On February 2, 2026, the Board authorized a repurchase program to purchase up to $10.0 million of the Company’s common stock in the aggregate over a period of twelve months beginning February 11, 2026. ▪ During the three months ended September 30, 2026, the Company repurchased 74,151 shares of its common stock at a total cost of $2.2 million and a weighted average cost per share of $29.85. ◦ During the nine months ended September 30, 2026, the Company repurchased 182,752 shares of its common stock at a total cost of $5.1 million and a weighted average cost per share of $27.86. REGULATORY CAPITAL 14.24% 15.49% 11.95% TIER 1 TOTAL LEVERAGE 1Non-GAAP Financial measure - see Non-GAAP reconciliation
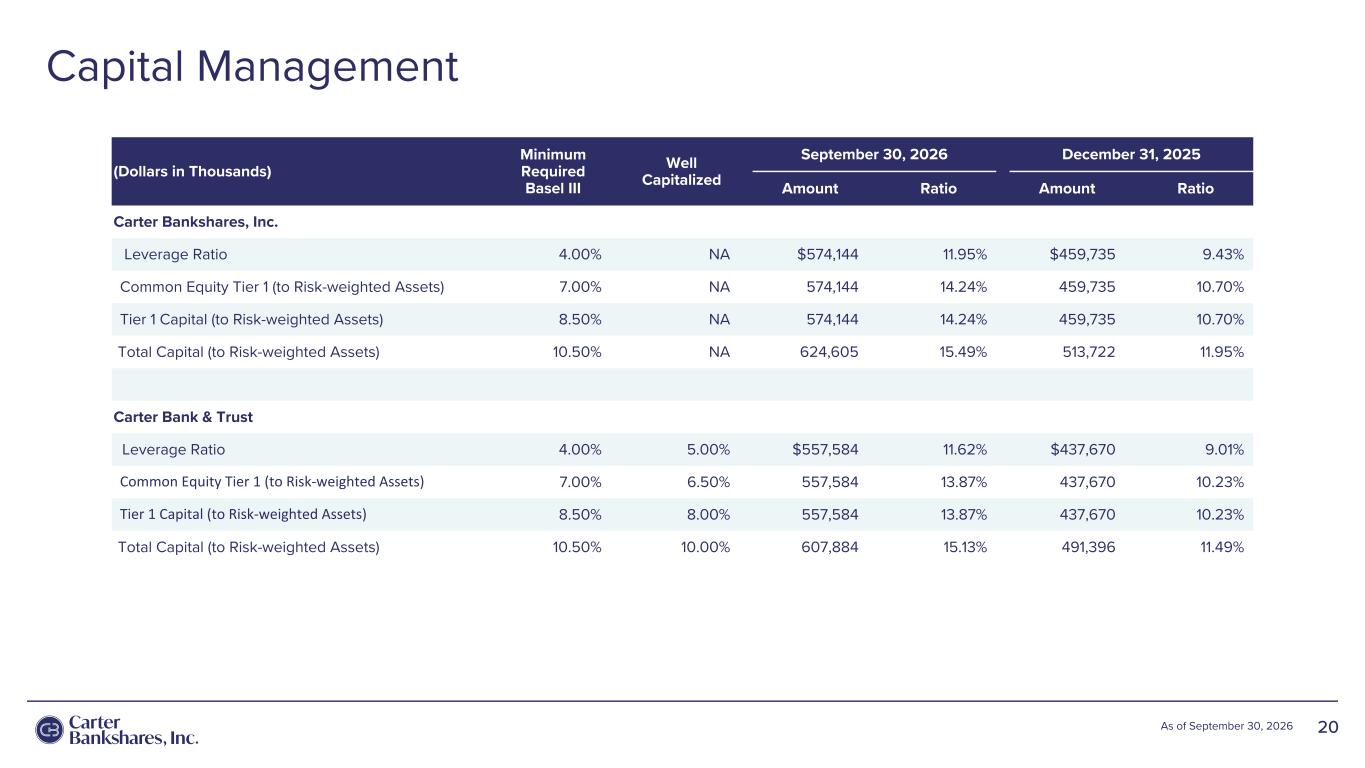
(Dollars in Thousands) Minimum Required Basel III Well Capitalized September 30, 2026 December 31, 2025 Amount Ratio Amount Ratio Carter Bankshares, Inc. Leverage Ratio 4.00 % NA $574,144 11.95 % $459,735 9.43 % Common Equity Tier 1 (to Risk-weighted Assets) 7.00 % NA 574,144 14.24 % 459,735 10.70 % Tier 1 Capital (to Risk-weighted Assets) 8.50 % NA 574,144 14.24 % 459,735 10.70 % Total Capital (to Risk-weighted Assets) 10.50 % NA 624,605 15.49 % 513,722 11.95 % Carter Bank & Trust Leverage Ratio 4.00 % 5.00 % $557,584 11.62 % $437,670 9.01 % Common Equity Tier 1 (to Risk-weighted Assets) 7.00 % 6.50 % 557,584 13.87 % 437,670 10.23 % Tier 1 Capital (to Risk-weighted Assets) 8.50 % 8.00 % 557,584 13.87 % 437,670 10.23 % Total Capital (to Risk-weighted Assets) 10.50 % 10.00 % 607,884 15.13 % 491,396 11.49 % Capital Management 20As of September 30, 2026
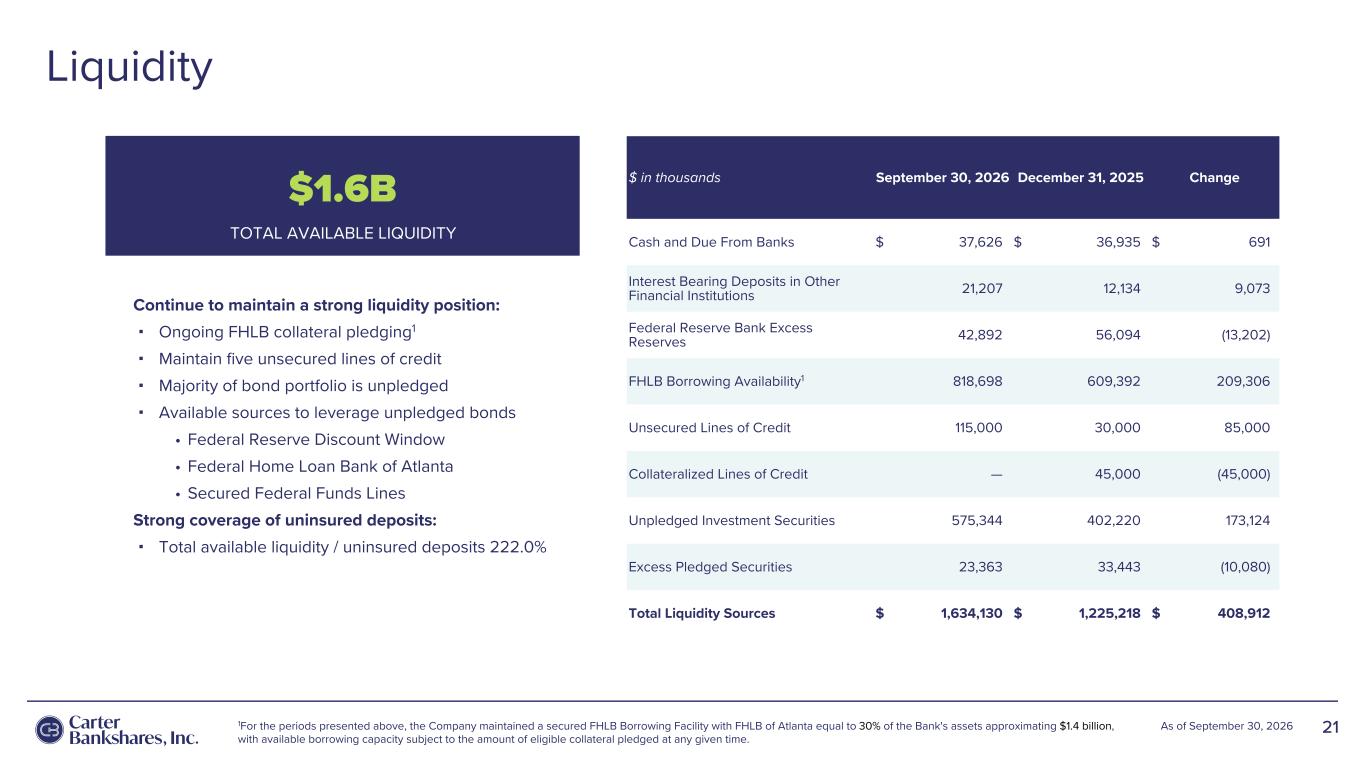
21 Liquidity As of September 30, 2026 $ in thousands September 30, 2026 December 31, 2025 Change Cash and Due From Banks $ 37,626 $ 36,935 $ 691 Interest Bearing Deposits in Other Financial Institutions 21,207 12,134 9,073 Federal Reserve Bank Excess Reserves 42,892 56,094 (13,202) FHLB Borrowing Availability1 818,698 609,392 209,306 Unsecured Lines of Credit 115,000 30,000 85,000 Collateralized Lines of Credit — 45,000 (45,000) Unpledged Investment Securities 575,344 402,220 173,124 Excess Pledged Securities 23,363 33,443 (10,080) Total Liquidity Sources $ 1,634,130 $ 1,225,218 $ 408,912 $1.6B TOTAL AVAILABLE LIQUIDITY Continue to maintain a strong liquidity position: ▪ Ongoing FHLB collateral pledging1 ▪ Maintain five unsecured lines of credit ▪ Majority of bond portfolio is unpledged ▪ Available sources to leverage unpledged bonds • Federal Reserve Discount Window • Federal Home Loan Bank of Atlanta • Secured Federal Funds Lines Strong coverage of uninsured deposits: ▪ Total available liquidity / uninsured deposits 222.0% 1For the periods presented above, the Company maintained a secured FHLB Borrowing Facility with FHLB of Atlanta equal to 30% of the Bank's assets approximating $1.4 billion, with available borrowing capacity subject to the amount of eligible collateral pledged at any given time.
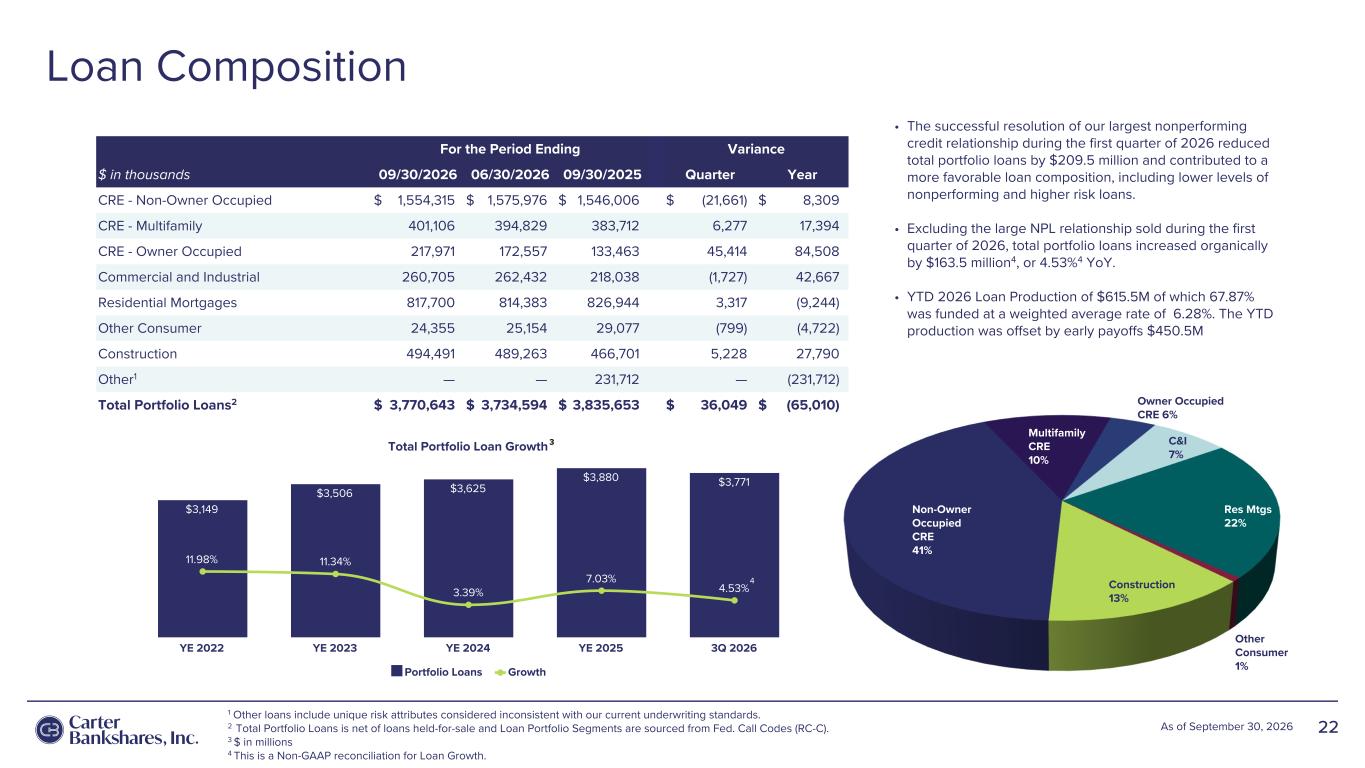
Loan Composition 22As of September 30, 2026 For the Period Ending Variance $ in thousands 09/30/2026 06/30/2026 09/30/2025 Quarter Year CRE - Non-Owner Occupied $ 1,554,315 $ 1,575,976 $ 1,546,006 $ (21,661) $ 8,309 CRE - Multifamily 401,106 394,829 383,712 6,277 17,394 CRE - Owner Occupied 217,971 172,557 133,463 45,414 84,508 Commercial and Industrial 260,705 262,432 218,038 (1,727) 42,667 Residential Mortgages 817,700 814,383 826,944 3,317 (9,244) Other Consumer 24,355 25,154 29,077 (799) (4,722) Construction 494,491 489,263 466,701 5,228 27,790 Other1 — — 231,712 — (231,712) Total Portfolio Loans2 $ 3,770,643 $ 3,734,594 $ 3,835,653 $ 36,049 $ (65,010) • The successful resolution of our largest nonperforming credit relationship during the first quarter of 2026 reduced total portfolio loans by $209.5 million and contributed to a more favorable loan composition, including lower levels of nonperforming and higher risk loans. • Excluding the large NPL relationship sold during the first quarter of 2026, total portfolio loans increased organically by $163.5 million4, or 4.53%4 YoY. • YTD 2026 Loan Production of $615.5M of which 67.87% was funded at a weighted average rate of 6.28%. The YTD production was offset by early payoffs $450.5M Total Portfolio Loan Growth $3,149 $3,506 $3,625 $3,880 $3,771 11.98% 11.34% 3.39% 7.03% 4.53% Portfolio Loans Growth YE 2022 YE 2023 YE 2024 YE 2025 3Q 2026 Non-Owner Occupied CRE 41% C&I 7% Res Mtgs 22% Other Consumer 1% Construction 13% 1 Other loans include unique risk attributes considered inconsistent with our current underwriting standards. 2 Total Portfolio Loans is net of loans held-for-sale and Loan Portfolio Segments are sourced from Fed. Call Codes (RC-C). 3 $ in millions 4 This is a Non-GAAP reconciliation for Loan Growth. 3 Multifamily CRE 10% Owner Occupied CRE 6% 4
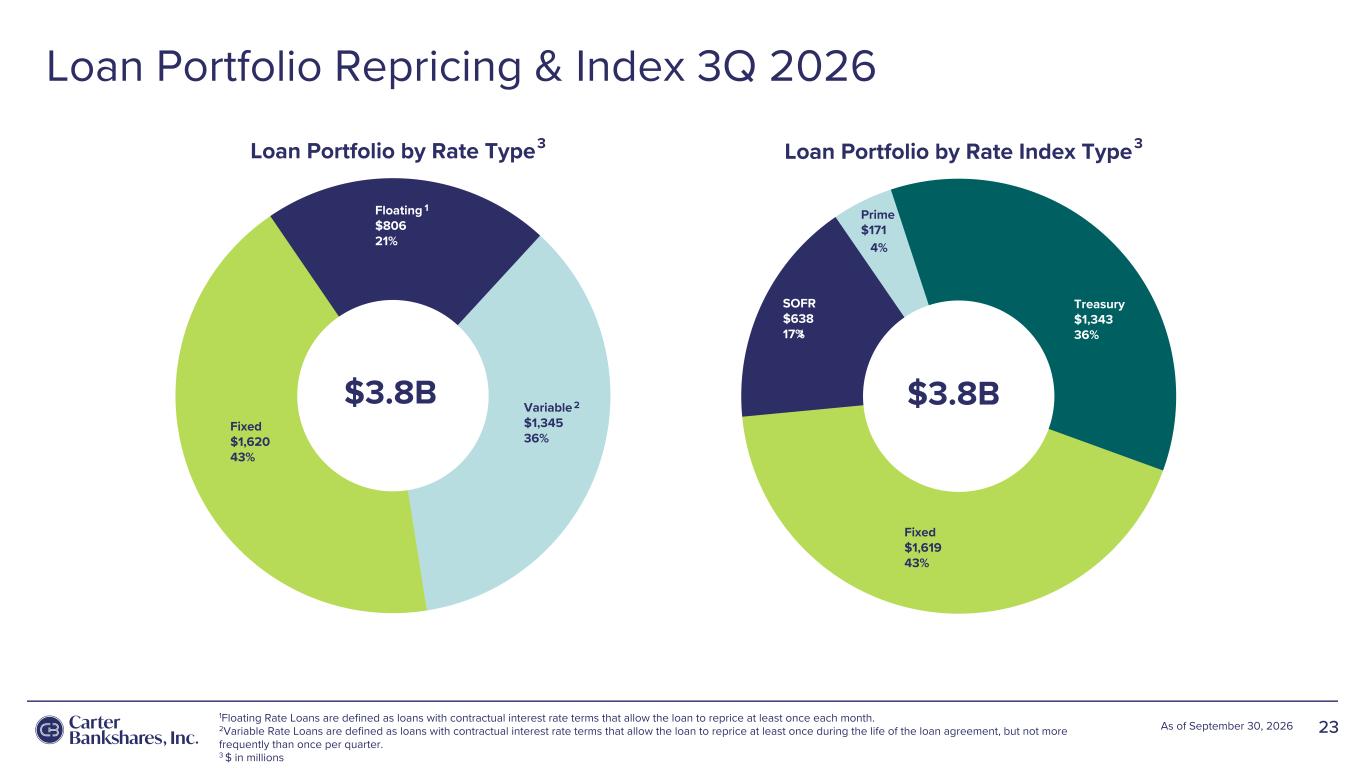
Loan Portfolio by Rate Type Fixed $1,620 43% Floating $806 21% Variable $1,345 36% Loan Portfolio Repricing & Index 3Q 2026 23As of September 30, 2026 Loan Portfolio by Rate Index Type Fixed $1,619 43% SOFR $638 17% Prime $171 Treasury $1,343 36% $3.8B $3.8B 1Floating Rate Loans are defined as loans with contractual interest rate terms that allow the loan to reprice at least once each month. 2Variable Rate Loans are defined as loans with contractual interest rate terms that allow the loan to reprice at least once during the life of the loan agreement, but not more frequently than once per quarter. 3 $ in millions 3 3 3 1 2 4% 3
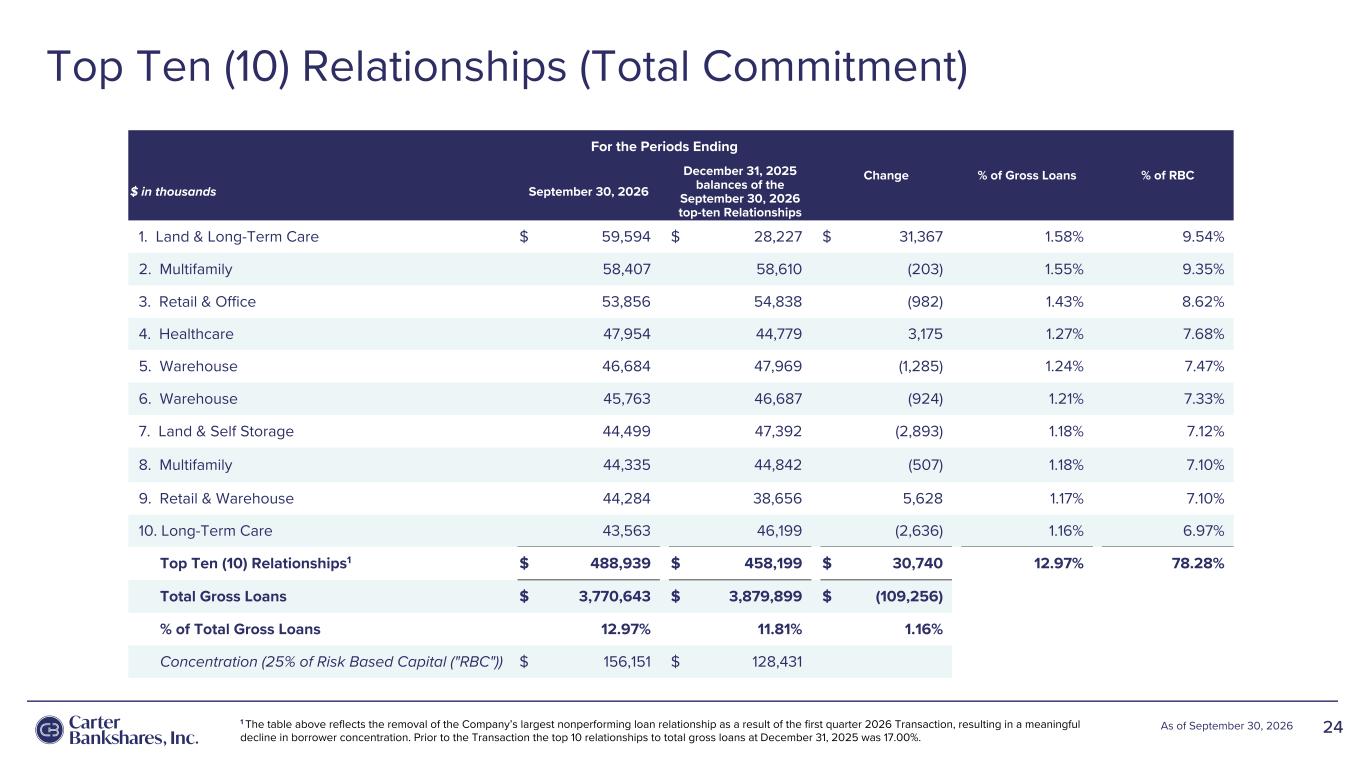
Top Ten (10) Relationships (Total Commitment) 24As of September 30, 2026 For the Periods Ending Change % of Gross Loans % of RBC $ in thousands September 30, 2026 December 31, 2025 balances of the September 30, 2026 top-ten Relationships 1. Land & Long-Term Care $ 59,594 $ 28,227 $ 31,367 1.58 % 9.54 % 2. Multifamily 58,407 58,610 (203) 1.55 % 9.35 % 3. Retail & Office 53,856 54,838 (982) 1.43 % 8.62 % 4. Healthcare 47,954 44,779 3,175 1.27 % 7.68 % 5. Warehouse 46,684 47,969 (1,285) 1.24 % 7.47 % 6. Warehouse 45,763 46,687 (924) 1.21 % 7.33 % 7. Land & Self Storage 44,499 47,392 (2,893) 1.18 % 7.12 % 8. Multifamily 44,335 44,842 (507) 1.18 % 7.10 % 9. Retail & Warehouse 44,284 38,656 5,628 1.17 % 7.10 % 10. Long-Term Care 43,563 46,199 (2,636) 1.16 % 6.97 % Top Ten (10) Relationships1 $ 488,939 $ 458,199 $ 30,740 12.97 % 78.28 % Total Gross Loans $ 3,770,643 $ 3,879,899 $ (109,256) % of Total Gross Loans 12.97 % 11.81 % 1.16 % Concentration (25% of Risk Based Capital ("RBC")) $ 156,151 $ 128,431 1 The table above reflects the removal of the Company’s largest nonperforming loan relationship as a result of the first quarter 2026 Transaction, resulting in a meaningful decline in borrower concentration. Prior to the Transaction the top 10 relationships to total gross loans at December 31, 2025 was 17.00%.
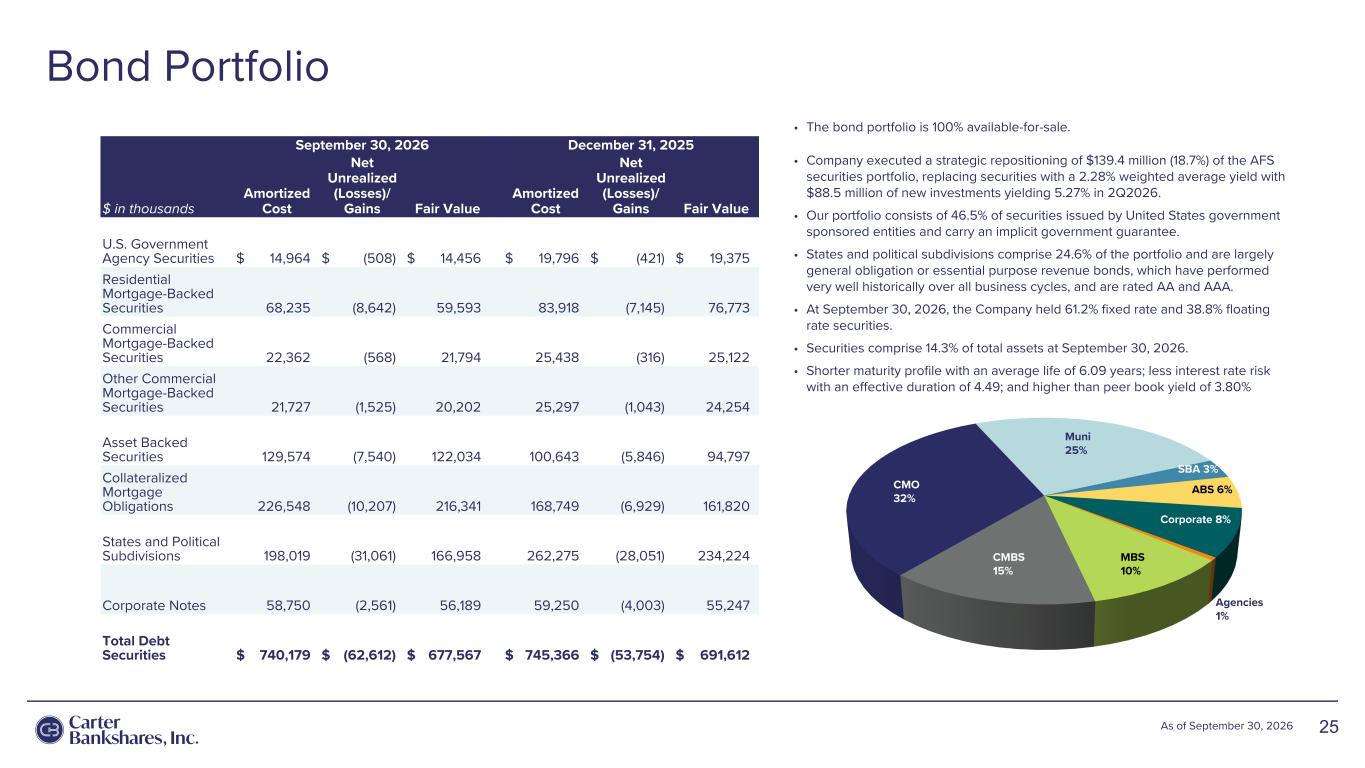
Bond Portfolio 25As of September 30, 2026 September 30, 2026 December 31, 2025 $ in thousands Amortized Cost Net Unrealized (Losses)/ Gains Fair Value Amortized Cost Net Unrealized (Losses)/ Gains Fair Value U.S. Government Agency Securities $ 14,964 $ (508) $ 14,456 $ 19,796 $ (421) $ 19,375 Residential Mortgage-Backed Securities 68,235 (8,642) 59,593 83,918 (7,145) 76,773 Commercial Mortgage-Backed Securities 22,362 (568) 21,794 25,438 (316) 25,122 Other Commercial Mortgage-Backed Securities 21,727 (1,525) 20,202 25,297 (1,043) 24,254 Asset Backed Securities 129,574 (7,540) 122,034 100,643 (5,846) 94,797 Collateralized Mortgage Obligations 226,548 (10,207) 216,341 168,749 (6,929) 161,820 States and Political Subdivisions 198,019 (31,061) 166,958 262,275 (28,051) 234,224 Corporate Notes 58,750 (2,561) 56,189 59,250 (4,003) 55,247 Total Debt Securities $ 740,179 $ (62,612) $ 677,567 $ 745,366 $ (53,754) $ 691,612 • The bond portfolio is 100% available-for-sale. • Company executed a strategic repositioning of $139.4 million (18.7%) of the AFS securities portfolio, replacing securities with a 2.28% weighted average yield with $88.5 million of new investments yielding 5.27% in 2Q2026. • Our portfolio consists of 46.5% of securities issued by United States government sponsored entities and carry an implicit government guarantee. • States and political subdivisions comprise 24.6% of the portfolio and are largely general obligation or essential purpose revenue bonds, which have performed very well historically over all business cycles, and are rated AA and AAA. • At September 30, 2026, the Company held 61.2% fixed rate and 38.8% floating rate securities. • Securities comprise 14.3% of total assets at September 30, 2026. • Shorter maturity profile with an average life of 6.09 years; less interest rate risk with an effective duration of 4.49; and higher than peer book yield of 3.80% CMO 32% Muni 25% SBA 3% Corporate 8% MBS 10% CMBS 15% ABS 6% Agencies 1%
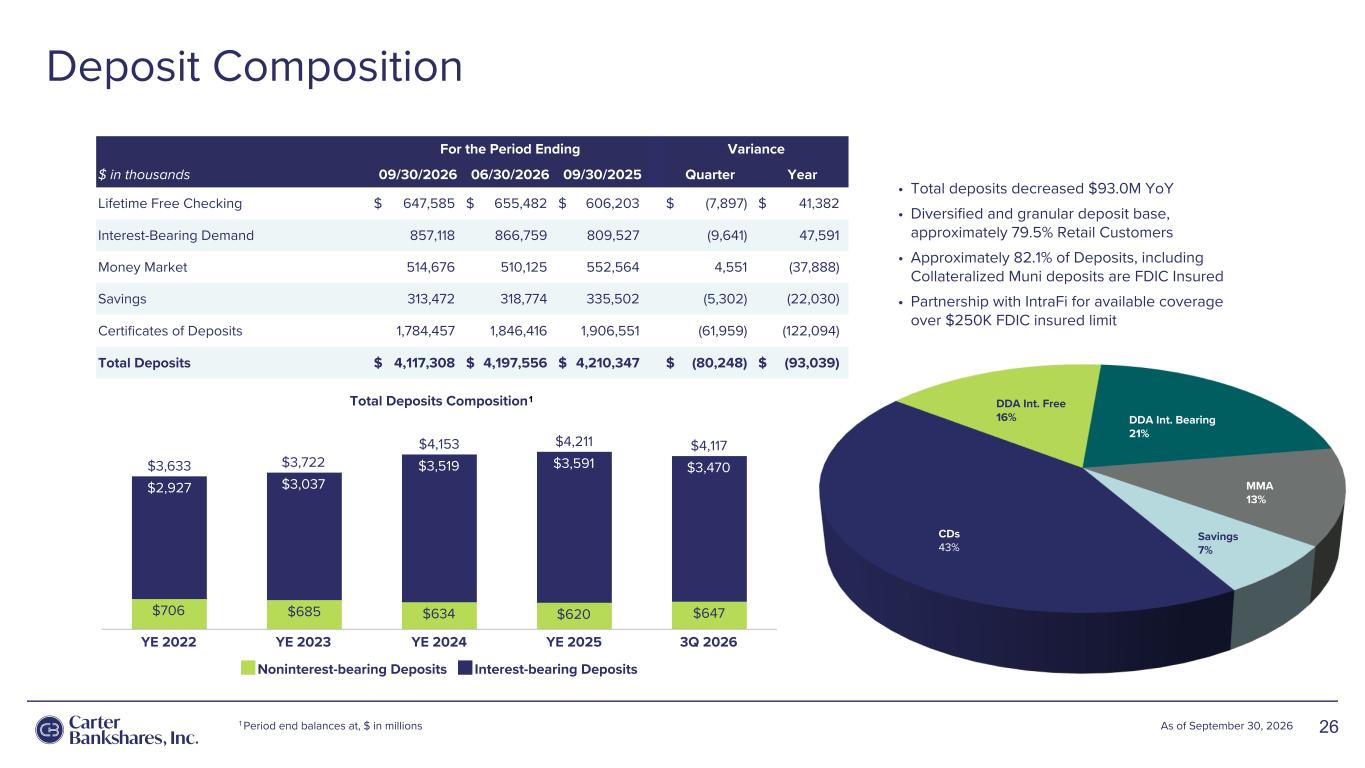
26As of September 30, 2026 Deposit Composition For the Period Ending Variance $ in thousands 09/30/2026 06/30/2026 09/30/2025 Quarter Year Lifetime Free Checking $ 647,585 $ 655,482 $ 606,203 $ (7,897) $ 41,382 Interest-Bearing Demand 857,118 866,759 809,527 (9,641) 47,591 Money Market 514,676 510,125 552,564 4,551 (37,888) Savings 313,472 318,774 335,502 (5,302) (22,030) Certificates of Deposits 1,784,457 1,846,416 1,906,551 (61,959) (122,094) Total Deposits $ 4,117,308 $ 4,197,556 $ 4,210,347 $ (80,248) $ (93,039) • Total deposits decreased $93.0M YoY • Diversified and granular deposit base, approximately 79.5% Retail Customers • Approximately 82.1% of Deposits, including Collateralized Muni deposits are FDIC Insured • Partnership with IntraFi for available coverage over $250K FDIC insured limit CDs 43% Savings 7% DDA Int. Bearing 21% DDA Int. Free 16% MMA 13% Total Deposits Composition $3,633 $3,722 $4,153 $4,211 $4,117 $706 $685 $634 $620 $647 $2,927 $3,037 $3,519 $3,591 $3,470 Noninterest-bearing Deposits Interest-bearing Deposits YE 2022 YE 2023 YE 2024 YE 2025 3Q 2026 1 1 Period end balances at, $ in millions
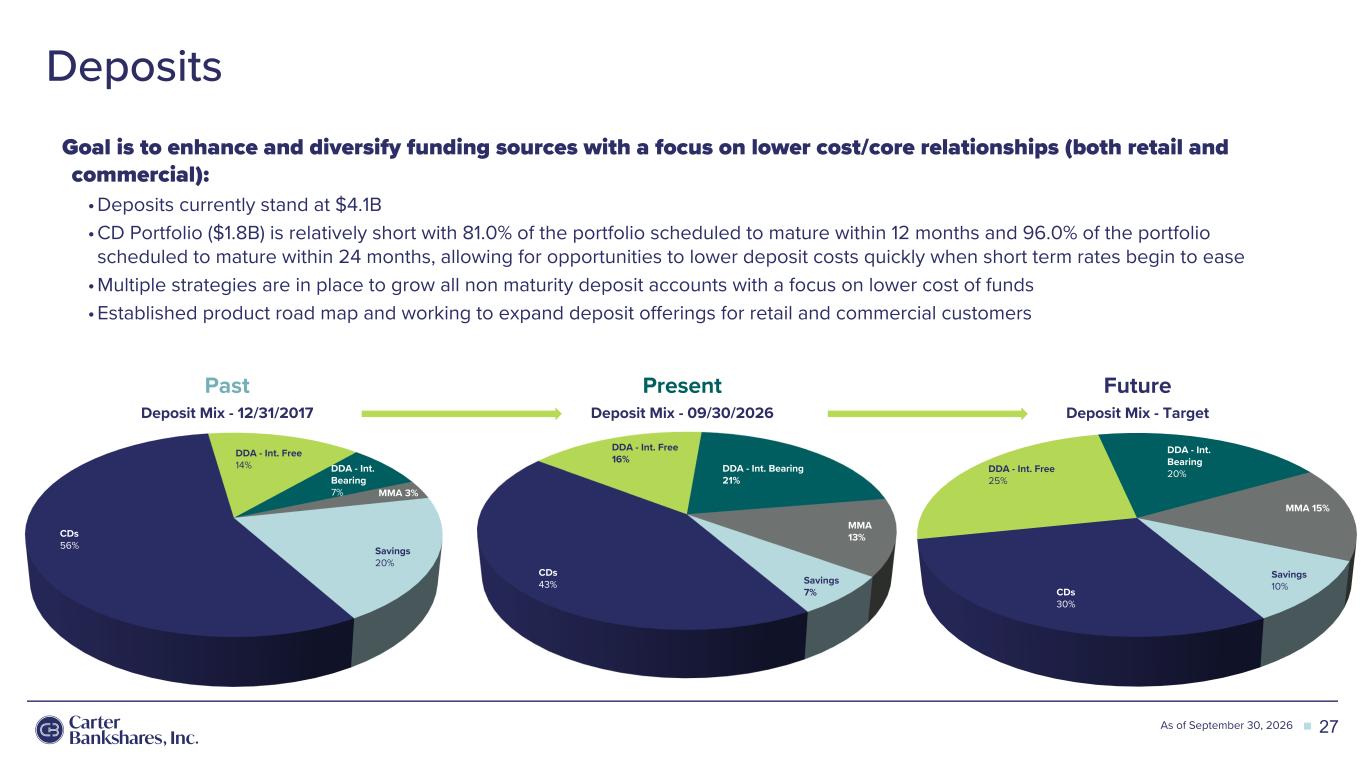
As of Month XX, XXXX Past Present Future Deposit Mix - 12/31/2017 Deposit Mix - 09/30/2026 Deposit Mix - Target Deposits 27 Goal is to enhance and diversify funding sources with a focus on lower cost/core relationships (both retail and commercial): •Deposits currently stand at $4.1B •CD Portfolio ($1.8B) is relatively short with 81.0% of the portfolio scheduled to mature within 12 months and 96.0% of the portfolio scheduled to mature within 24 months, allowing for opportunities to lower deposit costs quickly when short term rates begin to ease •Multiple strategies are in place to grow all non maturity deposit accounts with a focus on lower cost of funds •Established product road map and working to expand deposit offerings for retail and commercial customers As of September 30, 2026 CDs 56% DDA - Int. Free 14% DDA - Int. Bearing 7% MMA 3% Savings 20% CDs 30% DDA - Int. Free 25% DDA - Int. Bearing 20% MMA 15% Savings 10% DDA - Int. Free 16% DDA - Int. Bearing 21% CDs 43% MMA 13% Savings 7%

Asset Quality SECTION 03
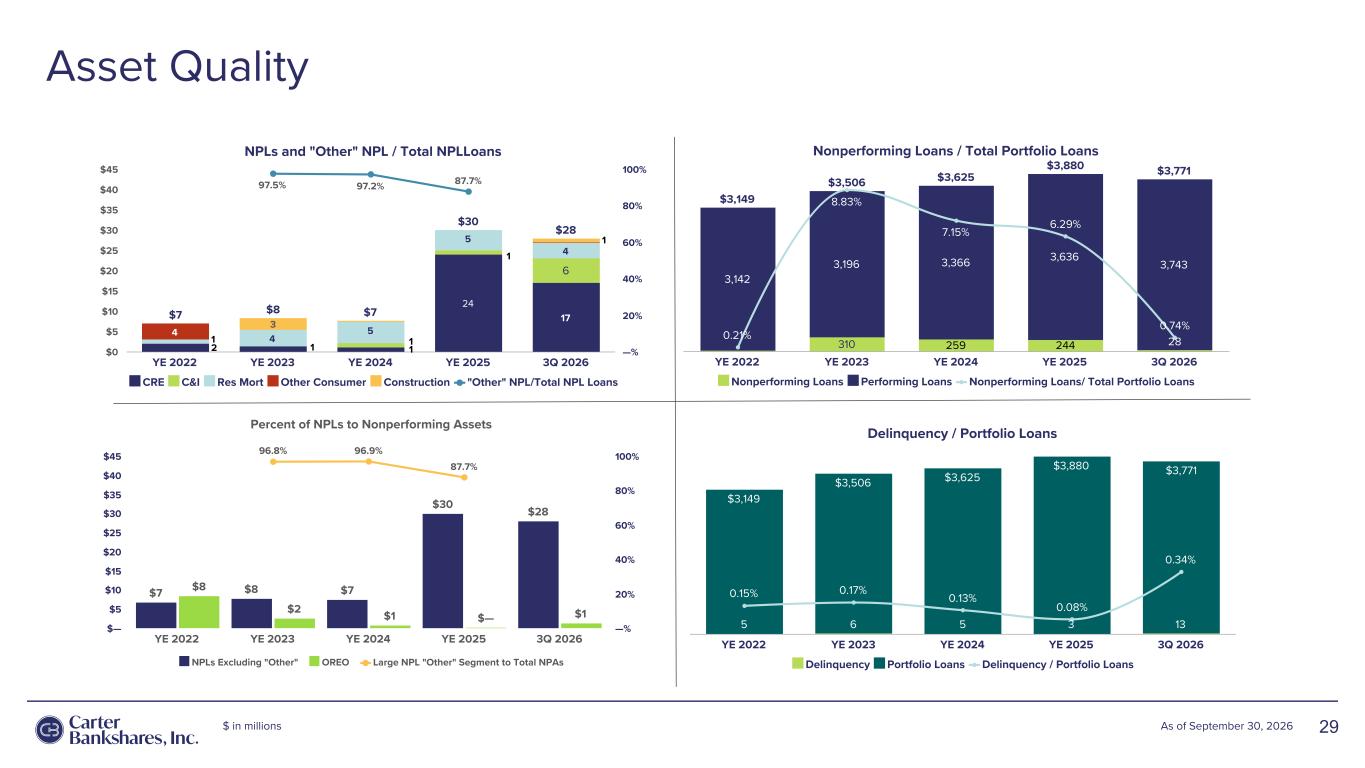
Asset Quality 29As of September 30, 2026 $229 $259 $ in millions 7 Percent of NPLs to Nonperforming Assets $7 $8 $7 $30 $28 $8 $2 $1 $— $1 96.8% 96.9% 87.7% NPLs Excluding "Other" OREO Large NPL "Other" Segment to Total NPAs YE 2022 YE 2023 YE 2024 YE 2025 3Q 2026 $— $5 $10 $15 $20 $25 $30 $35 $40 $45 —% 20% 40% 60% 80% 100% Nonperforming Loans / Total Portfolio Loans $3,149 $3,506 $3,625 $3,880 $3,771 310 259 244 28 3,142 3,196 3,366 3,636 3,743 0.21% 8.83% 7.15% 6.29% 0.74% Nonperforming Loans Performing Loans Nonperforming Loans/ Total Portfolio Loans YE 2022 YE 2023 YE 2024 YE 2025 3Q 2026 Delinquency / Portfolio Loans 5 6 5 3 13 $3,149 $3,506 $3,625 $3,880 $3,771 0.15% 0.17% 0.13% 0.08% 0.34% Delinquency Portfolio Loans Delinquency / Portfolio Loans YE 2022 YE 2023 YE 2024 YE 2025 3Q 2026 NPLs and "Other" NPL / Total NPLLoans $7 $8 $30 $28 24 17 6 4 5 5 4 4 3 97.5% 97.2% 87.7% CRE C&I Res Mort Other Consumer Construction "Other" NPL/Total NPL Loans YE 2022 YE 2023 YE 2024 YE 2025 3Q 2026 $0 $5 $10 $15 $20 $25 $30 $35 $40 $45 —% 20% 40% 60% 80% 100% 1 2 1 1 1 $7 1 1
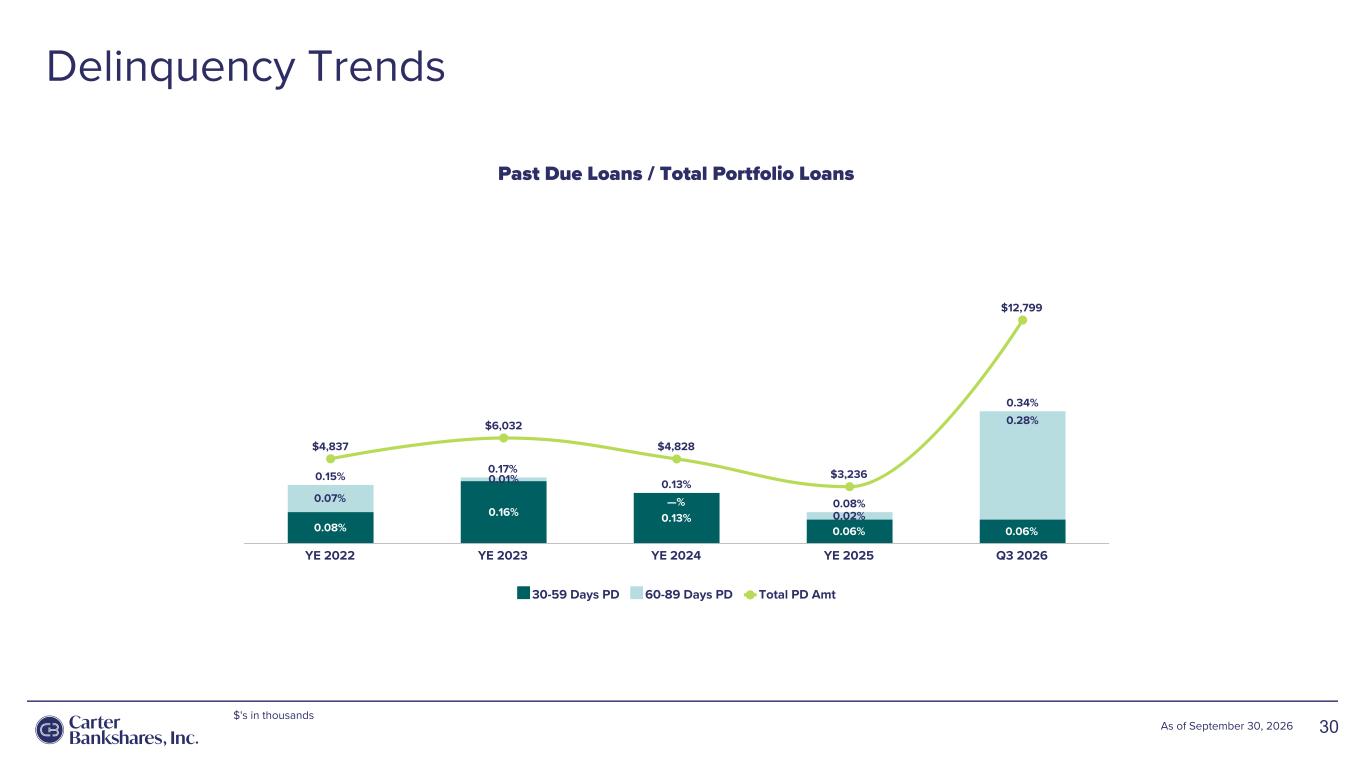
Delinquency Trends 30As of September 30, 2026 $'s in thousands Past Due Loans / Total Portfolio Loans 0.15% 0.17% 0.13% 0.08% 0.34% 0.08% 0.16% 0.13% 0.06% 0.06% 0.07% 0.01% —% 0.02% 0.28% $4,837 $6,032 $4,828 $3,236 $12,799 30-59 Days PD 60-89 Days PD Total PD Amt YE 2022 YE 2023 YE 2024 YE 2025 Q3 2026
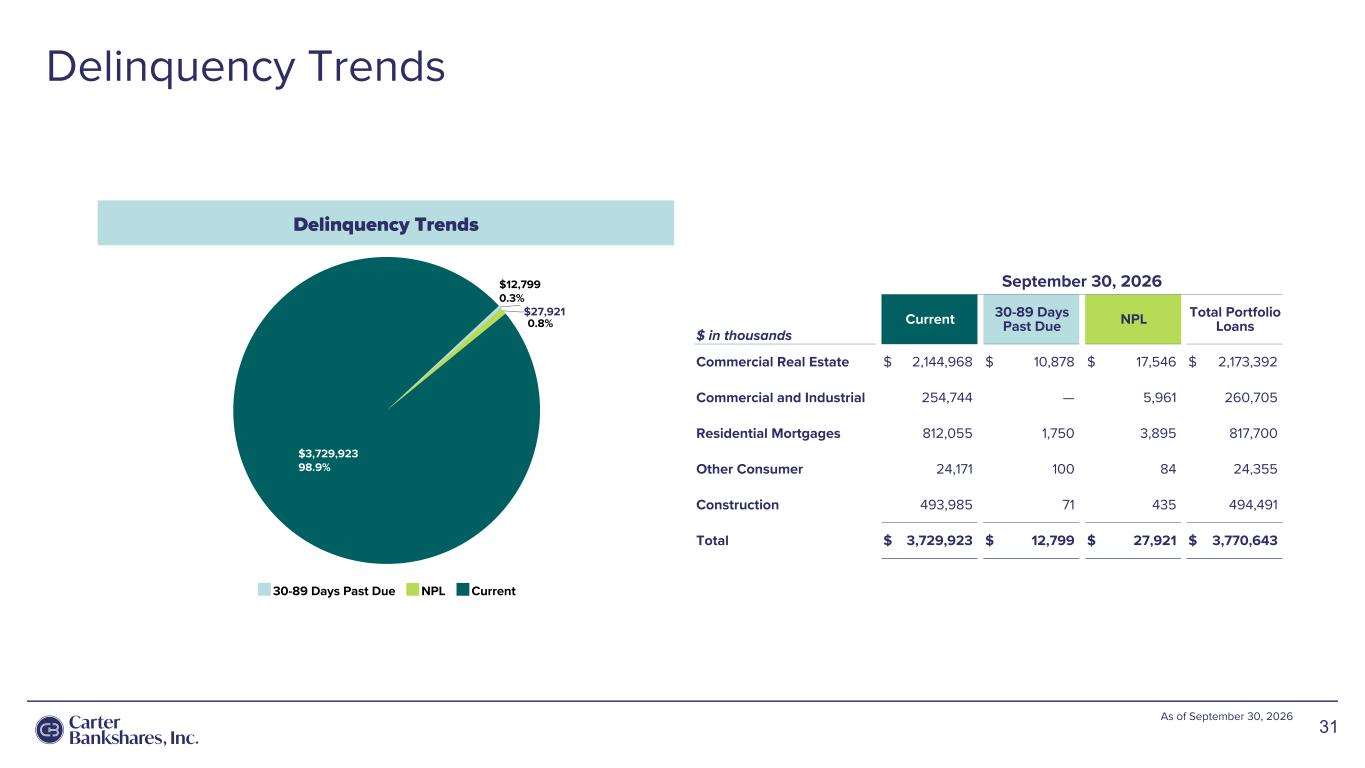
Delinquency Trends 31 As of September 30, 2026 Delinquency Trends $12,799 0.3% $27,921 $3,729,923 98.9% 30-89 Days Past Due NPL Current September 30, 2026 $ in thousands Current 30-89 Days Past Due NPL Total Portfolio Loans Commercial Real Estate $ 2,144,968 $ 10,878 $ 17,546 $ 2,173,392 Commercial and Industrial 254,744 — 5,961 260,705 Residential Mortgages 812,055 1,750 3,895 817,700 Other Consumer 24,171 100 84 24,355 Construction 493,985 71 435 494,491 Total $ 3,729,923 $ 12,799 $ 27,921 $ 3,770,643 0.8%
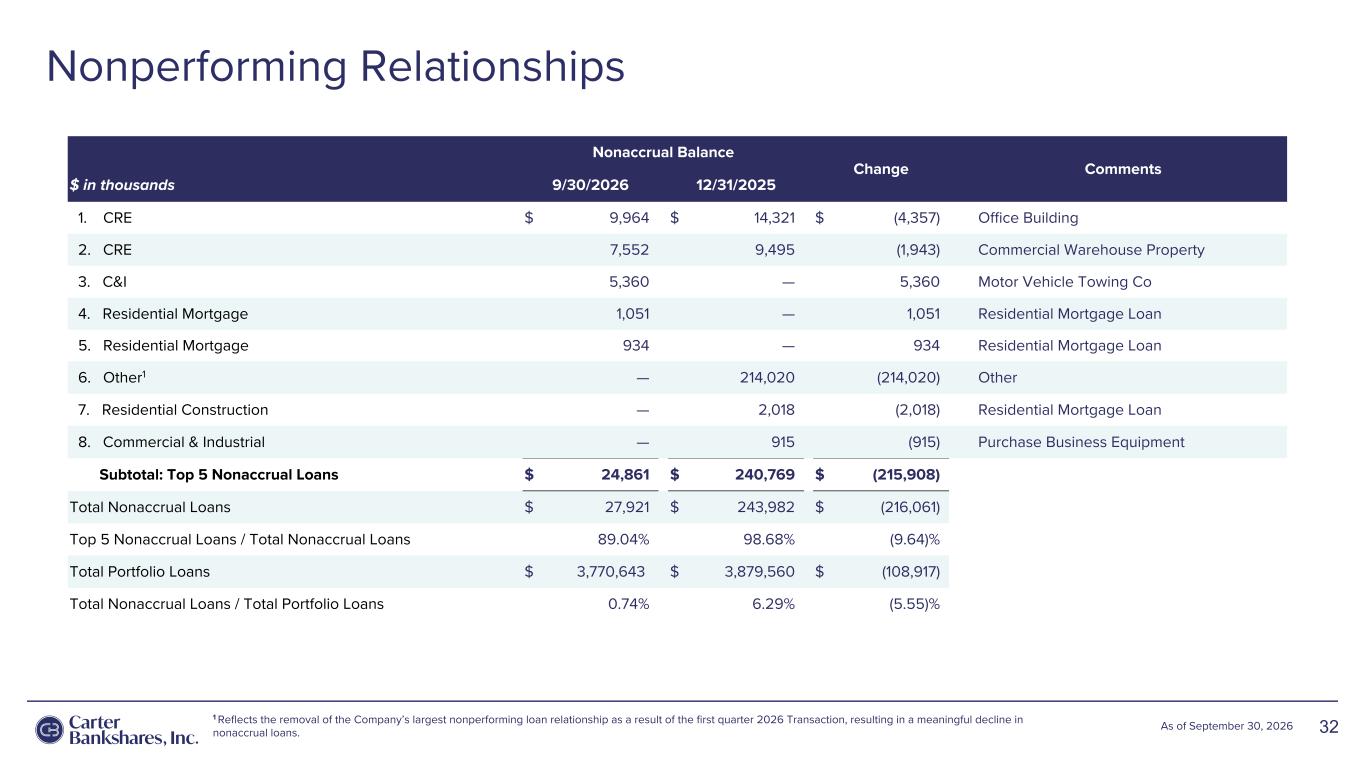
Nonperforming Relationships 32As of September 30, 2026 Nonaccrual Balance Change Comments $ in thousands 9/30/2026 12/31/2025 1. CRE $ 9,964 $ 14,321 $ (4,357) Office Building 2. CRE 7,552 9,495 (1,943) Commercial Warehouse Property 3. C&I 5,360 — 5,360 Motor Vehicle Towing Co 4. Residential Mortgage 1,051 — 1,051 Residential Mortgage Loan 5. Residential Mortgage 934 — 934 Residential Mortgage Loan 6. Other1 — 214,020 (214,020) Other 7. Residential Construction — 2,018 (2,018) Residential Mortgage Loan 8. Commercial & Industrial — 915 (915) Purchase Business Equipment Subtotal: Top 5 Nonaccrual Loans $ 24,861 $ 240,769 $ (215,908) Total Nonaccrual Loans $ 27,921 $ 243,982 $ (216,061) Top 5 Nonaccrual Loans / Total Nonaccrual Loans 89.04 % 98.68 % (9.64) % Total Portfolio Loans $ 3,770,643 $ 3,879,560 $ (108,917) Total Nonaccrual Loans / Total Portfolio Loans 0.74 % 6.29 % (5.55) % 1 Reflects the removal of the Company’s largest nonperforming loan relationship as a result of the first quarter 2026 Transaction, resulting in a meaningful decline in nonaccrual loans.
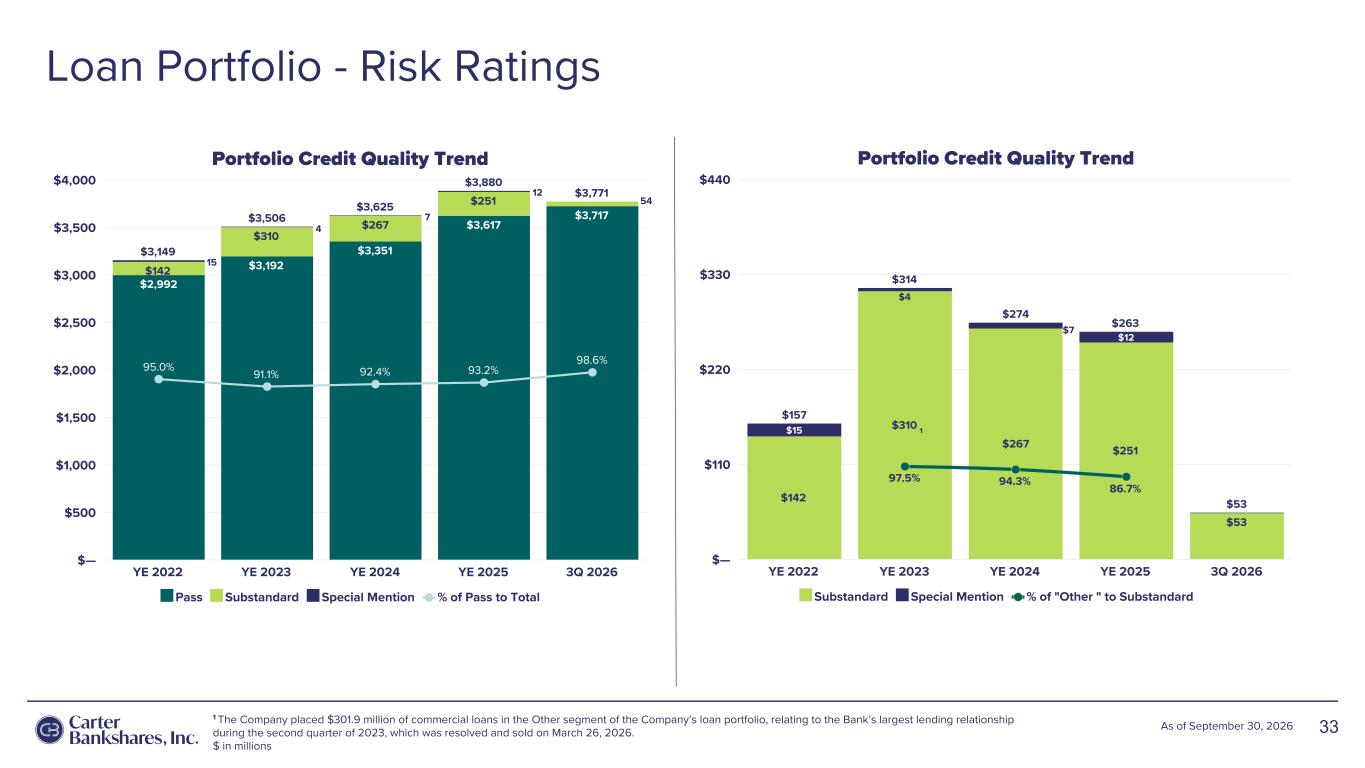
Loan Portfolio - Risk Ratings 33As of September 30, 2026 Portfolio Credit Quality Trend $3,149 $3,506 $3,625 $3,880 $3,771 $2,992 $3,192 $3,351 $3,617 $3,717 $142 $310 $267 $251 95.0% 91.1% 92.4% 93.2% 98.6% Pass Substandard Special Mention % of Pass to Total YE 2022 YE 2023 YE 2024 YE 2025 3Q 2026 $— $500 $1,000 $1,500 $2,000 $2,500 $3,000 $3,500 $4,000 15 4 7 Portfolio Credit Quality Trend $157 $314 $274 $263 $53$142 $310 $267 $251 $53 $15 $4 $12 97.5% 94.3% 86.7% Substandard Special Mention % of "Other " to Substandard YE 2022 YE 2023 YE 2024 YE 2025 3Q 2026 $— $110 $220 $330 $440 54 1 1 The Company placed $301.9 million of commercial loans in the Other segment of the Company’s loan portfolio, relating to the Bank’s largest lending relationship during the second quarter of 2023, which was resolved and sold on March 26, 2026. $ in millions 12 $7
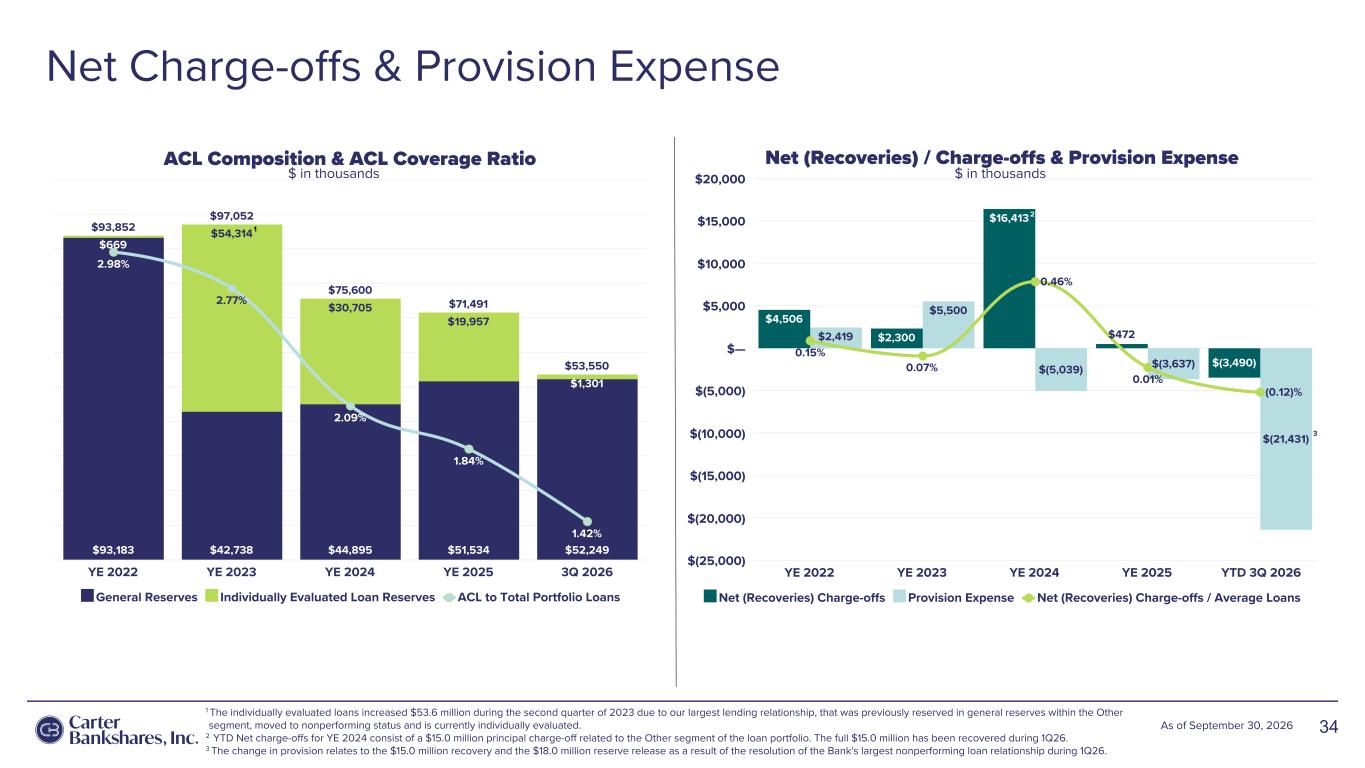
Net Charge-offs & Provision Expense 34As of September 30, 2026 ACL Composition & ACL Coverage Ratio $93,852 $97,052 $75,600 $71,491 $53,550 $93,183 $42,738 $44,895 $51,534 $52,249 $669 $54,314 $30,705 $19,957 $1,301 2.98% 2.77% 2.09% 1.84% 1.42% General Reserves Individually Evaluated Loan Reserves ACL to Total Portfolio Loans YE 2022 YE 2023 YE 2024 YE 2025 3Q 2026 Net (Recoveries) / Charge-offs & Provision Expense $4,506 $2,300 $16,413 $472 $(3,490) $2,419 $5,500 $(5,039) $(3,637) $(21,431) 0.15% 0.07% 0.46% 0.01% (0.12)% Net (Recoveries) Charge-offs Provision Expense Net (Recoveries) Charge-offs / Average Loans YE 2022 YE 2023 YE 2024 YE 2025 YTD 3Q 2026 $(25,000) $(20,000) $(15,000) $(10,000) $(5,000) $— $5,000 $10,000 $15,000 $20,000 1 1 The individually evaluated loans increased $53.6 million during the second quarter of 2023 due to our largest lending relationship, that was previously reserved in general reserves within the Other segment, moved to nonperforming status and is currently individually evaluated. 2 YTD Net charge-offs for YE 2024 consist of a $15.0 million principal charge-off related to the Other segment of the loan portfolio. The full $15.0 million has been recovered during 1Q26. 3 The change in provision relates to the $15.0 million recovery and the $18.0 million reserve release as a result of the resolution of the Bank's largest nonperforming loan relationship during 1Q26. $ in thousands $ in thousands 2 3

Deposit Mix SECTION 04
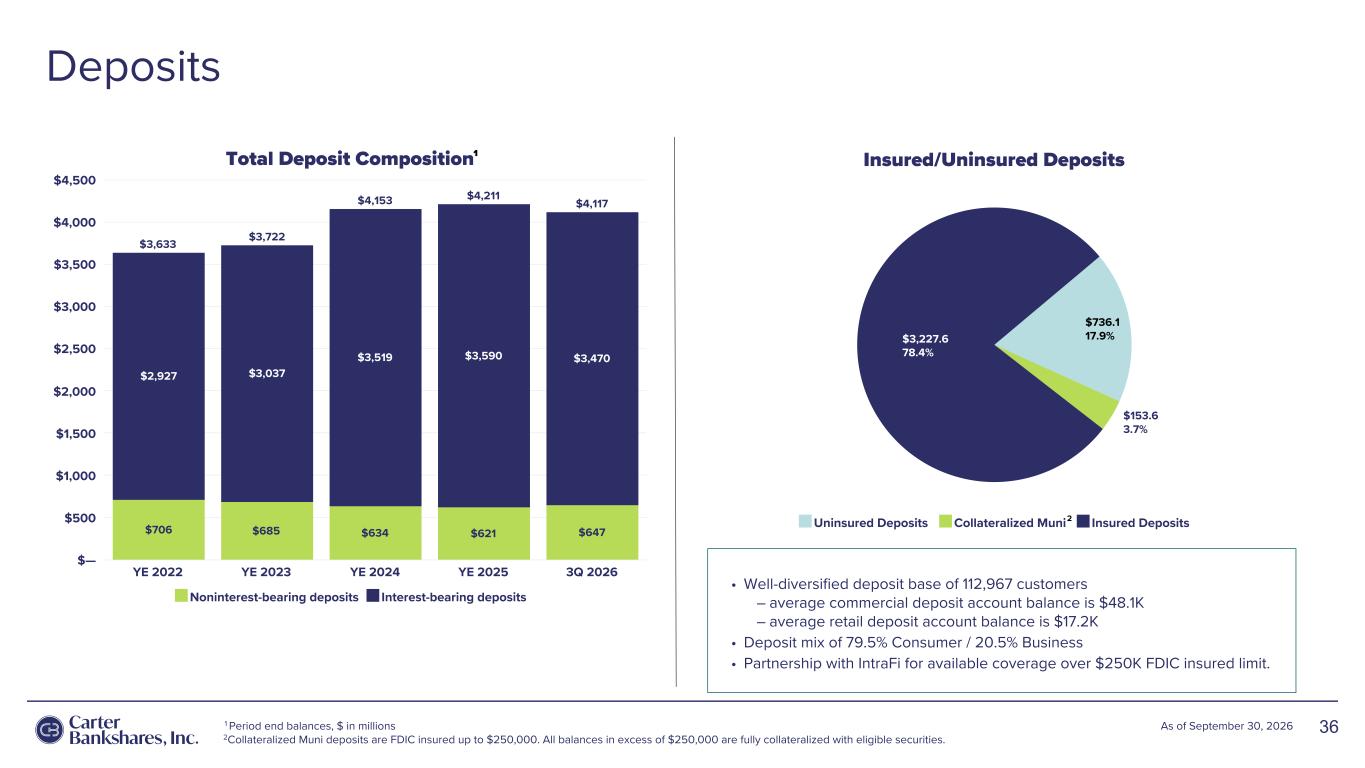
Deposits Insured/Uninsured Deposits $736.1 17.9% $153.6 3.7% $3,227.6 78.4% Uninsured Deposits Collateralized Muni Insured Deposits 36As of September 30, 2026 Total Deposit Composition $3,633 $3,722 $4,153 $4,211 $4,117 $706 $685 $634 $621 $647 $2,927 $3,037 $3,519 $3,590 $3,470 Noninterest-bearing deposits Interest-bearing deposits YE 2022 YE 2023 YE 2024 YE 2025 3Q 2026 $— $500 $1,000 $1,500 $2,000 $2,500 $3,000 $3,500 $4,000 $4,500 • Well-diversified deposit base of 112,967 customers – average commercial deposit account balance is $48.1K – average retail deposit account balance is $17.2K • Deposit mix of 79.5% Consumer / 20.5% Business • Partnership with IntraFi for available coverage over $250K FDIC insured limit. 1 2 1 Period end balances, $ in millions 2Collateralized Muni deposits are FDIC insured up to $250,000. All balances in excess of $250,000 are fully collateralized with eligible securities.
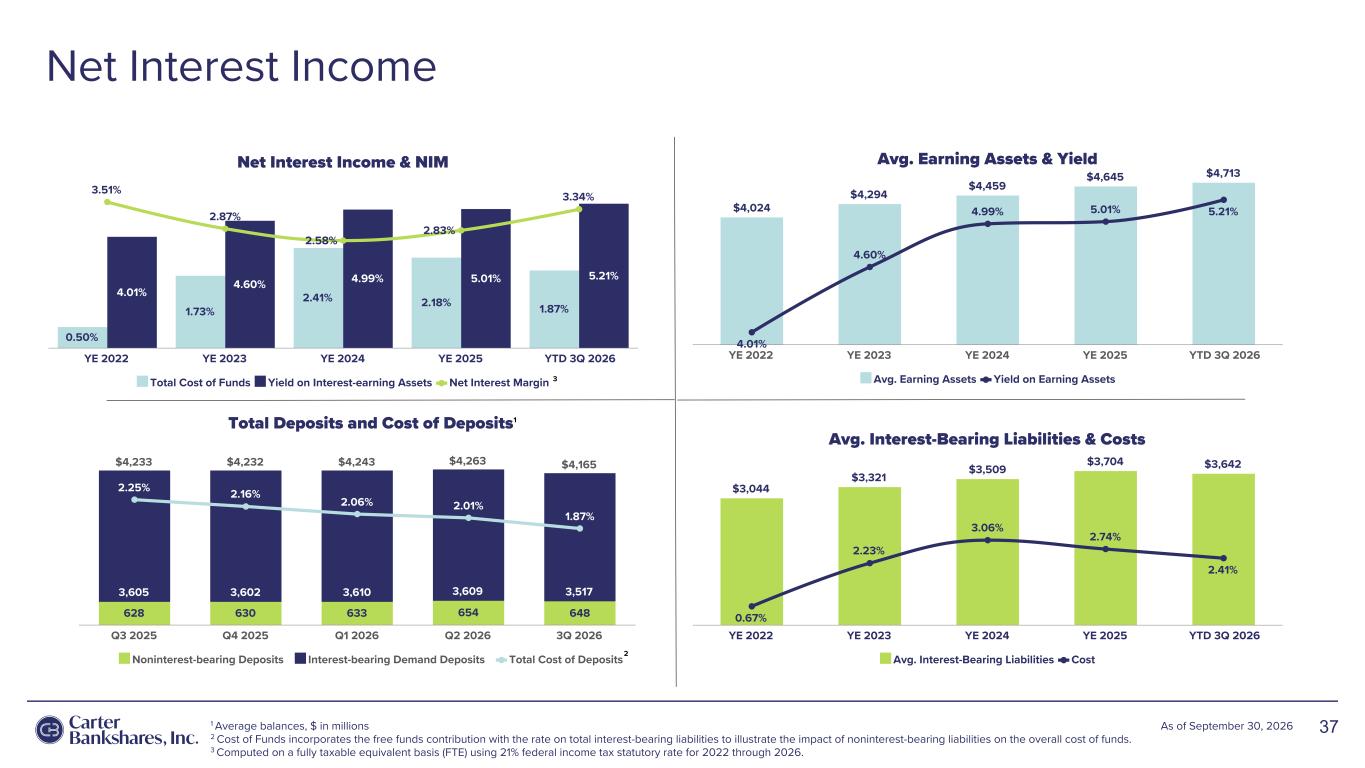
Total Deposits and Cost of Deposits $4,233 $4,232 $4,243 $4,263 $4,165 628 630 633 654 648 3,605 3,602 3,610 3,609 3,517 2.25% 2.16% 2.06% 2.01% 1.87% Noninterest-bearing Deposits Interest-bearing Demand Deposits Total Cost of Deposits Q3 2025 Q4 2025 Q1 2026 Q2 2026 3Q 2026 Net Interest Income & NIM 0.50% 1.73% 2.41% 2.18% 1.87% 4.01% 4.60% 4.99% 5.01% 5.21% 3.51% 2.87% 2.58% 2.83% 3.34% Total Cost of Funds Yield on Interest-earning Assets Net Interest Margin YE 2022 YE 2023 YE 2024 YE 2025 YTD 3Q 2026 Net Interest Income 37As of September 30, 2026 $252 Avg. Earning Assets & Yield $4,024 $4,294 $4,459 $4,645 $4,713 4.01% 4.60% 4.99% 5.01% 5.21% Avg. Earning Assets Yield on Earning Assets YE 2022 YE 2023 YE 2024 YE 2025 YTD 3Q 2026 Avg. Interest-Bearing Liabilities & Costs $3,044 $3,321 $3,509 $3,704 $3,642 0.67% 2.23% 3.06% 2.74% 2.41% Avg. Interest-Bearing Liabilities Cost YE 2022 YE 2023 YE 2024 YE 2025 YTD 3Q 2026 1 Average balances, $ in millions 2 Cost of Funds incorporates the free funds contribution with the rate on total interest-bearing liabilities to illustrate the impact of noninterest-bearing liabilities on the overall cost of funds. 3 Computed on a fully taxable equivalent basis (FTE) using 21% federal income tax statutory rate for 2022 through 2026. 1 2 3

Commercial Loans SECTION 05
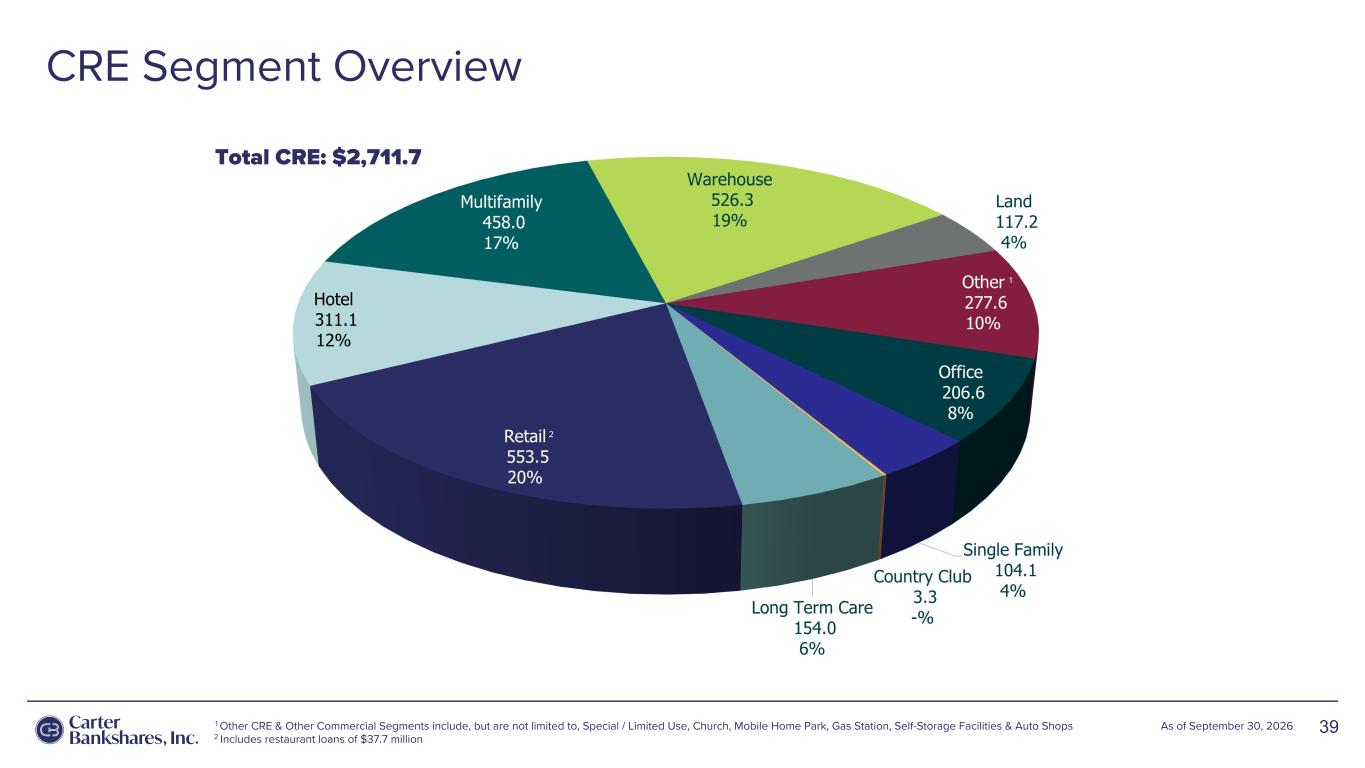
CRE Segment Overview 39As of September 30, 2026 Total CRE: $2,711.7 1 Other CRE & Other Commercial Segments include, but are not limited to, Special / Limited Use, Church, Mobile Home Park, Gas Station, Self-Storage Facilities & Auto Shops 2 Includes restaurant loans of $37.7 million 2 2 1 1
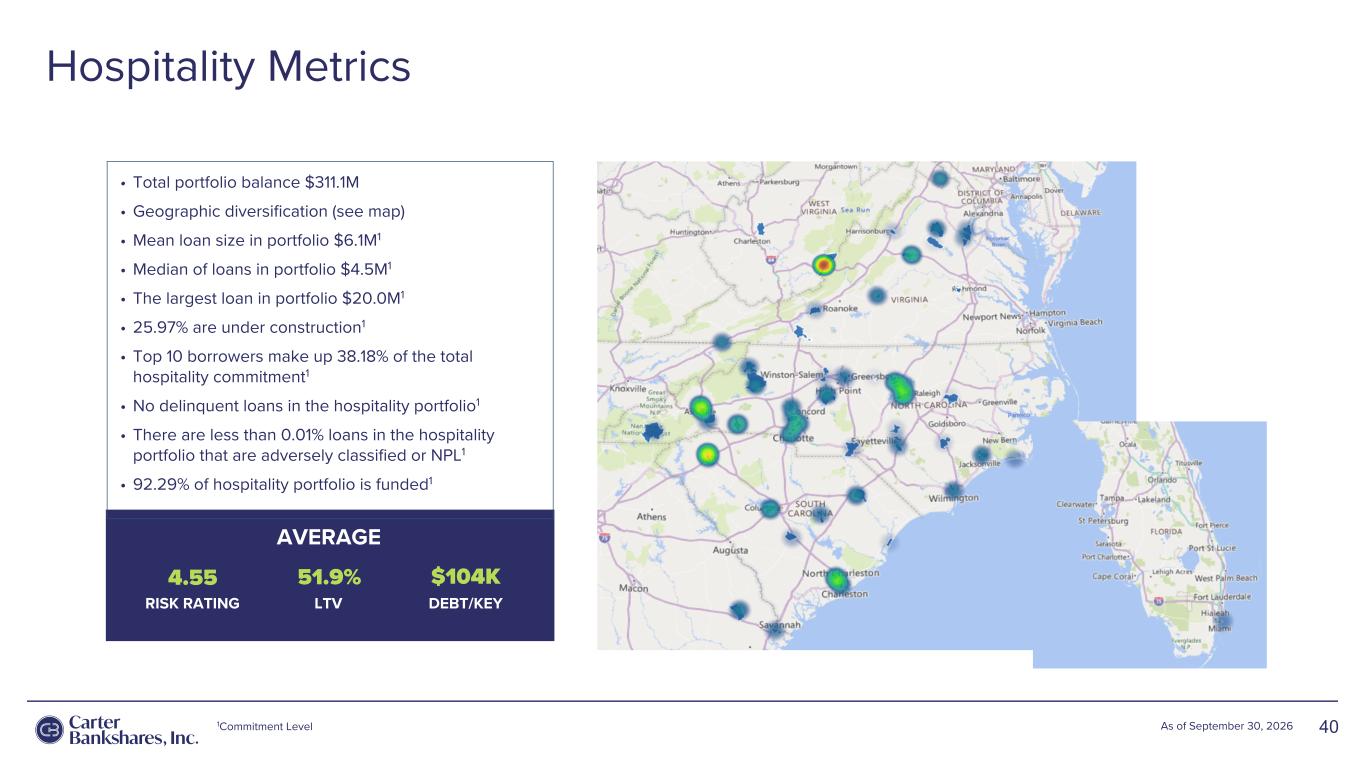
Hospitality Metrics 40As of September 30, 2026 $252 • Total portfolio balance $311.1M • Geographic diversification (see map) • Mean loan size in portfolio $6.1M1 • Median of loans in portfolio $4.5M1 • The largest loan in portfolio $20.0M1 • 25.97% are under construction1 • Top 10 borrowers make up 38.18% of the total hospitality commitment1 • No delinquent loans in the hospitality portfolio1 • There are less than 0.01% loans in the hospitality portfolio that are adversely classified or NPL1 • 92.29% of hospitality portfolio is funded1 4.55 RISK RATING LTV DEBT/KEY 51.9% $104K AVERAGE 1Commitment Level
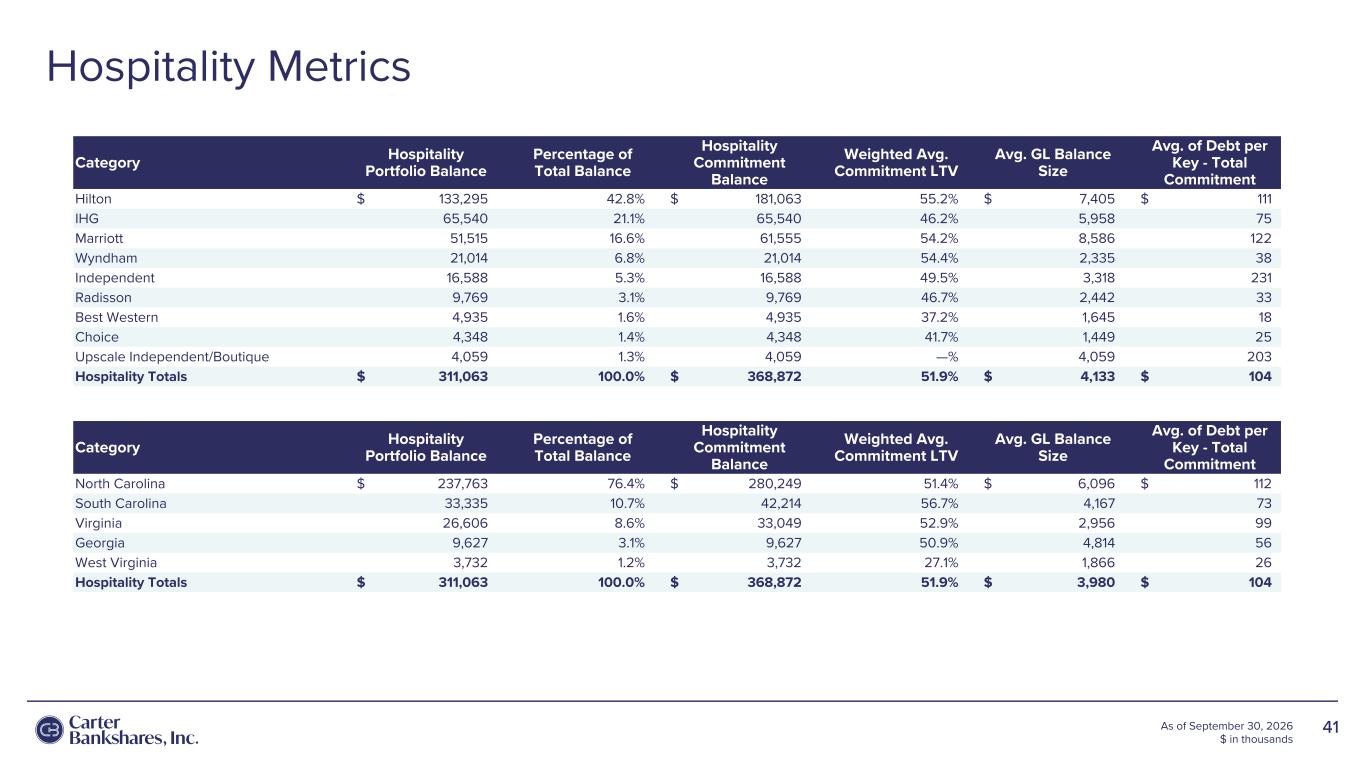
Hospitality Metrics 41As of September 30, 2026 $ in thousands Category Hospitality Portfolio Balance Percentage of Total Balance Hospitality Commitment Balance Weighted Avg. Commitment LTV Avg. GL Balance Size Avg. of Debt per Key - Total Commitment Hilton $ 133,295 42.8 % $ 181,063 55.2 % $ 7,405 $ 111 IHG 65,540 21.1 % 65,540 46.2 % 5,958 75 Marriott 51,515 16.6 % 61,555 54.2 % 8,586 122 Wyndham 21,014 6.8 % 21,014 54.4 % 2,335 38 Independent 16,588 5.3 % 16,588 49.5 % 3,318 231 Radisson 9,769 3.1 % 9,769 46.7 % 2,442 33 Best Western 4,935 1.6 % 4,935 37.2 % 1,645 18 Choice 4,348 1.4 % 4,348 41.7 % 1,449 25 Upscale Independent/Boutique 4,059 1.3 % 4,059 — % 4,059 203 Hospitality Totals $ 311,063 100.0 % $ 368,872 51.9 % $ 4,133 $ 104 Category Hospitality Portfolio Balance Percentage of Total Balance Hospitality Commitment Balance Weighted Avg. Commitment LTV Avg. GL Balance Size Avg. of Debt per Key - Total Commitment North Carolina $ 237,763 76.4 % $ 280,249 51.4 % $ 6,096 $ 112 South Carolina 33,335 10.7 % 42,214 56.7 % 4,167 73 Virginia 26,606 8.6 % 33,049 52.9 % 2,956 99 Georgia 9,627 3.1 % 9,627 50.9 % 4,814 56 West Virginia 3,732 1.2 % 3,732 27.1 % 1,866 26 Hospitality Totals $ 311,063 100.0 % $ 368,872 51.9 % $ 3,980 $ 104
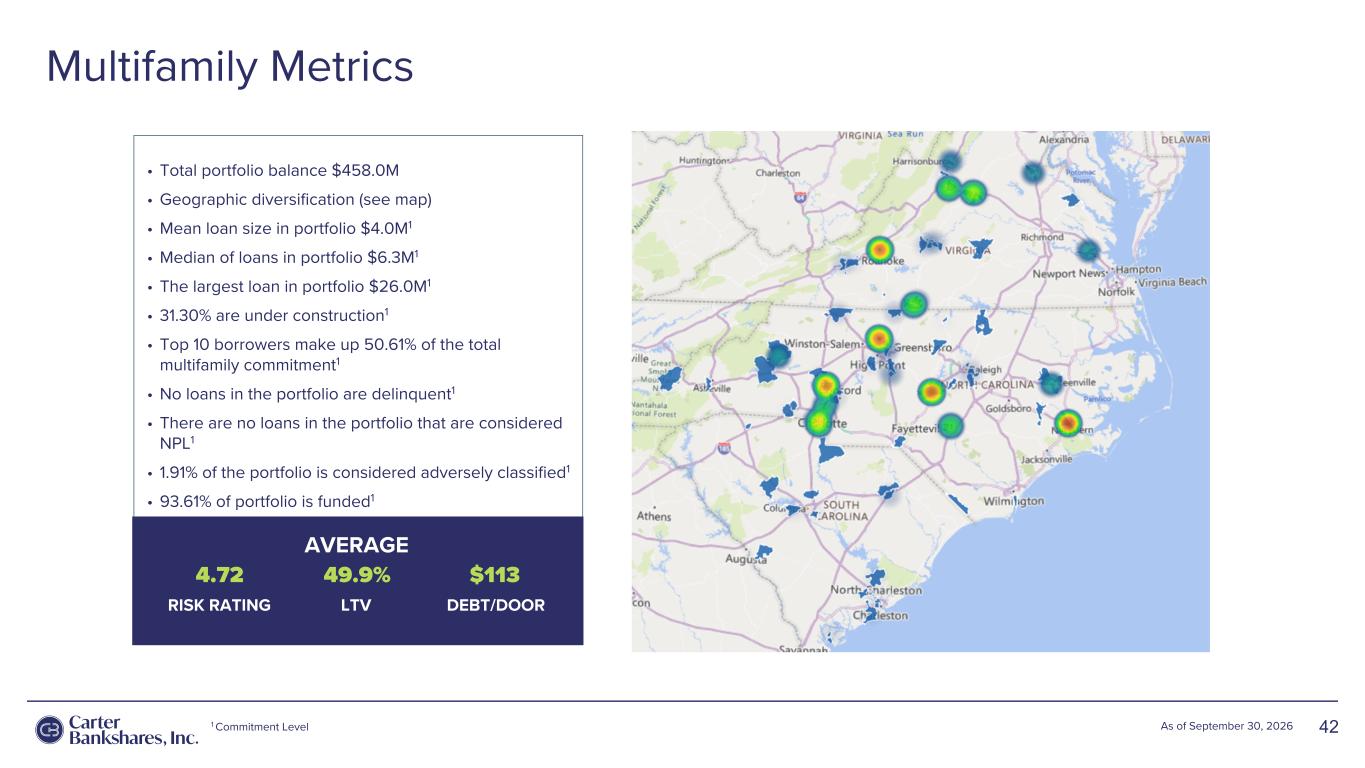
Multifamily Metrics 42As of September 30, 2026 $252 • Total portfolio balance $458.0M • Geographic diversification (see map) • Mean loan size in portfolio $4.0M1 • Median of loans in portfolio $6.3M1 • The largest loan in portfolio $26.0M1 • 31.30% are under construction1 • Top 10 borrowers make up 50.61% of the total multifamily commitment1 • No loans in the portfolio are delinquent1 • There are no loans in the portfolio that are considered NPL1 • 1.91% of the portfolio is considered adversely classified1 • 93.61% of portfolio is funded1 4.72 RISK RATING LTV DEBT/DOOR 49.9% $113 AVERAGE 1 Commitment Level
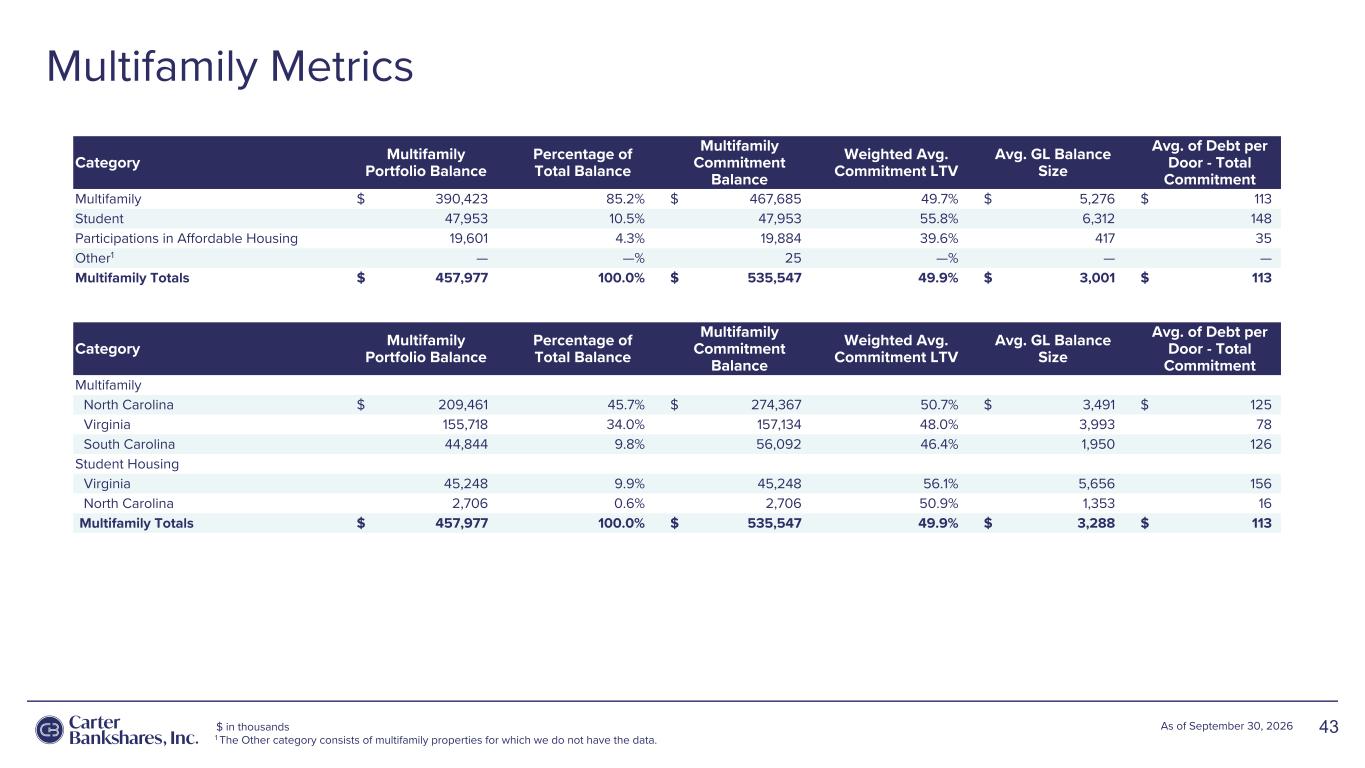
Multifamily Metrics 43As of September 30, 2026 $252 Category Multifamily Portfolio Balance Percentage of Total Balance Multifamily Commitment Balance Weighted Avg. Commitment LTV Avg. GL Balance Size Avg. of Debt per Door - Total Commitment Multifamily $ 390,423 85.2 % $ 467,685 49.7 % $ 5,276 $ 113 Student 47,953 10.5 % 47,953 55.8 % 6,312 148 Participations in Affordable Housing 19,601 4.3 % 19,884 39.6 % 417 35 Other1 — — % 25 — % — — Multifamily Totals $ 457,977 100.0 % $ 535,547 49.9 % $ 3,001 $ 113 Category Multifamily Portfolio Balance Percentage of Total Balance Multifamily Commitment Balance Weighted Avg. Commitment LTV Avg. GL Balance Size Avg. of Debt per Door - Total Commitment Multifamily North Carolina $ 209,461 45.7 % $ 274,367 50.7 % $ 3,491 $ 125 Virginia 155,718 34.0 % 157,134 48.0 % 3,993 78 South Carolina 44,844 9.8 % 56,092 46.4 % 1,950 126 Student Housing Virginia 45,248 9.9 % 45,248 56.1 % 5,656 156 North Carolina 2,706 0.6 % 2,706 50.9 % 1,353 16 Multifamily Totals $ 457,977 100.0 % $ 535,547 49.9 % $ 3,288 $ 113 $ in thousands 1 The Other category consists of multifamily properties for which we do not have the data.
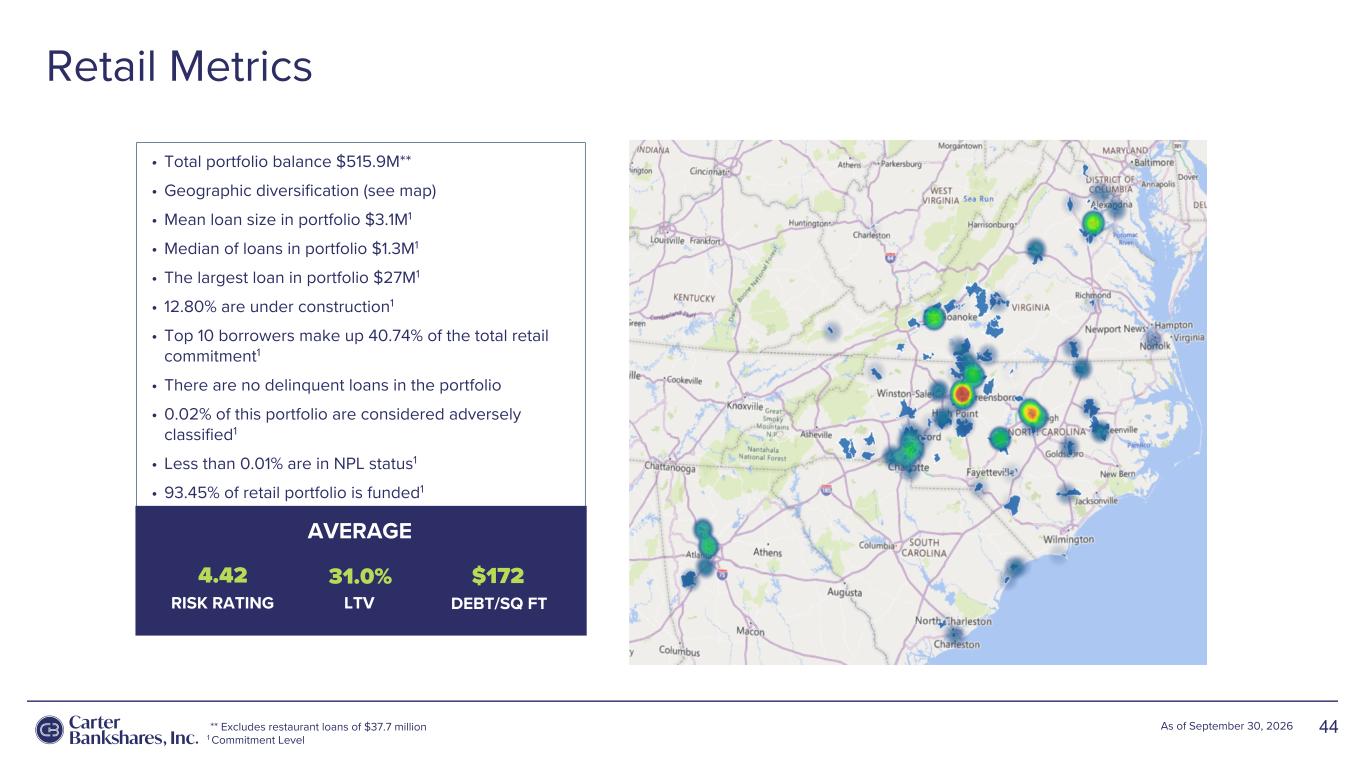
Retail Metrics 44As of September 30, 2026 $252 4.42 RISK RATING LTV DEBT/SQ FT 31.0% $172 AVERAGE • Total portfolio balance $515.9M** • Geographic diversification (see map) • Mean loan size in portfolio $3.1M1 • Median of loans in portfolio $1.3M1 • The largest loan in portfolio $27M1 • 12.80% are under construction1 • Top 10 borrowers make up 40.74% of the total retail commitment1 • There are no delinquent loans in the portfolio • 0.02% of this portfolio are considered adversely classified1 • Less than 0.01% are in NPL status1 • 93.45% of retail portfolio is funded1 ** Excludes restaurant loans of $37.7 million 1 Commitment Level
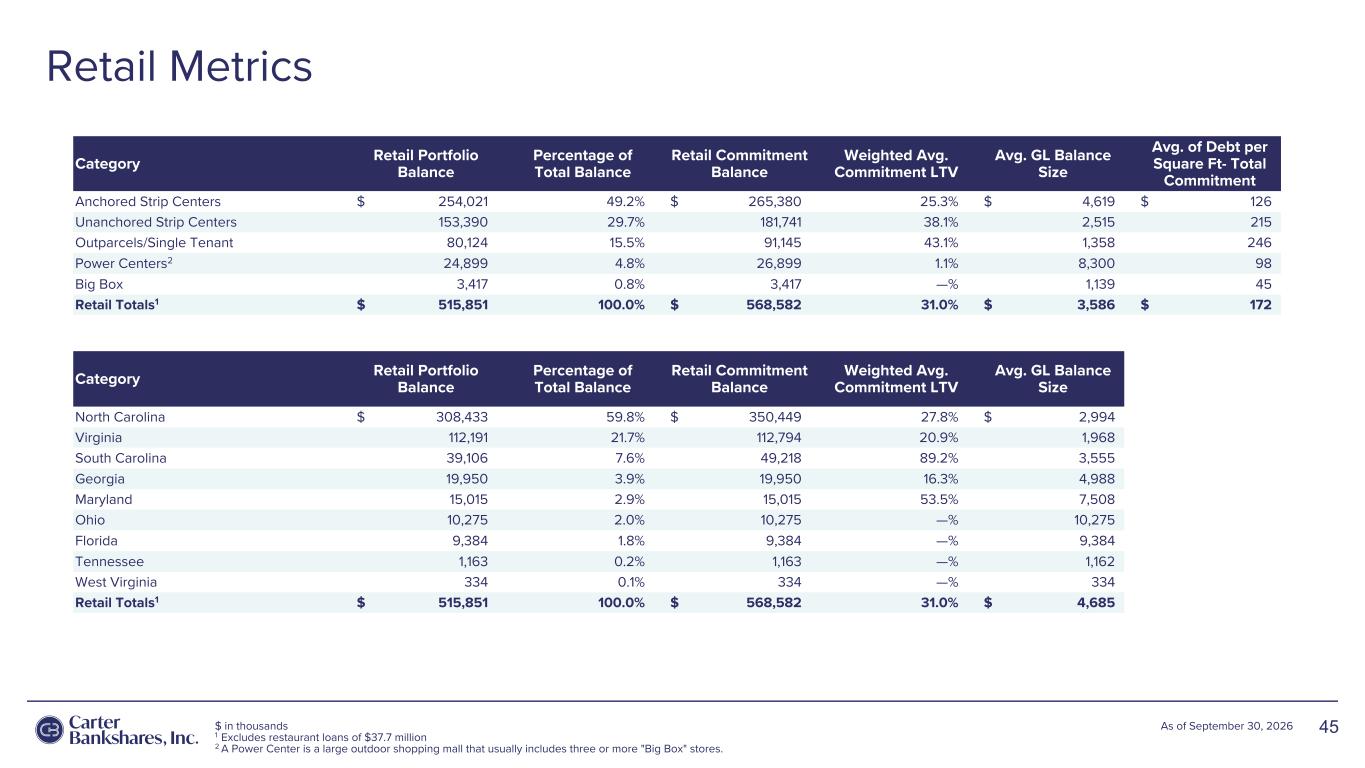
Retail Metrics 45As of September 30, 2026 $252 Category Retail Portfolio Balance Percentage of Total Balance Retail Commitment Balance Weighted Avg. Commitment LTV Avg. GL Balance Size Avg. of Debt per Square Ft- Total Commitment Anchored Strip Centers $ 254,021 49.2 % $ 265,380 25.3 % $ 4,619 $ 126 Unanchored Strip Centers 153,390 29.7 % 181,741 38.1 % 2,515 215 Outparcels/Single Tenant 80,124 15.5 % 91,145 43.1 % 1,358 246 Power Centers2 24,899 4.8 % 26,899 1.1 % 8,300 98 Big Box 3,417 0.8 % 3,417 — % 1,139 45 Retail Totals1 $ 515,851 100.0 % $ 568,582 31.0 % $ 3,586 $ 172 Category Retail Portfolio Balance Percentage of Total Balance Retail Commitment Balance Weighted Avg. Commitment LTV Avg. GL Balance Size North Carolina $ 308,433 59.8 % $ 350,449 27.8 % $ 2,994 Virginia 112,191 21.7 % 112,794 20.9 % 1,968 South Carolina 39,106 7.6 % 49,218 89.2 % 3,555 Georgia 19,950 3.9 % 19,950 16.3 % 4,988 Maryland 15,015 2.9 % 15,015 53.5 % 7,508 Ohio 10,275 2.0 % 10,275 — % 10,275 Florida 9,384 1.8 % 9,384 — % 9,384 Tennessee 1,163 0.2 % 1,163 — % 1,162 West Virginia 334 0.1 % 334 — % 334 Retail Totals1 $ 515,851 100.0 % $ 568,582 31.0 % $ 4,685 $ in thousands 1 Excludes restaurant loans of $37.7 million 2 A Power Center is a large outdoor shopping mall that usually includes three or more "Big Box" stores.
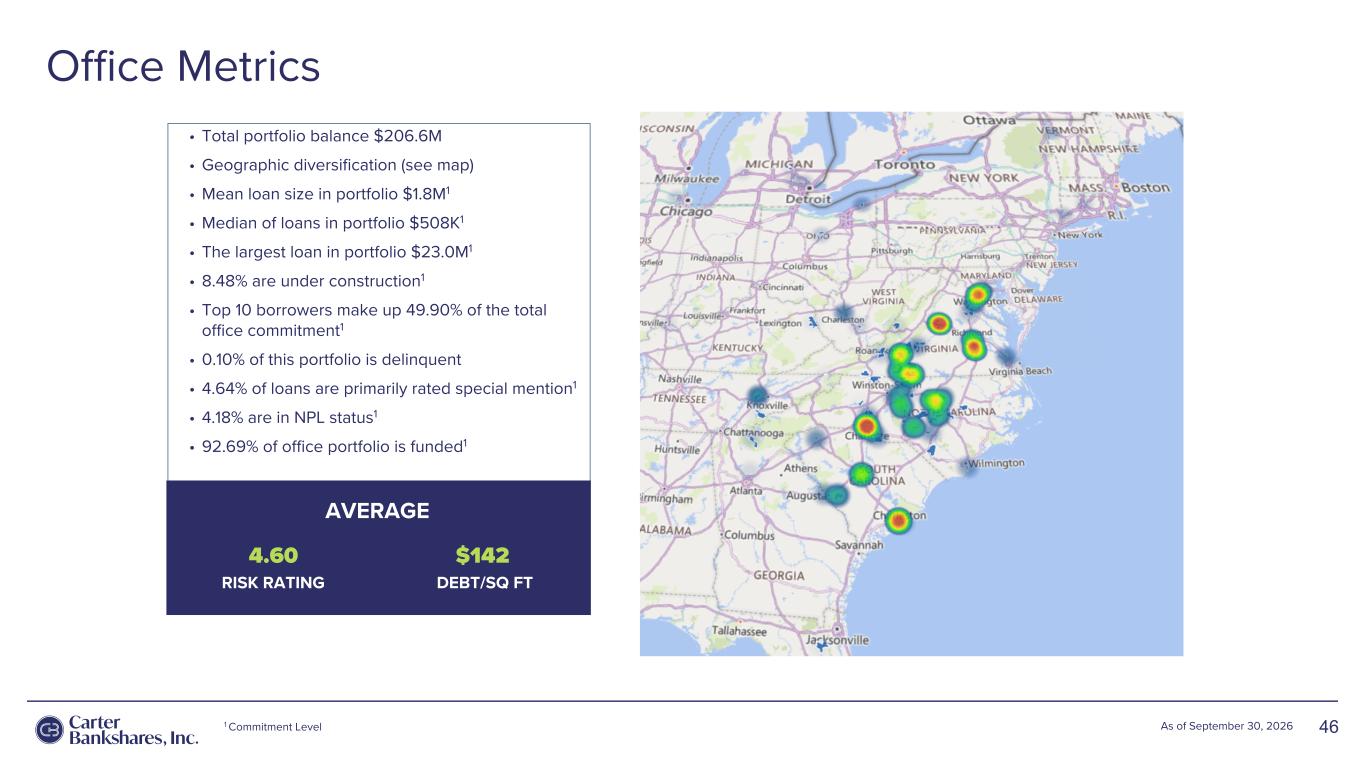
Office Metrics 46As of September 30, 2026 $252 • Total portfolio balance $206.6M • Geographic diversification (see map) • Mean loan size in portfolio $1.8M1 • Median of loans in portfolio $508K1 • The largest loan in portfolio $23.0M1 • 8.48% are under construction1 • Top 10 borrowers make up 49.90% of the total office commitment1 • 0.10% of this portfolio is delinquent • 4.64% of loans are primarily rated special mention1 • 4.18% are in NPL status1 • 92.69% of office portfolio is funded1 4.60 RISK RATING DEBT/SQ FT $142 AVERAGE 1 Commitment Level
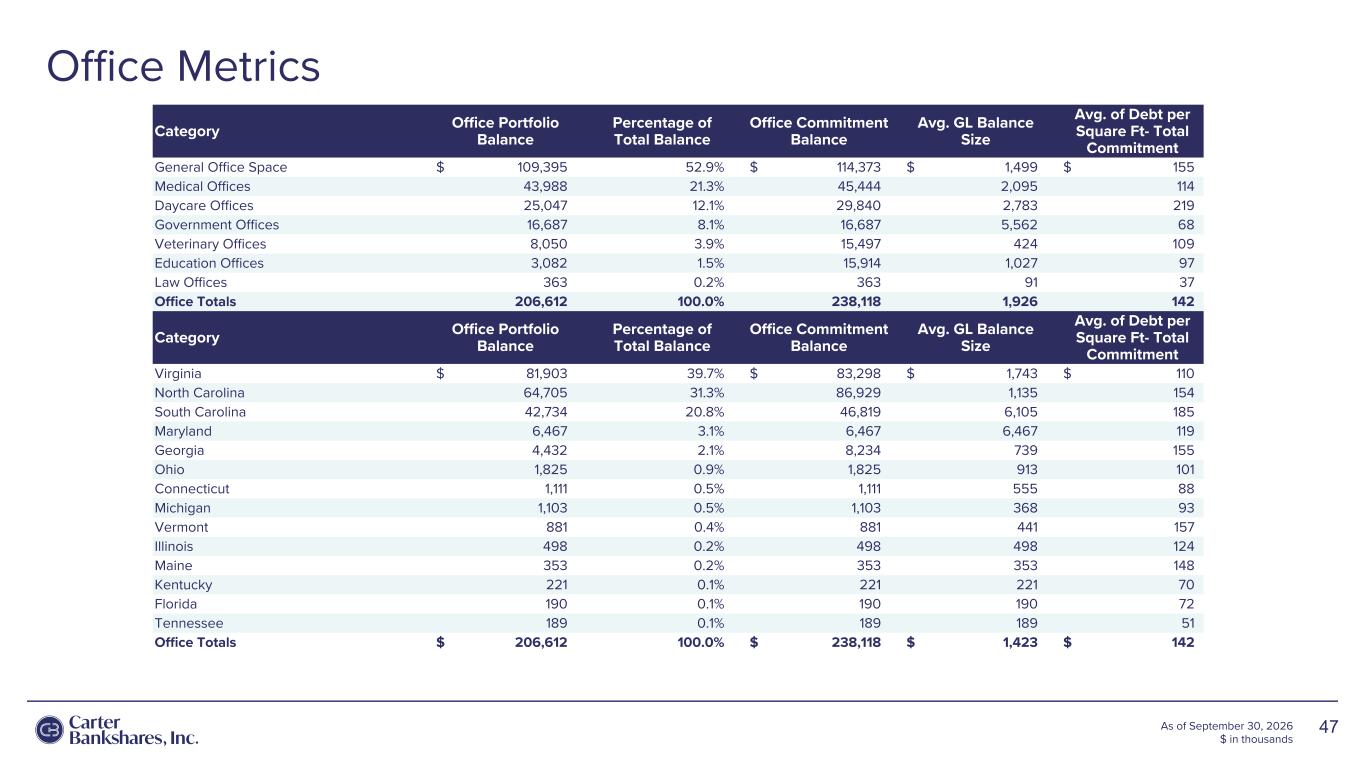
Office Metrics 47As of September 30, 2026 $ in thousands $252 Category Office Portfolio Balance Percentage of Total Balance Office Commitment Balance Avg. GL Balance Size Avg. of Debt per Square Ft- Total Commitment General Office Space $ 109,395 52.9 % $ 114,373 $ 1,499 $ 155 Medical Offices 43,988 21.3 % 45,444 2,095 114 Daycare Offices 25,047 12.1 % 29,840 2,783 219 Government Offices 16,687 8.1 % 16,687 5,562 68 Veterinary Offices 8,050 3.9 % 15,497 424 109 Education Offices 3,082 1.5 % 15,914 1,027 97 Law Offices 363 0.2 % 363 91 37 Office Totals 206,612 100.0 % 238,118 1,926 142 Category Office Portfolio Balance Percentage of Total Balance Office Commitment Balance Avg. GL Balance Size Avg. of Debt per Square Ft- Total Commitment Virginia $ 81,903 39.7 % $ 83,298 $ 1,743 $ 110 North Carolina 64,705 31.3 % 86,929 1,135 154 South Carolina 42,734 20.8 % 46,819 6,105 185 Maryland 6,467 3.1 % 6,467 6,467 119 Georgia 4,432 2.1 % 8,234 739 155 Ohio 1,825 0.9 % 1,825 913 101 Connecticut 1,111 0.5 % 1,111 555 88 Michigan 1,103 0.5 % 1,103 368 93 Vermont 881 0.4 % 881 441 157 Illinois 498 0.2 % 498 498 124 Maine 353 0.2 % 353 353 148 Kentucky 221 0.1 % 221 221 70 Florida 190 0.1 % 190 190 72 Tennessee 189 0.1 % 189 189 51 Office Totals $ 206,612 100.0 % $ 238,118 $ 1,423 $ 142

Non-GAAP Reconciliation SECTION 06
Non-GAAP Statement 49As of September 30, 2026 Statements in this exhibit include non-GAAP financial measures and should be read along with the accompanying tables in our definitions and reconciliations of GAAP to non-GAAP financial measures. Management uses, and this exhibit references, the adjusted return on average assets, adjusted return on average shareholders' equity, adjusted efficiency ratio, the adjusted book value and net interest income and net interest margin, each on a fully taxable equivalent, or FTE, basis, adjusted net income and adjusted earnings per common share (diluted) which are non-GAAP financial measures. Management believes the adjusted return on average assets, adjusted return on average shareholders' equity, adjusted efficiency ratio, the adjusted book value and net interest income and net interest margin, each on a fully taxable equivalent, or FTE, basis, adjusted net income and adjusted earnings per common share (diluted) provide information useful to investors in understanding our underlying business, operational performance and performance trends as they facilitate comparisons with the performance of other companies in the financial services industry. Although management believes that these non-GAAP financial measures enhance investors’ understanding of our business and performance, these non-GAAP financial measures should not be considered alternatives to GAAP or considered to be more important than financial results determined in accordance with GAAP, nor are they necessarily comparable with non-GAAP measures which may be presented by other companies.
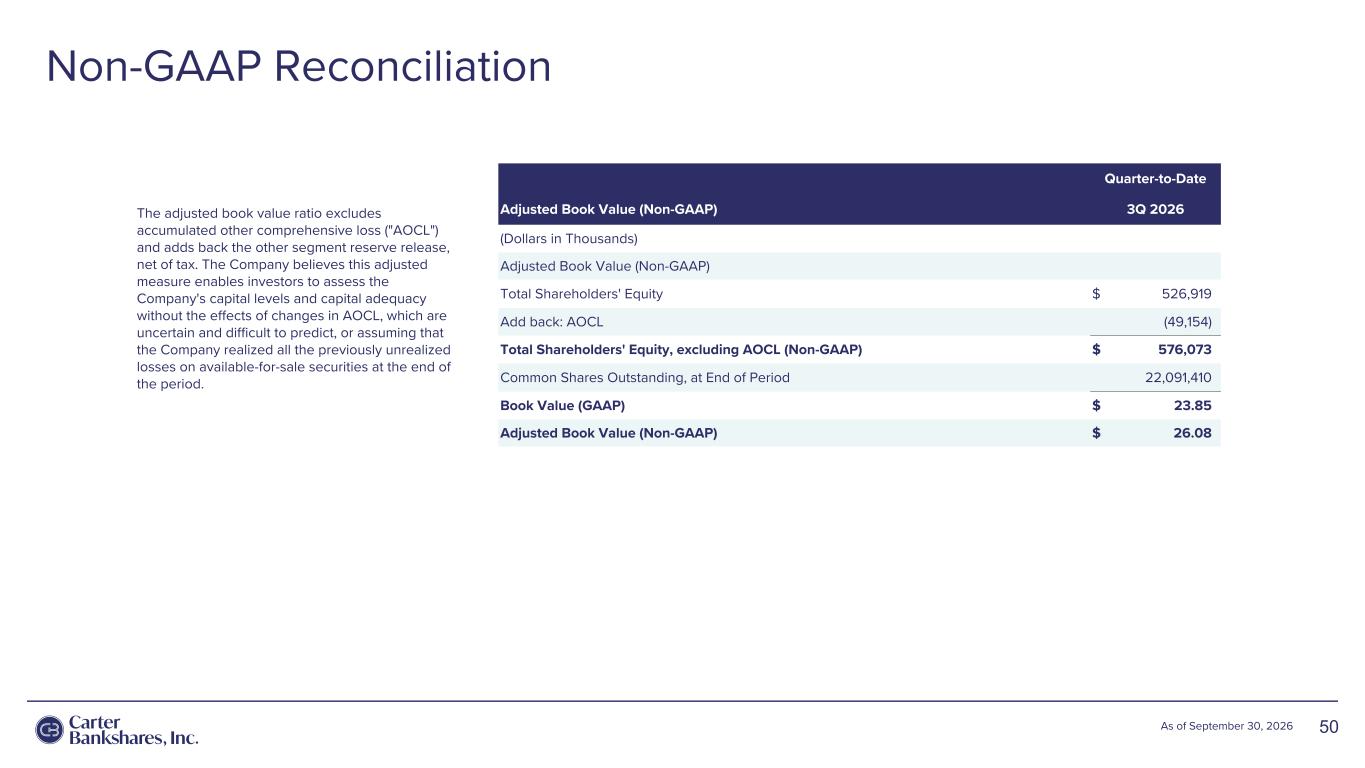
Non-GAAP Reconciliation 50As of September 30, 2026 $252 The adjusted book value ratio excludes accumulated other comprehensive loss ("AOCL") and adds back the other segment reserve release, net of tax. The Company believes this adjusted measure enables investors to assess the Company's capital levels and capital adequacy without the effects of changes in AOCL, which are uncertain and difficult to predict, or assuming that the Company realized all the previously unrealized losses on available-for-sale securities at the end of the period. Quarter-to-Date Adjusted Book Value (Non-GAAP) 3Q 2026 (Dollars in Thousands) Adjusted Book Value (Non-GAAP) Total Shareholders' Equity $ 526,919 Add back: AOCL (49,154) Total Shareholders' Equity, excluding AOCL (Non-GAAP) $ 576,073 Common Shares Outstanding, at End of Period 22,091,410 Book Value (GAAP) $ 23.85 Adjusted Book Value (Non-GAAP) $ 26.08
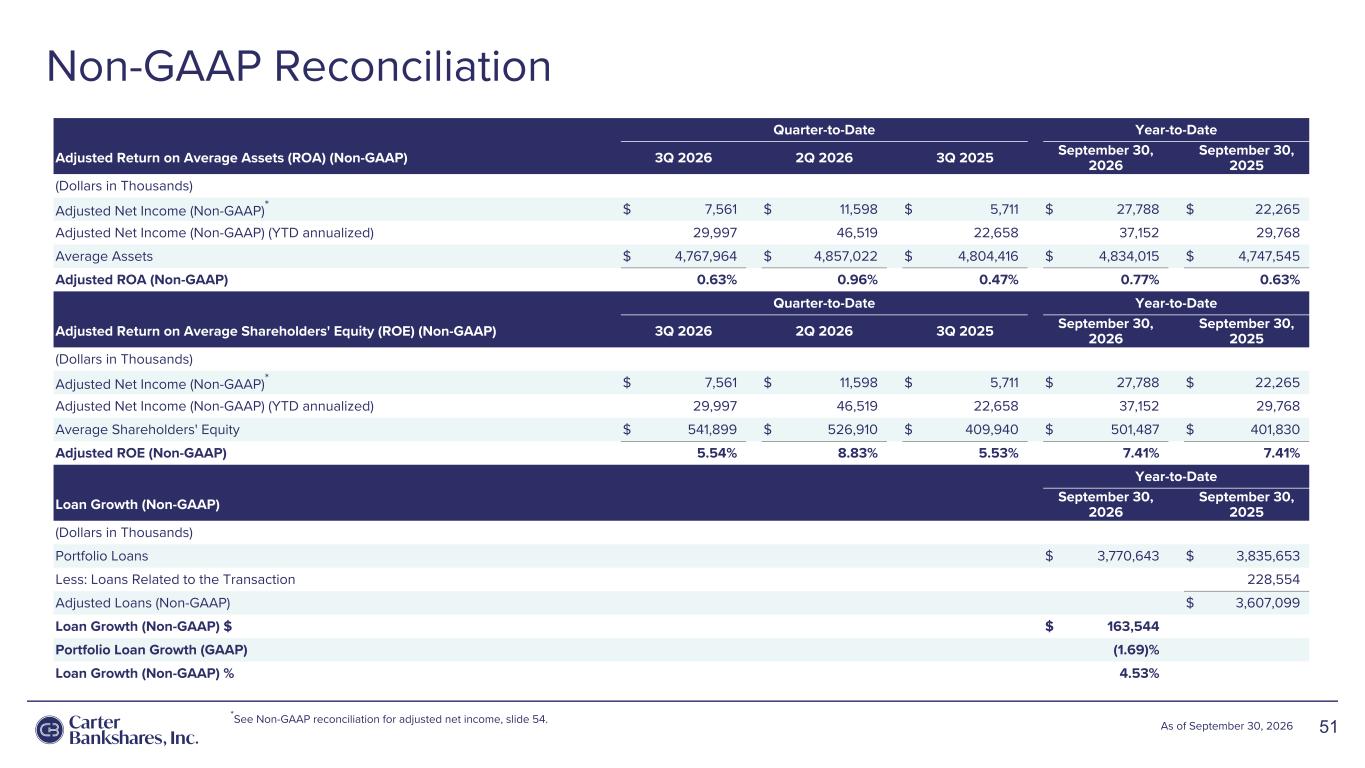
Non-GAAP Reconciliation 51As of September 30, 2026 $252 Quarter-to-Date Year-to-Date Adjusted Return on Average Assets (ROA) (Non-GAAP) 3Q 2026 2Q 2026 3Q 2025 September 30, 2026 September 30, 2025 (Dollars in Thousands) Adjusted Net Income (Non-GAAP)* $ 7,561 $ 11,598 $ 5,711 $ 27,788 $ 22,265 Adjusted Net Income (Non-GAAP) (YTD annualized) 29,997 46,519 22,658 37,152 29,768 Average Assets $ 4,767,964 $ 4,857,022 $ 4,804,416 $ 4,834,015 $ 4,747,545 Adjusted ROA (Non-GAAP) 0.63 % 0.96 % 0.47 % 0.77 % 0.63 % Quarter-to-Date Year-to-Date Adjusted Return on Average Shareholders' Equity (ROE) (Non-GAAP) 3Q 2026 2Q 2026 3Q 2025 September 30, 2026 September 30, 2025 (Dollars in Thousands) Adjusted Net Income (Non-GAAP)* $ 7,561 $ 11,598 $ 5,711 $ 27,788 $ 22,265 Adjusted Net Income (Non-GAAP) (YTD annualized) 29,997 46,519 22,658 37,152 29,768 Average Shareholders' Equity $ 541,899 $ 526,910 $ 409,940 $ 501,487 $ 401,830 Adjusted ROE (Non-GAAP) 5.54 % 8.83 % 5.53 % 7.41 % 7.41 % Year-to-Date Loan Growth (Non-GAAP) September 30, 2026 September 30, 2025 (Dollars in Thousands) Portfolio Loans $ 3,770,643 $ 3,835,653 Less: Loans Related to the Transaction 228,554 Adjusted Loans (Non-GAAP) $ 3,607,099 Loan Growth (Non-GAAP) $ $ 163,544 Portfolio Loan Growth (GAAP) (1.69) % Loan Growth (Non-GAAP) % 4.53 % *See Non-GAAP reconciliation for adjusted net income, slide 54.
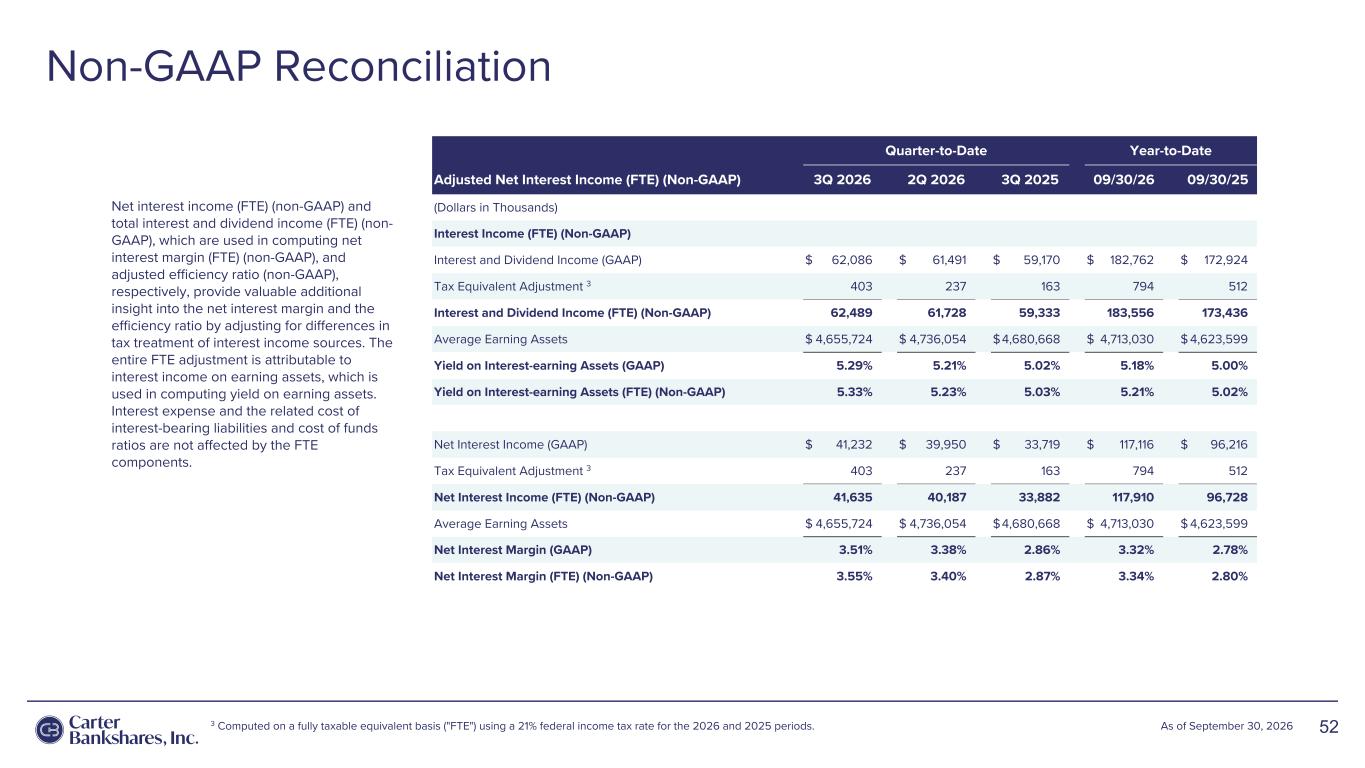
Non-GAAP Reconciliation 52As of September 30, 2026 $252 Quarter-to-Date Year-to-Date Adjusted Net Interest Income (FTE) (Non-GAAP) 3Q 2026 2Q 2026 3Q 2025 09/30/26 09/30/25 (Dollars in Thousands) Interest Income (FTE) (Non-GAAP) Interest and Dividend Income (GAAP) $ 62,086 $ 61,491 $ 59,170 $ 182,762 $ 172,924 Tax Equivalent Adjustment 3 403 237 163 794 512 Interest and Dividend Income (FTE) (Non-GAAP) 62,489 61,728 59,333 183,556 173,436 Average Earning Assets $ 4,655,724 $ 4,736,054 $ 4,680,668 $ 4,713,030 $ 4,623,599 Yield on Interest-earning Assets (GAAP) 5.29 % 5.21 % 5.02 % 5.18 % 5.00 % Yield on Interest-earning Assets (FTE) (Non-GAAP) 5.33 % 5.23 % 5.03 % 5.21 % 5.02 % Net Interest Income (GAAP) $ 41,232 $ 39,950 $ 33,719 $ 117,116 $ 96,216 Tax Equivalent Adjustment 3 403 237 163 794 512 Net Interest Income (FTE) (Non-GAAP) 41,635 40,187 33,882 117,910 96,728 Average Earning Assets $ 4,655,724 $ 4,736,054 $ 4,680,668 $ 4,713,030 $ 4,623,599 Net Interest Margin (GAAP) 3.51 % 3.38 % 2.86 % 3.32 % 2.78 % Net Interest Margin (FTE) (Non-GAAP) 3.55 % 3.40 % 2.87 % 3.34 % 2.80 % Net interest income (FTE) (non-GAAP) and total interest and dividend income (FTE) (non- GAAP), which are used in computing net interest margin (FTE) (non-GAAP), and adjusted efficiency ratio (non-GAAP), respectively, provide valuable additional insight into the net interest margin and the efficiency ratio by adjusting for differences in tax treatment of interest income sources. The entire FTE adjustment is attributable to interest income on earning assets, which is used in computing yield on earning assets. Interest expense and the related cost of interest-bearing liabilities and cost of funds ratios are not affected by the FTE components. 3 Computed on a fully taxable equivalent basis ("FTE") using a 21% federal income tax rate for the 2026 and 2025 periods.
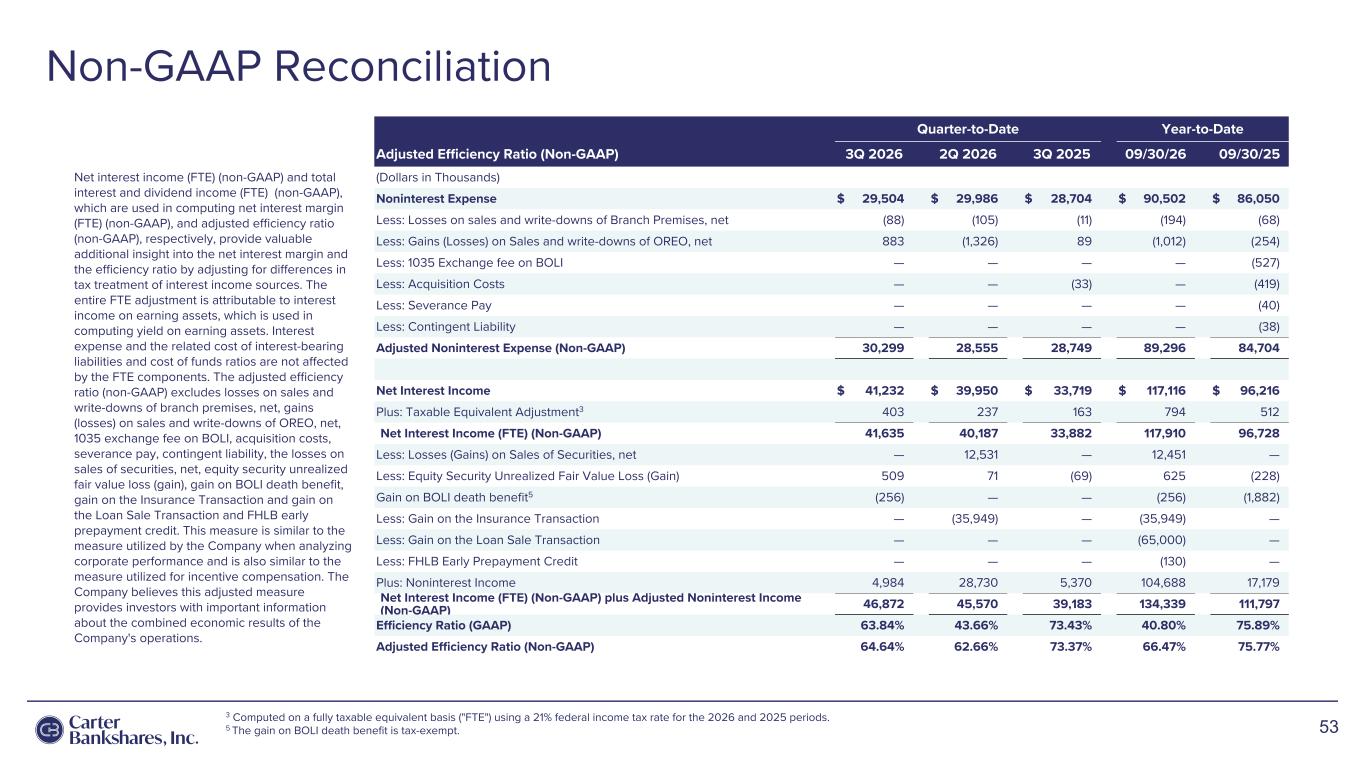
Non-GAAP Reconciliation 53 3 Computed on a fully taxable equivalent basis ("FTE") using a 21% federal income tax rate for the 2026 and 2025 periods. 5 The gain on BOLI death benefit is tax-exempt. $252 Quarter-to-Date Year-to-Date Adjusted Efficiency Ratio (Non-GAAP) 3Q 2026 2Q 2026 3Q 2025 09/30/26 09/30/25 (Dollars in Thousands) Noninterest Expense $ 29,504 $ 29,986 $ 28,704 $ 90,502 $ 86,050 Less: Losses on sales and write-downs of Branch Premises, net (88) (105) (11) (194) (68) Less: Gains (Losses) on Sales and write-downs of OREO, net 883 (1,326) 89 (1,012) (254) Less: 1035 Exchange fee on BOLI — — — — (527) Less: Acquisition Costs — — (33) — (419) Less: Severance Pay — — — — (40) Less: Contingent Liability — — — — (38) Adjusted Noninterest Expense (Non-GAAP) 30,299 28,555 28,749 89,296 84,704 Net Interest Income $ 41,232 $ 39,950 $ 33,719 $ 117,116 $ 96,216 Plus: Taxable Equivalent Adjustment3 403 237 163 794 512 Net Interest Income (FTE) (Non-GAAP) 41,635 40,187 33,882 117,910 96,728 Less: Losses (Gains) on Sales of Securities, net — 12,531 — 12,451 — Less: Equity Security Unrealized Fair Value Loss (Gain) 509 71 (69) 625 (228) Gain on BOLI death benefit5 (256) — — (256) (1,882) Less: Gain on the Insurance Transaction — (35,949) — (35,949) — Less: Gain on the Loan Sale Transaction — — — (65,000) — Less: FHLB Early Prepayment Credit — — — (130) — Plus: Noninterest Income 4,984 28,730 5,370 104,688 17,179 Net Interest Income (FTE) (Non-GAAP) plus Adjusted Noninterest Income (Non-GAAP) 46,872 45,570 39,183 134,339 111,797 Efficiency Ratio (GAAP) 63.84 % 43.66 % 73.43 % 40.80 % 75.89 % Adjusted Efficiency Ratio (Non-GAAP) 64.64 % 62.66 % 73.37 % 66.47 % 75.77 % Net interest income (FTE) (non-GAAP) and total interest and dividend income (FTE) (non-GAAP), which are used in computing net interest margin (FTE) (non-GAAP), and adjusted efficiency ratio (non-GAAP), respectively, provide valuable additional insight into the net interest margin and the efficiency ratio by adjusting for differences in tax treatment of interest income sources. The entire FTE adjustment is attributable to interest income on earning assets, which is used in computing yield on earning assets. Interest expense and the related cost of interest-bearing liabilities and cost of funds ratios are not affected by the FTE components. The adjusted efficiency ratio (non-GAAP) excludes losses on sales and write-downs of branch premises, net, gains (losses) on sales and write-downs of OREO, net, 1035 exchange fee on BOLI, acquisition costs, severance pay, contingent liability, the losses on sales of securities, net, equity security unrealized fair value loss (gain), gain on BOLI death benefit, gain on the Insurance Transaction and gain on the Loan Sale Transaction and FHLB early prepayment credit. This measure is similar to the measure utilized by the Company when analyzing corporate performance and is also similar to the measure utilized for incentive compensation. The Company believes this adjusted measure provides investors with important information about the combined economic results of the Company's operations.
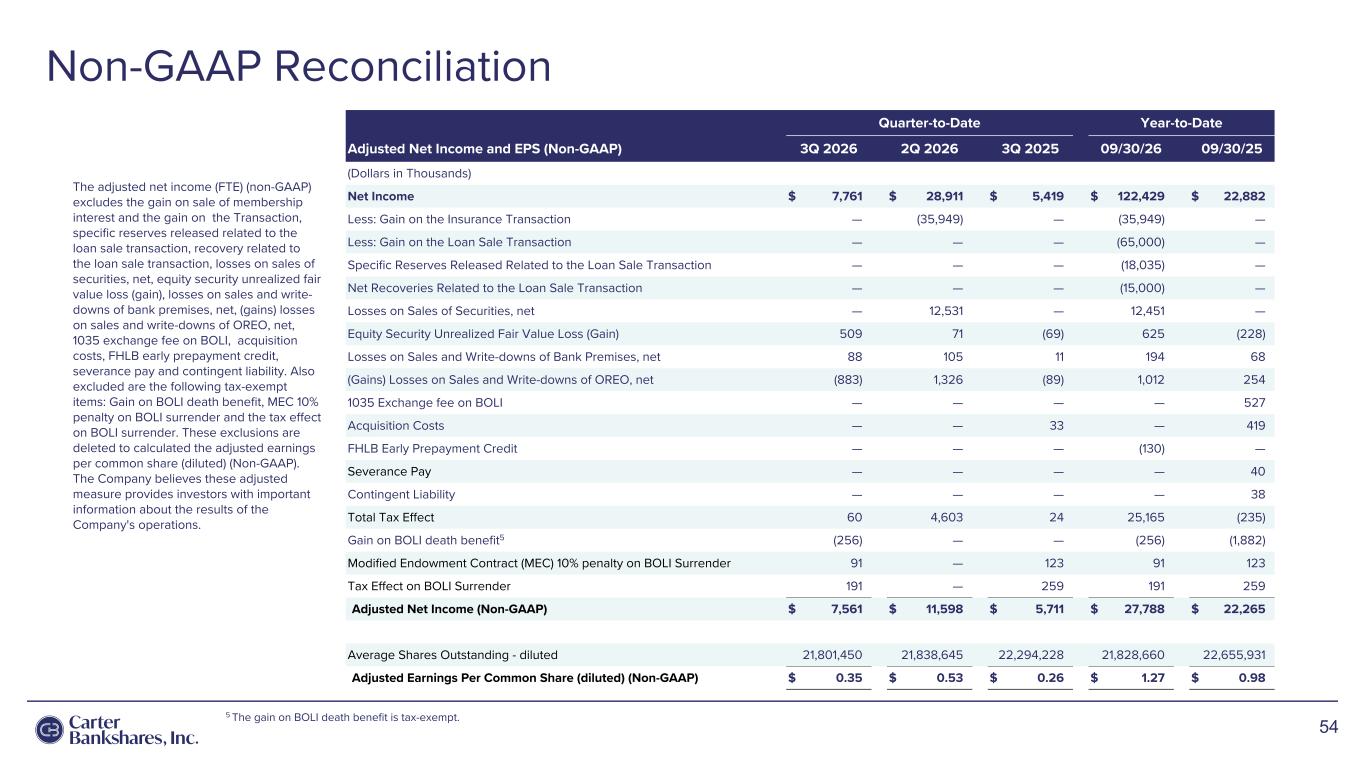
Non-GAAP Reconciliation 54 5 The gain on BOLI death benefit is tax-exempt. $252 Quarter-to-Date Year-to-Date Adjusted Net Income and EPS (Non-GAAP) 3Q 2026 2Q 2026 3Q 2025 09/30/26 09/30/25 (Dollars in Thousands) Net Income $ 7,761 $ 28,911 $ 5,419 $ 122,429 $ 22,882 Less: Gain on the Insurance Transaction — (35,949) — (35,949) — Less: Gain on the Loan Sale Transaction — — — (65,000) — Specific Reserves Released Related to the Loan Sale Transaction — — — (18,035) — Net Recoveries Related to the Loan Sale Transaction — — — (15,000) — Losses on Sales of Securities, net — 12,531 — 12,451 — Equity Security Unrealized Fair Value Loss (Gain) 509 71 (69) 625 (228) Losses on Sales and Write-downs of Bank Premises, net 88 105 11 194 68 (Gains) Losses on Sales and Write-downs of OREO, net (883) 1,326 (89) 1,012 254 1035 Exchange fee on BOLI — — — — 527 Acquisition Costs — — 33 — 419 FHLB Early Prepayment Credit — — — (130) — Severance Pay — — — — 40 Contingent Liability — — — — 38 Total Tax Effect 60 4,603 24 25,165 (235) Gain on BOLI death benefit5 (256) — — (256) (1,882) Modified Endowment Contract (MEC) 10% penalty on BOLI Surrender 91 — 123 91 123 Tax Effect on BOLI Surrender 191 — 259 191 259 Adjusted Net Income (Non-GAAP) $ 7,561 $ 11,598 $ 5,711 $ 27,788 $ 22,265 Average Shares Outstanding - diluted 21,801,450 21,838,645 22,294,228 21,828,660 22,655,931 Adjusted Earnings Per Common Share (diluted) (Non-GAAP) $ 0.35 $ 0.53 $ 0.26 $ 1.27 $ 0.98 The adjusted net income (FTE) (non-GAAP) excludes the gain on sale of membership interest and the gain on the Transaction, specific reserves released related to the loan sale transaction, recovery related to the loan sale transaction, losses on sales of securities, net, equity security unrealized fair value loss (gain), losses on sales and write- downs of bank premises, net, (gains) losses on sales and write-downs of OREO, net, 1035 exchange fee on BOLI, acquisition costs, FHLB early prepayment credit, severance pay and contingent liability. Also excluded are the following tax-exempt items: Gain on BOLI death benefit, MEC 10% penalty on BOLI surrender and the tax effect on BOLI surrender. These exclusions are deleted to calculated the adjusted earnings per common share (diluted) (Non-GAAP). The Company believes these adjusted measure provides investors with important information about the results of the Company's operations.