Shareholder Report
|
12 Months Ended |
|
Aug. 31, 2026
USD ($)
Holding
|
|---|
| Shareholder Report [Line Items] |
|
| Document Type |
N-CSR
|
| Amendment Flag |
false
|
| Registrant Name |
Advisors Preferred Trust
|
| Entity Central Index Key |
0001556505
|
| Entity Investment Company Type |
N-1A
|
| Document Period End Date |
Aug. 31, 2026
|
| Shareholder Report Annual or Semi-Annual |
Annual Shareholder Report
|
| C000212830 |
|
| Shareholder Report [Line Items] |
|
| Fund Name |
Hundredfold Select Alternative Fund
|
| Trading Symbol |
SFHYX
|
| Annual or Semi-Annual Statement [Text Block] |
This annual shareholder report contains important information about Hundredfold Select Alternative Fund for the period of September 1, 2025 to August 31, 2026.
|
| Additional Information [Text Block] |
You can find additional information about the Fund at hundredfoldselect.com/index.php/investor-materials. You can also request this information by contacting us at (855) 582-8006.
|
| Additional Information Phone Number |
(855) 582-8006
|
| Additional Information Website |
hundredfoldselect.com/index.php/investor-materials
|
| Expenses [Text Block] |
What were the Fund’s costs for the last year?(based on a hypothetical $10,000 investment) Table SummaryClass Name | Costs of a $10,000 investment | Costs paid as a percentage of a $10,000 investment |
|---|
Service Class | $231 | 2.23% |
|---|
|
| Expenses Paid, Amount |
$ 231
|
| Expense Ratio, Percent |
2.23%
|
| Performance Past Does Not Indicate Future [Text] |
The Fund’s past performance is not a good predictor of how the Fund will perform in the future.
|
| Average Annual Return [Table Text Block] |
Average Annual Total Returns Table Summary | 1 Year | 5 Years | 10 Years |
|---|
Hundredfold Select Alternative Fund | 6.75% | 2.81% | 7.24% |
|---|
Bloomberg U.S. Aggregate Bond Index | 1.89% | -0.29% | 1.40% |
|---|
S&P 500® Index | 20.38% | 12.79% | 15.37% |
|---|
The Fund’s past performance is not a good predictor of how the Fund will perform in the future. The graph and table do not reflect the deduction of taxes that a shareholder would pay on fund distributions or redemption of fund shares. For updated performance call (855) 582-8006. |
| No Deduction of Taxes [Text Block] |
The graph and table do not reflect the deduction of taxes that a shareholder would pay on fund distributions or redemption of fund shares.
|
| AssetsNet |
$ 132,461,114
|
| Holdings Count | Holding |
23
|
| Advisory Fees Paid, Amount |
$ 1,400,785
|
| InvestmentCompanyPortfolioTurnover |
285.00%
|
| Additional Fund Statistics [Text Block] |
Table SummaryNet Assets | $132,461,114 |
|---|
Number of Portfolio Holdings | 23 |
|---|
Advisory Fee | $1,400,785 |
|---|
Portfolio Turnover | 285% |
|---|
|
| Holdings [Text Block] |
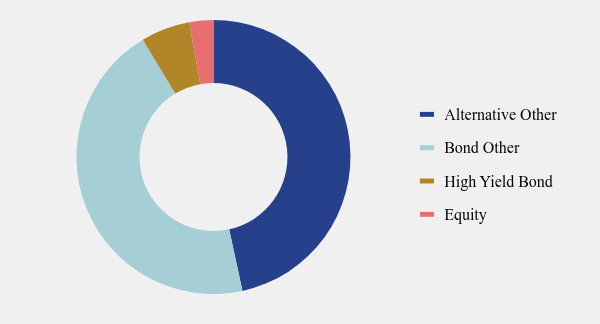
Investment Model Exposure 1.73 (1=100%)(value greater than 1 indicates use of leverage)Pie chart indexed to 100%, net exposureTable SummaryValue | Value |
|---|
Alternative Other | 80.65 | Bond Other | 77.48 | High Yield Bond | 10.03 | Equity | 4.90 | Portfolio Allocation (% of total (including notional) exposure)Table SummaryHigh Yield Bond | 10.03% |
|---|
Bond Other | 77.48% |
|---|
Alternative Other | 80.65% |
|---|
Equity | 4.90% |
|---|
| 173.06% |
|---|
Top 10 Holdings (% of net assets)Table SummaryHolding Name | % of Net Assets |
|---|
PGIM Securitized Credit Fund, Class Z | 11.9% |
|---|
Ambassador Fund, Institutional Class | 10.7% |
|---|
Putnam Mortgage Opportunities Fund, Class R6 | 10.4% |
|---|
AQR Diversifying Strategies Fund, Class R6 | 10.4% |
|---|
AQR Equity Market Neutral Fund, Class R6 | 10.2% |
|---|
Guggenheim Floating Rate Strategies Fund, Institutional Class | 10.1% |
|---|
AQR Trend Total Return Fund, Class I | 5.2% |
|---|
Federated Hermes MDT Market Neutral Fund, Institutional Shares | 5.1% |
|---|
Virtus Seix Floating Rate High Income Fund, Class R6, Class R6 | 5.0% |
|---|
First American Government Obligations Fund Class X | 1.4% |
|---|
|
| Material Fund Change [Text Block] |
No material changes occurred during the year ended August 31, 2026. |
| C000212831 |
|
| Shareholder Report [Line Items] |
|
| Fund Name |
Hundredfold Select Alternative Fund
|
| Trading Symbol |
HFSAX
|
| Annual or Semi-Annual Statement [Text Block] |
This annual shareholder report contains important information about Hundredfold Select Alternative Fund for the period of September 1, 2025 to August 31, 2026.
|
| Additional Information [Text Block] |
You can find additional information about the Fund at hundredfoldselect.com/index.php/investor-materials. You can also request this information by contacting us at (855) 582-8006.
|
| Additional Information Phone Number |
(855) 582-8006
|
| Additional Information Website |
hundredfoldselect.com/index.php/investor-materials
|
| Expenses [Text Block] |
What were the Fund’s costs for the last year?(based on a hypothetical $10,000 investment) Table SummaryClass Name | Costs of a $10,000 investment | Costs paid as a percentage of a $10,000 investment |
|---|
Investor Class | $135 | 1.30% |
|---|
|
| Expenses Paid, Amount |
$ 135
|
| Expense Ratio, Percent |
1.30%
|
| Performance Past Does Not Indicate Future [Text] |
The Fund’s past performance is not a good predictor of how the Fund will perform in the future.
|
| Average Annual Return [Table Text Block] |
Average Annual Total Returns Table Summary | 1 Year | 5 Years | 10 Years |
|---|
Hundredfold Select Alternative Fund | 7.74% | 3.77% | 8.23% |
|---|
Bloomberg U.S. Aggregate Bond Index | 1.89% | -0.29% | 1.40% |
|---|
S&P 500® Index | 20.38% | 12.79% | 15.37% |
|---|
The Fund’s past performance is not a good predictor of how the Fund will perform in the future. The graph and table do not reflect the deduction of taxes that a shareholder would pay on fund distributions or redemption of fund shares. For updated performance call (855) 582-8006. |
| No Deduction of Taxes [Text Block] |
The graph and table do not reflect the deduction of taxes that a shareholder would pay on fund distributions or redemption of fund shares.
|
| AssetsNet |
$ 132,461,114
|
| Holdings Count | Holding |
23
|
| Advisory Fees Paid, Amount |
$ 1,400,785
|
| InvestmentCompanyPortfolioTurnover |
285.00%
|
| Additional Fund Statistics [Text Block] |
Table SummaryNet Assets | $132,461,114 |
|---|
Number of Portfolio Holdings | 23 |
|---|
Advisory Fee | $1,400,785 |
|---|
Portfolio Turnover | 285% |
|---|
|
| Holdings [Text Block] |
Investment Model Exposure 1.73 (1=100%)(value greater than 1 indicates use of leverage)Pie chart indexed to 100%, net exposureTable SummaryValue | Value |
|---|
Alternative Other | 80.65 | Bond Other | 77.48 | High Yield Bond | 10.03 | Equity | 4.90 | Portfolio Allocation (% of total (including notional) exposure)Table SummaryHigh Yield Bond | 10.03% |
|---|
Bond Other | 77.48% |
|---|
Alternative Other | 80.65% |
|---|
Equity | 4.90% |
|---|
| 173.06% |
|---|
Top 10 Holdings (% of net assets)Table SummaryHolding Name | % of Net Assets |
|---|
PGIM Securitized Credit Fund, Class Z | 11.9% |
|---|
Ambassador Fund, Institutional Class | 10.7% |
|---|
Putnam Mortgage Opportunities Fund, Class R6 | 10.4% |
|---|
AQR Diversifying Strategies Fund, Class R6 | 10.4% |
|---|
AQR Equity Market Neutral Fund, Class R6 | 10.2% |
|---|
Guggenheim Floating Rate Strategies Fund, Institutional Class | 10.1% |
|---|
AQR Trend Total Return Fund, Class I | 5.2% |
|---|
Federated Hermes MDT Market Neutral Fund, Institutional Shares | 5.1% |
|---|
Virtus Seix Floating Rate High Income Fund, Class R6, Class R6 | 5.0% |
|---|
First American Government Obligations Fund Class X | 1.4% |
|---|
|
| Material Fund Change [Text Block] |
No material changes occurred during the year ended August 31, 2026. |