Shareholder Report
|
12 Months Ended |
|
Aug. 31, 2026
USD ($)
Holding
|
|---|
| Shareholder Report [Line Items] |
|
| Document Type |
N-CSR
|
| Amendment Flag |
false
|
| Registrant Name |
Columbia Funds Series Trust II
|
| Entity Central Index Key |
0001352280
|
| Entity Investment Company Type |
N-1A
|
| Document Period End Date |
Aug. 31, 2026
|
| Shareholder Report Annual or Semi-Annual |
Annual Shareholder Report
|
| C000097619 |
|
| Shareholder Report [Line Items] |
|
| Fund Name |
Columbia Emerging Markets Bond Fund
|
| Class Name |
Class A
|
| Trading Symbol |
REBAX
|
| Annual or Semi-Annual Statement [Text Block] |
This annual shareholder report contains important information about Columbia Emerging Markets Bond Fund (the Fund) for the period of September 1, 2025 to August 31, 2026.
|
| Additional Information [Text Block] |
You can find additional information about the Fund at columbiathreadneedleus.com/resources/literature. You can also request more information by contacting us at 1-800-345-6611.
|
| Additional Information Phone Number |
1-800-345-6611
|
| Additional Information Website |
columbiathreadneedleus.com/resources/literature
|
| Expenses [Text Block] |
What were the Fund costs for the reporting period? (Based on a hypothetical $10,000 investment)
Table Summary
Class |
Cost of a $10,000 investment |
Cost paid as a percentage of a $10,000 investment |
Class A |
$115 |
1.11% | |
| Expenses Paid, Amount |
$ 115
|
| Expense Ratio, Percent |
1.11%
|
| Factors Affecting Performance [Text Block] |
Management's Discussion of Fund Performance The performance of Class A shares for the period presented is shown in the Average Annual Total Returns table. Top Performance ContributorsAllocation and selection | Contribution to the Fund’s performance relative to the benchmark was driven primarily by an allocation to and selection within Ukrainian bonds. Also positively contributing to relative performance was an allocation to and selection within China. Finally, selection within and an allocation to Venezuela was also notably positive for the Fund’s relative performance. Rates and currency | Local currency allocations contributed to the Fund’s relative performance. Top Performance DetractorsAllocation and selection | Security selection within Brazil detracted from the Fund’s performance versus the benchmark. Additionally, the Fund’s underweight exposure to Argentina also negatively impacted the Fund’s overall relative performance. An allocation to Turkey also weighed on the Fund’s relative performance. Rates and currency | Positions in local rates and index spread negatively impacted the Fund’s relative performance. Additionally, U.S. rates and trading impacts also detracted from the Fund’s overall performance relative to the benchmark. |
| Performance Past Does Not Indicate Future [Text] |
The Fund's past performance is not a good predictor of the Fund's future performance.
|
| Line Graph [Table Text Block] |
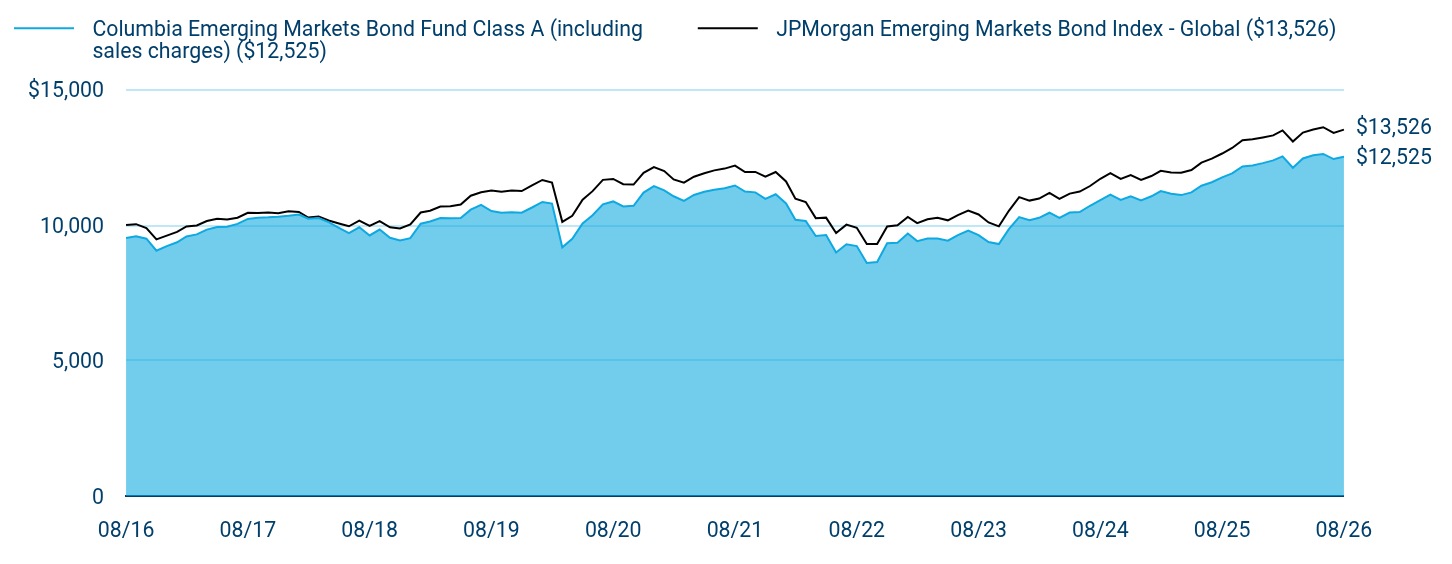
Table Summary
|
Columbia Emerging Markets Bond Fund Class A (including sales charges) ($12,525) |
JPMorgan Emerging Markets Bond Index - Global ($13,526) |
08/16 |
$9,528 |
$10,000 |
09/16 |
$9,584 |
$10,034 |
10/16 |
$9,500 |
$9,887 |
11/16 |
$9,055 |
$9,475 |
12/16 |
$9,225 |
$9,611 |
01/17 |
$9,366 |
$9,749 |
02/17 |
$9,582 |
$9,952 |
03/17 |
$9,658 |
$9,986 |
04/17 |
$9,835 |
$10,149 |
05/17 |
$9,932 |
$10,233 |
06/17 |
$9,939 |
$10,207 |
07/17 |
$10,046 |
$10,274 |
08/17 |
$10,229 |
$10,452 |
09/17 |
$10,270 |
$10,450 |
10/17 |
$10,286 |
$10,469 |
11/17 |
$10,310 |
$10,441 |
12/17 |
$10,346 |
$10,507 |
01/18 |
$10,392 |
$10,487 |
02/18 |
$10,236 |
$10,281 |
03/18 |
$10,260 |
$10,320 |
04/18 |
$10,111 |
$10,169 |
05/18 |
$9,899 |
$10,059 |
06/18 |
$9,703 |
$9,957 |
07/18 |
$9,920 |
$10,163 |
08/18 |
$9,619 |
$9,967 |
09/18 |
$9,837 |
$10,144 |
10/18 |
$9,533 |
$9,917 |
11/18 |
$9,436 |
$9,878 |
12/18 |
$9,519 |
$10,023 |
01/19 |
$10,050 |
$10,465 |
02/19 |
$10,136 |
$10,531 |
03/19 |
$10,260 |
$10,684 |
04/19 |
$10,256 |
$10,696 |
05/19 |
$10,260 |
$10,758 |
06/19 |
$10,571 |
$11,085 |
07/19 |
$10,744 |
$11,213 |
08/19 |
$10,517 |
$11,274 |
09/19 |
$10,457 |
$11,233 |
10/19 |
$10,472 |
$11,275 |
11/19 |
$10,458 |
$11,257 |
12/19 |
$10,650 |
$11,468 |
01/20 |
$10,854 |
$11,667 |
02/20 |
$10,793 |
$11,573 |
03/20 |
$9,180 |
$10,120 |
04/20 |
$9,493 |
$10,342 |
05/20 |
$10,062 |
$10,935 |
06/20 |
$10,367 |
$11,254 |
07/20 |
$10,768 |
$11,670 |
08/20 |
$10,874 |
$11,704 |
09/20 |
$10,688 |
$11,511 |
10/20 |
$10,712 |
$11,497 |
11/20 |
$11,201 |
$11,928 |
12/20 |
$11,440 |
$12,142 |
01/21 |
$11,281 |
$11,995 |
02/21 |
$11,064 |
$11,687 |
03/21 |
$10,894 |
$11,566 |
04/21 |
$11,114 |
$11,787 |
05/21 |
$11,228 |
$11,915 |
06/21 |
$11,304 |
$12,021 |
07/21 |
$11,364 |
$12,086 |
08/21 |
$11,463 |
$12,196 |
09/21 |
$11,241 |
$11,957 |
10/21 |
$11,209 |
$11,964 |
11/21 |
$10,969 |
$11,791 |
12/21 |
$11,138 |
$11,959 |
01/22 |
$10,800 |
$11,613 |
02/22 |
$10,194 |
$10,974 |
03/22 |
$10,151 |
$10,851 |
04/22 |
$9,600 |
$10,257 |
05/22 |
$9,636 |
$10,276 |
06/22 |
$8,989 |
$9,707 |
07/22 |
$9,291 |
$10,017 |
08/22 |
$9,225 |
$9,900 |
09/22 |
$8,602 |
$9,299 |
10/22 |
$8,640 |
$9,306 |
11/22 |
$9,333 |
$9,953 |
12/22 |
$9,345 |
$9,991 |
01/23 |
$9,687 |
$10,302 |
02/23 |
$9,409 |
$10,075 |
03/23 |
$9,509 |
$10,215 |
04/23 |
$9,504 |
$10,267 |
05/23 |
$9,424 |
$10,176 |
06/23 |
$9,631 |
$10,372 |
07/23 |
$9,798 |
$10,539 |
08/23 |
$9,631 |
$10,392 |
09/23 |
$9,377 |
$10,099 |
10/23 |
$9,300 |
$9,953 |
11/23 |
$9,852 |
$10,529 |
12/23 |
$10,297 |
$11,035 |
01/24 |
$10,180 |
$10,905 |
02/24 |
$10,269 |
$10,980 |
03/24 |
$10,457 |
$11,189 |
04/24 |
$10,264 |
$10,965 |
05/24 |
$10,462 |
$11,164 |
06/24 |
$10,480 |
$11,238 |
07/24 |
$10,714 |
$11,443 |
08/24 |
$10,926 |
$11,710 |
09/24 |
$11,126 |
$11,920 |
10/24 |
$10,932 |
$11,706 |
11/24 |
$11,067 |
$11,845 |
12/24 |
$10,912 |
$11,668 |
01/25 |
$11,064 |
$11,811 |
02/25 |
$11,259 |
$12,006 |
03/25 |
$11,161 |
$11,941 |
04/25 |
$11,108 |
$11,931 |
05/25 |
$11,208 |
$12,033 |
06/25 |
$11,453 |
$12,307 |
07/25 |
$11,584 |
$12,452 |
08/25 |
$11,763 |
$12,643 |
09/25 |
$11,908 |
$12,847 |
10/25 |
$12,164 |
$13,130 |
11/25 |
$12,202 |
$13,169 |
12/25 |
$12,289 |
$13,237 |
01/26 |
$12,389 |
$13,311 |
02/26 |
$12,535 |
$13,497 |
03/26 |
$12,118 |
$13,086 |
04/26 |
$12,459 |
$13,417 |
05/26 |
$12,579 |
$13,527 |
06/26 |
$12,626 |
$13,614 |
07/26 |
$12,439 |
$13,404 |
08/26 |
$12,525 |
$13,526 |
|
| Average Annual Return [Table Text Block] |
Table Summary
Average Annual Total Returns (%) |
1 year |
5 years |
10 years |
Class A (excluding sales charges) |
6.48 |
1.79 |
2.77 |
Class A (including sales charges) |
1.44 |
0.80 |
2.28 |
JPMorgan Emerging Markets Bond Index - Global |
6.99 |
2.09 |
3.07 | |
| No Deduction of Taxes [Text Block] |
Performance does not reflect the deduction of taxes that a shareholder may pay on fund distributions or on the redemptions of fund shares.
|
| Updated Performance Information Location [Text Block] |
columbiathreadneedleus.com/investment-products/mutual-funds
|
| AssetsNet |
$ 356,380,433
|
| Holdings Count | Holding |
165
|
| Advisory Fees Paid, Amount |
$ 2,137,317
|
| InvestmentCompanyPortfolioTurnover |
46.00%
|
| Additional Fund Statistics [Text Block] |
Table Summary
Fund net assets |
$356,380,433 |
Total number of portfolio holdings |
165 |
Management services fees (represents 0.60% of Fund average net assets) |
$2,137,317 |
Portfolio turnover for the reporting period |
46% | |
| Holdings [Text Block] |
Table Summary
Mexico |
8.8% |
|
Saudi Arabia |
7.6% |
|
Indonesia |
7.5% |
|
Turkey |
5.3% |
|
United Arab Emirates |
5.1% |
|
Hungary |
4.1% |
|
Colombia |
3.9% |
|
Romania |
3.9% |
|
Chile |
3.8% |
|
United States |
3.7% |
|
Other |
45.7% |
|
Table Summary
Foreign Government Obligations |
88.8% |
Corporate Bonds & Notes |
6.9% |
Money Market Funds |
3.7% |
Other |
0.0%Footnote Reference* |
| Footnote |
Description |
Footnote* |
Percentage rounds to less than 0.1% or (0.1)%. | |
| Largest Holdings [Text Block] |
Table Summary
Romanian Government International Bond 3.625% 03/27/2032 |
3.9% |
Perusahaan Penerbit SBSN Indonesia III 4.700% 06/06/2032 |
3.8% |
Mexico Government International Bond 3.500% 02/12/2034 |
3.3% |
Argentine Republic Government International Bond 2.750% 07/09/2035 |
2.5% |
Saudi Government International Bond 5.625% 01/13/2035 |
2.2% |
Chile Government International Bond 4.950% 01/05/2036 |
2.0% |
DP World PLC 6.850% 07/02/2037 |
1.9% |
Colombian TES 11.750% 01/24/2035 |
1.9% |
Petroleos de Venezuela SA 0.000% 05/16/2024 |
1.9% |
Hungary Government International Bond 2.125% 09/22/2031 |
1.4% | |
| Material Fund Change [Text Block] |
|
| C000097625 |
|
| Shareholder Report [Line Items] |
|
| Fund Name |
Columbia Emerging Markets Bond Fund
|
| Class Name |
Institutional Class
|
| Trading Symbol |
CMBZX
|
| Annual or Semi-Annual Statement [Text Block] |
This annual shareholder report contains important information about Columbia Emerging Markets Bond Fund (the Fund) for the period of September 1, 2025 to August 31, 2026.
|
| Additional Information [Text Block] |
You can find additional information about the Fund at columbiathreadneedleus.com/resources/literature. You can also request more information by contacting us at 1-800-345-6611.
|
| Additional Information Phone Number |
1-800-345-6611
|
| Additional Information Website |
columbiathreadneedleus.com/resources/literature
|
| Expenses [Text Block] |
What were the Fund costs for the reporting period? (Based on a hypothetical $10,000 investment)
Table Summary
Class |
Cost of a $10,000 investment |
Cost paid as a percentage of a $10,000 investment |
Institutional Class |
$89 |
0.86% | |
| Expenses Paid, Amount |
$ 89
|
| Expense Ratio, Percent |
0.86%
|
| Factors Affecting Performance [Text Block] |
Management's Discussion of Fund Performance The performance of Institutional Class shares for the period presented is shown in the Average Annual Total Returns table. Top Performance ContributorsAllocation and selection | Contribution to the Fund’s performance relative to the benchmark was driven primarily by an allocation to and selection within Ukrainian bonds. Also positively contributing to relative performance was an allocation to and selection within China. Finally, selection within and an allocation to Venezuela was also notably positive for the Fund’s relative performance. Rates and currency | Local currency allocations contributed to the Fund’s relative performance. Top Performance DetractorsAllocation and selection | Security selection within Brazil detracted from the Fund’s performance versus the benchmark. Additionally, the Fund’s underweight exposure to Argentina also negatively impacted the Fund’s overall relative performance. An allocation to Turkey also weighed on the Fund’s relative performance. Rates and currency | Positions in local rates and index spread negatively impacted the Fund’s relative performance. Additionally, U.S. rates and trading impacts also detracted from the Fund’s overall performance relative to the benchmark. |
| Performance Past Does Not Indicate Future [Text] |
The Fund's past performance is not a good predictor of the Fund's future performance.
|
| Line Graph [Table Text Block] |
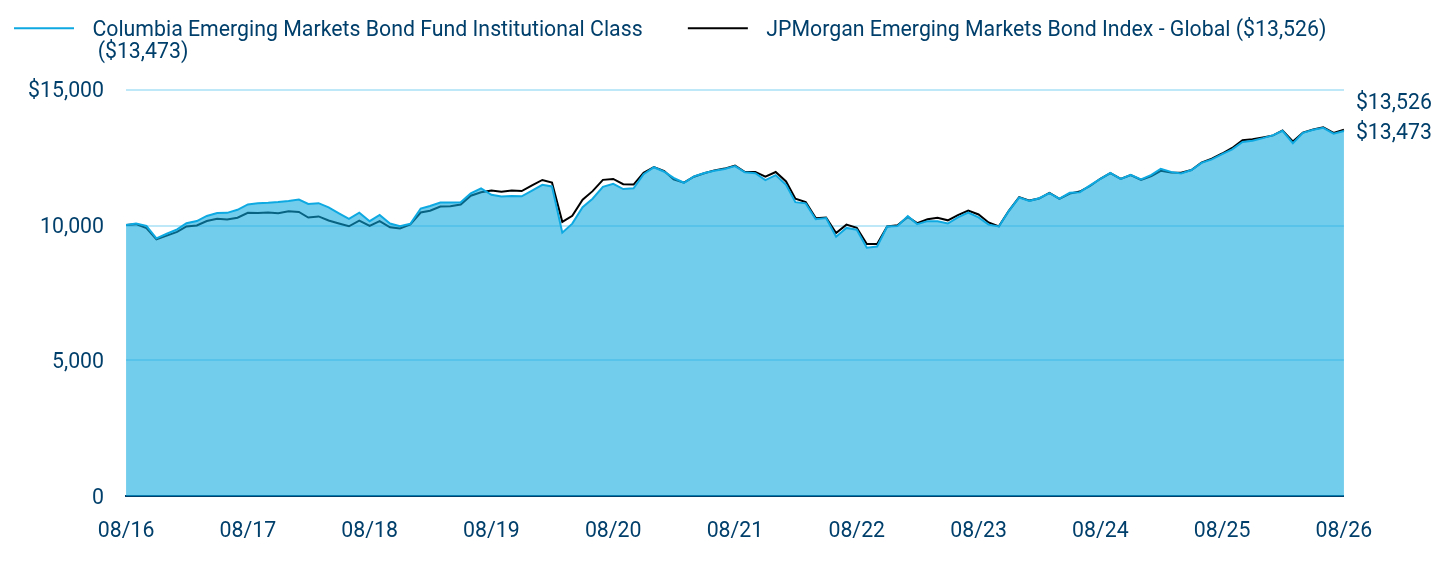
Table Summary
|
Columbia Emerging Markets Bond Fund Institutional Class ($13,473) |
JPMorgan Emerging Markets Bond Index - Global ($13,526) |
08/16 |
$10,000 |
$10,000 |
09/16 |
$10,060 |
$10,034 |
10/16 |
$9,974 |
$9,887 |
11/16 |
$9,510 |
$9,475 |
12/16 |
$9,681 |
$9,611 |
01/17 |
$9,840 |
$9,749 |
02/17 |
$10,069 |
$9,952 |
03/17 |
$10,151 |
$9,986 |
04/17 |
$10,338 |
$10,149 |
05/17 |
$10,443 |
$10,233 |
06/17 |
$10,452 |
$10,207 |
07/17 |
$10,566 |
$10,274 |
08/17 |
$10,762 |
$10,452 |
09/17 |
$10,807 |
$10,450 |
10/17 |
$10,826 |
$10,469 |
11/17 |
$10,854 |
$10,441 |
12/17 |
$10,894 |
$10,507 |
01/18 |
$10,944 |
$10,487 |
02/18 |
$10,782 |
$10,281 |
03/18 |
$10,809 |
$10,320 |
04/18 |
$10,655 |
$10,169 |
05/18 |
$10,434 |
$10,059 |
06/18 |
$10,230 |
$9,957 |
07/18 |
$10,461 |
$10,163 |
08/18 |
$10,146 |
$9,967 |
09/18 |
$10,378 |
$10,144 |
10/18 |
$10,060 |
$9,917 |
11/18 |
$9,959 |
$9,878 |
12/18 |
$10,049 |
$10,023 |
01/19 |
$10,611 |
$10,465 |
02/19 |
$10,704 |
$10,531 |
03/19 |
$10,837 |
$10,684 |
04/19 |
$10,835 |
$10,696 |
05/19 |
$10,842 |
$10,758 |
06/19 |
$11,172 |
$11,085 |
07/19 |
$11,357 |
$11,213 |
08/19 |
$11,120 |
$11,274 |
09/19 |
$11,059 |
$11,233 |
10/19 |
$11,077 |
$11,275 |
11/19 |
$11,064 |
$11,257 |
12/19 |
$11,270 |
$11,468 |
01/20 |
$11,487 |
$11,667 |
02/20 |
$11,426 |
$11,573 |
03/20 |
$9,722 |
$10,120 |
04/20 |
$10,055 |
$10,342 |
05/20 |
$10,660 |
$10,935 |
06/20 |
$10,974 |
$11,254 |
07/20 |
$11,412 |
$11,670 |
08/20 |
$11,526 |
$11,704 |
09/20 |
$11,331 |
$11,511 |
10/20 |
$11,360 |
$11,497 |
11/20 |
$11,880 |
$11,928 |
12/20 |
$12,136 |
$12,142 |
01/21 |
$11,970 |
$11,995 |
02/21 |
$11,742 |
$11,687 |
03/21 |
$11,563 |
$11,566 |
04/21 |
$11,800 |
$11,787 |
05/21 |
$11,923 |
$11,915 |
06/21 |
$12,006 |
$12,021 |
07/21 |
$12,072 |
$12,086 |
08/21 |
$12,180 |
$12,196 |
09/21 |
$11,947 |
$11,957 |
10/21 |
$11,915 |
$11,964 |
11/21 |
$11,662 |
$11,791 |
12/21 |
$11,845 |
$11,959 |
01/22 |
$11,488 |
$11,613 |
02/22 |
$10,847 |
$10,974 |
03/22 |
$10,803 |
$10,851 |
04/22 |
$10,219 |
$10,257 |
05/22 |
$10,260 |
$10,276 |
06/22 |
$9,573 |
$9,707 |
07/22 |
$9,897 |
$10,017 |
08/22 |
$9,828 |
$9,900 |
09/22 |
$9,167 |
$9,299 |
10/22 |
$9,210 |
$9,306 |
11/22 |
$9,950 |
$9,953 |
12/22 |
$9,964 |
$9,991 |
01/23 |
$10,331 |
$10,302 |
02/23 |
$10,037 |
$10,075 |
03/23 |
$10,146 |
$10,215 |
04/23 |
$10,142 |
$10,267 |
05/23 |
$10,059 |
$10,176 |
06/23 |
$10,283 |
$10,372 |
07/23 |
$10,462 |
$10,539 |
08/23 |
$10,286 |
$10,392 |
09/23 |
$10,018 |
$10,099 |
10/23 |
$9,950 |
$9,953 |
11/23 |
$10,529 |
$10,529 |
12/23 |
$11,018 |
$11,035 |
01/24 |
$10,896 |
$10,905 |
02/24 |
$10,992 |
$10,980 |
03/24 |
$11,184 |
$11,189 |
04/24 |
$10,980 |
$10,965 |
05/24 |
$11,193 |
$11,164 |
06/24 |
$11,216 |
$11,238 |
07/24 |
$11,467 |
$11,443 |
08/24 |
$11,709 |
$11,710 |
09/24 |
$11,925 |
$11,920 |
10/24 |
$11,708 |
$11,706 |
11/24 |
$11,855 |
$11,845 |
12/24 |
$11,691 |
$11,668 |
01/25 |
$11,856 |
$11,811 |
02/25 |
$12,080 |
$12,006 |
03/25 |
$11,965 |
$11,941 |
04/25 |
$11,910 |
$11,931 |
05/25 |
$12,033 |
$12,033 |
06/25 |
$12,298 |
$12,307 |
07/25 |
$12,428 |
$12,452 |
08/25 |
$12,623 |
$12,643 |
09/25 |
$12,794 |
$12,847 |
10/25 |
$13,070 |
$13,130 |
11/25 |
$13,115 |
$13,169 |
12/25 |
$13,211 |
$13,237 |
01/26 |
$13,320 |
$13,311 |
02/26 |
$13,480 |
$13,497 |
03/26 |
$13,022 |
$13,086 |
04/26 |
$13,404 |
$13,417 |
05/26 |
$13,522 |
$13,527 |
06/26 |
$13,589 |
$13,614 |
07/26 |
$13,377 |
$13,404 |
08/26 |
$13,473 |
$13,526 |
|
| Average Annual Return [Table Text Block] |
Table Summary
Average Annual Total Returns (%) |
1 year |
5 years |
10 years |
Institutional Class |
6.73 |
2.04 |
3.02 |
JPMorgan Emerging Markets Bond Index - Global |
6.99 |
2.09 |
3.07 | |
| No Deduction of Taxes [Text Block] |
Performance does not reflect the deduction of taxes that a shareholder may pay on fund distributions or on the redemptions of fund shares.
|
| Updated Performance Information Location [Text Block] |
columbiathreadneedleus.com/investment-products/mutual-funds
|
| AssetsNet |
$ 356,380,433
|
| Holdings Count | Holding |
165
|
| Advisory Fees Paid, Amount |
$ 2,137,317
|
| InvestmentCompanyPortfolioTurnover |
46.00%
|
| Additional Fund Statistics [Text Block] |
Table Summary
Fund net assets |
$356,380,433 |
Total number of portfolio holdings |
165 |
Management services fees (represents 0.60% of Fund average net assets) |
$2,137,317 |
Portfolio turnover for the reporting period |
46% | |
| Holdings [Text Block] |
Table Summary
Mexico |
8.8% |
|
Saudi Arabia |
7.6% |
|
Indonesia |
7.5% |
|
Turkey |
5.3% |
|
United Arab Emirates |
5.1% |
|
Hungary |
4.1% |
|
Colombia |
3.9% |
|
Romania |
3.9% |
|
Chile |
3.8% |
|
United States |
3.7% |
|
Other |
45.7% |
|
Table Summary
Foreign Government Obligations |
88.8% |
Corporate Bonds & Notes |
6.9% |
Money Market Funds |
3.7% |
Other |
0.0%Footnote Reference* |
| Footnote |
Description |
Footnote* |
Percentage rounds to less than 0.1% or (0.1)%. | |
| Largest Holdings [Text Block] |
Table Summary
Romanian Government International Bond 3.625% 03/27/2032 |
3.9% |
Perusahaan Penerbit SBSN Indonesia III 4.700% 06/06/2032 |
3.8% |
Mexico Government International Bond 3.500% 02/12/2034 |
3.3% |
Argentine Republic Government International Bond 2.750% 07/09/2035 |
2.5% |
Saudi Government International Bond 5.625% 01/13/2035 |
2.2% |
Chile Government International Bond 4.950% 01/05/2036 |
2.0% |
DP World PLC 6.850% 07/02/2037 |
1.9% |
Colombian TES 11.750% 01/24/2035 |
1.9% |
Petroleos de Venezuela SA 0.000% 05/16/2024 |
1.9% |
Hungary Government International Bond 2.125% 09/22/2031 |
1.4% | |
| Material Fund Change [Text Block] |
|
| C000122765 |
|
| Shareholder Report [Line Items] |
|
| Fund Name |
Columbia Emerging Markets Bond Fund
|
| Class Name |
Institutional 2 Class
|
| Trading Symbol |
CEBRX
|
| Annual or Semi-Annual Statement [Text Block] |
This annual shareholder report contains important information about Columbia Emerging Markets Bond Fund (the Fund) for the period of September 1, 2025 to August 31, 2026.
|
| Additional Information [Text Block] |
You can find additional information about the Fund at columbiathreadneedleus.com/resources/literature. You can also request more information by contacting us at 1-800-345-6611.
|
| Additional Information Phone Number |
1-800-345-6611
|
| Additional Information Website |
columbiathreadneedleus.com/resources/literature
|
| Expenses [Text Block] |
What were the Fund costs for the reporting period? (Based on a hypothetical $10,000 investment)
Table Summary
Class |
Cost of a $10,000 investment |
Cost paid as a percentage of a $10,000 investment |
Institutional 2 Class |
$76 |
0.73% | |
| Expenses Paid, Amount |
$ 76
|
| Expense Ratio, Percent |
0.73%
|
| Factors Affecting Performance [Text Block] |
Management's Discussion of Fund Performance The performance of Institutional 2 Class shares for the period presented is shown in the Average Annual Total Returns table. Top Performance ContributorsAllocation and selection | Contribution to the Fund’s performance relative to the benchmark was driven primarily by an allocation to and selection within Ukrainian bonds. Also positively contributing to relative performance was an allocation to and selection within China. Finally, selection within and an allocation to Venezuela was also notably positive for the Fund’s relative performance. Rates and currency | Local currency allocations contributed to the Fund’s relative performance. Top Performance DetractorsAllocation and selection | Security selection within Brazil detracted from the Fund’s performance versus the benchmark. Additionally, the Fund’s underweight exposure to Argentina also negatively impacted the Fund’s overall relative performance. An allocation to Turkey also weighed on the Fund’s relative performance. Rates and currency | Positions in local rates and index spread negatively impacted the Fund’s relative performance. Additionally, U.S. rates and trading impacts also detracted from the Fund’s overall performance relative to the benchmark. |
| Performance Past Does Not Indicate Future [Text] |
The Fund's past performance is not a good predictor of the Fund's future performance.
|
| Line Graph [Table Text Block] |
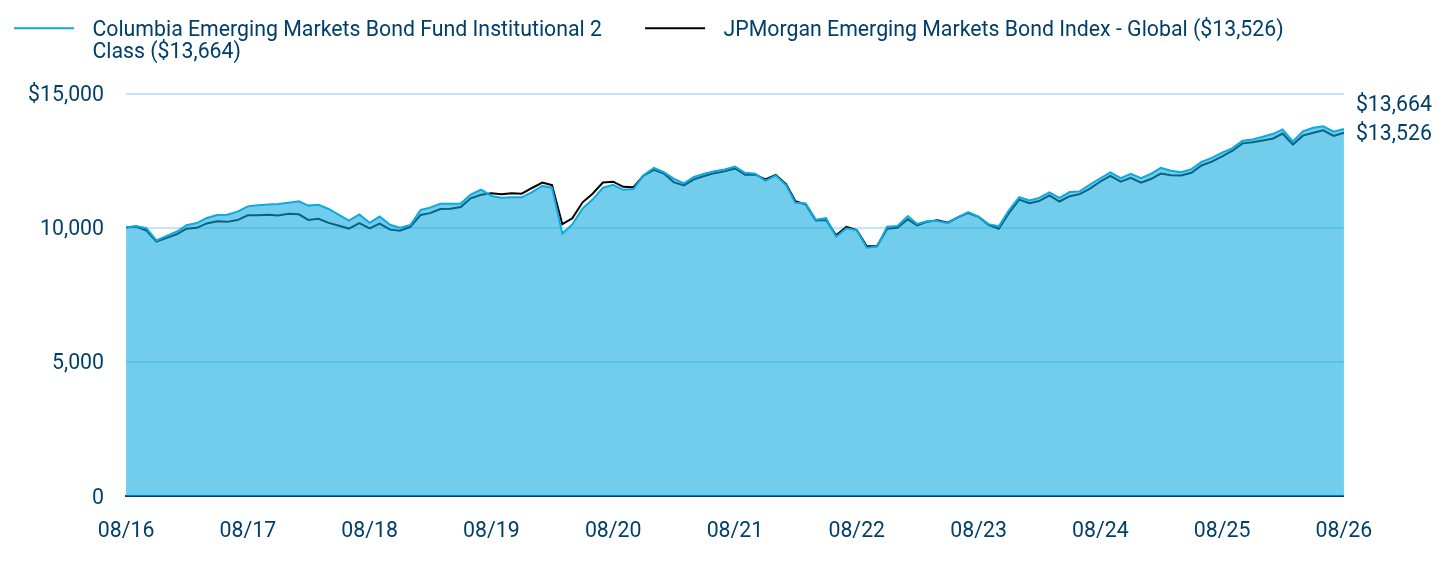
Table Summary
|
Columbia Emerging Markets Bond Fund Institutional 2 Class ($13,664) |
JPMorgan Emerging Markets Bond Index - Global ($13,526) |
08/16 |
$10,000 |
$10,000 |
09/16 |
$10,053 |
$10,034 |
10/16 |
$9,969 |
$9,887 |
11/16 |
$9,515 |
$9,475 |
12/16 |
$9,688 |
$9,611 |
01/17 |
$9,849 |
$9,749 |
02/17 |
$10,079 |
$9,952 |
03/17 |
$10,163 |
$9,986 |
04/17 |
$10,352 |
$10,149 |
05/17 |
$10,459 |
$10,233 |
06/17 |
$10,470 |
$10,207 |
07/17 |
$10,586 |
$10,274 |
08/17 |
$10,784 |
$10,452 |
09/17 |
$10,822 |
$10,450 |
10/17 |
$10,851 |
$10,469 |
11/17 |
$10,871 |
$10,441 |
12/17 |
$10,921 |
$10,507 |
01/18 |
$10,973 |
$10,487 |
02/18 |
$10,812 |
$10,281 |
03/18 |
$10,840 |
$10,320 |
04/18 |
$10,687 |
$10,169 |
05/18 |
$10,467 |
$10,059 |
06/18 |
$10,254 |
$9,957 |
07/18 |
$10,486 |
$10,163 |
08/18 |
$10,172 |
$9,967 |
09/18 |
$10,405 |
$10,144 |
10/18 |
$10,097 |
$9,917 |
11/18 |
$9,987 |
$9,878 |
12/18 |
$10,088 |
$10,023 |
01/19 |
$10,653 |
$10,465 |
02/19 |
$10,738 |
$10,531 |
03/19 |
$10,882 |
$10,684 |
04/19 |
$10,881 |
$10,696 |
05/19 |
$10,889 |
$10,758 |
06/19 |
$11,222 |
$11,085 |
07/19 |
$11,409 |
$11,213 |
08/19 |
$11,172 |
$11,274 |
09/19 |
$11,101 |
$11,233 |
10/19 |
$11,120 |
$11,275 |
11/19 |
$11,119 |
$11,257 |
12/19 |
$11,317 |
$11,468 |
01/20 |
$11,546 |
$11,667 |
02/20 |
$11,475 |
$11,573 |
03/20 |
$9,774 |
$10,120 |
04/20 |
$10,110 |
$10,342 |
05/20 |
$10,708 |
$10,935 |
06/20 |
$11,036 |
$11,254 |
07/20 |
$11,477 |
$11,670 |
08/20 |
$11,584 |
$11,704 |
09/20 |
$11,399 |
$11,511 |
10/20 |
$11,428 |
$11,497 |
11/20 |
$11,943 |
$11,928 |
12/20 |
$12,212 |
$12,142 |
01/21 |
$12,047 |
$11,995 |
02/21 |
$11,818 |
$11,687 |
03/21 |
$11,640 |
$11,566 |
04/21 |
$11,879 |
$11,787 |
05/21 |
$12,004 |
$11,915 |
06/21 |
$12,089 |
$12,021 |
07/21 |
$12,157 |
$12,086 |
08/21 |
$12,267 |
$12,196 |
09/21 |
$12,034 |
$11,957 |
10/21 |
$12,003 |
$11,964 |
11/21 |
$11,739 |
$11,791 |
12/21 |
$11,934 |
$11,959 |
01/22 |
$11,577 |
$11,613 |
02/22 |
$10,920 |
$10,974 |
03/22 |
$10,888 |
$10,851 |
04/22 |
$10,290 |
$10,257 |
05/22 |
$10,343 |
$10,276 |
06/22 |
$9,652 |
$9,707 |
07/22 |
$9,968 |
$10,017 |
08/22 |
$9,901 |
$9,900 |
09/22 |
$9,246 |
$9,299 |
10/22 |
$9,291 |
$9,306 |
11/22 |
$10,027 |
$9,953 |
12/22 |
$10,054 |
$9,991 |
01/23 |
$10,426 |
$10,302 |
02/23 |
$10,131 |
$10,075 |
03/23 |
$10,242 |
$10,215 |
04/23 |
$10,240 |
$10,267 |
05/23 |
$10,157 |
$10,176 |
06/23 |
$10,373 |
$10,372 |
07/23 |
$10,567 |
$10,539 |
08/23 |
$10,391 |
$10,392 |
09/23 |
$10,121 |
$10,099 |
10/23 |
$10,041 |
$9,953 |
11/23 |
$10,640 |
$10,529 |
12/23 |
$11,123 |
$11,035 |
01/24 |
$11,001 |
$10,905 |
02/24 |
$11,099 |
$10,980 |
03/24 |
$11,307 |
$11,189 |
04/24 |
$11,101 |
$10,965 |
05/24 |
$11,318 |
$11,164 |
06/24 |
$11,342 |
$11,238 |
07/24 |
$11,598 |
$11,443 |
08/24 |
$11,831 |
$11,710 |
09/24 |
$12,052 |
$11,920 |
10/24 |
$11,833 |
$11,706 |
11/24 |
$11,995 |
$11,845 |
12/24 |
$11,831 |
$11,668 |
01/25 |
$12,000 |
$11,811 |
02/25 |
$12,215 |
$12,006 |
03/25 |
$12,112 |
$11,941 |
04/25 |
$12,058 |
$11,931 |
05/25 |
$12,171 |
$12,033 |
06/25 |
$12,441 |
$12,307 |
07/25 |
$12,587 |
$12,452 |
08/25 |
$12,785 |
$12,643 |
09/25 |
$12,946 |
$12,847 |
10/25 |
$13,228 |
$13,130 |
11/25 |
$13,274 |
$13,169 |
12/25 |
$13,373 |
$13,237 |
01/26 |
$13,486 |
$13,311 |
02/26 |
$13,649 |
$13,497 |
03/26 |
$13,199 |
$13,086 |
04/26 |
$13,575 |
$13,417 |
05/26 |
$13,710 |
$13,527 |
06/26 |
$13,765 |
$13,614 |
07/26 |
$13,566 |
$13,404 |
08/26 |
$13,664 |
$13,526 |
|
| Average Annual Return [Table Text Block] |
Table Summary
Average Annual Total Returns (%) |
1 year |
5 years |
10 years |
Institutional 2 Class |
6.87 |
2.18 |
3.17 |
JPMorgan Emerging Markets Bond Index - Global |
6.99 |
2.09 |
3.07 | |
| No Deduction of Taxes [Text Block] |
Performance does not reflect the deduction of taxes that a shareholder may pay on fund distributions or on the redemptions of fund shares.
|
| Updated Performance Information Location [Text Block] |
columbiathreadneedleus.com/investment-products/mutual-funds
|
| AssetsNet |
$ 356,380,433
|
| Holdings Count | Holding |
165
|
| Advisory Fees Paid, Amount |
$ 2,137,317
|
| InvestmentCompanyPortfolioTurnover |
46.00%
|
| Additional Fund Statistics [Text Block] |
Table Summary
Fund net assets |
$356,380,433 |
Total number of portfolio holdings |
165 |
Management services fees (represents 0.60% of Fund average net assets) |
$2,137,317 |
Portfolio turnover for the reporting period |
46% | |
| Holdings [Text Block] |
Table Summary
Mexico |
8.8% |
|
Saudi Arabia |
7.6% |
|
Indonesia |
7.5% |
|
Turkey |
5.3% |
|
United Arab Emirates |
5.1% |
|
Hungary |
4.1% |
|
Colombia |
3.9% |
|
Romania |
3.9% |
|
Chile |
3.8% |
|
United States |
3.7% |
|
Other |
45.7% |
|
Table Summary
Foreign Government Obligations |
88.8% |
Corporate Bonds & Notes |
6.9% |
Money Market Funds |
3.7% |
Other |
0.0%Footnote Reference* |
| Footnote |
Description |
Footnote* |
Percentage rounds to less than 0.1% or (0.1)%. | |
| Largest Holdings [Text Block] |
Table Summary
Romanian Government International Bond 3.625% 03/27/2032 |
3.9% |
Perusahaan Penerbit SBSN Indonesia III 4.700% 06/06/2032 |
3.8% |
Mexico Government International Bond 3.500% 02/12/2034 |
3.3% |
Argentine Republic Government International Bond 2.750% 07/09/2035 |
2.5% |
Saudi Government International Bond 5.625% 01/13/2035 |
2.2% |
Chile Government International Bond 4.950% 01/05/2036 |
2.0% |
DP World PLC 6.850% 07/02/2037 |
1.9% |
Colombian TES 11.750% 01/24/2035 |
1.9% |
Petroleos de Venezuela SA 0.000% 05/16/2024 |
1.9% |
Hungary Government International Bond 2.125% 09/22/2031 |
1.4% | |
| Material Fund Change [Text Block] |
|
| C000122766 |
|
| Shareholder Report [Line Items] |
|
| Fund Name |
Columbia Emerging Markets Bond Fund
|
| Class Name |
Institutional 3 Class
|
| Trading Symbol |
CEBYX
|
| Annual or Semi-Annual Statement [Text Block] |
This annual shareholder report contains important information about Columbia Emerging Markets Bond Fund (the Fund) for the period of September 1, 2025 to August 31, 2026.
|
| Additional Information [Text Block] |
You can find additional information about the Fund at columbiathreadneedleus.com/resources/literature. You can also request more information by contacting us at 1-800-345-6611.
|
| Additional Information Phone Number |
1-800-345-6611
|
| Additional Information Website |
columbiathreadneedleus.com/resources/literature
|
| Expenses [Text Block] |
What were the Fund costs for the reporting period? (Based on a hypothetical $10,000 investment)
Table Summary
Class |
Cost of a $10,000 investment |
Cost paid as a percentage of a $10,000 investment |
Institutional 3 Class |
$70 |
0.68% | |
| Expenses Paid, Amount |
$ 70
|
| Expense Ratio, Percent |
0.68%
|
| Factors Affecting Performance [Text Block] |
Management's Discussion of Fund Performance The performance of Institutional 3 Class shares for the period presented is shown in the Average Annual Total Returns table. Top Performance ContributorsAllocation and selection | Contribution to the Fund’s performance relative to the benchmark was driven primarily by an allocation to and selection within Ukrainian bonds. Also positively contributing to relative performance was an allocation to and selection within China. Finally, selection within and an allocation to Venezuela was also notably positive for the Fund’s relative performance. Rates and currency | Local currency allocations contributed to the Fund’s relative performance. Top Performance DetractorsAllocation and selection | Security selection within Brazil detracted from the Fund’s performance versus the benchmark. Additionally, the Fund’s underweight exposure to Argentina also negatively impacted the Fund’s overall relative performance. An allocation to Turkey also weighed on the Fund’s relative performance. Rates and currency | Positions in local rates and index spread negatively impacted the Fund’s relative performance. Additionally, U.S. rates and trading impacts also detracted from the Fund’s overall performance relative to the benchmark. |
| Performance Past Does Not Indicate Future [Text] |
The Fund's past performance is not a good predictor of the Fund's future performance.
|
| Line Graph [Table Text Block] |
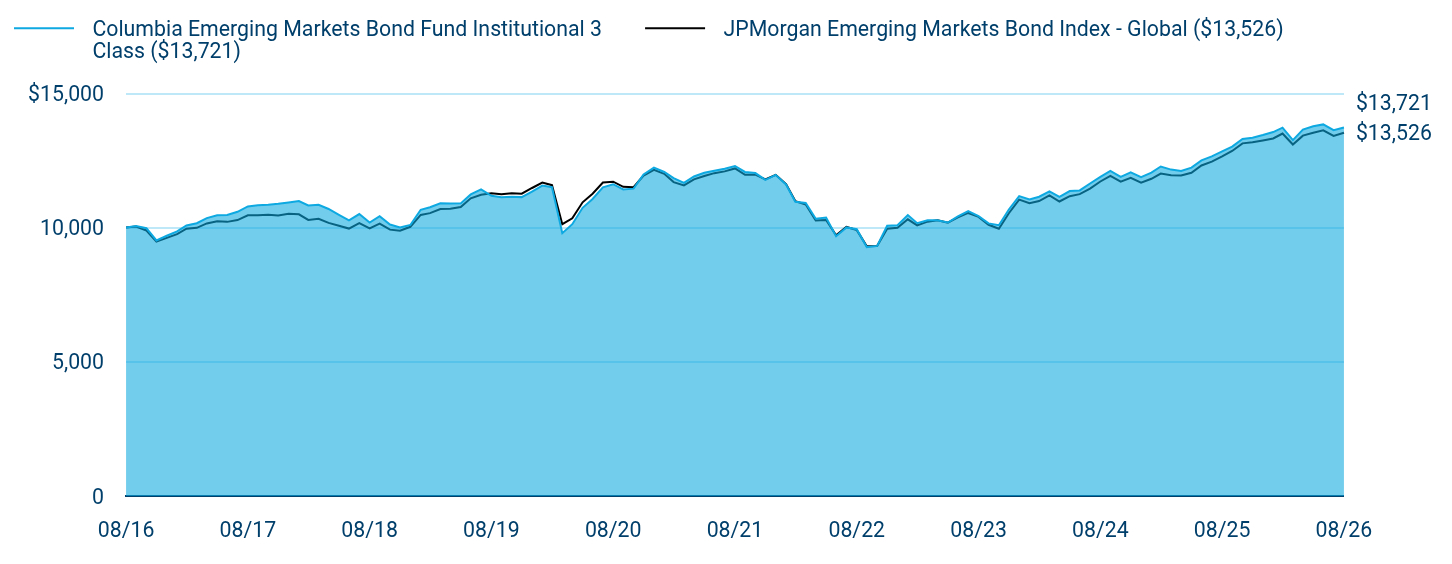
Table Summary
|
Columbia Emerging Markets Bond Fund Institutional 3 Class ($13,721) |
JPMorgan Emerging Markets Bond Index - Global ($13,526) |
08/16 |
$10,000 |
$10,000 |
09/16 |
$10,053 |
$10,034 |
10/16 |
$9,970 |
$9,887 |
11/16 |
$9,516 |
$9,475 |
12/16 |
$9,690 |
$9,611 |
01/17 |
$9,851 |
$9,749 |
02/17 |
$10,073 |
$9,952 |
03/17 |
$10,158 |
$9,986 |
04/17 |
$10,347 |
$10,149 |
05/17 |
$10,454 |
$10,233 |
06/17 |
$10,465 |
$10,207 |
07/17 |
$10,582 |
$10,274 |
08/17 |
$10,780 |
$10,452 |
09/17 |
$10,828 |
$10,450 |
10/17 |
$10,848 |
$10,469 |
11/17 |
$10,878 |
$10,441 |
12/17 |
$10,929 |
$10,507 |
01/18 |
$10,981 |
$10,487 |
02/18 |
$10,820 |
$10,281 |
03/18 |
$10,840 |
$10,320 |
04/18 |
$10,687 |
$10,169 |
05/18 |
$10,467 |
$10,059 |
06/18 |
$10,264 |
$9,957 |
07/18 |
$10,497 |
$10,163 |
08/18 |
$10,183 |
$9,967 |
09/18 |
$10,417 |
$10,144 |
10/18 |
$10,109 |
$9,917 |
11/18 |
$10,000 |
$9,878 |
12/18 |
$10,091 |
$10,023 |
01/19 |
$10,657 |
$10,465 |
02/19 |
$10,752 |
$10,531 |
03/19 |
$10,897 |
$10,684 |
04/19 |
$10,887 |
$10,696 |
05/19 |
$10,895 |
$10,758 |
06/19 |
$11,229 |
$11,085 |
07/19 |
$11,417 |
$11,213 |
08/19 |
$11,180 |
$11,274 |
09/19 |
$11,120 |
$11,233 |
10/19 |
$11,139 |
$11,275 |
11/19 |
$11,128 |
$11,257 |
12/19 |
$11,337 |
$11,468 |
01/20 |
$11,557 |
$11,667 |
02/20 |
$11,497 |
$11,573 |
03/20 |
$9,784 |
$10,120 |
04/20 |
$10,120 |
$10,342 |
05/20 |
$10,730 |
$10,935 |
06/20 |
$11,059 |
$11,254 |
07/20 |
$11,491 |
$11,670 |
08/20 |
$11,608 |
$11,704 |
09/20 |
$11,413 |
$11,511 |
10/20 |
$11,443 |
$11,497 |
11/20 |
$11,969 |
$11,928 |
12/20 |
$12,229 |
$12,142 |
01/21 |
$12,064 |
$11,995 |
02/21 |
$11,835 |
$11,687 |
03/21 |
$11,657 |
$11,566 |
04/21 |
$11,897 |
$11,787 |
05/21 |
$12,034 |
$11,915 |
06/21 |
$12,109 |
$12,021 |
07/21 |
$12,188 |
$12,086 |
08/21 |
$12,288 |
$12,196 |
09/21 |
$12,065 |
$11,957 |
10/21 |
$12,024 |
$11,964 |
11/21 |
$11,771 |
$11,791 |
12/21 |
$11,957 |
$11,959 |
01/22 |
$11,599 |
$11,613 |
02/22 |
$10,953 |
$10,974 |
03/22 |
$10,910 |
$10,851 |
04/22 |
$10,323 |
$10,257 |
05/22 |
$10,365 |
$10,276 |
06/22 |
$9,673 |
$9,707 |
07/22 |
$10,001 |
$10,017 |
08/22 |
$9,934 |
$9,900 |
09/22 |
$9,267 |
$9,299 |
10/22 |
$9,312 |
$9,306 |
11/22 |
$10,062 |
$9,953 |
12/22 |
$10,078 |
$9,991 |
01/23 |
$10,462 |
$10,302 |
02/23 |
$10,155 |
$10,075 |
03/23 |
$10,267 |
$10,215 |
04/23 |
$10,266 |
$10,267 |
05/23 |
$10,183 |
$10,176 |
06/23 |
$10,411 |
$10,372 |
07/23 |
$10,606 |
$10,539 |
08/23 |
$10,419 |
$10,392 |
09/23 |
$10,149 |
$10,099 |
10/23 |
$10,081 |
$9,953 |
11/23 |
$10,669 |
$10,529 |
12/23 |
$11,166 |
$11,035 |
01/24 |
$11,044 |
$10,905 |
02/24 |
$11,144 |
$10,980 |
03/24 |
$11,340 |
$11,189 |
04/24 |
$11,135 |
$10,965 |
05/24 |
$11,353 |
$11,164 |
06/24 |
$11,377 |
$11,238 |
07/24 |
$11,634 |
$11,443 |
08/24 |
$11,881 |
$11,710 |
09/24 |
$12,103 |
$11,920 |
10/24 |
$11,884 |
$11,706 |
11/24 |
$12,047 |
$11,845 |
12/24 |
$11,871 |
$11,668 |
01/25 |
$12,040 |
$11,811 |
02/25 |
$12,269 |
$12,006 |
03/25 |
$12,153 |
$11,941 |
04/25 |
$12,100 |
$11,931 |
05/25 |
$12,227 |
$12,033 |
06/25 |
$12,498 |
$12,307 |
07/25 |
$12,645 |
$12,452 |
08/25 |
$12,832 |
$12,643 |
09/25 |
$13,007 |
$12,847 |
10/25 |
$13,291 |
$13,130 |
11/25 |
$13,338 |
$13,169 |
12/25 |
$13,438 |
$13,237 |
01/26 |
$13,551 |
$13,311 |
02/26 |
$13,716 |
$13,497 |
03/26 |
$13,251 |
$13,086 |
04/26 |
$13,642 |
$13,417 |
05/26 |
$13,765 |
$13,527 |
06/26 |
$13,835 |
$13,614 |
07/26 |
$13,622 |
$13,404 |
08/26 |
$13,721 |
$13,526 |
|
| Average Annual Return [Table Text Block] |
Table Summary
Average Annual Total Returns (%) |
1 year |
5 years |
10 years |
Institutional 3 Class |
6.93 |
2.23 |
3.21 |
JPMorgan Emerging Markets Bond Index - Global |
6.99 |
2.09 |
3.07 | |
| No Deduction of Taxes [Text Block] |
Performance does not reflect the deduction of taxes that a shareholder may pay on fund distributions or on the redemptions of fund shares.
|
| Updated Performance Information Location [Text Block] |
columbiathreadneedleus.com/investment-products/mutual-funds
|
| AssetsNet |
$ 356,380,433
|
| Holdings Count | Holding |
165
|
| Advisory Fees Paid, Amount |
$ 2,137,317
|
| InvestmentCompanyPortfolioTurnover |
46.00%
|
| Additional Fund Statistics [Text Block] |
Table Summary
Fund net assets |
$356,380,433 |
Total number of portfolio holdings |
165 |
Management services fees (represents 0.60% of Fund average net assets) |
$2,137,317 |
Portfolio turnover for the reporting period |
46% | |
| Holdings [Text Block] |
Table Summary
Mexico |
8.8% |
|
Saudi Arabia |
7.6% |
|
Indonesia |
7.5% |
|
Turkey |
5.3% |
|
United Arab Emirates |
5.1% |
|
Hungary |
4.1% |
|
Colombia |
3.9% |
|
Romania |
3.9% |
|
Chile |
3.8% |
|
United States |
3.7% |
|
Other |
45.7% |
|
Table Summary
Foreign Government Obligations |
88.8% |
Corporate Bonds & Notes |
6.9% |
Money Market Funds |
3.7% |
Other |
0.0%Footnote Reference* |
| Footnote |
Description |
Footnote* |
Percentage rounds to less than 0.1% or (0.1)%. | |
| Largest Holdings [Text Block] |
Table Summary
Romanian Government International Bond 3.625% 03/27/2032 |
3.9% |
Perusahaan Penerbit SBSN Indonesia III 4.700% 06/06/2032 |
3.8% |
Mexico Government International Bond 3.500% 02/12/2034 |
3.3% |
Argentine Republic Government International Bond 2.750% 07/09/2035 |
2.5% |
Saudi Government International Bond 5.625% 01/13/2035 |
2.2% |
Chile Government International Bond 4.950% 01/05/2036 |
2.0% |
DP World PLC 6.850% 07/02/2037 |
1.9% |
Colombian TES 11.750% 01/24/2035 |
1.9% |
Petroleos de Venezuela SA 0.000% 05/16/2024 |
1.9% |
Hungary Government International Bond 2.125% 09/22/2031 |
1.4% | |
| Material Fund Change [Text Block] |
|
| C000109803 |
|
| Shareholder Report [Line Items] |
|
| Fund Name |
Columbia Emerging Markets Bond Fund
|
| Class Name |
Class R
|
| Trading Symbol |
CMBRX
|
| Annual or Semi-Annual Statement [Text Block] |
This annual shareholder report contains important information about Columbia Emerging Markets Bond Fund (the Fund) for the period of September 1, 2025 to August 31, 2026.
|
| Additional Information [Text Block] |
You can find additional information about the Fund at columbiathreadneedleus.com/resources/literature. You can also request more information by contacting us at 1-800-345-6611.
|
| Additional Information Phone Number |
1-800-345-6611
|
| Additional Information Website |
columbiathreadneedleus.com/resources/literature
|
| Expenses [Text Block] |
What were the Fund costs for the reporting period? (Based on a hypothetical $10,000 investment)
Table Summary
Class |
Cost of a $10,000 investment |
Cost paid as a percentage of a $10,000 investment |
Class R |
$140 |
1.36% | |
| Expenses Paid, Amount |
$ 140
|
| Expense Ratio, Percent |
1.36%
|
| Factors Affecting Performance [Text Block] |
Management's Discussion of Fund Performance The performance of Class R shares for the period presented is shown in the Average Annual Total Returns table. Top Performance ContributorsAllocation and selection | Contribution to the Fund’s performance relative to the benchmark was driven primarily by an allocation to and selection within Ukrainian bonds. Also positively contributing to relative performance was an allocation to and selection within China. Finally, selection within and an allocation to Venezuela was also notably positive for the Fund’s relative performance. Rates and currency | Local currency allocations contributed to the Fund’s relative performance. Top Performance DetractorsAllocation and selection | Security selection within Brazil detracted from the Fund’s performance versus the benchmark. Additionally, the Fund’s underweight exposure to Argentina also negatively impacted the Fund’s overall relative performance. An allocation to Turkey also weighed on the Fund’s relative performance. Rates and currency | Positions in local rates and index spread negatively impacted the Fund’s relative performance. Additionally, U.S. rates and trading impacts also detracted from the Fund’s overall performance relative to the benchmark. |
| Performance Past Does Not Indicate Future [Text] |
The Fund's past performance is not a good predictor of the Fund's future performance.
|
| Line Graph [Table Text Block] |
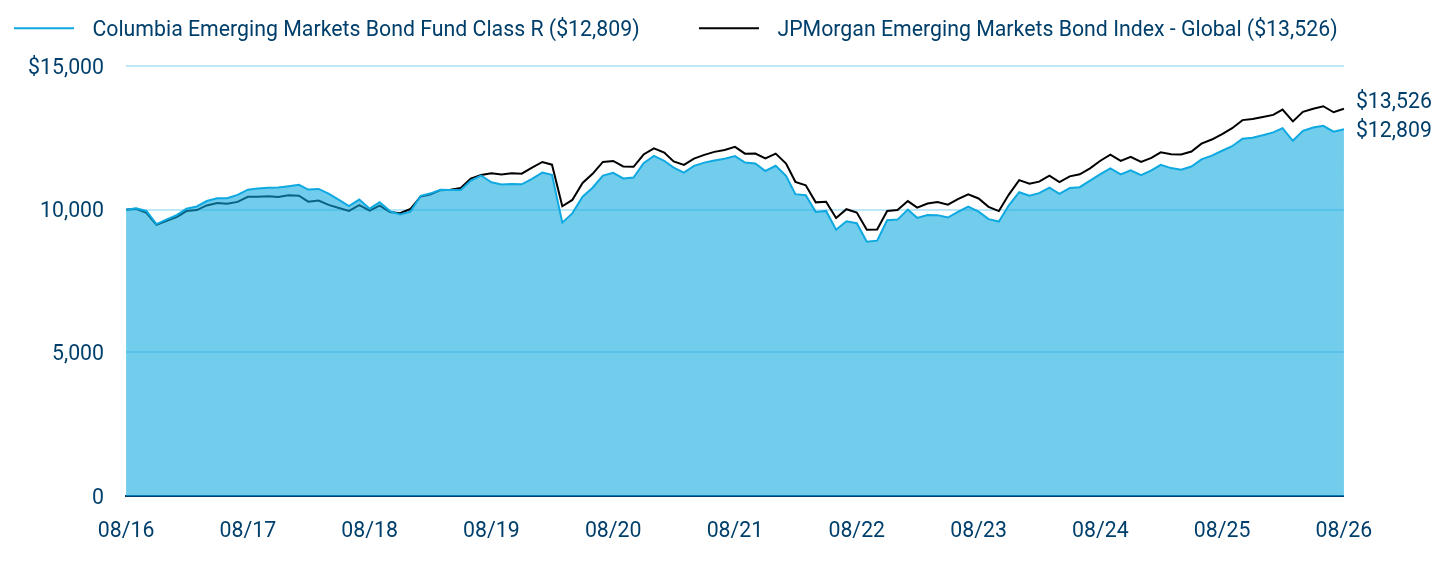
Table Summary
|
Columbia Emerging Markets Bond Fund Class R ($12,809) |
JPMorgan Emerging Markets Bond Index - Global ($13,526) |
08/16 |
$10,000 |
$10,000 |
09/16 |
$10,047 |
$10,034 |
10/16 |
$9,957 |
$9,887 |
11/16 |
$9,497 |
$9,475 |
12/16 |
$9,665 |
$9,611 |
01/17 |
$9,819 |
$9,749 |
02/17 |
$10,035 |
$9,952 |
03/17 |
$10,113 |
$9,986 |
04/17 |
$10,304 |
$10,149 |
05/17 |
$10,396 |
$10,233 |
06/17 |
$10,400 |
$10,207 |
07/17 |
$10,519 |
$10,274 |
08/17 |
$10,700 |
$10,452 |
09/17 |
$10,741 |
$10,450 |
10/17 |
$10,764 |
$10,469 |
11/17 |
$10,778 |
$10,441 |
12/17 |
$10,822 |
$10,507 |
01/18 |
$10,868 |
$10,487 |
02/18 |
$10,703 |
$10,281 |
03/18 |
$10,725 |
$10,320 |
04/18 |
$10,559 |
$10,169 |
05/18 |
$10,344 |
$10,059 |
06/18 |
$10,128 |
$9,957 |
07/18 |
$10,353 |
$10,163 |
08/18 |
$10,036 |
$9,967 |
09/18 |
$10,261 |
$10,144 |
10/18 |
$9,951 |
$9,917 |
11/18 |
$9,838 |
$9,878 |
12/18 |
$9,932 |
$10,023 |
01/19 |
$10,484 |
$10,465 |
02/19 |
$10,563 |
$10,531 |
03/19 |
$10,699 |
$10,684 |
04/19 |
$10,692 |
$10,696 |
05/19 |
$10,685 |
$10,758 |
06/19 |
$11,016 |
$11,085 |
07/19 |
$11,194 |
$11,213 |
08/19 |
$10,956 |
$11,274 |
09/19 |
$10,881 |
$11,233 |
10/19 |
$10,894 |
$11,275 |
11/19 |
$10,887 |
$11,257 |
12/19 |
$11,075 |
$11,468 |
01/20 |
$11,295 |
$11,667 |
02/20 |
$11,219 |
$11,573 |
03/20 |
$9,549 |
$10,120 |
04/20 |
$9,872 |
$10,342 |
05/20 |
$10,452 |
$10,935 |
06/20 |
$10,767 |
$11,254 |
07/20 |
$11,192 |
$11,670 |
08/20 |
$11,290 |
$11,704 |
09/20 |
$11,093 |
$11,511 |
10/20 |
$11,126 |
$11,497 |
11/20 |
$11,622 |
$11,928 |
12/20 |
$11,878 |
$12,142 |
01/21 |
$11,710 |
$11,995 |
02/21 |
$11,472 |
$11,687 |
03/21 |
$11,293 |
$11,566 |
04/21 |
$11,530 |
$11,787 |
05/21 |
$11,645 |
$11,915 |
06/21 |
$11,721 |
$12,021 |
07/21 |
$11,781 |
$12,086 |
08/21 |
$11,872 |
$12,196 |
09/21 |
$11,649 |
$11,957 |
10/21 |
$11,613 |
$11,964 |
11/21 |
$11,352 |
$11,791 |
12/21 |
$11,535 |
$11,959 |
01/22 |
$11,183 |
$11,613 |
02/22 |
$10,543 |
$10,974 |
03/22 |
$10,506 |
$10,851 |
04/22 |
$9,924 |
$10,257 |
05/22 |
$9,958 |
$10,276 |
06/22 |
$9,298 |
$9,707 |
07/22 |
$9,597 |
$10,017 |
08/22 |
$9,527 |
$9,900 |
09/22 |
$8,881 |
$9,299 |
10/22 |
$8,919 |
$9,306 |
11/22 |
$9,633 |
$9,953 |
12/22 |
$9,654 |
$9,991 |
01/23 |
$10,005 |
$10,302 |
02/23 |
$9,716 |
$10,075 |
03/23 |
$9,818 |
$10,215 |
04/23 |
$9,810 |
$10,267 |
05/23 |
$9,726 |
$10,176 |
06/23 |
$9,927 |
$10,372 |
07/23 |
$10,107 |
$10,539 |
08/23 |
$9,933 |
$10,392 |
09/23 |
$9,670 |
$10,099 |
10/23 |
$9,588 |
$9,953 |
11/23 |
$10,155 |
$10,529 |
12/23 |
$10,611 |
$11,035 |
01/24 |
$10,489 |
$10,905 |
02/24 |
$10,578 |
$10,980 |
03/24 |
$10,770 |
$11,189 |
04/24 |
$10,557 |
$10,965 |
05/24 |
$10,758 |
$11,164 |
06/24 |
$10,787 |
$11,238 |
07/24 |
$11,013 |
$11,443 |
08/24 |
$11,241 |
$11,710 |
09/24 |
$11,444 |
$11,920 |
10/24 |
$11,231 |
$11,706 |
11/24 |
$11,379 |
$11,845 |
12/24 |
$11,205 |
$11,668 |
01/25 |
$11,371 |
$11,811 |
02/25 |
$11,569 |
$12,006 |
03/25 |
$11,454 |
$11,941 |
04/25 |
$11,397 |
$11,931 |
05/25 |
$11,510 |
$12,033 |
06/25 |
$11,759 |
$12,307 |
07/25 |
$11,891 |
$12,452 |
08/25 |
$12,060 |
$12,643 |
09/25 |
$12,218 |
$12,847 |
10/25 |
$12,478 |
$13,130 |
11/25 |
$12,515 |
$13,169 |
12/25 |
$12,602 |
$13,237 |
01/26 |
$12,701 |
$13,311 |
02/26 |
$12,849 |
$13,497 |
03/26 |
$12,406 |
$13,086 |
04/26 |
$12,753 |
$13,417 |
05/26 |
$12,873 |
$13,527 |
06/26 |
$12,931 |
$13,614 |
07/26 |
$12,724 |
$13,404 |
08/26 |
$12,809 |
$13,526 |
|
| Average Annual Return [Table Text Block] |
Table Summary
Average Annual Total Returns (%) |
1 year |
5 years |
10 years |
Class R |
6.22 |
1.53 |
2.51 |
JPMorgan Emerging Markets Bond Index - Global |
6.99 |
2.09 |
3.07 | |
| No Deduction of Taxes [Text Block] |
Performance does not reflect the deduction of taxes that a shareholder may pay on fund distributions or on the redemptions of fund shares.
|
| Updated Performance Information Location [Text Block] |
columbiathreadneedleus.com/investment-products/mutual-funds
|
| AssetsNet |
$ 356,380,433
|
| Holdings Count | Holding |
165
|
| Advisory Fees Paid, Amount |
$ 2,137,317
|
| InvestmentCompanyPortfolioTurnover |
46.00%
|
| Additional Fund Statistics [Text Block] |
Table Summary
Fund net assets |
$356,380,433 |
Total number of portfolio holdings |
165 |
Management services fees (represents 0.60% of Fund average net assets) |
$2,137,317 |
Portfolio turnover for the reporting period |
46% | |
| Holdings [Text Block] |
Table Summary
Mexico |
8.8% |
|
Saudi Arabia |
7.6% |
|
Indonesia |
7.5% |
|
Turkey |
5.3% |
|
United Arab Emirates |
5.1% |
|
Hungary |
4.1% |
|
Colombia |
3.9% |
|
Romania |
3.9% |
|
Chile |
3.8% |
|
United States |
3.7% |
|
Other |
45.7% |
|
Table Summary
Foreign Government Obligations |
88.8% |
Corporate Bonds & Notes |
6.9% |
Money Market Funds |
3.7% |
Other |
0.0%Footnote Reference* |
| Footnote |
Description |
Footnote* |
Percentage rounds to less than 0.1% or (0.1)%. | |
| Largest Holdings [Text Block] |
Table Summary
Romanian Government International Bond 3.625% 03/27/2032 |
3.9% |
Perusahaan Penerbit SBSN Indonesia III 4.700% 06/06/2032 |
3.8% |
Mexico Government International Bond 3.500% 02/12/2034 |
3.3% |
Argentine Republic Government International Bond 2.750% 07/09/2035 |
2.5% |
Saudi Government International Bond 5.625% 01/13/2035 |
2.2% |
Chile Government International Bond 4.950% 01/05/2036 |
2.0% |
DP World PLC 6.850% 07/02/2037 |
1.9% |
Colombian TES 11.750% 01/24/2035 |
1.9% |
Petroleos de Venezuela SA 0.000% 05/16/2024 |
1.9% |
Hungary Government International Bond 2.125% 09/22/2031 |
1.4% | |
| Material Fund Change [Text Block] |
|
| C000231675 |
|
| Shareholder Report [Line Items] |
|
| Fund Name |
Columbia Integrated Small Cap Growth Fund
|
| Class Name |
Class A
|
| Trading Symbol |
ISGDX
|
| Annual or Semi-Annual Statement [Text Block] |
This annual shareholder report contains important information about Columbia Integrated Small Cap Growth Fund (the Fund) for the period of September 1, 2025 to August 31, 2026.
|
| Additional Information [Text Block] |
You can find additional information about the Fund at columbiathreadneedleus.com/resources/literature. You can also request more information by contacting us at 1-800-345-6611.
|
| Additional Information Phone Number |
1-800-345-6611
|
| Additional Information Website |
columbiathreadneedleus.com/resources/literature
|
| Expenses [Text Block] |
What were the Fund costs for the reporting period? (Based on a hypothetical $10,000 investment)
Table Summary
Class |
Cost of a $10,000 investment |
Cost paid as a percentage of a $10,000 investment |
Class A |
$137 |
1.20% | |
| Expenses Paid, Amount |
$ 137
|
| Expense Ratio, Percent |
1.20%
|
| Factors Affecting Performance [Text Block] |
Management's Discussion of Fund Performance The performance of Class A shares for the period presented is shown in the Average Annual Total Returns table. Top Performance ContributorsStock selection | Security selection contributed meaningfully to Fund performance relative to the benchmark across most sectors. Stock selection within the communication services, industrials and consumer discretionary sectors generated the largest positive contributions. Allocations | From a sector allocation perspective, the Fund benefited from underweight positions in the consumer staples and utilities sectors. Individual holdings | Overweight positions in Bandwidth, Revolution Medicines, and Planet Labs PBC were among the largest contributors to relative performance. These investments benefited from strong company-specific fundamentals and favorable market reception during the period. Top Performance DetractorsStock selection | Security selection detracted from Fund performance relative to the benchmark in only two sectors - consumer staples and health care. Allocations | Overweight exposures to the consumer discretionary, industrials and financials sectors detracted from relative performance. Individual holdings | Overweight positions in Vital Farms and Phreesia were the most significant individual detractors from the Fund’s relative performance. |
| Performance Past Does Not Indicate Future [Text] |
The Fund's past performance is not a good predictor of the Fund's future performance.
|
| Line Graph [Table Text Block] |
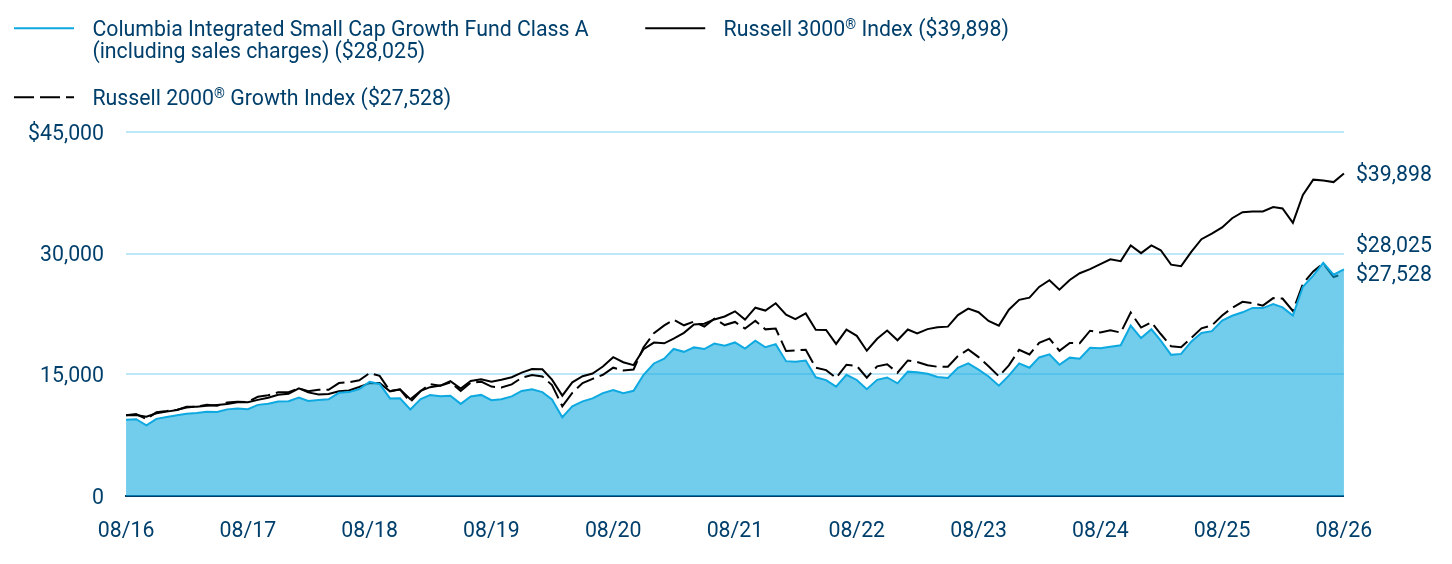
Table Summary
|
Columbia Integrated Small Cap Growth Fund Class A (including sales charges) ($28,025) |
Russell 3000® Index ($39,898) |
Russell 2000® Growth Index ($27,528) |
08/16 |
$9,427 |
$10,000 |
$10,000 |
09/16 |
$9,493 |
$10,016 |
$10,144 |
10/16 |
$8,743 |
$9,799 |
$9,514 |
11/16 |
$9,540 |
$10,238 |
$10,365 |
12/16 |
$9,771 |
$10,437 |
$10,506 |
01/17 |
$9,995 |
$10,634 |
$10,677 |
02/17 |
$10,180 |
$11,029 |
$10,939 |
03/17 |
$10,263 |
$11,037 |
$11,068 |
04/17 |
$10,414 |
$11,154 |
$11,272 |
05/17 |
$10,406 |
$11,268 |
$11,169 |
06/17 |
$10,716 |
$11,370 |
$11,554 |
07/17 |
$10,827 |
$11,584 |
$11,652 |
08/17 |
$10,745 |
$11,606 |
$11,639 |
09/17 |
$11,272 |
$11,889 |
$12,272 |
10/17 |
$11,424 |
$12,149 |
$12,462 |
11/17 |
$11,687 |
$12,518 |
$12,820 |
12/17 |
$11,734 |
$12,643 |
$12,835 |
01/18 |
$12,172 |
$13,309 |
$13,335 |
02/18 |
$11,760 |
$12,819 |
$12,956 |
03/18 |
$11,864 |
$12,561 |
$13,130 |
04/18 |
$11,956 |
$12,609 |
$13,143 |
05/18 |
$12,761 |
$12,965 |
$13,970 |
06/18 |
$12,853 |
$13,050 |
$14,080 |
07/18 |
$13,239 |
$13,483 |
$14,322 |
08/18 |
$14,135 |
$13,956 |
$15,213 |
09/18 |
$13,860 |
$13,979 |
$14,857 |
10/18 |
$12,067 |
$12,950 |
$12,977 |
11/18 |
$12,093 |
$13,209 |
$13,180 |
12/18 |
$10,695 |
$11,980 |
$11,640 |
01/19 |
$11,995 |
$13,008 |
$12,985 |
02/19 |
$12,483 |
$13,466 |
$13,823 |
03/19 |
$12,328 |
$13,662 |
$13,636 |
04/19 |
$12,398 |
$14,208 |
$14,051 |
05/19 |
$11,392 |
$13,289 |
$13,009 |
06/19 |
$12,313 |
$14,222 |
$14,011 |
07/19 |
$12,506 |
$14,433 |
$14,148 |
08/19 |
$11,856 |
$14,139 |
$13,537 |
09/19 |
$11,980 |
$14,387 |
$13,426 |
10/19 |
$12,320 |
$14,697 |
$13,808 |
11/19 |
$12,994 |
$15,256 |
$14,621 |
12/19 |
$13,214 |
$15,696 |
$14,956 |
01/20 |
$12,852 |
$15,679 |
$14,791 |
02/20 |
$11,953 |
$14,395 |
$13,723 |
03/20 |
$9,747 |
$12,416 |
$11,103 |
04/20 |
$11,094 |
$14,060 |
$12,756 |
05/20 |
$11,701 |
$14,812 |
$13,962 |
06/20 |
$12,072 |
$15,151 |
$14,498 |
07/20 |
$12,734 |
$16,011 |
$14,996 |
08/20 |
$13,113 |
$17,171 |
$15,876 |
09/20 |
$12,711 |
$16,546 |
$15,536 |
10/20 |
$13,010 |
$16,188 |
$15,654 |
11/20 |
$14,988 |
$18,158 |
$18,414 |
12/20 |
$16,395 |
$18,975 |
$20,135 |
01/21 |
$16,984 |
$18,890 |
$21,106 |
02/21 |
$18,188 |
$19,481 |
$21,803 |
03/21 |
$17,836 |
$20,179 |
$21,117 |
04/21 |
$18,384 |
$21,219 |
$21,578 |
05/21 |
$18,179 |
$21,316 |
$20,961 |
06/21 |
$18,854 |
$21,842 |
$21,944 |
07/21 |
$18,584 |
$22,211 |
$21,145 |
08/21 |
$18,993 |
$22,845 |
$21,529 |
09/21 |
$18,248 |
$21,820 |
$20,704 |
10/21 |
$19,214 |
$23,295 |
$21,673 |
11/21 |
$18,404 |
$22,941 |
$20,615 |
12/21 |
$18,786 |
$23,844 |
$20,706 |
01/22 |
$16,682 |
$22,441 |
$17,931 |
02/22 |
$16,621 |
$21,876 |
$18,009 |
03/22 |
$16,756 |
$22,585 |
$18,092 |
04/22 |
$14,684 |
$20,558 |
$15,872 |
05/22 |
$14,341 |
$20,531 |
$15,572 |
06/22 |
$13,532 |
$18,813 |
$14,608 |
07/22 |
$14,991 |
$20,578 |
$16,244 |
08/22 |
$14,353 |
$19,810 |
$16,091 |
09/22 |
$13,213 |
$17,973 |
$14,644 |
10/22 |
$14,365 |
$19,447 |
$16,033 |
11/22 |
$14,660 |
$20,462 |
$16,295 |
12/22 |
$13,935 |
$19,264 |
$15,249 |
01/23 |
$15,383 |
$20,591 |
$16,765 |
02/23 |
$15,319 |
$20,110 |
$16,584 |
03/23 |
$15,112 |
$20,647 |
$16,175 |
04/23 |
$14,724 |
$20,867 |
$15,987 |
05/23 |
$14,595 |
$20,949 |
$15,990 |
06/23 |
$15,849 |
$22,379 |
$17,315 |
07/23 |
$16,404 |
$23,181 |
$18,125 |
08/23 |
$15,629 |
$22,734 |
$17,181 |
09/23 |
$14,789 |
$21,651 |
$16,048 |
10/23 |
$13,651 |
$21,077 |
$14,810 |
11/23 |
$14,892 |
$23,042 |
$16,159 |
12/23 |
$16,404 |
$24,265 |
$18,094 |
01/24 |
$15,861 |
$24,534 |
$17,514 |
02/24 |
$17,141 |
$25,862 |
$18,936 |
03/24 |
$17,529 |
$26,696 |
$19,466 |
04/24 |
$16,236 |
$25,521 |
$17,967 |
05/24 |
$17,115 |
$26,727 |
$18,929 |
06/24 |
$16,973 |
$27,554 |
$18,897 |
07/24 |
$18,343 |
$28,066 |
$20,444 |
08/24 |
$18,279 |
$28,677 |
$20,218 |
09/24 |
$18,473 |
$29,271 |
$20,487 |
10/24 |
$18,641 |
$29,056 |
$20,215 |
11/24 |
$21,071 |
$30,989 |
$22,693 |
12/24 |
$19,531 |
$30,041 |
$20,836 |
01/25 |
$20,624 |
$30,990 |
$21,494 |
02/25 |
$19,221 |
$30,396 |
$20,039 |
03/25 |
$17,463 |
$28,623 |
$18,520 |
04/25 |
$17,581 |
$28,431 |
$18,401 |
05/25 |
$19,117 |
$30,233 |
$19,582 |
06/25 |
$20,166 |
$31,769 |
$20,736 |
07/25 |
$20,388 |
$32,469 |
$21,089 |
08/25 |
$21,703 |
$33,220 |
$22,336 |
09/25 |
$22,294 |
$34,366 |
$23,264 |
10/25 |
$22,722 |
$35,103 |
$24,017 |
11/25 |
$23,269 |
$35,199 |
$23,853 |
12/25 |
$23,243 |
$35,192 |
$23,547 |
01/26 |
$23,737 |
$35,738 |
$24,483 |
02/26 |
$23,331 |
$35,568 |
$24,424 |
03/26 |
$22,325 |
$33,800 |
$22,886 |
04/26 |
$25,890 |
$37,248 |
$26,248 |
05/26 |
$27,267 |
$39,135 |
$27,781 |
06/26 |
$28,837 |
$39,015 |
$28,769 |
07/26 |
$27,372 |
$38,833 |
$27,083 |
08/26 |
$28,025 |
$39,898 |
$27,528 |
|
| Average Annual Return [Table Text Block] |
Table Summary
Average Annual Total Returns (%) |
1 year |
5 years |
10 years |
Class A (excluding sales charges)Footnote Reference(a)Footnote Reference(b) |
29.13 |
8.09 |
11.51 |
Class A (including sales charges)Footnote Reference(a)Footnote Reference(b) |
21.68 |
6.81 |
10.86 |
Russell 3000® Index |
20.10 |
11.80 |
14.84 |
Russell 2000® Growth Index |
23.25 |
5.04 |
10.66 | |
| No Deduction of Taxes [Text Block] |
Performance does not reflect the deduction of taxes that a shareholder may pay on fund distributions or on the redemptions of fund shares.
|
| Updated Performance Information Location [Text Block] |
columbiathreadneedleus.com/investment-products/mutual-funds
|
| AssetsNet |
$ 33,423,918
|
| Holdings Count | Holding |
154
|
| Advisory Fees Paid, Amount |
$ 253,293
|
| InvestmentCompanyPortfolioTurnover |
110.00%
|
| Additional Fund Statistics [Text Block] |
Table Summary
Fund net assets |
$33,423,918 |
Total number of portfolio holdings |
154 |
Management services fees (represents 0.85% of Fund average net assets) |
$253,293 |
Portfolio turnover for the reporting period |
110% | |
| Holdings [Text Block] |
Table Summary
Health Care |
30.8% |
Information Technology |
16.9% |
Industrials |
13.9% |
Financials |
11.7% |
Consumer Discretionary |
10.3% |
Energy |
7.0% |
Materials |
5.1% |
Real Estate |
1.7% |
Communication Services |
1.6% |
Consumer Staples |
0.2% |
Table Summary
Common Stocks |
99.2% |
Other |
0.9% | |
| Largest Holdings [Text Block] |
Table Summary
Bowman Consulting Group Ltd. |
2.0% |
AtriCure, Inc. |
1.8% |
Remitly Global, Inc. |
1.7% |
Par Pacific Holdings, Inc. |
1.7% |
Freshworks, Inc., Class A |
1.7% |
Vertex, Inc., Class A |
1.6% |
Acadian Asset Management, Inc. |
1.6% |
SSR Mining, Inc. |
1.6% |
Steven Madden Ltd. |
1.4% |
Revolution Medicines, Inc. |
1.4% | |
| Material Fund Change [Text Block] |
|
| C000231678 |
|
| Shareholder Report [Line Items] |
|
| Fund Name |
Columbia Integrated Small Cap Growth Fund
|
| Class Name |
Institutional Class
|
| Trading Symbol |
ISGNX
|
| Annual or Semi-Annual Statement [Text Block] |
This annual shareholder report contains important information about Columbia Integrated Small Cap Growth Fund (the Fund) for the period of September 1, 2025 to August 31, 2026.
|
| Additional Information [Text Block] |
You can find additional information about the Fund at columbiathreadneedleus.com/resources/literature. You can also request more information by contacting us at 1-800-345-6611.
|
| Additional Information Phone Number |
1-800-345-6611
|
| Additional Information Website |
columbiathreadneedleus.com/resources/literature
|
| Expenses [Text Block] |
What were the Fund costs for the reporting period? (Based on a hypothetical $10,000 investment)
Table Summary
Class |
Cost of a $10,000 investment |
Cost paid as a percentage of a $10,000 investment |
Institutional Class |
$114 |
0.99% | |
| Expenses Paid, Amount |
$ 114
|
| Expense Ratio, Percent |
0.99%
|
| Factors Affecting Performance [Text Block] |
Management's Discussion of Fund Performance The performance of Institutional Class shares for the period presented is shown in the Average Annual Total Returns table. Top Performance ContributorsStock selection | Security selection contributed meaningfully to Fund performance relative to the benchmark across most sectors. Stock selection within the communication services, industrials and consumer discretionary sectors generated the largest positive contributions. Allocations | From a sector allocation perspective, the Fund benefited from underweight positions in the consumer staples and utilities sectors. Individual holdings | Overweight positions in Bandwidth, Revolution Medicines, and Planet Labs PBC were among the largest contributors to relative performance. These investments benefited from strong company-specific fundamentals and favorable market reception during the period. Top Performance DetractorsStock selection | Security selection detracted from Fund performance relative to the benchmark in only two sectors - consumer staples and health care. Allocations | Overweight exposures to the consumer discretionary, industrials and financials sectors detracted from relative performance. Individual holdings | Overweight positions in Vital Farms and Phreesia were the most significant individual detractors from the Fund’s relative performance. |
| Performance Past Does Not Indicate Future [Text] |
The Fund's past performance is not a good predictor of the Fund's future performance.
|
| Line Graph [Table Text Block] |
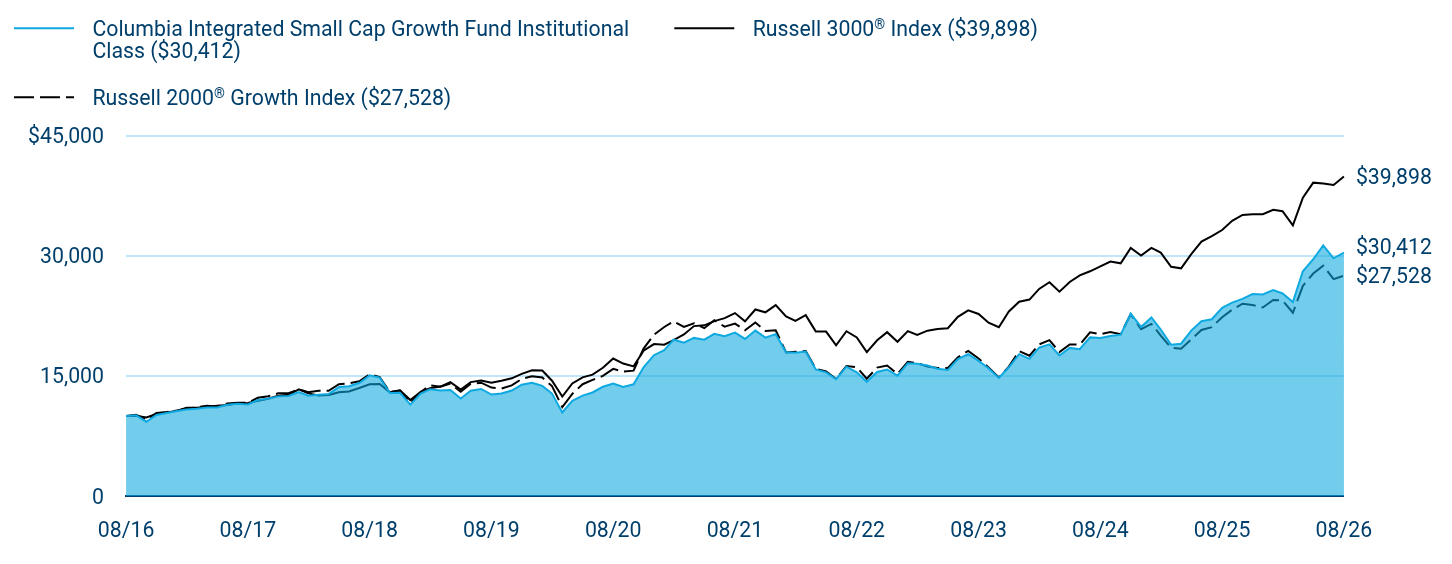
Table Summary
|
Columbia Integrated Small Cap Growth Fund Institutional Class ($30,412) |
Russell 3000® Index ($39,898) |
Russell 2000® Growth Index ($27,528) |
08/16 |
$10,000 |
$10,000 |
$10,000 |
09/16 |
$10,072 |
$10,016 |
$10,144 |
10/16 |
$9,278 |
$9,799 |
$9,514 |
11/16 |
$10,126 |
$10,238 |
$10,365 |
12/16 |
$10,373 |
$10,437 |
$10,506 |
01/17 |
$10,614 |
$10,634 |
$10,677 |
02/17 |
$10,812 |
$11,029 |
$10,939 |
03/17 |
$10,903 |
$11,037 |
$11,068 |
04/17 |
$11,065 |
$11,154 |
$11,272 |
05/17 |
$11,059 |
$11,268 |
$11,169 |
06/17 |
$11,390 |
$11,370 |
$11,554 |
07/17 |
$11,516 |
$11,584 |
$11,652 |
08/17 |
$11,432 |
$11,606 |
$11,639 |
09/17 |
$11,992 |
$11,889 |
$12,272 |
10/17 |
$12,160 |
$12,149 |
$12,462 |
11/17 |
$12,443 |
$12,518 |
$12,820 |
12/17 |
$12,497 |
$12,643 |
$12,835 |
01/18 |
$12,966 |
$13,309 |
$13,335 |
02/18 |
$12,524 |
$12,819 |
$12,956 |
03/18 |
$12,638 |
$12,561 |
$13,130 |
04/18 |
$12,738 |
$12,609 |
$13,143 |
05/18 |
$13,603 |
$12,965 |
$13,970 |
06/18 |
$13,704 |
$13,050 |
$14,080 |
07/18 |
$14,113 |
$13,483 |
$14,322 |
08/18 |
$15,071 |
$13,956 |
$15,213 |
09/18 |
$14,783 |
$13,979 |
$14,857 |
10/18 |
$12,872 |
$12,950 |
$12,977 |
11/18 |
$12,906 |
$13,209 |
$13,180 |
12/18 |
$11,420 |
$11,980 |
$11,640 |
01/19 |
$12,805 |
$13,008 |
$12,985 |
02/19 |
$13,325 |
$13,466 |
$13,823 |
03/19 |
$13,167 |
$13,662 |
$13,636 |
04/19 |
$13,246 |
$14,208 |
$14,051 |
05/19 |
$12,168 |
$13,289 |
$13,009 |
06/19 |
$13,159 |
$14,222 |
$14,011 |
07/19 |
$13,372 |
$14,433 |
$14,148 |
08/19 |
$12,671 |
$14,139 |
$13,537 |
09/19 |
$12,813 |
$14,387 |
$13,426 |
10/19 |
$13,175 |
$14,697 |
$13,808 |
11/19 |
$13,907 |
$15,256 |
$14,621 |
12/19 |
$14,139 |
$15,696 |
$14,956 |
01/20 |
$13,755 |
$15,679 |
$14,791 |
02/20 |
$12,794 |
$14,395 |
$13,723 |
03/20 |
$10,440 |
$12,416 |
$11,103 |
04/20 |
$11,881 |
$14,060 |
$12,756 |
05/20 |
$12,538 |
$14,812 |
$13,962 |
06/20 |
$12,931 |
$15,151 |
$14,498 |
07/20 |
$13,643 |
$16,011 |
$14,996 |
08/20 |
$14,052 |
$17,171 |
$15,876 |
09/20 |
$13,627 |
$16,546 |
$15,536 |
10/20 |
$13,948 |
$16,188 |
$15,654 |
11/20 |
$16,069 |
$18,158 |
$18,414 |
12/20 |
$17,587 |
$18,975 |
$20,135 |
01/21 |
$18,218 |
$18,890 |
$21,106 |
02/21 |
$19,521 |
$19,481 |
$21,803 |
03/21 |
$19,147 |
$20,179 |
$21,117 |
04/21 |
$19,745 |
$21,219 |
$21,578 |
05/21 |
$19,529 |
$21,316 |
$20,961 |
06/21 |
$20,255 |
$21,842 |
$21,944 |
07/21 |
$19,964 |
$22,211 |
$21,145 |
08/21 |
$20,413 |
$22,845 |
$21,529 |
09/21 |
$19,616 |
$21,820 |
$20,704 |
10/21 |
$20,662 |
$23,295 |
$21,673 |
11/21 |
$19,782 |
$22,941 |
$20,615 |
12/21 |
$20,213 |
$23,844 |
$20,706 |
01/22 |
$17,951 |
$22,441 |
$17,931 |
02/22 |
$17,880 |
$21,876 |
$18,009 |
03/22 |
$18,035 |
$22,585 |
$18,092 |
04/22 |
$15,813 |
$20,558 |
$15,872 |
05/22 |
$15,443 |
$20,531 |
$15,572 |
06/22 |
$14,583 |
$18,813 |
$14,608 |
07/22 |
$16,148 |
$20,578 |
$16,244 |
08/22 |
$15,455 |
$19,810 |
$16,091 |
09/22 |
$14,249 |
$17,973 |
$14,644 |
10/22 |
$15,491 |
$19,447 |
$16,033 |
11/22 |
$15,801 |
$20,462 |
$16,295 |
12/22 |
$15,024 |
$19,264 |
$15,249 |
01/23 |
$16,590 |
$20,591 |
$16,765 |
02/23 |
$16,515 |
$20,110 |
$16,584 |
03/23 |
$16,289 |
$20,647 |
$16,175 |
04/23 |
$15,888 |
$20,867 |
$15,987 |
05/23 |
$15,751 |
$20,949 |
$15,990 |
06/23 |
$17,104 |
$22,379 |
$17,315 |
07/23 |
$17,705 |
$23,181 |
$18,125 |
08/23 |
$16,878 |
$22,734 |
$17,181 |
09/23 |
$15,964 |
$21,651 |
$16,048 |
10/23 |
$14,748 |
$21,077 |
$14,810 |
11/23 |
$16,076 |
$23,042 |
$16,159 |
12/23 |
$17,718 |
$24,265 |
$18,094 |
01/24 |
$17,129 |
$24,534 |
$17,514 |
02/24 |
$18,520 |
$25,862 |
$18,936 |
03/24 |
$18,946 |
$26,696 |
$19,466 |
04/24 |
$17,555 |
$25,521 |
$17,967 |
05/24 |
$18,495 |
$26,727 |
$18,929 |
06/24 |
$18,332 |
$27,554 |
$18,897 |
07/24 |
$19,810 |
$28,066 |
$20,444 |
08/24 |
$19,748 |
$28,677 |
$20,218 |
09/24 |
$19,973 |
$29,271 |
$20,487 |
10/24 |
$20,149 |
$29,056 |
$20,215 |
11/24 |
$22,780 |
$30,989 |
$22,693 |
12/24 |
$21,112 |
$30,041 |
$20,836 |
01/25 |
$22,298 |
$30,990 |
$21,494 |
02/25 |
$20,788 |
$30,396 |
$20,039 |
03/25 |
$18,897 |
$28,623 |
$18,520 |
04/25 |
$19,024 |
$28,431 |
$18,401 |
05/25 |
$20,689 |
$30,233 |
$19,582 |
06/25 |
$21,832 |
$31,769 |
$20,736 |
07/25 |
$22,072 |
$32,469 |
$21,089 |
08/25 |
$23,511 |
$33,220 |
$22,336 |
09/25 |
$24,147 |
$34,366 |
$23,264 |
10/25 |
$24,612 |
$35,103 |
$24,017 |
11/25 |
$25,219 |
$35,199 |
$23,853 |
12/25 |
$25,178 |
$35,192 |
$23,547 |
01/26 |
$25,723 |
$35,738 |
$24,483 |
02/26 |
$25,293 |
$35,568 |
$24,424 |
03/26 |
$24,220 |
$33,800 |
$22,886 |
04/26 |
$28,067 |
$37,248 |
$26,248 |
05/26 |
$29,569 |
$39,135 |
$27,781 |
06/26 |
$31,287 |
$39,015 |
$28,769 |
07/26 |
$29,685 |
$38,833 |
$27,083 |
08/26 |
$30,412 |
$39,898 |
$27,528 |
|
| Average Annual Return [Table Text Block] |
Table Summary
Average Annual Total Returns (%) |
1 year |
5 years |
10 years |
Institutional ClassFootnote Reference(a)Footnote Reference(b) |
29.35 |
8.30 |
11.76 |
Russell 3000® Index |
20.10 |
11.80 |
14.84 |
Russell 2000® Growth Index |
23.25 |
5.04 |
10.66 | |
| No Deduction of Taxes [Text Block] |
Performance does not reflect the deduction of taxes that a shareholder may pay on fund distributions or on the redemptions of fund shares.
|
| Updated Performance Information Location [Text Block] |
columbiathreadneedleus.com/investment-products/mutual-funds
|
| AssetsNet |
$ 33,423,918
|
| Holdings Count | Holding |
154
|
| Advisory Fees Paid, Amount |
$ 253,293
|
| InvestmentCompanyPortfolioTurnover |
110.00%
|
| Additional Fund Statistics [Text Block] |
Table Summary
Fund net assets |
$33,423,918 |
Total number of portfolio holdings |
154 |
Management services fees (represents 0.85% of Fund average net assets) |
$253,293 |
Portfolio turnover for the reporting period |
110% | |
| Holdings [Text Block] |
Table Summary
Health Care |
30.8% |
Information Technology |
16.9% |
Industrials |
13.9% |
Financials |
11.7% |
Consumer Discretionary |
10.3% |
Energy |
7.0% |
Materials |
5.1% |
Real Estate |
1.7% |
Communication Services |
1.6% |
Consumer Staples |
0.2% |
Table Summary
Common Stocks |
99.2% |
Other |
0.9% | |
| Largest Holdings [Text Block] |
Table Summary
Bowman Consulting Group Ltd. |
2.0% |
AtriCure, Inc. |
1.8% |
Remitly Global, Inc. |
1.7% |
Par Pacific Holdings, Inc. |
1.7% |
Freshworks, Inc., Class A |
1.7% |
Vertex, Inc., Class A |
1.6% |
Acadian Asset Management, Inc. |
1.6% |
SSR Mining, Inc. |
1.6% |
Steven Madden Ltd. |
1.4% |
Revolution Medicines, Inc. |
1.4% | |
| Material Fund Change [Text Block] |
|
| C000231687 |
|
| Shareholder Report [Line Items] |
|
| Fund Name |
Columbia Pyrford International Stock Fund
|
| Class Name |
Class A
|
| Trading Symbol |
PISDX
|
| Annual or Semi-Annual Statement [Text Block] |
This annual shareholder report contains important information about Columbia Pyrford International Stock Fund (the Fund) for the period of September 1, 2025 to August 31, 2026.
|
| Additional Information [Text Block] |
You can find additional information about the Fund at columbiathreadneedleus.com/resources/literature. You can also request more information by contacting us at 1-800-345-6611.
|
| Additional Information Phone Number |
1-800-345-6611
|
| Additional Information Website |
columbiathreadneedleus.com/resources/literature
|
| Expenses [Text Block] |
What were the Fund costs for the reporting period? (Based on a hypothetical $10,000 investment)
Table Summary
Class |
Cost of a $10,000 investment |
Cost paid as a percentage of a $10,000 investment |
Class A |
$125 |
1.16% | |
| Expenses Paid, Amount |
$ 125
|
| Expense Ratio, Percent |
1.16%
|
| Factors Affecting Performance [Text Block] |
Management's Discussion of Fund Performance The performance of Class A shares for the period presented is shown in the Average Annual Total Returns table. Top Performance ContributorsStock selection | Selections in the health care and consumer staples sectors contributed to the Fund’s relative performance during the period. Allocations | An underweight allocation to the consumer discretionary sector greatly contributed, with an underweight to real estate also boosting the Fund’s relative performance during the period. Individual holdings | Positions in Taiwan Semiconductor Manufacturing, a global leader in advanced semiconductor foundry manufacturing; Roche Holding, a Swiss pharmaceutical and diagnostics company; Japan Tobacco, a global tobacco and consumer products company; Mitsubishi Electric, a diversified electrical equipment and industrial systems manufacturer; and Woolworths Group, an Australian food and consumer staples retailer, were top contributors during the period. Top Performance DetractorsStock selection | Selections in the financials and information technology sectors hurt the Fund’s relative performance during the period. Allocations | An underweight allocation to the financials sector, as well as overweights to the consumer staples and communication services sectors, detracted from the Fund’s relative performance during the period. Individual holdings | Positions in SAP, a German enterprise software provider; Brambles, an Australian supply chain logistics and pallet pooling company; Nemetschek, a German design and construction software provider; Wolters Kluwer, a Dutch professional information and software services company; and Bank Rakyat Indonesia, an Indonesian commercial bank, were top detractors during the period. |
| Performance Past Does Not Indicate Future [Text] |
The Fund's past performance is not a good predictor of the Fund's future performance.
|
| Line Graph [Table Text Block] |
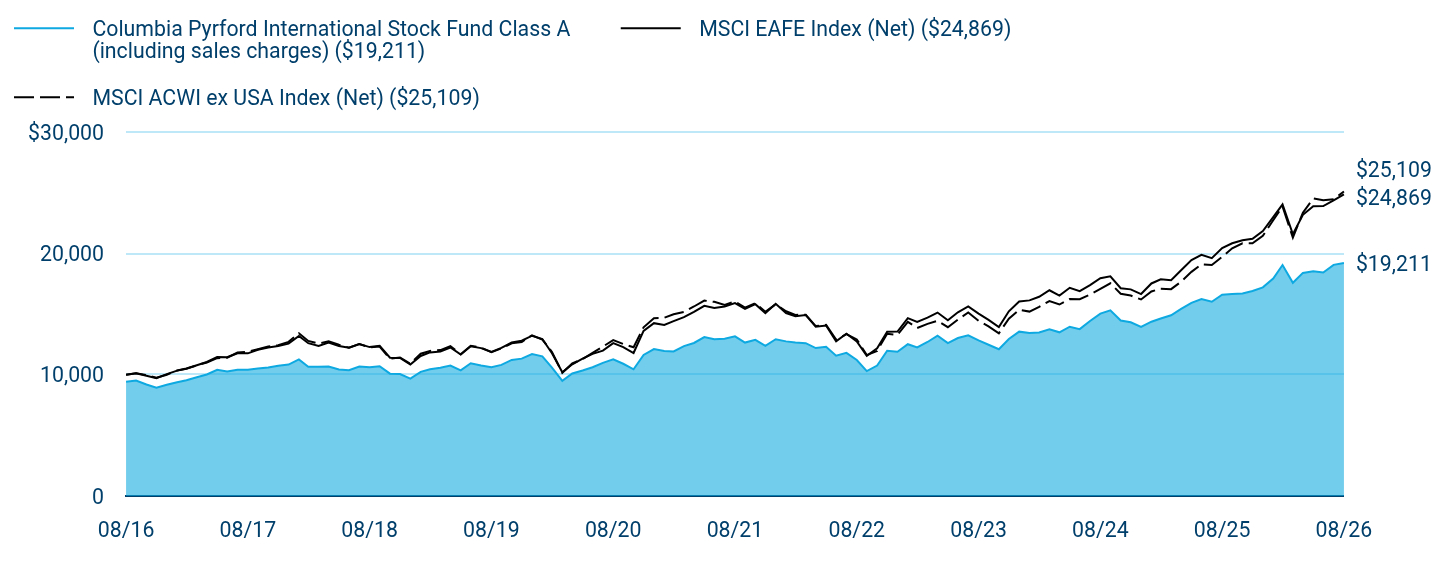
Table Summary
|
Columbia Pyrford International Stock Fund Class A (including sales charges) ($19,211) |
MSCI EAFE Index (Net) ($24,869) |
MSCI ACWI ex USA Index (Net) ($25,109) |
08/16 |
$9,427 |
$10,000 |
$10,000 |
09/16 |
$9,528 |
$10,123 |
$10,123 |
10/16 |
$9,195 |
$9,916 |
$9,978 |
11/16 |
$8,940 |
$9,718 |
$9,747 |
12/16 |
$9,172 |
$10,051 |
$9,996 |
01/17 |
$9,378 |
$10,342 |
$10,350 |
02/17 |
$9,544 |
$10,490 |
$10,515 |
03/17 |
$9,797 |
$10,779 |
$10,782 |
04/17 |
$10,018 |
$11,053 |
$11,013 |
05/17 |
$10,406 |
$11,459 |
$11,370 |
06/17 |
$10,263 |
$11,439 |
$11,405 |
07/17 |
$10,413 |
$11,768 |
$11,826 |
08/17 |
$10,406 |
$11,764 |
$11,888 |
09/17 |
$10,508 |
$12,057 |
$12,108 |
10/17 |
$10,595 |
$12,240 |
$12,336 |
11/17 |
$10,738 |
$12,368 |
$12,436 |
12/17 |
$10,840 |
$12,567 |
$12,714 |
01/18 |
$11,267 |
$13,197 |
$13,423 |
02/18 |
$10,666 |
$12,601 |
$12,790 |
03/18 |
$10,666 |
$12,374 |
$12,564 |
04/18 |
$10,682 |
$12,657 |
$12,765 |
05/18 |
$10,429 |
$12,372 |
$12,470 |
06/18 |
$10,374 |
$12,221 |
$12,236 |
07/18 |
$10,674 |
$12,522 |
$12,528 |
08/18 |
$10,619 |
$12,280 |
$12,266 |
09/18 |
$10,706 |
$12,387 |
$12,322 |
10/18 |
$10,089 |
$11,401 |
$11,320 |
11/18 |
$10,058 |
$11,386 |
$11,427 |
12/18 |
$9,681 |
$10,834 |
$10,910 |
01/19 |
$10,241 |
$11,546 |
$11,734 |
02/19 |
$10,452 |
$11,840 |
$11,963 |
03/19 |
$10,582 |
$11,915 |
$12,034 |
04/19 |
$10,761 |
$12,250 |
$12,352 |
05/19 |
$10,363 |
$11,661 |
$11,689 |
06/19 |
$10,948 |
$12,353 |
$12,393 |
07/19 |
$10,769 |
$12,196 |
$12,243 |
08/19 |
$10,623 |
$11,880 |
$11,865 |
09/19 |
$10,810 |
$12,221 |
$12,170 |
10/19 |
$11,224 |
$12,660 |
$12,595 |
11/19 |
$11,329 |
$12,803 |
$12,706 |
12/19 |
$11,713 |
$13,219 |
$13,256 |
01/20 |
$11,521 |
$12,943 |
$12,900 |
02/20 |
$10,590 |
$11,773 |
$11,881 |
03/20 |
$9,493 |
$10,201 |
$10,160 |
04/20 |
$10,100 |
$10,860 |
$10,930 |
05/20 |
$10,349 |
$11,333 |
$11,288 |
06/20 |
$10,615 |
$11,719 |
$11,798 |
07/20 |
$10,981 |
$11,992 |
$12,324 |
08/20 |
$11,272 |
$12,609 |
$12,852 |
09/20 |
$10,906 |
$12,281 |
$12,536 |
10/20 |
$10,449 |
$11,791 |
$12,266 |
11/20 |
$11,629 |
$13,619 |
$13,916 |
12/20 |
$12,112 |
$14,252 |
$14,668 |
01/21 |
$11,960 |
$14,100 |
$14,700 |
02/21 |
$11,926 |
$14,416 |
$14,991 |
03/21 |
$12,357 |
$14,748 |
$15,181 |
04/21 |
$12,619 |
$15,192 |
$15,628 |
05/21 |
$13,109 |
$15,687 |
$16,117 |
06/21 |
$12,932 |
$15,510 |
$16,012 |
07/21 |
$12,966 |
$15,627 |
$15,748 |
08/21 |
$13,169 |
$15,903 |
$16,048 |
09/21 |
$12,653 |
$15,441 |
$15,534 |
10/21 |
$12,881 |
$15,821 |
$15,905 |
11/21 |
$12,391 |
$15,085 |
$15,188 |
12/21 |
$12,925 |
$15,857 |
$15,816 |
01/22 |
$12,751 |
$15,091 |
$15,233 |
02/22 |
$12,655 |
$14,824 |
$14,932 |
03/22 |
$12,603 |
$14,919 |
$14,956 |
04/22 |
$12,202 |
$13,954 |
$14,016 |
05/22 |
$12,307 |
$14,059 |
$14,117 |
06/22 |
$11,575 |
$12,754 |
$12,903 |
07/22 |
$11,802 |
$13,390 |
$13,344 |
08/22 |
$11,218 |
$12,754 |
$12,915 |
09/22 |
$10,303 |
$11,561 |
$11,624 |
10/22 |
$10,756 |
$12,182 |
$11,972 |
11/22 |
$11,976 |
$13,555 |
$13,385 |
12/22 |
$11,890 |
$13,565 |
$13,285 |
01/23 |
$12,520 |
$14,664 |
$14,363 |
02/23 |
$12,250 |
$14,358 |
$13,858 |
03/23 |
$12,700 |
$14,714 |
$14,197 |
04/23 |
$13,223 |
$15,129 |
$14,444 |
05/23 |
$12,610 |
$14,489 |
$13,919 |
06/23 |
$13,025 |
$15,148 |
$14,543 |
07/23 |
$13,250 |
$15,639 |
$15,134 |
08/23 |
$12,836 |
$15,039 |
$14,451 |
09/23 |
$12,475 |
$14,526 |
$13,994 |
10/23 |
$12,106 |
$13,937 |
$13,417 |
11/23 |
$12,953 |
$15,230 |
$14,625 |
12/23 |
$13,555 |
$16,040 |
$15,360 |
01/24 |
$13,441 |
$16,132 |
$15,207 |
02/24 |
$13,488 |
$16,427 |
$15,592 |
03/24 |
$13,753 |
$16,967 |
$16,079 |
04/24 |
$13,498 |
$16,533 |
$15,791 |
05/24 |
$13,961 |
$17,173 |
$16,249 |
06/24 |
$13,763 |
$16,896 |
$16,234 |
07/24 |
$14,434 |
$17,392 |
$16,610 |
08/24 |
$15,039 |
$17,957 |
$17,083 |
09/24 |
$15,313 |
$18,123 |
$17,543 |
10/24 |
$14,472 |
$17,138 |
$16,682 |
11/24 |
$14,330 |
$17,040 |
$16,531 |
12/24 |
$13,941 |
$16,653 |
$16,210 |
01/25 |
$14,373 |
$17,528 |
$16,863 |
02/25 |
$14,640 |
$17,868 |
$17,097 |
03/25 |
$14,907 |
$17,796 |
$17,058 |
04/25 |
$15,431 |
$18,611 |
$17,674 |
05/25 |
$15,934 |
$19,462 |
$18,484 |
06/25 |
$16,243 |
$19,891 |
$19,111 |
07/25 |
$16,017 |
$19,612 |
$19,056 |
08/25 |
$16,602 |
$20,448 |
$19,717 |
09/25 |
$16,654 |
$20,839 |
$20,427 |
10/25 |
$16,695 |
$21,085 |
$20,840 |
11/25 |
$16,910 |
$21,216 |
$20,835 |
12/25 |
$17,208 |
$21,852 |
$21,459 |
01/26 |
$17,929 |
$22,992 |
$22,743 |
02/26 |
$19,051 |
$24,056 |
$23,885 |
03/26 |
$17,585 |
$21,581 |
$21,308 |
04/26 |
$18,398 |
$23,189 |
$23,364 |
05/26 |
$18,536 |
$23,900 |
$24,541 |
06/26 |
$18,433 |
$23,916 |
$24,396 |
07/26 |
$19,062 |
$24,384 |
$24,480 |
08/26 |
$19,211 |
$24,869 |
$25,109 |
|
| Average Annual Return [Table Text Block] |
Table Summary
Average Annual Total Returns (%) |
1 year |
5 years |
10 years |
Class A (excluding sales charges)Footnote Reference(a) |
15.71 |
7.85 |
7.38 |
Class A (including sales charges)Footnote Reference(a) |
9.03 |
6.58 |
6.75 |
MSCI EAFE Index (Net) |
21.62 |
9.35 |
9.54 |
MSCI ACWI ex USA Index (Net) |
27.35 |
9.37 |
9.64 | |
| No Deduction of Taxes [Text Block] |
Performance does not reflect the deduction of taxes that a shareholder may pay on fund distributions or on the redemptions of fund shares.
|
| Updated Performance Information Location [Text Block] |
columbiathreadneedleus.com/investment-products/mutual-funds
|
| AssetsNet |
$ 239,907,077
|
| Holdings Count | Holding |
80
|
| Advisory Fees Paid, Amount |
$ 2,263,788
|
| InvestmentCompanyPortfolioTurnover |
8.00%
|
| Additional Fund Statistics [Text Block] |
Table Summary
Fund net assets |
$239,907,077 |
Total number of portfolio holdings |
80 |
Management services fees (represents 0.87% of Fund average net assets) |
$2,263,788 |
Portfolio turnover for the reporting period |
8% | |
| Holdings [Text Block] |
Table Summary
Japan |
14.2% |
|
United Kingdom |
13.6% |
|
Germany |
11.2% |
|
Australia |
9.8% |
|
France |
8.3% |
|
Switzerland |
7.7% |
|
Singapore |
7.0% |
|
United States |
4.6% |
|
Hong Kong |
4.4% |
|
Finland |
2.8% |
|
Other |
15.6% |
|
Table Summary
Industrials |
22.6% |
Consumer Staples |
15.1% |
Financials |
14.5% |
Health Care |
10.3% |
Information Technology |
10.3% |
Communication Services |
8.3% |
Materials |
7.8% |
Consumer Discretionary |
3.1% |
Utilities |
3.0% |
Energy |
2.7% | |
| Largest Holdings [Text Block] |
Table Summary
SAP SE |
2.6% |
Japan Tobacco, Inc. |
2.6% |
United Overseas Bank Ltd. |
2.6% |
Nestlé SA, Registered Shares |
2.5% |
KDDI Corp. |
2.4% |
Unilever PLC |
2.3% |
Roche Holding Ag |
2.3% |
Brambles Ltd. |
2.3% |
Mitsubishi Electric Corp. |
2.2% |
Air Liquide SA |
2.1% | |
| Material Fund Change [Text Block] |
|
| C000231685 |
|
| Shareholder Report [Line Items] |
|
| Fund Name |
Columbia Pyrford International Stock Fund
|
| Class Name |
Institutional Class
|
| Trading Symbol |
PISLX
|
| Annual or Semi-Annual Statement [Text Block] |
This annual shareholder report contains important information about Columbia Pyrford International Stock Fund (the Fund) for the period of September 1, 2025 to August 31, 2026.
|
| Additional Information [Text Block] |
You can find additional information about the Fund at columbiathreadneedleus.com/resources/literature. You can also request more information by contacting us at 1-800-345-6611.
|
| Additional Information Phone Number |
1-800-345-6611
|
| Additional Information Website |
columbiathreadneedleus.com/resources/literature
|
| Expenses [Text Block] |
What were the Fund costs for the reporting period? (Based on a hypothetical $10,000 investment)
Table Summary
Class |
Cost of a $10,000 investment |
Cost paid as a percentage of a $10,000 investment |
Institutional Class |
$98 |
0.91% | |
| Expenses Paid, Amount |
$ 98
|
| Expense Ratio, Percent |
0.91%
|
| Factors Affecting Performance [Text Block] |
Management's Discussion of Fund Performance The performance of Institutional Class shares for the period presented is shown in the Average Annual Total Returns table. Top Performance ContributorsStock selection | Selections in the health care and consumer staples sectors contributed to the Fund’s relative performance during the period. Allocations | An underweight allocation to the consumer discretionary sector greatly contributed, with an underweight to real estate also boosting the Fund’s relative performance during the period. Individual holdings | Positions in Taiwan Semiconductor Manufacturing, a global leader in advanced semiconductor foundry manufacturing; Roche Holding, a Swiss pharmaceutical and diagnostics company; Japan Tobacco, a global tobacco and consumer products company; Mitsubishi Electric, a diversified electrical equipment and industrial systems manufacturer; and Woolworths Group, an Australian food and consumer staples retailer, were top contributors during the period. Top Performance DetractorsStock selection | Selections in the financials and information technology sectors hurt the Fund’s relative performance during the period. Allocations | An underweight allocation to the financials sector, as well as overweights to the consumer staples and communication services sectors, detracted from the Fund’s relative performance during the period. Individual holdings | Positions in SAP, a German enterprise software provider; Brambles, an Australian supply chain logistics and pallet pooling company; Nemetschek, a German design and construction software provider; Wolters Kluwer, a Dutch professional information and software services company; and Bank Rakyat Indonesia, an Indonesian commercial bank, were top detractors during the period. |
| Performance Past Does Not Indicate Future [Text] |
The Fund's past performance is not a good predictor of the Fund's future performance.
|
| Line Graph [Table Text Block] |
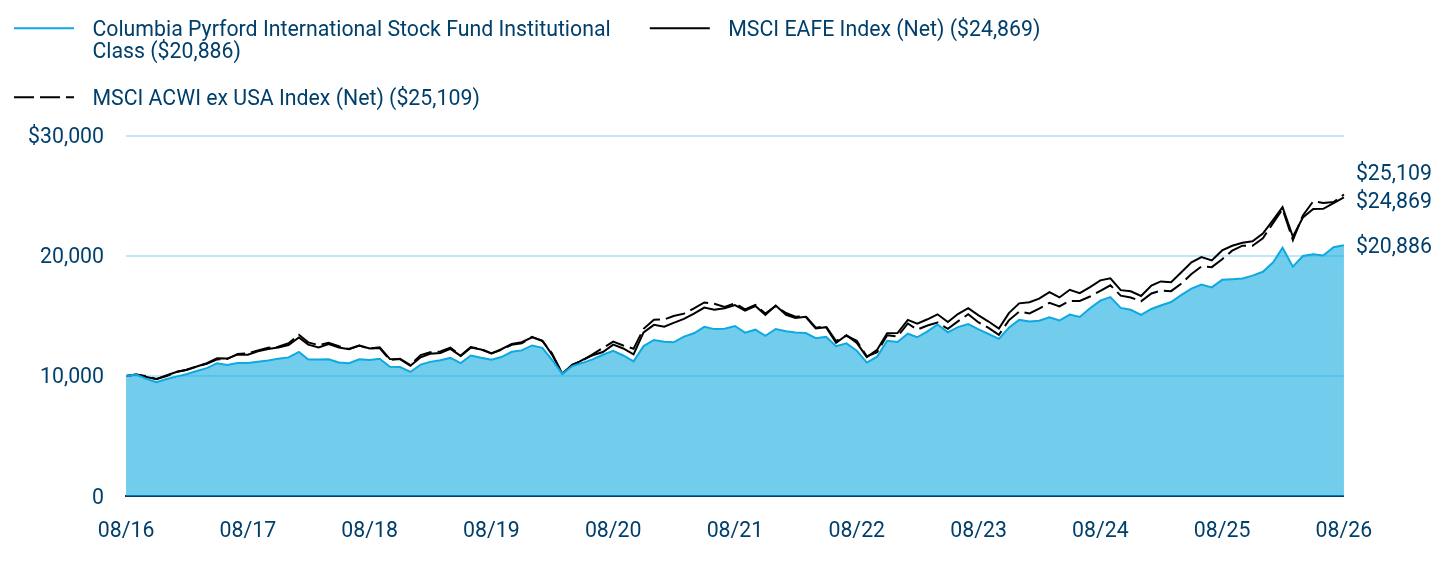
Table Summary
|
Columbia Pyrford International Stock Fund Institutional Class ($20,886) |
MSCI EAFE Index (Net) ($24,869) |
MSCI ACWI ex USA Index (Net) ($25,109) |
08/16 |
$10,000 |
$10,000 |
$10,000 |
09/16 |
$10,106 |
$10,123 |
$10,123 |
10/16 |
$9,755 |
$9,916 |
$9,978 |
11/16 |
$9,484 |
$9,718 |
$9,747 |
12/16 |
$9,736 |
$10,051 |
$9,996 |
01/17 |
$9,962 |
$10,342 |
$10,350 |
02/17 |
$10,138 |
$10,490 |
$10,515 |
03/17 |
$10,406 |
$10,779 |
$10,782 |
04/17 |
$10,649 |
$11,053 |
$11,013 |
05/17 |
$11,060 |
$11,459 |
$11,370 |
06/17 |
$10,909 |
$11,439 |
$11,405 |
07/17 |
$11,076 |
$11,768 |
$11,826 |
08/17 |
$11,068 |
$11,764 |
$11,888 |
09/17 |
$11,177 |
$12,057 |
$12,108 |
10/17 |
$11,277 |
$12,240 |
$12,336 |
11/17 |
$11,437 |
$12,368 |
$12,436 |
12/17 |
$11,542 |
$12,567 |
$12,714 |
01/18 |
$11,997 |
$13,197 |
$13,423 |
02/18 |
$11,361 |
$12,601 |
$12,790 |
03/18 |
$11,361 |
$12,374 |
$12,564 |
04/18 |
$11,387 |
$12,657 |
$12,765 |
05/18 |
$11,121 |
$12,372 |
$12,470 |
06/18 |
$11,061 |
$12,221 |
$12,236 |
07/18 |
$11,379 |
$12,522 |
$12,528 |
08/18 |
$11,327 |
$12,280 |
$12,266 |
09/18 |
$11,422 |
$12,387 |
$12,322 |
10/18 |
$10,760 |
$11,401 |
$11,320 |
11/18 |
$10,734 |
$11,386 |
$11,427 |
12/18 |
$10,329 |
$10,834 |
$10,910 |
01/19 |
$10,939 |
$11,546 |
$11,734 |
02/19 |
$11,169 |
$11,840 |
$11,963 |
03/19 |
$11,302 |
$11,915 |
$12,034 |
04/19 |
$11,497 |
$12,250 |
$12,352 |
05/19 |
$11,072 |
$11,661 |
$11,689 |
06/19 |
$11,700 |
$12,353 |
$12,393 |
07/19 |
$11,514 |
$12,196 |
$12,243 |
08/19 |
$11,355 |
$11,880 |
$11,865 |
09/19 |
$11,567 |
$12,221 |
$12,170 |
10/19 |
$12,010 |
$12,660 |
$12,595 |
11/19 |
$12,125 |
$12,803 |
$12,706 |
12/19 |
$12,534 |
$13,219 |
$13,256 |
01/20 |
$12,334 |
$12,943 |
$12,900 |
02/20 |
$11,344 |
$11,773 |
$11,881 |
03/20 |
$10,162 |
$10,201 |
$10,160 |
04/20 |
$10,817 |
$10,860 |
$10,930 |
05/20 |
$11,089 |
$11,333 |
$11,288 |
06/20 |
$11,380 |
$11,719 |
$11,798 |
07/20 |
$11,762 |
$11,992 |
$12,324 |
08/20 |
$12,080 |
$12,609 |
$12,852 |
09/20 |
$11,698 |
$12,281 |
$12,536 |
10/20 |
$11,207 |
$11,791 |
$12,266 |
11/20 |
$12,480 |
$13,619 |
$13,916 |
12/20 |
$12,994 |
$14,252 |
$14,668 |
01/21 |
$12,837 |
$14,100 |
$14,700 |
02/21 |
$12,799 |
$14,416 |
$14,991 |
03/21 |
$13,273 |
$14,748 |
$15,181 |
04/21 |
$13,552 |
$15,192 |
$15,628 |
05/21 |
$14,081 |
$15,687 |
$16,117 |
06/21 |
$13,895 |
$15,510 |
$16,012 |
07/21 |
$13,933 |
$15,627 |
$15,748 |
08/21 |
$14,156 |
$15,903 |
$16,048 |
09/21 |
$13,598 |
$15,441 |
$15,534 |
10/21 |
$13,849 |
$15,821 |
$15,905 |
11/21 |
$13,329 |
$15,085 |
$15,188 |
12/21 |
$13,905 |
$15,857 |
$15,816 |
01/22 |
$13,721 |
$15,091 |
$15,233 |
02/22 |
$13,623 |
$14,824 |
$14,932 |
03/22 |
$13,565 |
$14,919 |
$14,956 |
04/22 |
$13,138 |
$13,954 |
$14,016 |
05/22 |
$13,254 |
$14,059 |
$14,117 |
06/22 |
$12,468 |
$12,754 |
$12,903 |
07/22 |
$12,711 |
$13,390 |
$13,344 |
08/22 |
$12,089 |
$12,754 |
$12,915 |
09/22 |
$11,108 |
$11,561 |
$11,624 |
10/22 |
$11,604 |
$12,182 |
$11,972 |
11/22 |
$12,924 |
$13,555 |
$13,385 |
12/22 |
$12,825 |
$13,565 |
$13,285 |
01/23 |
$13,510 |
$14,664 |
$14,363 |
02/23 |
$13,218 |
$14,358 |
$13,858 |
03/23 |
$13,711 |
$14,714 |
$14,197 |
04/23 |
$14,276 |
$15,129 |
$14,444 |
05/23 |
$13,621 |
$14,489 |
$13,919 |
06/23 |
$14,064 |
$15,148 |
$14,543 |
07/23 |
$14,316 |
$15,639 |
$15,134 |
08/23 |
$13,873 |
$15,039 |
$14,451 |
09/23 |
$13,490 |
$14,526 |
$13,994 |
10/23 |
$13,087 |
$13,937 |
$13,417 |
11/23 |
$14,004 |
$15,230 |
$14,625 |
12/23 |
$14,663 |
$16,040 |
$15,360 |
01/24 |
$14,536 |
$16,132 |
$15,207 |
02/24 |
$14,599 |
$16,427 |
$15,592 |
03/24 |
$14,876 |
$16,967 |
$16,079 |
04/24 |
$14,610 |
$16,533 |
$15,791 |
05/24 |
$15,109 |
$17,173 |
$16,249 |
06/24 |
$14,907 |
$16,896 |
$16,234 |
07/24 |
$15,630 |
$17,392 |
$16,610 |
08/24 |
$16,267 |
$17,957 |
$17,083 |
09/24 |
$16,565 |
$18,123 |
$17,543 |
10/24 |
$15,662 |
$17,138 |
$16,682 |
11/24 |
$15,502 |
$17,040 |
$16,531 |
12/24 |
$15,082 |
$16,653 |
$16,210 |
01/25 |
$15,570 |
$17,528 |
$16,863 |
02/25 |
$15,861 |
$17,868 |
$17,097 |
03/25 |
$16,151 |
$17,796 |
$17,058 |
04/25 |
$16,721 |
$18,611 |
$17,674 |
05/25 |
$17,267 |
$19,462 |
$18,484 |
06/25 |
$17,604 |
$19,891 |
$19,111 |
07/25 |
$17,372 |
$19,612 |
$19,056 |
08/25 |
$17,999 |
$20,448 |
$19,717 |
09/25 |
$18,057 |
$20,839 |
$20,427 |
10/25 |
$18,115 |
$21,085 |
$20,840 |
11/25 |
$18,348 |
$21,216 |
$20,835 |
12/25 |
$18,668 |
$21,852 |
$21,459 |
01/26 |
$19,464 |
$22,992 |
$22,743 |
02/26 |
$20,677 |
$24,056 |
$23,885 |
03/26 |
$19,098 |
$21,581 |
$21,308 |
04/26 |
$19,985 |
$23,189 |
$23,364 |
05/26 |
$20,129 |
$23,900 |
$24,541 |
06/26 |
$20,025 |
$23,916 |
$24,396 |
07/26 |
$20,716 |
$24,384 |
$24,480 |
08/26 |
$20,886 |
$24,869 |
$25,109 |
|
| Average Annual Return [Table Text Block] |
Table Summary
Average Annual Total Returns (%) |
1 year |
5 years |
10 years |
Institutional ClassFootnote Reference(a)Footnote Reference(b) |
16.04 |
8.09 |
7.64 |
MSCI EAFE Index (Net) |
21.62 |
9.35 |
9.54 |
MSCI ACWI ex USA Index (Net) |
27.35 |
9.37 |
9.64 | |
| No Deduction of Taxes [Text Block] |
Performance does not reflect the deduction of taxes that a shareholder may pay on fund distributions or on the redemptions of fund shares.
|
| Updated Performance Information Location [Text Block] |
columbiathreadneedleus.com/investment-products/mutual-funds
|
| AssetsNet |
$ 239,907,077
|
| Holdings Count | Holding |
80
|
| Advisory Fees Paid, Amount |
$ 2,263,788
|
| InvestmentCompanyPortfolioTurnover |
8.00%
|
| Additional Fund Statistics [Text Block] |
Table Summary
Fund net assets |
$239,907,077 |
Total number of portfolio holdings |
80 |
Management services fees (represents 0.87% of Fund average net assets) |
$2,263,788 |
Portfolio turnover for the reporting period |
8% | |
| Holdings [Text Block] |
Table Summary
Japan |
14.2% |
|
United Kingdom |
13.6% |
|
Germany |
11.2% |
|
Australia |
9.8% |
|
France |
8.3% |
|
Switzerland |
7.7% |
|
Singapore |
7.0% |
|
United States |
4.6% |
|
Hong Kong |
4.4% |
|
Finland |
2.8% |
|
Other |
15.6% |
|
Table Summary
Industrials |
22.6% |
Consumer Staples |
15.1% |
Financials |
14.5% |
Health Care |
10.3% |
Information Technology |
10.3% |
Communication Services |
8.3% |
Materials |
7.8% |
Consumer Discretionary |
3.1% |
Utilities |
3.0% |
Energy |
2.7% | |
| Largest Holdings [Text Block] |
Table Summary
SAP SE |
2.6% |
Japan Tobacco, Inc. |
2.6% |
United Overseas Bank Ltd. |
2.6% |
Nestlé SA, Registered Shares |
2.5% |
KDDI Corp. |
2.4% |
Unilever PLC |
2.3% |
Roche Holding Ag |
2.3% |
Brambles Ltd. |
2.3% |
Mitsubishi Electric Corp. |
2.2% |
Air Liquide SA |
2.1% | |
| Material Fund Change [Text Block] |
|
| C000231686 |
|
| Shareholder Report [Line Items] |
|
| Fund Name |
Columbia Pyrford International Stock Fund
|
| Class Name |
Institutional 2 Class
|
| Trading Symbol |
PISOX
|
| Annual or Semi-Annual Statement [Text Block] |
This annual shareholder report contains important information about Columbia Pyrford International Stock Fund (the Fund) for the period of September 1, 2025 to August 31, 2026.
|
| Additional Information [Text Block] |
You can find additional information about the Fund at columbiathreadneedleus.com/resources/literature. You can also request more information by contacting us at 1-800-345-6611.
|
| Additional Information Phone Number |
1-800-345-6611
|
| Additional Information Website |
columbiathreadneedleus.com/resources/literature
|
| Expenses [Text Block] |
What were the Fund costs for the reporting period? (Based on a hypothetical $10,000 investment)
Table Summary
Class |
Cost of a $10,000 investment |
Cost paid as a percentage of a $10,000 investment |
Institutional 2 Class |
$88 |
0.81% | |
| Expenses Paid, Amount |
$ 88
|
| Expense Ratio, Percent |
0.81%
|
| Factors Affecting Performance [Text Block] |
Management's Discussion of Fund Performance The performance of Institutional 2 Class shares for the period presented is shown in the Average Annual Total Returns table. Top Performance ContributorsStock selection | Selections in the health care and consumer staples sectors contributed to the Fund’s relative performance during the period. Allocations | An underweight allocation to the consumer discretionary sector greatly contributed, with an underweight to real estate also boosting the Fund’s relative performance during the period. Individual holdings | Positions in Taiwan Semiconductor Manufacturing, a global leader in advanced semiconductor foundry manufacturing; Roche Holding, a Swiss pharmaceutical and diagnostics company; Japan Tobacco, a global tobacco and consumer products company; Mitsubishi Electric, a diversified electrical equipment and industrial systems manufacturer; and Woolworths Group, an Australian food and consumer staples retailer, were top contributors during the period. Top Performance DetractorsStock selection | Selections in the financials and information technology sectors hurt the Fund’s relative performance during the period. Allocations | An underweight allocation to the financials sector, as well as overweights to the consumer staples and communication services sectors, detracted from the Fund’s relative performance during the period. Individual holdings | Positions in SAP, a German enterprise software provider; Brambles, an Australian supply chain logistics and pallet pooling company; Nemetschek, a German design and construction software provider; Wolters Kluwer, a Dutch professional information and software services company; and Bank Rakyat Indonesia, an Indonesian commercial bank, were top detractors during the period. |
| Performance Past Does Not Indicate Future [Text] |
The Fund's past performance is not a good predictor of the Fund's future performance.
|
| Line Graph [Table Text Block] |
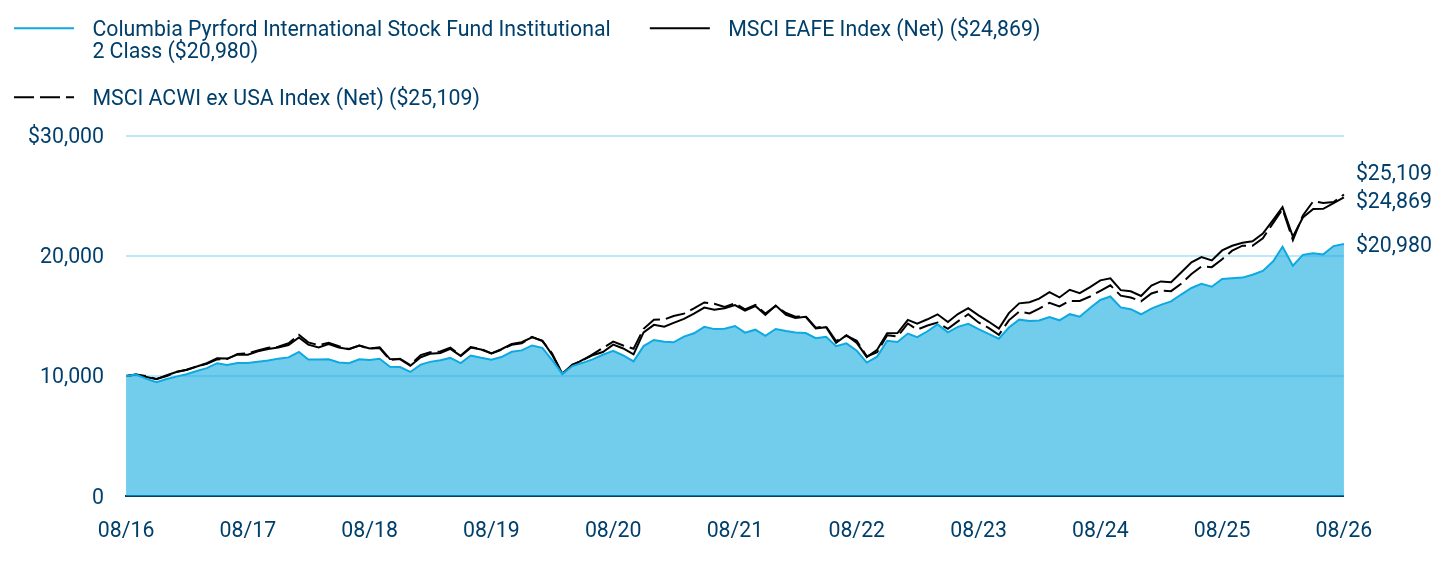
Table Summary
|
Columbia Pyrford International Stock Fund Institutional 2 Class ($20,980) |
MSCI EAFE Index (Net) ($24,869) |
MSCI ACWI ex USA Index (Net) ($25,109) |
08/16 |
$10,000 |
$10,000 |
$10,000 |
09/16 |
$10,106 |
$10,123 |
$10,123 |
10/16 |
$9,755 |
$9,916 |
$9,978 |
11/16 |
$9,484 |
$9,718 |
$9,747 |
12/16 |
$9,736 |
$10,051 |
$9,996 |
01/17 |
$9,962 |
$10,342 |
$10,350 |
02/17 |
$10,138 |
$10,490 |
$10,515 |
03/17 |
$10,406 |
$10,779 |
$10,782 |
04/17 |
$10,649 |
$11,053 |
$11,013 |
05/17 |
$11,060 |
$11,459 |
$11,370 |
06/17 |
$10,909 |
$11,439 |
$11,405 |
07/17 |
$11,076 |
$11,768 |
$11,826 |
08/17 |
$11,068 |
$11,764 |
$11,888 |
09/17 |
$11,177 |
$12,057 |
$12,108 |
10/17 |
$11,277 |
$12,240 |
$12,336 |
11/17 |
$11,437 |
$12,368 |
$12,436 |
12/17 |
$11,542 |
$12,567 |
$12,714 |
01/18 |
$11,997 |
$13,197 |
$13,423 |
02/18 |
$11,361 |
$12,601 |
$12,790 |
03/18 |
$11,361 |
$12,374 |
$12,564 |
04/18 |
$11,387 |
$12,657 |
$12,765 |
05/18 |
$11,121 |
$12,372 |
$12,470 |
06/18 |
$11,061 |
$12,221 |
$12,236 |
07/18 |
$11,379 |
$12,522 |
$12,528 |
08/18 |
$11,327 |
$12,280 |
$12,266 |
09/18 |
$11,422 |
$12,387 |
$12,322 |
10/18 |
$10,760 |
$11,401 |
$11,320 |
11/18 |
$10,734 |
$11,386 |
$11,427 |
12/18 |
$10,329 |
$10,834 |
$10,910 |
01/19 |
$10,939 |
$11,546 |
$11,734 |
02/19 |
$11,169 |
$11,840 |
$11,963 |
03/19 |
$11,302 |
$11,915 |
$12,034 |
04/19 |
$11,497 |
$12,250 |
$12,352 |
05/19 |
$11,072 |
$11,661 |
$11,689 |
06/19 |
$11,700 |
$12,353 |
$12,393 |
07/19 |
$11,514 |
$12,196 |
$12,243 |
08/19 |
$11,355 |
$11,880 |
$11,865 |
09/19 |
$11,567 |
$12,221 |
$12,170 |
10/19 |
$12,010 |
$12,660 |
$12,595 |
11/19 |
$12,125 |
$12,803 |
$12,706 |
12/19 |
$12,534 |
$13,219 |
$13,256 |
01/20 |
$12,334 |
$12,943 |
$12,900 |
02/20 |
$11,344 |
$11,773 |
$11,881 |
03/20 |
$10,162 |
$10,201 |
$10,160 |
04/20 |
$10,817 |
$10,860 |
$10,930 |
05/20 |
$11,089 |
$11,333 |
$11,288 |
06/20 |
$11,380 |
$11,719 |
$11,798 |
07/20 |
$11,762 |
$11,992 |
$12,324 |
08/20 |
$12,080 |
$12,609 |
$12,852 |
09/20 |
$11,698 |
$12,281 |
$12,536 |
10/20 |
$11,207 |
$11,791 |
$12,266 |
11/20 |
$12,480 |
$13,619 |
$13,916 |
12/20 |
$12,994 |
$14,252 |
$14,668 |
01/21 |
$12,837 |
$14,100 |
$14,700 |
02/21 |
$12,799 |
$14,416 |
$14,991 |
03/21 |
$13,273 |
$14,748 |
$15,181 |
04/21 |
$13,552 |
$15,192 |
$15,628 |
05/21 |
$14,081 |
$15,687 |
$16,117 |
06/21 |
$13,895 |
$15,510 |
$16,012 |
07/21 |
$13,933 |
$15,627 |
$15,748 |
08/21 |
$14,156 |
$15,903 |
$16,048 |
09/21 |
$13,598 |
$15,441 |
$15,534 |
10/21 |
$13,849 |
$15,821 |
$15,905 |
11/21 |
$13,329 |
$15,085 |
$15,188 |
12/21 |
$13,905 |
$15,857 |
$15,816 |
01/22 |
$13,730 |
$15,091 |
$15,233 |
02/22 |
$13,623 |
$14,824 |
$14,932 |
03/22 |
$13,565 |
$14,919 |
$14,956 |
04/22 |
$13,138 |
$13,954 |
$14,016 |
05/22 |
$13,264 |
$14,059 |
$14,117 |
06/22 |
$12,468 |
$12,754 |
$12,903 |
07/22 |
$12,711 |
$13,390 |
$13,344 |
08/22 |
$12,089 |
$12,754 |
$12,915 |
09/22 |
$11,108 |
$11,561 |
$11,624 |
10/22 |
$11,604 |
$12,182 |
$11,972 |
11/22 |
$12,924 |
$13,555 |
$13,385 |
12/22 |
$12,829 |
$13,565 |
$13,285 |
01/23 |
$13,524 |
$14,664 |
$14,363 |
02/23 |
$13,232 |
$14,358 |
$13,858 |
03/23 |
$13,716 |
$14,714 |
$14,197 |
04/23 |
$14,291 |
$15,129 |
$14,444 |
05/23 |
$13,625 |
$14,489 |
$13,919 |
06/23 |
$14,079 |
$15,148 |
$14,543 |
07/23 |
$14,331 |
$15,639 |
$15,134 |
08/23 |
$13,888 |
$15,039 |
$14,451 |
09/23 |
$13,504 |
$14,526 |
$13,994 |
10/23 |
$13,101 |
$13,937 |
$13,417 |
11/23 |
$14,029 |
$15,230 |
$14,625 |
12/23 |
$14,682 |
$16,040 |
$15,360 |
01/24 |
$14,564 |
$16,132 |
$15,207 |
02/24 |
$14,618 |
$16,427 |
$15,592 |
03/24 |
$14,894 |
$16,967 |
$16,079 |
04/24 |
$14,628 |
$16,533 |
$15,791 |
05/24 |
$15,139 |
$17,173 |
$16,249 |
06/24 |
$14,926 |
$16,896 |
$16,234 |
07/24 |
$15,661 |
$17,392 |
$16,610 |
08/24 |
$16,321 |
$17,957 |
$17,083 |
09/24 |
$16,609 |
$18,123 |
$17,543 |
10/24 |
$15,704 |
$17,138 |
$16,682 |
11/24 |
$15,555 |
$17,040 |
$16,531 |
12/24 |
$15,132 |
$16,653 |
$16,210 |
01/25 |
$15,609 |
$17,528 |
$16,863 |
02/25 |
$15,912 |
$17,868 |
$17,097 |
03/25 |
$16,204 |
$17,796 |
$17,058 |
04/25 |
$16,774 |
$18,611 |
$17,674 |
05/25 |
$17,322 |
$19,462 |
$18,484 |
06/25 |
$17,660 |
$19,891 |
$19,111 |
07/25 |
$17,427 |
$19,612 |
$19,056 |
08/25 |
$18,067 |
$20,448 |
$19,717 |
09/25 |
$18,126 |
$20,839 |
$20,427 |
10/25 |
$18,184 |
$21,085 |
$20,840 |
11/25 |
$18,428 |
$21,216 |
$20,835 |
12/25 |
$18,742 |
$21,852 |
$21,459 |
01/26 |
$19,540 |
$22,992 |
$22,743 |
02/26 |
$20,757 |
$24,056 |
$23,885 |
03/26 |
$19,174 |
$21,581 |
$21,308 |
04/26 |
$20,077 |
$23,189 |
$23,364 |
05/26 |
$20,221 |
$23,900 |
$24,541 |
06/26 |
$20,116 |
$23,916 |
$24,396 |
07/26 |
$20,810 |
$24,384 |
$24,480 |
08/26 |
$20,980 |
$24,869 |
$25,109 |
|
| Average Annual Return [Table Text Block] |
Table Summary
Average Annual Total Returns (%) |
1 year |
5 years |
10 years |
Institutional 2 ClassFootnote Reference(a)Footnote Reference(b) |
16.12 |
8.19 |
7.69 |
MSCI EAFE Index (Net) |
21.62 |
9.35 |
9.54 |
MSCI ACWI ex USA Index (Net) |
27.35 |
9.37 |
9.64 | |
| No Deduction of Taxes [Text Block] |
Performance does not reflect the deduction of taxes that a shareholder may pay on fund distributions or on the redemptions of fund shares.
|
| Updated Performance Information Location [Text Block] |
columbiathreadneedleus.com/investment-products/mutual-funds
|
| AssetsNet |
$ 239,907,077
|
| Holdings Count | Holding |
80
|
| Advisory Fees Paid, Amount |
$ 2,263,788
|
| InvestmentCompanyPortfolioTurnover |
8.00%
|
| Additional Fund Statistics [Text Block] |
Table Summary
Fund net assets |
$239,907,077 |
Total number of portfolio holdings |
80 |
Management services fees (represents 0.87% of Fund average net assets) |
$2,263,788 |
Portfolio turnover for the reporting period |
8% | |
| Holdings [Text Block] |
Table Summary
Japan |
14.2% |
|
United Kingdom |
13.6% |
|
Germany |
11.2% |
|
Australia |
9.8% |
|
France |
8.3% |
|
Switzerland |
7.7% |
|
Singapore |
7.0% |
|
United States |
4.6% |
|
Hong Kong |
4.4% |
|
Finland |
2.8% |
|
Other |
15.6% |
|
Table Summary
Industrials |
22.6% |
Consumer Staples |
15.1% |
Financials |
14.5% |
Health Care |
10.3% |
Information Technology |
10.3% |
Communication Services |
8.3% |
Materials |
7.8% |
Consumer Discretionary |
3.1% |
Utilities |
3.0% |
Energy |
2.7% | |
| Largest Holdings [Text Block] |
Table Summary
SAP SE |
2.6% |
Japan Tobacco, Inc. |
2.6% |
United Overseas Bank Ltd. |
2.6% |
Nestlé SA, Registered Shares |
2.5% |
KDDI Corp. |
2.4% |
Unilever PLC |
2.3% |
Roche Holding Ag |
2.3% |
Brambles Ltd. |
2.3% |
Mitsubishi Electric Corp. |
2.2% |
Air Liquide SA |
2.1% | |
| Material Fund Change [Text Block] |
|
| C000231688 |
|
| Shareholder Report [Line Items] |
|
| Fund Name |
Columbia Pyrford International Stock Fund
|
| Class Name |
Institutional 3 Class
|
| Trading Symbol |
PISQX
|
| Annual or Semi-Annual Statement [Text Block] |
This annual shareholder report contains important information about Columbia Pyrford International Stock Fund (the Fund) for the period of September 1, 2025 to August 31, 2026.
|
| Additional Information [Text Block] |
You can find additional information about the Fund at columbiathreadneedleus.com/resources/literature. You can also request more information by contacting us at 1-800-345-6611.
|
| Additional Information Phone Number |
1-800-345-6611
|
| Additional Information Website |
columbiathreadneedleus.com/resources/literature
|
| Expenses [Text Block] |
What were the Fund costs for the reporting period? (Based on a hypothetical $10,000 investment)
Table Summary
Class |
Cost of a $10,000 investment |
Cost paid as a percentage of a $10,000 investment |
Institutional 3 Class |
$82 |
0.76% | |
| Expenses Paid, Amount |
$ 82
|
| Expense Ratio, Percent |
0.76%
|
| Factors Affecting Performance [Text Block] |
Management's Discussion of Fund Performance The performance of Institutional 3 Class shares for the period presented is shown in the Average Annual Total Returns table. Top Performance ContributorsStock selection | Selections in the health care and consumer staples sectors contributed to the Fund’s relative performance during the period. Allocations | An underweight allocation to the consumer discretionary sector greatly contributed, with an underweight to real estate also boosting the Fund’s relative performance during the period. Individual holdings | Positions in Taiwan Semiconductor Manufacturing, a global leader in advanced semiconductor foundry manufacturing; Roche Holding, a Swiss pharmaceutical and diagnostics company; Japan Tobacco, a global tobacco and consumer products company; Mitsubishi Electric, a diversified electrical equipment and industrial systems manufacturer; and Woolworths Group, an Australian food and consumer staples retailer, were top contributors during the period. Top Performance DetractorsStock selection | Selections in the financials and information technology sectors hurt the Fund’s relative performance during the period. Allocations | An underweight allocation to the financials sector, as well as overweights to the consumer staples and communication services sectors, detracted from the Fund’s relative performance during the period. Individual holdings | Positions in SAP, a German enterprise software provider; Brambles, an Australian supply chain logistics and pallet pooling company; Nemetschek, a German design and construction software provider; Wolters Kluwer, a Dutch professional information and software services company; and Bank Rakyat Indonesia, an Indonesian commercial bank, were top detractors during the period. |
| Performance Past Does Not Indicate Future [Text] |
The Fund's past performance is not a good predictor of the Fund's future performance.
|
| Line Graph [Table Text Block] |
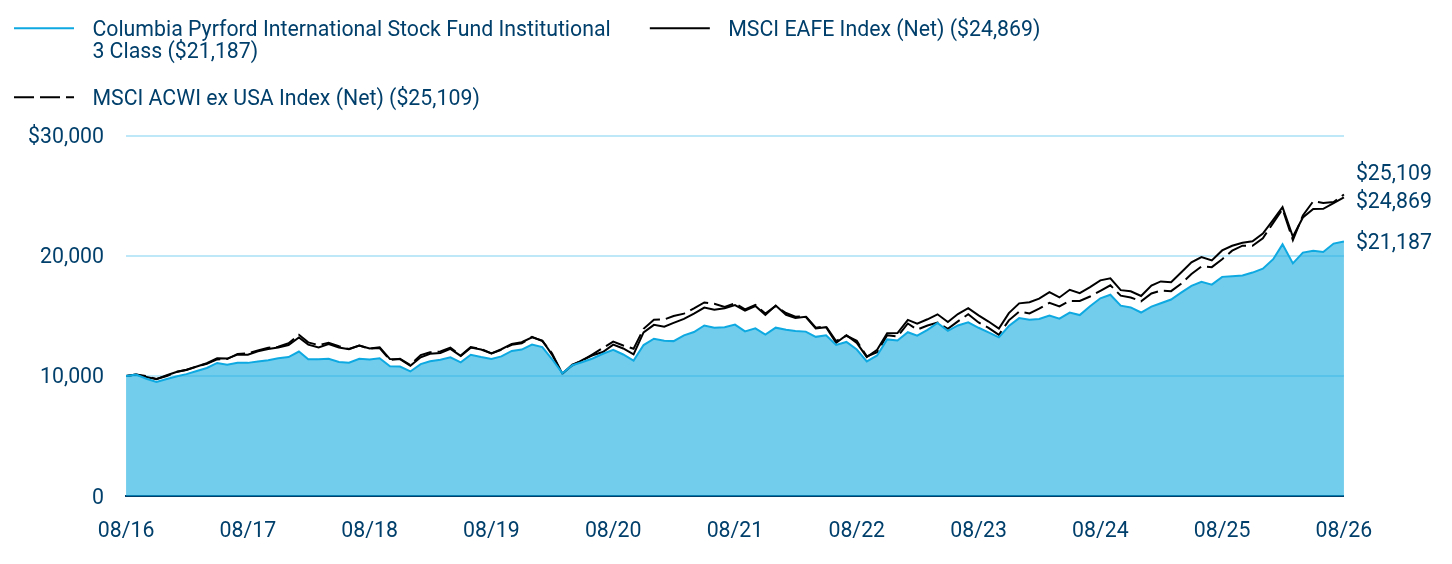
Table Summary
|
Columbia Pyrford International Stock Fund Institutional 3 Class ($21,187) |
MSCI EAFE Index (Net) ($24,869) |
MSCI ACWI ex USA Index (Net) ($25,109) |
08/16 |
$10,000 |
$10,000 |
$10,000 |
09/16 |
$10,114 |
$10,123 |
$10,123 |
10/16 |
$9,763 |
$9,916 |
$9,978 |
11/16 |
$9,493 |
$9,718 |
$9,747 |
12/16 |
$9,743 |
$10,051 |
$9,996 |
01/17 |
$9,970 |
$10,342 |
$10,350 |
02/17 |
$10,146 |
$10,490 |
$10,515 |
03/17 |
$10,414 |
$10,779 |
$10,782 |
04/17 |
$10,657 |
$11,053 |
$11,013 |
05/17 |
$11,076 |
$11,459 |
$11,370 |
06/17 |
$10,925 |
$11,439 |
$11,405 |
07/17 |
$11,093 |
$11,768 |
$11,826 |
08/17 |
$11,085 |
$11,764 |
$11,888 |
09/17 |
$11,202 |
$12,057 |
$12,108 |
10/17 |
$11,303 |
$12,240 |
$12,336 |
11/17 |
$11,462 |
$12,368 |
$12,436 |
12/17 |
$11,566 |
$12,567 |
$12,714 |
01/18 |
$12,031 |
$13,197 |
$13,423 |
02/18 |
$11,394 |
$12,601 |
$12,790 |
03/18 |
$11,394 |
$12,374 |
$12,564 |
04/18 |
$11,420 |
$12,657 |
$12,765 |
05/18 |
$11,153 |
$12,372 |
$12,470 |
06/18 |
$11,101 |
$12,221 |
$12,236 |
07/18 |
$11,420 |
$12,522 |
$12,528 |
08/18 |
$11,368 |
$12,280 |
$12,266 |
09/18 |
$11,463 |
$12,387 |
$12,322 |
10/18 |
$10,799 |
$11,401 |
$11,320 |
11/18 |
$10,782 |
$11,386 |
$11,427 |
12/18 |
$10,370 |
$10,834 |
$10,910 |
01/19 |
$10,983 |
$11,546 |
$11,734 |
02/19 |
$11,213 |
$11,840 |
$11,963 |
03/19 |
$11,347 |
$11,915 |
$12,034 |
04/19 |
$11,551 |
$12,250 |
$12,352 |
05/19 |
$11,125 |
$11,661 |
$11,689 |
06/19 |
$11,755 |
$12,353 |
$12,393 |
07/19 |
$11,569 |
$12,196 |
$12,243 |
08/19 |
$11,418 |
$11,880 |
$11,865 |
09/19 |
$11,622 |
$12,221 |
$12,170 |
10/19 |
$12,075 |
$12,660 |
$12,595 |
11/19 |
$12,190 |
$12,803 |
$12,706 |
12/19 |
$12,603 |
$13,219 |
$13,256 |
01/20 |
$12,402 |
$12,943 |
$12,900 |
02/20 |
$11,406 |
$11,773 |
$11,881 |
03/20 |
$10,227 |
$10,201 |
$10,160 |
04/20 |
$10,885 |
$10,860 |
$10,930 |
05/20 |
$11,159 |
$11,333 |
$11,288 |
06/20 |
$11,452 |
$11,719 |
$11,798 |
07/20 |
$11,845 |
$11,992 |
$12,324 |
08/20 |
$12,164 |
$12,609 |
$12,852 |
09/20 |
$11,781 |
$12,281 |
$12,536 |
10/20 |
$11,278 |
$11,791 |
$12,266 |
11/20 |
$12,567 |
$13,619 |
$13,916 |
12/20 |
$13,092 |
$14,252 |
$14,668 |
01/21 |
$12,933 |
$14,100 |
$14,700 |
02/21 |
$12,896 |
$14,416 |
$14,991 |
03/21 |
$13,373 |
$14,748 |
$15,181 |
04/21 |
$13,653 |
$15,192 |
$15,628 |
05/21 |
$14,196 |
$15,687 |
$16,117 |
06/21 |
$14,009 |
$15,510 |
$16,012 |
07/21 |
$14,046 |
$15,627 |
$15,748 |
08/21 |
$14,270 |
$15,903 |
$16,048 |
09/21 |
$13,709 |
$15,441 |
$15,534 |
10/21 |
$13,962 |
$15,821 |
$15,905 |
11/21 |
$13,438 |
$15,085 |
$15,188 |
12/21 |
$14,016 |
$15,857 |
$15,816 |
01/22 |
$13,842 |
$15,091 |
$15,233 |
02/22 |
$13,745 |
$14,824 |
$14,932 |
03/22 |
$13,687 |
$14,919 |
$14,956 |
04/22 |
$13,251 |
$13,954 |
$14,016 |
05/22 |
$13,377 |
$14,059 |
$14,117 |
06/22 |
$12,574 |
$12,754 |
$12,903 |
07/22 |
$12,825 |
$13,390 |
$13,344 |
08/22 |
$12,196 |
$12,754 |
$12,915 |
09/22 |
$11,209 |
$11,561 |
$11,624 |
10/22 |
$11,703 |
$12,182 |
$11,972 |
11/22 |
$13,038 |
$13,555 |
$13,385 |
12/22 |
$12,943 |
$13,565 |
$13,285 |
01/23 |
$13,636 |
$14,664 |
$14,363 |
02/23 |
$13,345 |
$14,358 |
$13,858 |
03/23 |
$13,837 |
$14,714 |
$14,197 |
04/23 |
$14,410 |
$15,129 |
$14,444 |
05/23 |
$13,747 |
$14,489 |
$13,919 |
06/23 |
$14,199 |
$15,148 |
$14,543 |
07/23 |
$14,460 |
$15,639 |
$15,134 |
08/23 |
$14,008 |
$15,039 |
$14,451 |
09/23 |
$13,616 |
$14,526 |
$13,994 |
10/23 |
$13,214 |
$13,937 |
$13,417 |
11/23 |
$14,149 |
$15,230 |
$14,625 |
12/23 |
$14,810 |
$16,040 |
$15,360 |
01/24 |
$14,682 |
$16,132 |
$15,207 |
02/24 |
$14,746 |
$16,427 |
$15,592 |
03/24 |
$15,032 |
$16,967 |
$16,079 |
04/24 |
$14,767 |
$16,533 |
$15,791 |
05/24 |
$15,276 |
$17,173 |
$16,249 |
06/24 |
$15,064 |
$16,896 |
$16,234 |
07/24 |
$15,806 |
$17,392 |
$16,610 |
08/24 |
$16,463 |
$17,957 |
$17,083 |
09/24 |
$16,760 |
$18,123 |
$17,543 |
10/24 |
$15,848 |
$17,138 |
$16,682 |
11/24 |
$15,700 |
$17,040 |
$16,531 |
12/24 |
$15,278 |
$16,653 |
$16,210 |
01/25 |
$15,764 |
$17,528 |
$16,863 |
02/25 |
$16,054 |
$17,868 |
$17,097 |
03/25 |
$16,356 |
$17,796 |
$17,058 |
04/25 |
$16,935 |
$18,611 |
$17,674 |
05/25 |
$17,492 |
$19,462 |
$18,484 |
06/25 |
$17,828 |
$19,891 |
$19,111 |
07/25 |
$17,596 |
$19,612 |
$19,056 |
08/25 |
$18,245 |
$20,448 |
$19,717 |
09/25 |
$18,303 |
$20,839 |
$20,427 |
10/25 |
$18,361 |
$21,085 |
$20,840 |
11/25 |
$18,604 |
$21,216 |
$20,835 |
12/25 |
$18,924 |
$21,852 |
$21,459 |
01/26 |
$19,718 |
$22,992 |
$22,743 |
02/26 |
$20,953 |
$24,056 |
$23,885 |
03/26 |
$19,367 |
$21,581 |
$21,308 |
04/26 |
$20,264 |
$23,189 |
$23,364 |
05/26 |
$20,420 |
$23,900 |
$24,541 |
06/26 |
$20,316 |
$23,916 |
$24,396 |
07/26 |
$21,018 |
$24,384 |
$24,480 |
08/26 |
$21,187 |
$24,869 |
$25,109 |
|
| Average Annual Return [Table Text Block] |
Table Summary
Average Annual Total Returns (%) |
1 year |
5 years |
10 years |
Institutional 3 ClassFootnote Reference(a) |
16.13 |
8.23 |
7.80 |
MSCI EAFE Index (Net) |
21.62 |
9.35 |
9.54 |
MSCI ACWI ex USA Index (Net) |
27.35 |
9.37 |
9.64 | |
| No Deduction of Taxes [Text Block] |
Performance does not reflect the deduction of taxes that a shareholder may pay on fund distributions or on the redemptions of fund shares.
|
| Updated Performance Information Location [Text Block] |
columbiathreadneedleus.com/investment-products/mutual-funds
|
| AssetsNet |
$ 239,907,077
|
| Holdings Count | Holding |
80
|
| Advisory Fees Paid, Amount |
$ 2,263,788
|
| InvestmentCompanyPortfolioTurnover |
8.00%
|
| Additional Fund Statistics [Text Block] |
Table Summary
Fund net assets |
$239,907,077 |
Total number of portfolio holdings |
80 |
Management services fees (represents 0.87% of Fund average net assets) |
$2,263,788 |
Portfolio turnover for the reporting period |
8% | |
| Holdings [Text Block] |
Table Summary
Japan |
14.2% |
|
United Kingdom |
13.6% |
|
Germany |
11.2% |
|
Australia |
9.8% |
|
France |
8.3% |
|
Switzerland |
7.7% |
|
Singapore |
7.0% |
|
United States |
4.6% |
|
Hong Kong |
4.4% |
|
Finland |
2.8% |
|
Other |
15.6% |
|
Table Summary
Industrials |
22.6% |
Consumer Staples |
15.1% |
Financials |
14.5% |
Health Care |
10.3% |
Information Technology |
10.3% |
Communication Services |
8.3% |
Materials |
7.8% |
Consumer Discretionary |
3.1% |
Utilities |
3.0% |
Energy |
2.7% | |
| Largest Holdings [Text Block] |
Table Summary
SAP SE |
2.6% |
Japan Tobacco, Inc. |
2.6% |
United Overseas Bank Ltd. |
2.6% |
Nestlé SA, Registered Shares |
2.5% |
KDDI Corp. |
2.4% |
Unilever PLC |
2.3% |
Roche Holding Ag |
2.3% |
Brambles Ltd. |
2.3% |
Mitsubishi Electric Corp. |
2.2% |
Air Liquide SA |
2.1% | |
| Material Fund Change [Text Block] |
|
| C000231683 |
|
| Shareholder Report [Line Items] |
|
| Fund Name |
Columbia Pyrford International Stock Fund
|
| Class Name |
Class R
|
| Trading Symbol |
PISJX
|
| Annual or Semi-Annual Statement [Text Block] |
This annual shareholder report contains important information about Columbia Pyrford International Stock Fund (the Fund) for the period of September 1, 2025 to August 31, 2026.
|
| Additional Information [Text Block] |
You can find additional information about the Fund at columbiathreadneedleus.com/resources/literature. You can also request more information by contacting us at 1-800-345-6611.
|
| Additional Information Phone Number |
1-800-345-6611
|
| Additional Information Website |
columbiathreadneedleus.com/resources/literature
|
| Expenses [Text Block] |
What were the Fund costs for the reporting period? (Based on a hypothetical $10,000 investment)
Table Summary
Class |
Cost of a $10,000 investment |
Cost paid as a percentage of a $10,000 investment |
Class R |
$152 |
1.41% | |
| Expenses Paid, Amount |
$ 152
|
| Expense Ratio, Percent |
1.41%
|
| Factors Affecting Performance [Text Block] |
Management's Discussion of Fund Performance The performance of Class R shares for the period presented is shown in the Average Annual Total Returns table. Top Performance ContributorsStock selection | Selections in the health care and consumer staples sectors contributed to the Fund’s relative performance during the period. Allocations | An underweight allocation to the consumer discretionary sector greatly contributed, with an underweight to real estate also boosting the Fund’s relative performance during the period. Individual holdings | Positions in Taiwan Semiconductor Manufacturing, a global leader in advanced semiconductor foundry manufacturing; Roche Holding, a Swiss pharmaceutical and diagnostics company; Japan Tobacco, a global tobacco and consumer products company; Mitsubishi Electric, a diversified electrical equipment and industrial systems manufacturer; and Woolworths Group, an Australian food and consumer staples retailer, were top contributors during the period. Top Performance DetractorsStock selection | Selections in the financials and information technology sectors hurt the Fund’s relative performance during the period. Allocations | An underweight allocation to the financials sector, as well as overweights to the consumer staples and communication services sectors, detracted from the Fund’s relative performance during the period. Individual holdings | Positions in SAP, a German enterprise software provider; Brambles, an Australian supply chain logistics and pallet pooling company; Nemetschek, a German design and construction software provider; Wolters Kluwer, a Dutch professional information and software services company; and Bank Rakyat Indonesia, an Indonesian commercial bank, were top detractors during the period. |
| Performance Past Does Not Indicate Future [Text] |
The Fund's past performance is not a good predictor of the Fund's future performance.
|
| Line Graph [Table Text Block] |
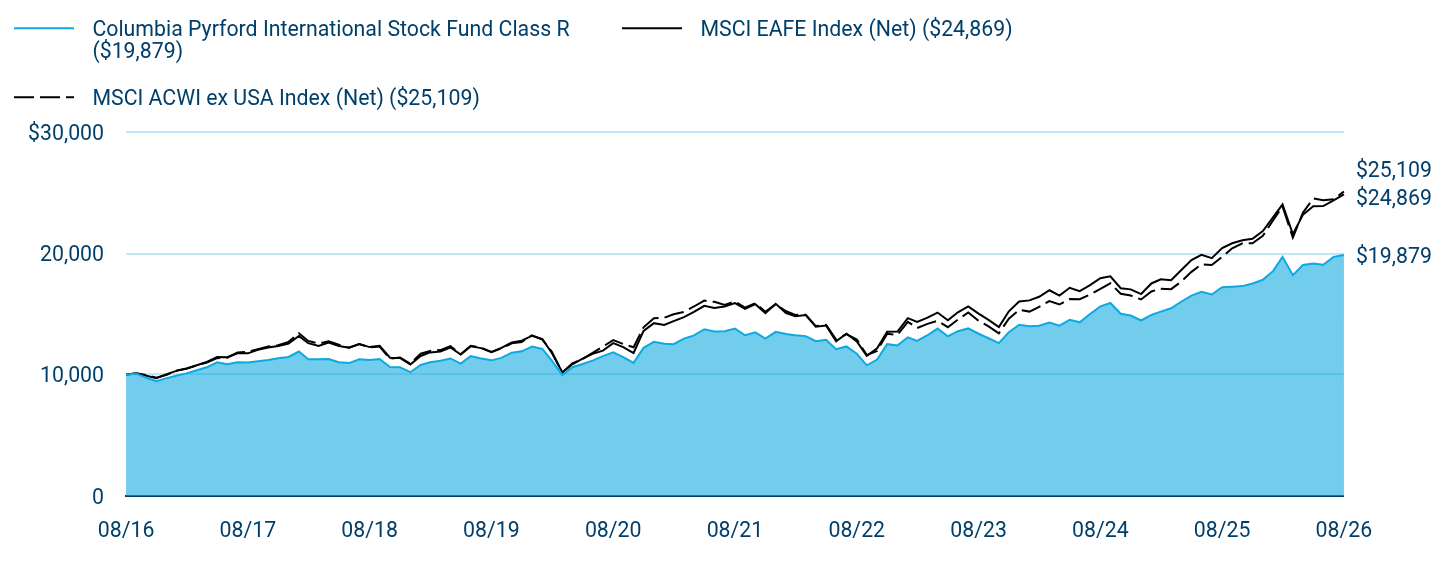
Table Summary
|
Columbia Pyrford International Stock Fund Class R ($19,879) |
MSCI EAFE Index (Net) ($24,869) |
MSCI ACWI ex USA Index (Net) ($25,109) |
08/16 |
$10,000 |
$10,000 |
$10,000 |
09/16 |
$10,102 |
$10,123 |
$10,123 |
10/16 |
$9,746 |
$9,916 |
$9,978 |
11/16 |
$9,473 |
$9,718 |
$9,747 |
12/16 |
$9,720 |
$10,051 |
$9,996 |
01/17 |
$9,941 |
$10,342 |
$10,350 |
02/17 |
$10,113 |
$10,490 |
$10,515 |
03/17 |
$10,376 |
$10,779 |
$10,782 |
04/17 |
$10,614 |
$11,053 |
$11,013 |
05/17 |
$11,019 |
$11,459 |
$11,370 |
06/17 |
$10,864 |
$11,439 |
$11,405 |
07/17 |
$11,026 |
$11,768 |
$11,826 |
08/17 |
$11,013 |
$11,764 |
$11,888 |
09/17 |
$11,117 |
$12,057 |
$12,108 |
10/17 |
$11,212 |
$12,240 |
$12,336 |
11/17 |
$11,366 |
$12,368 |
$12,436 |
12/17 |
$11,466 |
$12,567 |
$12,714 |
01/18 |
$11,913 |
$13,197 |
$13,423 |
02/18 |
$11,277 |
$12,601 |
$12,790 |
03/18 |
$11,272 |
$12,374 |
$12,564 |
04/18 |
$11,293 |
$12,657 |
$12,765 |
05/18 |
$11,024 |
$12,372 |
$12,470 |
06/18 |
$10,960 |
$12,221 |
$12,236 |
07/18 |
$11,270 |
$12,522 |
$12,528 |
08/18 |
$11,215 |
$12,280 |
$12,266 |
09/18 |
$11,304 |
$12,387 |
$12,322 |
10/18 |
$10,644 |
$11,401 |
$11,320 |
11/18 |
$10,614 |
$11,386 |
$11,427 |
12/18 |
$10,210 |
$10,834 |
$10,910 |
01/19 |
$10,808 |
$11,546 |
$11,734 |
02/19 |
$11,031 |
$11,840 |
$11,963 |
03/19 |
$11,158 |
$11,915 |
$12,034 |
04/19 |
$11,345 |
$12,250 |
$12,352 |
05/19 |
$10,921 |
$11,661 |
$11,689 |
06/19 |
$11,536 |
$12,353 |
$12,393 |
07/19 |
$11,348 |
$12,196 |
$12,243 |
08/19 |
$11,187 |
$11,880 |
$11,865 |
09/19 |
$11,391 |
$12,221 |
$12,170 |
10/19 |
$11,821 |
$12,660 |
$12,595 |
11/19 |
$11,930 |
$12,803 |
$12,706 |
12/19 |
$12,328 |
$13,219 |
$13,256 |
01/20 |
$12,126 |
$12,943 |
$12,900 |
02/20 |
$11,147 |
$11,773 |
$11,881 |
03/20 |
$9,982 |
$10,201 |
$10,160 |
04/20 |
$10,620 |
$10,860 |
$10,930 |
05/20 |
$10,884 |
$11,333 |
$11,288 |
06/20 |
$11,165 |
$11,719 |
$11,798 |
07/20 |
$11,534 |
$11,992 |
$12,324 |
08/20 |
$11,841 |
$12,609 |
$12,852 |
09/20 |
$11,462 |
$12,281 |
$12,536 |
10/20 |
$10,976 |
$11,791 |
$12,266 |
11/20 |
$12,218 |
$13,619 |
$13,916 |
12/20 |
$12,716 |
$14,252 |
$14,668 |
01/21 |
$12,556 |
$14,100 |
$14,700 |
02/21 |
$12,515 |
$14,416 |
$14,991 |
03/21 |
$12,973 |
$14,748 |
$15,181 |
04/21 |
$13,240 |
$15,192 |
$15,628 |
05/21 |
$13,751 |
$15,687 |
$16,117 |
06/21 |
$13,564 |
$15,510 |
$16,012 |
07/21 |
$13,594 |
$15,627 |
$15,748 |
08/21 |
$13,806 |
$15,903 |
$16,048 |
09/21 |
$13,257 |
$15,441 |
$15,534 |
10/21 |
$13,496 |
$15,821 |
$15,905 |
11/21 |
$12,983 |
$15,085 |
$15,188 |
12/21 |
$13,536 |
$15,857 |
$15,816 |
01/22 |
$13,361 |
$15,091 |
$15,233 |
02/22 |
$13,250 |
$14,824 |
$14,932 |
03/22 |
$13,185 |
$14,919 |
$14,956 |
04/22 |
$12,770 |
$13,954 |
$14,016 |
05/22 |
$12,881 |
$14,059 |
$14,117 |
06/22 |
$12,106 |
$12,754 |
$12,903 |
07/22 |
$12,336 |
$13,390 |
$13,344 |
08/22 |
$11,728 |
$12,754 |
$12,915 |
09/22 |
$10,777 |
$11,561 |
$11,624 |
10/22 |
$11,248 |
$12,182 |
$11,972 |
11/22 |
$12,521 |
$13,555 |
$13,385 |
12/22 |
$12,420 |
$13,565 |
$13,285 |
01/23 |
$13,086 |
$14,664 |
$14,363 |
02/23 |
$12,791 |
$14,358 |
$13,858 |
03/23 |
$13,257 |
$14,714 |
$14,197 |
04/23 |
$13,809 |
$15,129 |
$14,444 |
05/23 |
$13,162 |
$14,489 |
$13,919 |
06/23 |
$13,590 |
$15,148 |
$14,543 |
07/23 |
$13,819 |
$15,639 |
$15,134 |
08/23 |
$13,381 |
$15,039 |
$14,451 |
09/23 |
$13,010 |
$14,526 |
$13,994 |
10/23 |
$12,610 |
$13,937 |
$13,417 |
11/23 |
$13,504 |
$15,230 |
$14,625 |
12/23 |
$14,124 |
$16,040 |
$15,360 |
01/24 |
$13,994 |
$16,132 |
$15,207 |
02/24 |
$14,044 |
$16,427 |
$15,592 |
03/24 |
$14,313 |
$16,967 |
$16,079 |
04/24 |
$14,054 |
$16,533 |
$15,791 |
05/24 |
$14,533 |
$17,173 |
$16,249 |
06/24 |
$14,323 |
$16,896 |
$16,234 |
07/24 |
$15,011 |
$17,392 |
$16,610 |
08/24 |
$15,640 |
$17,957 |
$17,083 |
09/24 |
$15,919 |
$18,123 |
$17,543 |
10/24 |
$15,031 |
$17,138 |
$16,682 |
11/24 |
$14,882 |
$17,040 |
$16,531 |
12/24 |
$14,473 |
$16,653 |
$16,210 |
01/25 |
$14,928 |
$17,528 |
$16,863 |
02/25 |
$15,209 |
$17,868 |
$17,097 |
03/25 |
$15,480 |
$17,796 |
$17,058 |
04/25 |
$16,021 |
$18,611 |
$17,674 |
05/25 |
$16,530 |
$19,462 |
$18,484 |
06/25 |
$16,844 |
$19,891 |
$19,111 |
07/25 |
$16,616 |
$19,612 |
$19,056 |
08/25 |
$17,223 |
$20,448 |
$19,717 |
09/25 |
$17,266 |
$20,839 |
$20,427 |
10/25 |
$17,309 |
$21,085 |
$20,840 |
11/25 |
$17,526 |
$21,216 |
$20,835 |
12/25 |
$17,830 |
$21,852 |
$21,459 |
01/26 |
$18,565 |
$22,992 |
$22,743 |
02/26 |
$19,722 |
$24,056 |
$23,885 |
03/26 |
$18,216 |
$21,581 |
$21,308 |
04/26 |
$19,047 |
$23,189 |
$23,364 |
05/26 |
$19,180 |
$23,900 |
$24,541 |
06/26 |
$19,072 |
$23,916 |
$24,396 |
07/26 |
$19,722 |
$24,384 |
$24,480 |
08/26 |
$19,879 |
$24,869 |
$25,109 |
|
| Average Annual Return [Table Text Block] |
Table Summary
Average Annual Total Returns (%) |
1 year |
5 years |
10 years |
Class RFootnote Reference(a)Footnote Reference(b) |
15.43 |
7.56 |
7.11 |
MSCI EAFE Index (Net) |
21.62 |
9.35 |
9.54 |
MSCI ACWI ex USA Index (Net) |
27.35 |
9.37 |
9.64 | |
| No Deduction of Taxes [Text Block] |
Performance does not reflect the deduction of taxes that a shareholder may pay on fund distributions or on the redemptions of fund shares.
|
| Updated Performance Information Location [Text Block] |
columbiathreadneedleus.com/investment-products/mutual-funds
|
| AssetsNet |
$ 239,907,077
|
| Holdings Count | Holding |
80
|
| Advisory Fees Paid, Amount |
$ 2,263,788
|
| InvestmentCompanyPortfolioTurnover |
8.00%
|
| Additional Fund Statistics [Text Block] |
Table Summary
Fund net assets |
$239,907,077 |
Total number of portfolio holdings |
80 |
Management services fees (represents 0.87% of Fund average net assets) |
$2,263,788 |
Portfolio turnover for the reporting period |
8% | |
| Holdings [Text Block] |
Table Summary
Japan |
14.2% |
|
United Kingdom |
13.6% |
|
Germany |
11.2% |
|
Australia |
9.8% |
|
France |
8.3% |
|
Switzerland |
7.7% |
|
Singapore |
7.0% |
|
United States |
4.6% |
|
Hong Kong |
4.4% |
|
Finland |
2.8% |
|
Other |
15.6% |
|
Table Summary
Industrials |
22.6% |
Consumer Staples |
15.1% |
Financials |
14.5% |
Health Care |
10.3% |
Information Technology |
10.3% |
Communication Services |
8.3% |
Materials |
7.8% |
Consumer Discretionary |
3.1% |
Utilities |
3.0% |
Energy |
2.7% | |
| Largest Holdings [Text Block] |
Table Summary
SAP SE |
2.6% |
Japan Tobacco, Inc. |
2.6% |
United Overseas Bank Ltd. |
2.6% |
Nestlé SA, Registered Shares |
2.5% |
KDDI Corp. |
2.4% |
Unilever PLC |
2.3% |
Roche Holding Ag |
2.3% |
Brambles Ltd. |
2.3% |
Mitsubishi Electric Corp. |
2.2% |
Air Liquide SA |
2.1% | |
| Material Fund Change [Text Block] |
|
| C000231692 |
|
| Shareholder Report [Line Items] |
|
| Fund Name |
Columbia Ultra Short Duration Municipal Bond Fund
|
| Class Name |
Class A
|
| Trading Symbol |
USMBX
|
| Annual or Semi-Annual Statement [Text Block] |
This annual shareholder report contains important information about Columbia Ultra Short Duration Municipal Bond Fund (the Fund) for the period of September 1, 2025 to August 31, 2026.
|
| Additional Information [Text Block] |
You can find additional information about the Fund at columbiathreadneedleus.com/resources/literature. You can also request more information by contacting us at 1-800-345-6611.
|
| Additional Information Phone Number |
1-800-345-6611
|
| Additional Information Website |
columbiathreadneedleus.com/resources/literature
|
| Expenses [Text Block] |
What were the Fund costs for the reporting period? (Based on a hypothetical $10,000 investment)
Table Summary
Class |
Cost of a $10,000 investment |
Cost paid as a percentage of a $10,000 investment |
Class A |
$48 |
0.47% | |
| Expenses Paid, Amount |
$ 48
|
| Expense Ratio, Percent |
0.47%
|
| Factors Affecting Performance [Text Block] |
Management's Discussion of Fund Performance The performance of Class A shares for the period presented is shown in the Average Annual Total Returns table. Top Performance ContributorsYield carry | The Fund’s higher than benchmark yield was a significant contributor to the Fund’s benchmark-relative performance during the period. Sector allocation | Sector allocation was a major contributor to the Fund’s relative performance. Overweights to industrial development revenue bonds (IDR), housing and airports added to relative performance. Credit quality allocation | While quality allocation was neutral, an overweight to not-rated bonds added to relative performance. Credit quality security selection | While overall security selection was neutral, selection in AA-rated bonds contributed to the Fund’s performance relative to its benchmark. Sector security selection | While overall sector security selection detracted from benchmark-relative performance, selection in prepay gas bonds was a positive contributor to Fund performance. Top Performance DetractorsSector security selection | Security selection detracted from benchmark-relative performance, with selection in IDR and state general obligation (GO) bonds acting as a headwind to performance relative to the benchmark. Sector allocation | An overweight to cash detracted from relative performance. Credit quality allocation | While quality allocation was neutral, an overweight to AAA-rated bonds detracted from relative performance. Credit quality security selection | While overall security selection was neutral, selection in AAA-rated and A-rated bonds detracted from the Fund’s relative performance. |
| Performance Past Does Not Indicate Future [Text] |
The Fund's past performance is not a good predictor of the Fund's future performance.
|
| Line Graph [Table Text Block] |
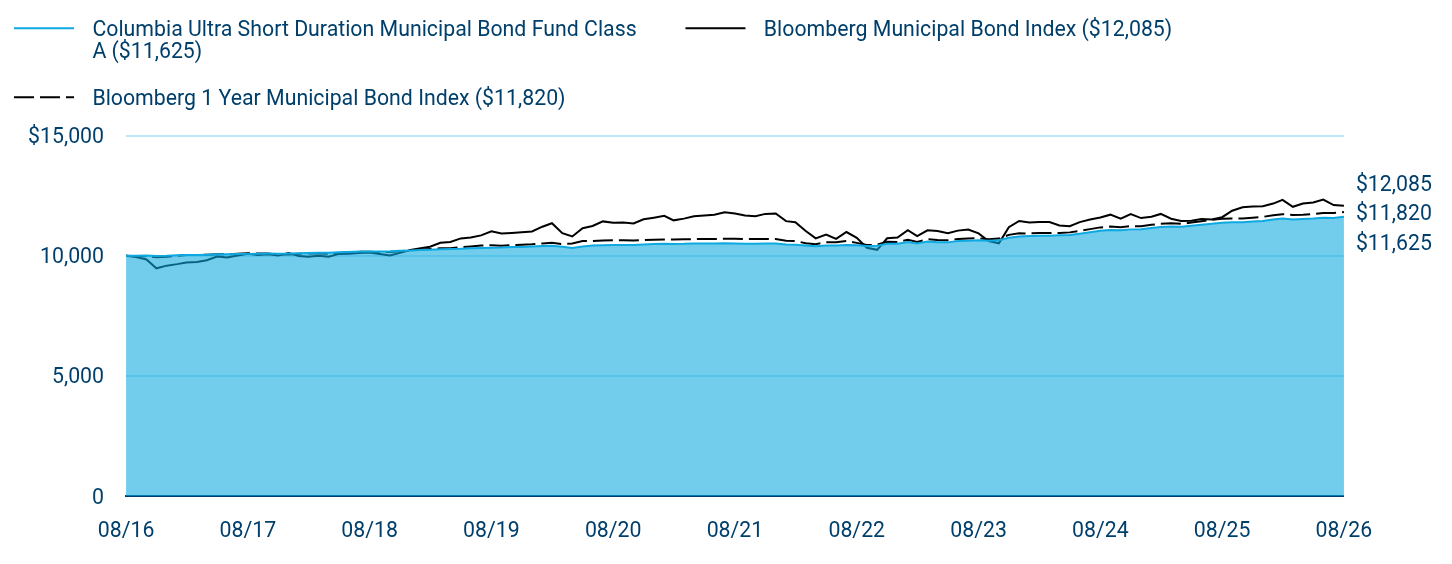
Table Summary
|
Columbia Ultra Short Duration Municipal Bond Fund Class A ($11,625) |
Bloomberg Municipal Bond Index ($12,085) |
Bloomberg 1 Year Municipal Bond Index ($11,820) |
08/16 |
$10,000 |
$10,000 |
$10,000 |
09/16 |
$10,005 |
$9,950 |
$9,979 |
10/16 |
$10,010 |
$9,846 |
$9,986 |
11/16 |
$9,995 |
$9,479 |
$9,942 |
12/16 |
$10,001 |
$9,590 |
$9,962 |
01/17 |
$10,026 |
$9,653 |
$9,998 |
02/17 |
$10,032 |
$9,720 |
$10,031 |
03/17 |
$10,038 |
$9,741 |
$10,031 |
04/17 |
$10,045 |
$9,812 |
$10,047 |
05/17 |
$10,061 |
$9,968 |
$10,066 |
06/17 |
$10,067 |
$9,932 |
$10,057 |
07/17 |
$10,074 |
$10,012 |
$10,081 |
08/17 |
$10,080 |
$10,088 |
$10,104 |
09/17 |
$10,086 |
$10,037 |
$10,092 |
10/17 |
$10,092 |
$10,062 |
$10,093 |
11/17 |
$10,089 |
$10,008 |
$10,047 |
12/17 |
$10,093 |
$10,112 |
$10,054 |
01/18 |
$10,111 |
$9,993 |
$10,082 |
02/18 |
$10,119 |
$9,963 |
$10,099 |
03/18 |
$10,127 |
$10,000 |
$10,092 |
04/18 |
$10,128 |
$9,964 |
$10,083 |
05/18 |
$10,148 |
$10,079 |
$10,116 |
06/18 |
$10,157 |
$10,087 |
$10,151 |
07/18 |
$10,175 |
$10,112 |
$10,173 |
08/18 |
$10,175 |
$10,138 |
$10,169 |
09/18 |
$10,176 |
$10,072 |
$10,149 |
10/18 |
$10,188 |
$10,010 |
$10,158 |
11/18 |
$10,210 |
$10,121 |
$10,190 |
12/18 |
$10,222 |
$10,242 |
$10,229 |
01/19 |
$10,244 |
$10,319 |
$10,260 |
02/19 |
$10,256 |
$10,375 |
$10,284 |
03/19 |
$10,269 |
$10,539 |
$10,312 |
04/19 |
$10,283 |
$10,578 |
$10,319 |
05/19 |
$10,295 |
$10,724 |
$10,358 |
06/19 |
$10,318 |
$10,764 |
$10,390 |
07/19 |
$10,329 |
$10,850 |
$10,424 |
08/19 |
$10,340 |
$11,022 |
$10,439 |
09/19 |
$10,341 |
$10,933 |
$10,417 |
10/19 |
$10,362 |
$10,953 |
$10,447 |
11/19 |
$10,371 |
$10,980 |
$10,465 |
12/19 |
$10,383 |
$11,014 |
$10,481 |
01/20 |
$10,403 |
$11,212 |
$10,517 |
02/20 |
$10,423 |
$11,356 |
$10,539 |
03/20 |
$10,373 |
$10,944 |
$10,486 |
04/20 |
$10,330 |
$10,807 |
$10,510 |
05/20 |
$10,388 |
$11,151 |
$10,614 |
06/20 |
$10,426 |
$11,242 |
$10,614 |
07/20 |
$10,444 |
$11,432 |
$10,641 |
08/20 |
$10,449 |
$11,378 |
$10,643 |
09/20 |
$10,454 |
$11,381 |
$10,650 |
10/20 |
$10,448 |
$11,346 |
$10,642 |
11/20 |
$10,473 |
$11,518 |
$10,655 |
12/20 |
$10,487 |
$11,588 |
$10,665 |
01/21 |
$10,501 |
$11,662 |
$10,682 |
02/21 |
$10,495 |
$11,476 |
$10,679 |
03/21 |
$10,498 |
$11,547 |
$10,687 |
04/21 |
$10,512 |
$11,644 |
$10,694 |
05/21 |
$10,515 |
$11,679 |
$10,698 |
06/21 |
$10,508 |
$11,711 |
$10,698 |
07/21 |
$10,520 |
$11,808 |
$10,711 |
08/21 |
$10,512 |
$11,765 |
$10,709 |
09/21 |
$10,503 |
$11,680 |
$10,698 |
10/21 |
$10,505 |
$11,645 |
$10,695 |
11/21 |
$10,507 |
$11,745 |
$10,699 |
12/21 |
$10,508 |
$11,764 |
$10,698 |
01/22 |
$10,468 |
$11,442 |
$10,627 |
02/22 |
$10,461 |
$11,401 |
$10,613 |
03/22 |
$10,433 |
$11,031 |
$10,525 |
04/22 |
$10,397 |
$10,726 |
$10,482 |
05/22 |
$10,425 |
$10,885 |
$10,562 |
06/22 |
$10,432 |
$10,707 |
$10,565 |
07/22 |
$10,452 |
$10,990 |
$10,622 |
08/22 |
$10,434 |
$10,749 |
$10,538 |
09/22 |
$10,404 |
$10,336 |
$10,448 |
10/22 |
$10,420 |
$10,250 |
$10,461 |
11/22 |
$10,497 |
$10,730 |
$10,582 |
12/22 |
$10,506 |
$10,761 |
$10,576 |
01/23 |
$10,576 |
$11,070 |
$10,665 |
02/23 |
$10,508 |
$10,819 |
$10,575 |
03/23 |
$10,591 |
$11,059 |
$10,689 |
04/23 |
$10,569 |
$11,034 |
$10,658 |
05/23 |
$10,559 |
$10,939 |
$10,646 |
06/23 |
$10,612 |
$11,048 |
$10,697 |
07/23 |
$10,623 |
$11,092 |
$10,720 |
08/23 |
$10,645 |
$10,932 |
$10,731 |
09/23 |
$10,624 |
$10,612 |
$10,687 |
10/23 |
$10,649 |
$10,521 |
$10,716 |
11/23 |
$10,748 |
$11,189 |
$10,872 |
12/23 |
$10,806 |
$11,449 |
$10,935 |
01/24 |
$10,823 |
$11,391 |
$10,932 |
02/24 |
$10,838 |
$11,406 |
$10,948 |
03/24 |
$10,834 |
$11,405 |
$10,948 |
04/24 |
$10,851 |
$11,264 |
$10,949 |
05/24 |
$10,868 |
$11,231 |
$10,975 |
06/24 |
$10,920 |
$11,403 |
$11,038 |
07/24 |
$10,982 |
$11,507 |
$11,110 |
08/24 |
$11,044 |
$11,598 |
$11,183 |
09/24 |
$11,073 |
$11,712 |
$11,218 |
10/24 |
$11,059 |
$11,542 |
$11,190 |
11/24 |
$11,100 |
$11,741 |
$11,234 |
12/24 |
$11,109 |
$11,570 |
$11,231 |
01/25 |
$11,162 |
$11,628 |
$11,290 |
02/25 |
$11,197 |
$11,743 |
$11,338 |
03/25 |
$11,215 |
$11,544 |
$11,350 |
04/25 |
$11,208 |
$11,451 |
$11,330 |
05/25 |
$11,248 |
$11,459 |
$11,384 |
06/25 |
$11,296 |
$11,530 |
$11,443 |
07/25 |
$11,331 |
$11,507 |
$11,501 |
08/25 |
$11,380 |
$11,607 |
$11,547 |
09/25 |
$11,397 |
$11,876 |
$11,556 |
10/25 |
$11,400 |
$12,023 |
$11,550 |
11/25 |
$11,425 |
$12,050 |
$11,583 |
12/25 |
$11,450 |
$12,061 |
$11,621 |
01/26 |
$11,508 |
$12,174 |
$11,685 |
02/26 |
$11,551 |
$12,326 |
$11,733 |
03/26 |
$11,507 |
$12,040 |
$11,694 |
04/26 |
$11,531 |
$12,178 |
$11,704 |
05/26 |
$11,555 |
$12,223 |
$11,739 |
06/26 |
$11,589 |
$12,341 |
$11,783 |
07/26 |
$11,576 |
$12,113 |
$11,777 |
08/26 |
$11,625 |
$12,085 |
$11,820 |
|
| Average Annual Return [Table Text Block] |
Table Summary
Average Annual Total Returns (%) |
1 year |
5 years |
10 years |
Class AFootnote Reference(a) |
2.14 |
2.03 |
1.52 |
Bloomberg Municipal Bond Index |
4.12 |
0.54 |
1.91 |
Bloomberg 1 Year Municipal Bond Index |
2.36 |
1.99 |
1.69 | |
| No Deduction of Taxes [Text Block] |
Performance does not reflect the deduction of taxes that a shareholder may pay on fund distributions or on the redemptions of fund shares.
|
| Updated Performance Information Location [Text Block] |
columbiathreadneedleus.com/investment-products/mutual-funds
|
| AssetsNet |
$ 78,071,425
|
| Holdings Count | Holding |
78
|
| Advisory Fees Paid, Amount |
$ 152,378
|
| InvestmentCompanyPortfolioTurnover |
68.00%
|
| Additional Fund Statistics [Text Block] |
Table Summary
Fund net assets |
$78,071,425 |
Total number of portfolio holdings |
78 |
Management services fees (represents 0.21% of Fund average net assets) |
$152,378 |
Portfolio turnover for the reporting period |
68% | |
| Holdings [Text Block] |
Table Summary
Texas |
14.6% |
New York |
13.2% |
California |
7.8% |
Colorado |
5.9% |
Wisconsin |
3.9% |
Florida |
3.6% |
Illinois |
3.5% |
Massachusetts |
3.4% |
Missouri |
3.2% |
Alabama |
2.7% |
Table Summary
Municipal Bonds |
79.4% |
Municipal Short Term |
14.6% |
Money Market Funds |
4.8% |
Floating Rate Notes |
2.6% | |
| Material Fund Change [Text Block] |
|
| C000231690 |
|
| Shareholder Report [Line Items] |
|
| Fund Name |
Columbia Ultra Short Duration Municipal Bond Fund
|
| Class Name |
Institutional Class
|
| Trading Symbol |
USMEX
|
| Annual or Semi-Annual Statement [Text Block] |
This annual shareholder report contains important information about Columbia Ultra Short Duration Municipal Bond Fund (the Fund) for the period of September 1, 2025 to August 31, 2026.
|
| Additional Information [Text Block] |
You can find additional information about the Fund at columbiathreadneedleus.com/resources/literature. You can also request more information by contacting us at 1-800-345-6611.
|
| Additional Information Phone Number |
1-800-345-6611
|
| Additional Information Website |
columbiathreadneedleus.com/resources/literature
|
| Expenses [Text Block] |
What were the Fund costs for the reporting period? (Based on a hypothetical $10,000 investment)
Table Summary
Class |
Cost of a $10,000 investment |
Cost paid as a percentage of a $10,000 investment |
Institutional Class |
$32 |
0.32% | |
| Expenses Paid, Amount |
$ 32
|
| Expense Ratio, Percent |
0.32%
|
| Factors Affecting Performance [Text Block] |
Management's Discussion of Fund Performance The performance of Institutional Class shares for the period presented is shown in the Average Annual Total Returns table. Top Performance ContributorsYield carry | The Fund’s higher than benchmark yield was a significant contributor to the Fund’s benchmark-relative performance during the period. Sector allocation | Sector allocation was a major contributor to the Fund’s relative performance. Overweights to industrial development revenue bonds (IDR), housing and airports added to relative performance. Credit quality allocation | While quality allocation was neutral, an overweight to not-rated bonds added to relative performance. Credit quality security selection | While overall security selection was neutral, selection in AA-rated bonds contributed to the Fund’s performance relative to its benchmark. Sector security selection | While overall sector security selection detracted from benchmark-relative performance, selection in prepay gas bonds was a positive contributor to Fund performance. Top Performance DetractorsSector security selection | Security selection detracted from benchmark-relative performance, with selection in IDR and state general obligation (GO) bonds acting as a headwind to performance relative to the benchmark. Sector allocation | An overweight to cash detracted from relative performance. Credit quality allocation | While quality allocation was neutral, an overweight to AAA-rated bonds detracted from relative performance. Credit quality security selection | While overall security selection was neutral, selection in AAA-rated and A-rated bonds detracted from the Fund’s relative performance. |
| Performance Past Does Not Indicate Future [Text] |
The Fund's past performance is not a good predictor of the Fund's future performance.
|
| Line Graph [Table Text Block] |
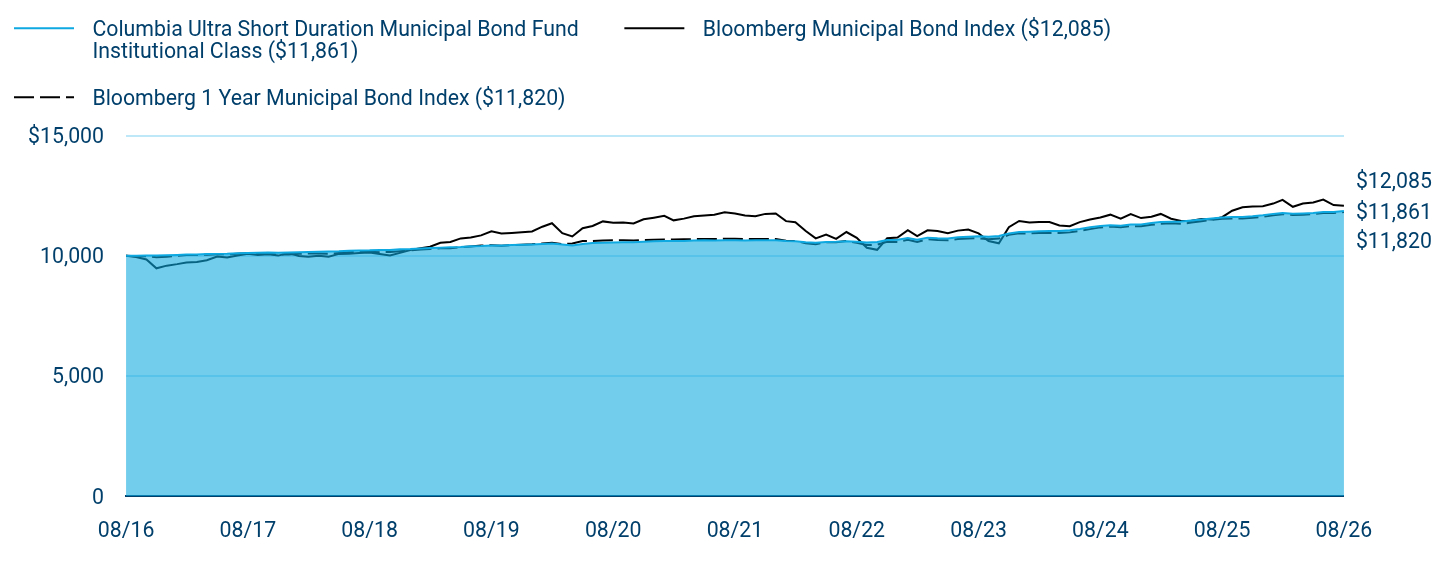
Table Summary
|
Columbia Ultra Short Duration Municipal Bond Fund Institutional Class ($11,861) |
Bloomberg Municipal Bond Index ($12,085) |
Bloomberg 1 Year Municipal Bond Index ($11,820) |
08/16 |
$10,000 |
$10,000 |
$10,000 |
09/16 |
$10,007 |
$9,950 |
$9,979 |
10/16 |
$10,015 |
$9,846 |
$9,986 |
11/16 |
$10,011 |
$9,479 |
$9,942 |
12/16 |
$10,020 |
$9,590 |
$9,962 |
01/17 |
$10,037 |
$9,653 |
$9,998 |
02/17 |
$10,055 |
$9,720 |
$10,031 |
03/17 |
$10,053 |
$9,741 |
$10,031 |
04/17 |
$10,072 |
$9,812 |
$10,047 |
05/17 |
$10,080 |
$9,968 |
$10,066 |
06/17 |
$10,089 |
$9,932 |
$10,057 |
07/17 |
$10,108 |
$10,012 |
$10,081 |
08/17 |
$10,116 |
$10,088 |
$10,104 |
09/17 |
$10,124 |
$10,037 |
$10,092 |
10/17 |
$10,133 |
$10,062 |
$10,093 |
11/17 |
$10,122 |
$10,008 |
$10,047 |
12/17 |
$10,137 |
$10,112 |
$10,054 |
01/18 |
$10,148 |
$9,993 |
$10,082 |
02/18 |
$10,157 |
$9,963 |
$10,099 |
03/18 |
$10,168 |
$10,000 |
$10,092 |
04/18 |
$10,181 |
$9,964 |
$10,083 |
05/18 |
$10,193 |
$10,079 |
$10,116 |
06/18 |
$10,215 |
$10,087 |
$10,151 |
07/18 |
$10,225 |
$10,112 |
$10,173 |
08/18 |
$10,227 |
$10,138 |
$10,169 |
09/18 |
$10,240 |
$10,072 |
$10,149 |
10/18 |
$10,244 |
$10,010 |
$10,158 |
11/18 |
$10,269 |
$10,121 |
$10,190 |
12/18 |
$10,283 |
$10,242 |
$10,229 |
01/19 |
$10,307 |
$10,319 |
$10,260 |
02/19 |
$10,322 |
$10,375 |
$10,284 |
03/19 |
$10,337 |
$10,539 |
$10,312 |
04/19 |
$10,353 |
$10,578 |
$10,319 |
05/19 |
$10,368 |
$10,724 |
$10,358 |
06/19 |
$10,393 |
$10,764 |
$10,390 |
07/19 |
$10,406 |
$10,850 |
$10,424 |
08/19 |
$10,430 |
$11,022 |
$10,439 |
09/19 |
$10,433 |
$10,933 |
$10,417 |
10/19 |
$10,446 |
$10,953 |
$10,447 |
11/19 |
$10,458 |
$10,980 |
$10,465 |
12/19 |
$10,472 |
$11,014 |
$10,481 |
01/20 |
$10,494 |
$11,212 |
$10,517 |
02/20 |
$10,516 |
$11,356 |
$10,539 |
03/20 |
$10,468 |
$10,944 |
$10,486 |
04/20 |
$10,426 |
$10,807 |
$10,510 |
05/20 |
$10,488 |
$11,151 |
$10,614 |
06/20 |
$10,528 |
$11,242 |
$10,614 |
07/20 |
$10,548 |
$11,432 |
$10,641 |
08/20 |
$10,556 |
$11,378 |
$10,643 |
09/20 |
$10,563 |
$11,381 |
$10,650 |
10/20 |
$10,559 |
$11,346 |
$10,642 |
11/20 |
$10,587 |
$11,518 |
$10,655 |
12/20 |
$10,603 |
$11,588 |
$10,665 |
01/21 |
$10,619 |
$11,662 |
$10,682 |
02/21 |
$10,615 |
$11,476 |
$10,679 |
03/21 |
$10,621 |
$11,547 |
$10,687 |
04/21 |
$10,637 |
$11,644 |
$10,694 |
05/21 |
$10,643 |
$11,679 |
$10,698 |
06/21 |
$10,638 |
$11,711 |
$10,698 |
07/21 |
$10,652 |
$11,808 |
$10,711 |
08/21 |
$10,646 |
$11,765 |
$10,709 |
09/21 |
$10,640 |
$11,680 |
$10,698 |
10/21 |
$10,643 |
$11,645 |
$10,695 |
11/21 |
$10,647 |
$11,745 |
$10,699 |
12/21 |
$10,651 |
$11,764 |
$10,698 |
01/22 |
$10,613 |
$11,442 |
$10,627 |
02/22 |
$10,606 |
$11,401 |
$10,613 |
03/22 |
$10,569 |
$11,031 |
$10,525 |
04/22 |
$10,544 |
$10,726 |
$10,482 |
05/22 |
$10,574 |
$10,885 |
$10,562 |
06/22 |
$10,583 |
$10,707 |
$10,565 |
07/22 |
$10,604 |
$10,990 |
$10,622 |
08/22 |
$10,587 |
$10,749 |
$10,538 |
09/22 |
$10,558 |
$10,336 |
$10,448 |
10/22 |
$10,576 |
$10,250 |
$10,461 |
11/22 |
$10,655 |
$10,730 |
$10,582 |
12/22 |
$10,665 |
$10,761 |
$10,576 |
01/23 |
$10,737 |
$11,070 |
$10,665 |
02/23 |
$10,670 |
$10,819 |
$10,575 |
03/23 |
$10,756 |
$11,059 |
$10,689 |
04/23 |
$10,734 |
$11,034 |
$10,658 |
05/23 |
$10,725 |
$10,939 |
$10,646 |
06/23 |
$10,770 |
$11,048 |
$10,697 |
07/23 |
$10,793 |
$11,092 |
$10,720 |
08/23 |
$10,817 |
$10,932 |
$10,731 |
09/23 |
$10,798 |
$10,612 |
$10,687 |
10/23 |
$10,824 |
$10,521 |
$10,716 |
11/23 |
$10,926 |
$11,189 |
$10,872 |
12/23 |
$10,986 |
$11,449 |
$10,935 |
01/24 |
$11,005 |
$11,391 |
$10,932 |
02/24 |
$11,022 |
$11,406 |
$10,948 |
03/24 |
$11,030 |
$11,405 |
$10,948 |
04/24 |
$11,037 |
$11,264 |
$10,949 |
05/24 |
$11,067 |
$11,231 |
$10,975 |
06/24 |
$11,120 |
$11,403 |
$11,038 |
07/24 |
$11,185 |
$11,507 |
$11,110 |
08/24 |
$11,238 |
$11,598 |
$11,183 |
09/24 |
$11,268 |
$11,712 |
$11,218 |
10/24 |
$11,256 |
$11,542 |
$11,190 |
11/24 |
$11,298 |
$11,741 |
$11,234 |
12/24 |
$11,308 |
$11,570 |
$11,231 |
01/25 |
$11,364 |
$11,628 |
$11,290 |
02/25 |
$11,412 |
$11,743 |
$11,338 |
03/25 |
$11,420 |
$11,544 |
$11,350 |
04/25 |
$11,426 |
$11,451 |
$11,330 |
05/25 |
$11,468 |
$11,459 |
$11,384 |
06/25 |
$11,507 |
$11,530 |
$11,443 |
07/25 |
$11,555 |
$11,507 |
$11,501 |
08/25 |
$11,595 |
$11,607 |
$11,547 |
09/25 |
$11,614 |
$11,876 |
$11,556 |
10/25 |
$11,619 |
$12,023 |
$11,550 |
11/25 |
$11,645 |
$12,050 |
$11,583 |
12/25 |
$11,684 |
$12,061 |
$11,621 |
01/26 |
$11,745 |
$12,174 |
$11,685 |
02/26 |
$11,778 |
$12,326 |
$11,733 |
03/26 |
$11,746 |
$12,040 |
$11,694 |
04/26 |
$11,761 |
$12,178 |
$11,704 |
05/26 |
$11,786 |
$12,223 |
$11,739 |
06/26 |
$11,823 |
$12,341 |
$11,783 |
07/26 |
$11,823 |
$12,113 |
$11,777 |
08/26 |
$11,861 |
$12,085 |
$11,820 |
|
| Average Annual Return [Table Text Block] |
Table Summary
Average Annual Total Returns (%) |
1 year |
5 years |
10 years |
Institutional ClassFootnote Reference(a)Footnote Reference(b) |
2.30 |
2.19 |
1.72 |
Bloomberg Municipal Bond Index |
4.12 |
0.54 |
1.91 |
Bloomberg 1 Year Municipal Bond Index |
2.36 |
1.99 |
1.69 | |
| No Deduction of Taxes [Text Block] |
Performance does not reflect the deduction of taxes that a shareholder may pay on fund distributions or on the redemptions of fund shares.
|
| Updated Performance Information Location [Text Block] |
columbiathreadneedleus.com/investment-products/mutual-funds
|
| AssetsNet |
$ 78,071,425
|
| Holdings Count | Holding |
78
|
| Advisory Fees Paid, Amount |
$ 152,378
|
| InvestmentCompanyPortfolioTurnover |
68.00%
|
| Additional Fund Statistics [Text Block] |
Table Summary
Fund net assets |
$78,071,425 |
Total number of portfolio holdings |
78 |
Management services fees (represents 0.21% of Fund average net assets) |
$152,378 |
Portfolio turnover for the reporting period |
68% | |
| Holdings [Text Block] |
Table Summary
Texas |
14.6% |
New York |
13.2% |
California |
7.8% |
Colorado |
5.9% |
Wisconsin |
3.9% |
Florida |
3.6% |
Illinois |
3.5% |
Massachusetts |
3.4% |
Missouri |
3.2% |
Alabama |
2.7% |
Table Summary
Municipal Bonds |
79.4% |
Municipal Short Term |
14.6% |
Money Market Funds |
4.8% |
Floating Rate Notes |
2.6% | |
| Material Fund Change [Text Block] |
|