Shareholder Report
|
12 Months Ended |
|
Aug. 31, 2026
USD ($)
Holding
|
|---|
| Shareholder Report [Line Items] |
|
| Document Type |
N-CSR
|
| Amendment Flag |
false
|
| Registrant Name |
Northern Lights Fund Trust IV
|
| Entity Central Index Key |
0001644419
|
| Entity Investment Company Type |
N-1A
|
| Document Period End Date |
Aug. 31, 2026
|
| Shareholder Report Annual or Semi-Annual |
Annual Shareholder Report
|
| C000173046 |
|
| Shareholder Report [Line Items] |
|
| Fund Name |
Anchor Risk Managed Equity Strategies Fund
|
| Trading Symbol |
ATEAX
|
| Annual or Semi-Annual Statement [Text Block] |
This annual shareholder report contains important information about Anchor Risk Managed Equity Strategies Fund for the period of September 1, 2025 to August 31, 2026.
|
| Additional Information [Text Block] |
You can find additional information about the Fund at https://anchor-capital.com/funds/. You can also request this information by contacting us at 1-800-290-8633.
|
| Additional Information Phone Number |
1-800-290-8633
|
| Additional Information Website |
https://anchor-capital.com/funds/
|
| Expenses [Text Block] |
What were the Fund’s costs for the last year?(based on a hypothetical $10,000 investment) Table SummaryClass Name | Costs of a $10,000 investment | Costs paid as a percentage of a $10,000 investment |
|---|
Advisor Class | $203 | 2.00% |
|---|
|
| Expenses Paid, Amount |
$ 203
|
| Expense Ratio, Percent |
2.00%
|
| Factors Affecting Performance [Text Block] |
How did the Fund perform during the reporting period? Market Conditions: • Performance: For the twelve-month period ended August 31, 2026, the S&P 500 Index advanced amid resilient corporate earnings and continued enthusiasm surrounding artificial intelligence, despite intermittent volatility tied to monetary policy uncertainty, rising Treasury yields, a softening labor market, and geopolitical developments. The Fund used tactical hedging and active exposure management to navigate market dislocations and changing macroeconomic conditions. By adjusting portfolio exposures and risk levels as conditions evolved, the Fund sought to limit downside participation while maintaining selective exposure to equity-market advances. • Volatility: The market experienced notable volatility throughout the period when geopolitical concerns and shifting rate expectations led to sharp intra-month movements. The S&P 500 Index had a higher daily standard deviation of 0.81%, compared to the Fund’s daily standard deviation of 0.74%, indicating more pronounced fluctuations in the broader market. • Economic Indicators: Economic growth moderated amid persistent inflation and a stable labor market. The Federal Reserve lowered its target rate in September 2025 as job growth slowed, then held rates steady through August 2026 while monitoring inflation and economic activity. In August 2026, nonfarm payrolls increased by 162,000, unemployment remained at 4.1%, and inflation stayed above the Federal Reserve’s long-term target. Shifting policy expectations, economic data, and geopolitical developments contributed to periodic market volatility. Investment Strategies and Techniques: • Long-Short Equity Strategy: The Fund employed a long-short equity strategy that used futures to hedge portfolio risk and dynamically adjust market exposure. Exposure levels were increased or reduced in response to underlying market trends and changes in volatility, allowing the Fund to adapt as market conditions evolved. • Risk Management: The Fund’s emphasis on disciplined risk management through diversification and strategic hedging helped preserve capital during periods of market turbulence. However, this prudent approach also tempered upside participation during swift market rebounds driven by headline-driven sentiment shifts. Summary Despite challenging market conditions, the Fund generated a positive return through strategic positioning and disciplined risk management. Although the S&P 500 Index delivered a higher absolute return, the Fund’s lower standard deviation reflected less volatility and a more stable return pattern during the period. This result underscores the Fund’s focus on balancing return opportunities with disciplined risk management amid heightened uncertainty. |
| Performance Past Does Not Indicate Future [Text] |
The Fund’s past performance is not a good predictor of how the Fund will perform in the future.
|
| Line Graph [Table Text Block] |
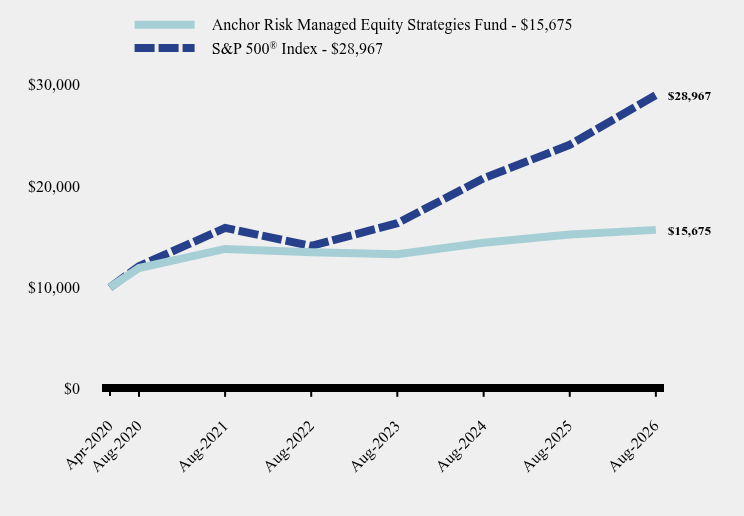
Table Summary | Anchor Risk Managed Equity Strategies Fund | S&P 500® Index |
|---|
Apr-2020 | $10,000 | $10,000 |
|---|
Aug-2020 | $11,915 | $12,098 |
|---|
Aug-2021 | $13,794 | $15,869 |
|---|
Aug-2022 | $13,460 | $14,087 |
|---|
Aug-2023 | $13,268 | $16,333 |
|---|
Aug-2024 | $14,414 | $20,766 |
|---|
Aug-2025 | $15,212 | $24,063 |
|---|
Aug-2026 | $15,675 | $28,967 |
|---|
|
| Average Annual Return [Table Text Block] |
Table Summary | 1 Year | 5 Years | Since Inception (April 30, 2020) |
|---|
Anchor Risk Managed Equity Strategies Fund | 3.04% | 2.59% | 7.35% |
|---|
S&P 500® Index | 20.38% | 12.79% | 18.27% |
|---|
|
| Performance Inception Date |
Apr. 30, 2020
|
| No Deduction of Taxes [Text Block] |
The graph and table do not reflect the deduction of taxes that a shareholder would pay on fund distributions or redemption of fund shares.
|
| AssetsNet |
$ 114,980,360
|
| Holdings Count | Holding |
3
|
| Advisory Fees Paid, Amount |
$ 2,289,797
|
| InvestmentCompanyPortfolioTurnover |
0.00%
|
| Additional Fund Statistics [Text Block] |
- Net Assets$114,980,360
- Number of Portfolio Holdings3
- Advisory Fee (net of waivers)$2,289,797
- Portfolio Turnover0%
|
| Holdings [Text Block] |
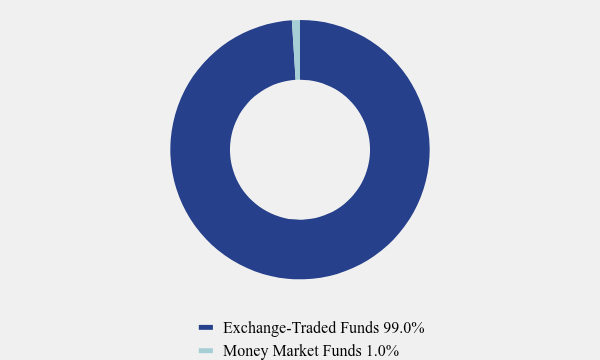
Asset Weighting (% of total investments)Table SummaryValue | Value |
|---|
Exchange-Traded Funds | 99.0% | Money Market Funds | 1.0% | Asset Weighting (% of total
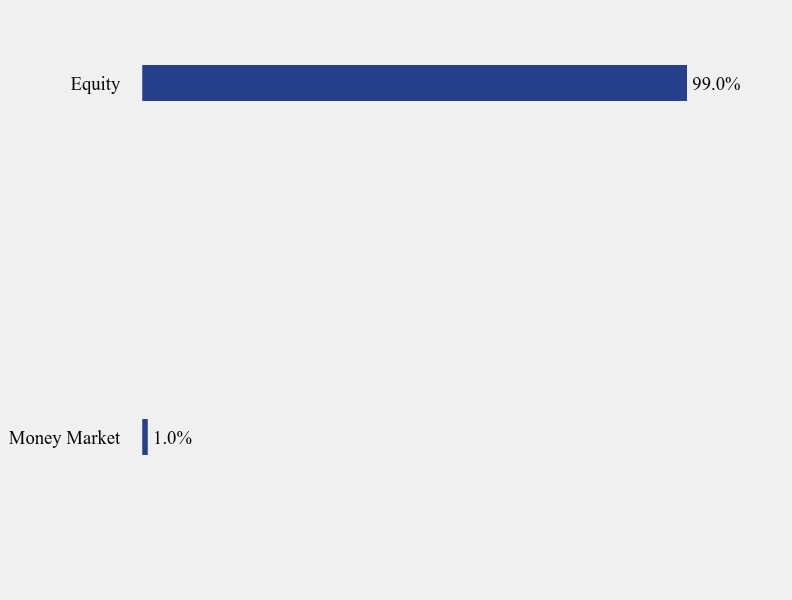
investments)Table SummaryValue | Value |
|---|
Money Market | 1.0% | Equity | 99.0% | |
| Largest Holdings [Text Block] |
Top 10 Holdings (% of net assets)Table SummaryHolding Name | % of Net Assets |
|---|
Invesco QQQ Trust Series 1 | 56.1% |
|---|
State Street SPDR S&P 500 ETF Trust | 38.1% |
|---|
First American Government Obligations Fund Class X | 0.9% |
|---|
|
| Material Fund Change [Text Block] |
No material changes occurred during the year ended August 31, 2026. |
| C000173045 |
|
| Shareholder Report [Line Items] |
|
| Fund Name |
Anchor Risk Managed Equity Strategies Fund
|
| Trading Symbol |
ATESX
|
| Annual or Semi-Annual Statement [Text Block] |
This annual shareholder report contains important information about Anchor Risk Managed Equity Strategies Fund for the period of September 1, 2025 to August 31, 2026.
|
| Additional Information [Text Block] |
You can find additional information about the Fund at https://anchor-capital.com/funds/. You can also request this information by contacting us at 1-800-290-8633.
|
| Additional Information Phone Number |
1-800-290-8633
|
| Additional Information Website |
https://anchor-capital.com/funds/
|
| Expenses [Text Block] |
What were the Fund’s costs for the last year?(based on a hypothetical $10,000 investment) Table SummaryClass Name | Costs of a $10,000 investment | Costs paid as a percentage of a $10,000 investment |
|---|
Institutional Class | $228 | 2.25% |
|---|
|
| Expenses Paid, Amount |
$ 228
|
| Expense Ratio, Percent |
2.25%
|
| Factors Affecting Performance [Text Block] |
How did the Fund perform during the reporting period? Market Conditions: • Performance: For the twelve-month period ended August 31, 2026, the S&P 500 Index advanced amid resilient corporate earnings and continued enthusiasm surrounding artificial intelligence, despite intermittent volatility tied to monetary policy uncertainty, rising Treasury yields, a softening labor market, and geopolitical developments. The Fund used tactical hedging and active exposure management to navigate market dislocations and changing macroeconomic conditions. By adjusting portfolio exposures and risk levels as conditions evolved, the Fund sought to limit downside participation while maintaining selective exposure to equity-market advances. • Volatility: The market experienced notable volatility throughout the period when geopolitical concerns and shifting rate expectations led to sharp intra-month movements. The S&P 500 Index had a higher daily standard deviation of 0.81%, compared to the Fund’s daily standard deviation of 0.74%, indicating more pronounced fluctuations in the broader market. • Economic Indicators: Economic growth moderated amid persistent inflation and a stable labor market. The Federal Reserve lowered its target rate in September 2025 as job growth slowed, then held rates steady through August 2026 while monitoring inflation and economic activity. In August 2026, nonfarm payrolls increased by 162,000, unemployment remained at 4.1%, and inflation stayed above the Federal Reserve’s long-term target. Shifting policy expectations, economic data, and geopolitical developments contributed to periodic market volatility. Investment Strategies and Techniques: • Long-Short Equity Strategy: The Fund employed a long-short equity strategy that used futures to hedge portfolio risk and dynamically adjust market exposure. Exposure levels were increased or reduced in response to underlying market trends and changes in volatility, allowing the Fund to adapt as market conditions evolved. • Risk Management: The Fund’s emphasis on disciplined risk management through diversification and strategic hedging helped preserve capital during periods of market turbulence. However, this prudent approach also tempered upside participation during swift market rebounds driven by headline-driven sentiment shifts. Summary Despite challenging market conditions, the Fund generated a positive return through strategic positioning and disciplined risk management. Although the S&P 500 Index delivered a higher absolute return, the Fund’s lower standard deviation reflected less volatility and a more stable return pattern during the period. This result underscores the Fund’s focus on balancing return opportunities with disciplined risk management amid heightened uncertainty. |
| Performance Past Does Not Indicate Future [Text] |
The Fund’s past performance is not a good predictor of how the Fund will perform in the future.
|
| Line Graph [Table Text Block] |
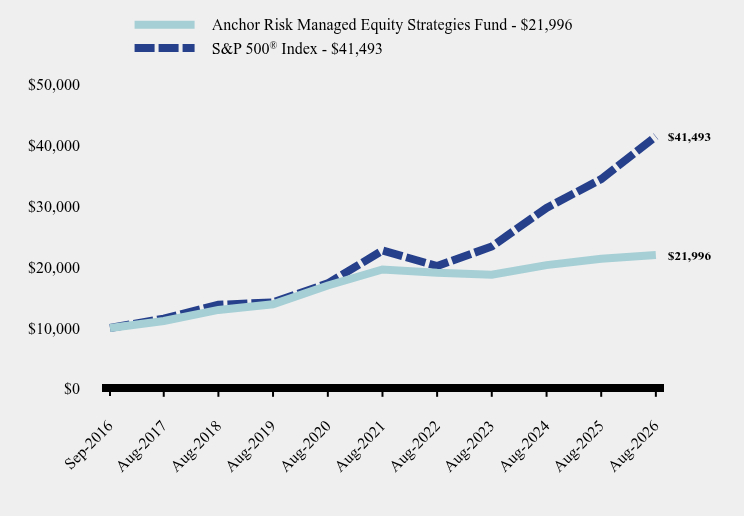
Table Summary | Anchor Risk Managed Equity Strategies Fund | S&P 500® Index |
|---|
Sep-2016 | $10,000 | $10,000 |
|---|
Aug-2017 | $11,148 | $11,540 |
|---|
Aug-2018 | $12,969 | $13,809 |
|---|
Aug-2019 | $13,887 | $14,212 |
|---|
Aug-2020 | $16,982 | $17,330 |
|---|
Aug-2021 | $19,609 | $22,731 |
|---|
Aug-2022 | $19,068 | $20,179 |
|---|
Aug-2023 | $18,760 | $23,396 |
|---|
Aug-2024 | $20,330 | $29,745 |
|---|
Aug-2025 | $21,394 | $34,468 |
|---|
Aug-2026 | $21,996 | $41,493 |
|---|
|
| Average Annual Return [Table Text Block] |
Table Summary | 1 Year | 5 Years | Since Inception (September 6, 2016) |
|---|
Anchor Risk Managed Equity Strategies Fund | 2.81% | 2.32% | 8.22% |
|---|
S&P 500® Index | 20.38% | 12.79% | 15.32% |
|---|
|
| Performance Inception Date |
Sep. 06, 2016
|
| No Deduction of Taxes [Text Block] |
The graph and table do not reflect the deduction of taxes that a shareholder would pay on fund distributions or redemption of fund shares.
|
| AssetsNet |
$ 114,980,360
|
| Holdings Count | Holding |
3
|
| Advisory Fees Paid, Amount |
$ 2,289,797
|
| InvestmentCompanyPortfolioTurnover |
0.00%
|
| Additional Fund Statistics [Text Block] |
- Net Assets$114,980,360
- Number of Portfolio Holdings3
- Advisory Fee (net of waivers)$2,289,797
- Portfolio Turnover0%
|
| Holdings [Text Block] |
Asset Weighting (% of total investments)Table SummaryValue | Value |
|---|
Exchange-Traded Funds | 99.0% | Money Market Funds | 1.0% | Asset Weighting (% of total investments)Table SummaryValue | Value |
|---|
Money Market | 1.0% | Equity | 99.0% | |
| Largest Holdings [Text Block] |
Top 10 Holdings (% of net assets)Table SummaryHolding Name | % of Net Assets |
|---|
Invesco QQQ Trust Series 1 | 56.1% |
|---|
State Street SPDR S&P 500 ETF Trust | 38.1% |
|---|
First American Government Obligations Fund Class X | 0.9% |
|---|
|
| Material Fund Change [Text Block] |
No material changes occurred during the year ended August 31, 2026. |
| C000159233 |
|
| Shareholder Report [Line Items] |
|
| Fund Name |
Anchor Risk Managed Income Strategies Fund
|
| Trading Symbol |
ATCAX
|
| Annual or Semi-Annual Statement [Text Block] |
This annual shareholder report contains important information about Anchor Risk Managed Income Strategies Fund for the period of September 1, 2025 to August 31, 2026.
|
| Additional Information [Text Block] |
You can find additional information about the Fund at https://anchor-capital.com/funds/. You can also request this information by contacting us at 1-800-290-8633.
|
| Additional Information Phone Number |
1-800-290-8633
|
| Additional Information Website |
https://anchor-capital.com/funds/
|
| Expenses [Text Block] |
What were the Fund’s costs for the last year?(based on a hypothetical $10,000 investment) Table SummaryClass Name | Costs of a $10,000 investment | Costs paid as a percentage of a $10,000 investment |
|---|
Advisor Class | $202 | 2.00% |
|---|
|
| Expenses Paid, Amount |
$ 202
|
| Expense Ratio, Percent |
2.00%
|
| Factors Affecting Performance [Text Block] |
How did the Fund perform during the reporting period? Market Conditions: • Performance: The Bloomberg U.S. Aggregate Bond Index experienced a total return of 1.89% over the reporting period. The Fund had a total return of 1.57%, trailing the benchmark. • Volatility: The U.S. Bond market experienced notable fluctuations, with the Bloomberg U.S. Aggregate Bond Index posting a daily standard deviation of 0.23%. In comparison, the Fund maintained a slightly higher volatility at 0.48%, reflecting its more active approach. However, the Fund’s beta of 0.47 and low correlation of 0.24 to the benchmark indicate limited sensitivity to broader market movements, contributing to a differentiated risk-return profile. Investment Strategies and Techniques: • Dynamic Investment Exposure: The Fund’s exposure was actively managed through a diversified mix of ETFs and index-based derivatives. This dynamic allocation strategy focused on capturing income opportunities while managing volatility and downside risk. Tactical shifts were made in response to macroeconomic developments and market dislocations, allowing the Fund to remain agile and responsive. • Risk Management: The Fund employed advanced risk management techniques, including diversification across asset classes and sectors, regular stress testing, and the use of index-based derivatives to hedge against market volatility. These strategies helped to protect capital and maintain stability during periods of market turbulence. Summary During the reporting period, the Bloomberg U.S. Aggregate Bond Index returned 1.89%, compared with 1.57% for the Fund. Fixed income markets were shaped by shifting interest-rate expectations, persistent inflation, and changing economic data. Against this backdrop, the Fund’s dynamic investment exposure and active allocation across ETFs and index-based derivatives supported positive performance while maintaining a differentiated approach to traditional bond-market exposure. In an uncertain market environment, the Fund’s flexible allocation, diversification, and disciplined risk management may complement traditional fixed income holdings. The strategy remained focused on identifying income opportunities, responding to changing market conditions, and managing downside risk while seeking competitive long-term returns. |
| Performance Past Does Not Indicate Future [Text] |
The Fund’s past performance is not a good predictor of how the Fund will perform in the future.
|
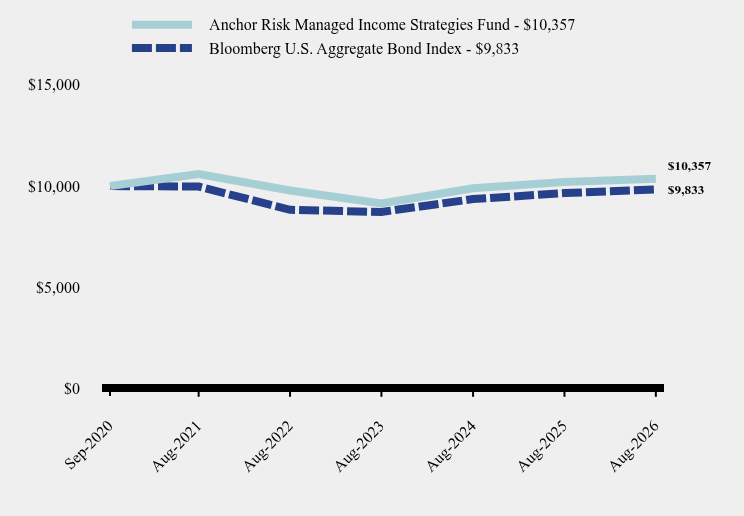
| Line Graph [Table Text Block] |
Table Summary | Anchor Risk Managed Income Strategies Fund | Bloomberg U.S. Aggregate Bond Index |
|---|
Sep-2020 | $10,000 | $10,000 |
|---|
Aug-2021 | $10,592 | $9,975 |
|---|
Aug-2022 | $9,781 | $8,826 |
|---|
Aug-2023 | $9,146 | $8,721 |
|---|
Aug-2024 | $9,887 | $9,357 |
|---|
Aug-2025 | $10,197 | $9,651 |
|---|
Aug-2026 | $10,357 | $9,833 |
|---|
|
| Average Annual Return [Table Text Block] |
Table Summary | 1 Year | 5 Years | Since Inception (September 11, 2020) |
|---|
Anchor Risk Managed Income Strategies Fund | 1.57% | -0.45% | 0.59% |
|---|
Bloomberg U.S. Aggregate Bond Index | 1.89% | -0.29% | -0.28% |
|---|
|
| Performance Inception Date |
Sep. 11, 2020
|
| No Deduction of Taxes [Text Block] |
The graph and table do not reflect the deduction of taxes that a shareholder would pay on fund distributions or redemption of fund shares.
|
| AssetsNet |
$ 15,512,025
|
| Holdings Count | Holding |
12
|
| Advisory Fees Paid, Amount |
$ 193,242
|
| InvestmentCompanyPortfolioTurnover |
29.00%
|
| Additional Fund Statistics [Text Block] |
- Net Assets$15,512,025
- Number of Portfolio Holdings12
- Advisory Fee (net of waivers)$193,242
- Portfolio Turnover29%
|
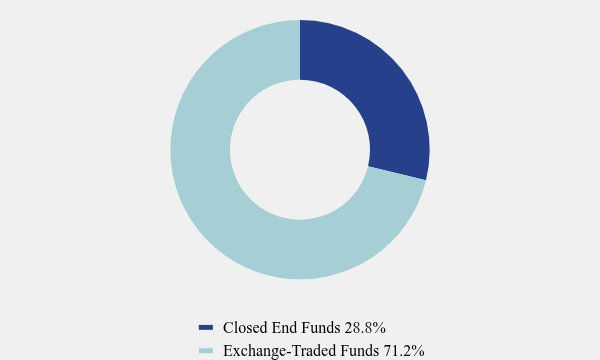
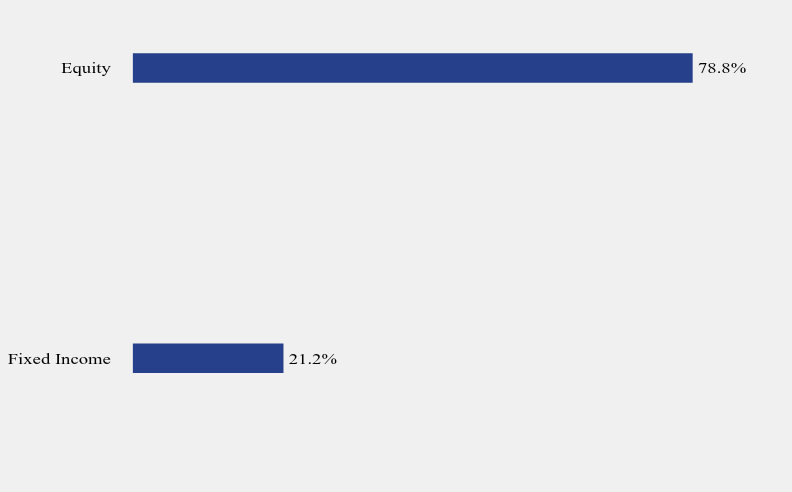
| Holdings [Text Block] |
Asset Weighting (% of total investments)Table SummaryValue | Value |
|---|
Closed End Funds | 28.8% | Exchange-Traded Funds | 71.2% | Asset Weighting (% of total investments)Table SummaryValue | Value |
|---|
Fixed Income | 21.2% | Equity | 78.8% | |
| Largest Holdings [Text Block] |
Top 10 Holdings (% of net assets)Table SummaryHolding Name | % of Net Assets |
|---|
JPMorgan Nasdaq Equity Premium Income ETF | 15.3% |
|---|
Global X Nasdaq 100 Covered Call ETF | 11.7% |
|---|
First Trust Nasdaq BuyWrite Income ETF | 10.5% |
|---|
First Trust BuyWrite Income ETF | 10.3% |
|---|
PIMCO Dynamic Income Fund | 8.3% |
|---|
Defiance Nasdaq 100 Target 30 Weekly Distribution ETF | 7.9% |
|---|
Defiance S&P 500 Target 30 Weekly Distribution ETF | 7.6% |
|---|
PIMCO Dynamic Income Opportunities Fund | 6.8% |
|---|
AllianceBernstein Global High Income Fund, Inc. | 5.2% |
|---|
NEOS Nasdaq-100 Hedged Equity Income ETF | 4.9% |
|---|
|
| Material Fund Change [Text Block] |
No material changes occurred during the year ended August 31, 2026. |
| C000161918 |
|
| Shareholder Report [Line Items] |
|
| Fund Name |
Anchor Risk Managed Income Strategies Fund
|
| Trading Symbol |
ATCSX
|
| Annual or Semi-Annual Statement [Text Block] |
This annual shareholder report contains important information about Anchor Risk Managed Income Strategies Fund for the period of September 1, 2025 to August 31, 2026.
|
| Additional Information [Text Block] |
You can find additional information about the Fund at https://anchor-capital.com/funds/. You can also request this information by contacting us at 1-800-290-8633.
|
| Additional Information Phone Number |
1-800-290-8633
|
| Additional Information Website |
https://anchor-capital.com/funds/
|
| Expenses [Text Block] |
What were the Fund’s costs for the last year?(based on a hypothetical $10,000 investment) Table SummaryClass Name | Costs of a $10,000 investment | Costs paid as a percentage of a $10,000 investment |
|---|
Institutional Class | $227 | 2.25% |
|---|
|
| Expenses Paid, Amount |
$ 227
|
| Expense Ratio, Percent |
2.25%
|
| Factors Affecting Performance [Text Block] |
How did the Fund perform during the reporting period? Market Conditions: • Performance: The Bloomberg U.S. Aggregate Bond Index experienced a total return of 1.89% over the reporting period. The Fund had a total return of 1.34%, trailing the benchmark. • Volatility: The U.S. Bond market experienced notable fluctuations, with the Bloomberg U.S. Aggregate Bond Index posting a daily standard deviation of 0.23%. In comparison, the Fund maintained a slightly higher volatility at 0.47%, reflecting its more active approach. However, the Fund’s beta of 0.46 and low correlation of 0.23 to the benchmark indicate limited sensitivity to broader market movements, contributing to a differentiated risk-return profile. Investment Strategies and Techniques: • Dynamic Investment Exposure: The Fund’s exposure was actively managed through a diversified mix of ETFs and index-based derivatives. This dynamic allocation strategy focused on capturing income opportunities while managing volatility and downside risk. Tactical shifts were made in response to macroeconomic developments and market dislocations, allowing the Fund to remain agile and responsive. • Risk Management: The Fund employed advanced risk management techniques, including diversification across asset classes and sectors, regular stress testing, and the use of index-based derivatives to hedge against market volatility. These strategies helped to protect capital and maintain stability during periods of market turbulence. Summary During the reporting period, the Bloomberg U.S. Aggregate Bond Index returned 1.89%, compared with 1.34% for the Fund. Fixed income markets were shaped by shifting interest-rate expectations, persistent inflation, and changing economic data. Against this backdrop, the Fund’s dynamic investment exposure and active allocation across ETFs and index-based derivatives supported positive performance while maintaining a differentiated approach to traditional bond-market exposure. In an uncertain market environment, the Fund’s flexible allocation, diversification, and disciplined risk management may complement traditional fixed income holdings. The strategy remained focused on identifying income opportunities, responding to changing market conditions, and managing downside risk while seeking competitive long-term returns. |
| Performance Past Does Not Indicate Future [Text] |
The Fund’s past performance is not a good predictor of how the Fund will perform in the future.
|
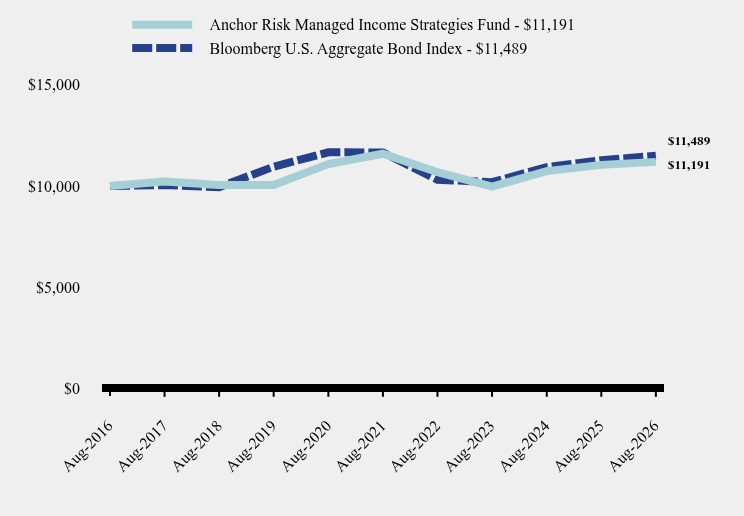
| Line Graph [Table Text Block] |
Table Summary | Anchor Risk Managed Income Strategies Fund | Bloomberg U.S. Aggregate Bond Index |
|---|
Aug-2016 | $10,000 | $10,000 |
|---|
Aug-2017 | $10,222 | $10,049 |
|---|
Aug-2018 | $10,053 | $9,944 |
|---|
Aug-2019 | $10,049 | $10,955 |
|---|
Aug-2020 | $11,086 | $11,664 |
|---|
Aug-2021 | $11,592 | $11,655 |
|---|
Aug-2022 | $10,683 | $10,313 |
|---|
Aug-2023 | $9,966 | $10,189 |
|---|
Aug-2024 | $10,734 | $10,933 |
|---|
Aug-2025 | $11,043 | $11,276 |
|---|
Aug-2026 | $11,191 | $11,489 |
|---|
|
| Average Annual Return [Table Text Block] |
Table Summary | 1 Year | 5 Years | 10 Years |
|---|
Anchor Risk Managed Income Strategies Fund | 1.34% | -0.70% | 1.13% |
|---|
Bloomberg U.S. Aggregate Bond Index | 1.89% | -0.29% | 1.40% |
|---|
|
| No Deduction of Taxes [Text Block] |
The graph and table do not reflect the deduction of taxes that a shareholder would pay on fund distributions or redemption of fund shares.
|
| AssetsNet |
$ 15,512,025
|
| Holdings Count | Holding |
12
|
| Advisory Fees Paid, Amount |
$ 193,242
|
| InvestmentCompanyPortfolioTurnover |
29.00%
|
| Additional Fund Statistics [Text Block] |
- Net Assets$15,512,025
- Number of Portfolio Holdings12
- Advisory Fee (net of waivers)$193,242
- Portfolio Turnover29%
|
| Holdings [Text Block] |
Asset Weighting (% of total investments)Table SummaryValue | Value |
|---|
Closed End Funds | 28.8% | Exchange-Traded Funds | 71.2% | Asset Weighting (% of total investments)Table SummaryValue | Value |
|---|
Fixed Income | 21.2% | Equity | 78.8% | |
| Largest Holdings [Text Block] |
Top 10 Holdings (% of net assets)Table SummaryHolding Name | % of Net Assets |
|---|
JPMorgan Nasdaq Equity Premium Income ETF | 15.3% |
|---|
Global X Nasdaq 100 Covered Call ETF | 11.7% |
|---|
First Trust Nasdaq BuyWrite Income ETF | 10.5% |
|---|
First Trust BuyWrite Income ETF | 10.3% |
|---|
PIMCO Dynamic Income Fund | 8.3% |
|---|
Defiance Nasdaq 100 Target 30 Weekly Distribution ETF | 7.9% |
|---|
Defiance S&P 500 Target 30 Weekly Distribution ETF | 7.6% |
|---|
PIMCO Dynamic Income Opportunities Fund | 6.8% |
|---|
AllianceBernstein Global High Income Fund, Inc. | 5.2% |
|---|
NEOS Nasdaq-100 Hedged Equity Income ETF | 4.9% |
|---|
|
| Material Fund Change [Text Block] |
No material changes occurred during the year ended August 31, 2026. |