Pay vs Performance Disclosure - USD ($)
|
12 Months Ended |
Aug. 01, 2026 |
Aug. 02, 2025 |
Aug. 03, 2024 |
Jul. 29, 2023 |
Jul. 30, 2022 |
| Pay vs Performance Disclosure |
|
|
|
|
|
| Pay vs Performance Disclosure, Table |
The table below shows compensation actually paid, as defined by the SEC in Item 402(v) of Regulation S-K (“Item 402(v)”), for our executives, and our financial performance for the fiscal years ended August 1, 2026, August 2, 2025, August 3, 2024, July 29, 2023, and July 30, 2022. For purposes of this discussion, our CEO is also referred to as our principal executive officer or “PEO” and our other named executive officers are referred to as our “Non-PEO NEOs”: | | | | | | | | | | | | | | | | | | | | | | | | | | | | | | | | | | | | | | | | Summary Compensation Table (“SCT”) Totals For: | Compensation Actually Paid (“CAP”) To: | | | Value of Initial Fixed $100 Investment Based On: | | | Year | PEO 1 ($) (1)(2) | PEO 2 ($) (1)(2) | PEO 3 ($) (1)(2) |
PEO 1 ($) (1)(3) |
PEO 2 ($) (1)(3) | PEO 3 ($) (1)(3) | Average SCT Total for Non-PEO NEOs ($) (1)(2) | Average CAP to Non-PEO NEOs ($) (1)(3) | Total Shareholder Return ($) (4) | Peer Group Total Shareholder Return ($) (5) | Net Loss (in thousands) ($) (6) | Adjusted EBITDA (in thousands) ($) (7) | | 2026 | N/A | N/A | 8,560,536 | | N/A | N/A | 7,217,099 | | 2,891,101 | | 2,615,004 | | 7.46 | | 102.52 | | (12,606) | | 53,387 | | | 2025 | N/A | N/A | 10,129,032 | | N/A | N/A | 11,249,951 | | 3,508,770 | | 4,846,565 | | 8.33 | | 88.10 | | (28,739) | | 49,139 | | | 2024 | N/A | N/A | 1,464,928 | | N/A | N/A | (3,215,275) | | 2,945,147 | | 2,266,228 | | 7.59 | | 82.36 | | (128,840) | | 29,281 | | | 2023 | 476,112 | | 652,000 | | 9,838,545 | | 336,828 | | (2,670,068) | | 14,172,325 | | 3,148,095 | | 1,407,739 | | 9.11 | | 73.42 | | (171,973) | | 16,814 | | | 2022 | N/A | 3,134,920 | | N/A | N/A | (26,070,368) | | N/A | 5,631,793 | | (370,343) | | 11.07 | | 68.03 | | (207,121) | | (19,455) | |
|
|
|
|
|
| Company Selected Measure Name |
Adjusted EBITDA
|
|
|
|
|
| Named Executive Officers, Footnote |
NEOs included in these tables reflect the following individuals: | | | | | | | | | | | | Year | PEO | Non-PEO NEOs | | 2026 | PEO 3 | Matt Baer | David Aufderhaar, Casey O’Connor, Sree Sreedhararaj, Anthony Bacos | | 2025 | PEO 3 | Matt Baer | David Aufderhaar, Casey O’Connor, Anthony Bacos | 2024 | PEO 3 | Matt Baer | David Aufderhaar, Casey O’Connor, Anthony Bacos | | 2023 | PEO 1 | Katrina Lake | Dan Jedda, Scott Darling, Sachin Dhawan, David Aufderhaar, Casey O’Connor | | PEO 2 | Elizabeth Spaulding | | PEO 3 | Matt Baer | | 2022 | PEO 2 | Elizabeth Spaulding | Dan Jedda, Scott Darling, Sachin Dhawan |
|
|
|
|
|
| Peer Group Issuers, Footnote |
Peer Group TSR represents the cumulative total return on a fixed investment of $100 in the Standard and Poor’s Retail Select Industry Index for the period beginning on the last trading day of fiscal year ended July 30, 2022 through the end of each applicable fiscal year (August 1, 2026), assuming reinvestment of dividends.
|
|
|
|
|
| Adjustment To PEO Compensation, Footnote |
CAP has been calculated based on the requirements and methodology set forth in the applicable SEC rules (Item 402(v) of Regulation S-K). The CAP calculation includes the end-of-year value of awards granted within the fiscal year, the change in fair value from prior year end of vested awards and the change in the fair value of unvested awards granted in prior years, regardless of if, when, or at which intrinsic value they will actually vest. To calculate CAP for fiscal year 2026, the following amounts were deducted from and added to the total compensation number shown in the SCT:
| | | | | | | | | | Reconciliation of SCT Total to CAP | Fiscal Year 2026 (For PEO 3) | Fiscal Year 2026 (Average For Non-PEO NEOs) | Summary Compensation Table Total | 8,560,536 | 2,891,101 | Less: Amounts Reported in SCT for Stock and Option Awards Based on Grant Date Fair Value | (5,879,502) | (2,087,201) | | | | | | | Plus: Fair Value at Fiscal Year End of Outstanding and Unvested Equity Awards Granted in the Fiscal Year | 4,618,220 | 1,778,064 | Plus/Less: Change in Fair Value of Outstanding and Unvested Equity Awards Granted in Prior Fiscal Years | (831,792) | (199,112) | Plus: Fair Value at Vesting of Equity Awards Granted and Vested in the Fiscal Year | 606,143 | 182,896 | Plus/ Less: Change in Fair Value as of the Vesting Date of Equity Awards Granted in Prior Fiscal Years that Vested in the Fiscal Year | 143,493 | 49,255 | | | | | | | Compensation Actually Paid | 7,217,099 | 2,615,004 |
For purposes of the above adjustments, the fair values of equity awards on the applicable date were determined in accordance with ASC Topic 718, using valuation methodologies that are generally consistent with those used to determine the grant date fair value for accounting purposes. The assumptions used in calculating such amounts are set forth in the notes to our audited consolidated financial statements included in our 2026 Annual Report.
The table below contains ranges of assumptions used in the valuation of outstanding equity awards for the relevant fiscal year(s). For more information, please see the notes to our financial statements in our 2026 Annual Report and the footnotes to the Summary Compensation Table of this proxy statement.
| | | | | | | Fiscal Year 2026 | Restricted Stock Units | | Stock Price | $3.15 - $5.94 | Stock Options | | Expected Term (years) | 0.7 - 3.7 | Strike Price | $2.48 - $5.02 | Volatility | 70.8% - 88.5% | Dividend Yield | 0.0% - 0.0% | Risk-Free Interest Rate | 3.4% - 4.2% |
|
|
|
|
|
| Non-PEO NEO Average Total Compensation Amount |
$ 2,891,101
|
$ 3,508,770
|
$ 2,945,147
|
$ 3,148,095
|
$ 5,631,793
|
| Non-PEO NEO Average Compensation Actually Paid Amount |
$ 2,615,004
|
4,846,565
|
2,266,228
|
1,407,739
|
(370,343)
|
| Compensation Actually Paid vs. Total Shareholder Return |
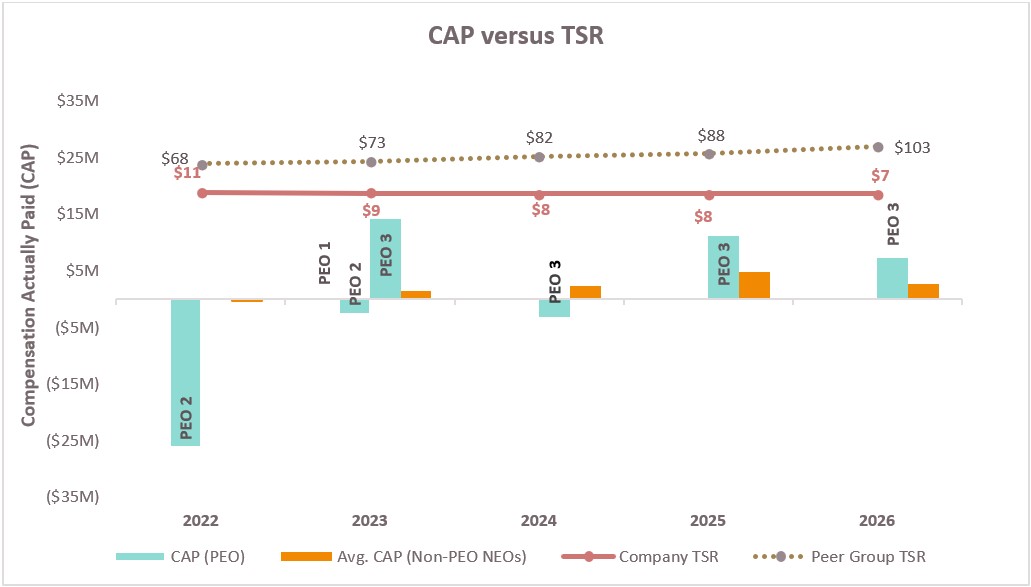
The following chart illustrates the relationship between CAP for our PEO and the average CAP for our Non-PEO NEOs against our TSR, as well as the relationship between our TSR and the TSR of our peer group:
|
|
|
|
|
| Compensation Actually Paid vs. Net Income |
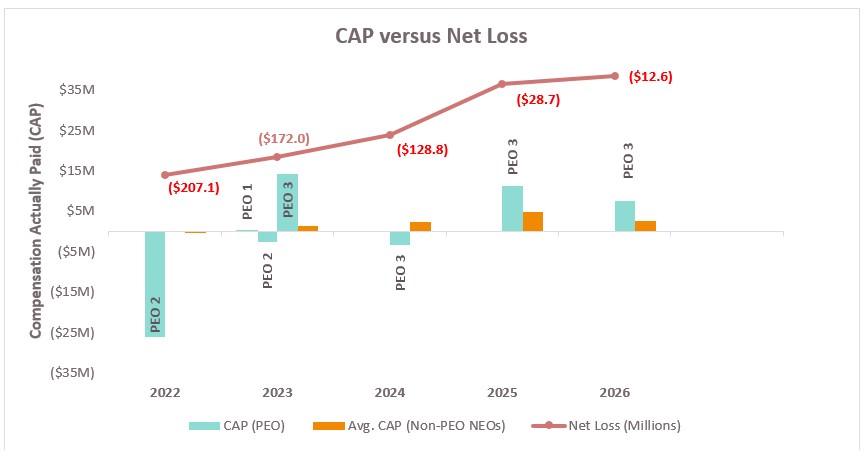
The following chart illustrates the CAP for our PEOs and the average CAP for our Non-PEO NEOs against our net income (loss):
|
|
|
|
|
| Compensation Actually Paid vs. Company Selected Measure |
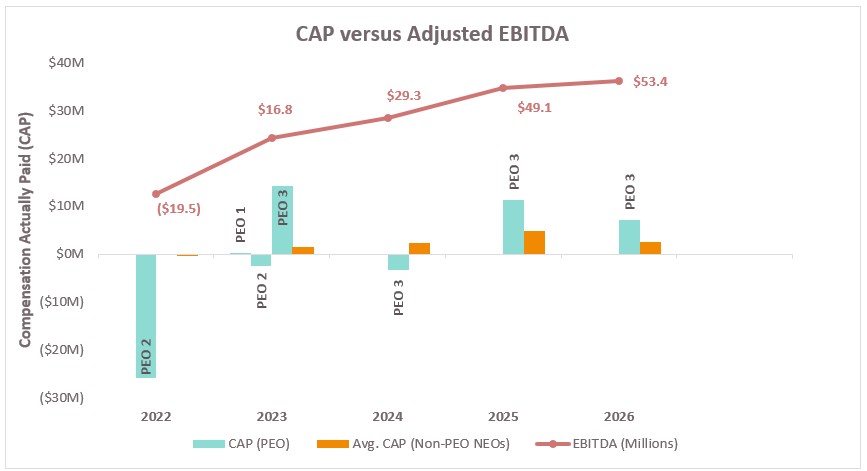
The following chart illustrates the CAP for our PEOs and the average CAP for our Non-PEO NEOs against our Adjusted EBITDA. Refer to Appendix A to this proxy statement for a reconciliation of net loss, the most comparable GAAP financial measure, to Adjusted EBITDA for each of the fiscal years presented.
|
|
|
|
|
| Total Shareholder Return Vs Peer Group |
The following chart illustrates the relationship between CAP for our PEO and the average CAP for our Non-PEO NEOs against our TSR, as well as the relationship between our TSR and the TSR of our peer group:
|
|
|
|
|
| Tabular List, Table |
The following is an unranked list of the financial performance measures we consider most important in linking company performance and compensation actually paid to our named executive officers for the most recently completed fiscal year: •TSR •Net Income (Loss) •Adjusted EBITDA
|
|
|
|
|
| Total Shareholder Return Amount |
$ 7.46
|
8.33
|
7.59
|
9.11
|
11.07
|
| Peer Group Total Shareholder Return Amount |
102.52
|
88.10
|
82.36
|
73.42
|
68.03
|
| Net Income (Loss) |
$ (12,606,000)
|
$ (28,739,000)
|
$ (128,840,000)
|
$ (171,973,000)
|
$ (207,121,000)
|
| Company Selected Measure Amount |
53,387,000
|
49,139,000
|
29,281,000
|
16,814,000
|
(19,455,000)
|
| Additional 402(v) Disclosure |
Amounts reflect total compensation as reported in our SCT for our NEOs for each applicable fiscal year.Total Shareholder Return (“TSR”) represents the cumulative total return to stockholders on a fixed investment of $100 in our Class A common stock for the period beginning on the last trading day of fiscal year ended July 30, 2022 through the end of each applicable fiscal year (August 1, 2026), assuming reinvestment of dividends. The Company has not paid dividends historically. The dollar amounts reported represent the net loss reflected in the Company’s audited consolidated financial statements for each applicable year.
|
|
|
|
|
| Measure:: 1 |
|
|
|
|
|
| Pay vs Performance Disclosure |
|
|
|
|
|
| Name |
TSR
|
|
|
|
|
| Measure:: 2 |
|
|
|
|
|
| Pay vs Performance Disclosure |
|
|
|
|
|
| Name |
Net Income (Loss)
|
|
|
|
|
| Measure:: 3 |
|
|
|
|
|
| Pay vs Performance Disclosure |
|
|
|
|
|
| Name |
Adjusted EBITDA
|
|
|
|
|
| Non-GAAP Measure Description |
The dollar amounts reported represent our Adjusted EBITDA reflected in the Company’s audited consolidated financial statements for each applicable fiscal year. Refer to Appendix A to this Proxy Statement for more detail on how we define Adjusted EBITDA and for a reconciliation of net loss, the most comparable GAAP financial measure, to Adjusted EBITDA for each of the fiscal years presented.
|
|
|
|
|
| Measure:: 4 |
|
|
|
|
|
| Pay vs Performance Disclosure |
|
|
|
|
|
| Name |
Net Revenue
|
|
|
|
|
| Aggregate Grant Date Fair Value of Equity Award Amounts Reported in Summary Compensation Table |
|
|
|
|
|
| Pay vs Performance Disclosure |
|
|
|
|
|
| Adjustment to Compensation, Amount |
$ (2,087,201)
|
|
|
|
|
| Year-end Fair Value of Equity Awards Granted in Covered Year that are Outstanding and Unvested |
|
|
|
|
|
| Pay vs Performance Disclosure |
|
|
|
|
|
| Adjustment to Compensation, Amount |
1,778,064
|
|
|
|
|
| Year-over-Year Change in Fair Value of Equity Awards Granted in Prior Years That are Outstanding and Unvested |
|
|
|
|
|
| Pay vs Performance Disclosure |
|
|
|
|
|
| Adjustment to Compensation, Amount |
(199,112)
|
|
|
|
|
| Vesting Date Fair Value of Equity Awards Granted and Vested in Covered Year |
|
|
|
|
|
| Pay vs Performance Disclosure |
|
|
|
|
|
| Adjustment to Compensation, Amount |
182,896
|
|
|
|
|
| Change in Fair Value as of Vesting Date of Prior Year Equity Awards Vested in Covered Year |
|
|
|
|
|
| Pay vs Performance Disclosure |
|
|
|
|
|
| Adjustment to Compensation, Amount |
49,255
|
|
|
|
|
| Matt Baer [Member] |
|
|
|
|
|
| Pay vs Performance Disclosure |
|
|
|
|
|
| PEO Total Compensation Amount |
8,560,536
|
$ 10,129,032
|
$ 1,464,928
|
$ 9,838,545
|
|
| PEO Actually Paid Compensation Amount |
$ 7,217,099
|
$ 11,249,951
|
$ (3,215,275)
|
$ 14,172,325
|
|
| PEO Name |
Matt Baer
|
Matt Baer
|
Matt Baer
|
Matt Baer
|
|
| Matt Baer [Member] | Aggregate Grant Date Fair Value of Equity Award Amounts Reported in Summary Compensation Table |
|
|
|
|
|
| Pay vs Performance Disclosure |
|
|
|
|
|
| Adjustment to Compensation, Amount |
$ (5,879,502)
|
|
|
|
|
| Matt Baer [Member] | Year-end Fair Value of Equity Awards Granted in Covered Year that are Outstanding and Unvested |
|
|
|
|
|
| Pay vs Performance Disclosure |
|
|
|
|
|
| Adjustment to Compensation, Amount |
4,618,220
|
|
|
|
|
| Matt Baer [Member] | Year-over-Year Change in Fair Value of Equity Awards Granted in Prior Years That are Outstanding and Unvested |
|
|
|
|
|
| Pay vs Performance Disclosure |
|
|
|
|
|
| Adjustment to Compensation, Amount |
(831,792)
|
|
|
|
|
| Matt Baer [Member] | Vesting Date Fair Value of Equity Awards Granted and Vested in Covered Year |
|
|
|
|
|
| Pay vs Performance Disclosure |
|
|
|
|
|
| Adjustment to Compensation, Amount |
606,143
|
|
|
|
|
| Matt Baer [Member] | Change in Fair Value as of Vesting Date of Prior Year Equity Awards Vested in Covered Year |
|
|
|
|
|
| Pay vs Performance Disclosure |
|
|
|
|
|
| Adjustment to Compensation, Amount |
$ 143,493
|
|
|
|
|
| Katrina Lake [Member] |
|
|
|
|
|
| Pay vs Performance Disclosure |
|
|
|
|
|
| PEO Total Compensation Amount |
|
|
|
$ 476,112
|
|
| PEO Actually Paid Compensation Amount |
|
|
|
$ 336,828
|
|
| PEO Name |
|
|
|
Katrina Lake
|
|
| Elizabeth Spaulding [Member] |
|
|
|
|
|
| Pay vs Performance Disclosure |
|
|
|
|
|
| PEO Total Compensation Amount |
|
|
|
$ 652,000
|
$ 3,134,920
|
| PEO Actually Paid Compensation Amount |
|
|
|
$ (2,670,068)
|
$ (26,070,368)
|
| PEO Name |
|
|
|
Elizabeth Spaulding
|
Elizabeth Spaulding
|