Shareholder Report
|
12 Months Ended |
|
Aug. 31, 2026
USD ($)
Holding
|
|---|
| Shareholder Report [Line Items] |
|
| Document Type |
N-CSR
|
| Amendment Flag |
false
|
| Registrant Name |
Columbia Funds Series Trust I
|
| Entity Central Index Key |
0000773757
|
| Entity Investment Company Type |
N-1A
|
| Document Period End Date |
Aug. 31, 2026
|
| Shareholder Report Annual or Semi-Annual |
Annual Shareholder Report
|
| C000032838 |
|
| Shareholder Report [Line Items] |
|
| Fund Name |
Columbia Balanced Fund
|
| Class Name |
Class A
|
| Trading Symbol |
CBLAX
|
| Annual or Semi-Annual Statement [Text Block] |
This annual shareholder report contains important information about Columbia Balanced Fund (the Fund) for the period of September 1, 2025 to August 31, 2026.
|
| Additional Information [Text Block] |
You can find additional information about the Fund at columbiathreadneedleus.com/resources/literature. You can also request more information by contacting us at 1-800-345-6611.
|
| Additional Information Phone Number |
1-800-345-6611
|
| Additional Information Website |
columbiathreadneedleus.com/resources/literature
|
| Expenses [Text Block] |
What were the Fund costs for the reporting period? (Based on a hypothetical $10,000 investment)
Table Summary
Class |
Cost of a $10,000 investment |
Cost paid as a percentage of a $10,000 investment |
Class A |
$97 |
0.91% | |
| Expenses Paid, Amount |
$ 97
|
| Expense Ratio, Percent |
0.91%
|
| Factors Affecting Performance [Text Block] |
Management's Discussion of Fund Performance The performance of Class A shares for the period presented is shown in the Average Annual Total Returns table. Top Performance ContributorsAllocations | Allocations to the consumer discretionary, communication services and real estate sectors boosted the Fund’s equity performance during the period. Smaller allocations to the consumer staples sector and larger allocations to the health care sector also contributed to equity performance. Sector allocation was the biggest driver of positive fixed-income performance with non-agency residential mortgage-backed securities (RMBS) contributing the most. Positioning in asset-backed securities (ABS) was additive, highlighted by holdings of collateralized loan obligations, fixed auto and other fixed ABS. Exposures to non-agency commercial mortgage-backed securities (CMBS) and high-yield corporates were also additive. Stock selection | Positions in Marvell Technology, a semiconductor company focused on data infrastructure and networking chips; Dell Technologies, a provider of personal computing and enterprise infrastructure solutions; and Applied Materials, a supplier of semiconductor manufacturing equipment and services, were among the top contributors to the Fund's equity performance. Security selection within ABS, CMBS and investment-grade corporate utilities contributed to the Fund’s performance in the fixed-income segment of the portfolio. Top Performance DetractorsAllocations | Allocations to the industrials, health care and energy sectors hurt the Fund’s equity performance during the period. Larger weightings to the financials and communication services sectors detracted from equity performance. Security selection within agency collateralized mortgage obligations and investment-grade corporates detracted from the Fund’s fixed-income performance. Duration and yield-curve positioning also detracted from fixed-income performance primarily due to the duration and yield curve positioning of mortgage-backed securities. Stock selection | Positions in Micron Technology, a memory and storage semiconductor manufacturer; Intuit, a financial software company; and Synopsys, a provider of chip design software and semiconductor IP, were among the top detractors from the Fund's equity performance. |
| Performance Past Does Not Indicate Future [Text] |
The Fund's past performance is not a good predictor of the Fund's future performance.
|
| Line Graph [Table Text Block] |
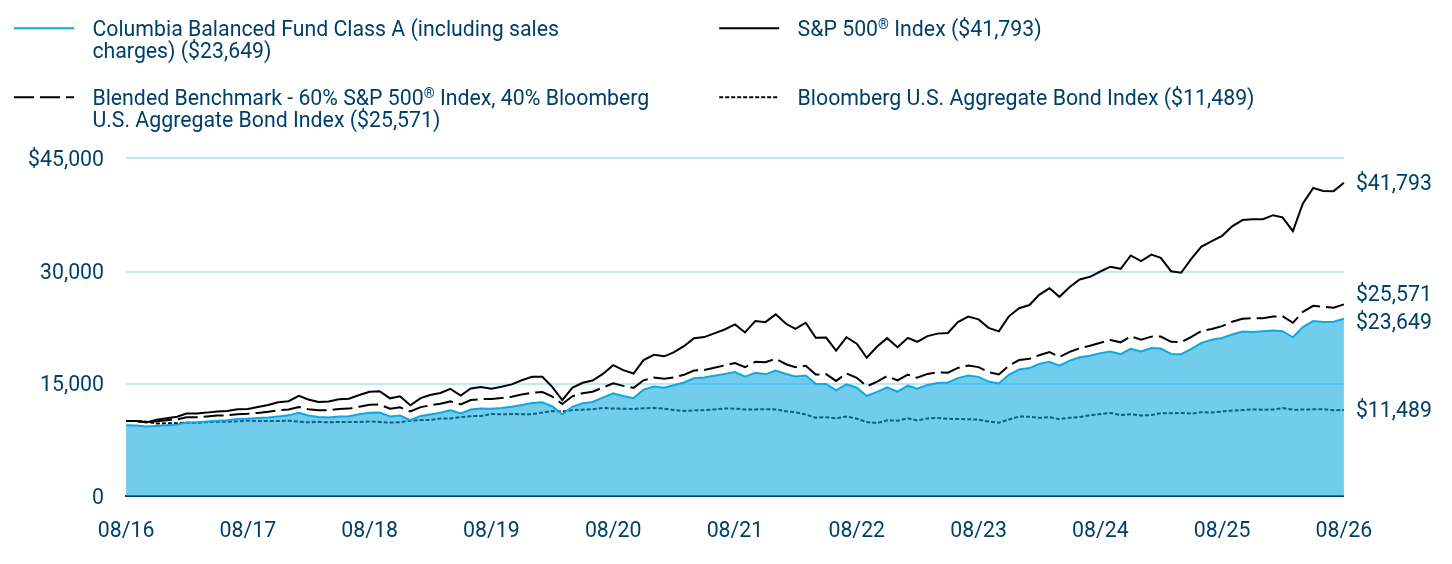
Table Summary
|
Columbia Balanced Fund Class A (including sales charges) ($23,649) |
S&P 500® Index ($41,793) |
Blended Benchmark - 60% S&P 500® Index, 40% Bloomberg U.S. Aggregate Bond Index ($25,571) |
Bloomberg U.S. Aggregate Bond Index ($11,489) |
08/16 |
$9,425 |
$10,000 |
$10,000 |
$10,000 |
09/16 |
$9,417 |
$10,002 |
$9,999 |
$9,994 |
10/16 |
$9,286 |
$9,819 |
$9,859 |
$9,918 |
11/16 |
$9,347 |
$10,183 |
$9,985 |
$9,683 |
12/16 |
$9,439 |
$10,384 |
$10,109 |
$9,697 |
01/17 |
$9,553 |
$10,581 |
$10,232 |
$9,716 |
02/17 |
$9,806 |
$11,001 |
$10,503 |
$9,781 |
03/17 |
$9,847 |
$11,014 |
$10,508 |
$9,776 |
04/17 |
$9,954 |
$11,127 |
$10,605 |
$9,851 |
05/17 |
$10,058 |
$11,284 |
$10,727 |
$9,927 |
06/17 |
$10,121 |
$11,354 |
$10,763 |
$9,917 |
07/17 |
$10,271 |
$11,588 |
$10,915 |
$9,960 |
08/17 |
$10,324 |
$11,623 |
$10,974 |
$10,049 |
09/17 |
$10,404 |
$11,863 |
$11,089 |
$10,001 |
10/17 |
$10,473 |
$12,140 |
$11,246 |
$10,007 |
11/17 |
$10,621 |
$12,512 |
$11,448 |
$9,994 |
12/17 |
$10,761 |
$12,651 |
$11,545 |
$10,040 |
01/18 |
$11,096 |
$13,376 |
$11,888 |
$9,925 |
02/18 |
$10,732 |
$12,883 |
$11,580 |
$9,830 |
03/18 |
$10,532 |
$12,555 |
$11,434 |
$9,894 |
04/18 |
$10,490 |
$12,604 |
$11,426 |
$9,820 |
05/18 |
$10,605 |
$12,907 |
$11,624 |
$9,890 |
06/18 |
$10,631 |
$12,987 |
$11,661 |
$9,878 |
07/18 |
$10,924 |
$13,470 |
$11,922 |
$9,880 |
08/18 |
$11,112 |
$13,909 |
$12,186 |
$9,944 |
09/18 |
$11,143 |
$13,988 |
$12,196 |
$9,880 |
10/18 |
$10,608 |
$13,032 |
$11,658 |
$9,802 |
11/18 |
$10,726 |
$13,297 |
$11,828 |
$9,860 |
12/18 |
$10,124 |
$12,097 |
$11,274 |
$10,041 |
01/19 |
$10,688 |
$13,066 |
$11,864 |
$10,148 |
02/19 |
$10,885 |
$13,486 |
$12,090 |
$10,142 |
03/19 |
$11,102 |
$13,748 |
$12,324 |
$10,337 |
04/19 |
$11,437 |
$14,304 |
$12,624 |
$10,339 |
05/19 |
$11,025 |
$13,395 |
$12,233 |
$10,523 |
06/19 |
$11,537 |
$14,339 |
$12,811 |
$10,655 |
07/19 |
$11,677 |
$14,546 |
$12,933 |
$10,679 |
08/19 |
$11,644 |
$14,315 |
$12,944 |
$10,955 |
09/19 |
$11,750 |
$14,583 |
$13,062 |
$10,897 |
10/19 |
$11,899 |
$14,899 |
$13,247 |
$10,930 |
11/19 |
$12,145 |
$15,440 |
$13,533 |
$10,924 |
12/19 |
$12,424 |
$15,906 |
$13,775 |
$10,917 |
01/20 |
$12,510 |
$15,899 |
$13,877 |
$11,127 |
02/20 |
$11,983 |
$14,591 |
$13,292 |
$11,327 |
03/20 |
$10,916 |
$12,788 |
$12,276 |
$11,260 |
04/20 |
$11,905 |
$14,428 |
$13,307 |
$11,460 |
05/20 |
$12,366 |
$15,115 |
$13,712 |
$11,514 |
06/20 |
$12,548 |
$15,416 |
$13,910 |
$11,586 |
07/20 |
$13,119 |
$16,285 |
$14,464 |
$11,759 |
08/20 |
$13,693 |
$17,455 |
$15,041 |
$11,665 |
09/20 |
$13,331 |
$16,792 |
$14,695 |
$11,658 |
10/20 |
$13,060 |
$16,346 |
$14,434 |
$11,606 |
11/20 |
$14,193 |
$18,135 |
$15,439 |
$11,720 |
12/20 |
$14,607 |
$18,832 |
$15,803 |
$11,736 |
01/21 |
$14,460 |
$18,642 |
$15,662 |
$11,652 |
02/21 |
$14,790 |
$19,156 |
$15,831 |
$11,484 |
03/21 |
$15,148 |
$19,995 |
$16,168 |
$11,340 |
04/21 |
$15,701 |
$21,062 |
$16,737 |
$11,430 |
05/21 |
$15,827 |
$21,209 |
$16,829 |
$11,467 |
06/21 |
$16,046 |
$21,704 |
$17,112 |
$11,548 |
07/21 |
$16,290 |
$22,220 |
$17,432 |
$11,677 |
08/21 |
$16,530 |
$22,895 |
$17,737 |
$11,655 |
09/21 |
$15,925 |
$21,831 |
$17,181 |
$11,554 |
10/21 |
$16,453 |
$23,360 |
$17,901 |
$11,551 |
11/21 |
$16,236 |
$23,198 |
$17,848 |
$11,585 |
12/21 |
$16,744 |
$24,238 |
$18,309 |
$11,555 |
01/22 |
$16,283 |
$22,984 |
$17,583 |
$11,306 |
02/22 |
$15,959 |
$22,295 |
$17,189 |
$11,180 |
03/22 |
$16,068 |
$23,123 |
$17,381 |
$10,869 |
04/22 |
$14,980 |
$21,107 |
$16,207 |
$10,457 |
05/22 |
$14,953 |
$21,146 |
$16,267 |
$10,524 |
06/22 |
$14,104 |
$19,400 |
$15,359 |
$10,359 |
07/22 |
$14,910 |
$21,189 |
$16,359 |
$10,612 |
08/22 |
$14,453 |
$20,325 |
$15,774 |
$10,313 |
09/22 |
$13,342 |
$18,453 |
$14,630 |
$9,867 |
10/22 |
$13,886 |
$19,947 |
$15,265 |
$9,739 |
11/22 |
$14,486 |
$21,062 |
$16,001 |
$10,097 |
12/22 |
$13,923 |
$19,848 |
$15,419 |
$10,052 |
01/23 |
$14,720 |
$21,095 |
$16,190 |
$10,361 |
02/23 |
$14,314 |
$20,581 |
$15,786 |
$10,093 |
03/23 |
$14,827 |
$21,336 |
$16,294 |
$10,350 |
04/23 |
$15,065 |
$21,669 |
$16,486 |
$10,412 |
05/23 |
$15,151 |
$21,763 |
$16,457 |
$10,299 |
06/23 |
$15,731 |
$23,201 |
$17,086 |
$10,262 |
07/23 |
$16,067 |
$23,947 |
$17,411 |
$10,255 |
08/23 |
$15,897 |
$23,566 |
$17,200 |
$10,189 |
09/23 |
$15,273 |
$22,442 |
$16,533 |
$9,931 |
10/23 |
$15,012 |
$21,970 |
$16,220 |
$9,774 |
11/23 |
$16,178 |
$23,977 |
$17,403 |
$10,216 |
12/23 |
$16,875 |
$25,066 |
$18,143 |
$10,608 |
01/24 |
$17,071 |
$25,487 |
$18,306 |
$10,578 |
02/24 |
$17,606 |
$26,848 |
$18,789 |
$10,429 |
03/24 |
$17,918 |
$27,712 |
$19,222 |
$10,525 |
04/24 |
$17,388 |
$26,580 |
$18,556 |
$10,259 |
05/24 |
$18,069 |
$27,898 |
$19,234 |
$10,433 |
06/24 |
$18,508 |
$28,899 |
$19,721 |
$10,532 |
07/24 |
$18,723 |
$29,251 |
$20,049 |
$10,778 |
08/24 |
$19,065 |
$29,960 |
$20,456 |
$10,933 |
09/24 |
$19,292 |
$30,600 |
$20,828 |
$11,079 |
10/24 |
$18,928 |
$30,323 |
$20,508 |
$10,805 |
11/24 |
$19,643 |
$32,102 |
$21,317 |
$10,919 |
12/24 |
$19,293 |
$31,337 |
$20,873 |
$10,740 |
01/25 |
$19,739 |
$32,210 |
$21,266 |
$10,797 |
02/25 |
$19,679 |
$31,790 |
$21,286 |
$11,035 |
03/25 |
$18,962 |
$29,998 |
$20,570 |
$11,039 |
04/25 |
$18,928 |
$29,795 |
$20,519 |
$11,082 |
05/25 |
$19,625 |
$31,670 |
$21,235 |
$11,003 |
06/25 |
$20,429 |
$33,281 |
$22,013 |
$11,172 |
07/25 |
$20,849 |
$34,028 |
$22,287 |
$11,143 |
08/25 |
$21,088 |
$34,718 |
$22,664 |
$11,276 |
09/25 |
$21,544 |
$35,985 |
$23,260 |
$11,399 |
10/25 |
$21,943 |
$36,827 |
$23,644 |
$11,470 |
11/25 |
$21,886 |
$36,918 |
$23,738 |
$11,541 |
12/25 |
$21,971 |
$36,940 |
$23,733 |
$11,524 |
01/26 |
$22,075 |
$37,476 |
$23,949 |
$11,537 |
02/26 |
$21,999 |
$37,191 |
$23,997 |
$11,726 |
03/26 |
$21,186 |
$35,339 |
$23,111 |
$11,519 |
04/26 |
$22,541 |
$39,047 |
$24,576 |
$11,532 |
05/26 |
$23,342 |
$41,102 |
$25,383 |
$11,568 |
06/26 |
$23,226 |
$40,711 |
$25,262 |
$11,596 |
07/26 |
$23,263 |
$40,685 |
$25,121 |
$11,445 |
08/26 |
$23,649 |
$41,793 |
$25,571 |
$11,489 |
|
| Average Annual Return [Table Text Block] |
Table Summary
Average Annual Total Returns (%) |
1 year |
5 years |
10 years |
Class A (excluding sales charges) |
12.15 |
7.42 |
9.64 |
Class A (including sales charges) |
5.70 |
6.16 |
8.99 |
S&P 500® Index |
20.38 |
12.79 |
15.37 |
Blended Benchmark - 60% S&P 500® Index, 40% Bloomberg U.S. Aggregate Bond Index |
12.82 |
7.59 |
9.84 |
Bloomberg U.S. Aggregate Bond Index |
1.89 |
(0.29) |
1.40 | |
| No Deduction of Taxes [Text Block] |
Performance does not reflect the deduction of taxes that a shareholder may pay on fund distributions or on the redemptions of fund shares.
|
| Updated Performance Information Location [Text Block] |
columbiathreadneedleus.com/investment-products/mutual-funds
|
| AssetsNet |
$ 10,425,754,230
|
| Holdings Count | Holding |
997
|
| Advisory Fees Paid, Amount |
$ 57,729,592
|
| InvestmentCompanyPortfolioTurnover |
86.00%
|
| Additional Fund Statistics [Text Block] |
Table Summary
Fund net assets |
$10,425,754,230 |
Total number of portfolio holdings |
997 |
Management services fees (represents 0.56% of Fund average net assets) |
$57,729,592 |
Portfolio turnover for the reporting period |
86% |
Portfolio turnover as of the end of the period excluding transactions in to be announced securities |
50% | |
| Holdings [Text Block] |
Table Summary
Information Technology |
24.1% |
Financials |
8.5% |
Communication Services |
6.9% |
Health Care |
6.5% |
Consumer Discretionary |
6.2% |
Industrials |
5.3% |
Energy |
1.8% |
Real Estate |
0.7% |
Materials |
0.6% |
Utilities |
0.6% |
Other |
0.6% |
Table Summary
Common Stocks |
61.8% |
Residential Mortgage-Backed Securities - Agency |
11.7% |
Residential Mortgage-Backed Securities - Non-Agency |
8.1% |
Corporate Bonds & Notes |
7.9% |
Asset-Backed Securities - Non-Agency |
4.6% |
Money Market Funds |
3.3% |
Exchange-Traded Equity Funds |
2.9% |
Other |
1.5% | |
| Largest Holdings [Text Block] |
Table Summary
NVIDIA Corp. |
5.5% |
Microsoft Corp. |
4.3% |
Apple, Inc. |
3.8% |
Amazon.com, Inc. |
3.1% |
iShares Core MSCI EAFE ETF |
2.9% |
Broadcom, Inc. |
2.0% |
Alphabet, Inc., Class A |
1.9% |
Alphabet, Inc., Class C |
1.6% |
Micron Technology, Inc. |
1.5% |
Eli Lilly & Co. |
1.4% | |
| Material Fund Change [Text Block] |
|
| C000032840 |
|
| Shareholder Report [Line Items] |
|
| Fund Name |
Columbia Balanced Fund
|
| Class Name |
Class C
|
| Trading Symbol |
CBLCX
|
| Annual or Semi-Annual Statement [Text Block] |
This annual shareholder report contains important information about Columbia Balanced Fund (the Fund) for the period of September 1, 2025 to August 31, 2026.
|
| Additional Information [Text Block] |
You can find additional information about the Fund at columbiathreadneedleus.com/resources/literature. You can also request more information by contacting us at 1-800-345-6611.
|
| Additional Information Phone Number |
1-800-345-6611
|
| Additional Information Website |
columbiathreadneedleus.com/resources/literature
|
| Expenses [Text Block] |
What were the Fund costs for the reporting period? (Based on a hypothetical $10,000 investment)
Table Summary
Class |
Cost of a $10,000 investment |
Cost paid as a percentage of a $10,000 investment |
Class C |
$175 |
1.66% | |
| Expenses Paid, Amount |
$ 175
|
| Expense Ratio, Percent |
1.66%
|
| Factors Affecting Performance [Text Block] |
Management's Discussion of Fund Performance The performance of Class C shares for the period presented is shown in the Average Annual Total Returns table. Top Performance ContributorsAllocations | Allocations to the consumer discretionary, communication services and real estate sectors boosted the Fund’s equity performance during the period. Smaller allocations to the consumer staples sector and larger allocations to the health care sector also contributed to equity performance. Sector allocation was the biggest driver of positive fixed-income performance with non-agency residential mortgage-backed securities (RMBS) contributing the most. Positioning in asset-backed securities (ABS) was additive, highlighted by holdings of collateralized loan obligations, fixed auto and other fixed ABS. Exposures to non-agency commercial mortgage-backed securities (CMBS) and high-yield corporates were also additive. Stock selection | Positions in Marvell Technology, a semiconductor company focused on data infrastructure and networking chips; Dell Technologies, a provider of personal computing and enterprise infrastructure solutions; and Applied Materials, a supplier of semiconductor manufacturing equipment and services, were among the top contributors to the Fund's equity performance. Security selection within ABS, CMBS and investment-grade corporate utilities contributed to the Fund’s performance in the fixed-income segment of the portfolio. Top Performance DetractorsAllocations | Allocations to the industrials, health care and energy sectors hurt the Fund’s equity performance during the period. Larger weightings to the financials and communication services sectors detracted from equity performance. Security selection within agency collateralized mortgage obligations and investment-grade corporates detracted from the Fund’s fixed-income performance. Duration and yield-curve positioning also detracted from fixed-income performance primarily due to the duration and yield curve positioning of mortgage-backed securities. Stock selection | Positions in Micron Technology, a memory and storage semiconductor manufacturer; Intuit, a financial software company; and Synopsys, a provider of chip design software and semiconductor IP, were among the top detractors from the Fund's equity performance. |
| Performance Past Does Not Indicate Future [Text] |
The Fund's past performance is not a good predictor of the Fund's future performance.
|
| Line Graph [Table Text Block] |
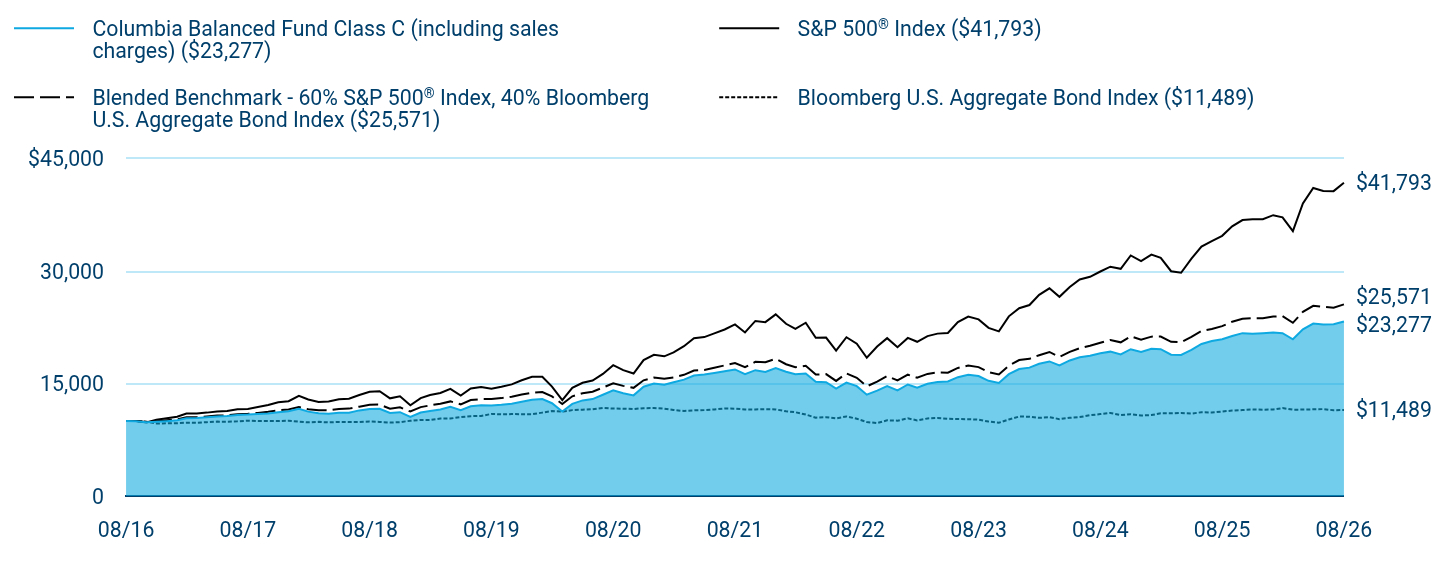
Table Summary
|
Columbia Balanced Fund Class C (including sales charges) ($23,277) |
S&P 500® Index ($41,793) |
Blended Benchmark - 60% S&P 500® Index, 40% Bloomberg U.S. Aggregate Bond Index ($25,571) |
Bloomberg U.S. Aggregate Bond Index ($11,489) |
08/16 |
$10,000 |
$10,000 |
$10,000 |
$10,000 |
09/16 |
$9,986 |
$10,002 |
$9,999 |
$9,994 |
10/16 |
$9,839 |
$9,819 |
$9,859 |
$9,918 |
11/16 |
$9,898 |
$10,183 |
$9,985 |
$9,683 |
12/16 |
$9,988 |
$10,384 |
$10,109 |
$9,697 |
01/17 |
$10,103 |
$10,581 |
$10,232 |
$9,716 |
02/17 |
$10,364 |
$11,001 |
$10,503 |
$9,781 |
03/17 |
$10,402 |
$11,014 |
$10,508 |
$9,776 |
04/17 |
$10,507 |
$11,127 |
$10,605 |
$9,851 |
05/17 |
$10,609 |
$11,284 |
$10,727 |
$9,927 |
06/17 |
$10,672 |
$11,354 |
$10,763 |
$9,917 |
07/17 |
$10,823 |
$11,588 |
$10,915 |
$9,960 |
08/17 |
$10,871 |
$11,623 |
$10,974 |
$10,049 |
09/17 |
$10,948 |
$11,863 |
$11,089 |
$10,001 |
10/17 |
$11,012 |
$12,140 |
$11,246 |
$10,007 |
11/17 |
$11,163 |
$12,512 |
$11,448 |
$9,994 |
12/17 |
$11,303 |
$12,651 |
$11,545 |
$10,040 |
01/18 |
$11,648 |
$13,376 |
$11,888 |
$9,925 |
02/18 |
$11,259 |
$12,883 |
$11,580 |
$9,830 |
03/18 |
$11,042 |
$12,555 |
$11,434 |
$9,894 |
04/18 |
$10,990 |
$12,604 |
$11,426 |
$9,820 |
05/18 |
$11,104 |
$12,907 |
$11,624 |
$9,890 |
06/18 |
$11,126 |
$12,987 |
$11,661 |
$9,878 |
07/18 |
$11,424 |
$13,470 |
$11,922 |
$9,880 |
08/18 |
$11,613 |
$13,909 |
$12,186 |
$9,944 |
09/18 |
$11,637 |
$13,988 |
$12,196 |
$9,880 |
10/18 |
$11,072 |
$13,032 |
$11,658 |
$9,802 |
11/18 |
$11,187 |
$13,297 |
$11,828 |
$9,860 |
12/18 |
$10,552 |
$12,097 |
$11,274 |
$10,041 |
01/19 |
$11,133 |
$13,066 |
$11,864 |
$10,148 |
02/19 |
$11,333 |
$13,486 |
$12,090 |
$10,142 |
03/19 |
$11,552 |
$13,748 |
$12,324 |
$10,337 |
04/19 |
$11,893 |
$14,304 |
$12,624 |
$10,339 |
05/19 |
$11,460 |
$13,395 |
$12,233 |
$10,523 |
06/19 |
$11,983 |
$14,339 |
$12,811 |
$10,655 |
07/19 |
$12,120 |
$14,546 |
$12,933 |
$10,679 |
08/19 |
$12,077 |
$14,315 |
$12,944 |
$10,955 |
09/19 |
$12,178 |
$14,583 |
$13,062 |
$10,897 |
10/19 |
$12,325 |
$14,899 |
$13,247 |
$10,930 |
11/19 |
$12,575 |
$15,440 |
$13,533 |
$10,924 |
12/19 |
$12,855 |
$15,906 |
$13,775 |
$10,917 |
01/20 |
$12,935 |
$15,899 |
$13,877 |
$11,127 |
02/20 |
$12,382 |
$14,591 |
$13,292 |
$11,327 |
03/20 |
$11,275 |
$12,788 |
$12,276 |
$11,260 |
04/20 |
$12,287 |
$14,428 |
$13,307 |
$11,460 |
05/20 |
$12,755 |
$15,115 |
$13,712 |
$11,514 |
06/20 |
$12,936 |
$15,416 |
$13,910 |
$11,586 |
07/20 |
$13,514 |
$16,285 |
$14,464 |
$11,759 |
08/20 |
$14,098 |
$17,455 |
$15,041 |
$11,665 |
09/20 |
$13,718 |
$16,792 |
$14,695 |
$11,658 |
10/20 |
$13,430 |
$16,346 |
$14,434 |
$11,606 |
11/20 |
$14,584 |
$18,135 |
$15,439 |
$11,720 |
12/20 |
$15,001 |
$18,832 |
$15,803 |
$11,736 |
01/21 |
$14,841 |
$18,642 |
$15,662 |
$11,652 |
02/21 |
$15,171 |
$19,156 |
$15,831 |
$11,484 |
03/21 |
$15,530 |
$19,995 |
$16,168 |
$11,340 |
04/21 |
$16,086 |
$21,062 |
$16,737 |
$11,430 |
05/21 |
$16,206 |
$21,209 |
$16,829 |
$11,467 |
06/21 |
$16,416 |
$21,704 |
$17,112 |
$11,548 |
07/21 |
$16,657 |
$22,220 |
$17,432 |
$11,677 |
08/21 |
$16,892 |
$22,895 |
$17,737 |
$11,655 |
09/21 |
$16,262 |
$21,831 |
$17,181 |
$11,554 |
10/21 |
$16,793 |
$23,360 |
$17,901 |
$11,551 |
11/21 |
$16,558 |
$23,198 |
$17,848 |
$11,585 |
12/21 |
$17,068 |
$24,238 |
$18,309 |
$11,555 |
01/22 |
$16,589 |
$22,984 |
$17,583 |
$11,306 |
02/22 |
$16,244 |
$22,295 |
$17,189 |
$11,180 |
03/22 |
$16,348 |
$23,123 |
$17,381 |
$10,869 |
04/22 |
$15,232 |
$21,107 |
$16,207 |
$10,457 |
05/22 |
$15,192 |
$21,146 |
$16,267 |
$10,524 |
06/22 |
$14,321 |
$19,400 |
$15,359 |
$10,359 |
07/22 |
$15,133 |
$21,189 |
$16,359 |
$10,612 |
08/22 |
$14,657 |
$20,325 |
$15,774 |
$10,313 |
09/22 |
$13,524 |
$18,453 |
$14,630 |
$9,867 |
10/22 |
$14,064 |
$19,947 |
$15,265 |
$9,739 |
11/22 |
$14,665 |
$21,062 |
$16,001 |
$10,097 |
12/22 |
$14,086 |
$19,848 |
$15,419 |
$10,052 |
01/23 |
$14,882 |
$21,095 |
$16,190 |
$10,361 |
02/23 |
$14,466 |
$20,581 |
$15,786 |
$10,093 |
03/23 |
$14,974 |
$21,336 |
$16,294 |
$10,350 |
04/23 |
$15,204 |
$21,669 |
$16,486 |
$10,412 |
05/23 |
$15,281 |
$21,763 |
$16,457 |
$10,299 |
06/23 |
$15,855 |
$23,201 |
$17,086 |
$10,262 |
07/23 |
$16,181 |
$23,947 |
$17,411 |
$10,255 |
08/23 |
$16,002 |
$23,566 |
$17,200 |
$10,189 |
09/23 |
$15,366 |
$22,442 |
$16,533 |
$9,931 |
10/23 |
$15,095 |
$21,970 |
$16,220 |
$9,774 |
11/23 |
$16,255 |
$23,977 |
$17,403 |
$10,216 |
12/23 |
$16,943 |
$25,066 |
$18,143 |
$10,608 |
01/24 |
$17,130 |
$25,487 |
$18,306 |
$10,578 |
02/24 |
$17,655 |
$26,848 |
$18,789 |
$10,429 |
03/24 |
$17,959 |
$27,712 |
$19,222 |
$10,525 |
04/24 |
$17,415 |
$26,580 |
$18,556 |
$10,259 |
05/24 |
$18,086 |
$27,898 |
$19,234 |
$10,433 |
06/24 |
$18,513 |
$28,899 |
$19,721 |
$10,532 |
07/24 |
$18,718 |
$29,251 |
$20,049 |
$10,778 |
08/24 |
$19,047 |
$29,960 |
$20,456 |
$10,933 |
09/24 |
$19,265 |
$30,600 |
$20,828 |
$11,079 |
10/24 |
$18,885 |
$30,323 |
$20,508 |
$10,805 |
11/24 |
$19,588 |
$32,102 |
$21,317 |
$10,919 |
12/24 |
$19,226 |
$31,337 |
$20,873 |
$10,740 |
01/25 |
$19,658 |
$32,210 |
$21,266 |
$10,797 |
02/25 |
$19,591 |
$31,790 |
$21,286 |
$11,035 |
03/25 |
$18,861 |
$29,998 |
$20,570 |
$11,039 |
04/25 |
$18,816 |
$29,795 |
$20,519 |
$11,082 |
05/25 |
$19,498 |
$31,670 |
$21,235 |
$11,003 |
06/25 |
$20,285 |
$33,281 |
$22,013 |
$11,172 |
07/25 |
$20,689 |
$34,028 |
$22,287 |
$11,143 |
08/25 |
$20,912 |
$34,718 |
$22,664 |
$11,276 |
09/25 |
$21,351 |
$35,985 |
$23,260 |
$11,399 |
10/25 |
$21,733 |
$36,827 |
$23,644 |
$11,470 |
11/25 |
$21,661 |
$36,918 |
$23,738 |
$11,541 |
12/25 |
$21,730 |
$36,940 |
$23,733 |
$11,524 |
01/26 |
$21,822 |
$37,476 |
$23,949 |
$11,537 |
02/26 |
$21,734 |
$37,191 |
$23,997 |
$11,726 |
03/26 |
$20,918 |
$35,339 |
$23,111 |
$11,519 |
04/26 |
$22,239 |
$39,047 |
$24,576 |
$11,532 |
05/26 |
$23,019 |
$41,102 |
$25,383 |
$11,568 |
06/26 |
$22,890 |
$40,711 |
$25,262 |
$11,596 |
07/26 |
$22,910 |
$40,685 |
$25,121 |
$11,445 |
08/26 |
$23,277 |
$41,793 |
$25,571 |
$11,489 |
|
| Average Annual Return [Table Text Block] |
Table Summary
Average Annual Total Returns (%) |
1 year |
5 years |
10 years |
Class C (excluding sales charges) |
11.31 |
6.62 |
8.82 |
Class C (including sales charges) |
10.31 |
6.62 |
8.82 |
S&P 500® Index |
20.38 |
12.79 |
15.37 |
Blended Benchmark - 60% S&P 500® Index, 40% Bloomberg U.S. Aggregate Bond Index |
12.82 |
7.59 |
9.84 |
Bloomberg U.S. Aggregate Bond Index |
1.89 |
(0.29) |
1.40 | |
| No Deduction of Taxes [Text Block] |
Performance does not reflect the deduction of taxes that a shareholder may pay on fund distributions or on the redemptions of fund shares.
|
| Updated Performance Information Location [Text Block] |
columbiathreadneedleus.com/investment-products/mutual-funds
|
| AssetsNet |
$ 10,425,754,230
|
| Holdings Count | Holding |
997
|
| Advisory Fees Paid, Amount |
$ 57,729,592
|
| InvestmentCompanyPortfolioTurnover |
86.00%
|
| Additional Fund Statistics [Text Block] |
Table Summary
Fund net assets |
$10,425,754,230 |
Total number of portfolio holdings |
997 |
Management services fees (represents 0.56% of Fund average net assets) |
$57,729,592 |
Portfolio turnover for the reporting period |
86% |
Portfolio turnover as of the end of the period excluding transactions in to be announced securities |
50% | |
| Holdings [Text Block] |
Table Summary
Information Technology |
24.1% |
Financials |
8.5% |
Communication Services |
6.9% |
Health Care |
6.5% |
Consumer Discretionary |
6.2% |
Industrials |
5.3% |
Energy |
1.8% |
Real Estate |
0.7% |
Materials |
0.6% |
Utilities |
0.6% |
Other |
0.6% |
Table Summary
Common Stocks |
61.8% |
Residential Mortgage-Backed Securities - Agency |
11.7% |
Residential Mortgage-Backed Securities - Non-Agency |
8.1% |
Corporate Bonds & Notes |
7.9% |
Asset-Backed Securities - Non-Agency |
4.6% |
Money Market Funds |
3.3% |
Exchange-Traded Equity Funds |
2.9% |
Other |
1.5% | |
| Largest Holdings [Text Block] |
Table Summary
NVIDIA Corp. |
5.5% |
Microsoft Corp. |
4.3% |
Apple, Inc. |
3.8% |
Amazon.com, Inc. |
3.1% |
iShares Core MSCI EAFE ETF |
2.9% |
Broadcom, Inc. |
2.0% |
Alphabet, Inc., Class A |
1.9% |
Alphabet, Inc., Class C |
1.6% |
Micron Technology, Inc. |
1.5% |
Eli Lilly & Co. |
1.4% | |
| Material Fund Change [Text Block] |
|
| C000032842 |
|
| Shareholder Report [Line Items] |
|
| Fund Name |
Columbia Balanced Fund
|
| Class Name |
Institutional Class
|
| Trading Symbol |
CBALX
|
| Annual or Semi-Annual Statement [Text Block] |
This annual shareholder report contains important information about Columbia Balanced Fund (the Fund) for the period of September 1, 2025 to August 31, 2026.
|
| Additional Information [Text Block] |
You can find additional information about the Fund at columbiathreadneedleus.com/resources/literature. You can also request more information by contacting us at 1-800-345-6611.
|
| Additional Information Phone Number |
1-800-345-6611
|
| Additional Information Website |
columbiathreadneedleus.com/resources/literature
|
| Expenses [Text Block] |
What were the Fund costs for the reporting period? (Based on a hypothetical $10,000 investment)
Table Summary
Class |
Cost of a $10,000 investment |
Cost paid as a percentage of a $10,000 investment |
Institutional Class |
$70 |
0.66% | |
| Expenses Paid, Amount |
$ 70
|
| Expense Ratio, Percent |
0.66%
|
| Factors Affecting Performance [Text Block] |
Management's Discussion of Fund Performance The performance of Institutional Class shares for the period presented is shown in the Average Annual Total Returns table. Top Performance ContributorsAllocations | Allocations to the consumer discretionary, communication services and real estate sectors boosted the Fund’s equity performance during the period. Smaller allocations to the consumer staples sector and larger allocations to the health care sector also contributed to equity performance. Sector allocation was the biggest driver of positive fixed-income performance with non-agency residential mortgage-backed securities (RMBS) contributing the most. Positioning in asset-backed securities (ABS) was additive, highlighted by holdings of collateralized loan obligations, fixed auto and other fixed ABS. Exposures to non-agency commercial mortgage-backed securities (CMBS) and high-yield corporates were also additive. Stock selection | Positions in Marvell Technology, a semiconductor company focused on data infrastructure and networking chips; Dell Technologies, a provider of personal computing and enterprise infrastructure solutions; and Applied Materials, a supplier of semiconductor manufacturing equipment and services, were among the top contributors to the Fund's equity performance. Security selection within ABS, CMBS and investment-grade corporate utilities contributed to the Fund’s performance in the fixed-income segment of the portfolio. Top Performance DetractorsAllocations | Allocations to the industrials, health care and energy sectors hurt the Fund’s equity performance during the period. Larger weightings to the financials and communication services sectors detracted from equity performance. Security selection within agency collateralized mortgage obligations and investment-grade corporates detracted from the Fund’s fixed-income performance. Duration and yield-curve positioning also detracted from fixed-income performance primarily due to the duration and yield curve positioning of mortgage-backed securities. Stock selection | Positions in Micron Technology, a memory and storage semiconductor manufacturer; Intuit, a financial software company; and Synopsys, a provider of chip design software and semiconductor IP, were among the top detractors from the Fund's equity performance. |
| Performance Past Does Not Indicate Future [Text] |
The Fund's past performance is not a good predictor of the Fund's future performance.
|
| Line Graph [Table Text Block] |
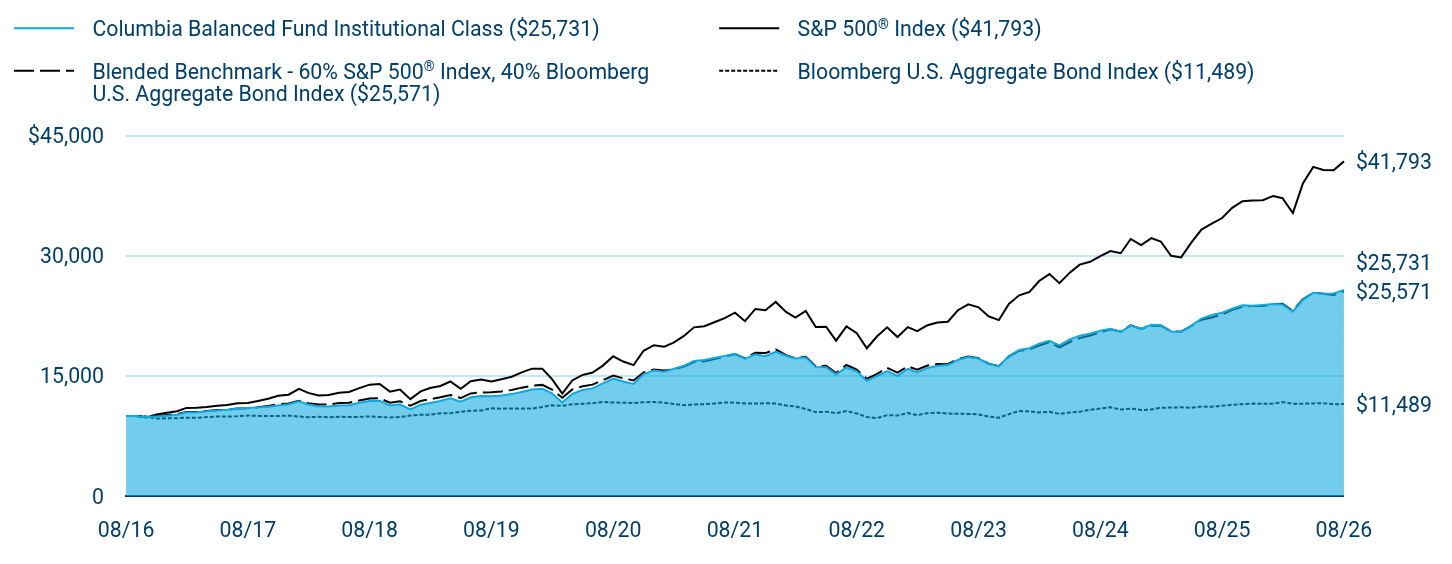
Table Summary
|
Columbia Balanced Fund Institutional Class ($25,731) |
S&P 500® Index ($41,793) |
Blended Benchmark - 60% S&P 500® Index, 40% Bloomberg U.S. Aggregate Bond Index ($25,571) |
Bloomberg U.S. Aggregate Bond Index ($11,489) |
08/16 |
$10,000 |
$10,000 |
$10,000 |
$10,000 |
09/16 |
$9,995 |
$10,002 |
$9,999 |
$9,994 |
10/16 |
$9,856 |
$9,819 |
$9,859 |
$9,918 |
11/16 |
$9,926 |
$10,183 |
$9,985 |
$9,683 |
12/16 |
$10,025 |
$10,384 |
$10,109 |
$9,697 |
01/17 |
$10,149 |
$10,581 |
$10,232 |
$9,716 |
02/17 |
$10,418 |
$11,001 |
$10,503 |
$9,781 |
03/17 |
$10,465 |
$11,014 |
$10,508 |
$9,776 |
04/17 |
$10,579 |
$11,127 |
$10,605 |
$9,851 |
05/17 |
$10,692 |
$11,284 |
$10,727 |
$9,927 |
06/17 |
$10,761 |
$11,354 |
$10,763 |
$9,917 |
07/17 |
$10,923 |
$11,588 |
$10,915 |
$9,960 |
08/17 |
$10,983 |
$11,623 |
$10,974 |
$10,049 |
09/17 |
$11,069 |
$11,863 |
$11,089 |
$10,001 |
10/17 |
$11,145 |
$12,140 |
$11,246 |
$10,007 |
11/17 |
$11,306 |
$12,512 |
$11,448 |
$9,994 |
12/17 |
$11,457 |
$12,651 |
$11,545 |
$10,040 |
01/18 |
$11,817 |
$13,376 |
$11,888 |
$9,925 |
02/18 |
$11,432 |
$12,883 |
$11,580 |
$9,830 |
03/18 |
$11,219 |
$12,555 |
$11,434 |
$9,894 |
04/18 |
$11,178 |
$12,604 |
$11,426 |
$9,820 |
05/18 |
$11,303 |
$12,907 |
$11,624 |
$9,890 |
06/18 |
$11,333 |
$12,987 |
$11,661 |
$9,878 |
07/18 |
$11,648 |
$13,470 |
$11,922 |
$9,880 |
08/18 |
$11,852 |
$13,909 |
$12,186 |
$9,944 |
09/18 |
$11,886 |
$13,988 |
$12,196 |
$9,880 |
10/18 |
$11,318 |
$13,032 |
$11,658 |
$9,802 |
11/18 |
$11,444 |
$13,297 |
$11,828 |
$9,860 |
12/18 |
$10,804 |
$12,097 |
$11,274 |
$10,041 |
01/19 |
$11,410 |
$13,066 |
$11,864 |
$10,148 |
02/19 |
$11,621 |
$13,486 |
$12,090 |
$10,142 |
03/19 |
$11,855 |
$13,748 |
$12,324 |
$10,337 |
04/19 |
$12,216 |
$14,304 |
$12,624 |
$10,339 |
05/19 |
$11,782 |
$13,395 |
$12,233 |
$10,523 |
06/19 |
$12,331 |
$14,339 |
$12,811 |
$10,655 |
07/19 |
$12,481 |
$14,546 |
$12,933 |
$10,679 |
08/19 |
$12,449 |
$14,315 |
$12,944 |
$10,955 |
09/19 |
$12,563 |
$14,583 |
$13,062 |
$10,897 |
10/19 |
$12,726 |
$14,899 |
$13,247 |
$10,930 |
11/19 |
$12,990 |
$15,440 |
$13,533 |
$10,924 |
12/19 |
$13,291 |
$15,906 |
$13,775 |
$10,917 |
01/20 |
$13,386 |
$15,899 |
$13,877 |
$11,127 |
02/20 |
$12,827 |
$14,591 |
$13,292 |
$11,327 |
03/20 |
$11,688 |
$12,788 |
$12,276 |
$11,260 |
04/20 |
$12,747 |
$14,428 |
$13,307 |
$11,460 |
05/20 |
$13,244 |
$15,115 |
$13,712 |
$11,514 |
06/20 |
$13,442 |
$15,416 |
$13,910 |
$11,586 |
07/20 |
$14,055 |
$16,285 |
$14,464 |
$11,759 |
08/20 |
$14,677 |
$17,455 |
$15,041 |
$11,665 |
09/20 |
$14,291 |
$16,792 |
$14,695 |
$11,658 |
10/20 |
$14,004 |
$16,346 |
$14,434 |
$11,606 |
11/20 |
$15,221 |
$18,135 |
$15,439 |
$11,720 |
12/20 |
$15,669 |
$18,832 |
$15,803 |
$11,736 |
01/21 |
$15,514 |
$18,642 |
$15,662 |
$11,652 |
02/21 |
$15,872 |
$19,156 |
$15,831 |
$11,484 |
03/21 |
$16,260 |
$19,995 |
$16,168 |
$11,340 |
04/21 |
$16,858 |
$21,062 |
$16,737 |
$11,430 |
05/21 |
$16,994 |
$21,209 |
$16,829 |
$11,467 |
06/21 |
$17,233 |
$21,704 |
$17,112 |
$11,548 |
07/21 |
$17,499 |
$22,220 |
$17,432 |
$11,677 |
08/21 |
$17,761 |
$22,895 |
$17,737 |
$11,655 |
09/21 |
$17,115 |
$21,831 |
$17,181 |
$11,554 |
10/21 |
$17,686 |
$23,360 |
$17,901 |
$11,551 |
11/21 |
$17,455 |
$23,198 |
$17,848 |
$11,585 |
12/21 |
$18,005 |
$24,238 |
$18,309 |
$11,555 |
01/22 |
$17,514 |
$22,984 |
$17,583 |
$11,306 |
02/22 |
$17,165 |
$22,295 |
$17,189 |
$11,180 |
03/22 |
$17,287 |
$23,123 |
$17,381 |
$10,869 |
04/22 |
$16,123 |
$21,107 |
$16,207 |
$10,457 |
05/22 |
$16,095 |
$21,146 |
$16,267 |
$10,524 |
06/22 |
$15,186 |
$19,400 |
$15,359 |
$10,359 |
07/22 |
$16,055 |
$21,189 |
$16,359 |
$10,612 |
08/22 |
$15,566 |
$20,325 |
$15,774 |
$10,313 |
09/22 |
$14,373 |
$18,453 |
$14,630 |
$9,867 |
10/22 |
$14,964 |
$19,947 |
$15,265 |
$9,739 |
11/22 |
$15,612 |
$21,062 |
$16,001 |
$10,097 |
12/22 |
$15,009 |
$19,848 |
$15,419 |
$10,052 |
01/23 |
$15,874 |
$21,095 |
$16,190 |
$10,361 |
02/23 |
$15,440 |
$20,581 |
$15,786 |
$10,093 |
03/23 |
$15,993 |
$21,336 |
$16,294 |
$10,350 |
04/23 |
$16,254 |
$21,669 |
$16,486 |
$10,412 |
05/23 |
$16,351 |
$21,763 |
$16,457 |
$10,299 |
06/23 |
$16,981 |
$23,201 |
$17,086 |
$10,262 |
07/23 |
$17,344 |
$23,947 |
$17,411 |
$10,255 |
08/23 |
$17,165 |
$23,566 |
$17,200 |
$10,189 |
09/23 |
$16,493 |
$22,442 |
$16,533 |
$9,931 |
10/23 |
$16,218 |
$21,970 |
$16,220 |
$9,774 |
11/23 |
$17,480 |
$23,977 |
$17,403 |
$10,216 |
12/23 |
$18,235 |
$25,066 |
$18,143 |
$10,608 |
01/24 |
$18,454 |
$25,487 |
$18,306 |
$10,578 |
02/24 |
$19,034 |
$26,848 |
$18,789 |
$10,429 |
03/24 |
$19,377 |
$27,712 |
$19,222 |
$10,525 |
04/24 |
$18,806 |
$26,580 |
$18,556 |
$10,259 |
05/24 |
$19,548 |
$27,898 |
$19,234 |
$10,433 |
06/24 |
$20,024 |
$28,899 |
$19,721 |
$10,532 |
07/24 |
$20,261 |
$29,251 |
$20,049 |
$10,778 |
08/24 |
$20,640 |
$29,960 |
$20,456 |
$10,933 |
09/24 |
$20,888 |
$30,600 |
$20,828 |
$11,079 |
10/24 |
$20,496 |
$30,323 |
$20,508 |
$10,805 |
11/24 |
$21,277 |
$32,102 |
$21,317 |
$10,919 |
12/24 |
$20,902 |
$31,337 |
$20,873 |
$10,740 |
01/25 |
$21,391 |
$32,210 |
$21,266 |
$10,797 |
02/25 |
$21,330 |
$31,790 |
$21,286 |
$11,035 |
03/25 |
$20,555 |
$29,998 |
$20,570 |
$11,039 |
04/25 |
$20,522 |
$29,795 |
$20,519 |
$11,082 |
05/25 |
$21,285 |
$31,670 |
$21,235 |
$11,003 |
06/25 |
$22,164 |
$33,281 |
$22,013 |
$11,172 |
07/25 |
$22,625 |
$34,028 |
$22,287 |
$11,143 |
08/25 |
$22,884 |
$34,718 |
$22,664 |
$11,276 |
09/25 |
$23,383 |
$35,985 |
$23,260 |
$11,399 |
10/25 |
$23,822 |
$36,827 |
$23,644 |
$11,470 |
11/25 |
$23,764 |
$36,918 |
$23,738 |
$11,541 |
12/25 |
$23,863 |
$36,940 |
$23,733 |
$11,524 |
01/26 |
$23,980 |
$37,476 |
$23,949 |
$11,537 |
02/26 |
$23,906 |
$37,191 |
$23,997 |
$11,726 |
03/26 |
$23,027 |
$35,339 |
$23,111 |
$11,519 |
04/26 |
$24,504 |
$39,047 |
$24,576 |
$11,532 |
05/26 |
$25,377 |
$41,102 |
$25,383 |
$11,568 |
06/26 |
$25,262 |
$40,711 |
$25,262 |
$11,596 |
07/26 |
$25,301 |
$40,685 |
$25,121 |
$11,445 |
08/26 |
$25,731 |
$41,793 |
$25,571 |
$11,489 |
|
| Average Annual Return [Table Text Block] |
Table Summary
Average Annual Total Returns (%) |
1 year |
5 years |
10 years |
Institutional Class |
12.44 |
7.70 |
9.91 |
S&P 500® Index |
20.38 |
12.79 |
15.37 |
Blended Benchmark - 60% S&P 500® Index, 40% Bloomberg U.S. Aggregate Bond Index |
12.82 |
7.59 |
9.84 |
Bloomberg U.S. Aggregate Bond Index |
1.89 |
(0.29) |
1.40 | |
| No Deduction of Taxes [Text Block] |
Performance does not reflect the deduction of taxes that a shareholder may pay on fund distributions or on the redemptions of fund shares.
|
| Updated Performance Information Location [Text Block] |
columbiathreadneedleus.com/investment-products/mutual-funds
|
| AssetsNet |
$ 10,425,754,230
|
| Holdings Count | Holding |
997
|
| Advisory Fees Paid, Amount |
$ 57,729,592
|
| InvestmentCompanyPortfolioTurnover |
86.00%
|
| Additional Fund Statistics [Text Block] |
Table Summary
Fund net assets |
$10,425,754,230 |
Total number of portfolio holdings |
997 |
Management services fees (represents 0.56% of Fund average net assets) |
$57,729,592 |
Portfolio turnover for the reporting period |
86% |
Portfolio turnover as of the end of the period excluding transactions in to be announced securities |
50% | |
| Holdings [Text Block] |
Table Summary
Information Technology |
24.1% |
Financials |
8.5% |
Communication Services |
6.9% |
Health Care |
6.5% |
Consumer Discretionary |
6.2% |
Industrials |
5.3% |
Energy |
1.8% |
Real Estate |
0.7% |
Materials |
0.6% |
Utilities |
0.6% |
Other |
0.6% |
Table Summary
Common Stocks |
61.8% |
Residential Mortgage-Backed Securities - Agency |
11.7% |
Residential Mortgage-Backed Securities - Non-Agency |
8.1% |
Corporate Bonds & Notes |
7.9% |
Asset-Backed Securities - Non-Agency |
4.6% |
Money Market Funds |
3.3% |
Exchange-Traded Equity Funds |
2.9% |
Other |
1.5% | |
| Largest Holdings [Text Block] |
Table Summary
NVIDIA Corp. |
5.5% |
Microsoft Corp. |
4.3% |
Apple, Inc. |
3.8% |
Amazon.com, Inc. |
3.1% |
iShares Core MSCI EAFE ETF |
2.9% |
Broadcom, Inc. |
2.0% |
Alphabet, Inc., Class A |
1.9% |
Alphabet, Inc., Class C |
1.6% |
Micron Technology, Inc. |
1.5% |
Eli Lilly & Co. |
1.4% | |
| Material Fund Change [Text Block] |
|
| C000094667 |
|
| Shareholder Report [Line Items] |
|
| Fund Name |
Columbia Balanced Fund
|
| Class Name |
Institutional 2 Class
|
| Trading Symbol |
CLREX
|
| Annual or Semi-Annual Statement [Text Block] |
This annual shareholder report contains important information about Columbia Balanced Fund (the Fund) for the period of September 1, 2025 to August 31, 2026.
|
| Additional Information [Text Block] |
You can find additional information about the Fund at columbiathreadneedleus.com/resources/literature. You can also request more information by contacting us at 1-800-345-6611.
|
| Additional Information Phone Number |
1-800-345-6611
|
| Additional Information Website |
columbiathreadneedleus.com/resources/literature
|
| Expenses [Text Block] |
What were the Fund costs for the reporting period? (Based on a hypothetical $10,000 investment)
Table Summary
Class |
Cost of a $10,000 investment |
Cost paid as a percentage of a $10,000 investment |
Institutional 2 Class |
$67 |
0.63% | |
| Expenses Paid, Amount |
$ 67
|
| Expense Ratio, Percent |
0.63%
|
| Factors Affecting Performance [Text Block] |
Management's Discussion of Fund Performance The performance of Institutional 2 Class shares for the period presented is shown in the Average Annual Total Returns table. Top Performance ContributorsAllocations | Allocations to the consumer discretionary, communication services and real estate sectors boosted the Fund’s equity performance during the period. Smaller allocations to the consumer staples sector and larger allocations to the health care sector also contributed to equity performance. Sector allocation was the biggest driver of positive fixed-income performance with non-agency residential mortgage-backed securities (RMBS) contributing the most. Positioning in asset-backed securities (ABS) was additive, highlighted by holdings of collateralized loan obligations, fixed auto and other fixed ABS. Exposures to non-agency commercial mortgage-backed securities (CMBS) and high-yield corporates were also additive. Stock selection | Positions in Marvell Technology, a semiconductor company focused on data infrastructure and networking chips; Dell Technologies, a provider of personal computing and enterprise infrastructure solutions; and Applied Materials, a supplier of semiconductor manufacturing equipment and services, were among the top contributors to the Fund's equity performance. Security selection within ABS, CMBS and investment-grade corporate utilities contributed to the Fund’s performance in the fixed-income segment of the portfolio. Top Performance DetractorsAllocations | Allocations to the industrials, health care and energy sectors hurt the Fund’s equity performance during the period. Larger weightings to the financials and communication services sectors detracted from equity performance. Security selection within agency collateralized mortgage obligations and investment-grade corporates detracted from the Fund’s fixed-income performance. Duration and yield-curve positioning also detracted from fixed-income performance primarily due to the duration and yield curve positioning of mortgage-backed securities. Stock selection | Positions in Micron Technology, a memory and storage semiconductor manufacturer; Intuit, a financial software company; and Synopsys, a provider of chip design software and semiconductor IP, were among the top detractors from the Fund's equity performance. |
| Performance Past Does Not Indicate Future [Text] |
The Fund's past performance is not a good predictor of the Fund's future performance.
|
| Line Graph [Table Text Block] |
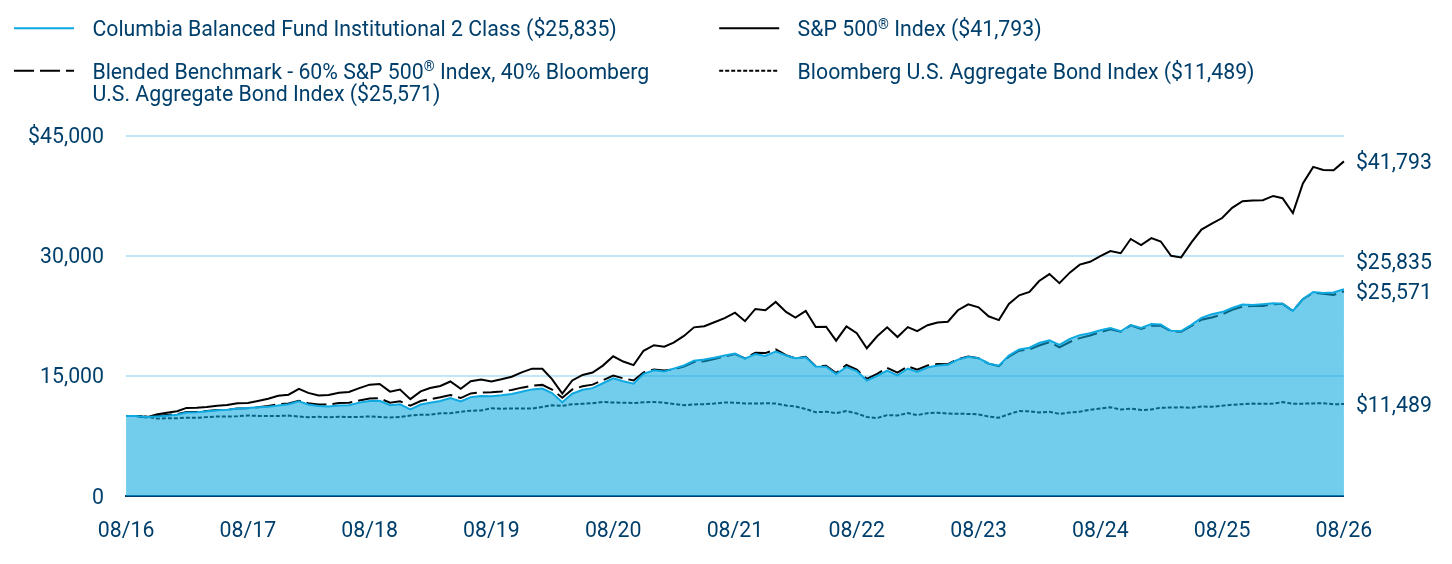
Table Summary
|
Columbia Balanced Fund Institutional 2 Class ($25,835) |
S&P 500® Index ($41,793) |
Blended Benchmark - 60% S&P 500® Index, 40% Bloomberg U.S. Aggregate Bond Index ($25,571) |
Bloomberg U.S. Aggregate Bond Index ($11,489) |
08/16 |
$10,000 |
$10,000 |
$10,000 |
$10,000 |
09/16 |
$9,998 |
$10,002 |
$9,999 |
$9,994 |
10/16 |
$9,859 |
$9,819 |
$9,859 |
$9,918 |
11/16 |
$9,928 |
$10,183 |
$9,985 |
$9,683 |
12/16 |
$10,026 |
$10,384 |
$10,109 |
$9,697 |
01/17 |
$10,150 |
$10,581 |
$10,232 |
$9,716 |
02/17 |
$10,423 |
$11,001 |
$10,503 |
$9,781 |
03/17 |
$10,469 |
$11,014 |
$10,508 |
$9,776 |
04/17 |
$10,585 |
$11,127 |
$10,605 |
$9,851 |
05/17 |
$10,696 |
$11,284 |
$10,727 |
$9,927 |
06/17 |
$10,769 |
$11,354 |
$10,763 |
$9,917 |
07/17 |
$10,931 |
$11,588 |
$10,915 |
$9,960 |
08/17 |
$10,991 |
$11,623 |
$10,974 |
$10,049 |
09/17 |
$11,076 |
$11,863 |
$11,089 |
$10,001 |
10/17 |
$11,152 |
$12,140 |
$11,246 |
$10,007 |
11/17 |
$11,315 |
$12,512 |
$11,448 |
$9,994 |
12/17 |
$11,465 |
$12,651 |
$11,545 |
$10,040 |
01/18 |
$11,826 |
$13,376 |
$11,888 |
$9,925 |
02/18 |
$11,440 |
$12,883 |
$11,580 |
$9,830 |
03/18 |
$11,229 |
$12,555 |
$11,434 |
$9,894 |
04/18 |
$11,187 |
$12,604 |
$11,426 |
$9,820 |
05/18 |
$11,313 |
$12,907 |
$11,624 |
$9,890 |
06/18 |
$11,347 |
$12,987 |
$11,661 |
$9,878 |
07/18 |
$11,662 |
$13,470 |
$11,922 |
$9,880 |
08/18 |
$11,866 |
$13,909 |
$12,186 |
$9,944 |
09/18 |
$11,899 |
$13,988 |
$12,196 |
$9,880 |
10/18 |
$11,330 |
$13,032 |
$11,658 |
$9,802 |
11/18 |
$11,459 |
$13,297 |
$11,828 |
$9,860 |
12/18 |
$10,818 |
$12,097 |
$11,274 |
$10,041 |
01/19 |
$11,424 |
$13,066 |
$11,864 |
$10,148 |
02/19 |
$11,638 |
$13,486 |
$12,090 |
$10,142 |
03/19 |
$11,874 |
$13,748 |
$12,324 |
$10,337 |
04/19 |
$12,236 |
$14,304 |
$12,624 |
$10,339 |
05/19 |
$11,800 |
$13,395 |
$12,233 |
$10,523 |
06/19 |
$12,349 |
$14,339 |
$12,811 |
$10,655 |
07/19 |
$12,502 |
$14,546 |
$12,933 |
$10,679 |
08/19 |
$12,470 |
$14,315 |
$12,944 |
$10,955 |
09/19 |
$12,583 |
$14,583 |
$13,062 |
$10,897 |
10/19 |
$12,746 |
$14,899 |
$13,247 |
$10,930 |
11/19 |
$13,014 |
$15,440 |
$13,533 |
$10,924 |
12/19 |
$13,316 |
$15,906 |
$13,775 |
$10,917 |
01/20 |
$13,411 |
$15,899 |
$13,877 |
$11,127 |
02/20 |
$12,851 |
$14,591 |
$13,292 |
$11,327 |
03/20 |
$11,710 |
$12,788 |
$12,276 |
$11,260 |
04/20 |
$12,773 |
$14,428 |
$13,307 |
$11,460 |
05/20 |
$13,271 |
$15,115 |
$13,712 |
$11,514 |
06/20 |
$13,471 |
$15,416 |
$13,910 |
$11,586 |
07/20 |
$14,085 |
$16,285 |
$14,464 |
$11,759 |
08/20 |
$14,708 |
$17,455 |
$15,041 |
$11,665 |
09/20 |
$14,323 |
$16,792 |
$14,695 |
$11,658 |
10/20 |
$14,035 |
$16,346 |
$14,434 |
$11,606 |
11/20 |
$15,254 |
$18,135 |
$15,439 |
$11,720 |
12/20 |
$15,704 |
$18,832 |
$15,803 |
$11,736 |
01/21 |
$15,549 |
$18,642 |
$15,662 |
$11,652 |
02/21 |
$15,907 |
$19,156 |
$15,831 |
$11,484 |
03/21 |
$16,298 |
$19,995 |
$16,168 |
$11,340 |
04/21 |
$16,897 |
$21,062 |
$16,737 |
$11,430 |
05/21 |
$17,036 |
$21,209 |
$16,829 |
$11,467 |
06/21 |
$17,274 |
$21,704 |
$17,112 |
$11,548 |
07/21 |
$17,540 |
$22,220 |
$17,432 |
$11,677 |
08/21 |
$17,806 |
$22,895 |
$17,737 |
$11,655 |
09/21 |
$17,157 |
$21,831 |
$17,181 |
$11,554 |
10/21 |
$17,729 |
$23,360 |
$17,901 |
$11,551 |
11/21 |
$17,501 |
$23,198 |
$17,848 |
$11,585 |
12/21 |
$18,053 |
$24,238 |
$18,309 |
$11,555 |
01/22 |
$17,562 |
$22,984 |
$17,583 |
$11,306 |
02/22 |
$17,212 |
$22,295 |
$17,189 |
$11,180 |
03/22 |
$17,336 |
$23,123 |
$17,381 |
$10,869 |
04/22 |
$16,166 |
$21,107 |
$16,207 |
$10,457 |
05/22 |
$16,138 |
$21,146 |
$16,267 |
$10,524 |
06/22 |
$15,228 |
$19,400 |
$15,359 |
$10,359 |
07/22 |
$16,099 |
$21,189 |
$16,359 |
$10,612 |
08/22 |
$15,612 |
$20,325 |
$15,774 |
$10,313 |
09/22 |
$14,414 |
$18,453 |
$14,630 |
$9,867 |
10/22 |
$15,006 |
$19,947 |
$15,265 |
$9,739 |
11/22 |
$15,659 |
$21,062 |
$16,001 |
$10,097 |
12/22 |
$15,053 |
$19,848 |
$15,419 |
$10,052 |
01/23 |
$15,920 |
$21,095 |
$16,190 |
$10,361 |
02/23 |
$15,485 |
$20,581 |
$15,786 |
$10,093 |
03/23 |
$16,045 |
$21,336 |
$16,294 |
$10,350 |
04/23 |
$16,302 |
$21,669 |
$16,486 |
$10,412 |
05/23 |
$16,403 |
$21,763 |
$16,457 |
$10,299 |
06/23 |
$17,032 |
$23,201 |
$17,086 |
$10,262 |
07/23 |
$17,400 |
$23,947 |
$17,411 |
$10,255 |
08/23 |
$17,220 |
$23,566 |
$17,200 |
$10,189 |
09/23 |
$16,548 |
$22,442 |
$16,533 |
$9,931 |
10/23 |
$16,272 |
$21,970 |
$16,220 |
$9,774 |
11/23 |
$17,537 |
$23,977 |
$17,403 |
$10,216 |
12/23 |
$18,296 |
$25,066 |
$18,143 |
$10,608 |
01/24 |
$18,516 |
$25,487 |
$18,306 |
$10,578 |
02/24 |
$19,101 |
$26,848 |
$18,789 |
$10,429 |
03/24 |
$19,443 |
$27,712 |
$19,222 |
$10,525 |
04/24 |
$18,870 |
$26,580 |
$18,556 |
$10,259 |
05/24 |
$19,618 |
$27,898 |
$19,234 |
$10,433 |
06/24 |
$20,093 |
$28,899 |
$19,721 |
$10,532 |
07/24 |
$20,335 |
$29,251 |
$20,049 |
$10,778 |
08/24 |
$20,711 |
$29,960 |
$20,456 |
$10,933 |
09/24 |
$20,965 |
$30,600 |
$20,828 |
$11,079 |
10/24 |
$20,572 |
$30,323 |
$20,508 |
$10,805 |
11/24 |
$21,355 |
$32,102 |
$21,317 |
$10,919 |
12/24 |
$20,977 |
$31,337 |
$20,873 |
$10,740 |
01/25 |
$21,471 |
$32,210 |
$21,266 |
$10,797 |
02/25 |
$21,410 |
$31,790 |
$21,286 |
$11,035 |
03/25 |
$20,630 |
$29,998 |
$20,570 |
$11,039 |
04/25 |
$20,602 |
$29,795 |
$20,519 |
$11,082 |
05/25 |
$21,366 |
$31,670 |
$21,235 |
$11,003 |
06/25 |
$22,245 |
$33,281 |
$22,013 |
$11,172 |
07/25 |
$22,712 |
$34,028 |
$22,287 |
$11,143 |
08/25 |
$22,972 |
$34,718 |
$22,664 |
$11,276 |
09/25 |
$23,474 |
$35,985 |
$23,260 |
$11,399 |
10/25 |
$23,918 |
$36,827 |
$23,644 |
$11,470 |
11/25 |
$23,860 |
$36,918 |
$23,738 |
$11,541 |
12/25 |
$23,957 |
$36,940 |
$23,733 |
$11,524 |
01/26 |
$24,074 |
$37,476 |
$23,949 |
$11,537 |
02/26 |
$24,000 |
$37,191 |
$23,997 |
$11,726 |
03/26 |
$23,120 |
$35,339 |
$23,111 |
$11,519 |
04/26 |
$24,602 |
$39,047 |
$24,576 |
$11,532 |
05/26 |
$25,482 |
$41,102 |
$25,383 |
$11,568 |
06/26 |
$25,364 |
$40,711 |
$25,262 |
$11,596 |
07/26 |
$25,408 |
$40,685 |
$25,121 |
$11,445 |
08/26 |
$25,835 |
$41,793 |
$25,571 |
$11,489 |
|
| Average Annual Return [Table Text Block] |
Table Summary
Average Annual Total Returns (%) |
1 year |
5 years |
10 years |
Institutional 2 Class |
12.46 |
7.73 |
9.96 |
S&P 500® Index |
20.38 |
12.79 |
15.37 |
Blended Benchmark - 60% S&P 500® Index, 40% Bloomberg U.S. Aggregate Bond Index |
12.82 |
7.59 |
9.84 |
Bloomberg U.S. Aggregate Bond Index |
1.89 |
(0.29) |
1.40 | |
| No Deduction of Taxes [Text Block] |
Performance does not reflect the deduction of taxes that a shareholder may pay on fund distributions or on the redemptions of fund shares.
|
| Updated Performance Information Location [Text Block] |
columbiathreadneedleus.com/investment-products/mutual-funds
|
| AssetsNet |
$ 10,425,754,230
|
| Holdings Count | Holding |
997
|
| Advisory Fees Paid, Amount |
$ 57,729,592
|
| InvestmentCompanyPortfolioTurnover |
86.00%
|
| Additional Fund Statistics [Text Block] |
Table Summary
Fund net assets |
$10,425,754,230 |
Total number of portfolio holdings |
997 |
Management services fees (represents 0.56% of Fund average net assets) |
$57,729,592 |
Portfolio turnover for the reporting period |
86% |
Portfolio turnover as of the end of the period excluding transactions in to be announced securities |
50% | |
| Holdings [Text Block] |
Table Summary
Information Technology |
24.1% |
Financials |
8.5% |
Communication Services |
6.9% |
Health Care |
6.5% |
Consumer Discretionary |
6.2% |
Industrials |
5.3% |
Energy |
1.8% |
Real Estate |
0.7% |
Materials |
0.6% |
Utilities |
0.6% |
Other |
0.6% |
Table Summary
Common Stocks |
61.8% |
Residential Mortgage-Backed Securities - Agency |
11.7% |
Residential Mortgage-Backed Securities - Non-Agency |
8.1% |
Corporate Bonds & Notes |
7.9% |
Asset-Backed Securities - Non-Agency |
4.6% |
Money Market Funds |
3.3% |
Exchange-Traded Equity Funds |
2.9% |
Other |
1.5% | |
| Largest Holdings [Text Block] |
Table Summary
NVIDIA Corp. |
5.5% |
Microsoft Corp. |
4.3% |
Apple, Inc. |
3.8% |
Amazon.com, Inc. |
3.1% |
iShares Core MSCI EAFE ETF |
2.9% |
Broadcom, Inc. |
2.0% |
Alphabet, Inc., Class A |
1.9% |
Alphabet, Inc., Class C |
1.6% |
Micron Technology, Inc. |
1.5% |
Eli Lilly & Co. |
1.4% | |
| Material Fund Change [Text Block] |
|
| C000122660 |
|
| Shareholder Report [Line Items] |
|
| Fund Name |
Columbia Balanced Fund
|
| Class Name |
Institutional 3 Class
|
| Trading Symbol |
CBDYX
|
| Annual or Semi-Annual Statement [Text Block] |
This annual shareholder report contains important information about Columbia Balanced Fund (the Fund) for the period of September 1, 2025 to August 31, 2026.
|
| Additional Information [Text Block] |
You can find additional information about the Fund at columbiathreadneedleus.com/resources/literature. You can also request more information by contacting us at 1-800-345-6611.
|
| Additional Information Phone Number |
1-800-345-6611
|
| Additional Information Website |
columbiathreadneedleus.com/resources/literature
|
| Expenses [Text Block] |
What were the Fund costs for the reporting period? (Based on a hypothetical $10,000 investment)
Table Summary
Class |
Cost of a $10,000 investment |
Cost paid as a percentage of a $10,000 investment |
Institutional 3 Class |
$62 |
0.58% | |
| Expenses Paid, Amount |
$ 62
|
| Expense Ratio, Percent |
0.58%
|
| Factors Affecting Performance [Text Block] |
Management's Discussion of Fund Performance The performance of Institutional 3 Class shares for the period presented is shown in the Average Annual Total Returns table. Top Performance ContributorsAllocations | Allocations to the consumer discretionary, communication services and real estate sectors boosted the Fund’s equity performance during the period. Smaller allocations to the consumer staples sector and larger allocations to the health care sector also contributed to equity performance. Sector allocation was the biggest driver of positive fixed-income performance with non-agency residential mortgage-backed securities (RMBS) contributing the most. Positioning in asset-backed securities (ABS) was additive, highlighted by holdings of collateralized loan obligations, fixed auto and other fixed ABS. Exposures to non-agency commercial mortgage-backed securities (CMBS) and high-yield corporates were also additive. Stock selection | Positions in Marvell Technology, a semiconductor company focused on data infrastructure and networking chips; Dell Technologies, a provider of personal computing and enterprise infrastructure solutions; and Applied Materials, a supplier of semiconductor manufacturing equipment and services, were among the top contributors to the Fund's equity performance. Security selection within ABS, CMBS and investment-grade corporate utilities contributed to the Fund’s performance in the fixed-income segment of the portfolio. Top Performance DetractorsAllocations | Allocations to the industrials, health care and energy sectors hurt the Fund’s equity performance during the period. Larger weightings to the financials and communication services sectors detracted from equity performance. Security selection within agency collateralized mortgage obligations and investment-grade corporates detracted from the Fund’s fixed-income performance. Duration and yield-curve positioning also detracted from fixed-income performance primarily due to the duration and yield curve positioning of mortgage-backed securities. Stock selection | Positions in Micron Technology, a memory and storage semiconductor manufacturer; Intuit, a financial software company; and Synopsys, a provider of chip design software and semiconductor IP, were among the top detractors from the Fund's equity performance. |
| Performance Past Does Not Indicate Future [Text] |
The Fund's past performance is not a good predictor of the Fund's future performance.
|
| Line Graph [Table Text Block] |
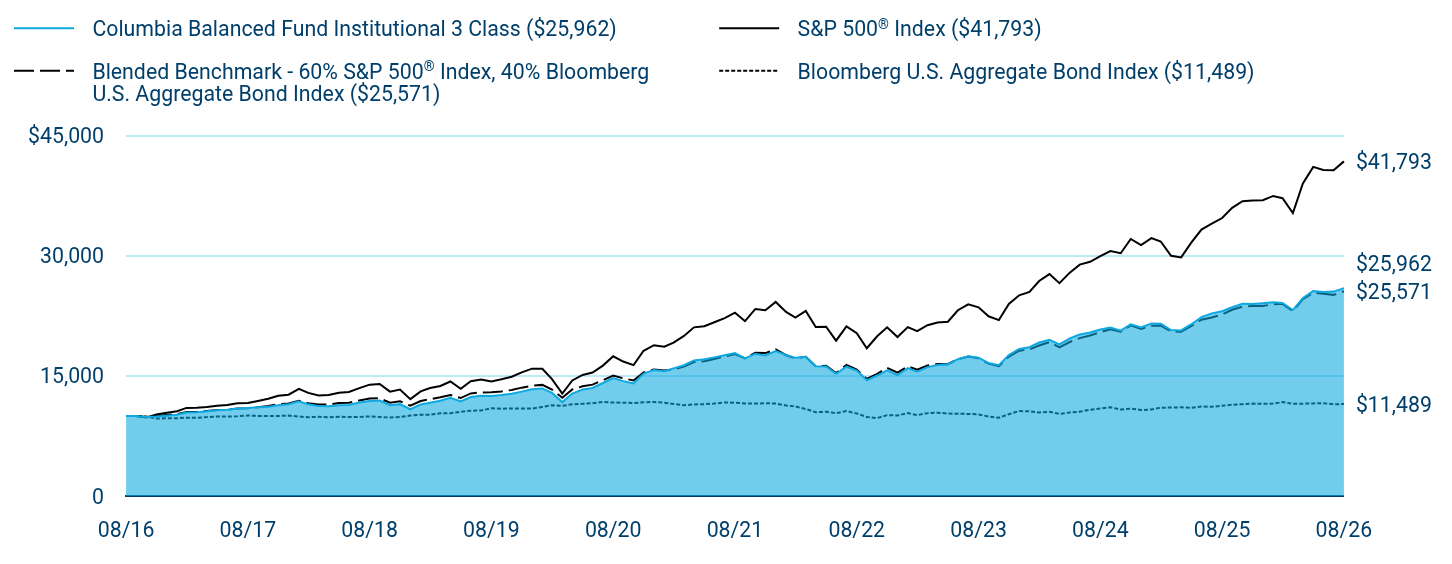
Table Summary
|
Columbia Balanced Fund Institutional 3 Class ($25,962) |
S&P 500® Index ($41,793) |
Blended Benchmark - 60% S&P 500® Index, 40% Bloomberg U.S. Aggregate Bond Index ($25,571) |
Bloomberg U.S. Aggregate Bond Index ($11,489) |
08/16 |
$10,000 |
$10,000 |
$10,000 |
$10,000 |
09/16 |
$9,996 |
$10,002 |
$9,999 |
$9,994 |
10/16 |
$9,858 |
$9,819 |
$9,859 |
$9,918 |
11/16 |
$9,927 |
$10,183 |
$9,985 |
$9,683 |
12/16 |
$10,029 |
$10,384 |
$10,109 |
$9,697 |
01/17 |
$10,154 |
$10,581 |
$10,232 |
$9,716 |
02/17 |
$10,424 |
$11,001 |
$10,503 |
$9,781 |
03/17 |
$10,471 |
$11,014 |
$10,508 |
$9,776 |
04/17 |
$10,587 |
$11,127 |
$10,605 |
$9,851 |
05/17 |
$10,702 |
$11,284 |
$10,727 |
$9,927 |
06/17 |
$10,773 |
$11,354 |
$10,763 |
$9,917 |
07/17 |
$10,934 |
$11,588 |
$10,915 |
$9,960 |
08/17 |
$10,996 |
$11,623 |
$10,974 |
$10,049 |
09/17 |
$11,081 |
$11,863 |
$11,089 |
$10,001 |
10/17 |
$11,157 |
$12,140 |
$11,246 |
$10,007 |
11/17 |
$11,322 |
$12,512 |
$11,448 |
$9,994 |
12/17 |
$11,471 |
$12,651 |
$11,545 |
$10,040 |
01/18 |
$11,835 |
$13,376 |
$11,888 |
$9,925 |
02/18 |
$11,449 |
$12,883 |
$11,580 |
$9,830 |
03/18 |
$11,238 |
$12,555 |
$11,434 |
$9,894 |
04/18 |
$11,197 |
$12,604 |
$11,426 |
$9,820 |
05/18 |
$11,324 |
$12,907 |
$11,624 |
$9,890 |
06/18 |
$11,356 |
$12,987 |
$11,661 |
$9,878 |
07/18 |
$11,672 |
$13,470 |
$11,922 |
$9,880 |
08/18 |
$11,877 |
$13,909 |
$12,186 |
$9,944 |
09/18 |
$11,912 |
$13,988 |
$12,196 |
$9,880 |
10/18 |
$11,341 |
$13,032 |
$11,658 |
$9,802 |
11/18 |
$11,472 |
$13,297 |
$11,828 |
$9,860 |
12/18 |
$10,832 |
$12,097 |
$11,274 |
$10,041 |
01/19 |
$11,439 |
$13,066 |
$11,864 |
$10,148 |
02/19 |
$11,651 |
$13,486 |
$12,090 |
$10,142 |
03/19 |
$11,886 |
$13,748 |
$12,324 |
$10,337 |
04/19 |
$12,251 |
$14,304 |
$12,624 |
$10,339 |
05/19 |
$11,813 |
$13,395 |
$12,233 |
$10,523 |
06/19 |
$12,364 |
$14,339 |
$12,811 |
$10,655 |
07/19 |
$12,519 |
$14,546 |
$12,933 |
$10,679 |
08/19 |
$12,487 |
$14,315 |
$12,944 |
$10,955 |
09/19 |
$12,601 |
$14,583 |
$13,062 |
$10,897 |
10/19 |
$12,766 |
$14,899 |
$13,247 |
$10,930 |
11/19 |
$13,034 |
$15,440 |
$13,533 |
$10,924 |
12/19 |
$13,339 |
$15,906 |
$13,775 |
$10,917 |
01/20 |
$13,433 |
$15,899 |
$13,877 |
$11,127 |
02/20 |
$12,872 |
$14,591 |
$13,292 |
$11,327 |
03/20 |
$11,729 |
$12,788 |
$12,276 |
$11,260 |
04/20 |
$12,796 |
$14,428 |
$13,307 |
$11,460 |
05/20 |
$13,296 |
$15,115 |
$13,712 |
$11,514 |
06/20 |
$13,495 |
$15,416 |
$13,910 |
$11,586 |
07/20 |
$14,110 |
$16,285 |
$14,464 |
$11,759 |
08/20 |
$14,735 |
$17,455 |
$15,041 |
$11,665 |
09/20 |
$14,348 |
$16,792 |
$14,695 |
$11,658 |
10/20 |
$14,062 |
$16,346 |
$14,434 |
$11,606 |
11/20 |
$15,284 |
$18,135 |
$15,439 |
$11,720 |
12/20 |
$15,735 |
$18,832 |
$15,803 |
$11,736 |
01/21 |
$15,582 |
$18,642 |
$15,662 |
$11,652 |
02/21 |
$15,944 |
$19,156 |
$15,831 |
$11,484 |
03/21 |
$16,333 |
$19,995 |
$16,168 |
$11,340 |
04/21 |
$16,934 |
$21,062 |
$16,737 |
$11,430 |
05/21 |
$17,072 |
$21,209 |
$16,829 |
$11,467 |
06/21 |
$17,313 |
$21,704 |
$17,112 |
$11,548 |
07/21 |
$17,580 |
$22,220 |
$17,432 |
$11,677 |
08/21 |
$17,848 |
$22,895 |
$17,737 |
$11,655 |
09/21 |
$17,199 |
$21,831 |
$17,181 |
$11,554 |
10/21 |
$17,773 |
$23,360 |
$17,901 |
$11,551 |
11/21 |
$17,544 |
$23,198 |
$17,848 |
$11,585 |
12/21 |
$18,097 |
$24,238 |
$18,309 |
$11,555 |
01/22 |
$17,607 |
$22,984 |
$17,583 |
$11,306 |
02/22 |
$17,256 |
$22,295 |
$17,189 |
$11,180 |
03/22 |
$17,382 |
$23,123 |
$17,381 |
$10,869 |
04/22 |
$16,211 |
$21,107 |
$16,207 |
$10,457 |
05/22 |
$16,183 |
$21,146 |
$16,267 |
$10,524 |
06/22 |
$15,269 |
$19,400 |
$15,359 |
$10,359 |
07/22 |
$16,147 |
$21,189 |
$16,359 |
$10,612 |
08/22 |
$15,657 |
$20,325 |
$15,774 |
$10,313 |
09/22 |
$14,457 |
$18,453 |
$14,630 |
$9,867 |
10/22 |
$15,048 |
$19,947 |
$15,265 |
$9,739 |
11/22 |
$15,706 |
$21,062 |
$16,001 |
$10,097 |
12/22 |
$15,100 |
$19,848 |
$15,419 |
$10,052 |
01/23 |
$15,971 |
$21,095 |
$16,190 |
$10,361 |
02/23 |
$15,536 |
$20,581 |
$15,786 |
$10,093 |
03/23 |
$16,096 |
$21,336 |
$16,294 |
$10,350 |
04/23 |
$16,355 |
$21,669 |
$16,486 |
$10,412 |
05/23 |
$16,455 |
$21,763 |
$16,457 |
$10,299 |
06/23 |
$17,088 |
$23,201 |
$17,086 |
$10,262 |
07/23 |
$17,457 |
$23,947 |
$17,411 |
$10,255 |
08/23 |
$17,278 |
$23,566 |
$17,200 |
$10,189 |
09/23 |
$16,606 |
$22,442 |
$16,533 |
$9,931 |
10/23 |
$16,329 |
$21,970 |
$16,220 |
$9,774 |
11/23 |
$17,599 |
$23,977 |
$17,403 |
$10,216 |
12/23 |
$18,360 |
$25,066 |
$18,143 |
$10,608 |
01/24 |
$18,582 |
$25,487 |
$18,306 |
$10,578 |
02/24 |
$19,170 |
$26,848 |
$18,789 |
$10,429 |
03/24 |
$19,515 |
$27,712 |
$19,222 |
$10,525 |
04/24 |
$18,940 |
$26,580 |
$18,556 |
$10,259 |
05/24 |
$19,689 |
$27,898 |
$19,234 |
$10,433 |
06/24 |
$20,170 |
$28,899 |
$19,721 |
$10,532 |
07/24 |
$20,413 |
$29,251 |
$20,049 |
$10,778 |
08/24 |
$20,794 |
$29,960 |
$20,456 |
$10,933 |
09/24 |
$21,045 |
$30,600 |
$20,828 |
$11,079 |
10/24 |
$20,651 |
$30,323 |
$20,508 |
$10,805 |
11/24 |
$21,439 |
$32,102 |
$21,317 |
$10,919 |
12/24 |
$21,063 |
$31,337 |
$20,873 |
$10,740 |
01/25 |
$21,557 |
$32,210 |
$21,266 |
$10,797 |
02/25 |
$21,500 |
$31,790 |
$21,286 |
$11,035 |
03/25 |
$20,718 |
$29,998 |
$20,570 |
$11,039 |
04/25 |
$20,685 |
$29,795 |
$20,519 |
$11,082 |
05/25 |
$21,455 |
$31,670 |
$21,235 |
$11,003 |
06/25 |
$22,342 |
$33,281 |
$22,013 |
$11,172 |
07/25 |
$22,808 |
$34,028 |
$22,287 |
$11,143 |
08/25 |
$23,075 |
$34,718 |
$22,664 |
$11,276 |
09/25 |
$23,579 |
$35,985 |
$23,260 |
$11,399 |
10/25 |
$24,023 |
$36,827 |
$23,644 |
$11,470 |
11/25 |
$23,966 |
$36,918 |
$23,738 |
$11,541 |
12/25 |
$24,065 |
$36,940 |
$23,733 |
$11,524 |
01/26 |
$24,186 |
$37,476 |
$23,949 |
$11,537 |
02/26 |
$24,112 |
$37,191 |
$23,997 |
$11,726 |
03/26 |
$23,226 |
$35,339 |
$23,111 |
$11,519 |
04/26 |
$24,720 |
$39,047 |
$24,576 |
$11,532 |
05/26 |
$25,605 |
$41,102 |
$25,383 |
$11,568 |
06/26 |
$25,487 |
$40,711 |
$25,262 |
$11,596 |
07/26 |
$25,530 |
$40,685 |
$25,121 |
$11,445 |
08/26 |
$25,962 |
$41,793 |
$25,571 |
$11,489 |
|
| Average Annual Return [Table Text Block] |
Table Summary
Average Annual Total Returns (%) |
1 year |
5 years |
10 years |
Institutional 3 Class |
12.52 |
7.78 |
10.01 |
S&P 500® Index |
20.38 |
12.79 |
15.37 |
Blended Benchmark - 60% S&P 500® Index, 40% Bloomberg U.S. Aggregate Bond Index |
12.82 |
7.59 |
9.84 |
Bloomberg U.S. Aggregate Bond Index |
1.89 |
(0.29) |
1.40 | |
| No Deduction of Taxes [Text Block] |
Performance does not reflect the deduction of taxes that a shareholder may pay on fund distributions or on the redemptions of fund shares.
|
| Updated Performance Information Location [Text Block] |
columbiathreadneedleus.com/investment-products/mutual-funds
|
| AssetsNet |
$ 10,425,754,230
|
| Holdings Count | Holding |
997
|
| Advisory Fees Paid, Amount |
$ 57,729,592
|
| InvestmentCompanyPortfolioTurnover |
86.00%
|
| Additional Fund Statistics [Text Block] |
Table Summary
Fund net assets |
$10,425,754,230 |
Total number of portfolio holdings |
997 |
Management services fees (represents 0.56% of Fund average net assets) |
$57,729,592 |
Portfolio turnover for the reporting period |
86% |
Portfolio turnover as of the end of the period excluding transactions in to be announced securities |
50% | |
| Holdings [Text Block] |
Table Summary
Information Technology |
24.1% |
Financials |
8.5% |
Communication Services |
6.9% |
Health Care |
6.5% |
Consumer Discretionary |
6.2% |
Industrials |
5.3% |
Energy |
1.8% |
Real Estate |
0.7% |
Materials |
0.6% |
Utilities |
0.6% |
Other |
0.6% |
Table Summary
Common Stocks |
61.8% |
Residential Mortgage-Backed Securities - Agency |
11.7% |
Residential Mortgage-Backed Securities - Non-Agency |
8.1% |
Corporate Bonds & Notes |
7.9% |
Asset-Backed Securities - Non-Agency |
4.6% |
Money Market Funds |
3.3% |
Exchange-Traded Equity Funds |
2.9% |
Other |
1.5% | |
| Largest Holdings [Text Block] |
Table Summary
NVIDIA Corp. |
5.5% |
Microsoft Corp. |
4.3% |
Apple, Inc. |
3.8% |
Amazon.com, Inc. |
3.1% |
iShares Core MSCI EAFE ETF |
2.9% |
Broadcom, Inc. |
2.0% |
Alphabet, Inc., Class A |
1.9% |
Alphabet, Inc., Class C |
1.6% |
Micron Technology, Inc. |
1.5% |
Eli Lilly & Co. |
1.4% | |
| Material Fund Change [Text Block] |
|
| C000094665 |
|
| Shareholder Report [Line Items] |
|
| Fund Name |
Columbia Balanced Fund
|
| Class Name |
Class R
|
| Trading Symbol |
CBLRX
|
| Annual or Semi-Annual Statement [Text Block] |
This annual shareholder report contains important information about Columbia Balanced Fund (the Fund) for the period of September 1, 2025 to August 31, 2026.
|
| Additional Information [Text Block] |
You can find additional information about the Fund at columbiathreadneedleus.com/resources/literature. You can also request more information by contacting us at 1-800-345-6611.
|
| Additional Information Phone Number |
1-800-345-6611
|
| Additional Information Website |
columbiathreadneedleus.com/resources/literature
|
| Expenses [Text Block] |
What were the Fund costs for the reporting period? (Based on a hypothetical $10,000 investment)
Table Summary
Class |
Cost of a $10,000 investment |
Cost paid as a percentage of a $10,000 investment |
Class R |
$123 |
1.16% | |
| Expenses Paid, Amount |
$ 123
|
| Expense Ratio, Percent |
1.16%
|
| Factors Affecting Performance [Text Block] |
Management's Discussion of Fund Performance The performance of Class R shares for the period presented is shown in the Average Annual Total Returns table. Top Performance ContributorsAllocations | Allocations to the consumer discretionary, communication services and real estate sectors boosted the Fund’s equity performance during the period. Smaller allocations to the consumer staples sector and larger allocations to the health care sector also contributed to equity performance. Sector allocation was the biggest driver of positive fixed-income performance with non-agency residential mortgage-backed securities (RMBS) contributing the most. Positioning in asset-backed securities (ABS) was additive, highlighted by holdings of collateralized loan obligations, fixed auto and other fixed ABS. Exposures to non-agency commercial mortgage-backed securities (CMBS) and high-yield corporates were also additive. Stock selection | Positions in Marvell Technology, a semiconductor company focused on data infrastructure and networking chips; Dell Technologies, a provider of personal computing and enterprise infrastructure solutions; and Applied Materials, a supplier of semiconductor manufacturing equipment and services, were among the top contributors to the Fund's equity performance. Security selection within ABS, CMBS and investment-grade corporate utilities contributed to the Fund’s performance in the fixed-income segment of the portfolio. Top Performance DetractorsAllocations | Allocations to the industrials, health care and energy sectors hurt the Fund’s equity performance during the period. Larger weightings to the financials and communication services sectors detracted from equity performance. Security selection within agency collateralized mortgage obligations and investment-grade corporates detracted from the Fund’s fixed-income performance. Duration and yield-curve positioning also detracted from fixed-income performance primarily due to the duration and yield curve positioning of mortgage-backed securities. Stock selection | Positions in Micron Technology, a memory and storage semiconductor manufacturer; Intuit, a financial software company; and Synopsys, a provider of chip design software and semiconductor IP, were among the top detractors from the Fund's equity performance. |
| Performance Past Does Not Indicate Future [Text] |
The Fund's past performance is not a good predictor of the Fund's future performance.
|
| Line Graph [Table Text Block] |
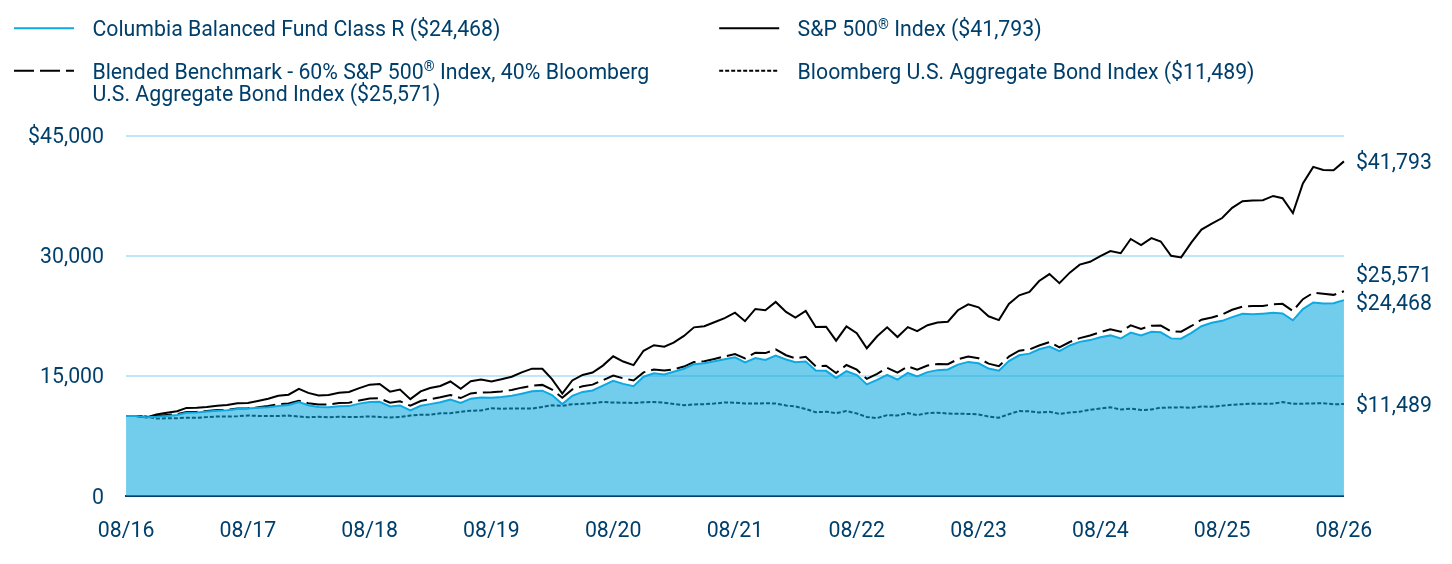
Table Summary
|
Columbia Balanced Fund Class R ($24,468) |
S&P 500® Index ($41,793) |
Blended Benchmark - 60% S&P 500® Index, 40% Bloomberg U.S. Aggregate Bond Index ($25,571) |
Bloomberg U.S. Aggregate Bond Index ($11,489) |
08/16 |
$10,000 |
$10,000 |
$10,000 |
$10,000 |
09/16 |
$9,991 |
$10,002 |
$9,999 |
$9,994 |
10/16 |
$9,846 |
$9,819 |
$9,859 |
$9,918 |
11/16 |
$9,910 |
$10,183 |
$9,985 |
$9,683 |
12/16 |
$10,005 |
$10,384 |
$10,109 |
$9,697 |
01/17 |
$10,126 |
$10,581 |
$10,232 |
$9,716 |
02/17 |
$10,391 |
$11,001 |
$10,503 |
$9,781 |
03/17 |
$10,434 |
$11,014 |
$10,508 |
$9,776 |
04/17 |
$10,541 |
$11,127 |
$10,605 |
$9,851 |
05/17 |
$10,649 |
$11,284 |
$10,727 |
$9,927 |
06/17 |
$10,714 |
$11,354 |
$10,763 |
$9,917 |
07/17 |
$10,871 |
$11,588 |
$10,915 |
$9,960 |
08/17 |
$10,927 |
$11,623 |
$10,974 |
$10,049 |
09/17 |
$11,007 |
$11,863 |
$11,089 |
$10,001 |
10/17 |
$11,077 |
$12,140 |
$11,246 |
$10,007 |
11/17 |
$11,234 |
$12,512 |
$11,448 |
$9,994 |
12/17 |
$11,378 |
$12,651 |
$11,545 |
$10,040 |
01/18 |
$11,729 |
$13,376 |
$11,888 |
$9,925 |
02/18 |
$11,342 |
$12,883 |
$11,580 |
$9,830 |
03/18 |
$11,129 |
$12,555 |
$11,434 |
$9,894 |
04/18 |
$11,082 |
$12,604 |
$11,426 |
$9,820 |
05/18 |
$11,200 |
$12,907 |
$11,624 |
$9,890 |
06/18 |
$11,227 |
$12,987 |
$11,661 |
$9,878 |
07/18 |
$11,536 |
$13,470 |
$11,922 |
$9,880 |
08/18 |
$11,732 |
$13,909 |
$12,186 |
$9,944 |
09/18 |
$11,760 |
$13,988 |
$12,196 |
$9,880 |
10/18 |
$11,193 |
$13,032 |
$11,658 |
$9,802 |
11/18 |
$11,314 |
$13,297 |
$11,828 |
$9,860 |
12/18 |
$10,677 |
$12,097 |
$11,274 |
$10,041 |
01/19 |
$11,269 |
$13,066 |
$11,864 |
$10,148 |
02/19 |
$11,474 |
$13,486 |
$12,090 |
$10,142 |
03/19 |
$11,702 |
$13,748 |
$12,324 |
$10,337 |
04/19 |
$12,053 |
$14,304 |
$12,624 |
$10,339 |
05/19 |
$11,618 |
$13,395 |
$12,233 |
$10,523 |
06/19 |
$12,153 |
$14,339 |
$12,811 |
$10,655 |
07/19 |
$12,298 |
$14,546 |
$12,933 |
$10,679 |
08/19 |
$12,260 |
$14,315 |
$12,944 |
$10,955 |
09/19 |
$12,369 |
$14,583 |
$13,062 |
$10,897 |
10/19 |
$12,524 |
$14,899 |
$13,247 |
$10,930 |
11/19 |
$12,780 |
$15,440 |
$13,533 |
$10,924 |
12/19 |
$13,071 |
$15,906 |
$13,775 |
$10,917 |
01/20 |
$13,158 |
$15,899 |
$13,877 |
$11,127 |
02/20 |
$12,601 |
$14,591 |
$13,292 |
$11,327 |
03/20 |
$11,476 |
$12,788 |
$12,276 |
$11,260 |
04/20 |
$12,513 |
$14,428 |
$13,307 |
$11,460 |
05/20 |
$12,997 |
$15,115 |
$13,712 |
$11,514 |
06/20 |
$13,184 |
$15,416 |
$13,910 |
$11,586 |
07/20 |
$13,781 |
$16,285 |
$14,464 |
$11,759 |
08/20 |
$14,384 |
$17,455 |
$15,041 |
$11,665 |
09/20 |
$14,000 |
$16,792 |
$14,695 |
$11,658 |
10/20 |
$13,713 |
$16,346 |
$14,434 |
$11,606 |
11/20 |
$14,897 |
$18,135 |
$15,439 |
$11,720 |
12/20 |
$15,331 |
$18,832 |
$15,803 |
$11,736 |
01/21 |
$15,174 |
$18,642 |
$15,662 |
$11,652 |
02/21 |
$15,517 |
$19,156 |
$15,831 |
$11,484 |
03/21 |
$15,889 |
$19,995 |
$16,168 |
$11,340 |
04/21 |
$16,466 |
$21,062 |
$16,737 |
$11,430 |
05/21 |
$16,592 |
$21,209 |
$16,829 |
$11,467 |
06/21 |
$16,817 |
$21,704 |
$17,112 |
$11,548 |
07/21 |
$17,069 |
$22,220 |
$17,432 |
$11,677 |
08/21 |
$17,318 |
$22,895 |
$17,737 |
$11,655 |
09/21 |
$16,680 |
$21,831 |
$17,181 |
$11,554 |
10/21 |
$17,232 |
$23,360 |
$17,901 |
$11,551 |
11/21 |
$16,999 |
$23,198 |
$17,848 |
$11,585 |
12/21 |
$17,530 |
$24,238 |
$18,309 |
$11,555 |
01/22 |
$17,043 |
$22,984 |
$17,583 |
$11,306 |
02/22 |
$16,697 |
$22,295 |
$17,189 |
$11,180 |
03/22 |
$16,808 |
$23,123 |
$17,381 |
$10,869 |
04/22 |
$15,670 |
$21,107 |
$16,207 |
$10,457 |
05/22 |
$15,635 |
$21,146 |
$16,267 |
$10,524 |
06/22 |
$14,747 |
$19,400 |
$15,359 |
$10,359 |
07/22 |
$15,586 |
$21,189 |
$16,359 |
$10,612 |
08/22 |
$15,105 |
$20,325 |
$15,774 |
$10,313 |
09/22 |
$13,942 |
$18,453 |
$14,630 |
$9,867 |
10/22 |
$14,503 |
$19,947 |
$15,265 |
$9,739 |
11/22 |
$15,130 |
$21,062 |
$16,001 |
$10,097 |
12/22 |
$14,536 |
$19,848 |
$15,419 |
$10,052 |
01/23 |
$15,368 |
$21,095 |
$16,190 |
$10,361 |
02/23 |
$14,941 |
$20,581 |
$15,786 |
$10,093 |
03/23 |
$15,474 |
$21,336 |
$16,294 |
$10,350 |
04/23 |
$15,719 |
$21,669 |
$16,486 |
$10,412 |
05/23 |
$15,805 |
$21,763 |
$16,457 |
$10,299 |
06/23 |
$16,407 |
$23,201 |
$17,086 |
$10,262 |
07/23 |
$16,749 |
$23,947 |
$17,411 |
$10,255 |
08/23 |
$16,573 |
$23,566 |
$17,200 |
$10,189 |
09/23 |
$15,916 |
$22,442 |
$16,533 |
$9,931 |
10/23 |
$15,644 |
$21,970 |
$16,220 |
$9,774 |
11/23 |
$16,855 |
$23,977 |
$17,403 |
$10,216 |
12/23 |
$17,574 |
$25,066 |
$18,143 |
$10,608 |
01/24 |
$17,778 |
$25,487 |
$18,306 |
$10,578 |
02/24 |
$18,331 |
$26,848 |
$18,789 |
$10,429 |
03/24 |
$18,653 |
$27,712 |
$19,222 |
$10,525 |
04/24 |
$18,094 |
$26,580 |
$18,556 |
$10,259 |
05/24 |
$18,802 |
$27,898 |
$19,234 |
$10,433 |
06/24 |
$19,251 |
$28,899 |
$19,721 |
$10,532 |
07/24 |
$19,471 |
$29,251 |
$20,049 |
$10,778 |
08/24 |
$19,827 |
$29,960 |
$20,456 |
$10,933 |
09/24 |
$20,058 |
$30,600 |
$20,828 |
$11,079 |
10/24 |
$19,672 |
$30,323 |
$20,508 |
$10,805 |
11/24 |
$20,412 |
$32,102 |
$21,317 |
$10,919 |
12/24 |
$20,042 |
$31,337 |
$20,873 |
$10,740 |
01/25 |
$20,506 |
$32,210 |
$21,266 |
$10,797 |
02/25 |
$20,440 |
$31,790 |
$21,286 |
$11,035 |
03/25 |
$19,686 |
$29,998 |
$20,570 |
$11,039 |
04/25 |
$19,647 |
$29,795 |
$20,519 |
$11,082 |
05/25 |
$20,371 |
$31,670 |
$21,235 |
$11,003 |
06/25 |
$21,200 |
$33,281 |
$22,013 |
$11,172 |
07/25 |
$21,632 |
$34,028 |
$22,287 |
$11,143 |
08/25 |
$21,876 |
$34,718 |
$22,664 |
$11,276 |
09/25 |
$22,342 |
$35,985 |
$23,260 |
$11,399 |
10/25 |
$22,752 |
$36,827 |
$23,644 |
$11,470 |
11/25 |
$22,689 |
$36,918 |
$23,738 |
$11,541 |
12/25 |
$22,770 |
$36,940 |
$23,733 |
$11,524 |
01/26 |
$22,874 |
$37,476 |
$23,949 |
$11,537 |
02/26 |
$22,791 |
$37,191 |
$23,997 |
$11,726 |
03/26 |
$21,943 |
$35,339 |
$23,111 |
$11,519 |
04/26 |
$23,343 |
$39,047 |
$24,576 |
$11,532 |
05/26 |
$24,165 |
$41,102 |
$25,383 |
$11,568 |
06/26 |
$24,043 |
$40,711 |
$25,262 |
$11,596 |
07/26 |
$24,072 |
$40,685 |
$25,121 |
$11,445 |
08/26 |
$24,468 |
$41,793 |
$25,571 |
$11,489 |
|
| Average Annual Return [Table Text Block] |
Table Summary
Average Annual Total Returns (%) |
1 year |
5 years |
10 years |
Class R |
11.85 |
7.16 |
9.36 |
S&P 500® Index |
20.38 |
12.79 |
15.37 |
Blended Benchmark - 60% S&P 500® Index, 40% Bloomberg U.S. Aggregate Bond Index |
12.82 |
7.59 |
9.84 |
Bloomberg U.S. Aggregate Bond Index |
1.89 |
(0.29) |
1.40 | |
| No Deduction of Taxes [Text Block] |
Performance does not reflect the deduction of taxes that a shareholder may pay on fund distributions or on the redemptions of fund shares.
|
| Updated Performance Information Location [Text Block] |
columbiathreadneedleus.com/investment-products/mutual-funds
|
| AssetsNet |
$ 10,425,754,230
|
| Holdings Count | Holding |
997
|
| Advisory Fees Paid, Amount |
$ 57,729,592
|
| InvestmentCompanyPortfolioTurnover |
86.00%
|
| Additional Fund Statistics [Text Block] |
Table Summary
Fund net assets |
$10,425,754,230 |
Total number of portfolio holdings |
997 |
Management services fees (represents 0.56% of Fund average net assets) |
$57,729,592 |
Portfolio turnover for the reporting period |
86% |
Portfolio turnover as of the end of the period excluding transactions in to be announced securities |
50% | |
| Holdings [Text Block] |
Table Summary
Information Technology |
24.1% |
Financials |
8.5% |
Communication Services |
6.9% |
Health Care |
6.5% |
Consumer Discretionary |
6.2% |
Industrials |
5.3% |
Energy |
1.8% |
Real Estate |
0.7% |
Materials |
0.6% |
Utilities |
0.6% |
Other |
0.6% |
Table Summary
Common Stocks |
61.8% |
Residential Mortgage-Backed Securities - Agency |
11.7% |
Residential Mortgage-Backed Securities - Non-Agency |
8.1% |
Corporate Bonds & Notes |
7.9% |
Asset-Backed Securities - Non-Agency |
4.6% |
Money Market Funds |
3.3% |
Exchange-Traded Equity Funds |
2.9% |
Other |
1.5% | |
| Largest Holdings [Text Block] |
Table Summary
NVIDIA Corp. |
5.5% |
Microsoft Corp. |
4.3% |
Apple, Inc. |
3.8% |
Amazon.com, Inc. |
3.1% |
iShares Core MSCI EAFE ETF |
2.9% |
Broadcom, Inc. |
2.0% |
Alphabet, Inc., Class A |
1.9% |
Alphabet, Inc., Class C |
1.6% |
Micron Technology, Inc. |
1.5% |
Eli Lilly & Co. |
1.4% | |
| Material Fund Change [Text Block] |
|
| C000253713 |
|
| Shareholder Report [Line Items] |
|
| Fund Name |
Columbia Balanced Fund
|
| Class Name |
Class S
|
| Trading Symbol |
CBABX
|
| Annual or Semi-Annual Statement [Text Block] |
This annual shareholder report contains important information about Columbia Balanced Fund (the Fund) for the period of September 1, 2025 to August 31, 2026.
|
| Additional Information [Text Block] |
You can find additional information about the Fund at columbiathreadneedleus.com/resources/literature. You can also request more information by contacting us at 1-800-345-6611.
|
| Additional Information Phone Number |
1-800-345-6611
|
| Additional Information Website |
columbiathreadneedleus.com/resources/literature
|
| Expenses [Text Block] |
What were the Fund costs for the reporting period? (Based on a hypothetical $10,000 investment)
Table Summary
Class |
Cost of a $10,000 investment |
Cost paid as a percentage of a $10,000 investment |
Class S |
$70 |
0.66% | |
| Expenses Paid, Amount |
$ 70
|
| Expense Ratio, Percent |
0.66%
|
| Factors Affecting Performance [Text Block] |
Management's Discussion of Fund Performance The performance of Class S shares for the period presented is shown in the Average Annual Total Returns table. Top Performance ContributorsAllocations | Allocations to the consumer discretionary, communication services and real estate sectors boosted the Fund’s equity performance during the period. Smaller allocations to the consumer staples sector and larger allocations to the health care sector also contributed to equity performance. Sector allocation was the biggest driver of positive fixed-income performance with non-agency residential mortgage-backed securities (RMBS) contributing the most. Positioning in asset-backed securities (ABS) was additive, highlighted by holdings of collateralized loan obligations, fixed auto and other fixed ABS. Exposures to non-agency commercial mortgage-backed securities (CMBS) and high-yield corporates were also additive. Stock selection | Positions in Marvell Technology, a semiconductor company focused on data infrastructure and networking chips; Dell Technologies, a provider of personal computing and enterprise infrastructure solutions; and Applied Materials, a supplier of semiconductor manufacturing equipment and services, were among the top contributors to the Fund's equity performance. Security selection within ABS, CMBS and investment-grade corporate utilities contributed to the Fund’s performance in the fixed-income segment of the portfolio. Top Performance DetractorsAllocations | Allocations to the industrials, health care and energy sectors hurt the Fund’s equity performance during the period. Larger weightings to the financials and communication services sectors detracted from equity performance. Security selection within agency collateralized mortgage obligations and investment-grade corporates detracted from the Fund’s fixed-income performance. Duration and yield-curve positioning also detracted from fixed-income performance primarily due to the duration and yield curve positioning of mortgage-backed securities. Stock selection | Positions in Micron Technology, a memory and storage semiconductor manufacturer; Intuit, a financial software company; and Synopsys, a provider of chip design software and semiconductor IP, were among the top detractors from the Fund's equity performance. |
| Performance Past Does Not Indicate Future [Text] |
The Fund's past performance is not a good predictor of the Fund's future performance.
|
| Line Graph [Table Text Block] |
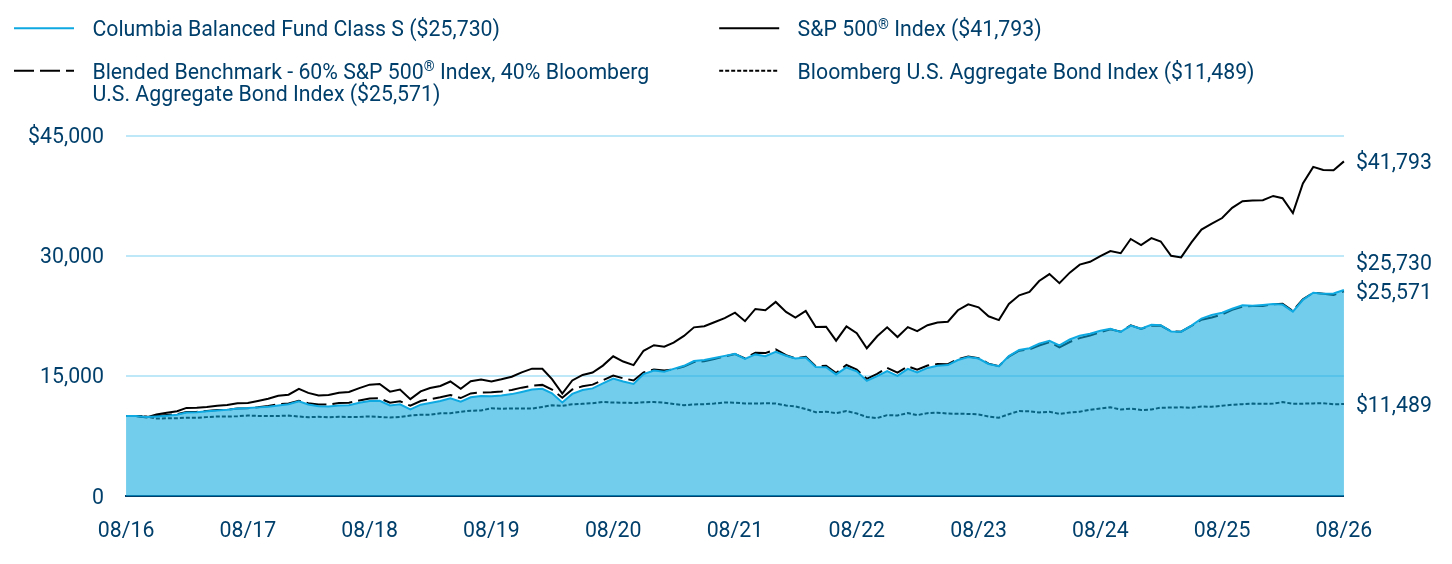
Table Summary
|
Columbia Balanced Fund Class S ($25,730) |
S&P 500® Index ($41,793) |
Blended Benchmark - 60% S&P 500® Index, 40% Bloomberg U.S. Aggregate Bond Index ($25,571) |
Bloomberg U.S. Aggregate Bond Index ($11,489) |
08/16 |
$10,000 |
$10,000 |
$10,000 |
$10,000 |
09/16 |
$9,995 |
$10,002 |
$9,999 |
$9,994 |
10/16 |
$9,856 |
$9,819 |
$9,859 |
$9,918 |
11/16 |
$9,926 |
$10,183 |
$9,985 |
$9,683 |
12/16 |
$10,025 |
$10,384 |
$10,109 |
$9,697 |
01/17 |
$10,149 |
$10,581 |
$10,232 |
$9,716 |
02/17 |
$10,418 |
$11,001 |
$10,503 |
$9,781 |
03/17 |
$10,465 |
$11,014 |
$10,508 |
$9,776 |
04/17 |
$10,579 |
$11,127 |
$10,605 |
$9,851 |
05/17 |
$10,692 |
$11,284 |
$10,727 |
$9,927 |
06/17 |
$10,761 |
$11,354 |
$10,763 |
$9,917 |
07/17 |
$10,923 |
$11,588 |
$10,915 |
$9,960 |
08/17 |
$10,983 |
$11,623 |
$10,974 |
$10,049 |
09/17 |
$11,069 |
$11,863 |
$11,089 |
$10,001 |
10/17 |
$11,145 |
$12,140 |
$11,246 |
$10,007 |
11/17 |
$11,306 |
$12,512 |
$11,448 |
$9,994 |
12/17 |
$11,457 |
$12,651 |
$11,545 |
$10,040 |
01/18 |
$11,817 |
$13,376 |
$11,888 |
$9,925 |
02/18 |
$11,432 |
$12,883 |
$11,580 |
$9,830 |
03/18 |
$11,219 |
$12,555 |
$11,434 |
$9,894 |
04/18 |
$11,178 |
$12,604 |
$11,426 |
$9,820 |
05/18 |
$11,303 |
$12,907 |
$11,624 |
$9,890 |
06/18 |
$11,333 |
$12,987 |
$11,661 |
$9,878 |
07/18 |
$11,648 |
$13,470 |
$11,922 |
$9,880 |
08/18 |
$11,852 |
$13,909 |
$12,186 |
$9,944 |
09/18 |
$11,886 |
$13,988 |
$12,196 |
$9,880 |
10/18 |
$11,318 |
$13,032 |
$11,658 |
$9,802 |
11/18 |
$11,444 |
$13,297 |
$11,828 |
$9,860 |
12/18 |
$10,804 |
$12,097 |
$11,274 |
$10,041 |
01/19 |
$11,410 |
$13,066 |
$11,864 |
$10,148 |
02/19 |
$11,621 |
$13,486 |
$12,090 |
$10,142 |
03/19 |
$11,855 |
$13,748 |
$12,324 |
$10,337 |
04/19 |
$12,216 |
$14,304 |
$12,624 |
$10,339 |
05/19 |
$11,782 |
$13,395 |
$12,233 |
$10,523 |
06/19 |
$12,331 |
$14,339 |
$12,811 |
$10,655 |
07/19 |
$12,481 |
$14,546 |
$12,933 |
$10,679 |
08/19 |
$12,449 |
$14,315 |
$12,944 |
$10,955 |
09/19 |
$12,563 |
$14,583 |
$13,062 |
$10,897 |
10/19 |
$12,726 |
$14,899 |
$13,247 |
$10,930 |
11/19 |
$12,990 |
$15,440 |
$13,533 |
$10,924 |
12/19 |
$13,291 |
$15,906 |
$13,775 |
$10,917 |
01/20 |
$13,386 |
$15,899 |
$13,877 |
$11,127 |
02/20 |
$12,827 |
$14,591 |
$13,292 |
$11,327 |
03/20 |
$11,688 |
$12,788 |
$12,276 |
$11,260 |
04/20 |
$12,747 |
$14,428 |
$13,307 |
$11,460 |
05/20 |
$13,244 |
$15,115 |
$13,712 |
$11,514 |
06/20 |
$13,442 |
$15,416 |
$13,910 |
$11,586 |
07/20 |
$14,055 |
$16,285 |
$14,464 |
$11,759 |
08/20 |
$14,677 |
$17,455 |
$15,041 |
$11,665 |
09/20 |
$14,291 |
$16,792 |
$14,695 |
$11,658 |
10/20 |
$14,004 |
$16,346 |
$14,434 |
$11,606 |
11/20 |
$15,221 |
$18,135 |
$15,439 |
$11,720 |
12/20 |
$15,669 |
$18,832 |
$15,803 |
$11,736 |
01/21 |
$15,514 |
$18,642 |
$15,662 |
$11,652 |
02/21 |
$15,872 |
$19,156 |
$15,831 |
$11,484 |
03/21 |
$16,260 |
$19,995 |
$16,168 |
$11,340 |
04/21 |
$16,858 |
$21,062 |
$16,737 |
$11,430 |
05/21 |
$16,994 |
$21,209 |
$16,829 |
$11,467 |
06/21 |
$17,233 |
$21,704 |
$17,112 |
$11,548 |
07/21 |
$17,499 |
$22,220 |
$17,432 |
$11,677 |
08/21 |
$17,761 |
$22,895 |
$17,737 |
$11,655 |
09/21 |
$17,115 |
$21,831 |
$17,181 |
$11,554 |
10/21 |
$17,686 |
$23,360 |
$17,901 |
$11,551 |
11/21 |
$17,455 |
$23,198 |
$17,848 |
$11,585 |
12/21 |
$18,005 |
$24,238 |
$18,309 |
$11,555 |
01/22 |
$17,514 |
$22,984 |
$17,583 |
$11,306 |
02/22 |
$17,165 |
$22,295 |
$17,189 |
$11,180 |
03/22 |
$17,287 |
$23,123 |
$17,381 |
$10,869 |
04/22 |
$16,123 |
$21,107 |
$16,207 |
$10,457 |
05/22 |
$16,095 |
$21,146 |
$16,267 |
$10,524 |
06/22 |
$15,186 |
$19,400 |
$15,359 |
$10,359 |
07/22 |
$16,055 |
$21,189 |
$16,359 |
$10,612 |
08/22 |
$15,566 |
$20,325 |
$15,774 |
$10,313 |
09/22 |
$14,373 |
$18,453 |
$14,630 |
$9,867 |
10/22 |
$14,964 |
$19,947 |
$15,265 |
$9,739 |
11/22 |
$15,612 |
$21,062 |
$16,001 |
$10,097 |
12/22 |
$15,009 |
$19,848 |
$15,419 |
$10,052 |
01/23 |
$15,874 |
$21,095 |
$16,190 |
$10,361 |
02/23 |
$15,440 |
$20,581 |
$15,786 |
$10,093 |
03/23 |
$15,993 |
$21,336 |
$16,294 |
$10,350 |
04/23 |
$16,254 |
$21,669 |
$16,486 |
$10,412 |
05/23 |
$16,351 |
$21,763 |
$16,457 |
$10,299 |
06/23 |
$16,981 |
$23,201 |
$17,086 |
$10,262 |
07/23 |
$17,344 |
$23,947 |
$17,411 |
$10,255 |
08/23 |
$17,165 |
$23,566 |
$17,200 |
$10,189 |
09/23 |
$16,493 |
$22,442 |
$16,533 |
$9,931 |
10/23 |
$16,218 |
$21,970 |
$16,220 |
$9,774 |
11/23 |
$17,480 |
$23,977 |
$17,403 |
$10,216 |
12/23 |
$18,235 |
$25,066 |
$18,143 |
$10,608 |
01/24 |
$18,454 |
$25,487 |
$18,306 |
$10,578 |
02/24 |
$19,034 |
$26,848 |
$18,789 |
$10,429 |
03/24 |
$19,377 |
$27,712 |
$19,222 |
$10,525 |
04/24 |
$18,806 |
$26,580 |
$18,556 |
$10,259 |
05/24 |
$19,548 |
$27,898 |
$19,234 |
$10,433 |
06/24 |
$20,024 |
$28,899 |
$19,721 |
$10,532 |
07/24 |
$20,261 |
$29,251 |
$20,049 |
$10,778 |
08/24 |
$20,640 |
$29,960 |
$20,456 |
$10,933 |
09/24 |
$20,888 |
$30,600 |
$20,828 |
$11,079 |
10/24 |
$20,496 |
$30,323 |
$20,508 |
$10,805 |
11/24 |
$21,277 |
$32,102 |
$21,317 |
$10,919 |
12/24 |
$20,900 |
$31,337 |
$20,873 |
$10,740 |
01/25 |
$21,389 |
$32,210 |
$21,266 |
$10,797 |
02/25 |
$21,332 |
$31,790 |
$21,286 |
$11,035 |
03/25 |
$20,556 |
$29,998 |
$20,570 |
$11,039 |
04/25 |
$20,523 |
$29,795 |
$20,519 |
$11,082 |
05/25 |
$21,286 |
$31,670 |
$21,235 |
$11,003 |
06/25 |
$22,164 |
$33,281 |
$22,013 |
$11,172 |
07/25 |
$22,625 |
$34,028 |
$22,287 |
$11,143 |
08/25 |
$22,885 |
$34,718 |
$22,664 |
$11,276 |
09/25 |
$23,383 |
$35,985 |
$23,260 |
$11,399 |
10/25 |
$23,825 |
$36,827 |
$23,644 |
$11,470 |
11/25 |
$23,768 |
$36,918 |
$23,738 |
$11,541 |
12/25 |
$23,862 |
$36,940 |
$23,733 |
$11,524 |
01/26 |
$23,979 |
$37,476 |
$23,949 |
$11,537 |
02/26 |
$23,905 |
$37,191 |
$23,997 |
$11,726 |
03/26 |
$23,027 |
$35,339 |
$23,111 |
$11,519 |
04/26 |
$24,503 |
$39,047 |
$24,576 |
$11,532 |
05/26 |
$25,381 |
$41,102 |
$25,383 |
$11,568 |
06/26 |
$25,261 |
$40,711 |
$25,262 |
$11,596 |
07/26 |
$25,305 |
$40,685 |
$25,121 |
$11,445 |
08/26 |
$25,730 |
$41,793 |
$25,571 |
$11,489 |
|
| Average Annual Return [Table Text Block] |
Table Summary
Average Annual Total Returns (%) |
1 year |
5 years |
10 years |
Class SFootnote Reference(a) |
12.44 |
7.69 |
9.91 |
S&P 500® Index |
20.38 |
12.79 |
15.37 |
Blended Benchmark - 60% S&P 500® Index, 40% Bloomberg U.S. Aggregate Bond Index |
12.82 |
7.59 |
9.84 |
Bloomberg U.S. Aggregate Bond Index |
1.89 |
(0.29) |
1.40 | |
| No Deduction of Taxes [Text Block] |
Performance does not reflect the deduction of taxes that a shareholder may pay on fund distributions or on the redemptions of fund shares.
|
| Updated Performance Information Location [Text Block] |
columbiathreadneedleus.com/investment-products/mutual-funds
|
| AssetsNet |
$ 10,425,754,230
|
| Holdings Count | Holding |
997
|
| Advisory Fees Paid, Amount |
$ 57,729,592
|
| InvestmentCompanyPortfolioTurnover |
86.00%
|
| Additional Fund Statistics [Text Block] |
Table Summary
Fund net assets |
$10,425,754,230 |
Total number of portfolio holdings |
997 |
Management services fees (represents 0.56% of Fund average net assets) |
$57,729,592 |
Portfolio turnover for the reporting period |
86% |
Portfolio turnover as of the end of the period excluding transactions in to be announced securities |
50% | |
| Holdings [Text Block] |
Table Summary
Information Technology |
24.1% |
Financials |
8.5% |
Communication Services |
6.9% |
Health Care |
6.5% |
Consumer Discretionary |
6.2% |
Industrials |
5.3% |
Energy |
1.8% |
Real Estate |
0.7% |
Materials |
0.6% |
Utilities |
0.6% |
Other |
0.6% |
Table Summary
Common Stocks |
61.8% |
Residential Mortgage-Backed Securities - Agency |
11.7% |
Residential Mortgage-Backed Securities - Non-Agency |
8.1% |
Corporate Bonds & Notes |
7.9% |
Asset-Backed Securities - Non-Agency |
4.6% |
Money Market Funds |
3.3% |
Exchange-Traded Equity Funds |
2.9% |
Other |
1.5% | |
| Largest Holdings [Text Block] |
Table Summary
NVIDIA Corp. |
5.5% |
Microsoft Corp. |
4.3% |
Apple, Inc. |
3.8% |
Amazon.com, Inc. |
3.1% |
iShares Core MSCI EAFE ETF |
2.9% |
Broadcom, Inc. |
2.0% |
Alphabet, Inc., Class A |
1.9% |
Alphabet, Inc., Class C |
1.6% |
Micron Technology, Inc. |
1.5% |
Eli Lilly & Co. |
1.4% | |
| Material Fund Change [Text Block] |
|
| C000032888 |
|
| Shareholder Report [Line Items] |
|
| Fund Name |
Columbia Contrarian Core Fund
|
| Class Name |
Class A
|
| Trading Symbol |
LCCAX
|
| Annual or Semi-Annual Statement [Text Block] |
This annual shareholder report contains important information about Columbia Contrarian Core Fund (the Fund) for the period of September 1, 2025 to August 31, 2026.
|
| Additional Information [Text Block] |
You can find additional information about the Fund at columbiathreadneedleus.com/resources/literature. You can also request more information by contacting us at 1-800-345-6611.
|
| Additional Information Phone Number |
1-800-345-6611
|
| Additional Information Website |
columbiathreadneedleus.com/resources/literature
|
| Expenses [Text Block] |
What were the Fund costs for the reporting period? (Based on a hypothetical $10,000 investment)
Table Summary
Class |
Cost of a $10,000 investment |
Cost paid as a percentage of a $10,000 investment |
Class A |
$107 |
0.98% | |
| Expenses Paid, Amount |
$ 107
|
| Expense Ratio, Percent |
0.98%
|
| Factors Affecting Performance [Text Block] |
Management's Discussion of Fund Performance The performance of Class A shares for the period presented is shown in the Average Annual Total Returns table. Top Performance ContributorsStock selection | Selections in the consumer discretionary, communication services and real estate sectors boosted the Fund’s performance relative to the benchmark during the period. Allocations | Smaller allocations to the consumer staples sector and larger allocations to the information technology sector buoyed the Fund’s relative performance during the period. Individual holdings | Positions in Marvell Technology, a semiconductor company focused on data infrastructure and networking chips; Dell Technologies, a provider of personal computing and enterprise infrastructure solutions; and Applied Materials, a supplier of semiconductor manufacturing equipment and services, were among the top contributors to the Fund's relative performance. Top Performance DetractorsStock selection | Selections in the industrials, health care and energy sectors hurt the Fund’s performance relative to the benchmark during the period. Allocations | Larger weightings in the financials and communication services sectors detracted from the Fund’s relative performance. Individual holdings | Positions in Intuit, a financial software company; Micron Technology, a memory and storage semiconductor manufacturer; and Synopsys, a provider of chip design software and semiconductor IP, were among the top detractors from the Fund's relative performance. |
| Performance Past Does Not Indicate Future [Text] |
The Fund's past performance is not a good predictor of the Fund's future performance.
|
| Line Graph [Table Text Block] |
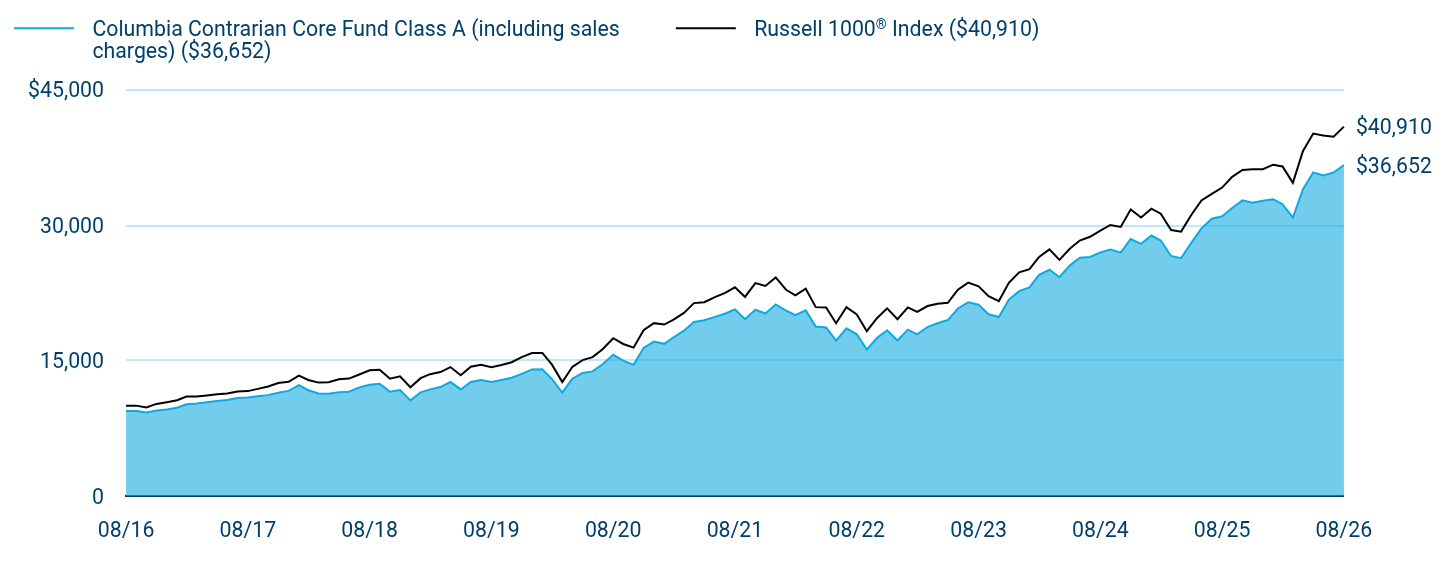
Table Summary
|
Columbia Contrarian Core Fund Class A (including sales charges) ($36,652) |
Russell 1000® Index ($40,910) |
08/16 |
$9,425 |
$10,000 |
09/16 |
$9,421 |
$10,008 |
10/16 |
$9,247 |
$9,813 |
11/16 |
$9,463 |
$10,200 |
12/16 |
$9,588 |
$10,391 |
01/17 |
$9,769 |
$10,600 |
02/17 |
$10,154 |
$11,010 |
03/17 |
$10,236 |
$11,017 |
04/17 |
$10,377 |
$11,134 |
05/17 |
$10,510 |
$11,276 |
06/17 |
$10,622 |
$11,355 |
07/17 |
$10,853 |
$11,580 |
08/17 |
$10,896 |
$11,616 |
09/17 |
$11,055 |
$11,863 |
10/17 |
$11,171 |
$12,135 |
11/17 |
$11,432 |
$12,505 |
12/17 |
$11,643 |
$12,645 |
01/18 |
$12,273 |
$13,339 |
02/18 |
$11,716 |
$12,849 |
03/18 |
$11,349 |
$12,558 |
04/18 |
$11,317 |
$12,600 |
05/18 |
$11,480 |
$12,922 |
06/18 |
$11,543 |
$13,005 |
07/18 |
$12,028 |
$13,454 |
08/18 |
$12,323 |
$13,918 |
09/18 |
$12,418 |
$13,971 |
10/18 |
$11,543 |
$12,982 |
11/18 |
$11,738 |
$13,246 |
12/18 |
$10,573 |
$12,040 |
01/19 |
$11,475 |
$13,049 |
02/19 |
$11,812 |
$13,491 |
03/19 |
$12,065 |
$13,726 |
04/19 |
$12,639 |
$14,280 |
05/19 |
$11,802 |
$13,370 |
06/19 |
$12,620 |
$14,308 |
07/19 |
$12,858 |
$14,531 |
08/19 |
$12,630 |
$14,265 |
09/19 |
$12,853 |
$14,512 |
10/19 |
$13,095 |
$14,819 |
11/19 |
$13,532 |
$15,379 |
12/19 |
$14,019 |
$15,824 |
01/20 |
$14,030 |
$15,841 |
02/20 |
$12,938 |
$14,546 |
03/20 |
$11,458 |
$12,624 |
04/20 |
$12,970 |
$14,292 |
05/20 |
$13,626 |
$15,046 |
06/20 |
$13,799 |
$15,379 |
07/20 |
$14,612 |
$16,279 |
08/20 |
$15,636 |
$17,474 |
09/20 |
$14,990 |
$16,836 |
10/20 |
$14,523 |
$16,430 |
11/20 |
$16,397 |
$18,364 |
12/20 |
$17,100 |
$19,141 |
01/21 |
$16,851 |
$18,983 |
02/21 |
$17,569 |
$19,533 |
03/21 |
$18,305 |
$20,272 |
04/21 |
$19,272 |
$21,364 |
05/21 |
$19,458 |
$21,465 |
06/21 |
$19,814 |
$22,003 |
07/21 |
$20,182 |
$22,460 |
08/21 |
$20,663 |
$23,110 |
09/21 |
$19,588 |
$22,048 |
10/21 |
$20,629 |
$23,578 |
11/21 |
$20,205 |
$23,262 |
12/21 |
$21,207 |
$24,204 |
01/22 |
$20,518 |
$22,840 |
02/22 |
$20,016 |
$22,213 |
03/22 |
$20,557 |
$22,962 |
04/22 |
$18,761 |
$20,916 |
05/22 |
$18,665 |
$20,884 |
06/22 |
$17,197 |
$19,135 |
07/22 |
$18,562 |
$20,917 |
08/22 |
$17,905 |
$20,114 |
09/22 |
$16,206 |
$18,253 |
10/22 |
$17,526 |
$19,717 |
11/22 |
$18,362 |
$20,783 |
12/22 |
$17,221 |
$19,575 |
01/23 |
$18,420 |
$20,887 |
02/23 |
$17,895 |
$20,390 |
03/23 |
$18,711 |
$21,035 |
04/23 |
$19,129 |
$21,296 |
05/23 |
$19,484 |
$21,395 |
06/23 |
$20,768 |
$22,840 |
07/23 |
$21,463 |
$23,625 |
08/23 |
$21,179 |
$23,212 |
09/23 |
$20,129 |
$22,121 |
10/23 |
$19,817 |
$21,587 |
11/23 |
$21,732 |
$23,603 |
12/23 |
$22,690 |
$24,768 |
01/24 |
$23,099 |
$25,113 |
02/24 |
$24,494 |
$26,469 |
03/24 |
$25,057 |
$27,318 |
04/24 |
$24,231 |
$26,155 |
05/24 |
$25,517 |
$27,387 |
06/24 |
$26,386 |
$28,294 |
07/24 |
$26,467 |
$28,705 |
08/24 |
$26,985 |
$29,386 |
09/24 |
$27,292 |
$30,014 |
10/24 |
$26,949 |
$29,804 |
11/24 |
$28,461 |
$31,723 |
12/24 |
$27,920 |
$30,839 |
01/25 |
$28,846 |
$31,820 |
02/25 |
$28,295 |
$31,264 |
03/25 |
$26,586 |
$29,454 |
04/25 |
$26,339 |
$29,279 |
05/25 |
$28,063 |
$31,148 |
06/25 |
$29,636 |
$32,726 |
07/25 |
$30,706 |
$33,453 |
08/25 |
$30,978 |
$34,157 |
09/25 |
$31,888 |
$35,341 |
10/25 |
$32,742 |
$36,104 |
11/25 |
$32,479 |
$36,192 |
12/25 |
$32,695 |
$36,194 |
01/26 |
$32,858 |
$36,692 |
02/26 |
$32,318 |
$36,496 |
03/26 |
$30,836 |
$34,681 |
04/26 |
$33,945 |
$38,185 |
05/26 |
$35,821 |
$40,133 |
06/26 |
$35,487 |
$39,928 |
07/26 |
$35,821 |
$39,788 |
08/26 |
$36,652 |
$40,910 |
|
| Average Annual Return [Table Text Block] |
Table Summary
Average Annual Total Returns (%) |
1 year |
5 years |
10 years |
Class A (excluding sales charges) |
18.32 |
12.15 |
14.55 |
Class A (including sales charges) |
11.51 |
10.82 |
13.87 |
Russell 1000® Index |
19.77 |
12.10 |
15.13 | |
| No Deduction of Taxes [Text Block] |
Performance does not reflect the deduction of taxes that a shareholder may pay on fund distributions or on the redemptions of fund shares.
|
| Updated Performance Information Location [Text Block] |
columbiathreadneedleus.com/investment-products/mutual-funds
|
| AssetsNet |
$ 18,595,649,063
|
| Holdings Count | Holding |
78
|
| Advisory Fees Paid, Amount |
$ 100,926,880
|
| InvestmentCompanyPortfolioTurnover |
56.00%
|
| Additional Fund Statistics [Text Block] |
Table Summary
Fund net assets |
$18,595,649,063 |
Total number of portfolio holdings |
78 |
Management services fees (represents 0.60% of Fund average net assets) |
$100,926,880 |
Portfolio turnover for the reporting period |
56% | |
| Holdings [Text Block] |
Table Summary
Information Technology |
38.4% |
Financials |
13.7% |
Communication Services |
11.0% |
Health Care |
10.6% |
Consumer Discretionary |
10.0% |
Industrials |
8.5% |
Energy |
3.0% |
Real Estate |
1.1% |
Materials |
1.0% |
Utilities |
1.0% |
Other |
0.9% |
Table Summary
Common Stocks |
99.2% |
Other |
0.8% | |
| Largest Holdings [Text Block] |
Table Summary
NVIDIA Corp. |
8.9% |
Microsoft Corp. |
6.7% |
Apple, Inc. |
6.1% |
Amazon.com, Inc. |
5.1% |
Broadcom, Inc. |
3.2% |
Alphabet, Inc., Class A |
3.0% |
Alphabet, Inc., Class C |
2.4% |
Micron Technology, Inc. |
2.4% |
Eli Lilly & Co. |
2.4% |
Meta Platforms, Inc., Class A |
2.3% | |
| Material Fund Change [Text Block] |
|
| C000032890 |
|
| Shareholder Report [Line Items] |
|
| Fund Name |
Columbia Contrarian Core Fund
|
| Class Name |
Class C
|
| Trading Symbol |
LCCCX
|
| Annual or Semi-Annual Statement [Text Block] |
This annual shareholder report contains important information about Columbia Contrarian Core Fund (the Fund) for the period of September 1, 2025 to August 31, 2026.
|
| Additional Information [Text Block] |
You can find additional information about the Fund at columbiathreadneedleus.com/resources/literature. You can also request more information by contacting us at 1-800-345-6611.
|
| Additional Information Phone Number |
1-800-345-6611
|
| Additional Information Website |
columbiathreadneedleus.com/resources/literature
|
| Expenses [Text Block] |
What were the Fund costs for the reporting period? (Based on a hypothetical $10,000 investment)
Table Summary
Class |
Cost of a $10,000 investment |
Cost paid as a percentage of a $10,000 investment |
Class C |
$188 |
1.73% | |
| Expenses Paid, Amount |
$ 188
|
| Expense Ratio, Percent |
1.73%
|
| Factors Affecting Performance [Text Block] |
Management's Discussion of Fund Performance The performance of Class C shares for the period presented is shown in the Average Annual Total Returns table. Top Performance ContributorsStock selection | Selections in the consumer discretionary, communication services and real estate sectors boosted the Fund’s performance relative to the benchmark during the period. Allocations | Smaller allocations to the consumer staples sector and larger allocations to the information technology sector buoyed the Fund’s relative performance during the period. Individual holdings | Positions in Marvell Technology, a semiconductor company focused on data infrastructure and networking chips; Dell Technologies, a provider of personal computing and enterprise infrastructure solutions; and Applied Materials, a supplier of semiconductor manufacturing equipment and services, were among the top contributors to the Fund's relative performance. Top Performance DetractorsStock selection | Selections in the industrials, health care and energy sectors hurt the Fund’s performance relative to the benchmark during the period. Allocations | Larger weightings in the financials and communication services sectors detracted from the Fund’s relative performance. Individual holdings | Positions in Intuit, a financial software company; Micron Technology, a memory and storage semiconductor manufacturer; and Synopsys, a provider of chip design software and semiconductor IP, were among the top detractors from the Fund's relative performance. |
| Performance Past Does Not Indicate Future [Text] |
The Fund's past performance is not a good predictor of the Fund's future performance.
|
| Line Graph [Table Text Block] |
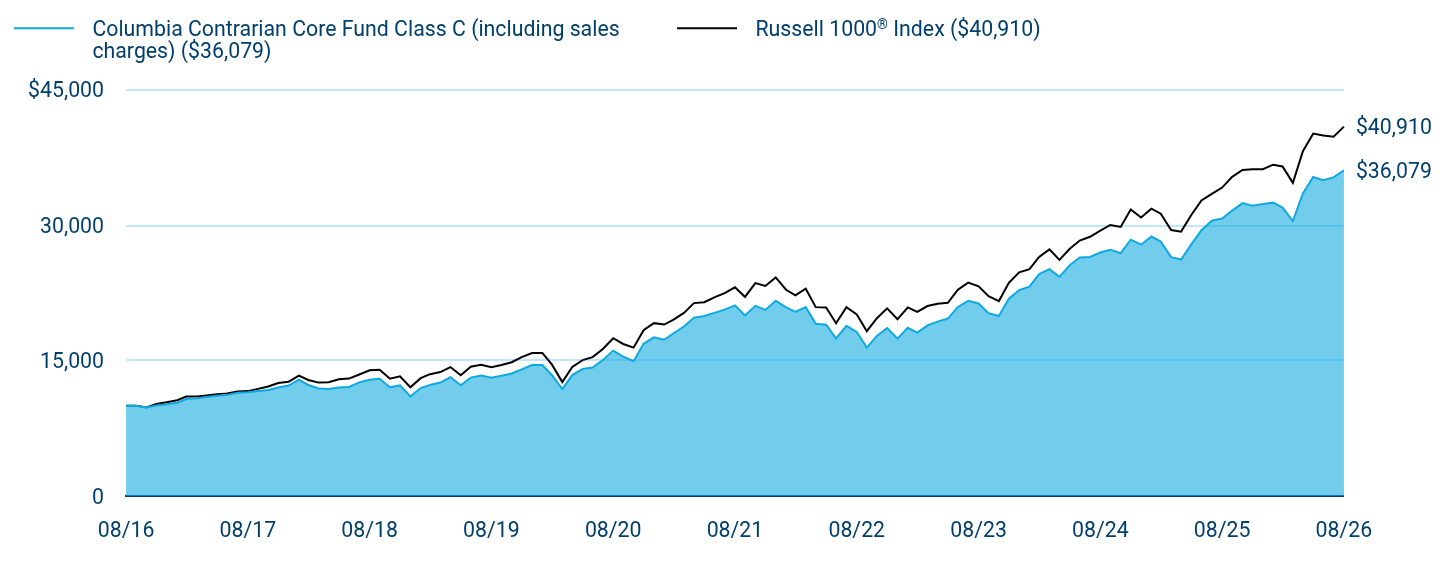
Table Summary
|
Columbia Contrarian Core Fund Class C (including sales charges) ($36,079) |
Russell 1000® Index ($40,910) |
08/16 |
$10,000 |
$10,000 |
09/16 |
$9,990 |
$10,008 |
10/16 |
$9,798 |
$9,813 |
11/16 |
$10,025 |
$10,200 |
12/16 |
$10,152 |
$10,391 |
01/17 |
$10,331 |
$10,600 |
02/17 |
$10,739 |
$11,010 |
03/17 |
$10,813 |
$11,017 |
04/17 |
$10,958 |
$11,134 |
05/17 |
$11,092 |
$11,276 |
06/17 |
$11,201 |
$11,355 |
07/17 |
$11,440 |
$11,580 |
08/17 |
$11,480 |
$11,616 |
09/17 |
$11,639 |
$11,863 |
10/17 |
$11,748 |
$12,135 |
11/17 |
$12,017 |
$12,505 |
12/17 |
$12,233 |
$12,645 |
01/18 |
$12,883 |
$13,339 |
02/18 |
$12,291 |
$12,849 |
03/18 |
$11,903 |
$12,558 |
04/18 |
$11,861 |
$12,600 |
05/18 |
$12,023 |
$12,922 |
06/18 |
$12,081 |
$13,005 |
07/18 |
$12,584 |
$13,454 |
08/18 |
$12,883 |
$13,918 |
09/18 |
$12,977 |
$13,971 |
10/18 |
$12,049 |
$12,982 |
11/18 |
$12,249 |
$13,246 |
12/18 |
$11,023 |
$12,040 |
01/19 |
$11,958 |
$13,049 |
02/19 |
$12,302 |
$13,491 |
03/19 |
$12,560 |
$13,726 |
04/19 |
$13,146 |
$14,280 |
05/19 |
$12,268 |
$13,370 |
06/19 |
$13,111 |
$14,308 |
07/19 |
$13,347 |
$14,531 |
08/19 |
$13,106 |
$14,265 |
09/19 |
$13,324 |
$14,512 |
10/19 |
$13,570 |
$14,819 |
11/19 |
$14,012 |
$15,379 |
12/19 |
$14,510 |
$15,824 |
01/20 |
$14,510 |
$15,841 |
02/20 |
$13,375 |
$14,546 |
03/20 |
$11,834 |
$12,624 |
04/20 |
$13,387 |
$14,292 |
05/20 |
$14,061 |
$15,046 |
06/20 |
$14,225 |
$15,379 |
07/20 |
$15,056 |
$16,279 |
08/20 |
$16,100 |
$17,474 |
09/20 |
$15,426 |
$16,836 |
10/20 |
$14,935 |
$16,430 |
11/20 |
$16,858 |
$18,364 |
12/20 |
$17,565 |
$19,141 |
01/21 |
$17,303 |
$18,983 |
02/21 |
$18,024 |
$19,533 |
03/21 |
$18,765 |
$20,272 |
04/21 |
$19,743 |
$21,364 |
05/21 |
$19,926 |
$21,465 |
06/21 |
$20,281 |
$22,003 |
07/21 |
$20,641 |
$22,460 |
08/21 |
$21,114 |
$23,110 |
09/21 |
$20,005 |
$22,048 |
10/21 |
$21,061 |
$23,578 |
11/21 |
$20,609 |
$23,262 |
12/21 |
$21,620 |
$24,204 |
01/22 |
$20,899 |
$22,840 |
02/22 |
$20,383 |
$22,213 |
03/22 |
$20,914 |
$22,962 |
04/22 |
$19,078 |
$20,916 |
05/22 |
$18,972 |
$20,884 |
06/22 |
$17,462 |
$19,135 |
07/22 |
$18,843 |
$20,917 |
08/22 |
$18,167 |
$20,114 |
09/22 |
$16,430 |
$18,253 |
10/22 |
$17,758 |
$19,717 |
11/22 |
$18,592 |
$20,783 |
12/22 |
$17,424 |
$19,575 |
01/23 |
$18,628 |
$20,887 |
02/23 |
$18,086 |
$20,390 |
03/23 |
$18,900 |
$21,035 |
04/23 |
$19,307 |
$21,296 |
05/23 |
$19,654 |
$21,395 |
06/23 |
$20,935 |
$22,840 |
07/23 |
$21,621 |
$23,625 |
08/23 |
$21,325 |
$23,212 |
09/23 |
$20,256 |
$22,121 |
10/23 |
$19,926 |
$21,587 |
11/23 |
$21,842 |
$23,603 |
12/23 |
$22,794 |
$24,768 |
01/24 |
$23,188 |
$25,113 |
02/24 |
$24,569 |
$26,469 |
03/24 |
$25,120 |
$27,318 |
04/24 |
$24,272 |
$26,155 |
05/24 |
$25,549 |
$27,387 |
06/24 |
$26,406 |
$28,294 |
07/24 |
$26,467 |
$28,705 |
08/24 |
$26,965 |
$29,386 |
09/24 |
$27,254 |
$30,014 |
10/24 |
$26,895 |
$29,804 |
11/24 |
$28,390 |
$31,723 |
12/24 |
$27,831 |
$30,839 |
01/25 |
$28,733 |
$31,820 |
02/25 |
$28,170 |
$31,264 |
03/25 |
$26,454 |
$29,454 |
04/25 |
$26,192 |
$29,279 |
05/25 |
$27,889 |
$31,148 |
06/25 |
$29,431 |
$32,726 |
07/25 |
$30,478 |
$33,453 |
08/25 |
$30,721 |
$34,157 |
09/25 |
$31,603 |
$35,341 |
10/25 |
$32,437 |
$36,104 |
11/25 |
$32,156 |
$36,192 |
12/25 |
$32,349 |
$36,194 |
01/26 |
$32,487 |
$36,692 |
02/26 |
$31,937 |
$36,496 |
03/26 |
$30,448 |
$34,681 |
04/26 |
$33,501 |
$38,185 |
05/26 |
$35,329 |
$40,133 |
06/26 |
$34,980 |
$39,928 |
07/26 |
$35,286 |
$39,788 |
08/26 |
$36,079 |
$40,910 |
|
| Average Annual Return [Table Text Block] |
Table Summary
Average Annual Total Returns (%) |
1 year |
5 years |
10 years |
Class C (excluding sales charges) |
17.44 |
11.31 |
13.69 |
Class C (including sales charges) |
16.44 |
11.31 |
13.69 |
Russell 1000® Index |
19.77 |
12.10 |
15.13 | |
| No Deduction of Taxes [Text Block] |
Performance does not reflect the deduction of taxes that a shareholder may pay on fund distributions or on the redemptions of fund shares.
|
| Updated Performance Information Location [Text Block] |
columbiathreadneedleus.com/investment-products/mutual-funds
|
| AssetsNet |
$ 18,595,649,063
|
| Holdings Count | Holding |
78
|
| Advisory Fees Paid, Amount |
$ 100,926,880
|
| InvestmentCompanyPortfolioTurnover |
56.00%
|
| Additional Fund Statistics [Text Block] |
Table Summary
Fund net assets |
$18,595,649,063 |
Total number of portfolio holdings |
78 |
Management services fees (represents 0.60% of Fund average net assets) |
$100,926,880 |
Portfolio turnover for the reporting period |
56% | |
| Holdings [Text Block] |
Table Summary
Information Technology |
38.4% |
Financials |
13.7% |
Communication Services |
11.0% |
Health Care |
10.6% |
Consumer Discretionary |
10.0% |
Industrials |
8.5% |
Energy |
3.0% |
Real Estate |
1.1% |
Materials |
1.0% |
Utilities |
1.0% |
Other |
0.9% |
Table Summary
Common Stocks |
99.2% |
Other |
0.8% | |
| Largest Holdings [Text Block] |
Table Summary
NVIDIA Corp. |
8.9% |
Microsoft Corp. |
6.7% |
Apple, Inc. |
6.1% |
Amazon.com, Inc. |
5.1% |
Broadcom, Inc. |
3.2% |
Alphabet, Inc., Class A |
3.0% |
Alphabet, Inc., Class C |
2.4% |
Micron Technology, Inc. |
2.4% |
Eli Lilly & Co. |
2.4% |
Meta Platforms, Inc., Class A |
2.3% | |
| Material Fund Change [Text Block] |
|
| C000032893 |
|
| Shareholder Report [Line Items] |
|
| Fund Name |
Columbia Contrarian Core Fund
|
| Class Name |
Institutional Class
|
| Trading Symbol |
SMGIX
|
| Annual or Semi-Annual Statement [Text Block] |
This annual shareholder report contains important information about Columbia Contrarian Core Fund (the Fund) for the period of September 1, 2025 to August 31, 2026.
|
| Additional Information [Text Block] |
You can find additional information about the Fund at columbiathreadneedleus.com/resources/literature. You can also request more information by contacting us at 1-800-345-6611.
|
| Additional Information Phone Number |
1-800-345-6611
|
| Additional Information Website |
columbiathreadneedleus.com/resources/literature
|
| Expenses [Text Block] |
What were the Fund costs for the reporting period? (Based on a hypothetical $10,000 investment)
Table Summary
Class |
Cost of a $10,000 investment |
Cost paid as a percentage of a $10,000 investment |
Institutional Class |
$80 |
0.73% | |
| Expenses Paid, Amount |
$ 80
|
| Expense Ratio, Percent |
0.73%
|
| Factors Affecting Performance [Text Block] |
Management's Discussion of Fund Performance The performance of Institutional Class shares for the period presented is shown in the Average Annual Total Returns table. Top Performance ContributorsStock selection | Selections in the consumer discretionary, communication services and real estate sectors boosted the Fund’s performance relative to the benchmark during the period. Allocations | Smaller allocations to the consumer staples sector and larger allocations to the information technology sector buoyed the Fund’s relative performance during the period. Individual holdings | Positions in Marvell Technology, a semiconductor company focused on data infrastructure and networking chips; Dell Technologies, a provider of personal computing and enterprise infrastructure solutions; and Applied Materials, a supplier of semiconductor manufacturing equipment and services, were among the top contributors to the Fund's relative performance. Top Performance DetractorsStock selection | Selections in the industrials, health care and energy sectors hurt the Fund’s performance relative to the benchmark during the period. Allocations | Larger weightings in the financials and communication services sectors detracted from the Fund’s relative performance. Individual holdings | Positions in Intuit, a financial software company; Micron Technology, a memory and storage semiconductor manufacturer; and Synopsys, a provider of chip design software and semiconductor IP, were among the top detractors from the Fund's relative performance. |
| Performance Past Does Not Indicate Future [Text] |
The Fund's past performance is not a good predictor of the Fund's future performance.
|
| Line Graph [Table Text Block] |
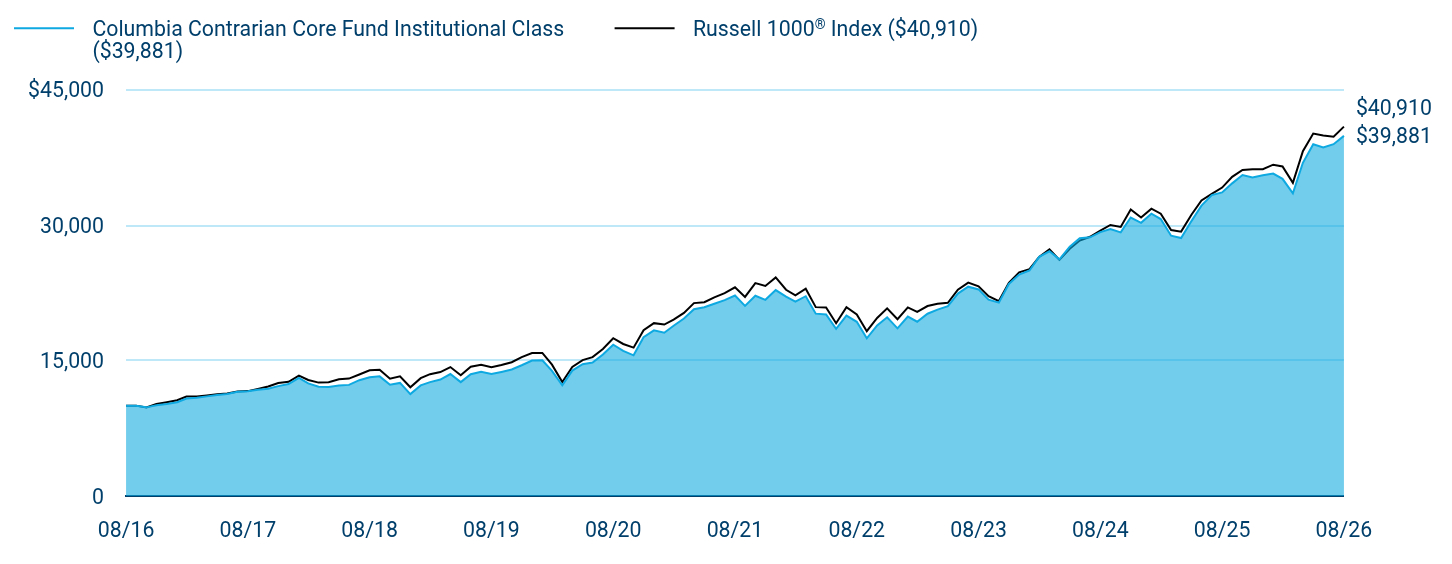
Table Summary
|
Columbia Contrarian Core Fund Institutional Class ($39,881) |
Russell 1000® Index ($40,910) |
08/16 |
$10,000 |
$10,000 |
09/16 |
$10,000 |
$10,008 |
10/16 |
$9,817 |
$9,813 |
11/16 |
$10,049 |
$10,200 |
12/16 |
$10,187 |
$10,391 |
01/17 |
$10,377 |
$10,600 |
02/17 |
$10,793 |
$11,010 |
03/17 |
$10,879 |
$11,017 |
04/17 |
$11,033 |
$11,134 |
05/17 |
$11,178 |
$11,276 |
06/17 |
$11,296 |
$11,355 |
07/17 |
$11,545 |
$11,580 |
08/17 |
$11,595 |
$11,616 |
09/17 |
$11,767 |
$11,863 |
10/17 |
$11,889 |
$12,135 |
11/17 |
$12,170 |
$12,505 |
12/17 |
$12,397 |
$12,645 |
01/18 |
$13,073 |
$13,339 |
02/18 |
$12,478 |
$12,849 |
03/18 |
$12,095 |
$12,558 |
04/18 |
$12,061 |
$12,600 |
05/18 |
$12,234 |
$12,922 |
06/18 |
$12,306 |
$13,005 |
07/18 |
$12,828 |
$13,454 |
08/18 |
$13,145 |
$13,918 |
09/18 |
$13,250 |
$13,971 |
10/18 |
$12,315 |
$12,982 |
11/18 |
$12,526 |
$13,246 |
12/18 |
$11,284 |
$12,040 |
01/19 |
$12,251 |
$13,049 |
02/19 |
$12,614 |
$13,491 |
03/19 |
$12,892 |
$13,726 |
04/19 |
$13,507 |
$14,280 |
05/19 |
$12,608 |
$13,370 |
06/19 |
$13,491 |
$14,308 |
07/19 |
$13,748 |
$14,531 |
08/19 |
$13,507 |
$14,265 |
09/19 |
$13,743 |
$14,512 |
10/19 |
$14,006 |
$14,819 |
11/19 |
$14,479 |
$15,379 |
12/19 |
$15,004 |
$15,824 |
01/20 |
$15,021 |
$15,841 |
02/20 |
$13,850 |
$14,546 |
03/20 |
$12,267 |
$12,624 |
04/20 |
$13,889 |
$14,292 |
05/20 |
$14,597 |
$15,046 |
06/20 |
$14,781 |
$15,379 |
07/20 |
$15,662 |
$16,279 |
08/20 |
$16,760 |
$17,474 |
09/20 |
$16,068 |
$16,836 |
10/20 |
$15,578 |
$16,430 |
11/20 |
$17,590 |
$18,364 |
12/20 |
$18,347 |
$19,141 |
01/21 |
$18,083 |
$18,983 |
02/21 |
$18,858 |
$19,533 |
03/21 |
$19,652 |
$20,272 |
04/21 |
$20,692 |
$21,364 |
05/21 |
$20,897 |
$21,465 |
06/21 |
$21,288 |
$22,003 |
07/21 |
$21,685 |
$22,460 |
08/21 |
$22,202 |
$23,110 |
09/21 |
$21,053 |
$22,048 |
10/21 |
$22,178 |
$23,578 |
11/21 |
$21,727 |
$23,262 |
12/21 |
$22,803 |
$24,204 |
01/22 |
$22,070 |
$22,840 |
02/22 |
$21,535 |
$22,213 |
03/22 |
$22,125 |
$22,962 |
04/22 |
$20,193 |
$20,916 |
05/22 |
$20,097 |
$20,884 |
06/22 |
$18,514 |
$19,135 |
07/22 |
$19,987 |
$20,917 |
08/22 |
$19,295 |
$20,114 |
09/22 |
$17,459 |
$18,253 |
10/22 |
$18,891 |
$19,717 |
11/22 |
$19,795 |
$20,783 |
12/22 |
$18,568 |
$19,575 |
01/23 |
$19,869 |
$20,887 |
02/23 |
$19,302 |
$20,390 |
03/23 |
$20,187 |
$21,035 |
04/23 |
$20,641 |
$21,296 |
05/23 |
$21,026 |
$21,395 |
06/23 |
$22,418 |
$22,840 |
07/23 |
$23,182 |
$23,625 |
08/23 |
$22,879 |
$23,212 |
09/23 |
$21,745 |
$22,121 |
10/23 |
$21,412 |
$21,587 |
11/23 |
$23,485 |
$23,603 |
12/23 |
$24,531 |
$24,768 |
01/24 |
$24,976 |
$25,113 |
02/24 |
$26,490 |
$26,469 |
03/24 |
$27,098 |
$27,318 |
04/24 |
$26,217 |
$26,155 |
05/24 |
$27,614 |
$27,387 |
06/24 |
$28,558 |
$28,294 |
07/24 |
$28,652 |
$28,705 |
08/24 |
$29,221 |
$29,386 |
09/24 |
$29,557 |
$30,014 |
10/24 |
$29,190 |
$29,804 |
11/24 |
$30,837 |
$31,723 |
12/24 |
$30,258 |
$30,839 |
01/25 |
$31,265 |
$31,820 |
02/25 |
$30,676 |
$31,264 |
03/25 |
$28,823 |
$29,454 |
04/25 |
$28,567 |
$29,279 |
05/25 |
$30,446 |
$31,148 |
06/25 |
$32,154 |
$32,726 |
07/25 |
$33,324 |
$33,453 |
08/25 |
$33,622 |
$34,157 |
09/25 |
$34,622 |
$35,341 |
10/25 |
$35,553 |
$36,104 |
11/25 |
$35,271 |
$36,192 |
12/25 |
$35,514 |
$36,194 |
01/26 |
$35,707 |
$36,692 |
02/26 |
$35,129 |
$36,496 |
03/26 |
$33,514 |
$34,681 |
04/26 |
$36,900 |
$38,185 |
05/26 |
$38,955 |
$40,133 |
06/26 |
$38,597 |
$39,928 |
07/26 |
$38,964 |
$39,788 |
08/26 |
$39,881 |
$40,910 |
|
| Average Annual Return [Table Text Block] |
Table Summary
Average Annual Total Returns (%) |
1 year |
5 years |
10 years |
Institutional Class |
18.62 |
12.43 |
14.84 |
Russell 1000® Index |
19.77 |
12.10 |
15.13 | |
| No Deduction of Taxes [Text Block] |
Performance does not reflect the deduction of taxes that a shareholder may pay on fund distributions or on the redemptions of fund shares.
|
| Updated Performance Information Location [Text Block] |
columbiathreadneedleus.com/investment-products/mutual-funds
|
| AssetsNet |
$ 18,595,649,063
|
| Holdings Count | Holding |
78
|
| Advisory Fees Paid, Amount |
$ 100,926,880
|
| InvestmentCompanyPortfolioTurnover |
56.00%
|
| Additional Fund Statistics [Text Block] |
Table Summary
Fund net assets |
$18,595,649,063 |
Total number of portfolio holdings |
78 |
Management services fees (represents 0.60% of Fund average net assets) |
$100,926,880 |
Portfolio turnover for the reporting period |
56% | |
| Holdings [Text Block] |
Table Summary
Information Technology |
38.4% |
Financials |
13.7% |
Communication Services |
11.0% |
Health Care |
10.6% |
Consumer Discretionary |
10.0% |
Industrials |
8.5% |
Energy |
3.0% |
Real Estate |
1.1% |
Materials |
1.0% |
Utilities |
1.0% |
Other |
0.9% |
Table Summary
Common Stocks |
99.2% |
Other |
0.8% | |
| Largest Holdings [Text Block] |
Table Summary
NVIDIA Corp. |
8.9% |
Microsoft Corp. |
6.7% |
Apple, Inc. |
6.1% |
Amazon.com, Inc. |
5.1% |
Broadcom, Inc. |
3.2% |
Alphabet, Inc., Class A |
3.0% |
Alphabet, Inc., Class C |
2.4% |
Micron Technology, Inc. |
2.4% |
Eli Lilly & Co. |
2.4% |
Meta Platforms, Inc., Class A |
2.3% | |
| Material Fund Change [Text Block] |
|
| C000122667 |
|
| Shareholder Report [Line Items] |
|
| Fund Name |
Columbia Contrarian Core Fund
|
| Class Name |
Institutional 2 Class
|
| Trading Symbol |
COFRX
|
| Annual or Semi-Annual Statement [Text Block] |
This annual shareholder report contains important information about Columbia Contrarian Core Fund (the Fund) for the period of September 1, 2025 to August 31, 2026.
|
| Additional Information [Text Block] |
You can find additional information about the Fund at columbiathreadneedleus.com/resources/literature. You can also request more information by contacting us at 1-800-345-6611.
|
| Additional Information Phone Number |
1-800-345-6611
|
| Additional Information Website |
columbiathreadneedleus.com/resources/literature
|
| Expenses [Text Block] |
What were the Fund costs for the reporting period? (Based on a hypothetical $10,000 investment)
Table Summary
Class |
Cost of a $10,000 investment |
Cost paid as a percentage of a $10,000 investment |
Institutional 2 Class |
$72 |
0.66% | |
| Expenses Paid, Amount |
$ 72
|
| Expense Ratio, Percent |
0.66%
|
| Factors Affecting Performance [Text Block] |
Management's Discussion of Fund Performance The performance of Institutional 2 Class shares for the period presented is shown in the Average Annual Total Returns table. Top Performance ContributorsStock selection | Selections in the consumer discretionary, communication services and real estate sectors boosted the Fund’s performance relative to the benchmark during the period. Allocations | Smaller allocations to the consumer staples sector and larger allocations to the information technology sector buoyed the Fund’s relative performance during the period. Individual holdings | Positions in Marvell Technology, a semiconductor company focused on data infrastructure and networking chips; Dell Technologies, a provider of personal computing and enterprise infrastructure solutions; and Applied Materials, a supplier of semiconductor manufacturing equipment and services, were among the top contributors to the Fund's relative performance. Top Performance DetractorsStock selection | Selections in the industrials, health care and energy sectors hurt the Fund’s performance relative to the benchmark during the period. Allocations | Larger weightings in the financials and communication services sectors detracted from the Fund’s relative performance. Individual holdings | Positions in Intuit, a financial software company; Micron Technology, a memory and storage semiconductor manufacturer; and Synopsys, a provider of chip design software and semiconductor IP, were among the top detractors from the Fund's relative performance. |
| Performance Past Does Not Indicate Future [Text] |
The Fund's past performance is not a good predictor of the Fund's future performance.
|
| Line Graph [Table Text Block] |
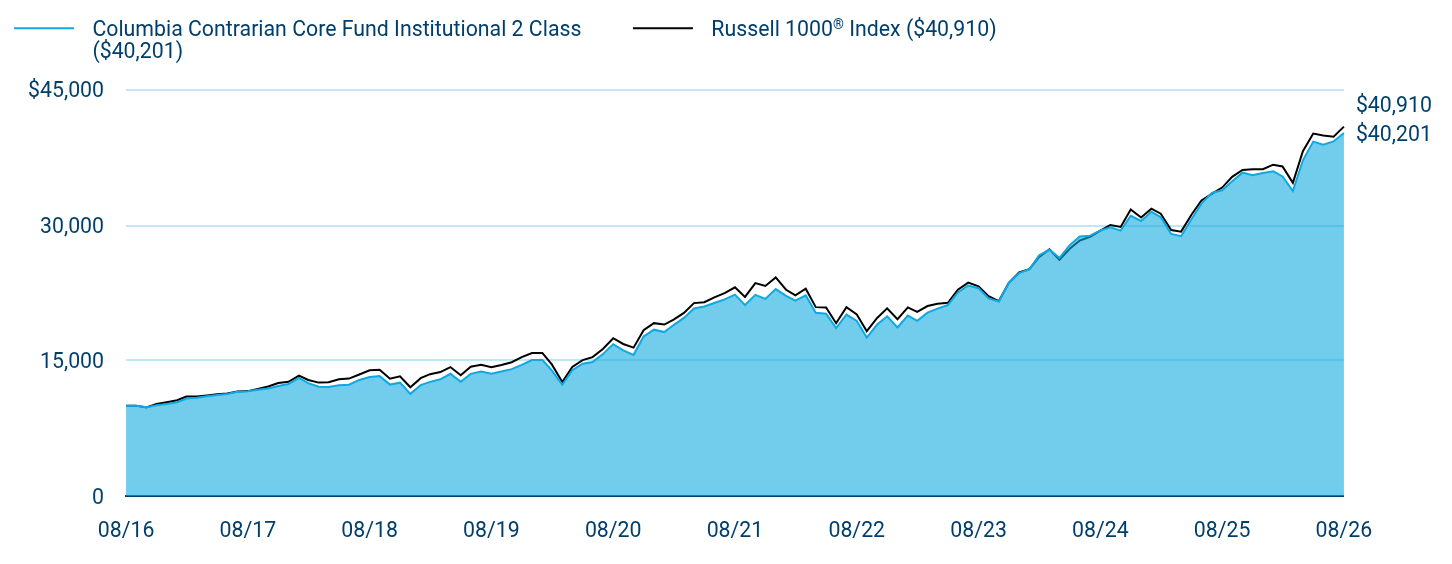
Table Summary
|
Columbia Contrarian Core Fund Institutional 2 Class ($40,201) |
Russell 1000® Index ($40,910) |
08/16 |
$10,000 |
$10,000 |
09/16 |
$10,000 |
$10,008 |
10/16 |
$9,820 |
$9,813 |
11/16 |
$10,053 |
$10,200 |
12/16 |
$10,190 |
$10,391 |
01/17 |
$10,382 |
$10,600 |
02/17 |
$10,797 |
$11,010 |
03/17 |
$10,886 |
$11,017 |
04/17 |
$11,038 |
$11,134 |
05/17 |
$11,185 |
$11,276 |
06/17 |
$11,306 |
$11,355 |
07/17 |
$11,556 |
$11,580 |
08/17 |
$11,605 |
$11,616 |
09/17 |
$11,774 |
$11,863 |
10/17 |
$11,904 |
$12,135 |
11/17 |
$12,185 |
$12,505 |
12/17 |
$12,411 |
$12,645 |
01/18 |
$13,087 |
$13,339 |
02/18 |
$12,496 |
$12,849 |
03/18 |
$12,109 |
$12,558 |
04/18 |
$12,081 |
$12,600 |
05/18 |
$12,255 |
$12,922 |
06/18 |
$12,326 |
$13,005 |
07/18 |
$12,851 |
$13,454 |
08/18 |
$13,172 |
$13,918 |
09/18 |
$13,276 |
$13,971 |
10/18 |
$12,340 |
$12,982 |
11/18 |
$12,553 |
$13,246 |
12/18 |
$11,312 |
$12,040 |
01/19 |
$12,279 |
$13,049 |
02/19 |
$12,642 |
$13,491 |
03/19 |
$12,921 |
$13,726 |
04/19 |
$13,537 |
$14,280 |
05/19 |
$12,642 |
$13,370 |
06/19 |
$13,527 |
$14,308 |
07/19 |
$13,785 |
$14,531 |
08/19 |
$13,542 |
$14,265 |
09/19 |
$13,780 |
$14,512 |
10/19 |
$14,049 |
$14,819 |
11/19 |
$14,520 |
$15,379 |
12/19 |
$15,050 |
$15,824 |
01/20 |
$15,067 |
$15,841 |
02/20 |
$13,892 |
$14,546 |
03/20 |
$12,311 |
$12,624 |
04/20 |
$13,936 |
$14,292 |
05/20 |
$14,649 |
$15,046 |
06/20 |
$14,836 |
$15,379 |
07/20 |
$15,714 |
$16,279 |
08/20 |
$16,818 |
$17,474 |
09/20 |
$16,131 |
$16,836 |
10/20 |
$15,632 |
$16,430 |
11/20 |
$17,657 |
$18,364 |
12/20 |
$18,421 |
$19,141 |
01/21 |
$18,155 |
$18,983 |
02/21 |
$18,930 |
$19,533 |
03/21 |
$19,729 |
$20,272 |
04/21 |
$20,776 |
$21,364 |
05/21 |
$20,984 |
$21,465 |
06/21 |
$21,374 |
$22,003 |
07/21 |
$21,777 |
$22,460 |
08/21 |
$22,297 |
$23,110 |
09/21 |
$21,143 |
$22,048 |
10/21 |
$22,274 |
$23,578 |
11/21 |
$21,824 |
$23,262 |
12/21 |
$22,910 |
$24,204 |
01/22 |
$22,170 |
$22,840 |
02/22 |
$21,638 |
$22,213 |
03/22 |
$22,224 |
$22,962 |
04/22 |
$20,293 |
$20,916 |
05/22 |
$20,192 |
$20,884 |
06/22 |
$18,604 |
$19,135 |
07/22 |
$20,091 |
$20,917 |
08/22 |
$19,391 |
$20,114 |
09/22 |
$17,547 |
$18,253 |
10/22 |
$18,987 |
$19,717 |
11/22 |
$19,896 |
$20,783 |
12/22 |
$18,671 |
$19,575 |
01/23 |
$19,976 |
$20,887 |
02/23 |
$19,405 |
$20,390 |
03/23 |
$20,302 |
$21,035 |
04/23 |
$20,755 |
$21,296 |
05/23 |
$21,148 |
$21,395 |
06/23 |
$22,542 |
$22,840 |
07/23 |
$23,313 |
$23,625 |
08/23 |
$23,009 |
$23,212 |
09/23 |
$21,874 |
$22,121 |
10/23 |
$21,541 |
$21,587 |
11/23 |
$23,624 |
$23,603 |
12/23 |
$24,680 |
$24,768 |
01/24 |
$25,131 |
$25,113 |
02/24 |
$26,654 |
$26,469 |
03/24 |
$27,266 |
$27,318 |
04/24 |
$26,378 |
$26,155 |
05/24 |
$27,786 |
$27,387 |
06/24 |
$28,735 |
$28,294 |
07/24 |
$28,834 |
$28,705 |
08/24 |
$29,408 |
$29,386 |
09/24 |
$29,752 |
$30,014 |
10/24 |
$29,385 |
$29,804 |
11/24 |
$31,037 |
$31,723 |
12/24 |
$30,458 |
$30,839 |
01/25 |
$31,469 |
$31,820 |
02/25 |
$30,884 |
$31,264 |
03/25 |
$29,020 |
$29,454 |
04/25 |
$28,770 |
$29,279 |
05/25 |
$30,650 |
$31,148 |
06/25 |
$32,379 |
$32,726 |
07/25 |
$33,558 |
$33,453 |
08/25 |
$33,858 |
$34,157 |
09/25 |
$34,869 |
$35,341 |
10/25 |
$35,814 |
$36,104 |
11/25 |
$35,530 |
$36,192 |
12/25 |
$35,782 |
$36,194 |
01/26 |
$35,970 |
$36,692 |
02/26 |
$35,387 |
$36,496 |
03/26 |
$33,774 |
$34,681 |
04/26 |
$37,180 |
$38,185 |
05/26 |
$39,251 |
$40,133 |
06/26 |
$38,901 |
$39,928 |
07/26 |
$39,269 |
$39,788 |
08/26 |
$40,201 |
$40,910 |
|
| Average Annual Return [Table Text Block] |
Table Summary
Average Annual Total Returns (%) |
1 year |
5 years |
10 years |
Institutional 2 Class |
18.73 |
12.51 |
14.93 |
Russell 1000® Index |
19.77 |
12.10 |
15.13 | |
| No Deduction of Taxes [Text Block] |
Performance does not reflect the deduction of taxes that a shareholder may pay on fund distributions or on the redemptions of fund shares.
|
| Updated Performance Information Location [Text Block] |
columbiathreadneedleus.com/investment-products/mutual-funds
|
| AssetsNet |
$ 18,595,649,063
|
| Holdings Count | Holding |
78
|
| Advisory Fees Paid, Amount |
$ 100,926,880
|
| InvestmentCompanyPortfolioTurnover |
56.00%
|
| Additional Fund Statistics [Text Block] |
Table Summary
Fund net assets |
$18,595,649,063 |
Total number of portfolio holdings |
78 |
Management services fees (represents 0.60% of Fund average net assets) |
$100,926,880 |
Portfolio turnover for the reporting period |
56% | |
| Holdings [Text Block] |
Table Summary
Information Technology |
38.4% |
Financials |
13.7% |
Communication Services |
11.0% |
Health Care |
10.6% |
Consumer Discretionary |
10.0% |
Industrials |
8.5% |
Energy |
3.0% |
Real Estate |
1.1% |
Materials |
1.0% |
Utilities |
1.0% |
Other |
0.9% |
Table Summary
Common Stocks |
99.2% |
Other |
0.8% | |
| Largest Holdings [Text Block] |
Table Summary
NVIDIA Corp. |
8.9% |
Microsoft Corp. |
6.7% |
Apple, Inc. |
6.1% |
Amazon.com, Inc. |
5.1% |
Broadcom, Inc. |
3.2% |
Alphabet, Inc., Class A |
3.0% |
Alphabet, Inc., Class C |
2.4% |
Micron Technology, Inc. |
2.4% |
Eli Lilly & Co. |
2.4% |
Meta Platforms, Inc., Class A |
2.3% | |
| Material Fund Change [Text Block] |
|
| C000122668 |
|
| Shareholder Report [Line Items] |
|
| Fund Name |
Columbia Contrarian Core Fund
|
| Class Name |
Institutional 3 Class
|
| Trading Symbol |
COFYX
|
| Annual or Semi-Annual Statement [Text Block] |
This annual shareholder report contains important information about Columbia Contrarian Core Fund (the Fund) for the period of September 1, 2025 to August 31, 2026.
|
| Additional Information [Text Block] |
You can find additional information about the Fund at columbiathreadneedleus.com/resources/literature. You can also request more information by contacting us at 1-800-345-6611.
|
| Additional Information Phone Number |
1-800-345-6611
|
| Additional Information Website |
columbiathreadneedleus.com/resources/literature
|
| Expenses [Text Block] |
What were the Fund costs for the reporting period? (Based on a hypothetical $10,000 investment)
Table Summary
Class |
Cost of a $10,000 investment |
Cost paid as a percentage of a $10,000 investment |
Institutional 3 Class |
$67 |
0.61% | |
| Expenses Paid, Amount |
$ 67
|
| Expense Ratio, Percent |
0.61%
|
| Factors Affecting Performance [Text Block] |
Management's Discussion of Fund Performance The performance of Institutional 3 Class shares for the period presented is shown in the Average Annual Total Returns table. Top Performance ContributorsStock selection | Selections in the consumer discretionary, communication services and real estate sectors boosted the Fund’s performance relative to the benchmark during the period. Allocations | Smaller allocations to the consumer staples sector and larger allocations to the information technology sector buoyed the Fund’s relative performance during the period. Individual holdings | Positions in Marvell Technology, a semiconductor company focused on data infrastructure and networking chips; Dell Technologies, a provider of personal computing and enterprise infrastructure solutions; and Applied Materials, a supplier of semiconductor manufacturing equipment and services, were among the top contributors to the Fund's relative performance. Top Performance DetractorsStock selection | Selections in the industrials, health care and energy sectors hurt the Fund’s performance relative to the benchmark during the period. Allocations | Larger weightings in the financials and communication services sectors detracted from the Fund’s relative performance. Individual holdings | Positions in Intuit, a financial software company; Micron Technology, a memory and storage semiconductor manufacturer; and Synopsys, a provider of chip design software and semiconductor IP, were among the top detractors from the Fund's relative performance. |
| Performance Past Does Not Indicate Future [Text] |
The Fund's past performance is not a good predictor of the Fund's future performance.
|
| Line Graph [Table Text Block] |
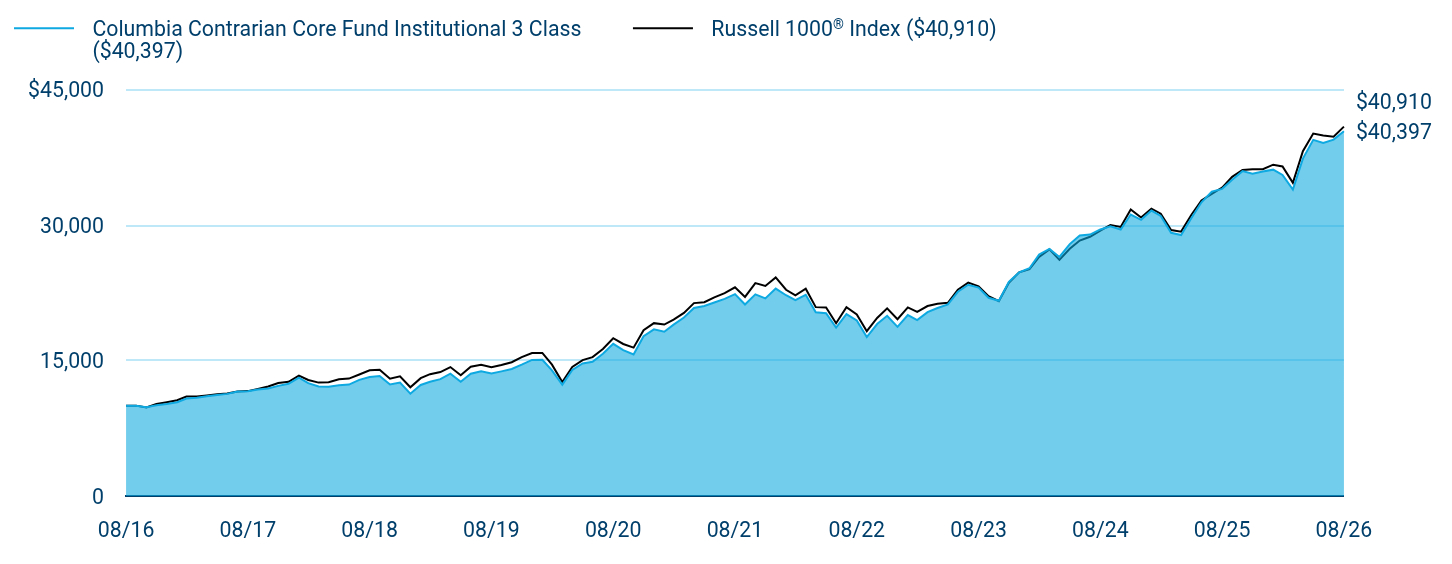
Table Summary
|
Columbia Contrarian Core Fund Institutional 3 Class ($40,397) |
Russell 1000® Index ($40,910) |
08/16 |
$10,000 |
$10,000 |
09/16 |
$10,000 |
$10,008 |
10/16 |
$9,820 |
$9,813 |
11/16 |
$10,053 |
$10,200 |
12/16 |
$10,191 |
$10,391 |
01/17 |
$10,382 |
$10,600 |
02/17 |
$10,802 |
$11,010 |
03/17 |
$10,887 |
$11,017 |
04/17 |
$11,043 |
$11,134 |
05/17 |
$11,190 |
$11,276 |
06/17 |
$11,310 |
$11,355 |
07/17 |
$11,560 |
$11,580 |
08/17 |
$11,614 |
$11,616 |
09/17 |
$11,783 |
$11,863 |
10/17 |
$11,908 |
$12,135 |
11/17 |
$12,194 |
$12,505 |
12/17 |
$12,421 |
$12,645 |
01/18 |
$13,097 |
$13,339 |
02/18 |
$12,506 |
$12,849 |
03/18 |
$12,119 |
$12,558 |
04/18 |
$12,090 |
$12,600 |
05/18 |
$12,265 |
$12,922 |
06/18 |
$12,341 |
$13,005 |
07/18 |
$12,865 |
$13,454 |
08/18 |
$13,182 |
$13,918 |
09/18 |
$13,291 |
$13,971 |
10/18 |
$12,355 |
$12,982 |
11/18 |
$12,568 |
$13,246 |
12/18 |
$11,327 |
$12,040 |
01/19 |
$12,295 |
$13,049 |
02/19 |
$12,658 |
$13,491 |
03/19 |
$12,938 |
$13,726 |
04/19 |
$13,554 |
$14,280 |
05/19 |
$12,658 |
$13,370 |
06/19 |
$13,544 |
$14,308 |
07/19 |
$13,803 |
$14,531 |
08/19 |
$13,564 |
$14,265 |
09/19 |
$13,803 |
$14,512 |
10/19 |
$14,072 |
$14,819 |
11/19 |
$14,543 |
$15,379 |
12/19 |
$15,074 |
$15,824 |
01/20 |
$15,091 |
$15,841 |
02/20 |
$13,920 |
$14,546 |
03/20 |
$12,332 |
$12,624 |
04/20 |
$13,964 |
$14,292 |
05/20 |
$14,673 |
$15,046 |
06/20 |
$14,866 |
$15,379 |
07/20 |
$15,750 |
$16,279 |
08/20 |
$16,855 |
$17,474 |
09/20 |
$16,163 |
$16,836 |
10/20 |
$15,668 |
$16,430 |
11/20 |
$17,696 |
$18,364 |
12/20 |
$18,457 |
$19,141 |
01/21 |
$18,196 |
$18,983 |
02/21 |
$18,978 |
$19,533 |
03/21 |
$19,773 |
$20,272 |
04/21 |
$20,822 |
$21,364 |
05/21 |
$21,035 |
$21,465 |
06/21 |
$21,426 |
$22,003 |
07/21 |
$21,835 |
$22,460 |
08/21 |
$22,357 |
$23,110 |
09/21 |
$21,201 |
$22,048 |
10/21 |
$22,333 |
$23,578 |
11/21 |
$21,883 |
$23,262 |
12/21 |
$22,969 |
$24,204 |
01/22 |
$22,234 |
$22,840 |
02/22 |
$21,695 |
$22,213 |
03/22 |
$22,288 |
$22,962 |
04/22 |
$20,347 |
$20,916 |
05/22 |
$20,252 |
$20,884 |
06/22 |
$18,661 |
$19,135 |
07/22 |
$20,151 |
$20,917 |
08/22 |
$19,450 |
$20,114 |
09/22 |
$17,603 |
$18,253 |
10/22 |
$19,045 |
$19,717 |
11/22 |
$19,962 |
$20,783 |
12/22 |
$18,731 |
$19,575 |
01/23 |
$20,040 |
$20,887 |
02/23 |
$19,475 |
$20,390 |
03/23 |
$20,367 |
$21,035 |
04/23 |
$20,820 |
$21,296 |
05/23 |
$21,222 |
$21,395 |
06/23 |
$22,619 |
$22,840 |
07/23 |
$23,392 |
$23,625 |
08/23 |
$23,087 |
$23,212 |
09/23 |
$21,950 |
$22,121 |
10/23 |
$21,616 |
$21,587 |
11/23 |
$23,712 |
$23,603 |
12/23 |
$24,766 |
$24,768 |
01/24 |
$25,218 |
$25,113 |
02/24 |
$26,753 |
$26,469 |
03/24 |
$27,366 |
$27,318 |
04/24 |
$26,476 |
$26,155 |
05/24 |
$27,896 |
$27,387 |
06/24 |
$28,855 |
$28,294 |
07/24 |
$28,947 |
$28,705 |
08/24 |
$29,522 |
$29,386 |
09/24 |
$29,875 |
$30,014 |
10/24 |
$29,507 |
$29,804 |
11/24 |
$31,172 |
$31,723 |
12/24 |
$30,588 |
$30,839 |
01/25 |
$31,610 |
$31,820 |
02/25 |
$31,015 |
$31,264 |
03/25 |
$29,146 |
$29,454 |
04/25 |
$28,894 |
$29,279 |
05/25 |
$30,789 |
$31,148 |
06/25 |
$32,524 |
$32,726 |
07/25 |
$33,714 |
$33,453 |
08/25 |
$34,016 |
$34,157 |
09/25 |
$35,030 |
$35,341 |
10/25 |
$35,977 |
$36,104 |
11/25 |
$35,692 |
$36,192 |
12/25 |
$35,944 |
$36,194 |
01/26 |
$36,142 |
$36,692 |
02/26 |
$35,558 |
$36,496 |
03/26 |
$33,929 |
$34,681 |
04/26 |
$37,366 |
$38,185 |
05/26 |
$39,443 |
$40,133 |
06/26 |
$39,093 |
$39,928 |
07/26 |
$39,470 |
$39,788 |
08/26 |
$40,397 |
$40,910 |
|
| Average Annual Return [Table Text Block] |
Table Summary
Average Annual Total Returns (%) |
1 year |
5 years |
10 years |
Institutional 3 Class |
18.76 |
12.56 |
14.98 |
Russell 1000® Index |
19.77 |
12.10 |
15.13 | |
| No Deduction of Taxes [Text Block] |
Performance does not reflect the deduction of taxes that a shareholder may pay on fund distributions or on the redemptions of fund shares.
|
| Updated Performance Information Location [Text Block] |
columbiathreadneedleus.com/investment-products/mutual-funds
|
| AssetsNet |
$ 18,595,649,063
|
| Holdings Count | Holding |
78
|
| Advisory Fees Paid, Amount |
$ 100,926,880
|
| InvestmentCompanyPortfolioTurnover |
56.00%
|
| Additional Fund Statistics [Text Block] |
Table Summary
Fund net assets |
$18,595,649,063 |
Total number of portfolio holdings |
78 |
Management services fees (represents 0.60% of Fund average net assets) |
$100,926,880 |
Portfolio turnover for the reporting period |
56% | |
| Holdings [Text Block] |
Table Summary
Information Technology |
38.4% |
Financials |
13.7% |
Communication Services |
11.0% |
Health Care |
10.6% |
Consumer Discretionary |
10.0% |
Industrials |
8.5% |
Energy |
3.0% |
Real Estate |
1.1% |
Materials |
1.0% |
Utilities |
1.0% |
Other |
0.9% |
Table Summary
Common Stocks |
99.2% |
Other |
0.8% | |
| Largest Holdings [Text Block] |
Table Summary
NVIDIA Corp. |
8.9% |
Microsoft Corp. |
6.7% |
Apple, Inc. |
6.1% |
Amazon.com, Inc. |
5.1% |
Broadcom, Inc. |
3.2% |
Alphabet, Inc., Class A |
3.0% |
Alphabet, Inc., Class C |
2.4% |
Micron Technology, Inc. |
2.4% |
Eli Lilly & Co. |
2.4% |
Meta Platforms, Inc., Class A |
2.3% | |
| Material Fund Change [Text Block] |
|
| C000094681 |
|
| Shareholder Report [Line Items] |
|
| Fund Name |
Columbia Contrarian Core Fund
|
| Class Name |
Class R
|
| Trading Symbol |
CCCRX
|
| Annual or Semi-Annual Statement [Text Block] |
This annual shareholder report contains important information about Columbia Contrarian Core Fund (the Fund) for the period of September 1, 2025 to August 31, 2026.
|
| Additional Information [Text Block] |
You can find additional information about the Fund at columbiathreadneedleus.com/resources/literature. You can also request more information by contacting us at 1-800-345-6611.
|
| Additional Information Phone Number |
1-800-345-6611
|
| Additional Information Website |
columbiathreadneedleus.com/resources/literature
|
| Expenses [Text Block] |
What were the Fund costs for the reporting period? (Based on a hypothetical $10,000 investment)
Table Summary
Class |
Cost of a $10,000 investment |
Cost paid as a percentage of a $10,000 investment |
Class R |
$134 |
1.23% | |
| Expenses Paid, Amount |
$ 134
|
| Expense Ratio, Percent |
1.23%
|
| Factors Affecting Performance [Text Block] |
Management's Discussion of Fund Performance The performance of Class R shares for the period presented is shown in the Average Annual Total Returns table. Top Performance ContributorsStock selection | Selections in the consumer discretionary, communication services and real estate sectors boosted the Fund’s performance relative to the benchmark during the period. Allocations | Smaller allocations to the consumer staples sector and larger allocations to the information technology sector buoyed the Fund’s relative performance during the period. Individual holdings | Positions in Marvell Technology, a semiconductor company focused on data infrastructure and networking chips; Dell Technologies, a provider of personal computing and enterprise infrastructure solutions; and Applied Materials, a supplier of semiconductor manufacturing equipment and services, were among the top contributors to the Fund's relative performance. Top Performance DetractorsStock selection | Selections in the industrials, health care and energy sectors hurt the Fund’s performance relative to the benchmark during the period. Allocations | Larger weightings in the financials and communication services sectors detracted from the Fund’s relative performance. Individual holdings | Positions in Intuit, a financial software company; Micron Technology, a memory and storage semiconductor manufacturer; and Synopsys, a provider of chip design software and semiconductor IP, were among the top detractors from the Fund's relative performance. |
| Performance Past Does Not Indicate Future [Text] |
The Fund's past performance is not a good predictor of the Fund's future performance.
|
| Line Graph [Table Text Block] |
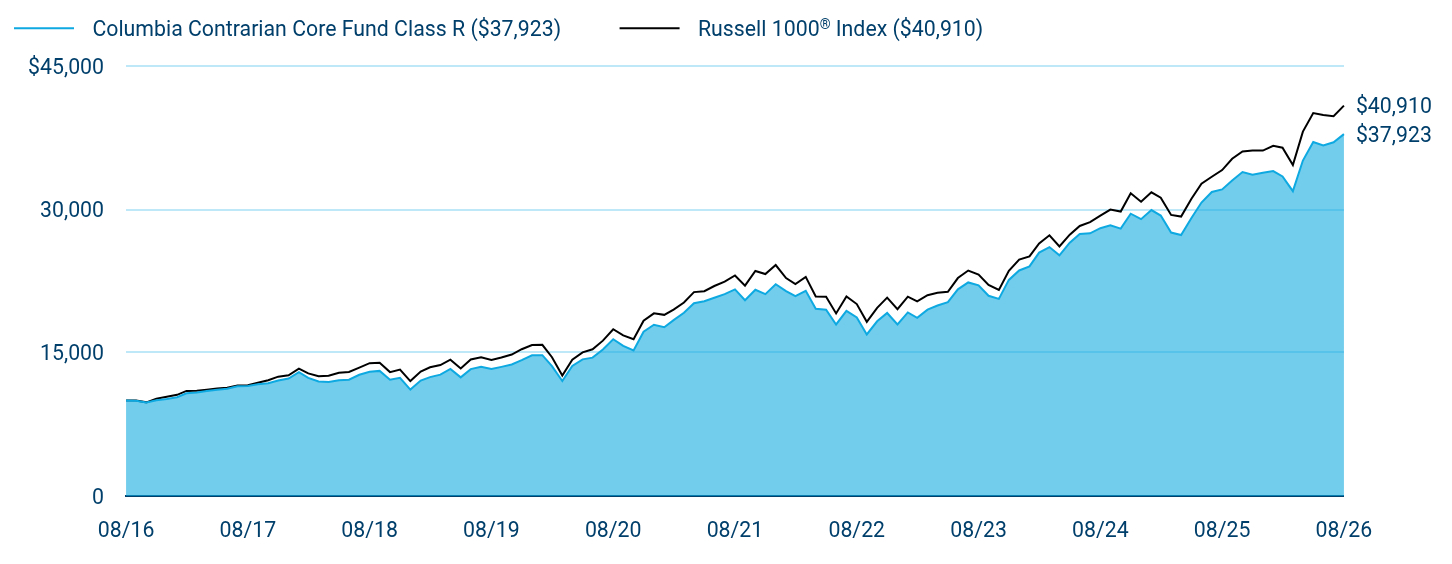
Table Summary
|
Columbia Contrarian Core Fund Class R ($37,923) |
Russell 1000® Index ($40,910) |
08/16 |
$10,000 |
$10,000 |
09/16 |
$9,991 |
$10,008 |
10/16 |
$9,807 |
$9,813 |
11/16 |
$10,031 |
$10,200 |
12/16 |
$10,163 |
$10,391 |
01/17 |
$10,350 |
$10,600 |
02/17 |
$10,763 |
$11,010 |
03/17 |
$10,844 |
$11,017 |
04/17 |
$10,994 |
$11,134 |
05/17 |
$11,130 |
$11,276 |
06/17 |
$11,248 |
$11,355 |
07/17 |
$11,489 |
$11,580 |
08/17 |
$11,534 |
$11,616 |
09/17 |
$11,698 |
$11,863 |
10/17 |
$11,816 |
$12,135 |
11/17 |
$12,093 |
$12,505 |
12/17 |
$12,310 |
$12,645 |
01/18 |
$12,975 |
$13,339 |
02/18 |
$12,382 |
$12,849 |
03/18 |
$11,994 |
$12,558 |
04/18 |
$11,956 |
$12,600 |
05/18 |
$12,123 |
$12,922 |
06/18 |
$12,190 |
$13,005 |
07/18 |
$12,702 |
$13,454 |
08/18 |
$13,009 |
$13,918 |
09/18 |
$13,109 |
$13,971 |
10/18 |
$12,181 |
$12,982 |
11/18 |
$12,382 |
$13,246 |
12/18 |
$11,150 |
$12,040 |
01/19 |
$12,100 |
$13,049 |
02/19 |
$12,455 |
$13,491 |
03/19 |
$12,721 |
$13,726 |
04/19 |
$13,321 |
$14,280 |
05/19 |
$12,434 |
$13,370 |
06/19 |
$13,295 |
$14,308 |
07/19 |
$13,541 |
$14,531 |
08/19 |
$13,301 |
$14,265 |
09/19 |
$13,530 |
$14,512 |
10/19 |
$13,781 |
$14,819 |
11/19 |
$14,240 |
$15,379 |
12/19 |
$14,751 |
$15,824 |
01/20 |
$14,756 |
$15,841 |
02/20 |
$13,604 |
$14,546 |
03/20 |
$12,049 |
$12,624 |
04/20 |
$13,631 |
$14,292 |
05/20 |
$14,321 |
$15,046 |
06/20 |
$14,497 |
$15,379 |
07/20 |
$15,352 |
$16,279 |
08/20 |
$16,422 |
$17,474 |
09/20 |
$15,738 |
$16,836 |
10/20 |
$15,247 |
$16,430 |
11/20 |
$17,216 |
$18,364 |
12/20 |
$17,949 |
$19,141 |
01/21 |
$17,683 |
$18,983 |
02/21 |
$18,429 |
$19,533 |
03/21 |
$19,200 |
$20,272 |
04/21 |
$20,208 |
$21,364 |
05/21 |
$20,403 |
$21,465 |
06/21 |
$20,771 |
$22,003 |
07/21 |
$21,150 |
$22,460 |
08/21 |
$21,648 |
$23,110 |
09/21 |
$20,516 |
$22,048 |
10/21 |
$21,607 |
$23,578 |
11/21 |
$21,156 |
$23,262 |
12/21 |
$22,195 |
$24,204 |
01/22 |
$21,475 |
$22,840 |
02/22 |
$20,943 |
$22,213 |
03/22 |
$21,502 |
$22,962 |
04/22 |
$19,624 |
$20,916 |
05/22 |
$19,523 |
$20,884 |
06/22 |
$17,974 |
$19,135 |
07/22 |
$19,402 |
$20,917 |
08/22 |
$18,715 |
$20,114 |
09/22 |
$16,931 |
$18,253 |
10/22 |
$18,304 |
$19,717 |
11/22 |
$19,179 |
$20,783 |
12/22 |
$17,983 |
$19,575 |
01/23 |
$19,233 |
$20,887 |
02/23 |
$18,678 |
$20,390 |
03/23 |
$19,529 |
$21,035 |
04/23 |
$19,959 |
$21,296 |
05/23 |
$20,321 |
$21,395 |
06/23 |
$21,653 |
$22,840 |
07/23 |
$22,379 |
$23,625 |
08/23 |
$22,082 |
$23,212 |
09/23 |
$20,980 |
$22,121 |
10/23 |
$20,654 |
$21,587 |
11/23 |
$22,645 |
$23,603 |
12/23 |
$23,634 |
$24,768 |
01/24 |
$24,060 |
$25,113 |
02/24 |
$25,505 |
$26,469 |
03/24 |
$26,083 |
$27,318 |
04/24 |
$25,216 |
$26,155 |
05/24 |
$26,547 |
$27,387 |
06/24 |
$27,452 |
$28,294 |
07/24 |
$27,528 |
$28,705 |
08/24 |
$28,060 |
$29,386 |
09/24 |
$28,379 |
$30,014 |
10/24 |
$28,014 |
$29,804 |
11/24 |
$29,581 |
$31,723 |
12/24 |
$29,012 |
$30,839 |
01/25 |
$29,966 |
$31,820 |
02/25 |
$29,385 |
$31,264 |
03/25 |
$27,602 |
$29,454 |
04/25 |
$27,345 |
$29,279 |
05/25 |
$29,128 |
$31,148 |
06/25 |
$30,753 |
$32,726 |
07/25 |
$31,856 |
$33,453 |
08/25 |
$32,130 |
$34,157 |
09/25 |
$33,067 |
$35,341 |
10/25 |
$33,946 |
$36,104 |
11/25 |
$33,664 |
$36,192 |
12/25 |
$33,879 |
$36,194 |
01/26 |
$34,048 |
$36,692 |
02/26 |
$33,488 |
$36,496 |
03/26 |
$31,942 |
$34,681 |
04/26 |
$35,150 |
$38,185 |
05/26 |
$37,088 |
$40,133 |
06/26 |
$36,732 |
$39,928 |
07/26 |
$37,070 |
$39,788 |
08/26 |
$37,923 |
$40,910 |
|
| Average Annual Return [Table Text Block] |
Table Summary
Average Annual Total Returns (%) |
1 year |
5 years |
10 years |
Class R |
18.03 |
11.87 |
14.26 |
Russell 1000® Index |
19.77 |
12.10 |
15.13 | |
| No Deduction of Taxes [Text Block] |
Performance does not reflect the deduction of taxes that a shareholder may pay on fund distributions or on the redemptions of fund shares.
|
| Updated Performance Information Location [Text Block] |
columbiathreadneedleus.com/investment-products/mutual-funds
|
| AssetsNet |
$ 18,595,649,063
|
| Holdings Count | Holding |
78
|
| Advisory Fees Paid, Amount |
$ 100,926,880
|
| InvestmentCompanyPortfolioTurnover |
56.00%
|
| Additional Fund Statistics [Text Block] |
Table Summary
Fund net assets |
$18,595,649,063 |
Total number of portfolio holdings |
78 |
Management services fees (represents 0.60% of Fund average net assets) |
$100,926,880 |
Portfolio turnover for the reporting period |
56% | |
| Holdings [Text Block] |
Table Summary
Information Technology |
38.4% |
Financials |
13.7% |
Communication Services |
11.0% |
Health Care |
10.6% |
Consumer Discretionary |
10.0% |
Industrials |
8.5% |
Energy |
3.0% |
Real Estate |
1.1% |
Materials |
1.0% |
Utilities |
1.0% |
Other |
0.9% |
Table Summary
Common Stocks |
99.2% |
Other |
0.8% | |
| Largest Holdings [Text Block] |
Table Summary
NVIDIA Corp. |
8.9% |
Microsoft Corp. |
6.7% |
Apple, Inc. |
6.1% |
Amazon.com, Inc. |
5.1% |
Broadcom, Inc. |
3.2% |
Alphabet, Inc., Class A |
3.0% |
Alphabet, Inc., Class C |
2.4% |
Micron Technology, Inc. |
2.4% |
Eli Lilly & Co. |
2.4% |
Meta Platforms, Inc., Class A |
2.3% | |
| Material Fund Change [Text Block] |
|
| C000253719 |
|
| Shareholder Report [Line Items] |
|
| Fund Name |
Columbia Contrarian Core Fund
|
| Class Name |
Class S
|
| Trading Symbol |
SMGEX
|
| Annual or Semi-Annual Statement [Text Block] |
This annual shareholder report contains important information about Columbia Contrarian Core Fund (the Fund) for the period of September 1, 2025 to August 31, 2026.
|
| Additional Information [Text Block] |
You can find additional information about the Fund at columbiathreadneedleus.com/resources/literature. You can also request more information by contacting us at 1-800-345-6611.
|
| Additional Information Phone Number |
1-800-345-6611
|
| Additional Information Website |
columbiathreadneedleus.com/resources/literature
|
| Expenses [Text Block] |
What were the Fund costs for the reporting period? (Based on a hypothetical $10,000 investment)
Table Summary
Class |
Cost of a $10,000 investment |
Cost paid as a percentage of a $10,000 investment |
Class S |
$80 |
0.73% | |
| Expenses Paid, Amount |
$ 80
|
| Expense Ratio, Percent |
0.73%
|
| Factors Affecting Performance [Text Block] |
Management's Discussion of Fund Performance The performance of Class S shares for the period presented is shown in the Average Annual Total Returns table. Top Performance ContributorsStock selection | Selections in the consumer discretionary, communication services and real estate sectors boosted the Fund’s performance relative to the benchmark during the period. Allocations | Smaller allocations to the consumer staples sector and larger allocations to the information technology sector buoyed the Fund’s relative performance during the period. Individual holdings | Positions in Marvell Technology, a semiconductor company focused on data infrastructure and networking chips; Dell Technologies, a provider of personal computing and enterprise infrastructure solutions; and Applied Materials, a supplier of semiconductor manufacturing equipment and services, were among the top contributors to the Fund's relative performance. Top Performance DetractorsStock selection | Selections in the industrials, health care and energy sectors hurt the Fund’s performance relative to the benchmark during the period. Allocations | Larger weightings in the financials and communication services sectors detracted from the Fund’s relative performance. Individual holdings | Positions in Intuit, a financial software company; Micron Technology, a memory and storage semiconductor manufacturer; and Synopsys, a provider of chip design software and semiconductor IP, were among the top detractors from the Fund's relative performance. |
| Performance Past Does Not Indicate Future [Text] |
The Fund's past performance is not a good predictor of the Fund's future performance.
|
| Line Graph [Table Text Block] |
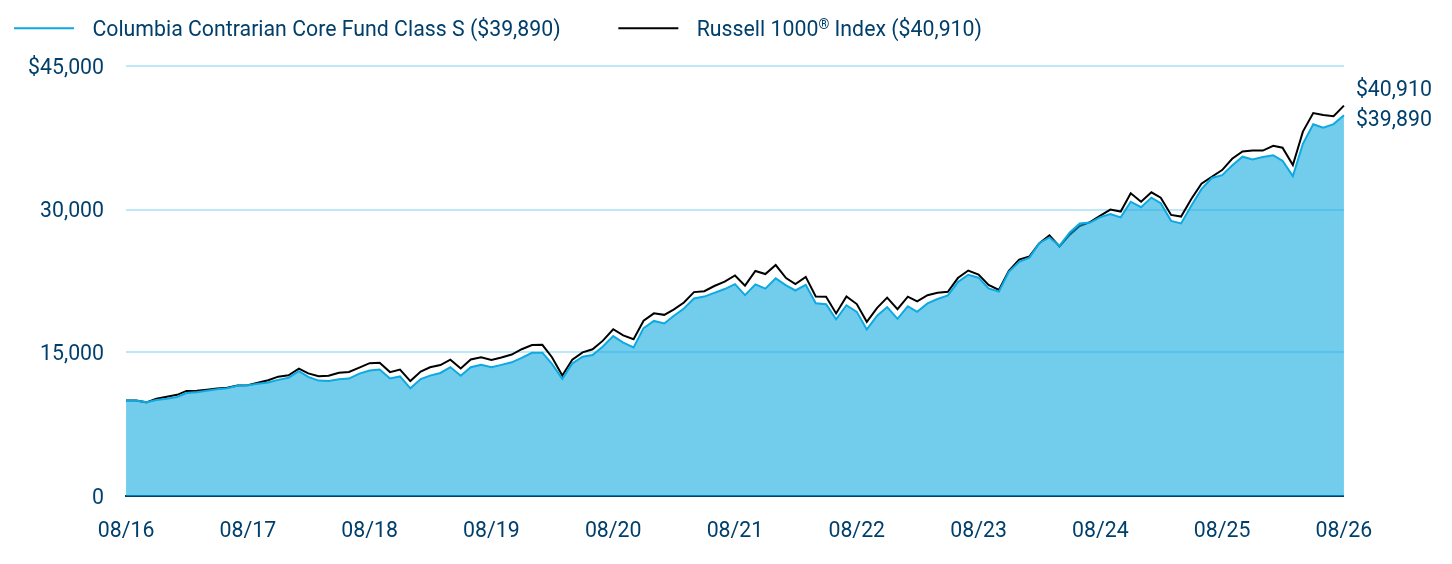
Table Summary
|
Columbia Contrarian Core Fund Class S ($39,890) |
Russell 1000® Index ($40,910) |
08/16 |
$10,000 |
$10,000 |
09/16 |
$10,000 |
$10,008 |
10/16 |
$9,817 |
$9,813 |
11/16 |
$10,049 |
$10,200 |
12/16 |
$10,187 |
$10,391 |
01/17 |
$10,377 |
$10,600 |
02/17 |
$10,793 |
$11,010 |
03/17 |
$10,879 |
$11,017 |
04/17 |
$11,033 |
$11,134 |
05/17 |
$11,178 |
$11,276 |
06/17 |
$11,296 |
$11,355 |
07/17 |
$11,545 |
$11,580 |
08/17 |
$11,595 |
$11,616 |
09/17 |
$11,767 |
$11,863 |
10/17 |
$11,889 |
$12,135 |
11/17 |
$12,170 |
$12,505 |
12/17 |
$12,397 |
$12,645 |
01/18 |
$13,073 |
$13,339 |
02/18 |
$12,478 |
$12,849 |
03/18 |
$12,095 |
$12,558 |
04/18 |
$12,061 |
$12,600 |
05/18 |
$12,234 |
$12,922 |
06/18 |
$12,306 |
$13,005 |
07/18 |
$12,828 |
$13,454 |
08/18 |
$13,145 |
$13,918 |
09/18 |
$13,250 |
$13,971 |
10/18 |
$12,315 |
$12,982 |
11/18 |
$12,526 |
$13,246 |
12/18 |
$11,284 |
$12,040 |
01/19 |
$12,251 |
$13,049 |
02/19 |
$12,614 |
$13,491 |
03/19 |
$12,892 |
$13,726 |
04/19 |
$13,507 |
$14,280 |
05/19 |
$12,608 |
$13,370 |
06/19 |
$13,491 |
$14,308 |
07/19 |
$13,748 |
$14,531 |
08/19 |
$13,507 |
$14,265 |
09/19 |
$13,743 |
$14,512 |
10/19 |
$14,006 |
$14,819 |
11/19 |
$14,479 |
$15,379 |
12/19 |
$15,004 |
$15,824 |
01/20 |
$15,021 |
$15,841 |
02/20 |
$13,850 |
$14,546 |
03/20 |
$12,267 |
$12,624 |
04/20 |
$13,889 |
$14,292 |
05/20 |
$14,597 |
$15,046 |
06/20 |
$14,781 |
$15,379 |
07/20 |
$15,662 |
$16,279 |
08/20 |
$16,760 |
$17,474 |
09/20 |
$16,068 |
$16,836 |
10/20 |
$15,578 |
$16,430 |
11/20 |
$17,590 |
$18,364 |
12/20 |
$18,347 |
$19,141 |
01/21 |
$18,083 |
$18,983 |
02/21 |
$18,858 |
$19,533 |
03/21 |
$19,652 |
$20,272 |
04/21 |
$20,692 |
$21,364 |
05/21 |
$20,897 |
$21,465 |
06/21 |
$21,288 |
$22,003 |
07/21 |
$21,685 |
$22,460 |
08/21 |
$22,202 |
$23,110 |
09/21 |
$21,053 |
$22,048 |
10/21 |
$22,178 |
$23,578 |
11/21 |
$21,727 |
$23,262 |
12/21 |
$22,803 |
$24,204 |
01/22 |
$22,070 |
$22,840 |
02/22 |
$21,535 |
$22,213 |
03/22 |
$22,125 |
$22,962 |
04/22 |
$20,193 |
$20,916 |
05/22 |
$20,097 |
$20,884 |
06/22 |
$18,514 |
$19,135 |
07/22 |
$19,987 |
$20,917 |
08/22 |
$19,295 |
$20,114 |
09/22 |
$17,459 |
$18,253 |
10/22 |
$18,891 |
$19,717 |
11/22 |
$19,795 |
$20,783 |
12/22 |
$18,568 |
$19,575 |
01/23 |
$19,869 |
$20,887 |
02/23 |
$19,302 |
$20,390 |
03/23 |
$20,187 |
$21,035 |
04/23 |
$20,641 |
$21,296 |
05/23 |
$21,026 |
$21,395 |
06/23 |
$22,418 |
$22,840 |
07/23 |
$23,182 |
$23,625 |
08/23 |
$22,879 |
$23,212 |
09/23 |
$21,745 |
$22,121 |
10/23 |
$21,412 |
$21,587 |
11/23 |
$23,485 |
$23,603 |
12/23 |
$24,531 |
$24,768 |
01/24 |
$24,976 |
$25,113 |
02/24 |
$26,490 |
$26,469 |
03/24 |
$27,098 |
$27,318 |
04/24 |
$26,217 |
$26,155 |
05/24 |
$27,614 |
$27,387 |
06/24 |
$28,558 |
$28,294 |
07/24 |
$28,652 |
$28,705 |
08/24 |
$29,221 |
$29,386 |
09/24 |
$29,557 |
$30,014 |
10/24 |
$29,198 |
$29,804 |
11/24 |
$30,837 |
$31,723 |
12/24 |
$30,258 |
$30,839 |
01/25 |
$31,265 |
$31,820 |
02/25 |
$30,676 |
$31,264 |
03/25 |
$28,831 |
$29,454 |
04/25 |
$28,567 |
$29,279 |
05/25 |
$30,446 |
$31,148 |
06/25 |
$32,154 |
$32,726 |
07/25 |
$33,324 |
$33,453 |
08/25 |
$33,622 |
$34,157 |
09/25 |
$34,622 |
$35,341 |
10/25 |
$35,553 |
$36,104 |
11/25 |
$35,271 |
$36,192 |
12/25 |
$35,514 |
$36,194 |
01/26 |
$35,706 |
$36,692 |
02/26 |
$35,128 |
$36,496 |
03/26 |
$33,523 |
$34,681 |
04/26 |
$36,908 |
$38,185 |
05/26 |
$38,954 |
$40,133 |
06/26 |
$38,605 |
$39,928 |
07/26 |
$38,972 |
$39,788 |
08/26 |
$39,890 |
$40,910 |
|
| Average Annual Return [Table Text Block] |
Table Summary
Average Annual Total Returns (%) |
1 year |
5 years |
10 years |
Class SFootnote Reference(a) |
18.64 |
12.43 |
14.84 |
Russell 1000® Index |
19.77 |
12.10 |
15.13 | |
| No Deduction of Taxes [Text Block] |
Performance does not reflect the deduction of taxes that a shareholder may pay on fund distributions or on the redemptions of fund shares.
|
| Updated Performance Information Location [Text Block] |
columbiathreadneedleus.com/investment-products/mutual-funds
|
| AssetsNet |
$ 18,595,649,063
|
| Holdings Count | Holding |
78
|
| Advisory Fees Paid, Amount |
$ 100,926,880
|
| InvestmentCompanyPortfolioTurnover |
56.00%
|
| Additional Fund Statistics [Text Block] |
Table Summary
Fund net assets |
$18,595,649,063 |
Total number of portfolio holdings |
78 |
Management services fees (represents 0.60% of Fund average net assets) |
$100,926,880 |
Portfolio turnover for the reporting period |
56% | |
| Holdings [Text Block] |
Table Summary
Information Technology |
38.4% |
Financials |
13.7% |
Communication Services |
11.0% |
Health Care |
10.6% |
Consumer Discretionary |
10.0% |
Industrials |
8.5% |
Energy |
3.0% |
Real Estate |
1.1% |
Materials |
1.0% |
Utilities |
1.0% |
Other |
0.9% |
Table Summary
Common Stocks |
99.2% |
Other |
0.8% | |
| Largest Holdings [Text Block] |
Table Summary
NVIDIA Corp. |
8.9% |
Microsoft Corp. |
6.7% |
Apple, Inc. |
6.1% |
Amazon.com, Inc. |
5.1% |
Broadcom, Inc. |
3.2% |
Alphabet, Inc., Class A |
3.0% |
Alphabet, Inc., Class C |
2.4% |
Micron Technology, Inc. |
2.4% |
Eli Lilly & Co. |
2.4% |
Meta Platforms, Inc., Class A |
2.3% | |
| Material Fund Change [Text Block] |
|
| C000061809 |
|
| Shareholder Report [Line Items] |
|
| Fund Name |
Columbia Emerging Markets Fund
|
| Class Name |
Class A
|
| Trading Symbol |
EEMAX
|
| Annual or Semi-Annual Statement [Text Block] |
This annual shareholder report contains important information about Columbia Emerging Markets Fund (the Fund) for the period of September 1, 2025 to August 31, 2026.
|
| Additional Information [Text Block] |
You can find additional information about the Fund at columbiathreadneedleus.com/resources/literature. You can also request more information by contacting us at 1-800-345-6611.
|
| Additional Information Phone Number |
1-800-345-6611
|
| Additional Information Website |
columbiathreadneedleus.com/resources/literature
|
| Expenses [Text Block] |
What were the Fund costs for the reporting period? (Based on a hypothetical $10,000 investment)
Table Summary
Class |
Cost of a $10,000 investment |
Cost paid as a percentage of a $10,000 investment |
Class A |
$168 |
1.37% | |
| Expenses Paid, Amount |
$ 168
|
| Expense Ratio, Percent |
1.37%
|
| Factors Affecting Performance [Text Block] |
Management's Discussion of Fund Performance The performance of Class A shares for the period presented is shown in the Average Annual Total Returns table. Top Performance ContributorsStock selection | Selections in the information technology sector boosted the Fund’s performance relative to the benchmark during the period. Allocations | A larger allocation to the information technology sector and, to a lesser extent, smaller allocations to the consumer discretionary and communication services sectors buoyed the Fund’s relative performance during the period. Individual holdings | Positions in SK Hynix, a South Korean semiconductor devices manufacturer; Unimicron Technology Corp., a Taiwanese manufacturer of circuit boards; Samsung Electro-Mechanics Co., a South Korea-based supplier of high-value electronic components; ASPEED Technology, Inc., a Taiwanese semiconductor devices company; and Elite Material Co., a Taiwanese electronic materials company that supplies critical inputs for semiconductor substrates, were among the top contributors to the Fund’s relative performance. Top Performance DetractorsStock selection | Selections in the consumer discretionary, communication services, financials and materials sectors hurt the Fund’s performance relative to the benchmark during the period. Allocations | Large weightings in the real estate and industrials sectors and a smaller allocation to materials sector detracted from the Fund’s relative performance. Individual holdings | Fund positions in MercadoLibre, Inc., an Argentinian company that operates online marketplaces dedicated to e-commerce and online auctions; Nu Holdings (Nubank), a Brazil-headquartered digital banking and financial services platform; Coupang, Inc. a leading South Korean e-commerce and logistics platform; Eastroc Beverage Co., a leading company in energy drinks and beverages in China; and SK Square Co., a South Korea-based technology holding company that provides exposure to the AI and semiconductor investment cycle, were top detractors from the Fund’s relative performance during the period. |
| Performance Past Does Not Indicate Future [Text] |
The Fund's past performance is not a good predictor of the Fund's future performance.
|
| Line Graph [Table Text Block] |
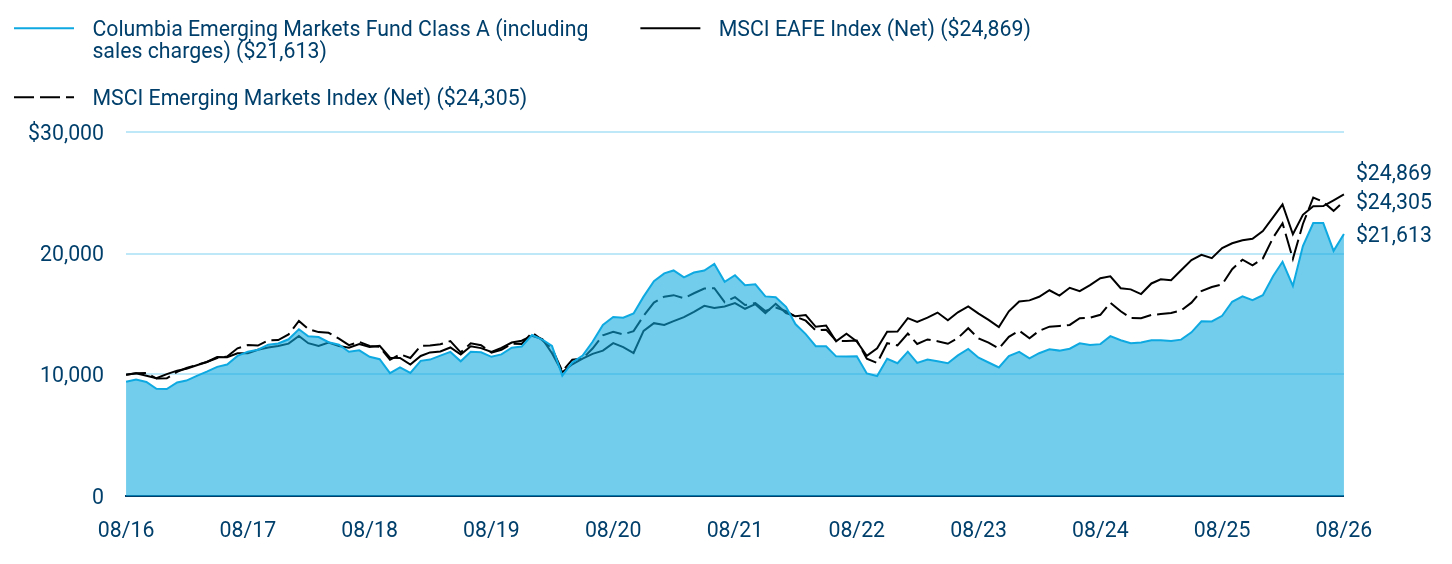
Table Summary
|
Columbia Emerging Markets Fund Class A (including sales charges) ($21,613) |
MSCI EAFE Index (Net) ($24,869) |
MSCI Emerging Markets Index (Net) ($24,305) |
08/16 |
$9,425 |
$10,000 |
$10,000 |
09/16 |
$9,613 |
$10,123 |
$10,129 |
10/16 |
$9,406 |
$9,916 |
$10,153 |
11/16 |
$8,840 |
$9,718 |
$9,685 |
12/16 |
$8,821 |
$10,051 |
$9,707 |
01/17 |
$9,368 |
$10,342 |
$10,238 |
02/17 |
$9,519 |
$10,490 |
$10,551 |
03/17 |
$9,906 |
$10,779 |
$10,818 |
04/17 |
$10,255 |
$11,053 |
$11,055 |
05/17 |
$10,651 |
$11,459 |
$11,381 |
06/17 |
$10,840 |
$11,439 |
$11,496 |
07/17 |
$11,557 |
$11,768 |
$12,181 |
08/17 |
$11,906 |
$11,764 |
$12,453 |
09/17 |
$12,066 |
$12,057 |
$12,403 |
10/17 |
$12,481 |
$12,240 |
$12,838 |
11/17 |
$12,575 |
$12,368 |
$12,864 |
12/17 |
$12,924 |
$12,567 |
$13,326 |
01/18 |
$13,756 |
$13,197 |
$14,436 |
02/18 |
$13,170 |
$12,601 |
$13,771 |
03/18 |
$13,113 |
$12,374 |
$13,515 |
04/18 |
$12,679 |
$12,657 |
$13,455 |
05/18 |
$12,480 |
$12,372 |
$12,978 |
06/18 |
$11,895 |
$12,221 |
$12,439 |
07/18 |
$12,017 |
$12,522 |
$12,712 |
08/18 |
$11,479 |
$12,280 |
$12,368 |
09/18 |
$11,280 |
$12,387 |
$12,303 |
10/18 |
$10,137 |
$11,401 |
$11,231 |
11/18 |
$10,600 |
$11,386 |
$11,694 |
12/18 |
$10,147 |
$10,834 |
$11,384 |
01/19 |
$11,148 |
$11,546 |
$12,381 |
02/19 |
$11,252 |
$11,840 |
$12,409 |
03/19 |
$11,573 |
$11,915 |
$12,513 |
04/19 |
$11,885 |
$12,250 |
$12,777 |
05/19 |
$11,110 |
$11,661 |
$11,850 |
06/19 |
$11,895 |
$12,353 |
$12,589 |
07/19 |
$11,847 |
$12,196 |
$12,435 |
08/19 |
$11,479 |
$11,880 |
$11,829 |
09/19 |
$11,677 |
$12,221 |
$12,055 |
10/19 |
$12,225 |
$12,660 |
$12,563 |
11/19 |
$12,320 |
$12,803 |
$12,546 |
12/19 |
$13,272 |
$13,219 |
$13,482 |
01/20 |
$12,903 |
$12,943 |
$12,853 |
02/20 |
$12,373 |
$11,773 |
$12,175 |
03/20 |
$9,933 |
$10,201 |
$10,300 |
04/20 |
$11,011 |
$10,860 |
$11,243 |
05/20 |
$11,579 |
$11,333 |
$11,330 |
06/20 |
$12,723 |
$11,719 |
$12,163 |
07/20 |
$14,114 |
$11,992 |
$13,249 |
08/20 |
$14,757 |
$12,609 |
$13,542 |
09/20 |
$14,710 |
$12,281 |
$13,325 |
10/20 |
$15,050 |
$11,791 |
$13,600 |
11/20 |
$16,441 |
$13,619 |
$14,857 |
12/20 |
$17,722 |
$14,252 |
$15,950 |
01/21 |
$18,362 |
$14,100 |
$16,439 |
02/21 |
$18,601 |
$14,416 |
$16,564 |
03/21 |
$18,028 |
$14,748 |
$16,314 |
04/21 |
$18,429 |
$15,192 |
$16,720 |
05/21 |
$18,592 |
$15,687 |
$17,108 |
06/21 |
$19,136 |
$15,510 |
$17,138 |
07/21 |
$17,665 |
$15,627 |
$15,984 |
08/21 |
$18,210 |
$15,903 |
$16,403 |
09/21 |
$17,388 |
$15,441 |
$15,751 |
10/21 |
$17,455 |
$15,821 |
$15,906 |
11/21 |
$16,461 |
$15,085 |
$15,258 |
12/21 |
$16,391 |
$15,857 |
$15,544 |
01/22 |
$15,596 |
$15,091 |
$15,250 |
02/22 |
$14,181 |
$14,824 |
$14,794 |
03/22 |
$13,348 |
$14,919 |
$14,460 |
04/22 |
$12,359 |
$13,954 |
$13,656 |
05/22 |
$12,349 |
$14,059 |
$13,716 |
06/22 |
$11,516 |
$12,754 |
$12,804 |
07/22 |
$11,506 |
$13,390 |
$12,773 |
08/22 |
$11,525 |
$12,754 |
$12,826 |
09/22 |
$10,110 |
$11,561 |
$11,323 |
10/22 |
$9,897 |
$12,182 |
$10,971 |
11/22 |
$11,312 |
$13,555 |
$12,598 |
12/22 |
$10,953 |
$13,565 |
$12,421 |
01/23 |
$11,903 |
$14,664 |
$13,402 |
02/23 |
$10,973 |
$14,358 |
$12,533 |
03/23 |
$11,254 |
$14,714 |
$12,913 |
04/23 |
$11,118 |
$15,129 |
$12,766 |
05/23 |
$10,953 |
$14,489 |
$12,552 |
06/23 |
$11,593 |
$15,148 |
$13,028 |
07/23 |
$12,126 |
$15,639 |
$13,839 |
08/23 |
$11,409 |
$15,039 |
$12,987 |
09/23 |
$11,011 |
$14,526 |
$12,647 |
10/23 |
$10,604 |
$13,937 |
$12,156 |
11/23 |
$11,535 |
$15,230 |
$13,129 |
12/23 |
$11,884 |
$16,040 |
$13,642 |
01/24 |
$11,351 |
$16,132 |
$13,008 |
02/24 |
$11,777 |
$16,427 |
$13,627 |
03/24 |
$12,107 |
$16,967 |
$13,965 |
04/24 |
$11,990 |
$16,533 |
$14,027 |
05/24 |
$12,146 |
$17,173 |
$14,107 |
06/24 |
$12,591 |
$16,896 |
$14,663 |
07/24 |
$12,446 |
$17,392 |
$14,707 |
08/24 |
$12,524 |
$17,957 |
$14,944 |
09/24 |
$13,183 |
$18,123 |
$15,942 |
10/24 |
$12,843 |
$17,138 |
$15,233 |
11/24 |
$12,591 |
$17,040 |
$14,686 |
12/24 |
$12,667 |
$16,653 |
$14,666 |
01/25 |
$12,853 |
$17,528 |
$14,928 |
02/25 |
$12,844 |
$17,868 |
$15,000 |
03/25 |
$12,785 |
$17,796 |
$15,095 |
04/25 |
$12,893 |
$18,611 |
$15,293 |
05/25 |
$13,500 |
$19,462 |
$15,946 |
06/25 |
$14,411 |
$19,891 |
$16,905 |
07/25 |
$14,392 |
$19,612 |
$17,234 |
08/25 |
$14,862 |
$20,448 |
$17,455 |
09/25 |
$16,018 |
$20,839 |
$18,704 |
10/25 |
$16,468 |
$21,085 |
$19,485 |
11/25 |
$16,155 |
$21,216 |
$19,019 |
12/25 |
$16,564 |
$21,852 |
$19,588 |
01/26 |
$18,148 |
$22,992 |
$21,322 |
02/26 |
$19,320 |
$24,056 |
$22,494 |
03/26 |
$17,325 |
$21,581 |
$19,556 |
04/26 |
$20,615 |
$23,189 |
$22,433 |
05/26 |
$22,507 |
$23,900 |
$24,606 |
06/26 |
$22,507 |
$23,916 |
$24,259 |
07/26 |
$20,214 |
$24,384 |
$23,514 |
08/26 |
$21,613 |
$24,869 |
$24,305 |
|
| Average Annual Return [Table Text Block] |
Table Summary
Average Annual Total Returns (%) |
1 year |
5 years |
10 years |
Class A (excluding sales charges) |
45.42 |
3.49 |
8.65 |
Class A (including sales charges) |
37.02 |
2.27 |
8.01 |
MSCI EAFE Index (Net) |
21.62 |
9.35 |
9.54 |
MSCI Emerging Markets Index (Net) |
39.25 |
8.18 |
9.29 | |
| No Deduction of Taxes [Text Block] |
Performance does not reflect the deduction of taxes that a shareholder may pay on fund distributions or on the redemptions of fund shares.
|
| Updated Performance Information Location [Text Block] |
columbiathreadneedleus.com/investment-products/mutual-funds
|
| AssetsNet |
$ 839,405,589
|
| Holdings Count | Holding |
87
|
| Advisory Fees Paid, Amount |
$ 8,735,712
|
| InvestmentCompanyPortfolioTurnover |
47.00%
|
| Additional Fund Statistics [Text Block] |
Table Summary
Fund net assets |
$839,405,589 |
Total number of portfolio holdings |
87 |
Management services fees (represents 1.08% of Fund average net assets) |
$8,735,712 |
Portfolio turnover for the reporting period |
47% | |
| Holdings [Text Block] |
Table Summary
Taiwan |
29.3% |
|
South Korea |
24.3% |
|
China |
17.1% |
|
Greece |
6.1% |
|
India |
5.6% |
|
Brazil |
4.2% |
|
South Africa |
4.0% |
|
Mexico |
1.7% |
|
United Kingdom |
1.6% |
|
Turkey |
1.5% |
|
Other |
5.0% |
|
Table Summary
Information Technology |
49.1% |
Financials |
14.9% |
Industrials |
11.7% |
Consumer Discretionary |
6.1% |
Communication Services |
4.1% |
Materials |
4.0% |
Energy |
2.7% |
Real Estate |
2.4% |
Consumer Staples |
2.1% |
Health Care |
1.7% |
Other |
1.2% | |
| Largest Holdings [Text Block] |
Table Summary
Taiwan Semiconductor Manufacturing Co., Ltd. |
15.5% |
Samsung Electronics Co., Ltd. |
8.9% |
SK Hynix, Inc. |
6.7% |
Tencent Holdings Ltd. |
3.0% |
Samsung Electro-Mechanics Co., Ltd. |
2.9% |
Alibaba Group Holding Ltd. |
2.8% |
Unimicron Technology Corp. |
2.6% |
Piraeus Bank SA |
2.1% |
Capitec Ltd. |
2.0% |
Delta Electronics, Inc. |
1.9% | |
| Material Fund Change [Text Block] |
|
| C000061810 |
|
| Shareholder Report [Line Items] |
|
| Fund Name |
Columbia Emerging Markets Fund
|
| Class Name |
Class C
|
| Trading Symbol |
EEMCX
|
| Annual or Semi-Annual Statement [Text Block] |
This annual shareholder report contains important information about Columbia Emerging Markets Fund (the Fund) for the period of September 1, 2025 to August 31, 2026.
|
| Additional Information [Text Block] |
You can find additional information about the Fund at columbiathreadneedleus.com/resources/literature. You can also request more information by contacting us at 1-800-345-6611.
|
| Additional Information Phone Number |
1-800-345-6611
|
| Additional Information Website |
columbiathreadneedleus.com/resources/literature
|
| Expenses [Text Block] |
What were the Fund costs for the reporting period? (Based on a hypothetical $10,000 investment)
Table Summary
Class |
Cost of a $10,000 investment |
Cost paid as a percentage of a $10,000 investment |
Class C |
$259 |
2.12% | |
| Expenses Paid, Amount |
$ 259
|
| Expense Ratio, Percent |
2.12%
|
| Factors Affecting Performance [Text Block] |
Management's Discussion of Fund Performance The performance of Class C shares for the period presented is shown in the Average Annual Total Returns table. Top Performance ContributorsStock selection | Selections in the information technology sector boosted the Fund’s performance relative to the benchmark during the period. Allocations | A larger allocation to the information technology sector and, to a lesser extent, smaller allocations to the consumer discretionary and communication services sectors buoyed the Fund’s relative performance during the period. Individual holdings | Positions in SK Hynix, a South Korean semiconductor devices manufacturer; Unimicron Technology Corp., a Taiwanese manufacturer of circuit boards; Samsung Electro-Mechanics Co., a South Korea-based supplier of high-value electronic components; ASPEED Technology, Inc., a Taiwanese semiconductor devices company; and Elite Material Co., a Taiwanese electronic materials company that supplies critical inputs for semiconductor substrates, were among the top contributors to the Fund’s relative performance. Top Performance DetractorsStock selection | Selections in the consumer discretionary, communication services, financials and materials sectors hurt the Fund’s performance relative to the benchmark during the period. Allocations | Large weightings in the real estate and industrials sectors and a smaller allocation to materials sector detracted from the Fund’s relative performance. Individual holdings | Fund positions in MercadoLibre, Inc., an Argentinian company that operates online marketplaces dedicated to e-commerce and online auctions; Nu Holdings (Nubank), a Brazil-headquartered digital banking and financial services platform; Coupang, Inc. a leading South Korean e-commerce and logistics platform; Eastroc Beverage Co., a leading company in energy drinks and beverages in China; and SK Square Co., a South Korea-based technology holding company that provides exposure to the AI and semiconductor investment cycle, were top detractors from the Fund’s relative performance during the period. |
| Performance Past Does Not Indicate Future [Text] |
The Fund's past performance is not a good predictor of the Fund's future performance.
|
| Line Graph [Table Text Block] |
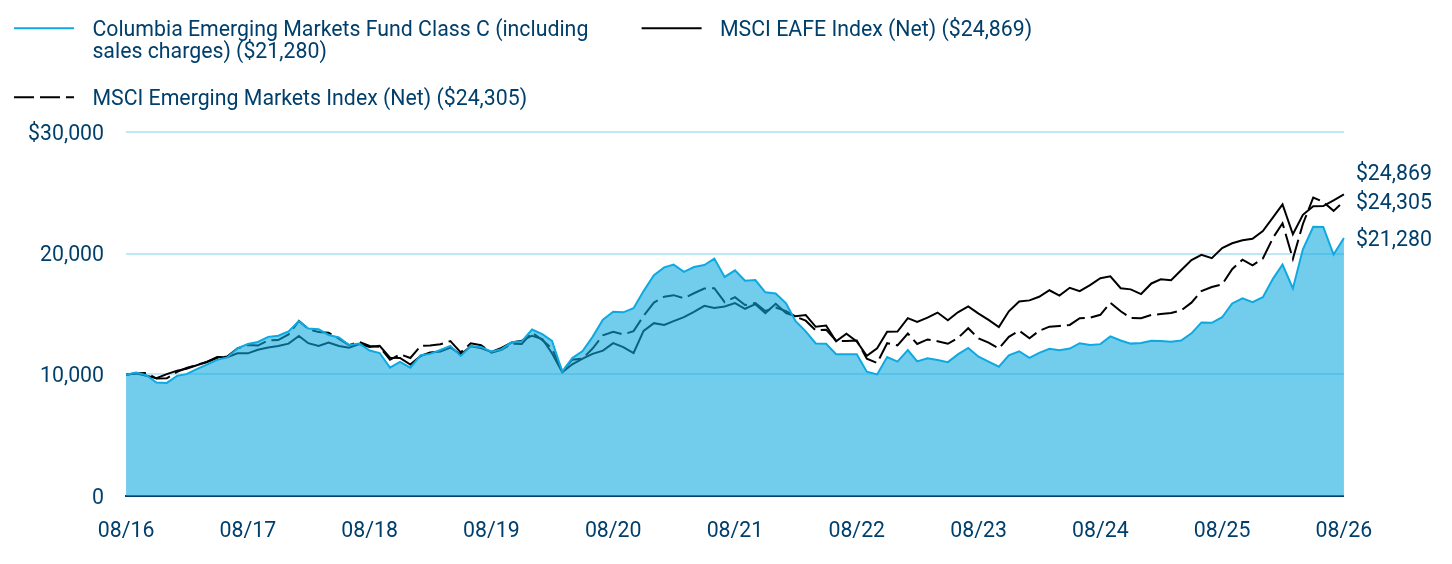
Table Summary
|
Columbia Emerging Markets Fund Class C (including sales charges) ($21,280) |
MSCI EAFE Index (Net) ($24,869) |
MSCI Emerging Markets Index (Net) ($24,305) |
08/16 |
$10,000 |
$10,000 |
$10,000 |
09/16 |
$10,189 |
$10,123 |
$10,129 |
10/16 |
$9,958 |
$9,916 |
$10,153 |
11/16 |
$9,361 |
$9,718 |
$9,685 |
12/16 |
$9,329 |
$10,051 |
$9,707 |
01/17 |
$9,906 |
$10,342 |
$10,238 |
02/17 |
$10,052 |
$10,490 |
$10,551 |
03/17 |
$10,461 |
$10,779 |
$10,818 |
04/17 |
$10,828 |
$11,053 |
$11,055 |
05/17 |
$11,226 |
$11,459 |
$11,381 |
06/17 |
$11,426 |
$11,439 |
$11,496 |
07/17 |
$12,180 |
$11,768 |
$12,181 |
08/17 |
$12,537 |
$11,764 |
$12,453 |
09/17 |
$12,704 |
$12,057 |
$12,403 |
10/17 |
$13,124 |
$12,240 |
$12,838 |
11/17 |
$13,218 |
$12,368 |
$12,864 |
12/17 |
$13,574 |
$12,567 |
$13,326 |
01/18 |
$14,434 |
$13,197 |
$14,436 |
02/18 |
$13,816 |
$12,601 |
$13,771 |
03/18 |
$13,753 |
$12,374 |
$13,515 |
04/18 |
$13,281 |
$12,657 |
$13,455 |
05/18 |
$13,071 |
$12,372 |
$12,978 |
06/18 |
$12,453 |
$12,221 |
$12,439 |
07/18 |
$12,568 |
$12,522 |
$12,712 |
08/18 |
$12,002 |
$12,280 |
$12,368 |
09/18 |
$11,792 |
$12,387 |
$12,303 |
10/18 |
$10,587 |
$11,401 |
$11,231 |
11/18 |
$11,059 |
$11,386 |
$11,694 |
12/18 |
$10,587 |
$10,834 |
$11,384 |
01/19 |
$11,614 |
$11,546 |
$12,381 |
02/19 |
$11,719 |
$11,840 |
$12,409 |
03/19 |
$12,044 |
$11,915 |
$12,513 |
04/19 |
$12,369 |
$12,250 |
$12,777 |
05/19 |
$11,551 |
$11,661 |
$11,850 |
06/19 |
$12,358 |
$12,353 |
$12,589 |
07/19 |
$12,296 |
$12,196 |
$12,435 |
08/19 |
$11,908 |
$11,880 |
$11,829 |
09/19 |
$12,107 |
$12,221 |
$12,055 |
10/19 |
$12,673 |
$12,660 |
$12,563 |
11/19 |
$12,757 |
$12,803 |
$12,546 |
12/19 |
$13,732 |
$13,219 |
$13,482 |
01/20 |
$13,344 |
$12,943 |
$12,853 |
02/20 |
$12,799 |
$11,773 |
$12,175 |
03/20 |
$10,262 |
$10,201 |
$10,300 |
04/20 |
$11,373 |
$10,860 |
$11,243 |
05/20 |
$11,950 |
$11,333 |
$11,330 |
06/20 |
$13,124 |
$11,719 |
$12,163 |
07/20 |
$14,539 |
$11,992 |
$13,249 |
08/20 |
$15,199 |
$12,609 |
$13,542 |
09/20 |
$15,147 |
$12,281 |
$13,325 |
10/20 |
$15,482 |
$11,791 |
$13,600 |
11/20 |
$16,897 |
$13,619 |
$14,857 |
12/20 |
$18,201 |
$14,252 |
$15,950 |
01/21 |
$18,854 |
$14,100 |
$16,439 |
02/21 |
$19,086 |
$14,416 |
$16,564 |
03/21 |
$18,485 |
$14,748 |
$16,314 |
04/21 |
$18,886 |
$15,192 |
$16,720 |
05/21 |
$19,044 |
$15,687 |
$17,108 |
06/21 |
$19,581 |
$15,510 |
$17,138 |
07/21 |
$18,064 |
$15,627 |
$15,984 |
08/21 |
$18,612 |
$15,903 |
$16,403 |
09/21 |
$17,759 |
$15,441 |
$15,751 |
10/21 |
$17,811 |
$15,821 |
$15,906 |
11/21 |
$16,800 |
$15,085 |
$15,258 |
12/21 |
$16,706 |
$15,857 |
$15,544 |
01/22 |
$15,885 |
$15,091 |
$15,250 |
02/22 |
$14,444 |
$14,824 |
$14,794 |
03/22 |
$13,580 |
$14,919 |
$14,460 |
04/22 |
$12,577 |
$13,954 |
$13,656 |
05/22 |
$12,556 |
$14,059 |
$13,716 |
06/22 |
$11,692 |
$12,754 |
$12,804 |
07/22 |
$11,681 |
$13,390 |
$12,773 |
08/22 |
$11,692 |
$12,754 |
$12,826 |
09/22 |
$10,252 |
$11,561 |
$11,323 |
10/22 |
$10,028 |
$12,182 |
$10,971 |
11/22 |
$11,457 |
$13,555 |
$12,598 |
12/22 |
$11,084 |
$13,565 |
$12,421 |
01/23 |
$12,033 |
$14,664 |
$13,402 |
02/23 |
$11,095 |
$14,358 |
$12,533 |
03/23 |
$11,361 |
$14,714 |
$12,913 |
04/23 |
$11,223 |
$15,129 |
$12,766 |
05/23 |
$11,041 |
$14,489 |
$12,552 |
06/23 |
$11,681 |
$15,148 |
$13,028 |
07/23 |
$12,215 |
$15,639 |
$13,839 |
08/23 |
$11,489 |
$15,039 |
$12,987 |
09/23 |
$11,084 |
$14,526 |
$12,647 |
10/23 |
$10,668 |
$13,937 |
$12,156 |
11/23 |
$11,596 |
$15,230 |
$13,129 |
12/23 |
$11,937 |
$16,040 |
$13,642 |
01/24 |
$11,393 |
$16,132 |
$13,008 |
02/24 |
$11,809 |
$16,427 |
$13,627 |
03/24 |
$12,140 |
$16,967 |
$13,965 |
04/24 |
$12,012 |
$16,533 |
$14,027 |
05/24 |
$12,161 |
$17,173 |
$14,107 |
06/24 |
$12,599 |
$16,896 |
$14,663 |
07/24 |
$12,449 |
$17,392 |
$14,707 |
08/24 |
$12,524 |
$17,957 |
$14,944 |
09/24 |
$13,164 |
$18,123 |
$15,942 |
10/24 |
$12,823 |
$17,138 |
$15,233 |
11/24 |
$12,567 |
$17,040 |
$14,686 |
12/24 |
$12,623 |
$16,653 |
$14,666 |
01/25 |
$12,805 |
$17,528 |
$14,928 |
02/25 |
$12,784 |
$17,868 |
$15,000 |
03/25 |
$12,720 |
$17,796 |
$15,095 |
04/25 |
$12,816 |
$18,611 |
$15,293 |
05/25 |
$13,416 |
$19,462 |
$15,946 |
06/25 |
$14,315 |
$19,891 |
$16,905 |
07/25 |
$14,283 |
$19,612 |
$17,234 |
08/25 |
$14,743 |
$20,448 |
$17,455 |
09/25 |
$15,878 |
$20,839 |
$18,704 |
10/25 |
$16,306 |
$21,085 |
$19,485 |
11/25 |
$15,985 |
$21,216 |
$19,019 |
12/25 |
$16,391 |
$21,852 |
$19,588 |
01/26 |
$17,949 |
$22,992 |
$21,322 |
02/26 |
$19,090 |
$24,056 |
$22,494 |
03/26 |
$17,114 |
$21,581 |
$19,556 |
04/26 |
$20,343 |
$23,189 |
$22,433 |
05/26 |
$22,205 |
$23,900 |
$24,606 |
06/26 |
$22,194 |
$23,916 |
$24,259 |
07/26 |
$19,914 |
$24,384 |
$23,514 |
08/26 |
$21,280 |
$24,869 |
$24,305 |
|
| Average Annual Return [Table Text Block] |
Table Summary
Average Annual Total Returns (%) |
1 year |
5 years |
10 years |
Class C (excluding sales charges) |
44.33 |
2.72 |
7.84 |
Class C (including sales charges) |
43.33 |
2.72 |
7.84 |
MSCI EAFE Index (Net) |
21.62 |
9.35 |
9.54 |
MSCI Emerging Markets Index (Net) |
39.25 |
8.18 |
9.29 | |
| No Deduction of Taxes [Text Block] |
Performance does not reflect the deduction of taxes that a shareholder may pay on fund distributions or on the redemptions of fund shares.
|
| Updated Performance Information Location [Text Block] |
columbiathreadneedleus.com/investment-products/mutual-funds
|
| AssetsNet |
$ 839,405,589
|
| Holdings Count | Holding |
87
|
| Advisory Fees Paid, Amount |
$ 8,735,712
|
| InvestmentCompanyPortfolioTurnover |
47.00%
|
| Additional Fund Statistics [Text Block] |
Table Summary
Fund net assets |
$839,405,589 |
Total number of portfolio holdings |
87 |
Management services fees (represents 1.08% of Fund average net assets) |
$8,735,712 |
Portfolio turnover for the reporting period |
47% | |
| Holdings [Text Block] |
Table Summary
Taiwan |
29.3% |
|
South Korea |
24.3% |
|
China |
17.1% |
|
Greece |
6.1% |
|
India |
5.6% |
|
Brazil |
4.2% |
|
South Africa |
4.0% |
|
Mexico |
1.7% |
|
United Kingdom |
1.6% |
|
Turkey |
1.5% |
|
Other |
5.0% |
|
Table Summary
Information Technology |
49.1% |
Financials |
14.9% |
Industrials |
11.7% |
Consumer Discretionary |
6.1% |
Communication Services |
4.1% |
Materials |
4.0% |
Energy |
2.7% |
Real Estate |
2.4% |
Consumer Staples |
2.1% |
Health Care |
1.7% |
Other |
1.2% | |
| Largest Holdings [Text Block] |
Table Summary
Taiwan Semiconductor Manufacturing Co., Ltd. |
15.5% |
Samsung Electronics Co., Ltd. |
8.9% |
SK Hynix, Inc. |
6.7% |
Tencent Holdings Ltd. |
3.0% |
Samsung Electro-Mechanics Co., Ltd. |
2.9% |
Alibaba Group Holding Ltd. |
2.8% |
Unimicron Technology Corp. |
2.6% |
Piraeus Bank SA |
2.1% |
Capitec Ltd. |
2.0% |
Delta Electronics, Inc. |
1.9% | |
| Material Fund Change [Text Block] |
|
| C000061811 |
|
| Shareholder Report [Line Items] |
|
| Fund Name |
Columbia Emerging Markets Fund
|
| Class Name |
Institutional Class
|
| Trading Symbol |
UMEMX
|
| Annual or Semi-Annual Statement [Text Block] |
This annual shareholder report contains important information about Columbia Emerging Markets Fund (the Fund) for the period of September 1, 2025 to August 31, 2026.
|
| Additional Information [Text Block] |
You can find additional information about the Fund at columbiathreadneedleus.com/resources/literature. You can also request more information by contacting us at 1-800-345-6611.
|
| Additional Information Phone Number |
1-800-345-6611
|
| Additional Information Website |
columbiathreadneedleus.com/resources/literature
|
| Expenses [Text Block] |
What were the Fund costs for the reporting period? (Based on a hypothetical $10,000 investment)
Table Summary
Class |
Cost of a $10,000 investment |
Cost paid as a percentage of a $10,000 investment |
Institutional Class |
$138 |
1.12% | |
| Expenses Paid, Amount |
$ 138
|
| Expense Ratio, Percent |
1.12%
|
| Factors Affecting Performance [Text Block] |
Management's Discussion of Fund Performance The performance of Institutional Class shares for the period presented is shown in the Average Annual Total Returns table. Top Performance ContributorsStock selection | Selections in the information technology sector boosted the Fund’s performance relative to the benchmark during the period. Allocations | A larger allocation to the information technology sector and, to a lesser extent, smaller allocations to the consumer discretionary and communication services sectors buoyed the Fund’s relative performance during the period. Individual holdings | Positions in SK Hynix, a South Korean semiconductor devices manufacturer; Unimicron Technology Corp., a Taiwanese manufacturer of circuit boards; Samsung Electro-Mechanics Co., a South Korea-based supplier of high-value electronic components; ASPEED Technology, Inc., a Taiwanese semiconductor devices company; and Elite Material Co., a Taiwanese electronic materials company that supplies critical inputs for semiconductor substrates, were among the top contributors to the Fund’s relative performance. Top Performance DetractorsStock selection | Selections in the consumer discretionary, communication services, financials and materials sectors hurt the Fund’s performance relative to the benchmark during the period. Allocations | Large weightings in the real estate and industrials sectors and a smaller allocation to materials sector detracted from the Fund’s relative performance. Individual holdings | Fund positions in MercadoLibre, Inc., an Argentinian company that operates online marketplaces dedicated to e-commerce and online auctions; Nu Holdings (Nubank), a Brazil-headquartered digital banking and financial services platform; Coupang, Inc. a leading South Korean e-commerce and logistics platform; Eastroc Beverage Co., a leading company in energy drinks and beverages in China; and SK Square Co., a South Korea-based technology holding company that provides exposure to the AI and semiconductor investment cycle, were top detractors from the Fund’s relative performance during the period. |
| Performance Past Does Not Indicate Future [Text] |
The Fund's past performance is not a good predictor of the Fund's future performance.
|
| Line Graph [Table Text Block] |
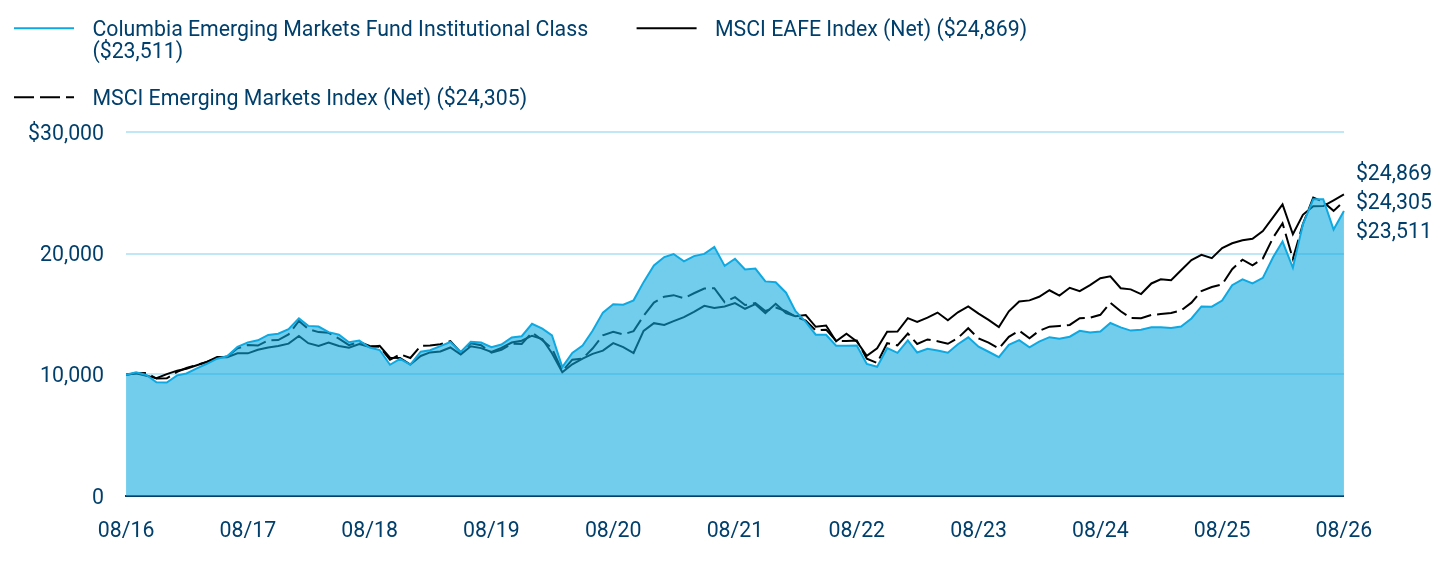
Table Summary
|
Columbia Emerging Markets Fund Institutional Class ($23,511) |
MSCI EAFE Index (Net) ($24,869) |
MSCI Emerging Markets Index (Net) ($24,305) |
08/16 |
$10,000 |
$10,000 |
$10,000 |
09/16 |
$10,209 |
$10,123 |
$10,129 |
10/16 |
$9,980 |
$9,916 |
$10,153 |
11/16 |
$9,384 |
$9,718 |
$9,685 |
12/16 |
$9,364 |
$10,051 |
$9,707 |
01/17 |
$9,950 |
$10,342 |
$10,238 |
02/17 |
$10,109 |
$10,490 |
$10,551 |
03/17 |
$10,526 |
$10,779 |
$10,818 |
04/17 |
$10,904 |
$11,053 |
$11,055 |
05/17 |
$11,321 |
$11,459 |
$11,381 |
06/17 |
$11,519 |
$11,439 |
$11,496 |
07/17 |
$12,294 |
$11,768 |
$12,181 |
08/17 |
$12,671 |
$11,764 |
$12,453 |
09/17 |
$12,840 |
$12,057 |
$12,403 |
10/17 |
$13,287 |
$12,240 |
$12,838 |
11/17 |
$13,386 |
$12,368 |
$12,864 |
12/17 |
$13,761 |
$12,567 |
$13,326 |
01/18 |
$14,648 |
$13,197 |
$14,436 |
02/18 |
$14,030 |
$12,601 |
$13,771 |
03/18 |
$13,970 |
$12,374 |
$13,515 |
04/18 |
$13,512 |
$12,657 |
$13,455 |
05/18 |
$13,303 |
$12,372 |
$12,978 |
06/18 |
$12,675 |
$12,221 |
$12,439 |
07/18 |
$12,814 |
$12,522 |
$12,712 |
08/18 |
$12,246 |
$12,280 |
$12,368 |
09/18 |
$12,037 |
$12,387 |
$12,303 |
10/18 |
$10,821 |
$11,401 |
$11,231 |
11/18 |
$11,310 |
$11,386 |
$11,694 |
12/18 |
$10,834 |
$10,834 |
$11,384 |
01/19 |
$11,901 |
$11,546 |
$12,381 |
02/19 |
$12,021 |
$11,840 |
$12,409 |
03/19 |
$12,360 |
$11,915 |
$12,513 |
04/19 |
$12,700 |
$12,250 |
$12,777 |
05/19 |
$11,872 |
$11,661 |
$11,850 |
06/19 |
$12,710 |
$12,353 |
$12,589 |
07/19 |
$12,660 |
$12,196 |
$12,435 |
08/19 |
$12,271 |
$11,880 |
$11,829 |
09/19 |
$12,490 |
$12,221 |
$12,055 |
10/19 |
$13,079 |
$12,660 |
$12,563 |
11/19 |
$13,178 |
$12,803 |
$12,546 |
12/19 |
$14,204 |
$13,219 |
$13,482 |
01/20 |
$13,803 |
$12,943 |
$12,853 |
02/20 |
$13,243 |
$11,773 |
$12,175 |
03/20 |
$10,630 |
$10,201 |
$10,300 |
04/20 |
$11,791 |
$10,860 |
$11,243 |
05/20 |
$12,402 |
$11,333 |
$11,330 |
06/20 |
$13,633 |
$11,719 |
$12,163 |
07/20 |
$15,125 |
$11,992 |
$13,249 |
08/20 |
$15,815 |
$12,609 |
$13,542 |
09/20 |
$15,775 |
$12,281 |
$13,325 |
10/20 |
$16,136 |
$11,791 |
$13,600 |
11/20 |
$17,637 |
$13,619 |
$14,857 |
12/20 |
$19,007 |
$14,252 |
$15,950 |
01/21 |
$19,705 |
$14,100 |
$16,439 |
02/21 |
$19,959 |
$14,416 |
$16,564 |
03/21 |
$19,351 |
$14,748 |
$16,314 |
04/21 |
$19,786 |
$15,192 |
$16,720 |
05/21 |
$19,969 |
$15,687 |
$17,108 |
06/21 |
$20,546 |
$15,510 |
$17,138 |
07/21 |
$18,976 |
$15,627 |
$15,984 |
08/21 |
$19,564 |
$15,903 |
$16,403 |
09/21 |
$18,683 |
$15,441 |
$15,751 |
10/21 |
$18,754 |
$15,821 |
$15,906 |
11/21 |
$17,700 |
$15,085 |
$15,258 |
12/21 |
$17,621 |
$15,857 |
$15,544 |
01/22 |
$16,768 |
$15,091 |
$15,250 |
02/22 |
$15,256 |
$14,824 |
$14,794 |
03/22 |
$14,362 |
$14,919 |
$14,460 |
04/22 |
$13,303 |
$13,954 |
$13,656 |
05/22 |
$13,293 |
$14,059 |
$13,716 |
06/22 |
$12,398 |
$12,754 |
$12,804 |
07/22 |
$12,398 |
$13,390 |
$12,773 |
08/22 |
$12,419 |
$12,754 |
$12,826 |
09/22 |
$10,897 |
$11,561 |
$11,323 |
10/22 |
$10,661 |
$12,182 |
$10,971 |
11/22 |
$12,193 |
$13,555 |
$12,598 |
12/22 |
$11,802 |
$13,565 |
$12,421 |
01/23 |
$12,830 |
$14,664 |
$13,402 |
02/23 |
$11,833 |
$14,358 |
$12,533 |
03/23 |
$12,141 |
$14,714 |
$12,913 |
04/23 |
$11,997 |
$15,129 |
$12,766 |
05/23 |
$11,812 |
$14,489 |
$12,552 |
06/23 |
$12,511 |
$15,148 |
$13,028 |
07/23 |
$13,087 |
$15,639 |
$13,839 |
08/23 |
$12,316 |
$15,039 |
$12,987 |
09/23 |
$11,895 |
$14,526 |
$12,647 |
10/23 |
$11,452 |
$13,937 |
$12,156 |
11/23 |
$12,470 |
$15,230 |
$13,129 |
12/23 |
$12,851 |
$16,040 |
$13,642 |
01/24 |
$12,265 |
$16,132 |
$13,008 |
02/24 |
$12,738 |
$16,427 |
$13,627 |
03/24 |
$13,097 |
$16,967 |
$13,965 |
04/24 |
$12,964 |
$16,533 |
$14,027 |
05/24 |
$13,138 |
$17,173 |
$14,107 |
06/24 |
$13,622 |
$16,896 |
$14,663 |
07/24 |
$13,478 |
$17,392 |
$14,707 |
08/24 |
$13,560 |
$17,957 |
$14,944 |
09/24 |
$14,269 |
$18,123 |
$15,942 |
10/24 |
$13,910 |
$17,138 |
$15,233 |
11/24 |
$13,642 |
$17,040 |
$14,686 |
12/24 |
$13,714 |
$16,653 |
$14,666 |
01/25 |
$13,922 |
$17,528 |
$14,928 |
02/25 |
$13,911 |
$17,868 |
$15,000 |
03/25 |
$13,849 |
$17,796 |
$15,095 |
04/25 |
$13,974 |
$18,611 |
$15,293 |
05/25 |
$14,640 |
$19,462 |
$15,946 |
06/25 |
$15,630 |
$19,891 |
$16,905 |
07/25 |
$15,609 |
$19,612 |
$17,234 |
08/25 |
$16,119 |
$20,448 |
$17,455 |
09/25 |
$17,389 |
$20,839 |
$18,704 |
10/25 |
$17,868 |
$21,085 |
$19,485 |
11/25 |
$17,535 |
$21,216 |
$19,019 |
12/25 |
$17,992 |
$21,852 |
$19,588 |
01/26 |
$19,711 |
$22,992 |
$21,322 |
02/26 |
$20,982 |
$24,056 |
$22,494 |
03/26 |
$18,824 |
$21,581 |
$19,556 |
04/26 |
$22,405 |
$23,189 |
$22,433 |
05/26 |
$24,464 |
$23,900 |
$24,606 |
06/26 |
$24,475 |
$23,916 |
$24,259 |
07/26 |
$21,978 |
$24,384 |
$23,514 |
08/26 |
$23,511 |
$24,869 |
$24,305 |
|
| Average Annual Return [Table Text Block] |
Table Summary
Average Annual Total Returns (%) |
1 year |
5 years |
10 years |
Institutional Class |
45.86 |
3.74 |
8.92 |
MSCI EAFE Index (Net) |
21.62 |
9.35 |
9.54 |
MSCI Emerging Markets Index (Net) |
39.25 |
8.18 |
9.29 | |
| No Deduction of Taxes [Text Block] |
Performance does not reflect the deduction of taxes that a shareholder may pay on fund distributions or on the redemptions of fund shares.
|
| Updated Performance Information Location [Text Block] |
columbiathreadneedleus.com/investment-products/mutual-funds
|
| AssetsNet |
$ 839,405,589
|
| Holdings Count | Holding |
87
|
| Advisory Fees Paid, Amount |
$ 8,735,712
|
| InvestmentCompanyPortfolioTurnover |
47.00%
|
| Additional Fund Statistics [Text Block] |
Table Summary
Fund net assets |
$839,405,589 |
Total number of portfolio holdings |
87 |
Management services fees (represents 1.08% of Fund average net assets) |
$8,735,712 |
Portfolio turnover for the reporting period |
47% | |
| Holdings [Text Block] |
Table Summary
Taiwan |
29.3% |
|
South Korea |
24.3% |
|
China |
17.1% |
|
Greece |
6.1% |
|
India |
5.6% |
|
Brazil |
4.2% |
|
South Africa |
4.0% |
|
Mexico |
1.7% |
|
United Kingdom |
1.6% |
|
Turkey |
1.5% |
|
Other |
5.0% |
|
Table Summary
Information Technology |
49.1% |
Financials |
14.9% |
Industrials |
11.7% |
Consumer Discretionary |
6.1% |
Communication Services |
4.1% |
Materials |
4.0% |
Energy |
2.7% |
Real Estate |
2.4% |
Consumer Staples |
2.1% |
Health Care |
1.7% |
Other |
1.2% | |
| Largest Holdings [Text Block] |
Table Summary
Taiwan Semiconductor Manufacturing Co., Ltd. |
15.5% |
Samsung Electronics Co., Ltd. |
8.9% |
SK Hynix, Inc. |
6.7% |
Tencent Holdings Ltd. |
3.0% |
Samsung Electro-Mechanics Co., Ltd. |
2.9% |
Alibaba Group Holding Ltd. |
2.8% |
Unimicron Technology Corp. |
2.6% |
Piraeus Bank SA |
2.1% |
Capitec Ltd. |
2.0% |
Delta Electronics, Inc. |
1.9% | |
| Material Fund Change [Text Block] |
|
| C000121798 |
|
| Shareholder Report [Line Items] |
|
| Fund Name |
Columbia Emerging Markets Fund
|
| Class Name |
Institutional 2 Class
|
| Trading Symbol |
CEKRX
|
| Annual or Semi-Annual Statement [Text Block] |
This annual shareholder report contains important information about Columbia Emerging Markets Fund (the Fund) for the period of September 1, 2025 to August 31, 2026.
|
| Additional Information [Text Block] |
You can find additional information about the Fund at columbiathreadneedleus.com/resources/literature. You can also request more information by contacting us at 1-800-345-6611.
|
| Additional Information Phone Number |
1-800-345-6611
|
| Additional Information Website |
columbiathreadneedleus.com/resources/literature
|
| Expenses [Text Block] |
What were the Fund costs for the reporting period? (Based on a hypothetical $10,000 investment)
Table Summary
Class |
Cost of a $10,000 investment |
Cost paid as a percentage of a $10,000 investment |
Institutional 2 Class |
$129 |
1.05% | |
| Expenses Paid, Amount |
$ 129
|
| Expense Ratio, Percent |
1.05%
|
| Factors Affecting Performance [Text Block] |
Management's Discussion of Fund Performance The performance of Institutional 2 Class shares for the period presented is shown in the Average Annual Total Returns table. Top Performance ContributorsStock selection | Selections in the information technology sector boosted the Fund’s performance relative to the benchmark during the period. Allocations | A larger allocation to the information technology sector and, to a lesser extent, smaller allocations to the consumer discretionary and communication services sectors buoyed the Fund’s relative performance during the period. Individual holdings | Positions in SK Hynix, a South Korean semiconductor devices manufacturer; Unimicron Technology Corp., a Taiwanese manufacturer of circuit boards; Samsung Electro-Mechanics Co., a South Korea-based supplier of high-value electronic components; ASPEED Technology, Inc., a Taiwanese semiconductor devices company; and Elite Material Co., a Taiwanese electronic materials company that supplies critical inputs for semiconductor substrates, were among the top contributors to the Fund’s relative performance. Top Performance DetractorsStock selection | Selections in the consumer discretionary, communication services, financials and materials sectors hurt the Fund’s performance relative to the benchmark during the period. Allocations | Large weightings in the real estate and industrials sectors and a smaller allocation to materials sector detracted from the Fund’s relative performance. Individual holdings | Fund positions in MercadoLibre, Inc., an Argentinian company that operates online marketplaces dedicated to e-commerce and online auctions; Nu Holdings (Nubank), a Brazil-headquartered digital banking and financial services platform; Coupang, Inc. a leading South Korean e-commerce and logistics platform; Eastroc Beverage Co., a leading company in energy drinks and beverages in China; and SK Square Co., a South Korea-based technology holding company that provides exposure to the AI and semiconductor investment cycle, were top detractors from the Fund’s relative performance during the period. |
| Performance Past Does Not Indicate Future [Text] |
The Fund's past performance is not a good predictor of the Fund's future performance.
|
| Line Graph [Table Text Block] |
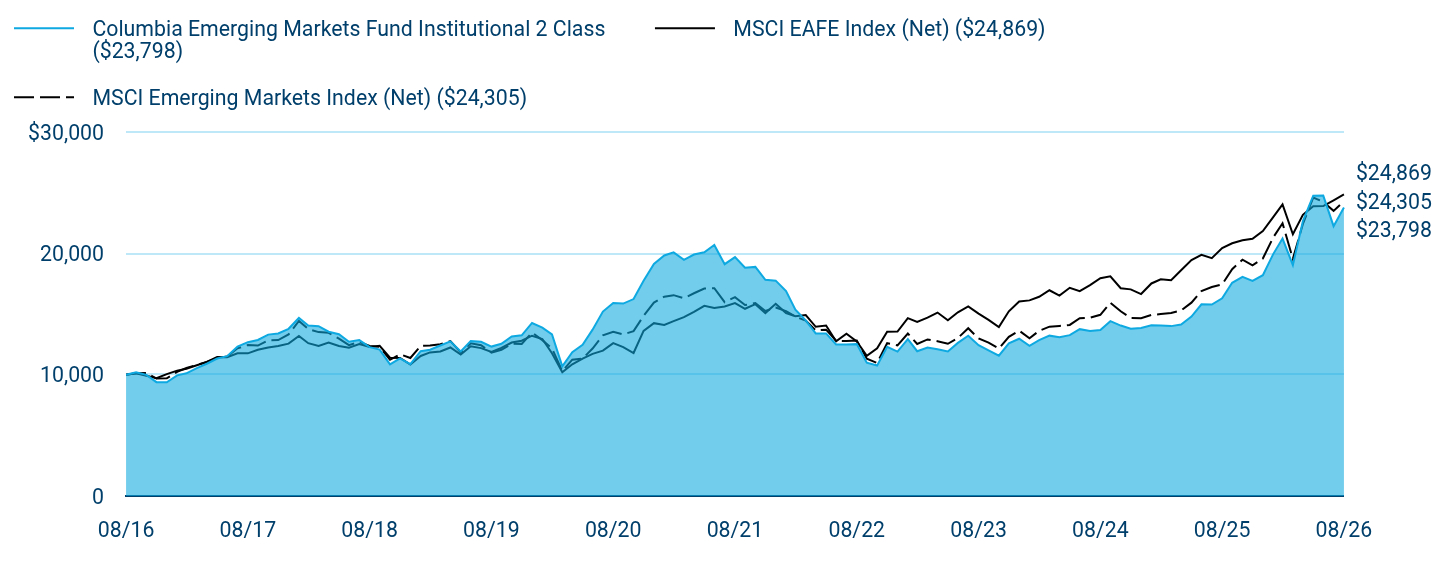
Table Summary
|
Columbia Emerging Markets Fund Institutional 2 Class ($23,798) |
MSCI EAFE Index (Net) ($24,869) |
MSCI Emerging Markets Index (Net) ($24,305) |
08/16 |
$10,000 |
$10,000 |
$10,000 |
09/16 |
$10,208 |
$10,123 |
$10,129 |
10/16 |
$9,990 |
$9,916 |
$10,153 |
11/16 |
$9,387 |
$9,718 |
$9,685 |
12/16 |
$9,377 |
$10,051 |
$9,707 |
01/17 |
$9,951 |
$10,342 |
$10,238 |
02/17 |
$10,119 |
$10,490 |
$10,551 |
03/17 |
$10,543 |
$10,779 |
$10,818 |
04/17 |
$10,909 |
$11,053 |
$11,055 |
05/17 |
$11,334 |
$11,459 |
$11,381 |
06/17 |
$11,532 |
$11,439 |
$11,496 |
07/17 |
$12,312 |
$11,768 |
$12,181 |
08/17 |
$12,688 |
$11,764 |
$12,453 |
09/17 |
$12,866 |
$12,057 |
$12,403 |
10/17 |
$13,310 |
$12,240 |
$12,838 |
11/17 |
$13,409 |
$12,368 |
$12,864 |
12/17 |
$13,788 |
$12,567 |
$13,326 |
01/18 |
$14,682 |
$13,197 |
$14,436 |
02/18 |
$14,056 |
$12,601 |
$13,771 |
03/18 |
$14,007 |
$12,374 |
$13,515 |
04/18 |
$13,550 |
$12,657 |
$13,455 |
05/18 |
$13,341 |
$12,372 |
$12,978 |
06/18 |
$12,716 |
$12,221 |
$12,439 |
07/18 |
$12,855 |
$12,522 |
$12,712 |
08/18 |
$12,279 |
$12,280 |
$12,368 |
09/18 |
$12,071 |
$12,387 |
$12,303 |
10/18 |
$10,850 |
$11,401 |
$11,231 |
11/18 |
$11,346 |
$11,386 |
$11,694 |
12/18 |
$10,870 |
$10,834 |
$11,384 |
01/19 |
$11,945 |
$11,546 |
$12,381 |
02/19 |
$12,065 |
$11,840 |
$12,409 |
03/19 |
$12,413 |
$11,915 |
$12,513 |
04/19 |
$12,751 |
$12,250 |
$12,777 |
05/19 |
$11,925 |
$11,661 |
$11,850 |
06/19 |
$12,771 |
$12,353 |
$12,589 |
07/19 |
$12,722 |
$12,196 |
$12,435 |
08/19 |
$12,323 |
$11,880 |
$11,829 |
09/19 |
$12,552 |
$12,221 |
$12,055 |
10/19 |
$13,150 |
$12,660 |
$12,563 |
11/19 |
$13,249 |
$12,803 |
$12,546 |
12/19 |
$14,270 |
$13,219 |
$13,482 |
01/20 |
$13,880 |
$12,943 |
$12,853 |
02/20 |
$13,320 |
$11,773 |
$12,175 |
03/20 |
$10,690 |
$10,201 |
$10,300 |
04/20 |
$11,860 |
$10,860 |
$11,243 |
05/20 |
$12,470 |
$11,333 |
$11,330 |
06/20 |
$13,720 |
$11,719 |
$12,163 |
07/20 |
$15,210 |
$11,992 |
$13,249 |
08/20 |
$15,920 |
$12,609 |
$13,542 |
09/20 |
$15,870 |
$12,281 |
$13,325 |
10/20 |
$16,240 |
$11,791 |
$13,600 |
11/20 |
$17,750 |
$13,619 |
$14,857 |
12/20 |
$19,138 |
$14,252 |
$15,950 |
01/21 |
$19,836 |
$14,100 |
$16,439 |
02/21 |
$20,090 |
$14,416 |
$16,564 |
03/21 |
$19,482 |
$14,748 |
$16,314 |
04/21 |
$19,917 |
$15,192 |
$16,720 |
05/21 |
$20,100 |
$15,687 |
$17,108 |
06/21 |
$20,697 |
$15,510 |
$17,138 |
07/21 |
$19,118 |
$15,627 |
$15,984 |
08/21 |
$19,705 |
$15,903 |
$16,403 |
09/21 |
$18,824 |
$15,441 |
$15,751 |
10/21 |
$18,895 |
$15,821 |
$15,906 |
11/21 |
$17,832 |
$15,085 |
$15,258 |
12/21 |
$17,759 |
$15,857 |
$15,544 |
01/22 |
$16,905 |
$15,091 |
$15,250 |
02/22 |
$15,373 |
$14,824 |
$14,794 |
03/22 |
$14,479 |
$14,919 |
$14,460 |
04/22 |
$13,409 |
$13,954 |
$13,656 |
05/22 |
$13,409 |
$14,059 |
$13,716 |
06/22 |
$12,504 |
$12,754 |
$12,804 |
07/22 |
$12,494 |
$13,390 |
$12,773 |
08/22 |
$12,525 |
$12,754 |
$12,826 |
09/22 |
$10,993 |
$11,561 |
$11,323 |
10/22 |
$10,756 |
$12,182 |
$10,971 |
11/22 |
$12,299 |
$13,555 |
$12,598 |
12/22 |
$11,908 |
$13,565 |
$12,421 |
01/23 |
$12,946 |
$14,664 |
$13,402 |
02/23 |
$11,939 |
$14,358 |
$12,533 |
03/23 |
$12,247 |
$14,714 |
$12,913 |
04/23 |
$12,103 |
$15,129 |
$12,766 |
05/23 |
$11,918 |
$14,489 |
$12,552 |
06/23 |
$12,628 |
$15,148 |
$13,028 |
07/23 |
$13,214 |
$15,639 |
$13,839 |
08/23 |
$12,432 |
$15,039 |
$12,987 |
09/23 |
$12,011 |
$14,526 |
$12,647 |
10/23 |
$11,568 |
$13,937 |
$12,156 |
11/23 |
$12,586 |
$15,230 |
$13,129 |
12/23 |
$12,967 |
$16,040 |
$13,642 |
01/24 |
$12,381 |
$16,132 |
$13,008 |
02/24 |
$12,854 |
$16,427 |
$13,627 |
03/24 |
$13,224 |
$16,967 |
$13,965 |
04/24 |
$13,101 |
$16,533 |
$14,027 |
05/24 |
$13,265 |
$17,173 |
$14,107 |
06/24 |
$13,759 |
$16,896 |
$14,663 |
07/24 |
$13,615 |
$17,392 |
$14,707 |
08/24 |
$13,697 |
$17,957 |
$14,944 |
09/24 |
$14,417 |
$18,123 |
$15,942 |
10/24 |
$14,057 |
$17,138 |
$15,233 |
11/24 |
$13,790 |
$17,040 |
$14,686 |
12/24 |
$13,864 |
$16,653 |
$14,666 |
01/25 |
$14,083 |
$17,528 |
$14,928 |
02/25 |
$14,062 |
$17,868 |
$15,000 |
03/25 |
$14,010 |
$17,796 |
$15,095 |
04/25 |
$14,135 |
$18,611 |
$15,293 |
05/25 |
$14,802 |
$19,462 |
$15,946 |
06/25 |
$15,813 |
$19,891 |
$16,905 |
07/25 |
$15,792 |
$19,612 |
$17,234 |
08/25 |
$16,303 |
$20,448 |
$17,455 |
09/25 |
$17,585 |
$20,839 |
$18,704 |
10/25 |
$18,075 |
$21,085 |
$19,485 |
11/25 |
$17,741 |
$21,216 |
$19,019 |
12/25 |
$18,205 |
$21,852 |
$19,588 |
01/26 |
$19,949 |
$22,992 |
$21,322 |
02/26 |
$21,232 |
$24,056 |
$22,494 |
03/26 |
$19,050 |
$21,581 |
$19,556 |
04/26 |
$22,669 |
$23,189 |
$22,433 |
05/26 |
$24,764 |
$23,900 |
$24,606 |
06/26 |
$24,774 |
$23,916 |
$24,259 |
07/26 |
$22,252 |
$24,384 |
$23,514 |
08/26 |
$23,798 |
$24,869 |
$24,305 |
|
| Average Annual Return [Table Text Block] |
Table Summary
Average Annual Total Returns (%) |
1 year |
5 years |
10 years |
Institutional 2 Class |
45.98 |
3.85 |
9.06 |
MSCI EAFE Index (Net) |
21.62 |
9.35 |
9.54 |
MSCI Emerging Markets Index (Net) |
39.25 |
8.18 |
9.29 | |
| No Deduction of Taxes [Text Block] |
Performance does not reflect the deduction of taxes that a shareholder may pay on fund distributions or on the redemptions of fund shares.
|
| Updated Performance Information Location [Text Block] |
columbiathreadneedleus.com/investment-products/mutual-funds
|
| AssetsNet |
$ 839,405,589
|
| Holdings Count | Holding |
87
|
| Advisory Fees Paid, Amount |
$ 8,735,712
|
| InvestmentCompanyPortfolioTurnover |
47.00%
|
| Additional Fund Statistics [Text Block] |
Table Summary
Fund net assets |
$839,405,589 |
Total number of portfolio holdings |
87 |
Management services fees (represents 1.08% of Fund average net assets) |
$8,735,712 |
Portfolio turnover for the reporting period |
47% | |
| Holdings [Text Block] |
Table Summary
Taiwan |
29.3% |
|
South Korea |
24.3% |
|
China |
17.1% |
|
Greece |
6.1% |
|
India |
5.6% |
|
Brazil |
4.2% |
|
South Africa |
4.0% |
|
Mexico |
1.7% |
|
United Kingdom |
1.6% |
|
Turkey |
1.5% |
|
Other |
5.0% |
|
Table Summary
Information Technology |
49.1% |
Financials |
14.9% |
Industrials |
11.7% |
Consumer Discretionary |
6.1% |
Communication Services |
4.1% |
Materials |
4.0% |
Energy |
2.7% |
Real Estate |
2.4% |
Consumer Staples |
2.1% |
Health Care |
1.7% |
Other |
1.2% | |
| Largest Holdings [Text Block] |
Table Summary
Taiwan Semiconductor Manufacturing Co., Ltd. |
15.5% |
Samsung Electronics Co., Ltd. |
8.9% |
SK Hynix, Inc. |
6.7% |
Tencent Holdings Ltd. |
3.0% |
Samsung Electro-Mechanics Co., Ltd. |
2.9% |
Alibaba Group Holding Ltd. |
2.8% |
Unimicron Technology Corp. |
2.6% |
Piraeus Bank SA |
2.1% |
Capitec Ltd. |
2.0% |
Delta Electronics, Inc. |
1.9% | |
| Material Fund Change [Text Block] |
|
| C000122684 |
|
| Shareholder Report [Line Items] |
|
| Fund Name |
Columbia Emerging Markets Fund
|
| Class Name |
Institutional 3 Class
|
| Trading Symbol |
CEKYX
|
| Annual or Semi-Annual Statement [Text Block] |
This annual shareholder report contains important information about Columbia Emerging Markets Fund (the Fund) for the period of September 1, 2025 to August 31, 2026.
|
| Additional Information [Text Block] |
You can find additional information about the Fund at columbiathreadneedleus.com/resources/literature. You can also request more information by contacting us at 1-800-345-6611.
|
| Additional Information Phone Number |
1-800-345-6611
|
| Additional Information Website |
columbiathreadneedleus.com/resources/literature
|
| Expenses [Text Block] |
What were the Fund costs for the reporting period? (Based on a hypothetical $10,000 investment)
Table Summary
Class |
Cost of a $10,000 investment |
Cost paid as a percentage of a $10,000 investment |
Institutional 3 Class |
$123 |
1.00% | |
| Expenses Paid, Amount |
$ 123
|
| Expense Ratio, Percent |
1.00%
|
| Factors Affecting Performance [Text Block] |
Management's Discussion of Fund Performance The performance of Institutional 3 Class shares for the period presented is shown in the Average Annual Total Returns table. Top Performance ContributorsStock selection | Selections in the information technology sector boosted the Fund’s performance relative to the benchmark during the period. Allocations | A larger allocation to the information technology sector and, to a lesser extent, smaller allocations to the consumer discretionary and communication services sectors buoyed the Fund’s relative performance during the period. Individual holdings | Positions in SK Hynix, a South Korean semiconductor devices manufacturer; Unimicron Technology Corp., a Taiwanese manufacturer of circuit boards; Samsung Electro-Mechanics Co., a South Korea-based supplier of high-value electronic components; ASPEED Technology, Inc., a Taiwanese semiconductor devices company; and Elite Material Co., a Taiwanese electronic materials company that supplies critical inputs for semiconductor substrates, were among the top contributors to the Fund’s relative performance. Top Performance DetractorsStock selection | Selections in the consumer discretionary, communication services, financials and materials sectors hurt the Fund’s performance relative to the benchmark during the period. Allocations | Large weightings in the real estate and industrials sectors and a smaller allocation to materials sector detracted from the Fund’s relative performance. Individual holdings | Fund positions in MercadoLibre, Inc., an Argentinian company that operates online marketplaces dedicated to e-commerce and online auctions; Nu Holdings (Nubank), a Brazil-headquartered digital banking and financial services platform; Coupang, Inc. a leading South Korean e-commerce and logistics platform; Eastroc Beverage Co., a leading company in energy drinks and beverages in China; and SK Square Co., a South Korea-based technology holding company that provides exposure to the AI and semiconductor investment cycle, were top detractors from the Fund’s relative performance during the period. |
| Performance Past Does Not Indicate Future [Text] |
The Fund's past performance is not a good predictor of the Fund's future performance.
|
| Line Graph [Table Text Block] |
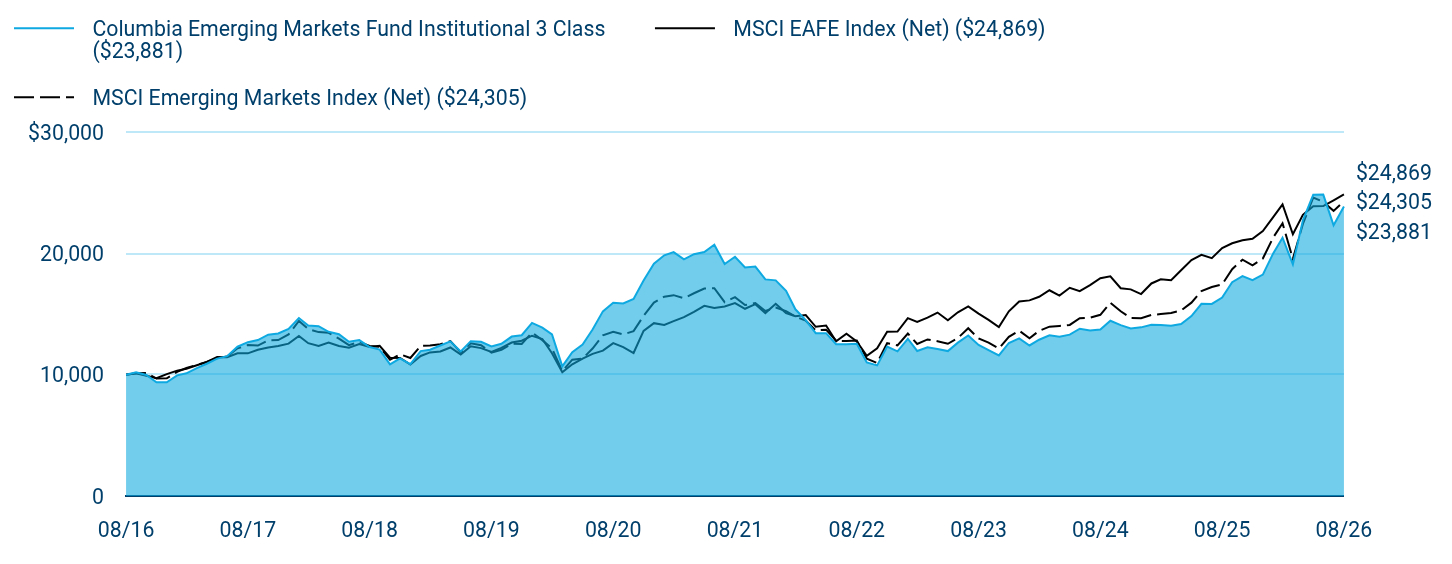
Table Summary
|
Columbia Emerging Markets Fund Institutional 3 Class ($23,881) |
MSCI EAFE Index (Net) ($24,869) |
MSCI Emerging Markets Index (Net) ($24,305) |
08/16 |
$10,000 |
$10,000 |
$10,000 |
09/16 |
$10,197 |
$10,123 |
$10,129 |
10/16 |
$9,980 |
$9,916 |
$10,153 |
11/16 |
$9,381 |
$9,718 |
$9,685 |
12/16 |
$9,371 |
$10,051 |
$9,707 |
01/17 |
$9,951 |
$10,342 |
$10,238 |
02/17 |
$10,118 |
$10,490 |
$10,551 |
03/17 |
$10,541 |
$10,779 |
$10,818 |
04/17 |
$10,905 |
$11,053 |
$11,055 |
05/17 |
$11,327 |
$11,459 |
$11,381 |
06/17 |
$11,534 |
$11,439 |
$11,496 |
07/17 |
$12,311 |
$11,768 |
$12,181 |
08/17 |
$12,684 |
$11,764 |
$12,453 |
09/17 |
$12,861 |
$12,057 |
$12,403 |
10/17 |
$13,304 |
$12,240 |
$12,838 |
11/17 |
$13,402 |
$12,368 |
$12,864 |
12/17 |
$13,783 |
$12,567 |
$13,326 |
01/18 |
$14,672 |
$13,197 |
$14,436 |
02/18 |
$14,059 |
$12,601 |
$13,771 |
03/18 |
$14,000 |
$12,374 |
$13,515 |
04/18 |
$13,545 |
$12,657 |
$13,455 |
05/18 |
$13,338 |
$12,372 |
$12,978 |
06/18 |
$12,716 |
$12,221 |
$12,439 |
07/18 |
$12,854 |
$12,522 |
$12,712 |
08/18 |
$12,281 |
$12,280 |
$12,368 |
09/18 |
$12,073 |
$12,387 |
$12,303 |
10/18 |
$10,858 |
$11,401 |
$11,231 |
11/18 |
$11,352 |
$11,386 |
$11,694 |
12/18 |
$10,876 |
$10,834 |
$11,384 |
01/19 |
$11,947 |
$11,546 |
$12,381 |
02/19 |
$12,066 |
$11,840 |
$12,409 |
03/19 |
$12,413 |
$11,915 |
$12,513 |
04/19 |
$12,750 |
$12,250 |
$12,777 |
05/19 |
$11,927 |
$11,661 |
$11,850 |
06/19 |
$12,770 |
$12,353 |
$12,589 |
07/19 |
$12,721 |
$12,196 |
$12,435 |
08/19 |
$12,334 |
$11,880 |
$11,829 |
09/19 |
$12,552 |
$12,221 |
$12,055 |
10/19 |
$13,147 |
$12,660 |
$12,563 |
11/19 |
$13,256 |
$12,803 |
$12,546 |
12/19 |
$14,279 |
$13,219 |
$13,482 |
01/20 |
$13,890 |
$12,943 |
$12,853 |
02/20 |
$13,332 |
$11,773 |
$12,175 |
03/20 |
$10,692 |
$10,201 |
$10,300 |
04/20 |
$11,868 |
$10,860 |
$11,243 |
05/20 |
$12,485 |
$11,333 |
$11,330 |
06/20 |
$13,731 |
$11,719 |
$12,163 |
07/20 |
$15,226 |
$11,992 |
$13,249 |
08/20 |
$15,933 |
$12,609 |
$13,542 |
09/20 |
$15,883 |
$12,281 |
$13,325 |
10/20 |
$16,252 |
$11,791 |
$13,600 |
11/20 |
$17,767 |
$13,619 |
$14,857 |
12/20 |
$19,156 |
$14,252 |
$15,950 |
01/21 |
$19,852 |
$14,100 |
$16,439 |
02/21 |
$20,114 |
$14,416 |
$16,564 |
03/21 |
$19,509 |
$14,748 |
$16,314 |
04/21 |
$19,943 |
$15,192 |
$16,720 |
05/21 |
$20,125 |
$15,687 |
$17,108 |
06/21 |
$20,720 |
$15,510 |
$17,138 |
07/21 |
$19,135 |
$15,627 |
$15,984 |
08/21 |
$19,731 |
$15,903 |
$16,403 |
09/21 |
$18,843 |
$15,441 |
$15,751 |
10/21 |
$18,924 |
$15,821 |
$15,906 |
11/21 |
$17,864 |
$15,085 |
$15,258 |
12/21 |
$17,784 |
$15,857 |
$15,544 |
01/22 |
$16,923 |
$15,091 |
$15,250 |
02/22 |
$15,396 |
$14,824 |
$14,794 |
03/22 |
$14,504 |
$14,919 |
$14,460 |
04/22 |
$13,428 |
$13,954 |
$13,656 |
05/22 |
$13,428 |
$14,059 |
$13,716 |
06/22 |
$12,516 |
$12,754 |
$12,804 |
07/22 |
$12,516 |
$13,390 |
$12,773 |
08/22 |
$12,546 |
$12,754 |
$12,826 |
09/22 |
$11,009 |
$11,561 |
$11,323 |
10/22 |
$10,773 |
$12,182 |
$10,971 |
11/22 |
$12,321 |
$13,555 |
$12,598 |
12/22 |
$11,931 |
$13,565 |
$12,421 |
01/23 |
$12,967 |
$14,664 |
$13,402 |
02/23 |
$11,962 |
$14,358 |
$12,533 |
03/23 |
$12,270 |
$14,714 |
$12,913 |
04/23 |
$12,126 |
$15,129 |
$12,766 |
05/23 |
$11,952 |
$14,489 |
$12,552 |
06/23 |
$12,649 |
$15,148 |
$13,028 |
07/23 |
$13,243 |
$15,639 |
$13,839 |
08/23 |
$12,454 |
$15,039 |
$12,987 |
09/23 |
$12,034 |
$14,526 |
$12,647 |
10/23 |
$11,593 |
$13,937 |
$12,156 |
11/23 |
$12,618 |
$15,230 |
$13,129 |
12/23 |
$12,997 |
$16,040 |
$13,642 |
01/24 |
$12,413 |
$16,132 |
$13,008 |
02/24 |
$12,885 |
$16,427 |
$13,627 |
03/24 |
$13,254 |
$16,967 |
$13,965 |
04/24 |
$13,131 |
$16,533 |
$14,027 |
05/24 |
$13,305 |
$17,173 |
$14,107 |
06/24 |
$13,797 |
$16,896 |
$14,663 |
07/24 |
$13,643 |
$17,392 |
$14,707 |
08/24 |
$13,735 |
$17,957 |
$14,944 |
09/24 |
$14,453 |
$18,123 |
$15,942 |
10/24 |
$14,094 |
$17,138 |
$15,233 |
11/24 |
$13,817 |
$17,040 |
$14,686 |
12/24 |
$13,907 |
$16,653 |
$14,666 |
01/25 |
$14,115 |
$17,528 |
$14,928 |
02/25 |
$14,104 |
$17,868 |
$15,000 |
03/25 |
$14,042 |
$17,796 |
$15,095 |
04/25 |
$14,177 |
$18,611 |
$15,293 |
05/25 |
$14,842 |
$19,462 |
$15,946 |
06/25 |
$15,850 |
$19,891 |
$16,905 |
07/25 |
$15,840 |
$19,612 |
$17,234 |
08/25 |
$16,360 |
$20,448 |
$17,455 |
09/25 |
$17,638 |
$20,839 |
$18,704 |
10/25 |
$18,137 |
$21,085 |
$19,485 |
11/25 |
$17,794 |
$21,216 |
$19,019 |
12/25 |
$18,258 |
$21,852 |
$19,588 |
01/26 |
$20,008 |
$22,992 |
$21,322 |
02/26 |
$21,299 |
$24,056 |
$22,494 |
03/26 |
$19,111 |
$21,581 |
$19,556 |
04/26 |
$22,743 |
$23,189 |
$22,433 |
05/26 |
$24,844 |
$23,900 |
$24,606 |
06/26 |
$24,855 |
$23,916 |
$24,259 |
07/26 |
$22,328 |
$24,384 |
$23,514 |
08/26 |
$23,881 |
$24,869 |
$24,305 |
|
| Average Annual Return [Table Text Block] |
Table Summary
Average Annual Total Returns (%) |
1 year |
5 years |
10 years |
Institutional 3 Class |
45.98 |
3.89 |
9.10 |
MSCI EAFE Index (Net) |
21.62 |
9.35 |
9.54 |
MSCI Emerging Markets Index (Net) |
39.25 |
8.18 |
9.29 | |
| No Deduction of Taxes [Text Block] |
Performance does not reflect the deduction of taxes that a shareholder may pay on fund distributions or on the redemptions of fund shares.
|
| Updated Performance Information Location [Text Block] |
columbiathreadneedleus.com/investment-products/mutual-funds
|
| AssetsNet |
$ 839,405,589
|
| Holdings Count | Holding |
87
|
| Advisory Fees Paid, Amount |
$ 8,735,712
|
| InvestmentCompanyPortfolioTurnover |
47.00%
|
| Additional Fund Statistics [Text Block] |
Table Summary
Fund net assets |
$839,405,589 |
Total number of portfolio holdings |
87 |
Management services fees (represents 1.08% of Fund average net assets) |
$8,735,712 |
Portfolio turnover for the reporting period |
47% | |
| Holdings [Text Block] |
Table Summary
Taiwan |
29.3% |
|
South Korea |
24.3% |
|
China |
17.1% |
|
Greece |
6.1% |
|
India |
5.6% |
|
Brazil |
4.2% |
|
South Africa |
4.0% |
|
Mexico |
1.7% |
|
United Kingdom |
1.6% |
|
Turkey |
1.5% |
|
Other |
5.0% |
|
Table Summary
Information Technology |
49.1% |
Financials |
14.9% |
Industrials |
11.7% |
Consumer Discretionary |
6.1% |
Communication Services |
4.1% |
Materials |
4.0% |
Energy |
2.7% |
Real Estate |
2.4% |
Consumer Staples |
2.1% |
Health Care |
1.7% |
Other |
1.2% | |
| Largest Holdings [Text Block] |
Table Summary
Taiwan Semiconductor Manufacturing Co., Ltd. |
15.5% |
Samsung Electronics Co., Ltd. |
8.9% |
SK Hynix, Inc. |
6.7% |
Tencent Holdings Ltd. |
3.0% |
Samsung Electro-Mechanics Co., Ltd. |
2.9% |
Alibaba Group Holding Ltd. |
2.8% |
Unimicron Technology Corp. |
2.6% |
Piraeus Bank SA |
2.1% |
Capitec Ltd. |
2.0% |
Delta Electronics, Inc. |
1.9% | |
| Material Fund Change [Text Block] |
|
| C000253721 |
|
| Shareholder Report [Line Items] |
|
| Fund Name |
Columbia Emerging Markets Fund
|
| Class Name |
Class S
|
| Trading Symbol |
UMEBX
|
| Annual or Semi-Annual Statement [Text Block] |
This annual shareholder report contains important information about Columbia Emerging Markets Fund (the Fund) for the period of September 1, 2025 to August 31, 2026.
|
| Additional Information [Text Block] |
You can find additional information about the Fund at columbiathreadneedleus.com/resources/literature. You can also request more information by contacting us at 1-800-345-6611.
|
| Additional Information Phone Number |
1-800-345-6611
|
| Additional Information Website |
columbiathreadneedleus.com/resources/literature
|
| Expenses [Text Block] |
What were the Fund costs for the reporting period? (Based on a hypothetical $10,000 investment)
Table Summary
Class |
Cost of a $10,000 investment |
Cost paid as a percentage of a $10,000 investment |
Class S |
$138 |
1.12% | |
| Expenses Paid, Amount |
$ 138
|
| Expense Ratio, Percent |
1.12%
|
| Factors Affecting Performance [Text Block] |
Management's Discussion of Fund Performance The performance of Class S shares for the period presented is shown in the Average Annual Total Returns table. Top Performance ContributorsStock selection | Selections in the information technology sector boosted the Fund’s performance relative to the benchmark during the period. Allocations | A larger allocation to the information technology sector and, to a lesser extent, smaller allocations to the consumer discretionary and communication services sectors buoyed the Fund’s relative performance during the period. Individual holdings | Positions in SK Hynix, a South Korean semiconductor devices manufacturer; Unimicron Technology Corp., a Taiwanese manufacturer of circuit boards; Samsung Electro-Mechanics Co., a South Korea-based supplier of high-value electronic components; ASPEED Technology, Inc., a Taiwanese semiconductor devices company; and Elite Material Co., a Taiwanese electronic materials company that supplies critical inputs for semiconductor substrates, were among the top contributors to the Fund’s relative performance. Top Performance DetractorsStock selection | Selections in the consumer discretionary, communication services, financials and materials sectors hurt the Fund’s performance relative to the benchmark during the period. Allocations | Large weightings in the real estate and industrials sectors and a smaller allocation to materials sector detracted from the Fund’s relative performance. Individual holdings | Fund positions in MercadoLibre, Inc., an Argentinian company that operates online marketplaces dedicated to e-commerce and online auctions; Nu Holdings (Nubank), a Brazil-headquartered digital banking and financial services platform; Coupang, Inc. a leading South Korean e-commerce and logistics platform; Eastroc Beverage Co., a leading company in energy drinks and beverages in China; and SK Square Co., a South Korea-based technology holding company that provides exposure to the AI and semiconductor investment cycle, were top detractors from the Fund’s relative performance during the period. |
| Performance Past Does Not Indicate Future [Text] |
The Fund's past performance is not a good predictor of the Fund's future performance.
|
| Line Graph [Table Text Block] |
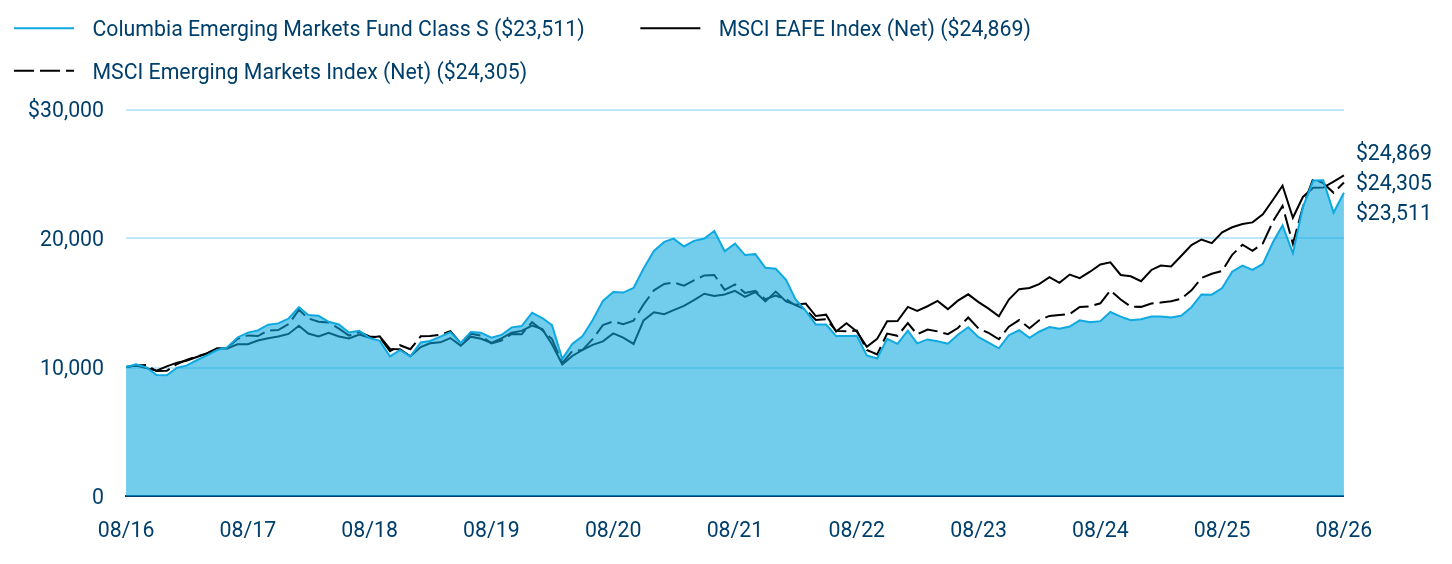
Table Summary
|
Columbia Emerging Markets Fund Class S ($23,511) |
MSCI EAFE Index (Net) ($24,869) |
MSCI Emerging Markets Index (Net) ($24,305) |
08/16 |
$10,000 |
$10,000 |
$10,000 |
09/16 |
$10,209 |
$10,123 |
$10,129 |
10/16 |
$9,980 |
$9,916 |
$10,153 |
11/16 |
$9,384 |
$9,718 |
$9,685 |
12/16 |
$9,364 |
$10,051 |
$9,707 |
01/17 |
$9,950 |
$10,342 |
$10,238 |
02/17 |
$10,109 |
$10,490 |
$10,551 |
03/17 |
$10,526 |
$10,779 |
$10,818 |
04/17 |
$10,904 |
$11,053 |
$11,055 |
05/17 |
$11,321 |
$11,459 |
$11,381 |
06/17 |
$11,519 |
$11,439 |
$11,496 |
07/17 |
$12,294 |
$11,768 |
$12,181 |
08/17 |
$12,671 |
$11,764 |
$12,453 |
09/17 |
$12,840 |
$12,057 |
$12,403 |
10/17 |
$13,287 |
$12,240 |
$12,838 |
11/17 |
$13,386 |
$12,368 |
$12,864 |
12/17 |
$13,761 |
$12,567 |
$13,326 |
01/18 |
$14,648 |
$13,197 |
$14,436 |
02/18 |
$14,030 |
$12,601 |
$13,771 |
03/18 |
$13,970 |
$12,374 |
$13,515 |
04/18 |
$13,512 |
$12,657 |
$13,455 |
05/18 |
$13,303 |
$12,372 |
$12,978 |
06/18 |
$12,675 |
$12,221 |
$12,439 |
07/18 |
$12,814 |
$12,522 |
$12,712 |
08/18 |
$12,246 |
$12,280 |
$12,368 |
09/18 |
$12,037 |
$12,387 |
$12,303 |
10/18 |
$10,821 |
$11,401 |
$11,231 |
11/18 |
$11,310 |
$11,386 |
$11,694 |
12/18 |
$10,834 |
$10,834 |
$11,384 |
01/19 |
$11,901 |
$11,546 |
$12,381 |
02/19 |
$12,021 |
$11,840 |
$12,409 |
03/19 |
$12,360 |
$11,915 |
$12,513 |
04/19 |
$12,700 |
$12,250 |
$12,777 |
05/19 |
$11,872 |
$11,661 |
$11,850 |
06/19 |
$12,710 |
$12,353 |
$12,589 |
07/19 |
$12,660 |
$12,196 |
$12,435 |
08/19 |
$12,271 |
$11,880 |
$11,829 |
09/19 |
$12,490 |
$12,221 |
$12,055 |
10/19 |
$13,079 |
$12,660 |
$12,563 |
11/19 |
$13,178 |
$12,803 |
$12,546 |
12/19 |
$14,204 |
$13,219 |
$13,482 |
01/20 |
$13,803 |
$12,943 |
$12,853 |
02/20 |
$13,243 |
$11,773 |
$12,175 |
03/20 |
$10,630 |
$10,201 |
$10,300 |
04/20 |
$11,791 |
$10,860 |
$11,243 |
05/20 |
$12,402 |
$11,333 |
$11,330 |
06/20 |
$13,633 |
$11,719 |
$12,163 |
07/20 |
$15,125 |
$11,992 |
$13,249 |
08/20 |
$15,815 |
$12,609 |
$13,542 |
09/20 |
$15,775 |
$12,281 |
$13,325 |
10/20 |
$16,136 |
$11,791 |
$13,600 |
11/20 |
$17,637 |
$13,619 |
$14,857 |
12/20 |
$19,007 |
$14,252 |
$15,950 |
01/21 |
$19,705 |
$14,100 |
$16,439 |
02/21 |
$19,959 |
$14,416 |
$16,564 |
03/21 |
$19,351 |
$14,748 |
$16,314 |
04/21 |
$19,786 |
$15,192 |
$16,720 |
05/21 |
$19,969 |
$15,687 |
$17,108 |
06/21 |
$20,546 |
$15,510 |
$17,138 |
07/21 |
$18,976 |
$15,627 |
$15,984 |
08/21 |
$19,564 |
$15,903 |
$16,403 |
09/21 |
$18,683 |
$15,441 |
$15,751 |
10/21 |
$18,754 |
$15,821 |
$15,906 |
11/21 |
$17,700 |
$15,085 |
$15,258 |
12/21 |
$17,621 |
$15,857 |
$15,544 |
01/22 |
$16,768 |
$15,091 |
$15,250 |
02/22 |
$15,256 |
$14,824 |
$14,794 |
03/22 |
$14,362 |
$14,919 |
$14,460 |
04/22 |
$13,303 |
$13,954 |
$13,656 |
05/22 |
$13,293 |
$14,059 |
$13,716 |
06/22 |
$12,398 |
$12,754 |
$12,804 |
07/22 |
$12,398 |
$13,390 |
$12,773 |
08/22 |
$12,419 |
$12,754 |
$12,826 |
09/22 |
$10,897 |
$11,561 |
$11,323 |
10/22 |
$10,661 |
$12,182 |
$10,971 |
11/22 |
$12,193 |
$13,555 |
$12,598 |
12/22 |
$11,802 |
$13,565 |
$12,421 |
01/23 |
$12,830 |
$14,664 |
$13,402 |
02/23 |
$11,833 |
$14,358 |
$12,533 |
03/23 |
$12,141 |
$14,714 |
$12,913 |
04/23 |
$11,997 |
$15,129 |
$12,766 |
05/23 |
$11,812 |
$14,489 |
$12,552 |
06/23 |
$12,511 |
$15,148 |
$13,028 |
07/23 |
$13,087 |
$15,639 |
$13,839 |
08/23 |
$12,316 |
$15,039 |
$12,987 |
09/23 |
$11,895 |
$14,526 |
$12,647 |
10/23 |
$11,452 |
$13,937 |
$12,156 |
11/23 |
$12,470 |
$15,230 |
$13,129 |
12/23 |
$12,851 |
$16,040 |
$13,642 |
01/24 |
$12,265 |
$16,132 |
$13,008 |
02/24 |
$12,738 |
$16,427 |
$13,627 |
03/24 |
$13,097 |
$16,967 |
$13,965 |
04/24 |
$12,964 |
$16,533 |
$14,027 |
05/24 |
$13,138 |
$17,173 |
$14,107 |
06/24 |
$13,622 |
$16,896 |
$14,663 |
07/24 |
$13,478 |
$17,392 |
$14,707 |
08/24 |
$13,560 |
$17,957 |
$14,944 |
09/24 |
$14,269 |
$18,123 |
$15,942 |
10/24 |
$13,910 |
$17,138 |
$15,233 |
11/24 |
$13,632 |
$17,040 |
$14,686 |
12/24 |
$13,714 |
$16,653 |
$14,666 |
01/25 |
$13,922 |
$17,528 |
$14,928 |
02/25 |
$13,911 |
$17,868 |
$15,000 |
03/25 |
$13,849 |
$17,796 |
$15,095 |
04/25 |
$13,974 |
$18,611 |
$15,293 |
05/25 |
$14,640 |
$19,462 |
$15,946 |
06/25 |
$15,630 |
$19,891 |
$16,905 |
07/25 |
$15,609 |
$19,612 |
$17,234 |
08/25 |
$16,119 |
$20,448 |
$17,455 |
09/25 |
$17,389 |
$20,839 |
$18,704 |
10/25 |
$17,868 |
$21,085 |
$19,485 |
11/25 |
$17,535 |
$21,216 |
$19,019 |
12/25 |
$17,992 |
$21,852 |
$19,588 |
01/26 |
$19,711 |
$22,992 |
$21,322 |
02/26 |
$20,982 |
$24,056 |
$22,494 |
03/26 |
$18,824 |
$21,581 |
$19,556 |
04/26 |
$22,405 |
$23,189 |
$22,433 |
05/26 |
$24,464 |
$23,900 |
$24,606 |
06/26 |
$24,475 |
$23,916 |
$24,259 |
07/26 |
$21,978 |
$24,384 |
$23,514 |
08/26 |
$23,511 |
$24,869 |
$24,305 |
|
| Average Annual Return [Table Text Block] |
Table Summary
Average Annual Total Returns (%) |
1 year |
5 years |
10 years |
Class SFootnote Reference(a) |
45.86 |
3.74 |
8.92 |
MSCI EAFE Index (Net) |
21.62 |
9.35 |
9.54 |
MSCI Emerging Markets Index (Net) |
39.25 |
8.18 |
9.29 | |
| No Deduction of Taxes [Text Block] |
Performance does not reflect the deduction of taxes that a shareholder may pay on fund distributions or on the redemptions of fund shares.
|
| Updated Performance Information Location [Text Block] |
columbiathreadneedleus.com/investment-products/mutual-funds
|
| AssetsNet |
$ 839,405,589
|
| Holdings Count | Holding |
87
|
| Advisory Fees Paid, Amount |
$ 8,735,712
|
| InvestmentCompanyPortfolioTurnover |
47.00%
|
| Additional Fund Statistics [Text Block] |
Table Summary
Fund net assets |
$839,405,589 |
Total number of portfolio holdings |
87 |
Management services fees (represents 1.08% of Fund average net assets) |
$8,735,712 |
Portfolio turnover for the reporting period |
47% | |
| Holdings [Text Block] |
Table Summary
Taiwan |
29.3% |
|
South Korea |
24.3% |
|
China |
17.1% |
|
Greece |
6.1% |
|
India |
5.6% |
|
Brazil |
4.2% |
|
South Africa |
4.0% |
|
Mexico |
1.7% |
|
United Kingdom |
1.6% |
|
Turkey |
1.5% |
|
Other |
5.0% |
|
Table Summary
Information Technology |
49.1% |
Financials |
14.9% |
Industrials |
11.7% |
Consumer Discretionary |
6.1% |
Communication Services |
4.1% |
Materials |
4.0% |
Energy |
2.7% |
Real Estate |
2.4% |
Consumer Staples |
2.1% |
Health Care |
1.7% |
Other |
1.2% | |
| Largest Holdings [Text Block] |
Table Summary
Taiwan Semiconductor Manufacturing Co., Ltd. |
15.5% |
Samsung Electronics Co., Ltd. |
8.9% |
SK Hynix, Inc. |
6.7% |
Tencent Holdings Ltd. |
3.0% |
Samsung Electro-Mechanics Co., Ltd. |
2.9% |
Alibaba Group Holding Ltd. |
2.8% |
Unimicron Technology Corp. |
2.6% |
Piraeus Bank SA |
2.1% |
Capitec Ltd. |
2.0% |
Delta Electronics, Inc. |
1.9% | |
| Material Fund Change [Text Block] |
|
| C000032877 |
|
| Shareholder Report [Line Items] |
|
| Fund Name |
Columbia Global Technology Growth Fund
|
| Class Name |
Class A
|
| Trading Symbol |
CTCAX
|
| Annual or Semi-Annual Statement [Text Block] |
This annual shareholder report contains important information about Columbia Global Technology Growth Fund (the Fund) for the period of September 1, 2025 to August 31, 2026.
|
| Additional Information [Text Block] |
You can find additional information about the Fund at columbiathreadneedleus.com/resources/literature. You can also request more information by contacting us at 1-800-345-6611.
|
| Additional Information Phone Number |
1-800-345-6611
|
| Additional Information Website |
columbiathreadneedleus.com/resources/literature
|
| Expenses [Text Block] |
What were the Fund costs for the reporting period? (Based on a hypothetical $10,000 investment)
Table Summary
Class |
Cost of a $10,000 investment |
Cost paid as a percentage of a $10,000 investment |
Class A |
$136 |
1.15% | |
| Expenses Paid, Amount |
$ 136
|
| Expense Ratio, Percent |
1.15%
|
| Factors Affecting Performance [Text Block] |
Management's Discussion of Fund Performance The performance of Class A shares for the period presented is shown in the Average Annual Total Returns table. Top Performance ContributorsStock selection | Selections in the semiconductors and semiconductor equipment, technology hardware storage and peripherals, and IT services industries added to the Fund’s performance relative to the benchmark during the period. Allocations | An underweight allocation to software greatly contributed. An allocation to IT services also boosted the Fund’s relative performance during the period. Individual holdings | Positions in Lam Research, a semiconductor fabrication equipment manufacturer; Micron Technology, a memory and storage solutions provider; NVIDIA, a leading designer of GPUs and AI computing platforms; Broadcom, a global semiconductor and infrastructure software solutions provider; and Apple, a consumer technology hardware and services provider, were top contributors during the period. Top Performance DetractorsStock selection | Selections in the software and communications equipment industries hurt the Fund’s relative performance during the period. Allocations | Out-of-benchmark allocations to the entertainment, financial services, and interactive media and services industries, as well as an underweight to the technology hardware storage and peripherals industry, detracted from the Fund’s relative performance during the period. Individual holdings | Positions in Synopsys, an electronic design automation software provider; Meta Platforms, a social media and digital advertising provider; Intuit, a financial and tax software provider; Microsoft, a global software, cloud, and enterprise technology provider; and Netflix, a streaming entertainment provider, were top detractors from the Fund’s relative performance during the period. |
| Performance Past Does Not Indicate Future [Text] |
The Fund's past performance is not a good predictor of the Fund's future performance.
|
| Line Graph [Table Text Block] |
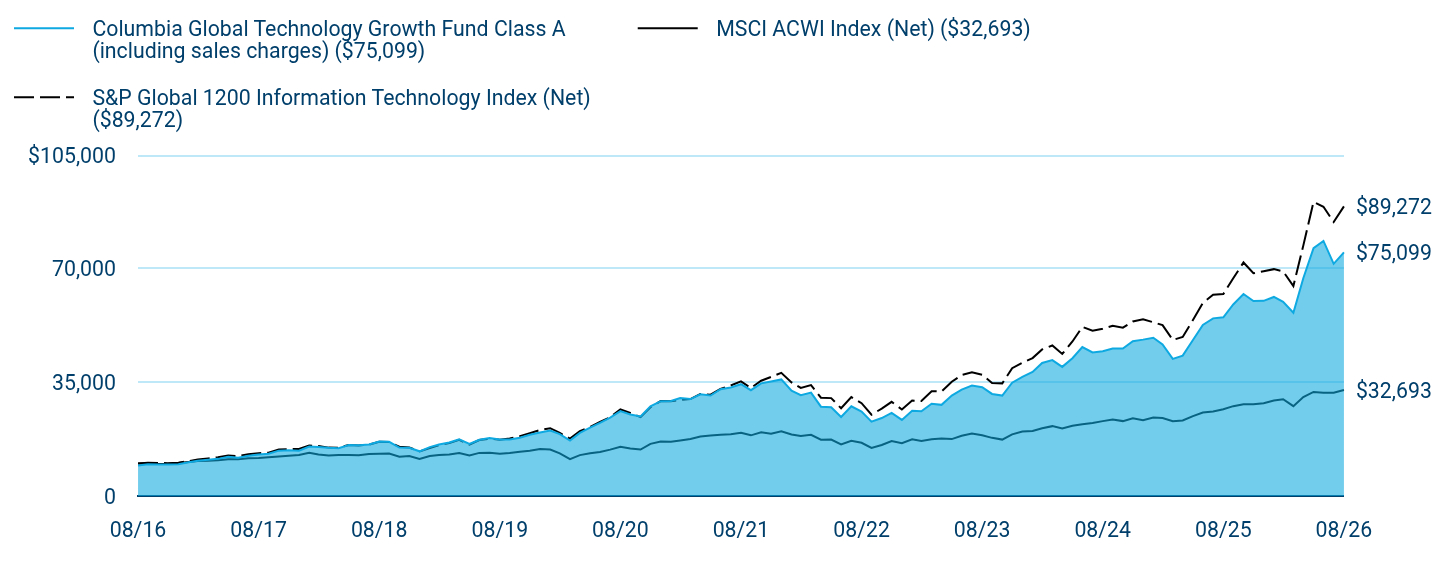
Table Summary
|
Columbia Global Technology Growth Fund Class A (including sales charges) ($75,099) |
MSCI ACWI Index (Net) ($32,693) |
S&P Global 1200 Information Technology Index (Net) ($89,272) |
08/16 |
$9,426 |
$10,000 |
$10,000 |
09/16 |
$9,755 |
$10,061 |
$10,253 |
10/16 |
$9,680 |
$9,890 |
$10,203 |
11/16 |
$9,715 |
$9,966 |
$10,119 |
12/16 |
$9,768 |
$10,181 |
$10,261 |
01/17 |
$10,380 |
$10,459 |
$10,760 |
02/17 |
$10,831 |
$10,753 |
$11,220 |
03/17 |
$11,161 |
$10,884 |
$11,582 |
04/17 |
$11,447 |
$11,054 |
$11,910 |
05/17 |
$12,090 |
$11,298 |
$12,474 |
06/17 |
$11,800 |
$11,349 |
$12,279 |
07/17 |
$12,398 |
$11,667 |
$12,836 |
08/17 |
$12,764 |
$11,711 |
$13,188 |
09/17 |
$13,041 |
$11,937 |
$13,348 |
10/17 |
$13,983 |
$12,185 |
$14,348 |
11/17 |
$14,068 |
$12,421 |
$14,470 |
12/17 |
$13,962 |
$12,622 |
$14,483 |
01/18 |
$15,224 |
$13,334 |
$15,550 |
02/18 |
$15,094 |
$12,774 |
$15,412 |
03/18 |
$14,877 |
$12,500 |
$14,912 |
04/18 |
$14,748 |
$12,620 |
$14,897 |
05/18 |
$15,713 |
$12,635 |
$15,746 |
06/18 |
$15,635 |
$12,567 |
$15,583 |
07/18 |
$15,907 |
$12,946 |
$15,844 |
08/18 |
$16,762 |
$13,048 |
$16,747 |
09/18 |
$16,688 |
$13,104 |
$16,616 |
10/18 |
$14,919 |
$12,122 |
$15,201 |
11/18 |
$14,877 |
$12,300 |
$14,916 |
12/18 |
$13,775 |
$11,433 |
$13,762 |
01/19 |
$15,060 |
$12,336 |
$14,768 |
02/19 |
$15,867 |
$12,666 |
$15,637 |
03/19 |
$16,473 |
$12,825 |
$16,292 |
04/19 |
$17,499 |
$13,258 |
$17,298 |
05/19 |
$16,028 |
$12,472 |
$15,829 |
06/19 |
$17,314 |
$13,289 |
$17,235 |
07/19 |
$17,871 |
$13,327 |
$17,654 |
08/19 |
$17,446 |
$13,011 |
$17,345 |
09/19 |
$17,421 |
$13,285 |
$17,720 |
10/19 |
$17,978 |
$13,649 |
$18,458 |
11/19 |
$18,878 |
$13,982 |
$19,362 |
12/19 |
$19,562 |
$14,474 |
$20,331 |
01/20 |
$20,152 |
$14,314 |
$20,896 |
02/20 |
$19,072 |
$13,158 |
$19,449 |
03/20 |
$17,092 |
$11,382 |
$17,679 |
04/20 |
$19,429 |
$12,601 |
$19,962 |
05/20 |
$21,053 |
$13,149 |
$21,281 |
06/20 |
$22,513 |
$13,569 |
$22,827 |
07/20 |
$24,142 |
$14,287 |
$24,281 |
08/20 |
$26,148 |
$15,161 |
$26,676 |
09/20 |
$25,118 |
$14,672 |
$25,585 |
10/20 |
$24,519 |
$14,316 |
$24,313 |
11/20 |
$27,653 |
$16,080 |
$27,351 |
12/20 |
$29,235 |
$16,827 |
$29,265 |
01/21 |
$29,305 |
$16,751 |
$29,214 |
02/21 |
$30,205 |
$17,138 |
$29,584 |
03/21 |
$29,870 |
$17,596 |
$29,887 |
04/21 |
$31,339 |
$18,366 |
$31,453 |
05/21 |
$30,974 |
$18,651 |
$31,227 |
06/21 |
$32,903 |
$18,897 |
$33,016 |
07/21 |
$33,468 |
$19,027 |
$34,060 |
08/21 |
$34,462 |
$19,504 |
$35,324 |
09/21 |
$32,608 |
$18,698 |
$33,280 |
10/21 |
$34,727 |
$19,652 |
$35,531 |
11/21 |
$35,282 |
$19,179 |
$36,692 |
12/21 |
$35,924 |
$19,946 |
$37,955 |
01/22 |
$32,432 |
$18,967 |
$35,023 |
02/22 |
$31,098 |
$18,477 |
$33,317 |
03/22 |
$31,864 |
$18,877 |
$34,173 |
04/22 |
$27,533 |
$17,366 |
$30,307 |
05/22 |
$27,335 |
$17,386 |
$30,168 |
06/22 |
$24,333 |
$15,921 |
$27,046 |
07/22 |
$27,664 |
$17,033 |
$30,481 |
08/22 |
$25,996 |
$16,406 |
$28,597 |
09/22 |
$22,916 |
$14,835 |
$25,053 |
10/22 |
$24,036 |
$15,730 |
$26,937 |
11/22 |
$25,636 |
$16,950 |
$29,026 |
12/22 |
$23,451 |
$16,283 |
$26,681 |
01/23 |
$26,275 |
$17,450 |
$29,429 |
02/23 |
$26,097 |
$16,950 |
$29,284 |
03/23 |
$28,441 |
$17,473 |
$32,305 |
04/23 |
$28,091 |
$17,724 |
$32,199 |
05/23 |
$30,953 |
$17,534 |
$35,217 |
06/23 |
$32,796 |
$18,552 |
$37,280 |
07/23 |
$34,047 |
$19,232 |
$38,105 |
08/23 |
$33,529 |
$18,694 |
$37,362 |
09/23 |
$31,460 |
$17,921 |
$34,835 |
10/23 |
$30,958 |
$17,382 |
$34,718 |
11/23 |
$34,925 |
$18,987 |
$39,381 |
12/23 |
$36,687 |
$19,899 |
$41,070 |
01/24 |
$38,237 |
$20,015 |
$42,518 |
02/24 |
$41,013 |
$20,874 |
$45,172 |
03/24 |
$41,884 |
$21,530 |
$46,386 |
04/24 |
$39,799 |
$20,819 |
$43,786 |
05/24 |
$42,480 |
$21,665 |
$47,637 |
06/24 |
$45,901 |
$22,147 |
$52,114 |
07/24 |
$44,251 |
$22,504 |
$50,956 |
08/24 |
$44,638 |
$23,076 |
$51,530 |
09/24 |
$45,438 |
$23,612 |
$52,488 |
10/24 |
$45,438 |
$23,082 |
$51,892 |
11/24 |
$47,700 |
$23,945 |
$53,793 |
12/24 |
$48,194 |
$23,379 |
$54,439 |
01/25 |
$48,791 |
$24,163 |
$53,557 |
02/25 |
$46,722 |
$24,018 |
$52,662 |
03/25 |
$42,262 |
$23,069 |
$48,104 |
04/25 |
$43,277 |
$23,284 |
$49,021 |
05/25 |
$48,077 |
$24,622 |
$54,219 |
06/25 |
$52,710 |
$25,728 |
$59,485 |
07/25 |
$54,750 |
$26,077 |
$62,031 |
08/25 |
$55,079 |
$26,721 |
$62,251 |
09/25 |
$59,037 |
$27,689 |
$67,109 |
10/25 |
$62,243 |
$28,308 |
$71,973 |
11/25 |
$60,102 |
$28,305 |
$68,670 |
12/25 |
$60,159 |
$28,601 |
$69,266 |
01/26 |
$61,351 |
$29,449 |
$69,920 |
02/26 |
$59,848 |
$29,827 |
$69,236 |
03/26 |
$56,488 |
$27,685 |
$64,717 |
04/26 |
$67,102 |
$30,502 |
$77,170 |
05/26 |
$76,384 |
$32,075 |
$90,671 |
06/26 |
$78,608 |
$31,818 |
$89,156 |
07/26 |
$71,567 |
$31,842 |
$84,448 |
08/26 |
$75,099 |
$32,693 |
$89,272 |
|
| Average Annual Return [Table Text Block] |
Table Summary
Average Annual Total Returns (%) |
1 year |
5 years |
10 years |
Class A (excluding sales charges) |
36.35 |
16.86 |
23.06 |
Class A (including sales charges) |
28.51 |
15.48 |
22.34 |
MSCI ACWI Index (Net) |
22.35 |
10.88 |
12.58 |
S&P Global 1200 Information Technology Index (Net) |
43.41 |
20.37 |
24.47 | |
| No Deduction of Taxes [Text Block] |
Performance does not reflect the deduction of taxes that a shareholder may pay on fund distributions or on the redemptions of fund shares.
|
| Updated Performance Information Location [Text Block] |
columbiathreadneedleus.com/investment-products/mutual-funds
|
| AssetsNet |
$ 5,398,705,730
|
| Holdings Count | Holding |
101
|
| Advisory Fees Paid, Amount |
$ 37,571,623
|
| InvestmentCompanyPortfolioTurnover |
10.00%
|
| Additional Fund Statistics [Text Block] |
Table Summary
Fund net assets |
$5,398,705,730 |
Total number of portfolio holdings |
101 |
Management services fees (represents 0.78% of Fund average net assets) |
$37,571,623 |
Portfolio turnover for the reporting period |
10% | |
| Holdings [Text Block] |
Information Technology Sub-Industry Allocation
Table Summary
Semiconductors |
37.8% |
Technology Hardware, Storage & Peripherals |
12.2% |
Semiconductor Materials & Equipment |
11.8% |
Systems Software |
10.7% |
Application Software |
4.1% |
Communications Equipment |
2.7% |
Internet Services & Infrastructure |
1.8% |
Electronic Components |
1.2% |
Other |
1.4% |
Table Summary
Information Technology |
83.7% |
Communication Services |
7.3% |
Consumer Discretionary |
3.6% |
Financials |
3.6% |
Industrials |
0.7% | |
| Largest Holdings [Text Block] |
Table Summary
NVIDIA Corp. |
14.2% |
Apple, Inc. |
7.6% |
Broadcom, Inc. |
7.5% |
Microsoft Corp. |
6.6% |
Lam Research Corp. |
6.1% |
Micron Technology, Inc. |
5.7% |
Alphabet, Inc., Class A |
3.8% |
Taiwan Semiconductor Manufacturing Co., Ltd., ADR |
3.7% |
Amazon.com, Inc. |
2.7% |
Applied Materials, Inc. |
2.6% | |
| Material Fund Change [Text Block] |
|
| C000032879 |
|
| Shareholder Report [Line Items] |
|
| Fund Name |
Columbia Global Technology Growth Fund
|
| Class Name |
Class C
|
| Trading Symbol |
CTHCX
|
| Annual or Semi-Annual Statement [Text Block] |
This annual shareholder report contains important information about Columbia Global Technology Growth Fund (the Fund) for the period of September 1, 2025 to August 31, 2026.
|
| Additional Information [Text Block] |
You can find additional information about the Fund at columbiathreadneedleus.com/resources/literature. You can also request more information by contacting us at 1-800-345-6611.
|
| Additional Information Phone Number |
1-800-345-6611
|
| Additional Information Website |
columbiathreadneedleus.com/resources/literature
|
| Expenses [Text Block] |
What were the Fund costs for the reporting period? (Based on a hypothetical $10,000 investment)
Table Summary
Class |
Cost of a $10,000 investment |
Cost paid as a percentage of a $10,000 investment |
Class C |
$224 |
1.90% | |
| Expenses Paid, Amount |
$ 224
|
| Expense Ratio, Percent |
1.90%
|
| Factors Affecting Performance [Text Block] |
Management's Discussion of Fund Performance The performance of Class C shares for the period presented is shown in the Average Annual Total Returns table. Top Performance ContributorsStock selection | Selections in the semiconductors and semiconductor equipment, technology hardware storage and peripherals, and IT services industries added to the Fund’s performance relative to the benchmark during the period. Allocations | An underweight allocation to software greatly contributed. An allocation to IT services also boosted the Fund’s relative performance during the period. Individual holdings | Positions in Lam Research, a semiconductor fabrication equipment manufacturer; Micron Technology, a memory and storage solutions provider; NVIDIA, a leading designer of GPUs and AI computing platforms; Broadcom, a global semiconductor and infrastructure software solutions provider; and Apple, a consumer technology hardware and services provider, were top contributors during the period. Top Performance DetractorsStock selection | Selections in the software and communications equipment industries hurt the Fund’s relative performance during the period. Allocations | Out-of-benchmark allocations to the entertainment, financial services, and interactive media and services industries, as well as an underweight to the technology hardware storage and peripherals industry, detracted from the Fund’s relative performance during the period. Individual holdings | Positions in Synopsys, an electronic design automation software provider; Meta Platforms, a social media and digital advertising provider; Intuit, a financial and tax software provider; Microsoft, a global software, cloud, and enterprise technology provider; and Netflix, a streaming entertainment provider, were top detractors from the Fund’s relative performance during the period. |
| Performance Past Does Not Indicate Future [Text] |
The Fund's past performance is not a good predictor of the Fund's future performance.
|
| Line Graph [Table Text Block] |
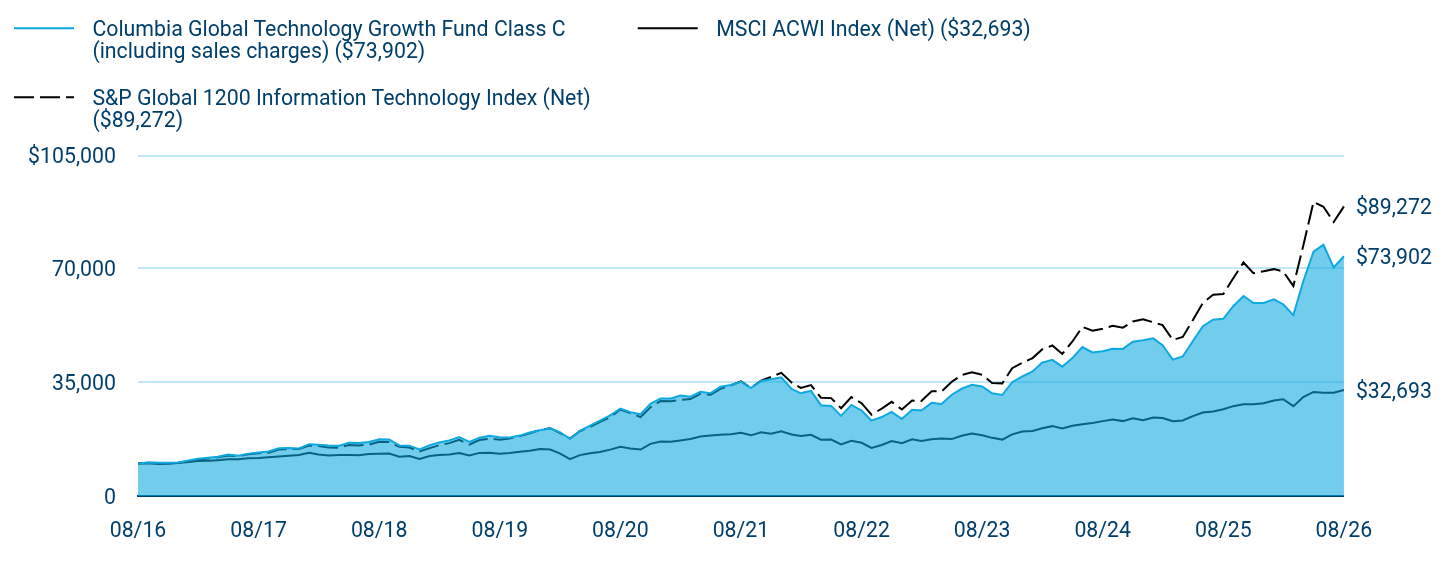
Table Summary
|
Columbia Global Technology Growth Fund Class C (including sales charges) ($73,902) |
MSCI ACWI Index (Net) ($32,693) |
S&P Global 1200 Information Technology Index (Net) ($89,272) |
08/16 |
$10,000 |
$10,000 |
$10,000 |
09/16 |
$10,343 |
$10,061 |
$10,253 |
10/16 |
$10,254 |
$9,890 |
$10,203 |
11/16 |
$10,286 |
$9,966 |
$10,119 |
12/16 |
$10,332 |
$10,181 |
$10,261 |
01/17 |
$10,973 |
$10,459 |
$10,760 |
02/17 |
$11,447 |
$10,753 |
$11,220 |
03/17 |
$11,786 |
$10,884 |
$11,582 |
04/17 |
$12,078 |
$11,054 |
$11,910 |
05/17 |
$12,756 |
$11,298 |
$12,474 |
06/17 |
$12,438 |
$11,349 |
$12,279 |
07/17 |
$13,063 |
$11,667 |
$12,836 |
08/17 |
$13,439 |
$11,711 |
$13,188 |
09/17 |
$13,725 |
$11,937 |
$13,348 |
10/17 |
$14,705 |
$12,185 |
$14,348 |
11/17 |
$14,784 |
$12,421 |
$14,470 |
12/17 |
$14,665 |
$12,622 |
$14,483 |
01/18 |
$15,979 |
$13,334 |
$15,550 |
02/18 |
$15,833 |
$12,774 |
$15,412 |
03/18 |
$15,596 |
$12,500 |
$14,912 |
04/18 |
$15,451 |
$12,620 |
$14,897 |
05/18 |
$16,447 |
$12,635 |
$15,746 |
06/18 |
$16,355 |
$12,567 |
$15,583 |
07/18 |
$16,630 |
$12,946 |
$15,844 |
08/18 |
$17,512 |
$13,048 |
$16,747 |
09/18 |
$17,426 |
$13,104 |
$16,616 |
10/18 |
$15,570 |
$12,122 |
$15,201 |
11/18 |
$15,516 |
$12,300 |
$14,916 |
12/18 |
$14,358 |
$11,433 |
$13,762 |
01/19 |
$15,686 |
$12,336 |
$14,768 |
02/19 |
$16,520 |
$12,666 |
$15,637 |
03/19 |
$17,138 |
$12,825 |
$16,292 |
04/19 |
$18,194 |
$13,258 |
$17,298 |
05/19 |
$16,656 |
$12,472 |
$15,829 |
06/19 |
$17,978 |
$13,289 |
$17,235 |
07/19 |
$18,546 |
$13,327 |
$17,654 |
08/19 |
$18,092 |
$13,011 |
$17,345 |
09/19 |
$18,058 |
$13,285 |
$17,720 |
10/19 |
$18,620 |
$13,649 |
$18,458 |
11/19 |
$19,545 |
$13,982 |
$19,362 |
12/19 |
$20,237 |
$14,474 |
$20,331 |
01/20 |
$20,836 |
$14,314 |
$20,896 |
02/20 |
$19,708 |
$13,158 |
$19,449 |
03/20 |
$17,652 |
$11,382 |
$17,679 |
04/20 |
$20,053 |
$12,601 |
$19,962 |
05/20 |
$21,711 |
$13,149 |
$21,281 |
06/20 |
$23,202 |
$13,569 |
$22,827 |
07/20 |
$24,866 |
$14,287 |
$24,281 |
08/20 |
$26,916 |
$15,161 |
$26,676 |
09/20 |
$25,839 |
$14,672 |
$25,585 |
10/20 |
$25,206 |
$14,316 |
$24,313 |
11/20 |
$28,413 |
$16,080 |
$27,351 |
12/20 |
$30,017 |
$16,827 |
$29,265 |
01/21 |
$30,069 |
$16,751 |
$29,214 |
02/21 |
$30,983 |
$17,138 |
$29,584 |
03/21 |
$30,616 |
$17,596 |
$29,887 |
04/21 |
$32,100 |
$18,366 |
$31,453 |
05/21 |
$31,710 |
$18,651 |
$31,227 |
06/21 |
$33,659 |
$18,897 |
$33,016 |
07/21 |
$34,218 |
$19,027 |
$34,060 |
08/21 |
$35,207 |
$19,504 |
$35,324 |
09/21 |
$33,292 |
$18,698 |
$33,280 |
10/21 |
$35,439 |
$19,652 |
$35,531 |
11/21 |
$35,980 |
$19,179 |
$36,692 |
12/21 |
$36,609 |
$19,946 |
$37,955 |
01/22 |
$33,031 |
$18,967 |
$35,023 |
02/22 |
$31,651 |
$18,477 |
$33,317 |
03/22 |
$32,414 |
$18,877 |
$34,173 |
04/22 |
$27,989 |
$17,366 |
$30,307 |
05/22 |
$27,771 |
$17,386 |
$30,168 |
06/22 |
$24,702 |
$15,921 |
$27,046 |
07/22 |
$28,068 |
$17,033 |
$30,481 |
08/22 |
$26,361 |
$16,406 |
$28,597 |
09/22 |
$23,219 |
$14,835 |
$25,053 |
10/22 |
$24,345 |
$15,730 |
$26,937 |
11/22 |
$25,943 |
$16,950 |
$29,026 |
12/22 |
$23,719 |
$16,283 |
$26,681 |
01/23 |
$26,563 |
$17,450 |
$29,429 |
02/23 |
$26,361 |
$16,950 |
$29,284 |
03/23 |
$28,714 |
$17,473 |
$32,305 |
04/23 |
$28,343 |
$17,724 |
$32,199 |
05/23 |
$31,212 |
$17,534 |
$35,217 |
06/23 |
$33,049 |
$18,552 |
$37,280 |
07/23 |
$34,289 |
$19,232 |
$38,105 |
08/23 |
$33,741 |
$18,694 |
$37,362 |
09/23 |
$31,640 |
$17,921 |
$34,835 |
10/23 |
$31,118 |
$17,382 |
$34,718 |
11/23 |
$35,088 |
$18,987 |
$39,381 |
12/23 |
$36,836 |
$19,899 |
$41,070 |
01/24 |
$38,368 |
$20,015 |
$42,518 |
02/24 |
$41,122 |
$20,874 |
$45,172 |
03/24 |
$41,976 |
$21,530 |
$46,386 |
04/24 |
$39,855 |
$20,819 |
$43,786 |
05/24 |
$42,519 |
$21,665 |
$47,637 |
06/24 |
$45,914 |
$22,147 |
$52,114 |
07/24 |
$44,233 |
$22,504 |
$50,956 |
08/24 |
$44,588 |
$23,076 |
$51,530 |
09/24 |
$45,364 |
$23,612 |
$52,488 |
10/24 |
$45,332 |
$23,082 |
$51,892 |
11/24 |
$47,556 |
$23,945 |
$53,793 |
12/24 |
$48,025 |
$23,379 |
$54,439 |
01/25 |
$48,588 |
$24,163 |
$53,557 |
02/25 |
$46,500 |
$24,018 |
$52,662 |
03/25 |
$42,036 |
$23,069 |
$48,104 |
04/25 |
$43,012 |
$23,284 |
$49,021 |
05/25 |
$47,757 |
$24,622 |
$54,219 |
06/25 |
$52,325 |
$25,728 |
$59,485 |
07/25 |
$54,321 |
$26,077 |
$62,031 |
08/25 |
$54,609 |
$26,721 |
$62,251 |
09/25 |
$58,496 |
$27,689 |
$67,109 |
10/25 |
$61,631 |
$28,308 |
$71,973 |
11/25 |
$59,478 |
$28,305 |
$68,670 |
12/25 |
$59,499 |
$28,601 |
$69,266 |
01/26 |
$60,635 |
$29,449 |
$69,920 |
02/26 |
$59,117 |
$29,827 |
$69,236 |
03/26 |
$55,762 |
$27,685 |
$64,717 |
04/26 |
$66,203 |
$30,502 |
$77,170 |
05/26 |
$75,311 |
$32,075 |
$90,671 |
06/26 |
$77,448 |
$31,818 |
$89,156 |
07/26 |
$70,471 |
$31,842 |
$84,448 |
08/26 |
$73,902 |
$32,693 |
$89,272 |
|
| Average Annual Return [Table Text Block] |
Table Summary
Average Annual Total Returns (%) |
1 year |
5 years |
10 years |
Class C (excluding sales charges) |
35.33 |
15.99 |
22.14 |
Class C (including sales charges) |
34.33 |
15.99 |
22.14 |
MSCI ACWI Index (Net) |
22.35 |
10.88 |
12.58 |
S&P Global 1200 Information Technology Index (Net) |
43.41 |
20.37 |
24.47 | |
| No Deduction of Taxes [Text Block] |
Performance does not reflect the deduction of taxes that a shareholder may pay on fund distributions or on the redemptions of fund shares.
|
| Updated Performance Information Location [Text Block] |
columbiathreadneedleus.com/investment-products/mutual-funds
|
| AssetsNet |
$ 5,398,705,730
|
| Holdings Count | Holding |
101
|
| Advisory Fees Paid, Amount |
$ 37,571,623
|
| InvestmentCompanyPortfolioTurnover |
10.00%
|
| Additional Fund Statistics [Text Block] |
Table Summary
Fund net assets |
$5,398,705,730 |
Total number of portfolio holdings |
101 |
Management services fees (represents 0.78% of Fund average net assets) |
$37,571,623 |
Portfolio turnover for the reporting period |
10% | |
| Holdings [Text Block] |
Information Technology Sub-Industry Allocation
Table Summary
Semiconductors |
37.8% |
Technology Hardware, Storage & Peripherals |
12.2% |
Semiconductor Materials & Equipment |
11.8% |
Systems Software |
10.7% |
Application Software |
4.1% |
Communications Equipment |
2.7% |
Internet Services & Infrastructure |
1.8% |
Electronic Components |
1.2% |
Other |
1.4% |
Table Summary
Information Technology |
83.7% |
Communication Services |
7.3% |
Consumer Discretionary |
3.6% |
Financials |
3.6% |
Industrials |
0.7% | |
| Largest Holdings [Text Block] |
Table Summary
NVIDIA Corp. |
14.2% |
Apple, Inc. |
7.6% |
Broadcom, Inc. |
7.5% |
Microsoft Corp. |
6.6% |
Lam Research Corp. |
6.1% |
Micron Technology, Inc. |
5.7% |
Alphabet, Inc., Class A |
3.8% |
Taiwan Semiconductor Manufacturing Co., Ltd., ADR |
3.7% |
Amazon.com, Inc. |
2.7% |
Applied Materials, Inc. |
2.6% | |
| Material Fund Change [Text Block] |
|
| C000032881 |
|
| Shareholder Report [Line Items] |
|
| Fund Name |
Columbia Global Technology Growth Fund
|
| Class Name |
Institutional Class
|
| Trading Symbol |
CMTFX
|
| Annual or Semi-Annual Statement [Text Block] |
This annual shareholder report contains important information about Columbia Global Technology Growth Fund (the Fund) for the period of September 1, 2025 to August 31, 2026.
|
| Additional Information [Text Block] |
You can find additional information about the Fund at columbiathreadneedleus.com/resources/literature. You can also request more information by contacting us at 1-800-345-6611.
|
| Additional Information Phone Number |
1-800-345-6611
|
| Additional Information Website |
columbiathreadneedleus.com/resources/literature
|
| Expenses [Text Block] |
What were the Fund costs for the reporting period? (Based on a hypothetical $10,000 investment)
Table Summary
Class |
Cost of a $10,000 investment |
Cost paid as a percentage of a $10,000 investment |
Institutional Class |
$107 |
0.90% | |
| Expenses Paid, Amount |
$ 107
|
| Expense Ratio, Percent |
0.90%
|
| Factors Affecting Performance [Text Block] |
Management's Discussion of Fund Performance The performance of Institutional Class shares for the period presented is shown in the Average Annual Total Returns table. Top Performance ContributorsStock selection | Selections in the semiconductors and semiconductor equipment, technology hardware storage and peripherals, and IT services industries added to the Fund’s performance relative to the benchmark during the period. Allocations | An underweight allocation to software greatly contributed. An allocation to IT services also boosted the Fund’s relative performance during the period. Individual holdings | Positions in Lam Research, a semiconductor fabrication equipment manufacturer; Micron Technology, a memory and storage solutions provider; NVIDIA, a leading designer of GPUs and AI computing platforms; Broadcom, a global semiconductor and infrastructure software solutions provider; and Apple, a consumer technology hardware and services provider, were top contributors during the period. Top Performance DetractorsStock selection | Selections in the software and communications equipment industries hurt the Fund’s relative performance during the period. Allocations | Out-of-benchmark allocations to the entertainment, financial services, and interactive media and services industries, as well as an underweight to the technology hardware storage and peripherals industry, detracted from the Fund’s relative performance during the period. Individual holdings | Positions in Synopsys, an electronic design automation software provider; Meta Platforms, a social media and digital advertising provider; Intuit, a financial and tax software provider; Microsoft, a global software, cloud, and enterprise technology provider; and Netflix, a streaming entertainment provider, were top detractors from the Fund’s relative performance during the period. |
| Performance Past Does Not Indicate Future [Text] |
The Fund's past performance is not a good predictor of the Fund's future performance.
|
| Line Graph [Table Text Block] |
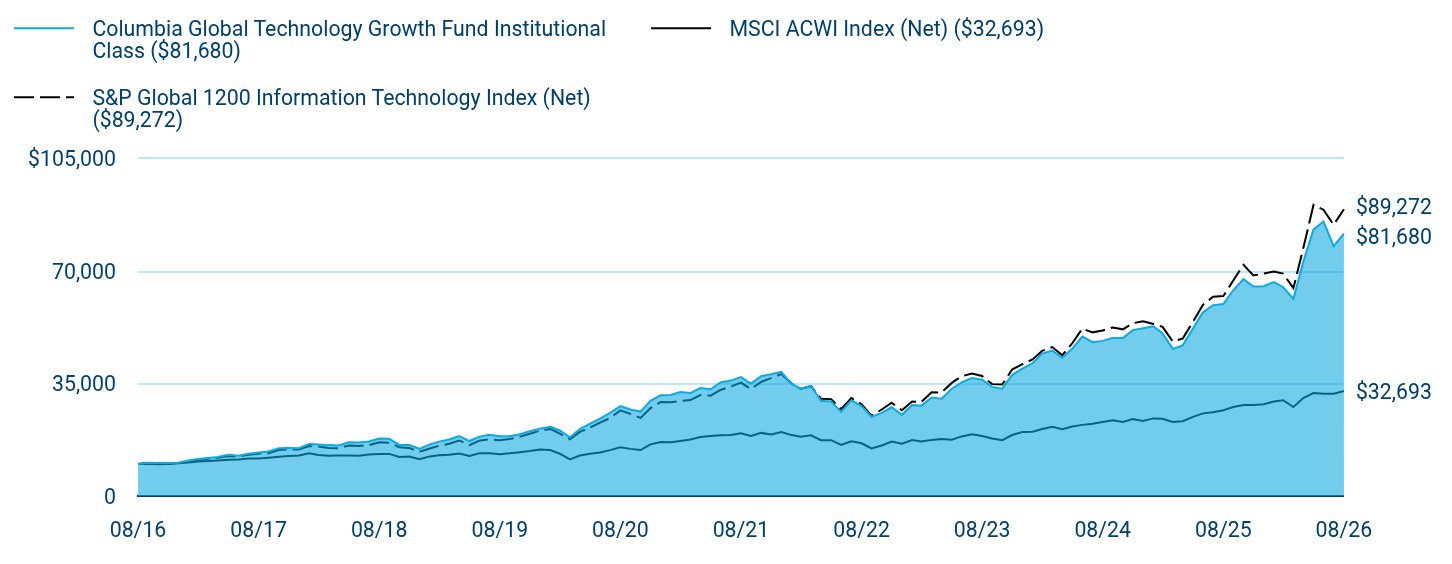
Table Summary
|
Columbia Global Technology Growth Fund Institutional Class ($81,680) |
MSCI ACWI Index (Net) ($32,693) |
S&P Global 1200 Information Technology Index (Net) ($89,272) |
08/16 |
$10,000 |
$10,000 |
$10,000 |
09/16 |
$10,351 |
$10,061 |
$10,253 |
10/16 |
$10,273 |
$9,890 |
$10,203 |
11/16 |
$10,310 |
$9,966 |
$10,119 |
12/16 |
$10,369 |
$10,181 |
$10,261 |
01/17 |
$11,023 |
$10,459 |
$10,760 |
02/17 |
$11,503 |
$10,753 |
$11,220 |
03/17 |
$11,855 |
$10,884 |
$11,582 |
04/17 |
$12,162 |
$11,054 |
$11,910 |
05/17 |
$12,852 |
$11,298 |
$12,474 |
06/17 |
$12,541 |
$11,349 |
$12,279 |
07/17 |
$13,182 |
$11,667 |
$12,836 |
08/17 |
$13,575 |
$11,711 |
$13,188 |
09/17 |
$13,872 |
$11,937 |
$13,348 |
10/17 |
$14,879 |
$12,185 |
$14,348 |
11/17 |
$14,970 |
$12,421 |
$14,470 |
12/17 |
$14,861 |
$12,622 |
$14,483 |
01/18 |
$16,207 |
$13,334 |
$15,550 |
02/18 |
$16,074 |
$12,774 |
$15,412 |
03/18 |
$15,842 |
$12,500 |
$14,912 |
04/18 |
$15,709 |
$12,620 |
$14,897 |
05/18 |
$16,737 |
$12,635 |
$15,746 |
06/18 |
$16,662 |
$12,567 |
$15,583 |
07/18 |
$16,955 |
$12,946 |
$15,844 |
08/18 |
$17,870 |
$13,048 |
$16,747 |
09/18 |
$17,794 |
$13,104 |
$16,616 |
10/18 |
$15,913 |
$12,122 |
$15,201 |
11/18 |
$15,870 |
$12,300 |
$14,916 |
12/18 |
$14,695 |
$11,433 |
$13,762 |
01/19 |
$16,074 |
$12,336 |
$14,768 |
02/19 |
$16,936 |
$12,666 |
$15,637 |
03/19 |
$17,588 |
$12,825 |
$16,292 |
04/19 |
$18,687 |
$13,258 |
$17,298 |
05/19 |
$17,117 |
$12,472 |
$15,829 |
06/19 |
$18,491 |
$13,289 |
$17,235 |
07/19 |
$19,098 |
$13,327 |
$17,654 |
08/19 |
$18,642 |
$13,011 |
$17,345 |
09/19 |
$18,622 |
$13,285 |
$17,720 |
10/19 |
$19,218 |
$13,649 |
$18,458 |
11/19 |
$20,191 |
$13,982 |
$19,362 |
12/19 |
$20,924 |
$14,474 |
$20,331 |
01/20 |
$21,559 |
$14,314 |
$20,896 |
02/20 |
$20,406 |
$13,158 |
$19,449 |
03/20 |
$18,294 |
$11,382 |
$17,679 |
04/20 |
$20,802 |
$12,601 |
$19,962 |
05/20 |
$22,544 |
$13,149 |
$21,281 |
06/20 |
$24,113 |
$13,569 |
$22,827 |
07/20 |
$25,864 |
$14,287 |
$24,281 |
08/20 |
$28,017 |
$15,161 |
$26,676 |
09/20 |
$26,920 |
$14,672 |
$25,585 |
10/20 |
$26,281 |
$14,316 |
$24,313 |
11/20 |
$29,647 |
$16,080 |
$27,351 |
12/20 |
$31,347 |
$16,827 |
$29,265 |
01/21 |
$31,434 |
$16,751 |
$29,214 |
02/21 |
$32,403 |
$17,138 |
$29,584 |
03/21 |
$32,049 |
$17,596 |
$29,887 |
04/21 |
$33,634 |
$18,366 |
$31,453 |
05/21 |
$33,250 |
$18,651 |
$31,227 |
06/21 |
$35,332 |
$18,897 |
$33,016 |
07/21 |
$35,942 |
$19,027 |
$34,060 |
08/21 |
$37,014 |
$19,504 |
$35,324 |
09/21 |
$35,034 |
$18,698 |
$33,280 |
10/21 |
$37,322 |
$19,652 |
$35,531 |
11/21 |
$37,922 |
$19,179 |
$36,692 |
12/21 |
$38,618 |
$19,946 |
$37,955 |
01/22 |
$34,872 |
$18,967 |
$35,023 |
02/22 |
$33,443 |
$18,477 |
$33,317 |
03/22 |
$34,278 |
$18,877 |
$34,173 |
04/22 |
$29,623 |
$17,366 |
$30,307 |
05/22 |
$29,414 |
$17,386 |
$30,168 |
06/22 |
$26,193 |
$15,921 |
$27,046 |
07/22 |
$29,783 |
$17,033 |
$30,481 |
08/22 |
$27,991 |
$16,406 |
$28,597 |
09/22 |
$24,684 |
$14,835 |
$25,053 |
10/22 |
$25,898 |
$15,730 |
$26,937 |
11/22 |
$27,621 |
$16,950 |
$29,026 |
12/22 |
$25,276 |
$16,283 |
$26,681 |
01/23 |
$28,325 |
$17,450 |
$29,429 |
02/23 |
$28,138 |
$16,950 |
$29,284 |
03/23 |
$30,668 |
$17,473 |
$32,305 |
04/23 |
$30,303 |
$17,724 |
$32,199 |
05/23 |
$33,397 |
$17,534 |
$35,217 |
06/23 |
$35,392 |
$18,552 |
$37,280 |
07/23 |
$36,745 |
$19,232 |
$38,105 |
08/23 |
$36,193 |
$18,694 |
$37,362 |
09/23 |
$33,966 |
$17,921 |
$34,835 |
10/23 |
$33,436 |
$17,382 |
$34,718 |
11/23 |
$37,728 |
$18,987 |
$39,381 |
12/23 |
$39,639 |
$19,899 |
$41,070 |
01/24 |
$41,323 |
$20,015 |
$42,518 |
02/24 |
$44,328 |
$20,874 |
$45,172 |
03/24 |
$45,283 |
$21,530 |
$46,386 |
04/24 |
$43,035 |
$20,819 |
$43,786 |
05/24 |
$45,949 |
$21,665 |
$47,637 |
06/24 |
$49,655 |
$22,147 |
$52,114 |
07/24 |
$47,881 |
$22,504 |
$50,956 |
08/24 |
$48,305 |
$23,076 |
$51,530 |
09/24 |
$49,186 |
$23,612 |
$52,488 |
10/24 |
$49,192 |
$23,082 |
$51,892 |
11/24 |
$51,655 |
$23,945 |
$53,793 |
12/24 |
$52,206 |
$23,379 |
$54,439 |
01/25 |
$52,862 |
$24,163 |
$53,557 |
02/25 |
$50,626 |
$24,018 |
$52,662 |
03/25 |
$45,806 |
$23,069 |
$48,104 |
04/25 |
$46,912 |
$23,284 |
$49,021 |
05/25 |
$52,132 |
$24,622 |
$54,219 |
06/25 |
$57,169 |
$25,728 |
$59,485 |
07/25 |
$59,394 |
$26,077 |
$62,031 |
08/25 |
$59,759 |
$26,721 |
$62,251 |
09/25 |
$64,065 |
$27,689 |
$67,109 |
10/25 |
$67,556 |
$28,308 |
$71,973 |
11/25 |
$65,246 |
$28,305 |
$68,670 |
12/25 |
$65,328 |
$28,601 |
$69,266 |
01/26 |
$66,634 |
$29,449 |
$69,920 |
02/26 |
$65,016 |
$29,827 |
$69,236 |
03/26 |
$61,373 |
$27,685 |
$64,717 |
04/26 |
$72,924 |
$30,502 |
$77,170 |
05/26 |
$83,028 |
$32,075 |
$90,671 |
06/26 |
$85,464 |
$31,818 |
$89,156 |
07/26 |
$77,826 |
$31,842 |
$84,448 |
08/26 |
$81,680 |
$32,693 |
$89,272 |
|
| Average Annual Return [Table Text Block] |
Table Summary
Average Annual Total Returns (%) |
1 year |
5 years |
10 years |
Institutional Class |
36.68 |
17.15 |
23.37 |
MSCI ACWI Index (Net) |
22.35 |
10.88 |
12.58 |
S&P Global 1200 Information Technology Index (Net) |
43.41 |
20.37 |
24.47 | |
| No Deduction of Taxes [Text Block] |
Performance does not reflect the deduction of taxes that a shareholder may pay on fund distributions or on the redemptions of fund shares.
|
| Updated Performance Information Location [Text Block] |
columbiathreadneedleus.com/investment-products/mutual-funds
|
| AssetsNet |
$ 5,398,705,730
|
| Holdings Count | Holding |
101
|
| Advisory Fees Paid, Amount |
$ 37,571,623
|
| InvestmentCompanyPortfolioTurnover |
10.00%
|
| Additional Fund Statistics [Text Block] |
Table Summary
Fund net assets |
$5,398,705,730 |
Total number of portfolio holdings |
101 |
Management services fees (represents 0.78% of Fund average net assets) |
$37,571,623 |
Portfolio turnover for the reporting period |
10% | |
| Holdings [Text Block] |
Information Technology Sub-Industry Allocation
Table Summary
Semiconductors |
37.8% |
Technology Hardware, Storage & Peripherals |
12.2% |
Semiconductor Materials & Equipment |
11.8% |
Systems Software |
10.7% |
Application Software |
4.1% |
Communications Equipment |
2.7% |
Internet Services & Infrastructure |
1.8% |
Electronic Components |
1.2% |
Other |
1.4% |
Table Summary
Information Technology |
83.7% |
Communication Services |
7.3% |
Consumer Discretionary |
3.6% |
Financials |
3.6% |
Industrials |
0.7% | |
| Largest Holdings [Text Block] |
Table Summary
NVIDIA Corp. |
14.2% |
Apple, Inc. |
7.6% |
Broadcom, Inc. |
7.5% |
Microsoft Corp. |
6.6% |
Lam Research Corp. |
6.1% |
Micron Technology, Inc. |
5.7% |
Alphabet, Inc., Class A |
3.8% |
Taiwan Semiconductor Manufacturing Co., Ltd., ADR |
3.7% |
Amazon.com, Inc. |
2.7% |
Applied Materials, Inc. |
2.6% | |
| Material Fund Change [Text Block] |
|
| C000122665 |
|
| Shareholder Report [Line Items] |
|
| Fund Name |
Columbia Global Technology Growth Fund
|
| Class Name |
Institutional 2 Class
|
| Trading Symbol |
CTHRX
|
| Annual or Semi-Annual Statement [Text Block] |
This annual shareholder report contains important information about Columbia Global Technology Growth Fund (the Fund) for the period of September 1, 2025 to August 31, 2026.
|
| Additional Information [Text Block] |
You can find additional information about the Fund at columbiathreadneedleus.com/resources/literature. You can also request more information by contacting us at 1-800-345-6611.
|
| Additional Information Phone Number |
1-800-345-6611
|
| Additional Information Website |
columbiathreadneedleus.com/resources/literature
|
| Expenses [Text Block] |
What were the Fund costs for the reporting period? (Based on a hypothetical $10,000 investment)
Table Summary
Class |
Cost of a $10,000 investment |
Cost paid as a percentage of a $10,000 investment |
Institutional 2 Class |
$101 |
0.85% | |
| Expenses Paid, Amount |
$ 101
|
| Expense Ratio, Percent |
0.85%
|
| Factors Affecting Performance [Text Block] |
Management's Discussion of Fund Performance The performance of Institutional 2 Class shares for the period presented is shown in the Average Annual Total Returns table. Top Performance ContributorsStock selection | Selections in the semiconductors and semiconductor equipment, technology hardware storage and peripherals, and IT services industries added to the Fund’s performance relative to the benchmark during the period. Allocations | An underweight allocation to software greatly contributed. An allocation to IT services also boosted the Fund’s relative performance during the period. Individual holdings | Positions in Lam Research, a semiconductor fabrication equipment manufacturer; Micron Technology, a memory and storage solutions provider; NVIDIA, a leading designer of GPUs and AI computing platforms; Broadcom, a global semiconductor and infrastructure software solutions provider; and Apple, a consumer technology hardware and services provider, were top contributors during the period. Top Performance DetractorsStock selection | Selections in the software and communications equipment industries hurt the Fund’s relative performance during the period. Allocations | Out-of-benchmark allocations to the entertainment, financial services, and interactive media and services industries, as well as an underweight to the technology hardware storage and peripherals industry, detracted from the Fund’s relative performance during the period. Individual holdings | Positions in Synopsys, an electronic design automation software provider; Meta Platforms, a social media and digital advertising provider; Intuit, a financial and tax software provider; Microsoft, a global software, cloud, and enterprise technology provider; and Netflix, a streaming entertainment provider, were top detractors from the Fund’s relative performance during the period. |
| Performance Past Does Not Indicate Future [Text] |
The Fund's past performance is not a good predictor of the Fund's future performance.
|
| Line Graph [Table Text Block] |
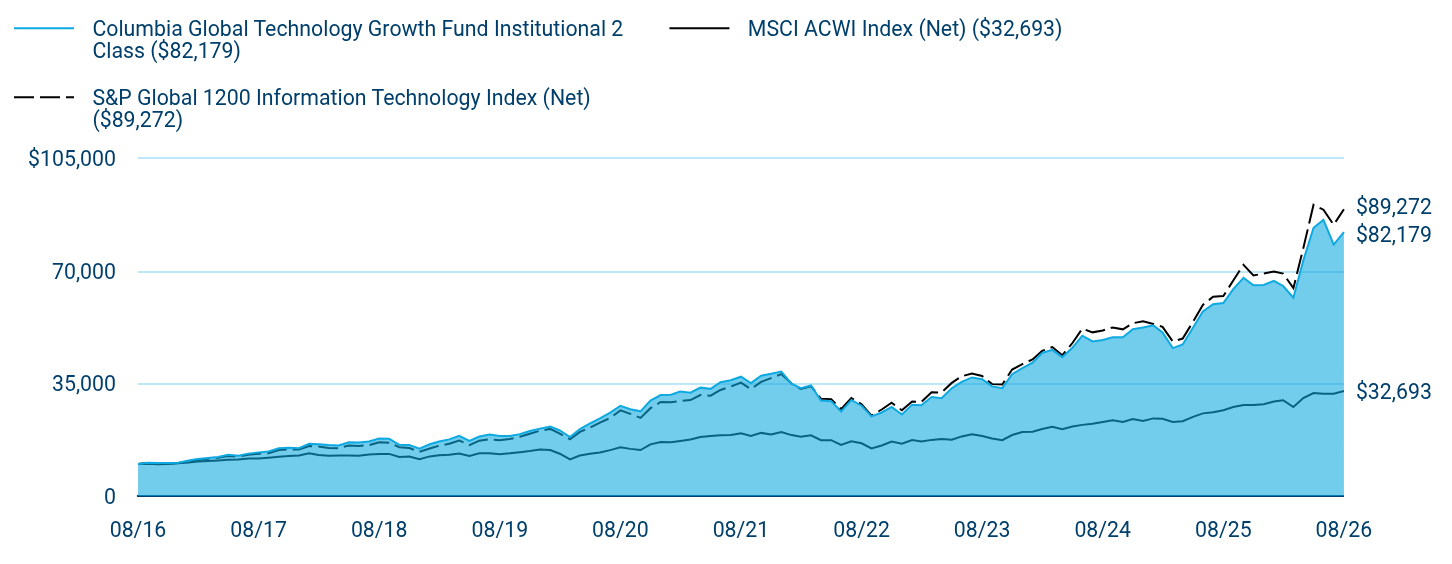
Table Summary
|
Columbia Global Technology Growth Fund Institutional 2 Class ($82,179) |
MSCI ACWI Index (Net) ($32,693) |
S&P Global 1200 Information Technology Index (Net) ($89,272) |
08/16 |
$10,000 |
$10,000 |
$10,000 |
09/16 |
$10,349 |
$10,061 |
$10,253 |
10/16 |
$10,273 |
$9,890 |
$10,203 |
11/16 |
$10,313 |
$9,966 |
$10,119 |
12/16 |
$10,371 |
$10,181 |
$10,261 |
01/17 |
$11,027 |
$10,459 |
$10,760 |
02/17 |
$11,508 |
$10,753 |
$11,220 |
03/17 |
$11,863 |
$10,884 |
$11,582 |
04/17 |
$12,169 |
$11,054 |
$11,910 |
05/17 |
$12,861 |
$11,298 |
$12,474 |
06/17 |
$12,551 |
$11,349 |
$12,279 |
07/17 |
$13,193 |
$11,667 |
$12,836 |
08/17 |
$13,584 |
$11,711 |
$13,188 |
09/17 |
$13,885 |
$11,937 |
$13,348 |
10/17 |
$14,892 |
$12,185 |
$14,348 |
11/17 |
$14,986 |
$12,421 |
$14,470 |
12/17 |
$14,879 |
$12,622 |
$14,483 |
01/18 |
$16,229 |
$13,334 |
$15,550 |
02/18 |
$16,094 |
$12,774 |
$15,412 |
03/18 |
$15,861 |
$12,500 |
$14,912 |
04/18 |
$15,731 |
$12,620 |
$14,897 |
05/18 |
$16,759 |
$12,635 |
$15,746 |
06/18 |
$16,685 |
$12,567 |
$15,583 |
07/18 |
$16,978 |
$12,946 |
$15,844 |
08/18 |
$17,895 |
$13,048 |
$16,747 |
09/18 |
$17,820 |
$13,104 |
$16,616 |
10/18 |
$15,936 |
$12,122 |
$15,201 |
11/18 |
$15,898 |
$12,300 |
$14,916 |
12/18 |
$14,722 |
$11,433 |
$13,762 |
01/19 |
$16,101 |
$12,336 |
$14,768 |
02/19 |
$16,968 |
$12,666 |
$15,637 |
03/19 |
$17,623 |
$12,825 |
$16,292 |
04/19 |
$18,721 |
$13,258 |
$17,298 |
05/19 |
$17,155 |
$12,472 |
$15,829 |
06/19 |
$18,534 |
$13,289 |
$17,235 |
07/19 |
$19,140 |
$13,327 |
$17,654 |
08/19 |
$18,687 |
$13,011 |
$17,345 |
09/19 |
$18,667 |
$13,285 |
$17,720 |
10/19 |
$19,268 |
$13,649 |
$18,458 |
11/19 |
$20,238 |
$13,982 |
$19,362 |
12/19 |
$20,977 |
$14,474 |
$20,331 |
01/20 |
$21,616 |
$14,314 |
$20,896 |
02/20 |
$20,464 |
$13,158 |
$19,449 |
03/20 |
$18,345 |
$11,382 |
$17,679 |
04/20 |
$20,858 |
$12,601 |
$19,962 |
05/20 |
$22,603 |
$13,149 |
$21,281 |
06/20 |
$24,178 |
$13,569 |
$22,827 |
07/20 |
$25,938 |
$14,287 |
$24,281 |
08/20 |
$28,096 |
$15,161 |
$26,676 |
09/20 |
$26,999 |
$14,672 |
$25,585 |
10/20 |
$26,361 |
$14,316 |
$24,313 |
11/20 |
$29,736 |
$16,080 |
$27,351 |
12/20 |
$31,446 |
$16,827 |
$29,265 |
01/21 |
$31,532 |
$16,751 |
$29,214 |
02/21 |
$32,509 |
$17,138 |
$29,584 |
03/21 |
$32,156 |
$17,596 |
$29,887 |
04/21 |
$33,743 |
$18,366 |
$31,453 |
05/21 |
$33,360 |
$18,651 |
$31,227 |
06/21 |
$35,451 |
$18,897 |
$33,016 |
07/21 |
$36,065 |
$19,027 |
$34,060 |
08/21 |
$37,143 |
$19,504 |
$35,324 |
09/21 |
$35,158 |
$18,698 |
$33,280 |
10/21 |
$37,455 |
$19,652 |
$35,531 |
11/21 |
$38,060 |
$19,179 |
$36,692 |
12/21 |
$38,759 |
$19,946 |
$37,955 |
01/22 |
$35,003 |
$18,967 |
$35,023 |
02/22 |
$33,568 |
$18,477 |
$33,317 |
03/22 |
$34,409 |
$18,877 |
$34,173 |
04/22 |
$29,739 |
$17,366 |
$30,307 |
05/22 |
$29,529 |
$17,386 |
$30,168 |
06/22 |
$26,293 |
$15,921 |
$27,046 |
07/22 |
$29,902 |
$17,033 |
$30,481 |
08/22 |
$28,105 |
$16,406 |
$28,597 |
09/22 |
$24,780 |
$14,835 |
$25,053 |
10/22 |
$26,004 |
$15,730 |
$26,937 |
11/22 |
$27,737 |
$16,950 |
$29,026 |
12/22 |
$25,382 |
$16,283 |
$26,681 |
01/23 |
$28,444 |
$17,450 |
$29,429 |
02/23 |
$28,254 |
$16,950 |
$29,284 |
03/23 |
$30,802 |
$17,473 |
$32,305 |
04/23 |
$30,433 |
$17,724 |
$32,199 |
05/23 |
$33,544 |
$17,534 |
$35,217 |
06/23 |
$35,550 |
$18,552 |
$37,280 |
07/23 |
$36,915 |
$19,232 |
$38,105 |
08/23 |
$36,357 |
$18,694 |
$37,362 |
09/23 |
$34,124 |
$17,921 |
$34,835 |
10/23 |
$33,588 |
$17,382 |
$34,718 |
11/23 |
$37,907 |
$18,987 |
$39,381 |
12/23 |
$39,825 |
$19,899 |
$41,070 |
01/24 |
$41,526 |
$20,015 |
$42,518 |
02/24 |
$44,545 |
$20,874 |
$45,172 |
03/24 |
$45,503 |
$21,530 |
$46,386 |
04/24 |
$43,249 |
$20,819 |
$43,786 |
05/24 |
$46,173 |
$21,665 |
$47,637 |
06/24 |
$49,906 |
$22,147 |
$52,114 |
07/24 |
$48,123 |
$22,504 |
$50,956 |
08/24 |
$48,555 |
$23,076 |
$51,530 |
09/24 |
$49,436 |
$23,612 |
$52,488 |
10/24 |
$49,447 |
$23,082 |
$51,892 |
11/24 |
$51,923 |
$23,945 |
$53,793 |
12/24 |
$52,480 |
$23,379 |
$54,439 |
01/25 |
$53,139 |
$24,163 |
$53,557 |
02/25 |
$50,897 |
$24,018 |
$52,662 |
03/25 |
$46,055 |
$23,069 |
$48,104 |
04/25 |
$47,167 |
$23,284 |
$49,021 |
05/25 |
$52,412 |
$24,622 |
$54,219 |
06/25 |
$57,479 |
$25,728 |
$59,485 |
07/25 |
$59,721 |
$26,077 |
$62,031 |
08/25 |
$60,090 |
$26,721 |
$62,251 |
09/25 |
$64,429 |
$27,689 |
$67,109 |
10/25 |
$67,941 |
$28,308 |
$71,973 |
11/25 |
$65,620 |
$28,305 |
$68,670 |
12/25 |
$65,700 |
$28,601 |
$69,266 |
01/26 |
$67,014 |
$29,449 |
$69,920 |
02/26 |
$65,395 |
$29,827 |
$69,236 |
03/26 |
$61,735 |
$27,685 |
$64,717 |
04/26 |
$73,354 |
$30,502 |
$77,170 |
05/26 |
$83,521 |
$32,075 |
$90,671 |
06/26 |
$85,977 |
$31,818 |
$89,156 |
07/26 |
$78,294 |
$31,842 |
$84,448 |
08/26 |
$82,179 |
$32,693 |
$89,272 |
|
| Average Annual Return [Table Text Block] |
Table Summary
Average Annual Total Returns (%) |
1 year |
5 years |
10 years |
Institutional 2 Class |
36.76 |
17.21 |
23.45 |
MSCI ACWI Index (Net) |
22.35 |
10.88 |
12.58 |
S&P Global 1200 Information Technology Index (Net) |
43.41 |
20.37 |
24.47 | |
| No Deduction of Taxes [Text Block] |
Performance does not reflect the deduction of taxes that a shareholder may pay on fund distributions or on the redemptions of fund shares.
|
| Updated Performance Information Location [Text Block] |
columbiathreadneedleus.com/investment-products/mutual-funds
|
| AssetsNet |
$ 5,398,705,730
|
| Holdings Count | Holding |
101
|
| Advisory Fees Paid, Amount |
$ 37,571,623
|
| InvestmentCompanyPortfolioTurnover |
10.00%
|
| Additional Fund Statistics [Text Block] |
Table Summary
Fund net assets |
$5,398,705,730 |
Total number of portfolio holdings |
101 |
Management services fees (represents 0.78% of Fund average net assets) |
$37,571,623 |
Portfolio turnover for the reporting period |
10% | |
| Holdings [Text Block] |
Information Technology Sub-Industry Allocation
Table Summary
Semiconductors |
37.8% |
Technology Hardware, Storage & Peripherals |
12.2% |
Semiconductor Materials & Equipment |
11.8% |
Systems Software |
10.7% |
Application Software |
4.1% |
Communications Equipment |
2.7% |
Internet Services & Infrastructure |
1.8% |
Electronic Components |
1.2% |
Other |
1.4% |
Table Summary
Information Technology |
83.7% |
Communication Services |
7.3% |
Consumer Discretionary |
3.6% |
Financials |
3.6% |
Industrials |
0.7% | |
| Largest Holdings [Text Block] |
Table Summary
NVIDIA Corp. |
14.2% |
Apple, Inc. |
7.6% |
Broadcom, Inc. |
7.5% |
Microsoft Corp. |
6.6% |
Lam Research Corp. |
6.1% |
Micron Technology, Inc. |
5.7% |
Alphabet, Inc., Class A |
3.8% |
Taiwan Semiconductor Manufacturing Co., Ltd., ADR |
3.7% |
Amazon.com, Inc. |
2.7% |
Applied Materials, Inc. |
2.6% | |
| Material Fund Change [Text Block] |
|
| C000169173 |
|
| Shareholder Report [Line Items] |
|
| Fund Name |
Columbia Global Technology Growth Fund
|
| Class Name |
Institutional 3 Class
|
| Trading Symbol |
CGTUX
|
| Annual or Semi-Annual Statement [Text Block] |
This annual shareholder report contains important information about Columbia Global Technology Growth Fund (the Fund) for the period of September 1, 2025 to August 31, 2026.
|
| Additional Information [Text Block] |
You can find additional information about the Fund at columbiathreadneedleus.com/resources/literature. You can also request more information by contacting us at 1-800-345-6611.
|
| Additional Information Phone Number |
1-800-345-6611
|
| Additional Information Website |
columbiathreadneedleus.com/resources/literature
|
| Expenses [Text Block] |
What were the Fund costs for the reporting period? (Based on a hypothetical $10,000 investment)
Table Summary
Class |
Cost of a $10,000 investment |
Cost paid as a percentage of a $10,000 investment |
Institutional 3 Class |
$95 |
0.80% | |
| Expenses Paid, Amount |
$ 95
|
| Expense Ratio, Percent |
0.80%
|
| Factors Affecting Performance [Text Block] |
Management's Discussion of Fund Performance The performance of Institutional 3 Class shares for the period presented is shown in the Average Annual Total Returns table. Top Performance ContributorsStock selection | Selections in the semiconductors and semiconductor equipment, technology hardware storage and peripherals, and IT services industries added to the Fund’s performance relative to the benchmark during the period. Allocations | An underweight allocation to software greatly contributed. An allocation to IT services also boosted the Fund’s relative performance during the period. Individual holdings | Positions in Lam Research, a semiconductor fabrication equipment manufacturer; Micron Technology, a memory and storage solutions provider; NVIDIA, a leading designer of GPUs and AI computing platforms; Broadcom, a global semiconductor and infrastructure software solutions provider; and Apple, a consumer technology hardware and services provider, were top contributors during the period. Top Performance DetractorsStock selection | Selections in the software and communications equipment industries hurt the Fund’s relative performance during the period. Allocations | Out-of-benchmark allocations to the entertainment, financial services, and interactive media and services industries, as well as an underweight to the technology hardware storage and peripherals industry, detracted from the Fund’s relative performance during the period. Individual holdings | Positions in Synopsys, an electronic design automation software provider; Meta Platforms, a social media and digital advertising provider; Intuit, a financial and tax software provider; Microsoft, a global software, cloud, and enterprise technology provider; and Netflix, a streaming entertainment provider, were top detractors from the Fund’s relative performance during the period. |
| Performance Past Does Not Indicate Future [Text] |
The Fund's past performance is not a good predictor of the Fund's future performance.
|
| Line Graph [Table Text Block] |
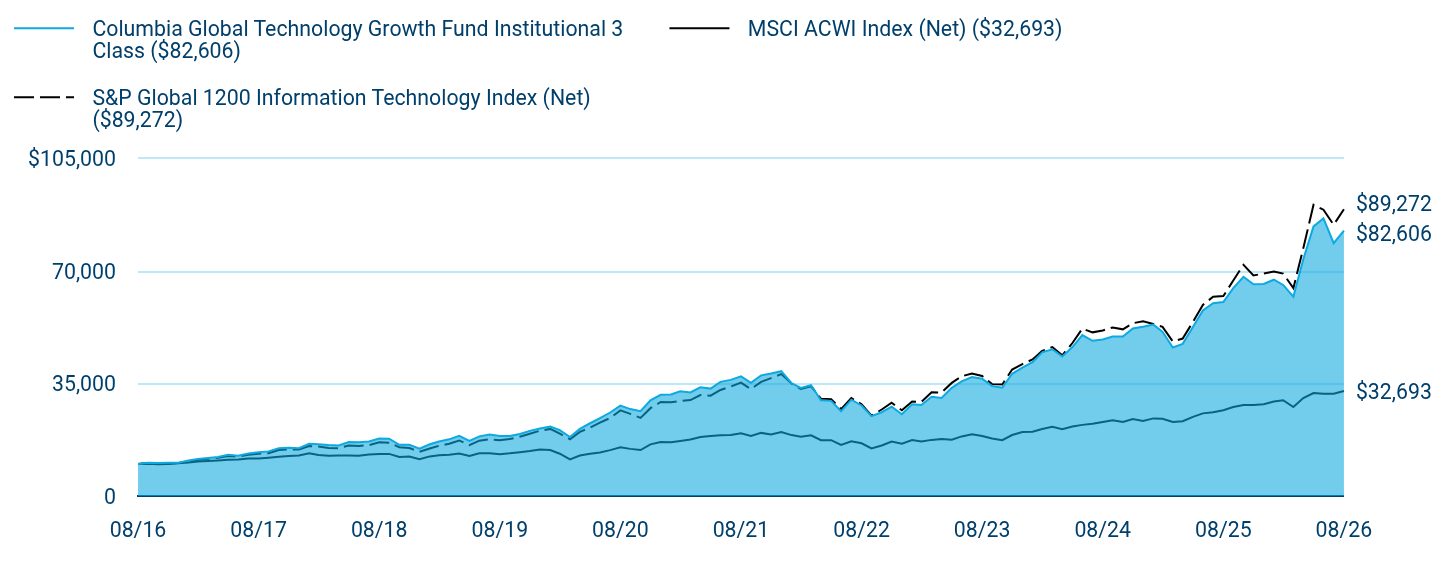
Table Summary
|
Columbia Global Technology Growth Fund Institutional 3 Class ($82,606) |
MSCI ACWI Index (Net) ($32,693) |
S&P Global 1200 Information Technology Index (Net) ($89,272) |
08/16 |
$10,000 |
$10,000 |
$10,000 |
09/16 |
$10,353 |
$10,061 |
$10,253 |
10/16 |
$10,277 |
$9,890 |
$10,203 |
11/16 |
$10,317 |
$9,966 |
$10,119 |
12/16 |
$10,375 |
$10,181 |
$10,261 |
01/17 |
$11,030 |
$10,459 |
$10,760 |
02/17 |
$11,514 |
$10,753 |
$11,220 |
03/17 |
$11,864 |
$10,884 |
$11,582 |
04/17 |
$12,174 |
$11,054 |
$11,910 |
05/17 |
$12,865 |
$11,298 |
$12,474 |
06/17 |
$12,560 |
$11,349 |
$12,279 |
07/17 |
$13,201 |
$11,667 |
$12,836 |
08/17 |
$13,596 |
$11,711 |
$13,188 |
09/17 |
$13,896 |
$11,937 |
$13,348 |
10/17 |
$14,901 |
$12,185 |
$14,348 |
11/17 |
$15,000 |
$12,421 |
$14,470 |
12/17 |
$14,890 |
$12,622 |
$14,483 |
01/18 |
$16,242 |
$13,334 |
$15,550 |
02/18 |
$16,107 |
$12,774 |
$15,412 |
03/18 |
$15,880 |
$12,500 |
$14,912 |
04/18 |
$15,745 |
$12,620 |
$14,897 |
05/18 |
$16,781 |
$12,635 |
$15,746 |
06/18 |
$16,702 |
$12,567 |
$15,583 |
07/18 |
$17,000 |
$12,946 |
$15,844 |
08/18 |
$17,915 |
$13,048 |
$16,747 |
09/18 |
$17,845 |
$13,104 |
$16,616 |
10/18 |
$15,959 |
$12,122 |
$15,201 |
11/18 |
$15,921 |
$12,300 |
$14,916 |
12/18 |
$14,741 |
$11,433 |
$13,762 |
01/19 |
$16,123 |
$12,336 |
$14,768 |
02/19 |
$16,994 |
$12,666 |
$15,637 |
03/19 |
$17,648 |
$12,825 |
$16,292 |
04/19 |
$18,750 |
$13,258 |
$17,298 |
05/19 |
$17,181 |
$12,472 |
$15,829 |
06/19 |
$18,563 |
$13,289 |
$17,235 |
07/19 |
$19,169 |
$13,327 |
$17,654 |
08/19 |
$18,716 |
$13,011 |
$17,345 |
09/19 |
$18,696 |
$13,285 |
$17,720 |
10/19 |
$19,302 |
$13,649 |
$18,458 |
11/19 |
$20,276 |
$13,982 |
$19,362 |
12/19 |
$21,014 |
$14,474 |
$20,331 |
01/20 |
$21,656 |
$14,314 |
$20,896 |
02/20 |
$20,501 |
$13,158 |
$19,449 |
03/20 |
$18,380 |
$11,382 |
$17,679 |
04/20 |
$20,900 |
$12,601 |
$19,962 |
05/20 |
$22,652 |
$13,149 |
$21,281 |
06/20 |
$24,231 |
$13,569 |
$22,827 |
07/20 |
$25,994 |
$14,287 |
$24,281 |
08/20 |
$28,160 |
$15,161 |
$26,676 |
09/20 |
$27,059 |
$14,672 |
$25,585 |
10/20 |
$26,422 |
$14,316 |
$24,313 |
11/20 |
$29,808 |
$16,080 |
$27,351 |
12/20 |
$31,523 |
$16,827 |
$29,265 |
01/21 |
$31,608 |
$16,751 |
$29,214 |
02/21 |
$32,590 |
$17,138 |
$29,584 |
03/21 |
$32,238 |
$17,596 |
$29,887 |
04/21 |
$33,828 |
$18,366 |
$31,453 |
05/21 |
$33,446 |
$18,651 |
$31,227 |
06/21 |
$35,544 |
$18,897 |
$33,016 |
07/21 |
$36,164 |
$19,027 |
$34,060 |
08/21 |
$37,246 |
$19,504 |
$35,324 |
09/21 |
$35,253 |
$18,698 |
$33,280 |
10/21 |
$37,558 |
$19,652 |
$35,531 |
11/21 |
$38,167 |
$19,179 |
$36,692 |
12/21 |
$38,872 |
$19,946 |
$37,955 |
01/22 |
$35,107 |
$18,967 |
$35,023 |
02/22 |
$33,669 |
$18,477 |
$33,317 |
03/22 |
$34,509 |
$18,877 |
$34,173 |
04/22 |
$29,825 |
$17,366 |
$30,307 |
05/22 |
$29,620 |
$17,386 |
$30,168 |
06/22 |
$26,375 |
$15,921 |
$27,046 |
07/22 |
$29,998 |
$17,033 |
$30,481 |
08/22 |
$28,197 |
$16,406 |
$28,597 |
09/22 |
$24,863 |
$14,835 |
$25,053 |
10/22 |
$26,086 |
$15,730 |
$26,937 |
11/22 |
$27,830 |
$16,950 |
$29,026 |
12/22 |
$25,465 |
$16,283 |
$26,681 |
01/23 |
$28,542 |
$17,450 |
$29,429 |
02/23 |
$28,352 |
$16,950 |
$29,284 |
03/23 |
$30,909 |
$17,473 |
$32,305 |
04/23 |
$30,540 |
$17,724 |
$32,199 |
05/23 |
$33,666 |
$17,534 |
$35,217 |
06/23 |
$35,681 |
$18,552 |
$37,280 |
07/23 |
$37,051 |
$19,232 |
$38,105 |
08/23 |
$36,493 |
$18,694 |
$37,362 |
09/23 |
$34,251 |
$17,921 |
$34,835 |
10/23 |
$33,720 |
$17,382 |
$34,718 |
11/23 |
$38,054 |
$18,987 |
$39,381 |
12/23 |
$39,981 |
$19,899 |
$41,070 |
01/24 |
$41,686 |
$20,015 |
$42,518 |
02/24 |
$44,719 |
$20,874 |
$45,172 |
03/24 |
$45,688 |
$21,530 |
$46,386 |
04/24 |
$43,424 |
$20,819 |
$43,786 |
05/24 |
$46,363 |
$21,665 |
$47,637 |
06/24 |
$50,111 |
$22,147 |
$52,114 |
07/24 |
$48,323 |
$22,504 |
$50,956 |
08/24 |
$48,760 |
$23,076 |
$51,530 |
09/24 |
$49,651 |
$23,612 |
$52,488 |
10/24 |
$49,662 |
$23,082 |
$51,892 |
11/24 |
$52,148 |
$23,945 |
$53,793 |
12/24 |
$52,710 |
$23,379 |
$54,439 |
01/25 |
$53,375 |
$24,163 |
$53,557 |
02/25 |
$51,123 |
$24,018 |
$52,662 |
03/25 |
$46,262 |
$23,069 |
$48,104 |
04/25 |
$47,379 |
$23,284 |
$49,021 |
05/25 |
$52,654 |
$24,622 |
$54,219 |
06/25 |
$57,745 |
$25,728 |
$59,485 |
07/25 |
$60,002 |
$26,077 |
$62,031 |
08/25 |
$60,376 |
$26,721 |
$62,251 |
09/25 |
$64,735 |
$27,689 |
$67,109 |
10/25 |
$68,267 |
$28,308 |
$71,973 |
11/25 |
$65,936 |
$28,305 |
$68,670 |
12/25 |
$66,022 |
$28,601 |
$69,266 |
01/26 |
$67,346 |
$29,449 |
$69,920 |
02/26 |
$65,717 |
$29,827 |
$69,236 |
03/26 |
$62,043 |
$27,685 |
$64,717 |
04/26 |
$73,727 |
$30,502 |
$77,170 |
05/26 |
$83,948 |
$32,075 |
$90,671 |
06/26 |
$86,419 |
$31,818 |
$89,156 |
07/26 |
$78,702 |
$31,842 |
$84,448 |
08/26 |
$82,606 |
$32,693 |
$89,272 |
|
| Average Annual Return [Table Text Block] |
Table Summary
Average Annual Total Returns (%) |
1 year |
5 years |
10 years |
Institutional 3 Class |
36.82 |
17.27 |
23.51 |
MSCI ACWI Index (Net) |
22.35 |
10.88 |
12.58 |
S&P Global 1200 Information Technology Index (Net) |
43.41 |
20.37 |
24.47 | |
| No Deduction of Taxes [Text Block] |
Performance does not reflect the deduction of taxes that a shareholder may pay on fund distributions or on the redemptions of fund shares.
|
| Updated Performance Information Location [Text Block] |
columbiathreadneedleus.com/investment-products/mutual-funds
|
| AssetsNet |
$ 5,398,705,730
|
| Holdings Count | Holding |
101
|
| Advisory Fees Paid, Amount |
$ 37,571,623
|
| InvestmentCompanyPortfolioTurnover |
10.00%
|
| Additional Fund Statistics [Text Block] |
Table Summary
Fund net assets |
$5,398,705,730 |
Total number of portfolio holdings |
101 |
Management services fees (represents 0.78% of Fund average net assets) |
$37,571,623 |
Portfolio turnover for the reporting period |
10% | |
| Holdings [Text Block] |
Information Technology Sub-Industry Allocation
Table Summary
Semiconductors |
37.8% |
Technology Hardware, Storage & Peripherals |
12.2% |
Semiconductor Materials & Equipment |
11.8% |
Systems Software |
10.7% |
Application Software |
4.1% |
Communications Equipment |
2.7% |
Internet Services & Infrastructure |
1.8% |
Electronic Components |
1.2% |
Other |
1.4% |
Table Summary
Information Technology |
83.7% |
Communication Services |
7.3% |
Consumer Discretionary |
3.6% |
Financials |
3.6% |
Industrials |
0.7% | |
| Largest Holdings [Text Block] |
Table Summary
NVIDIA Corp. |
14.2% |
Apple, Inc. |
7.6% |
Broadcom, Inc. |
7.5% |
Microsoft Corp. |
6.6% |
Lam Research Corp. |
6.1% |
Micron Technology, Inc. |
5.7% |
Alphabet, Inc., Class A |
3.8% |
Taiwan Semiconductor Manufacturing Co., Ltd., ADR |
3.7% |
Amazon.com, Inc. |
2.7% |
Applied Materials, Inc. |
2.6% | |
| Material Fund Change [Text Block] |
|
| C000253718 |
|
| Shareholder Report [Line Items] |
|
| Fund Name |
Columbia Global Technology Growth Fund
|
| Class Name |
Class S
|
| Trading Symbol |
CGTDX
|
| Annual or Semi-Annual Statement [Text Block] |
This annual shareholder report contains important information about Columbia Global Technology Growth Fund (the Fund) for the period of September 1, 2025 to August 31, 2026.
|
| Additional Information [Text Block] |
You can find additional information about the Fund at columbiathreadneedleus.com/resources/literature. You can also request more information by contacting us at 1-800-345-6611.
|
| Additional Information Phone Number |
1-800-345-6611
|
| Additional Information Website |
columbiathreadneedleus.com/resources/literature
|
| Expenses [Text Block] |
What were the Fund costs for the reporting period? (Based on a hypothetical $10,000 investment)
Table Summary
Class |
Cost of a $10,000 investment |
Cost paid as a percentage of a $10,000 investment |
Class S |
$107 |
0.90% | |
| Expenses Paid, Amount |
$ 107
|
| Expense Ratio, Percent |
0.90%
|
| Factors Affecting Performance [Text Block] |
Management's Discussion of Fund Performance The performance of Class S shares for the period presented is shown in the Average Annual Total Returns table. Top Performance ContributorsStock selection | Selections in the semiconductors and semiconductor equipment, technology hardware storage and peripherals, and IT services industries added to the Fund’s performance relative to the benchmark during the period. Allocations | An underweight allocation to software greatly contributed. An allocation to IT services also boosted the Fund’s relative performance during the period. Individual holdings | Positions in Lam Research, a semiconductor fabrication equipment manufacturer; Micron Technology, a memory and storage solutions provider; NVIDIA, a leading designer of GPUs and AI computing platforms; Broadcom, a global semiconductor and infrastructure software solutions provider; and Apple, a consumer technology hardware and services provider, were top contributors during the period. Top Performance DetractorsStock selection | Selections in the software and communications equipment industries hurt the Fund’s relative performance during the period. Allocations | Out-of-benchmark allocations to the entertainment, financial services, and interactive media and services industries, as well as an underweight to the technology hardware storage and peripherals industry, detracted from the Fund’s relative performance during the period. Individual holdings | Positions in Synopsys, an electronic design automation software provider; Meta Platforms, a social media and digital advertising provider; Intuit, a financial and tax software provider; Microsoft, a global software, cloud, and enterprise technology provider; and Netflix, a streaming entertainment provider, were top detractors from the Fund’s relative performance during the period. |
| Performance Past Does Not Indicate Future [Text] |
The Fund's past performance is not a good predictor of the Fund's future performance.
|
| Line Graph [Table Text Block] |
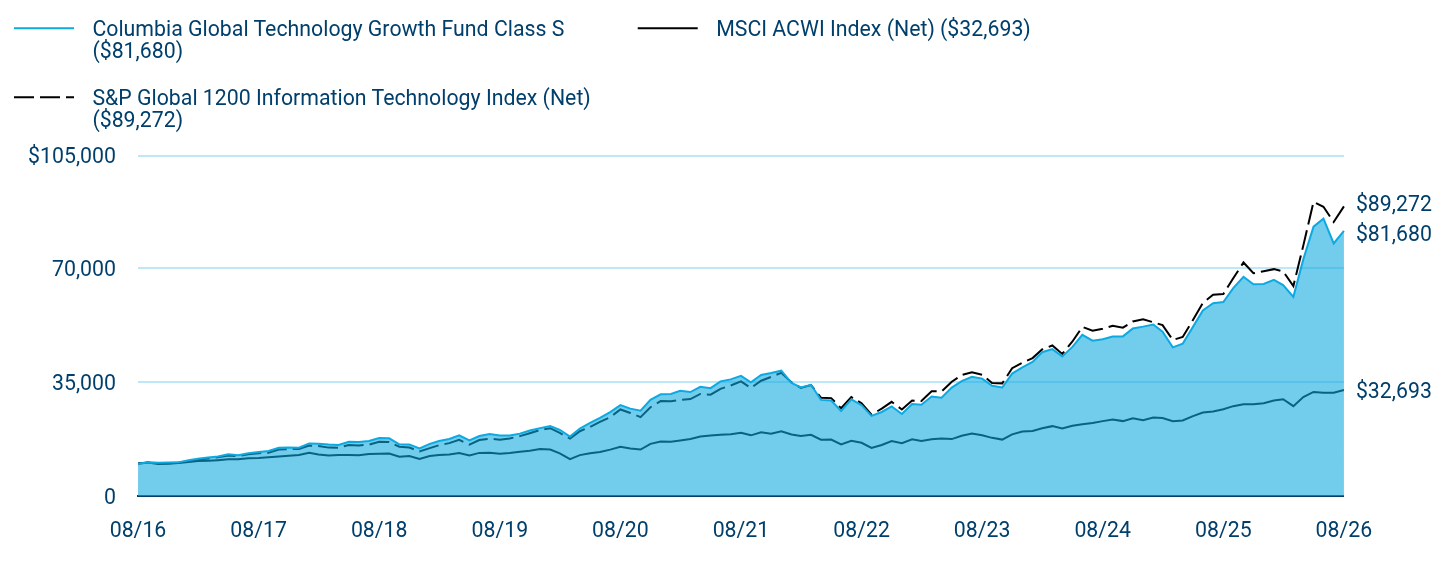
Table Summary
|
Columbia Global Technology Growth Fund Class S ($81,680) |
MSCI ACWI Index (Net) ($32,693) |
S&P Global 1200 Information Technology Index (Net) ($89,272) |
08/16 |
$10,000 |
$10,000 |
$10,000 |
09/16 |
$10,351 |
$10,343 |
$10,253 |
10/16 |
$10,273 |
$9,890 |
$10,203 |
11/16 |
$10,310 |
$9,966 |
$10,119 |
12/16 |
$10,369 |
$10,181 |
$10,261 |
01/17 |
$11,023 |
$10,459 |
$10,760 |
02/17 |
$11,503 |
$10,753 |
$11,220 |
03/17 |
$11,855 |
$10,884 |
$11,582 |
04/17 |
$12,162 |
$11,054 |
$11,910 |
05/17 |
$12,852 |
$11,298 |
$12,474 |
06/17 |
$12,541 |
$11,349 |
$12,279 |
07/17 |
$13,182 |
$11,667 |
$12,836 |
08/17 |
$13,575 |
$11,711 |
$13,188 |
09/17 |
$13,872 |
$11,937 |
$13,348 |
10/17 |
$14,879 |
$12,185 |
$14,348 |
11/17 |
$14,970 |
$12,421 |
$14,470 |
12/17 |
$14,861 |
$12,622 |
$14,483 |
01/18 |
$16,207 |
$13,334 |
$15,550 |
02/18 |
$16,074 |
$12,774 |
$15,412 |
03/18 |
$15,842 |
$12,500 |
$14,912 |
04/18 |
$15,709 |
$12,620 |
$14,897 |
05/18 |
$16,737 |
$12,635 |
$15,746 |
06/18 |
$16,662 |
$12,567 |
$15,583 |
07/18 |
$16,955 |
$12,946 |
$15,844 |
08/18 |
$17,870 |
$13,048 |
$16,747 |
09/18 |
$17,794 |
$13,104 |
$16,616 |
10/18 |
$15,913 |
$12,122 |
$15,201 |
11/18 |
$15,870 |
$12,300 |
$14,916 |
12/18 |
$14,695 |
$11,433 |
$13,762 |
01/19 |
$16,074 |
$12,336 |
$14,768 |
02/19 |
$16,936 |
$12,666 |
$15,637 |
03/19 |
$17,588 |
$12,825 |
$16,292 |
04/19 |
$18,687 |
$13,258 |
$17,298 |
05/19 |
$17,117 |
$12,472 |
$15,829 |
06/19 |
$18,491 |
$13,289 |
$17,235 |
07/19 |
$19,098 |
$13,327 |
$17,654 |
08/19 |
$18,642 |
$13,011 |
$17,345 |
09/19 |
$18,622 |
$13,285 |
$17,720 |
10/19 |
$19,218 |
$13,649 |
$18,458 |
11/19 |
$20,191 |
$13,982 |
$19,362 |
12/19 |
$20,924 |
$14,474 |
$20,331 |
01/20 |
$21,559 |
$14,314 |
$20,896 |
02/20 |
$20,406 |
$13,158 |
$19,449 |
03/20 |
$18,294 |
$11,382 |
$17,679 |
04/20 |
$20,802 |
$12,601 |
$19,962 |
05/20 |
$22,544 |
$13,149 |
$21,281 |
06/20 |
$24,113 |
$13,569 |
$22,827 |
07/20 |
$25,864 |
$14,287 |
$24,281 |
08/20 |
$28,017 |
$15,161 |
$26,676 |
09/20 |
$26,920 |
$14,672 |
$25,585 |
10/20 |
$26,281 |
$14,316 |
$24,313 |
11/20 |
$29,647 |
$16,080 |
$27,351 |
12/20 |
$31,347 |
$16,827 |
$29,265 |
01/21 |
$31,434 |
$16,751 |
$29,214 |
02/21 |
$32,403 |
$17,138 |
$29,584 |
03/21 |
$32,049 |
$17,596 |
$29,887 |
04/21 |
$33,634 |
$18,366 |
$31,453 |
05/21 |
$33,250 |
$18,651 |
$31,227 |
06/21 |
$35,332 |
$18,897 |
$33,016 |
07/21 |
$35,942 |
$19,027 |
$34,060 |
08/21 |
$37,014 |
$19,504 |
$35,324 |
09/21 |
$35,034 |
$18,698 |
$33,280 |
10/21 |
$37,322 |
$19,652 |
$35,531 |
11/21 |
$37,922 |
$19,179 |
$36,692 |
12/21 |
$38,618 |
$19,946 |
$37,955 |
01/22 |
$34,872 |
$18,967 |
$35,023 |
02/22 |
$33,443 |
$18,477 |
$33,317 |
03/22 |
$34,278 |
$18,877 |
$34,173 |
04/22 |
$29,623 |
$17,366 |
$30,307 |
05/22 |
$29,414 |
$17,386 |
$30,168 |
06/22 |
$26,193 |
$15,921 |
$27,046 |
07/22 |
$29,783 |
$17,033 |
$30,481 |
08/22 |
$27,991 |
$16,406 |
$28,597 |
09/22 |
$24,684 |
$14,835 |
$25,053 |
10/22 |
$25,898 |
$15,730 |
$26,937 |
11/22 |
$27,621 |
$16,950 |
$29,026 |
12/22 |
$25,276 |
$16,283 |
$26,681 |
01/23 |
$28,325 |
$17,450 |
$29,429 |
02/23 |
$28,138 |
$16,950 |
$29,284 |
03/23 |
$30,668 |
$17,473 |
$32,305 |
04/23 |
$30,303 |
$17,724 |
$32,199 |
05/23 |
$33,397 |
$17,534 |
$35,217 |
06/23 |
$35,392 |
$18,552 |
$37,280 |
07/23 |
$36,745 |
$19,232 |
$38,105 |
08/23 |
$36,193 |
$18,694 |
$37,362 |
09/23 |
$33,966 |
$17,921 |
$34,835 |
10/23 |
$33,436 |
$17,382 |
$34,718 |
11/23 |
$37,728 |
$18,987 |
$39,381 |
12/23 |
$39,639 |
$19,899 |
$41,070 |
01/24 |
$41,323 |
$20,015 |
$42,518 |
02/24 |
$44,328 |
$20,874 |
$45,172 |
03/24 |
$45,283 |
$21,530 |
$46,386 |
04/24 |
$43,035 |
$20,819 |
$43,786 |
05/24 |
$45,949 |
$21,665 |
$47,637 |
06/24 |
$49,655 |
$22,147 |
$52,114 |
07/24 |
$47,881 |
$22,504 |
$50,956 |
08/24 |
$48,305 |
$23,076 |
$51,530 |
09/24 |
$49,186 |
$23,612 |
$52,488 |
10/24 |
$49,192 |
$23,082 |
$51,892 |
11/24 |
$51,655 |
$23,945 |
$53,793 |
12/24 |
$52,206 |
$23,379 |
$54,439 |
01/25 |
$52,862 |
$24,163 |
$53,557 |
02/25 |
$50,626 |
$24,018 |
$52,662 |
03/25 |
$45,806 |
$23,069 |
$48,104 |
04/25 |
$46,912 |
$23,284 |
$49,021 |
05/25 |
$52,132 |
$24,622 |
$54,219 |
06/25 |
$57,169 |
$25,728 |
$59,485 |
07/25 |
$59,394 |
$26,077 |
$62,031 |
08/25 |
$59,759 |
$26,721 |
$62,251 |
09/25 |
$64,065 |
$27,689 |
$67,109 |
10/25 |
$67,556 |
$28,308 |
$71,973 |
11/25 |
$65,246 |
$28,305 |
$68,670 |
12/25 |
$65,328 |
$28,601 |
$69,266 |
01/26 |
$66,634 |
$29,449 |
$69,920 |
02/26 |
$65,016 |
$29,827 |
$69,236 |
03/26 |
$61,373 |
$27,685 |
$64,717 |
04/26 |
$72,924 |
$30,502 |
$77,170 |
05/26 |
$83,028 |
$32,075 |
$90,671 |
06/26 |
$85,464 |
$31,818 |
$89,156 |
07/26 |
$77,826 |
$31,842 |
$84,448 |
08/26 |
$81,680 |
$32,693 |
$89,272 |
|
| Average Annual Return [Table Text Block] |
Table Summary
Average Annual Total Returns (%) |
1 year |
5 years |
10 years |
Class SFootnote Reference(a) |
36.68 |
17.15 |
23.37 |
MSCI ACWI Index (Net) |
22.35 |
10.88 |
12.58 |
S&P Global 1200 Information Technology Index (Net) |
43.41 |
20.37 |
24.47 | |
| No Deduction of Taxes [Text Block] |
Performance does not reflect the deduction of taxes that a shareholder may pay on fund distributions or on the redemptions of fund shares.
|
| Updated Performance Information Location [Text Block] |
columbiathreadneedleus.com/investment-products/mutual-funds
|
| AssetsNet |
$ 5,398,705,730
|
| Holdings Count | Holding |
101
|
| Advisory Fees Paid, Amount |
$ 37,571,623
|
| InvestmentCompanyPortfolioTurnover |
10.00%
|
| Additional Fund Statistics [Text Block] |
Table Summary
Fund net assets |
$5,398,705,730 |
Total number of portfolio holdings |
101 |
Management services fees (represents 0.78% of Fund average net assets) |
$37,571,623 |
Portfolio turnover for the reporting period |
10% | |
| Holdings [Text Block] |
Information Technology Sub-Industry Allocation
Table Summary
Semiconductors |
37.8% |
Technology Hardware, Storage & Peripherals |
12.2% |
Semiconductor Materials & Equipment |
11.8% |
Systems Software |
10.7% |
Application Software |
4.1% |
Communications Equipment |
2.7% |
Internet Services & Infrastructure |
1.8% |
Electronic Components |
1.2% |
Other |
1.4% |
Table Summary
Information Technology |
83.7% |
Communication Services |
7.3% |
Consumer Discretionary |
3.6% |
Financials |
3.6% |
Industrials |
0.7% | |
| Largest Holdings [Text Block] |
Table Summary
NVIDIA Corp. |
14.2% |
Apple, Inc. |
7.6% |
Broadcom, Inc. |
7.5% |
Microsoft Corp. |
6.6% |
Lam Research Corp. |
6.1% |
Micron Technology, Inc. |
5.7% |
Alphabet, Inc., Class A |
3.8% |
Taiwan Semiconductor Manufacturing Co., Ltd., ADR |
3.7% |
Amazon.com, Inc. |
2.7% |
Applied Materials, Inc. |
2.6% | |
| Material Fund Change [Text Block] |
|
| C000032843 |
|
| Shareholder Report [Line Items] |
|
| Fund Name |
Columbia Greater China Fund
|
| Class Name |
Class A
|
| Trading Symbol |
NGCAX
|
| Annual or Semi-Annual Statement [Text Block] |
This annual shareholder report contains important information about Columbia Greater China Fund (the Fund) for the period of September 1, 2025 to August 31, 2026.
|
| Additional Information [Text Block] |
You can find additional information about the Fund at columbiathreadneedleus.com/resources/literature. You can also request more information by contacting us at 1-800-345-6611.
|
| Additional Information Phone Number |
1-800-345-6611
|
| Additional Information Website |
columbiathreadneedleus.com/resources/literature
|
| Expenses [Text Block] |
What were the Fund costs for the reporting period? (Based on a hypothetical $10,000 investment)
Table Summary
Class |
Cost of a $10,000 investment |
Cost paid as a percentage of a $10,000 investment |
Class A |
$140 |
1.47% | |
| Expenses Paid, Amount |
$ 140
|
| Expense Ratio, Percent |
1.47%
|
| Factors Affecting Performance [Text Block] |
Management's Discussion of Fund Performance The performance of Class A shares for the period presented is shown in the Average Annual Total Returns table. Top Performance ContributorsStock selection | Selections in the information technology sector boosted the Fund’s performance relative to the benchmark during the period, followed to a lesser extent by selections in the industrials, energy and real estate sectors. Allocations | Larger allocations to the industrials and information technology sectors and a smaller allocation to the consumer discretionary sector buoyed the Fund’s relative performance during the period. Individual holdings | Positions in Unimicron Technology Corp., a Taiwanese manufacturer of circuit boards; Taiwan Semiconductor Manufacturing Company, the world's largest dedicated semiconductor foundry; Sieyuan Electric Co., a China-based manufacturer of power transmission and electrical grid equipment; Jentech Precision Industrial, a Taiwanese technology hardware company that provides precision components and thermal management solutions for semiconductors, AI servers, data centers and other electronics applications; and ASPEED Technology, Inc., a Taiwanese semiconductor devices company, were among the top contributors to the Fund’s relative performance. Top Performance DetractorsStock selection | Selections in the consumer staples, materials, financials, consumer discretionary and communication services sectors hurt the Fund’s performance relative to the benchmark during the period. Allocations | Smaller weightings in the financials, energy and materials sectors and a larger allocation to the communication services sector detracted from the Fund’s relative performance. Individual holdings | Fund positions in Trip.com, a provider of travel-related services; Eastroc Beverage Group, an energy drink company; Futu Holdings, a Hong Kong–based digital brokerage platform; Giant Biogene, biotechnology and consumer health company focused on recombinant collagen products used in skincare, medical aesthetics and wound-care applications; and Zijin Gold International, a precious-metals mining company that provides exposure to gold prices through a diversified portfolio of mining operations, were top detractors from the Fund’s relative performance during the period. |
| Performance Past Does Not Indicate Future [Text] |
The Fund's past performance is not a good predictor of the Fund's future performance.
|
| Line Graph [Table Text Block] |
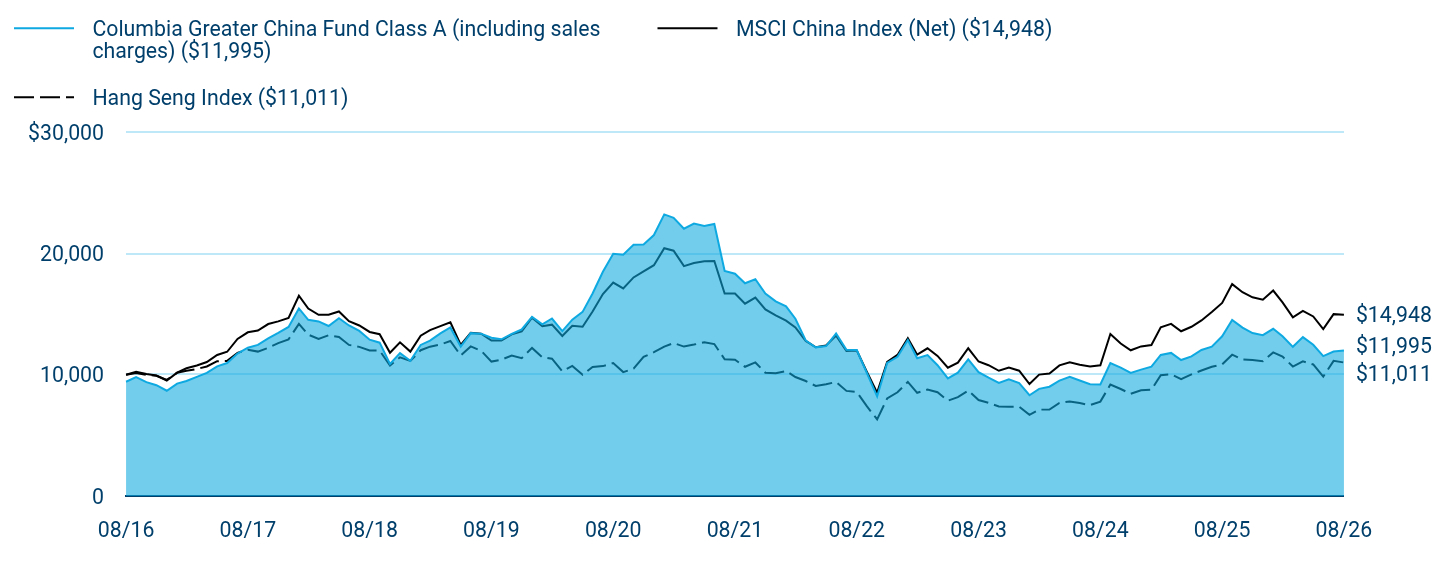
Table Summary
|
Columbia Greater China Fund Class A (including sales charges) ($11,995) |
MSCI China Index (Net) ($14,948) |
Hang Seng Index ($11,011) |
08/16 |
$9,424 |
$10,000 |
$10,000 |
09/16 |
$9,799 |
$10,253 |
$10,140 |
10/16 |
$9,395 |
$10,054 |
$9,984 |
11/16 |
$9,135 |
$9,934 |
$9,919 |
12/16 |
$8,680 |
$9,527 |
$9,580 |
01/17 |
$9,266 |
$10,174 |
$10,164 |
02/17 |
$9,481 |
$10,534 |
$10,325 |
03/17 |
$9,829 |
$10,759 |
$10,474 |
04/17 |
$10,153 |
$11,046 |
$10,684 |
05/17 |
$10,696 |
$11,629 |
$11,117 |
06/17 |
$10,964 |
$11,896 |
$11,142 |
07/17 |
$11,748 |
$12,953 |
$11,811 |
08/17 |
$12,228 |
$13,500 |
$12,065 |
09/17 |
$12,463 |
$13,640 |
$11,909 |
10/17 |
$13,001 |
$14,182 |
$12,222 |
11/17 |
$13,448 |
$14,403 |
$12,612 |
12/17 |
$13,945 |
$14,679 |
$12,921 |
01/18 |
$15,467 |
$16,512 |
$14,195 |
02/18 |
$14,532 |
$15,454 |
$13,307 |
03/18 |
$14,395 |
$14,946 |
$12,945 |
04/18 |
$14,019 |
$14,942 |
$13,252 |
05/18 |
$14,663 |
$15,217 |
$13,113 |
06/18 |
$14,065 |
$14,422 |
$12,460 |
07/18 |
$13,615 |
$14,063 |
$12,297 |
08/18 |
$12,889 |
$13,529 |
$11,996 |
09/18 |
$12,644 |
$13,340 |
$11,989 |
10/18 |
$10,890 |
$11,810 |
$10,758 |
11/18 |
$11,782 |
$12,675 |
$11,435 |
12/18 |
$11,143 |
$11,908 |
$11,145 |
01/19 |
$12,460 |
$13,225 |
$12,022 |
02/19 |
$12,820 |
$13,681 |
$12,315 |
03/19 |
$13,406 |
$14,015 |
$12,494 |
04/19 |
$13,899 |
$14,327 |
$12,780 |
05/19 |
$12,321 |
$12,452 |
$11,583 |
06/19 |
$13,432 |
$13,452 |
$12,334 |
07/19 |
$13,391 |
$13,379 |
$11,980 |
08/19 |
$13,055 |
$12,819 |
$11,084 |
09/19 |
$12,924 |
$12,816 |
$11,237 |
10/19 |
$13,371 |
$13,333 |
$11,590 |
11/19 |
$13,742 |
$13,571 |
$11,363 |
12/19 |
$14,775 |
$14,701 |
$12,214 |
01/20 |
$14,165 |
$13,995 |
$11,440 |
02/20 |
$14,639 |
$14,131 |
$11,320 |
03/20 |
$13,602 |
$13,200 |
$10,281 |
04/20 |
$14,545 |
$14,033 |
$10,732 |
05/20 |
$15,181 |
$13,964 |
$10,001 |
06/20 |
$16,696 |
$15,218 |
$10,640 |
07/20 |
$18,496 |
$16,655 |
$10,714 |
08/20 |
$19,982 |
$17,600 |
$10,967 |
09/20 |
$19,893 |
$17,119 |
$10,219 |
10/20 |
$20,721 |
$18,025 |
$10,495 |
11/20 |
$20,748 |
$18,525 |
$11,471 |
12/20 |
$21,520 |
$19,037 |
$11,857 |
01/21 |
$23,225 |
$20,439 |
$12,315 |
02/21 |
$22,948 |
$20,227 |
$12,612 |
03/21 |
$22,044 |
$18,956 |
$12,323 |
04/21 |
$22,463 |
$19,219 |
$12,486 |
05/21 |
$22,260 |
$19,367 |
$12,681 |
06/21 |
$22,436 |
$19,386 |
$12,532 |
07/21 |
$18,568 |
$16,702 |
$11,278 |
08/21 |
$18,330 |
$16,703 |
$11,234 |
09/21 |
$17,547 |
$15,864 |
$10,658 |
10/21 |
$17,874 |
$16,365 |
$11,014 |
11/21 |
$16,702 |
$15,387 |
$10,166 |
12/21 |
$16,054 |
$14,903 |
$10,132 |
01/22 |
$15,644 |
$14,463 |
$10,306 |
02/22 |
$14,620 |
$13,899 |
$9,814 |
03/22 |
$12,828 |
$12,788 |
$9,483 |
04/22 |
$12,260 |
$12,265 |
$9,074 |
05/22 |
$12,368 |
$12,410 |
$9,215 |
06/22 |
$13,405 |
$13,224 |
$9,405 |
07/22 |
$12,054 |
$11,968 |
$8,669 |
08/22 |
$12,032 |
$11,995 |
$8,583 |
09/22 |
$10,163 |
$10,249 |
$7,407 |
10/22 |
$8,214 |
$8,526 |
$6,317 |
11/22 |
$10,980 |
$11,059 |
$8,044 |
12/22 |
$11,474 |
$11,634 |
$8,557 |
01/23 |
$12,871 |
$13,005 |
$9,407 |
02/23 |
$11,366 |
$11,656 |
$8,510 |
03/23 |
$11,622 |
$12,182 |
$8,774 |
04/23 |
$10,783 |
$11,554 |
$8,556 |
05/23 |
$9,697 |
$10,580 |
$7,864 |
06/23 |
$10,175 |
$10,999 |
$8,149 |
07/23 |
$11,270 |
$12,183 |
$8,692 |
08/23 |
$10,209 |
$11,092 |
$7,914 |
09/23 |
$9,756 |
$10,786 |
$7,677 |
10/23 |
$9,330 |
$10,327 |
$7,383 |
11/23 |
$9,614 |
$10,587 |
$7,367 |
12/23 |
$9,305 |
$10,332 |
$7,370 |
01/24 |
$8,307 |
$9,235 |
$6,688 |
02/24 |
$8,834 |
$10,010 |
$7,120 |
03/24 |
$9,014 |
$10,105 |
$7,135 |
04/24 |
$9,510 |
$10,771 |
$7,667 |
05/24 |
$9,829 |
$11,030 |
$7,802 |
06/24 |
$9,529 |
$10,821 |
$7,662 |
07/24 |
$9,215 |
$10,678 |
$7,496 |
08/24 |
$9,197 |
$10,785 |
$7,786 |
09/24 |
$10,970 |
$13,363 |
$9,186 |
10/24 |
$10,589 |
$12,573 |
$8,823 |
11/24 |
$10,146 |
$12,015 |
$8,427 |
12/24 |
$10,425 |
$12,338 |
$8,718 |
01/25 |
$10,672 |
$12,452 |
$8,763 |
02/25 |
$11,632 |
$13,916 |
$9,960 |
03/25 |
$11,801 |
$14,192 |
$10,032 |
04/25 |
$11,211 |
$13,586 |
$9,630 |
05/25 |
$11,519 |
$13,958 |
$10,027 |
06/25 |
$12,045 |
$14,477 |
$10,353 |
07/25 |
$12,321 |
$15,172 |
$10,654 |
08/25 |
$13,168 |
$15,921 |
$10,860 |
09/25 |
$14,516 |
$17,473 |
$11,653 |
10/25 |
$13,889 |
$16,807 |
$11,253 |
11/25 |
$13,434 |
$16,387 |
$11,213 |
12/25 |
$13,260 |
$16,184 |
$11,117 |
01/26 |
$13,786 |
$16,944 |
$11,839 |
02/26 |
$13,180 |
$15,967 |
$11,494 |
03/26 |
$12,302 |
$14,738 |
$10,674 |
04/26 |
$13,100 |
$15,273 |
$11,109 |
05/26 |
$12,474 |
$14,810 |
$10,848 |
06/26 |
$11,539 |
$13,761 |
$9,850 |
07/26 |
$11,915 |
$14,999 |
$11,144 |
08/26 |
$11,995 |
$14,948 |
$11,011 |
|
| Average Annual Return [Table Text Block] |
Table Summary
Average Annual Total Returns (%) |
1 year |
5 years |
10 years |
Class A (excluding sales charges) |
(8.90) |
(8.13) |
2.44 |
Class A (including sales charges) |
(14.14) |
(9.21) |
1.84 |
MSCI China Index (Net) |
(6.11) |
(2.20) |
4.10 |
Hang Seng Index |
1.39 |
(0.40) |
0.97 | |
| No Deduction of Taxes [Text Block] |
Performance does not reflect the deduction of taxes that a shareholder may pay on fund distributions or on the redemptions of fund shares.
|
| Updated Performance Information Location [Text Block] |
columbiathreadneedleus.com/investment-products/mutual-funds
|
| AssetsNet |
$ 42,032,494
|
| Holdings Count | Holding |
59
|
| Advisory Fees Paid, Amount |
$ 458,015
|
| InvestmentCompanyPortfolioTurnover |
55.00%
|
| Additional Fund Statistics [Text Block] |
Table Summary
Fund net assets |
$42,032,494 |
Total number of portfolio holdings |
59 |
Management services fees (represents 0.95% of Fund average net assets) |
$458,015 |
Portfolio turnover for the reporting period |
55% | |
| Holdings [Text Block] |
Table Summary
Information Technology |
21.5% |
Consumer Discretionary |
19.2% |
Communication Services |
15.4% |
Financials |
13.6% |
Industrials |
11.6% |
Health Care |
6.4% |
Materials |
6.1% |
Real Estate |
2.8% |
Energy |
2.6% |
Table Summary
Common Stocks |
99.2% |
Money Market Funds |
1.1% | |
| Largest Holdings [Text Block] |
Table Summary
Tencent Holdings Ltd. |
12.3% |
Alibaba Group Holding Ltd. |
12.3% |
China Construction Bank Corp., Class H |
7.0% |
Contemporary Amperex Technology Co., Ltd., Class A |
4.2% |
Taiwan Semiconductor Manufacturing Co., Ltd. |
3.9% |
Ping An Insurance Group Co. of China Ltd., Class H |
3.8% |
Zijin Mining Group Co., Ltd., Class H |
3.5% |
Unimicron Technology Corp. |
2.8% |
NetEase, Inc. |
2.7% |
China Merchants Bank Co., Ltd., Class H |
2.5% | |
| Material Fund Change [Text Block] |
|
| C000032846 |
|
| Shareholder Report [Line Items] |
|
| Fund Name |
Columbia Greater China Fund
|
| Class Name |
Institutional Class
|
| Trading Symbol |
LNGZX
|
| Annual or Semi-Annual Statement [Text Block] |
This annual shareholder report contains important information about Columbia Greater China Fund (the Fund) for the period of September 1, 2025 to August 31, 2026.
|
| Additional Information [Text Block] |
You can find additional information about the Fund at columbiathreadneedleus.com/resources/literature. You can also request more information by contacting us at 1-800-345-6611.
|
| Additional Information Phone Number |
1-800-345-6611
|
| Additional Information Website |
columbiathreadneedleus.com/resources/literature
|
| Expenses [Text Block] |
What were the Fund costs for the reporting period? (Based on a hypothetical $10,000 investment)
Table Summary
Class |
Cost of a $10,000 investment |
Cost paid as a percentage of a $10,000 investment |
Institutional Class |
$117 |
1.22% | |
| Expenses Paid, Amount |
$ 117
|
| Expense Ratio, Percent |
1.22%
|
| Factors Affecting Performance [Text Block] |
Management's Discussion of Fund Performance The performance of Institutional Class shares for the period presented is shown in the Average Annual Total Returns table. Top Performance ContributorsStock selection | Selections in the information technology sector boosted the Fund’s performance relative to the benchmark during the period, followed to a lesser extent by selections in the industrials, energy and real estate sectors. Allocations | Larger allocations to the industrials and information technology sectors and a smaller allocation to the consumer discretionary sector buoyed the Fund’s relative performance during the period. Individual holdings | Positions in Unimicron Technology Corp., a Taiwanese manufacturer of circuit boards; Taiwan Semiconductor Manufacturing Company, the world's largest dedicated semiconductor foundry; Sieyuan Electric Co., a China-based manufacturer of power transmission and electrical grid equipment; Jentech Precision Industrial, a Taiwanese technology hardware company that provides precision components and thermal management solutions for semiconductors, AI servers, data centers and other electronics applications; and ASPEED Technology, Inc., a Taiwanese semiconductor devices company, were among the top contributors to the Fund’s relative performance. Top Performance DetractorsStock selection | Selections in the consumer staples, materials, financials, consumer discretionary and communication services sectors hurt the Fund’s performance relative to the benchmark during the period. Allocations | Smaller weightings in the financials, energy and materials sectors and a larger allocation to the communication services sector detracted from the Fund’s relative performance. Individual holdings | Fund positions in Trip.com, a provider of travel-related services; Eastroc Beverage Group, an energy drink company; Futu Holdings, a Hong Kong–based digital brokerage platform; Giant Biogene, biotechnology and consumer health company focused on recombinant collagen products used in skincare, medical aesthetics and wound-care applications; and Zijin Gold International, a precious-metals mining company that provides exposure to gold prices through a diversified portfolio of mining operations, were top detractors from the Fund’s relative performance during the period. |
| Performance Past Does Not Indicate Future [Text] |
The Fund's past performance is not a good predictor of the Fund's future performance.
|
| Line Graph [Table Text Block] |
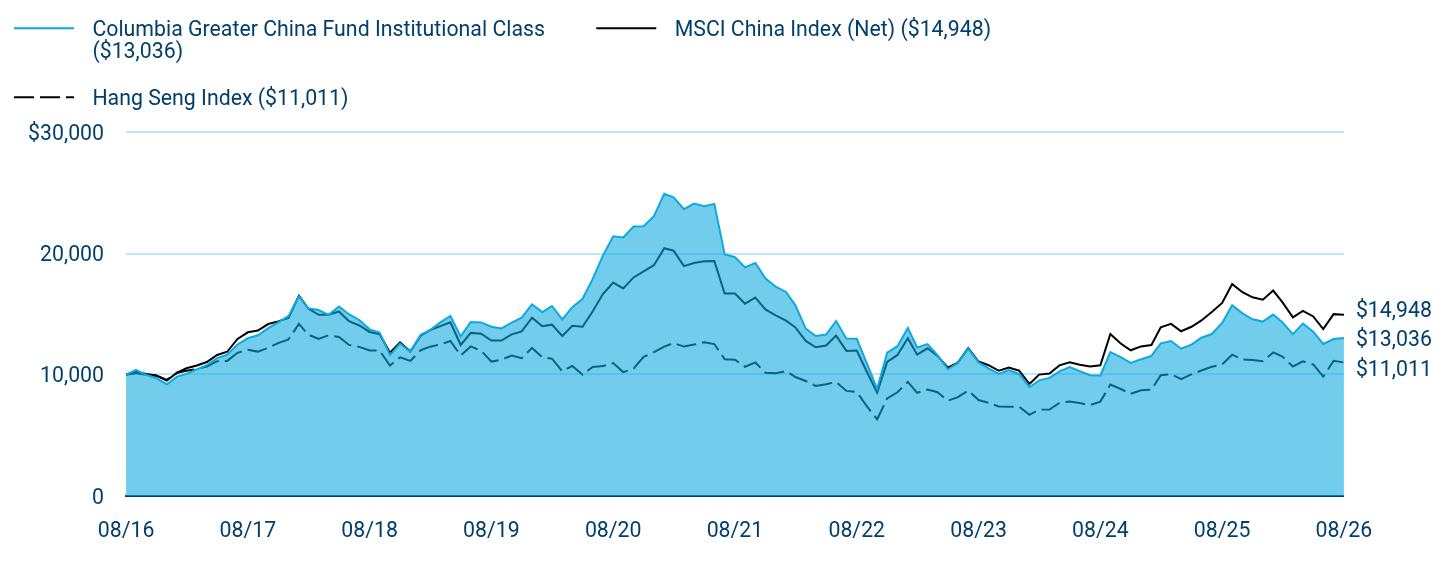
Table Summary
|
Columbia Greater China Fund Institutional Class ($13,036) |
MSCI China Index (Net) ($14,948) |
Hang Seng Index ($11,011) |
08/16 |
$10,000 |
$10,000 |
$10,000 |
09/16 |
$10,399 |
$10,253 |
$10,140 |
10/16 |
$9,974 |
$10,054 |
$9,984 |
11/16 |
$9,698 |
$9,934 |
$9,919 |
12/16 |
$9,219 |
$9,527 |
$9,580 |
01/17 |
$9,842 |
$10,174 |
$10,164 |
02/17 |
$10,071 |
$10,534 |
$10,325 |
03/17 |
$10,444 |
$10,759 |
$10,474 |
04/17 |
$10,791 |
$11,046 |
$10,684 |
05/17 |
$11,369 |
$11,629 |
$11,117 |
06/17 |
$11,658 |
$11,896 |
$11,142 |
07/17 |
$12,494 |
$12,953 |
$11,811 |
08/17 |
$13,007 |
$13,500 |
$12,065 |
09/17 |
$13,259 |
$13,640 |
$11,909 |
10/17 |
$13,837 |
$14,182 |
$12,222 |
11/17 |
$14,315 |
$14,403 |
$12,612 |
12/17 |
$14,849 |
$14,679 |
$12,921 |
01/18 |
$16,472 |
$16,512 |
$14,195 |
02/18 |
$15,478 |
$15,454 |
$13,307 |
03/18 |
$15,336 |
$14,946 |
$12,945 |
04/18 |
$14,937 |
$14,942 |
$13,252 |
05/18 |
$15,628 |
$15,217 |
$13,113 |
06/18 |
$14,993 |
$14,422 |
$12,460 |
07/18 |
$14,516 |
$14,063 |
$12,297 |
08/18 |
$13,745 |
$13,529 |
$11,996 |
09/18 |
$13,488 |
$13,340 |
$11,989 |
10/18 |
$11,617 |
$11,810 |
$10,758 |
11/18 |
$12,574 |
$12,675 |
$11,435 |
12/18 |
$11,893 |
$11,908 |
$11,145 |
01/19 |
$13,302 |
$13,225 |
$12,022 |
02/19 |
$13,687 |
$13,681 |
$12,315 |
03/19 |
$14,317 |
$14,015 |
$12,494 |
04/19 |
$14,847 |
$14,327 |
$12,780 |
05/19 |
$13,163 |
$12,452 |
$11,583 |
06/19 |
$14,354 |
$13,452 |
$12,334 |
07/19 |
$14,314 |
$13,379 |
$11,980 |
08/19 |
$13,957 |
$12,819 |
$11,084 |
09/19 |
$13,821 |
$12,816 |
$11,237 |
10/19 |
$14,300 |
$13,333 |
$11,590 |
11/19 |
$14,702 |
$13,571 |
$11,363 |
12/19 |
$15,810 |
$14,701 |
$12,214 |
01/20 |
$15,161 |
$13,995 |
$11,440 |
02/20 |
$15,670 |
$14,131 |
$11,320 |
03/20 |
$14,562 |
$13,200 |
$10,281 |
04/20 |
$15,575 |
$14,033 |
$10,732 |
05/20 |
$16,262 |
$13,964 |
$10,001 |
06/20 |
$17,887 |
$15,218 |
$10,640 |
07/20 |
$19,822 |
$16,655 |
$10,714 |
08/20 |
$21,415 |
$17,600 |
$10,967 |
09/20 |
$21,326 |
$17,119 |
$10,219 |
10/20 |
$22,217 |
$18,025 |
$10,495 |
11/20 |
$22,252 |
$18,525 |
$11,471 |
12/20 |
$23,082 |
$19,037 |
$11,857 |
01/21 |
$24,917 |
$20,439 |
$12,315 |
02/21 |
$24,626 |
$20,227 |
$12,612 |
03/21 |
$23,659 |
$18,956 |
$12,323 |
04/21 |
$24,115 |
$19,219 |
$12,486 |
05/21 |
$23,902 |
$19,367 |
$12,681 |
06/21 |
$24,091 |
$19,386 |
$12,532 |
07/21 |
$19,944 |
$16,702 |
$11,278 |
08/21 |
$19,695 |
$16,703 |
$11,234 |
09/21 |
$18,854 |
$15,864 |
$10,658 |
10/21 |
$19,212 |
$16,365 |
$11,014 |
11/21 |
$17,954 |
$15,387 |
$10,166 |
12/21 |
$17,263 |
$14,903 |
$10,132 |
01/22 |
$16,828 |
$14,463 |
$10,306 |
02/22 |
$15,726 |
$13,899 |
$9,814 |
03/22 |
$13,801 |
$12,788 |
$9,483 |
04/22 |
$13,194 |
$12,265 |
$9,074 |
05/22 |
$13,314 |
$12,410 |
$9,215 |
06/22 |
$14,431 |
$13,224 |
$9,405 |
07/22 |
$12,978 |
$11,968 |
$8,669 |
08/22 |
$12,960 |
$11,995 |
$8,583 |
09/22 |
$10,948 |
$10,249 |
$7,407 |
10/22 |
$8,840 |
$8,526 |
$6,317 |
11/22 |
$11,822 |
$11,059 |
$8,044 |
12/22 |
$12,356 |
$11,634 |
$8,557 |
01/23 |
$13,864 |
$13,005 |
$9,407 |
02/23 |
$12,245 |
$11,656 |
$8,510 |
03/23 |
$12,522 |
$12,182 |
$8,774 |
04/23 |
$11,624 |
$11,554 |
$8,556 |
05/23 |
$10,453 |
$10,580 |
$7,864 |
06/23 |
$10,972 |
$10,999 |
$8,149 |
07/23 |
$12,155 |
$12,183 |
$8,692 |
08/23 |
$11,014 |
$11,092 |
$7,914 |
09/23 |
$10,525 |
$10,786 |
$7,677 |
10/23 |
$10,071 |
$10,327 |
$7,383 |
11/23 |
$10,378 |
$10,587 |
$7,367 |
12/23 |
$10,045 |
$10,332 |
$7,370 |
01/24 |
$8,969 |
$9,235 |
$6,688 |
02/24 |
$9,540 |
$10,010 |
$7,120 |
03/24 |
$9,737 |
$10,105 |
$7,135 |
04/24 |
$10,275 |
$10,771 |
$7,667 |
05/24 |
$10,623 |
$11,030 |
$7,802 |
06/24 |
$10,299 |
$10,821 |
$7,662 |
07/24 |
$9,964 |
$10,678 |
$7,496 |
08/24 |
$9,946 |
$10,785 |
$7,786 |
09/24 |
$11,865 |
$13,363 |
$9,186 |
10/24 |
$11,454 |
$12,573 |
$8,823 |
11/24 |
$10,979 |
$12,015 |
$8,427 |
12/24 |
$11,282 |
$12,338 |
$8,718 |
01/25 |
$11,551 |
$12,452 |
$8,763 |
02/25 |
$12,592 |
$13,916 |
$9,960 |
03/25 |
$12,778 |
$14,192 |
$10,032 |
04/25 |
$12,145 |
$13,586 |
$9,630 |
05/25 |
$12,478 |
$13,958 |
$10,027 |
06/25 |
$13,051 |
$14,477 |
$10,353 |
07/25 |
$13,357 |
$15,172 |
$10,654 |
08/25 |
$14,275 |
$15,921 |
$10,860 |
09/25 |
$15,740 |
$17,473 |
$11,653 |
10/25 |
$15,064 |
$16,807 |
$11,253 |
11/25 |
$14,571 |
$16,387 |
$11,213 |
12/25 |
$14,386 |
$16,184 |
$11,117 |
01/26 |
$14,963 |
$16,944 |
$11,839 |
02/26 |
$14,305 |
$15,967 |
$11,494 |
03/26 |
$13,354 |
$14,738 |
$10,674 |
04/26 |
$14,224 |
$15,273 |
$11,109 |
05/26 |
$13,548 |
$14,810 |
$10,848 |
06/26 |
$12,535 |
$13,761 |
$9,850 |
07/26 |
$12,946 |
$14,999 |
$11,144 |
08/26 |
$13,036 |
$14,948 |
$11,011 |
|
| Average Annual Return [Table Text Block] |
Table Summary
Average Annual Total Returns (%) |
1 year |
5 years |
10 years |
Institutional Class |
(8.67) |
(7.92) |
2.69 |
MSCI China Index (Net) |
(6.11) |
(2.20) |
4.10 |
Hang Seng Index |
1.39 |
(0.40) |
0.97 | |
| No Deduction of Taxes [Text Block] |
Performance does not reflect the deduction of taxes that a shareholder may pay on fund distributions or on the redemptions of fund shares.
|
| Updated Performance Information Location [Text Block] |
columbiathreadneedleus.com/investment-products/mutual-funds
|
| AssetsNet |
$ 42,032,494
|
| Holdings Count | Holding |
59
|
| Advisory Fees Paid, Amount |
$ 458,015
|
| InvestmentCompanyPortfolioTurnover |
55.00%
|
| Additional Fund Statistics [Text Block] |
Table Summary
Fund net assets |
$42,032,494 |
Total number of portfolio holdings |
59 |
Management services fees (represents 0.95% of Fund average net assets) |
$458,015 |
Portfolio turnover for the reporting period |
55% | |
| Holdings [Text Block] |
Table Summary
Information Technology |
21.5% |
Consumer Discretionary |
19.2% |
Communication Services |
15.4% |
Financials |
13.6% |
Industrials |
11.6% |
Health Care |
6.4% |
Materials |
6.1% |
Real Estate |
2.8% |
Energy |
2.6% |
Table Summary
Common Stocks |
99.2% |
Money Market Funds |
1.1% | |
| Largest Holdings [Text Block] |
Table Summary
Tencent Holdings Ltd. |
12.3% |
Alibaba Group Holding Ltd. |
12.3% |
China Construction Bank Corp., Class H |
7.0% |
Contemporary Amperex Technology Co., Ltd., Class A |
4.2% |
Taiwan Semiconductor Manufacturing Co., Ltd. |
3.9% |
Ping An Insurance Group Co. of China Ltd., Class H |
3.8% |
Zijin Mining Group Co., Ltd., Class H |
3.5% |
Unimicron Technology Corp. |
2.8% |
NetEase, Inc. |
2.7% |
China Merchants Bank Co., Ltd., Class H |
2.5% | |
| Material Fund Change [Text Block] |
|
| C000179749 |
|
| Shareholder Report [Line Items] |
|
| Fund Name |
Columbia Greater China Fund
|
| Class Name |
Institutional 3 Class
|
| Trading Symbol |
CGCYX
|
| Annual or Semi-Annual Statement [Text Block] |
This annual shareholder report contains important information about Columbia Greater China Fund (the Fund) for the period of September 1, 2025 to August 31, 2026.
|
| Additional Information [Text Block] |
You can find additional information about the Fund at columbiathreadneedleus.com/resources/literature. You can also request more information by contacting us at 1-800-345-6611.
|
| Additional Information Phone Number |
1-800-345-6611
|
| Additional Information Website |
columbiathreadneedleus.com/resources/literature
|
| Expenses [Text Block] |
What were the Fund costs for the reporting period? (Based on a hypothetical $10,000 investment)
Table Summary
Class |
Cost of a $10,000 investment |
Cost paid as a percentage of a $10,000 investment |
Institutional 3 Class |
$104 |
1.09% | |
| Expenses Paid, Amount |
$ 104
|
| Expense Ratio, Percent |
1.09%
|
| Factors Affecting Performance [Text Block] |
Management's Discussion of Fund Performance The performance of Institutional 3 Class shares for the period presented is shown in the Average Annual Total Returns table. Top Performance ContributorsStock selection | Selections in the information technology sector boosted the Fund’s performance relative to the benchmark during the period, followed to a lesser extent by selections in the industrials, energy and real estate sectors. Allocations | Larger allocations to the industrials and information technology sectors and a smaller allocation to the consumer discretionary sector buoyed the Fund’s relative performance during the period. Individual holdings | Positions in Unimicron Technology Corp., a Taiwanese manufacturer of circuit boards; Taiwan Semiconductor Manufacturing Company, the world's largest dedicated semiconductor foundry; Sieyuan Electric Co., a China-based manufacturer of power transmission and electrical grid equipment; Jentech Precision Industrial, a Taiwanese technology hardware company that provides precision components and thermal management solutions for semiconductors, AI servers, data centers and other electronics applications; and ASPEED Technology, Inc., a Taiwanese semiconductor devices company, were among the top contributors to the Fund’s relative performance. Top Performance DetractorsStock selection | Selections in the consumer staples, materials, financials, consumer discretionary and communication services sectors hurt the Fund’s performance relative to the benchmark during the period. Allocations | Smaller weightings in the financials, energy and materials sectors and a larger allocation to the communication services sector detracted from the Fund’s relative performance. Individual holdings | Fund positions in Trip.com, a provider of travel-related services; Eastroc Beverage Group, an energy drink company; Futu Holdings, a Hong Kong–based digital brokerage platform; Giant Biogene, biotechnology and consumer health company focused on recombinant collagen products used in skincare, medical aesthetics and wound-care applications; and Zijin Gold International, a precious-metals mining company that provides exposure to gold prices through a diversified portfolio of mining operations, were top detractors from the Fund’s relative performance during the period. |
| Performance Past Does Not Indicate Future [Text] |
The Fund's past performance is not a good predictor of the Fund's future performance.
|
| Line Graph [Table Text Block] |
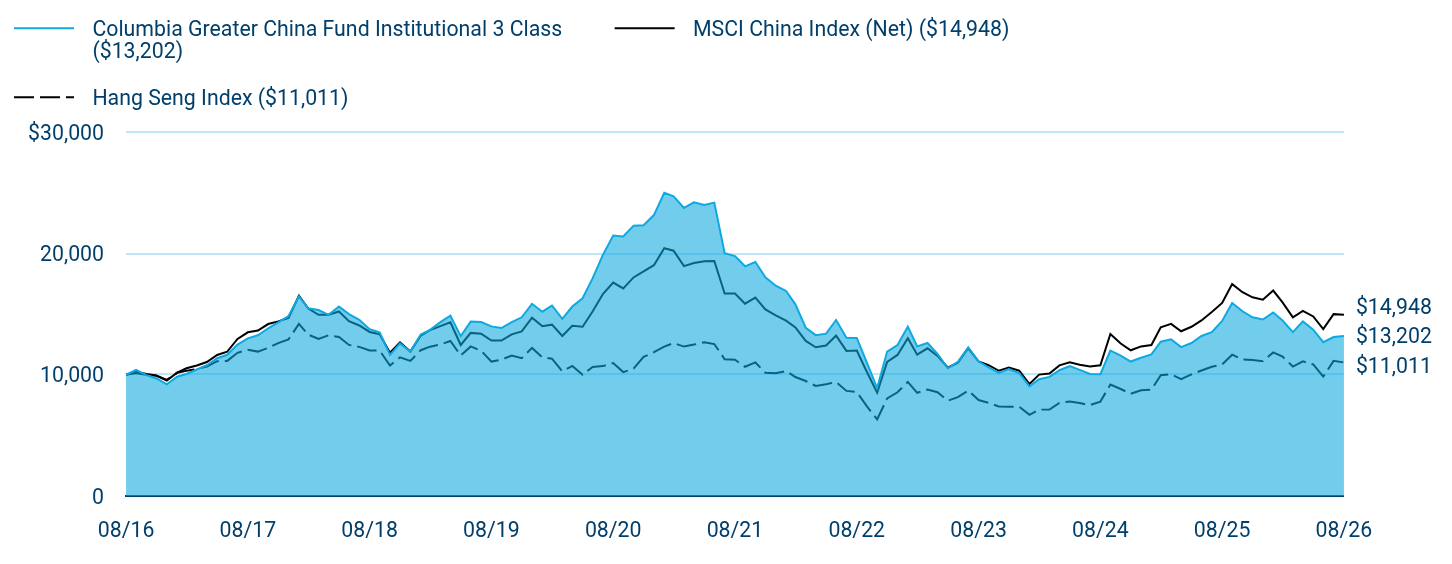
Table Summary
|
Columbia Greater China Fund Institutional 3 Class ($13,202) |
MSCI China Index (Net) ($14,948) |
Hang Seng Index ($11,011) |
08/16 |
$10,000 |
$10,000 |
$10,000 |
09/16 |
$10,398 |
$10,253 |
$10,140 |
10/16 |
$9,969 |
$10,054 |
$9,984 |
11/16 |
$9,693 |
$9,934 |
$9,919 |
12/16 |
$9,210 |
$9,527 |
$9,580 |
01/17 |
$9,832 |
$10,174 |
$10,164 |
02/17 |
$10,060 |
$10,534 |
$10,325 |
03/17 |
$10,431 |
$10,759 |
$10,474 |
04/17 |
$10,782 |
$11,046 |
$10,684 |
05/17 |
$11,360 |
$11,629 |
$11,117 |
06/17 |
$11,648 |
$11,896 |
$11,142 |
07/17 |
$12,485 |
$12,953 |
$11,811 |
08/17 |
$12,999 |
$13,500 |
$12,065 |
09/17 |
$13,253 |
$13,640 |
$11,909 |
10/17 |
$13,831 |
$14,182 |
$12,222 |
11/17 |
$14,311 |
$14,403 |
$12,612 |
12/17 |
$14,846 |
$14,679 |
$12,921 |
01/18 |
$16,470 |
$16,512 |
$14,195 |
02/18 |
$15,476 |
$15,454 |
$13,307 |
03/18 |
$15,336 |
$14,946 |
$12,945 |
04/18 |
$14,940 |
$14,942 |
$13,252 |
05/18 |
$15,633 |
$15,217 |
$13,113 |
06/18 |
$15,000 |
$14,422 |
$12,460 |
07/18 |
$14,526 |
$14,063 |
$12,297 |
08/18 |
$13,756 |
$13,529 |
$11,996 |
09/18 |
$13,500 |
$13,340 |
$11,989 |
10/18 |
$11,631 |
$11,810 |
$10,758 |
11/18 |
$12,587 |
$12,675 |
$11,435 |
12/18 |
$11,908 |
$11,908 |
$11,145 |
01/19 |
$13,319 |
$13,225 |
$12,022 |
02/19 |
$13,706 |
$13,681 |
$12,315 |
03/19 |
$14,339 |
$14,015 |
$12,494 |
04/19 |
$14,872 |
$14,327 |
$12,780 |
05/19 |
$13,185 |
$12,452 |
$11,583 |
06/19 |
$14,382 |
$13,452 |
$12,334 |
07/19 |
$14,342 |
$13,379 |
$11,980 |
08/19 |
$13,988 |
$12,819 |
$11,084 |
09/19 |
$13,849 |
$12,816 |
$11,237 |
10/19 |
$14,333 |
$13,333 |
$11,590 |
11/19 |
$14,735 |
$13,571 |
$11,363 |
12/19 |
$15,849 |
$14,701 |
$12,214 |
01/20 |
$15,199 |
$13,995 |
$11,440 |
02/20 |
$15,710 |
$14,131 |
$11,320 |
03/20 |
$14,603 |
$13,200 |
$10,281 |
04/20 |
$15,621 |
$14,033 |
$10,732 |
05/20 |
$16,309 |
$13,964 |
$10,001 |
06/20 |
$17,942 |
$15,218 |
$10,640 |
07/20 |
$19,885 |
$16,655 |
$10,714 |
08/20 |
$21,487 |
$17,600 |
$10,967 |
09/20 |
$21,397 |
$17,119 |
$10,219 |
10/20 |
$22,296 |
$18,025 |
$10,495 |
11/20 |
$22,331 |
$18,525 |
$11,471 |
12/20 |
$23,167 |
$19,037 |
$11,857 |
01/21 |
$25,010 |
$20,439 |
$12,315 |
02/21 |
$24,720 |
$20,227 |
$12,612 |
03/21 |
$23,753 |
$18,956 |
$12,323 |
04/21 |
$24,215 |
$19,219 |
$12,486 |
05/21 |
$24,001 |
$19,367 |
$12,681 |
06/21 |
$24,197 |
$19,386 |
$12,532 |
07/21 |
$20,030 |
$16,702 |
$11,278 |
08/21 |
$19,782 |
$16,703 |
$11,234 |
09/21 |
$18,942 |
$15,864 |
$10,658 |
10/21 |
$19,301 |
$16,365 |
$11,014 |
11/21 |
$18,041 |
$15,387 |
$10,166 |
12/21 |
$17,346 |
$14,903 |
$10,132 |
01/22 |
$16,911 |
$14,463 |
$10,306 |
02/22 |
$15,808 |
$13,899 |
$9,814 |
03/22 |
$13,874 |
$12,788 |
$9,483 |
04/22 |
$13,263 |
$12,265 |
$9,074 |
05/22 |
$13,387 |
$12,410 |
$9,215 |
06/22 |
$14,515 |
$13,224 |
$9,405 |
07/22 |
$13,055 |
$11,968 |
$8,669 |
08/22 |
$13,037 |
$11,995 |
$8,583 |
09/22 |
$11,012 |
$10,249 |
$7,407 |
10/22 |
$8,906 |
$8,526 |
$6,317 |
11/22 |
$11,910 |
$11,059 |
$8,044 |
12/22 |
$12,448 |
$11,634 |
$8,557 |
01/23 |
$13,968 |
$13,005 |
$9,407 |
02/23 |
$12,339 |
$11,656 |
$8,510 |
03/23 |
$12,620 |
$12,182 |
$8,774 |
04/23 |
$11,713 |
$11,554 |
$8,556 |
05/23 |
$10,535 |
$10,580 |
$7,864 |
06/23 |
$11,060 |
$10,999 |
$8,149 |
07/23 |
$12,254 |
$12,183 |
$8,692 |
08/23 |
$11,106 |
$11,092 |
$7,914 |
09/23 |
$10,613 |
$10,786 |
$7,677 |
10/23 |
$10,157 |
$10,327 |
$7,383 |
11/23 |
$10,468 |
$10,587 |
$7,367 |
12/23 |
$10,134 |
$10,332 |
$7,370 |
01/24 |
$9,050 |
$9,235 |
$6,688 |
02/24 |
$9,625 |
$10,010 |
$7,120 |
03/24 |
$9,826 |
$10,105 |
$7,135 |
04/24 |
$10,372 |
$10,771 |
$7,667 |
05/24 |
$10,722 |
$11,030 |
$7,802 |
06/24 |
$10,399 |
$10,821 |
$7,662 |
07/24 |
$10,061 |
$10,678 |
$7,496 |
08/24 |
$10,046 |
$10,785 |
$7,786 |
09/24 |
$11,983 |
$13,363 |
$9,186 |
10/24 |
$11,572 |
$12,573 |
$8,823 |
11/24 |
$11,090 |
$12,015 |
$8,427 |
12/24 |
$11,401 |
$12,338 |
$8,718 |
01/25 |
$11,673 |
$12,452 |
$8,763 |
02/25 |
$12,726 |
$13,916 |
$9,960 |
03/25 |
$12,917 |
$14,192 |
$10,032 |
04/25 |
$12,278 |
$13,586 |
$9,630 |
05/25 |
$12,614 |
$13,958 |
$10,027 |
06/25 |
$13,195 |
$14,477 |
$10,353 |
07/25 |
$13,504 |
$15,172 |
$10,654 |
08/25 |
$14,433 |
$15,921 |
$10,860 |
09/25 |
$15,921 |
$17,473 |
$11,653 |
10/25 |
$15,236 |
$16,807 |
$11,253 |
11/25 |
$14,742 |
$16,387 |
$11,213 |
12/25 |
$14,556 |
$16,184 |
$11,117 |
01/26 |
$15,139 |
$16,944 |
$11,839 |
02/26 |
$14,475 |
$15,967 |
$11,494 |
03/26 |
$13,514 |
$14,738 |
$10,674 |
04/26 |
$14,396 |
$15,273 |
$11,109 |
05/26 |
$13,713 |
$14,810 |
$10,848 |
06/26 |
$12,689 |
$13,761 |
$9,850 |
07/26 |
$13,108 |
$14,999 |
$11,144 |
08/26 |
$13,202 |
$14,948 |
$11,011 |
|
| Average Annual Return [Table Text Block] |
Table Summary
Average Annual Total Returns (%) |
1 year |
5 years |
10 years |
Institutional 3 ClassFootnote Reference(a) |
(8.52) |
(7.77) |
2.82 |
MSCI China Index (Net) |
(6.11) |
(2.20) |
4.10 |
Hang Seng Index |
1.39 |
(0.40) |
0.97 | |
| No Deduction of Taxes [Text Block] |
Performance does not reflect the deduction of taxes that a shareholder may pay on fund distributions or on the redemptions of fund shares.
|
| Updated Performance Information Location [Text Block] |
columbiathreadneedleus.com/investment-products/mutual-funds
|
| AssetsNet |
$ 42,032,494
|
| Holdings Count | Holding |
59
|
| Advisory Fees Paid, Amount |
$ 458,015
|
| InvestmentCompanyPortfolioTurnover |
55.00%
|
| Additional Fund Statistics [Text Block] |
Table Summary
Fund net assets |
$42,032,494 |
Total number of portfolio holdings |
59 |
Management services fees (represents 0.95% of Fund average net assets) |
$458,015 |
Portfolio turnover for the reporting period |
55% | |
| Holdings [Text Block] |
Table Summary
Information Technology |
21.5% |
Consumer Discretionary |
19.2% |
Communication Services |
15.4% |
Financials |
13.6% |
Industrials |
11.6% |
Health Care |
6.4% |
Materials |
6.1% |
Real Estate |
2.8% |
Energy |
2.6% |
Table Summary
Common Stocks |
99.2% |
Money Market Funds |
1.1% | |
| Largest Holdings [Text Block] |
Table Summary
Tencent Holdings Ltd. |
12.3% |
Alibaba Group Holding Ltd. |
12.3% |
China Construction Bank Corp., Class H |
7.0% |
Contemporary Amperex Technology Co., Ltd., Class A |
4.2% |
Taiwan Semiconductor Manufacturing Co., Ltd. |
3.9% |
Ping An Insurance Group Co. of China Ltd., Class H |
3.8% |
Zijin Mining Group Co., Ltd., Class H |
3.5% |
Unimicron Technology Corp. |
2.8% |
NetEase, Inc. |
2.7% |
China Merchants Bank Co., Ltd., Class H |
2.5% | |
| Material Fund Change [Text Block] |
|
| C000032872 |
|
| Shareholder Report [Line Items] |
|
| Fund Name |
Columbia International Dividend Income Fund
|
| Class Name |
Class A
|
| Trading Symbol |
CSVAX
|
| Annual or Semi-Annual Statement [Text Block] |
This annual shareholder report contains important information about Columbia International Dividend Income Fund (the Fund) for the period of September 1, 2025 to August 31, 2026.
|
| Additional Information [Text Block] |
You can find additional information about the Fund at columbiathreadneedleus.com/resources/literature. You can also request more information by contacting us at 1-800-345-6611.
|
| Additional Information Phone Number |
1-800-345-6611
|
| Additional Information Website |
columbiathreadneedleus.com/resources/literature
|
| Expenses [Text Block] |
What were the Fund costs for the reporting period? (Based on a hypothetical $10,000 investment)
Table Summary
Class |
Cost of a $10,000 investment |
Cost paid as a percentage of a $10,000 investment |
Class A |
$136 |
1.18% | |
| Expenses Paid, Amount |
$ 136
|
| Expense Ratio, Percent |
1.18%
|
| Factors Affecting Performance [Text Block] |
Management's Discussion of Fund Performance The performance of Class A shares for the period presented is shown in the Average Annual Total Returns table. Top Performance ContributorsStock selection | Selections in the information technology and health care sectors boosted the Fund’s performance relative to the benchmark during the annual period. Allocation | An underweight allocation to the consumer discretionary sector contributed to relative performance. Individual holdings | Positions in Samsung Electronics, an electronics company, Tokyo Electron, a semiconductor company, and Anglo American, a mining company, were among the top contributors to the Fund’s relative performance during the period. Top Performance DetractorsStock selection | Selections in the materials and consumer staples sectors hurt the Fund’s performance relative to the benchmark during the period. Allocation | An overweight allocation to the communication services sector detracted from relative performance. Individual holdings | Positions in PT Bank Rakyat Indonesia, a financial services company, BT Group, a communication services company, and Deutsche Telekom, a telecommunications company, were among the top detractors from relative performance during the period. |
| Performance Past Does Not Indicate Future [Text] |
The Fund's past performance is not a good predictor of the Fund's future performance.
|
| Line Graph [Table Text Block] |
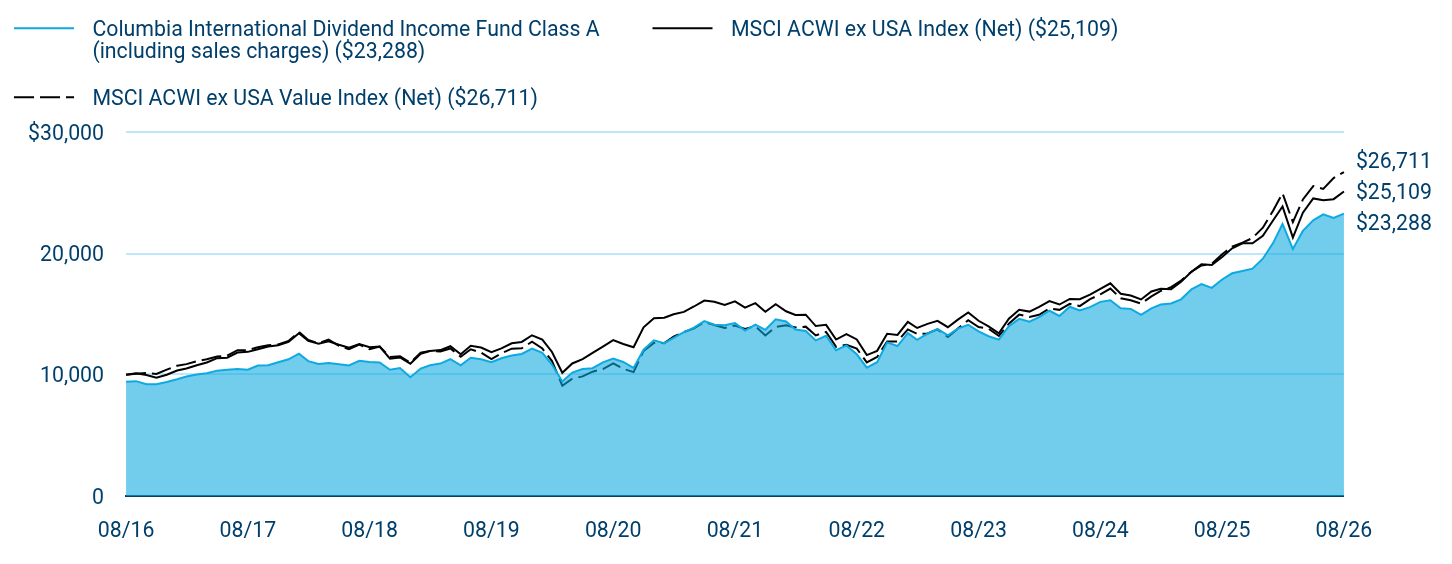
Table Summary
|
Columbia International Dividend Income Fund Class A (including sales charges) ($23,288) |
MSCI ACWI ex USA Index (Net) ($25,109) |
MSCI ACWI ex USA Value Index (Net) ($26,711) |
08/16 |
$9,425 |
$10,000 |
$10,000 |
09/16 |
$9,471 |
$10,123 |
$10,091 |
10/16 |
$9,226 |
$9,978 |
$10,146 |
11/16 |
$9,226 |
$9,747 |
$10,060 |
12/16 |
$9,409 |
$9,996 |
$10,423 |
01/17 |
$9,629 |
$10,350 |
$10,745 |
02/17 |
$9,849 |
$10,515 |
$10,874 |
03/17 |
$10,021 |
$10,782 |
$11,118 |
04/17 |
$10,124 |
$11,013 |
$11,275 |
05/17 |
$10,339 |
$11,370 |
$11,509 |
06/17 |
$10,413 |
$11,405 |
$11,572 |
07/17 |
$10,476 |
$11,826 |
$12,025 |
08/17 |
$10,413 |
$11,888 |
$12,030 |
09/17 |
$10,765 |
$12,108 |
$12,266 |
10/17 |
$10,777 |
$12,336 |
$12,431 |
11/17 |
$11,035 |
$12,436 |
$12,495 |
12/17 |
$11,275 |
$12,714 |
$12,784 |
01/18 |
$11,733 |
$13,423 |
$13,543 |
02/18 |
$11,124 |
$12,790 |
$12,872 |
03/18 |
$10,887 |
$12,564 |
$12,593 |
04/18 |
$10,963 |
$12,765 |
$12,903 |
05/18 |
$10,858 |
$12,470 |
$12,378 |
06/18 |
$10,771 |
$12,236 |
$12,109 |
07/18 |
$11,153 |
$12,528 |
$12,484 |
08/18 |
$11,059 |
$12,266 |
$12,098 |
09/18 |
$11,014 |
$12,322 |
$12,317 |
10/18 |
$10,416 |
$11,320 |
$11,471 |
11/18 |
$10,546 |
$11,427 |
$11,514 |
12/18 |
$9,790 |
$10,910 |
$10,998 |
01/19 |
$10,509 |
$11,734 |
$11,824 |
02/19 |
$10,783 |
$11,963 |
$11,968 |
03/19 |
$10,920 |
$12,034 |
$11,914 |
04/19 |
$11,282 |
$12,352 |
$12,166 |
05/19 |
$10,773 |
$11,689 |
$11,483 |
06/19 |
$11,406 |
$12,393 |
$12,100 |
07/19 |
$11,276 |
$12,243 |
$11,826 |
08/19 |
$11,042 |
$11,865 |
$11,297 |
09/19 |
$11,359 |
$12,170 |
$11,762 |
10/19 |
$11,584 |
$12,595 |
$12,153 |
11/19 |
$11,714 |
$12,706 |
$12,177 |
12/19 |
$12,152 |
$13,256 |
$12,727 |
01/20 |
$11,805 |
$12,900 |
$12,162 |
02/20 |
$10,842 |
$11,881 |
$11,124 |
03/20 |
$9,440 |
$10,160 |
$9,093 |
04/20 |
$10,184 |
$10,930 |
$9,671 |
05/20 |
$10,477 |
$11,288 |
$9,863 |
06/20 |
$10,540 |
$11,798 |
$10,254 |
07/20 |
$11,020 |
$12,324 |
$10,470 |
08/20 |
$11,334 |
$12,852 |
$10,940 |
09/20 |
$11,054 |
$12,536 |
$10,487 |
10/20 |
$10,567 |
$12,266 |
$10,216 |
11/20 |
$12,067 |
$13,916 |
$11,964 |
12/20 |
$12,836 |
$14,668 |
$12,628 |
01/21 |
$12,607 |
$14,700 |
$12,607 |
02/21 |
$13,039 |
$14,991 |
$13,153 |
03/21 |
$13,518 |
$15,181 |
$13,520 |
04/21 |
$13,892 |
$15,628 |
$13,823 |
05/21 |
$14,423 |
$16,117 |
$14,348 |
06/21 |
$14,131 |
$16,012 |
$14,105 |
07/21 |
$14,078 |
$15,748 |
$13,854 |
08/21 |
$14,256 |
$16,048 |
$14,065 |
09/21 |
$13,647 |
$15,534 |
$13,778 |
10/21 |
$14,139 |
$15,905 |
$14,005 |
11/21 |
$13,706 |
$15,188 |
$13,244 |
12/21 |
$14,568 |
$15,816 |
$13,949 |
01/22 |
$14,397 |
$15,233 |
$14,073 |
02/22 |
$13,725 |
$14,932 |
$13,903 |
03/22 |
$13,607 |
$14,956 |
$13,967 |
04/22 |
$12,833 |
$14,016 |
$13,243 |
05/22 |
$13,212 |
$14,117 |
$13,530 |
06/22 |
$12,019 |
$12,903 |
$12,304 |
07/22 |
$12,422 |
$13,344 |
$12,468 |
08/22 |
$11,687 |
$12,915 |
$12,157 |
09/22 |
$10,583 |
$11,624 |
$11,020 |
10/22 |
$11,039 |
$11,972 |
$11,466 |
11/22 |
$12,669 |
$13,385 |
$12,747 |
12/22 |
$12,369 |
$13,285 |
$12,750 |
01/23 |
$13,430 |
$14,363 |
$13,741 |
02/23 |
$12,885 |
$13,858 |
$13,364 |
03/23 |
$13,382 |
$14,197 |
$13,408 |
04/23 |
$13,784 |
$14,444 |
$13,741 |
05/23 |
$13,243 |
$13,919 |
$13,121 |
06/23 |
$13,805 |
$14,543 |
$13,804 |
07/23 |
$14,121 |
$15,134 |
$14,502 |
08/23 |
$13,577 |
$14,451 |
$13,933 |
09/23 |
$13,173 |
$13,994 |
$13,794 |
10/23 |
$12,898 |
$13,417 |
$13,194 |
11/23 |
$14,004 |
$14,625 |
$14,206 |
12/23 |
$14,608 |
$15,360 |
$14,957 |
01/24 |
$14,375 |
$15,207 |
$14,772 |
02/24 |
$14,751 |
$15,592 |
$14,944 |
03/24 |
$15,276 |
$16,079 |
$15,465 |
04/24 |
$14,845 |
$15,791 |
$15,351 |
05/24 |
$15,608 |
$16,249 |
$15,841 |
06/24 |
$15,294 |
$16,234 |
$15,661 |
07/24 |
$15,576 |
$16,610 |
$16,229 |
08/24 |
$16,009 |
$17,083 |
$16,636 |
09/24 |
$16,137 |
$17,543 |
$17,110 |
10/24 |
$15,486 |
$16,682 |
$16,302 |
11/24 |
$15,432 |
$16,531 |
$16,142 |
12/24 |
$14,934 |
$16,210 |
$15,860 |
01/25 |
$15,472 |
$16,863 |
$16,464 |
02/25 |
$15,793 |
$17,097 |
$16,912 |
03/25 |
$15,881 |
$17,058 |
$17,221 |
04/25 |
$16,219 |
$17,674 |
$17,765 |
05/25 |
$17,050 |
$18,484 |
$18,498 |
06/25 |
$17,474 |
$19,111 |
$19,016 |
07/25 |
$17,165 |
$19,056 |
$19,147 |
08/25 |
$17,856 |
$19,717 |
$19,939 |
09/25 |
$18,367 |
$20,427 |
$20,561 |
10/25 |
$18,556 |
$20,840 |
$20,893 |
11/25 |
$18,745 |
$20,835 |
$21,279 |
12/25 |
$19,572 |
$21,459 |
$22,125 |
01/26 |
$20,878 |
$22,743 |
$23,546 |
02/26 |
$22,437 |
$23,885 |
$24,963 |
03/26 |
$20,365 |
$21,308 |
$22,585 |
04/26 |
$21,863 |
$23,364 |
$24,456 |
05/26 |
$22,735 |
$24,541 |
$25,563 |
06/26 |
$23,229 |
$24,396 |
$25,330 |
07/26 |
$22,939 |
$24,480 |
$26,220 |
08/26 |
$23,288 |
$25,109 |
$26,711 |
|
| Average Annual Return [Table Text Block] |
Table Summary
Average Annual Total Returns (%) |
1 year |
5 years |
10 years |
Class A (excluding sales charges)Footnote Reference(a) |
30.43 |
10.31 |
9.47 |
Class A (including sales charges)Footnote Reference(a) |
22.93 |
9.01 |
8.82 |
MSCI ACWI ex USA Index (Net) |
27.35 |
9.37 |
9.64 |
MSCI ACWI ex USA Value Index (Net) |
33.96 |
13.69 |
10.32 | |
| No Deduction of Taxes [Text Block] |
Performance does not reflect the deduction of taxes that a shareholder may pay on fund distributions or on the redemptions of fund shares.
|
| Updated Performance Information Location [Text Block] |
columbiathreadneedleus.com/investment-products/mutual-funds
|
| AssetsNet |
$ 702,004,492
|
| Holdings Count | Holding |
63
|
| Advisory Fees Paid, Amount |
$ 4,934,854
|
| InvestmentCompanyPortfolioTurnover |
12.00%
|
| Additional Fund Statistics [Text Block] |
Table Summary
Fund net assets |
$702,004,492 |
Total number of portfolio holdings |
63 |
Management services fees (represents 0.76% of Fund average net assets) |
$4,934,854 |
Portfolio turnover for the reporting period |
12% | |
| Holdings [Text Block] |
Table Summary
Japan |
14.5% |
|
United Kingdom |
13.0% |
|
United States |
8.8% |
|
France |
8.7% |
|
Germany |
8.0% |
|
South Korea |
7.1% |
|
Canada |
6.5% |
|
Taiwan |
5.8% |
|
Switzerland |
5.3% |
|
Hong Kong |
3.6% |
|
Other |
18.2% |
|
Table Summary
Financials |
22.6% |
Information Technology |
19.4% |
Industrials |
13.9% |
Health Care |
8.4% |
Materials |
7.5% |
Communication Services |
6.3% |
Energy |
5.8% |
Consumer Discretionary |
5.4% |
Consumer Staples |
5.3% |
Utilities |
4.4% | |
| Largest Holdings [Text Block] |
Table Summary
Samsung Electronics Co., Ltd. |
6.6% |
Taiwan Semiconductor Manufacturing Co., Ltd. |
4.9% |
Tokyo Electron Ltd. |
3.8% |
Anglo American PLC |
2.7% |
BNP Paribas SA |
2.7% |
Roche Holding Ag |
2.6% |
Iberdrola SA |
2.5% |
Royal Bank of Canada |
2.2% |
Bank of Ireland Group PLC |
2.2% |
Siemens AG, Registered Shares |
2.1% | |
| Material Fund Change [Text Block] |
|
| C000032876 |
|
| Shareholder Report [Line Items] |
|
| Fund Name |
Columbia International Dividend Income Fund
|
| Class Name |
Institutional Class
|
| Trading Symbol |
CSVFX
|
| Annual or Semi-Annual Statement [Text Block] |
This annual shareholder report contains important information about Columbia International Dividend Income Fund (the Fund) for the period of September 1, 2025 to August 31, 2026.
|
| Additional Information [Text Block] |
You can find additional information about the Fund at columbiathreadneedleus.com/resources/literature. You can also request more information by contacting us at 1-800-345-6611.
|
| Additional Information Phone Number |
1-800-345-6611
|
| Additional Information Website |
columbiathreadneedleus.com/resources/literature
|
| Expenses [Text Block] |
What were the Fund costs for the reporting period? (Based on a hypothetical $10,000 investment)
Table Summary
Class |
Cost of a $10,000 investment |
Cost paid as a percentage of a $10,000 investment |
Institutional Class |
$107 |
0.93% | |
| Expenses Paid, Amount |
$ 107
|
| Expense Ratio, Percent |
0.93%
|
| Factors Affecting Performance [Text Block] |
Management's Discussion of Fund Performance The performance of Institutional Class shares for the period presented is shown in the Average Annual Total Returns table. Top Performance ContributorsStock selection | Selections in the information technology and health care sectors boosted the Fund’s performance relative to the benchmark during the annual period. Allocation | An underweight allocation to the consumer discretionary sector contributed to relative performance. Individual holdings | Positions in Samsung Electronics, an electronics company, Tokyo Electron, a semiconductor company, and Anglo American, a mining company, were among the top contributors to the Fund’s relative performance during the period. Top Performance DetractorsStock selection | Selections in the materials and consumer staples sectors hurt the Fund’s performance relative to the benchmark during the period. Allocation | An overweight allocation to the communication services sector detracted from relative performance. Individual holdings | Positions in PT Bank Rakyat Indonesia, a financial services company, BT Group, a communication services company, and Deutsche Telekom, a telecommunications company, were among the top detractors from relative performance during the period. |
| Performance Past Does Not Indicate Future [Text] |
The Fund's past performance is not a good predictor of the Fund's future performance.
|
| Line Graph [Table Text Block] |
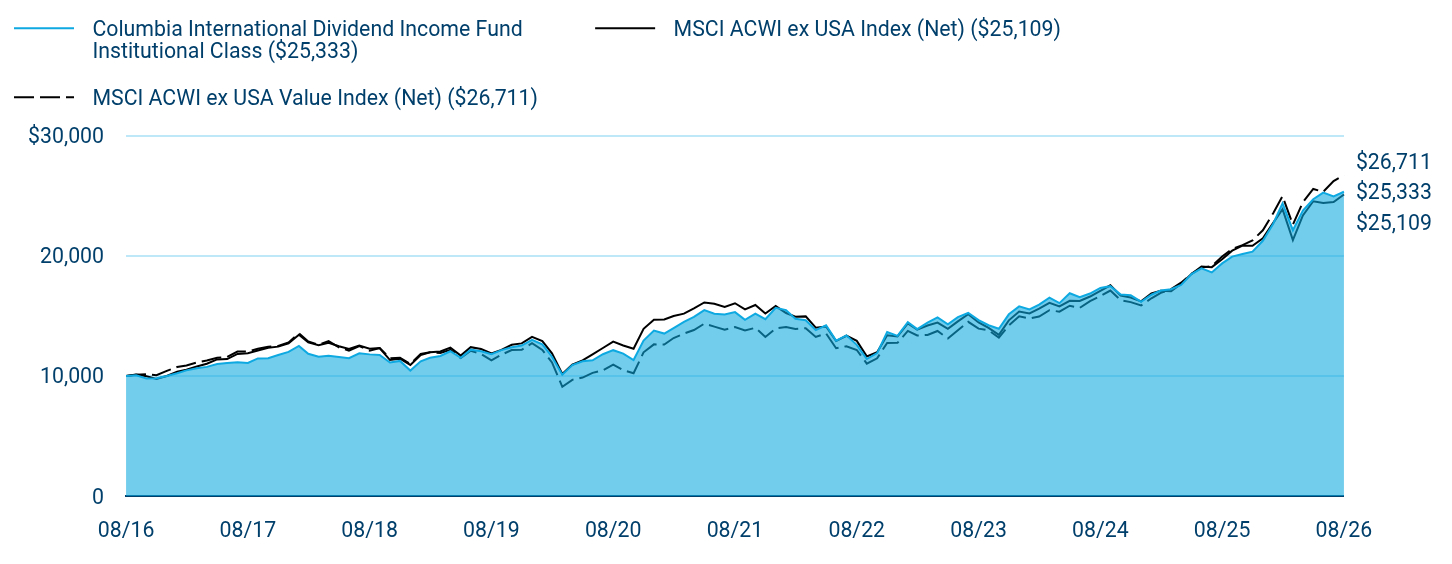
Table Summary
|
Columbia International Dividend Income Fund Institutional Class ($25,333) |
MSCI ACWI ex USA Index (Net) ($25,109) |
MSCI ACWI ex USA Value Index (Net) ($26,711) |
08/16 |
$10,000 |
$10,000 |
$10,000 |
09/16 |
$10,049 |
$10,123 |
$10,091 |
10/16 |
$9,790 |
$9,978 |
$10,146 |
11/16 |
$9,796 |
$9,747 |
$10,060 |
12/16 |
$9,990 |
$9,996 |
$10,423 |
01/17 |
$10,222 |
$10,350 |
$10,745 |
02/17 |
$10,461 |
$10,515 |
$10,874 |
03/17 |
$10,644 |
$10,782 |
$11,118 |
04/17 |
$10,752 |
$11,013 |
$11,275 |
05/17 |
$10,987 |
$11,370 |
$11,509 |
06/17 |
$11,066 |
$11,405 |
$11,572 |
07/17 |
$11,138 |
$11,826 |
$12,025 |
08/17 |
$11,072 |
$11,888 |
$12,030 |
09/17 |
$11,452 |
$12,108 |
$12,266 |
10/17 |
$11,464 |
$12,336 |
$12,431 |
11/17 |
$11,739 |
$12,436 |
$12,495 |
12/17 |
$12,000 |
$12,714 |
$12,784 |
01/18 |
$12,492 |
$13,423 |
$13,543 |
02/18 |
$11,840 |
$12,790 |
$12,872 |
03/18 |
$11,596 |
$12,564 |
$12,593 |
04/18 |
$11,676 |
$12,765 |
$12,903 |
05/18 |
$11,571 |
$12,470 |
$12,378 |
06/18 |
$11,480 |
$12,236 |
$12,109 |
07/18 |
$11,886 |
$12,528 |
$12,484 |
08/18 |
$11,792 |
$12,266 |
$12,098 |
09/18 |
$11,745 |
$12,322 |
$12,317 |
10/18 |
$11,110 |
$11,320 |
$11,471 |
11/18 |
$11,248 |
$11,427 |
$11,514 |
12/18 |
$10,445 |
$10,910 |
$10,998 |
01/19 |
$11,216 |
$11,734 |
$11,824 |
02/19 |
$11,508 |
$11,963 |
$11,968 |
03/19 |
$11,660 |
$12,034 |
$11,914 |
04/19 |
$12,052 |
$12,352 |
$12,166 |
05/19 |
$11,504 |
$11,689 |
$11,483 |
06/19 |
$12,185 |
$12,393 |
$12,100 |
07/19 |
$12,047 |
$12,243 |
$11,826 |
08/19 |
$11,804 |
$11,865 |
$11,297 |
09/19 |
$12,143 |
$12,170 |
$11,762 |
10/19 |
$12,388 |
$12,595 |
$12,153 |
11/19 |
$12,527 |
$12,706 |
$12,177 |
12/19 |
$13,002 |
$13,256 |
$12,727 |
01/20 |
$12,632 |
$12,900 |
$12,162 |
02/20 |
$11,598 |
$11,881 |
$11,124 |
03/20 |
$10,106 |
$10,160 |
$9,093 |
04/20 |
$10,907 |
$10,930 |
$9,671 |
05/20 |
$11,219 |
$11,288 |
$9,863 |
06/20 |
$11,293 |
$11,798 |
$10,254 |
07/20 |
$11,806 |
$12,324 |
$10,470 |
08/20 |
$12,141 |
$12,852 |
$10,940 |
09/20 |
$11,850 |
$12,536 |
$10,487 |
10/20 |
$11,322 |
$12,266 |
$10,216 |
11/20 |
$12,939 |
$13,916 |
$11,964 |
12/20 |
$13,768 |
$14,668 |
$12,628 |
01/21 |
$13,523 |
$14,700 |
$12,607 |
02/21 |
$13,984 |
$14,991 |
$13,153 |
03/21 |
$14,506 |
$15,181 |
$13,520 |
04/21 |
$14,913 |
$15,628 |
$13,823 |
05/21 |
$15,481 |
$16,117 |
$14,348 |
06/21 |
$15,170 |
$16,012 |
$14,105 |
07/21 |
$15,114 |
$15,748 |
$13,854 |
08/21 |
$15,311 |
$16,048 |
$14,065 |
09/21 |
$14,662 |
$15,534 |
$13,778 |
10/21 |
$15,188 |
$15,905 |
$14,005 |
11/21 |
$14,726 |
$15,188 |
$13,244 |
12/21 |
$15,666 |
$15,816 |
$13,949 |
01/22 |
$15,482 |
$15,233 |
$14,073 |
02/22 |
$14,763 |
$14,932 |
$13,903 |
03/22 |
$14,638 |
$14,956 |
$13,967 |
04/22 |
$13,808 |
$14,016 |
$13,243 |
05/22 |
$14,215 |
$14,117 |
$13,530 |
06/22 |
$12,937 |
$12,903 |
$12,304 |
07/22 |
$13,377 |
$13,344 |
$12,468 |
08/22 |
$12,589 |
$12,915 |
$12,157 |
09/22 |
$11,405 |
$11,624 |
$11,020 |
10/22 |
$11,894 |
$11,972 |
$11,466 |
11/22 |
$13,651 |
$13,385 |
$12,747 |
12/22 |
$13,330 |
$13,285 |
$12,750 |
01/23 |
$14,477 |
$14,363 |
$13,741 |
02/23 |
$13,891 |
$13,858 |
$13,364 |
03/23 |
$14,434 |
$14,197 |
$13,408 |
04/23 |
$14,873 |
$14,444 |
$13,741 |
05/23 |
$14,292 |
$13,919 |
$13,121 |
06/23 |
$14,898 |
$14,543 |
$13,804 |
07/23 |
$15,238 |
$15,134 |
$14,502 |
08/23 |
$14,652 |
$14,451 |
$13,933 |
09/23 |
$14,217 |
$13,994 |
$13,794 |
10/23 |
$13,929 |
$13,417 |
$13,194 |
11/23 |
$15,127 |
$14,625 |
$14,206 |
12/23 |
$15,786 |
$15,360 |
$14,957 |
01/24 |
$15,535 |
$15,207 |
$14,772 |
02/24 |
$15,940 |
$15,592 |
$14,944 |
03/24 |
$16,515 |
$16,079 |
$15,465 |
04/24 |
$16,059 |
$15,791 |
$15,351 |
05/24 |
$16,881 |
$16,249 |
$15,841 |
06/24 |
$16,545 |
$16,234 |
$15,661 |
07/24 |
$16,856 |
$16,610 |
$16,229 |
08/24 |
$17,324 |
$17,083 |
$16,636 |
09/24 |
$17,471 |
$17,543 |
$17,110 |
10/24 |
$16,770 |
$16,682 |
$16,302 |
11/24 |
$16,712 |
$16,531 |
$16,142 |
12/24 |
$16,177 |
$16,210 |
$15,860 |
01/25 |
$16,757 |
$16,863 |
$16,464 |
02/25 |
$17,112 |
$17,097 |
$16,912 |
03/25 |
$17,217 |
$17,058 |
$17,221 |
04/25 |
$17,583 |
$17,674 |
$17,765 |
05/25 |
$18,479 |
$18,484 |
$18,498 |
06/25 |
$18,948 |
$19,111 |
$19,016 |
07/25 |
$18,614 |
$19,056 |
$19,147 |
08/25 |
$19,369 |
$19,717 |
$19,939 |
09/25 |
$19,933 |
$20,427 |
$20,561 |
10/25 |
$20,146 |
$20,840 |
$20,893 |
11/25 |
$20,341 |
$20,835 |
$21,279 |
12/25 |
$21,248 |
$21,459 |
$22,125 |
01/26 |
$22,669 |
$22,743 |
$23,546 |
02/26 |
$24,372 |
$23,885 |
$24,963 |
03/26 |
$22,129 |
$21,308 |
$22,585 |
04/26 |
$23,758 |
$23,364 |
$24,456 |
05/26 |
$24,710 |
$24,541 |
$25,563 |
06/26 |
$25,259 |
$24,396 |
$25,330 |
07/26 |
$24,946 |
$24,480 |
$26,220 |
08/26 |
$25,333 |
$25,109 |
$26,711 |
|
| Average Annual Return [Table Text Block] |
Table Summary
Average Annual Total Returns (%) |
1 year |
5 years |
10 years |
Institutional ClassFootnote Reference(a) |
30.79 |
10.59 |
9.74 |
MSCI ACWI ex USA Index (Net) |
27.35 |
9.37 |
9.64 |
MSCI ACWI ex USA Value Index (Net) |
33.96 |
13.69 |
10.32 | |
| No Deduction of Taxes [Text Block] |
Performance does not reflect the deduction of taxes that a shareholder may pay on fund distributions or on the redemptions of fund shares.
|
| Updated Performance Information Location [Text Block] |
columbiathreadneedleus.com/investment-products/mutual-funds
|
| AssetsNet |
$ 702,004,492
|
| Holdings Count | Holding |
63
|
| Advisory Fees Paid, Amount |
$ 4,934,854
|
| InvestmentCompanyPortfolioTurnover |
12.00%
|
| Additional Fund Statistics [Text Block] |
Table Summary
Fund net assets |
$702,004,492 |
Total number of portfolio holdings |
63 |
Management services fees (represents 0.76% of Fund average net assets) |
$4,934,854 |
Portfolio turnover for the reporting period |
12% | |
| Holdings [Text Block] |
Table Summary
Japan |
14.5% |
|
United Kingdom |
13.0% |
|
United States |
8.8% |
|
France |
8.7% |
|
Germany |
8.0% |
|
South Korea |
7.1% |
|
Canada |
6.5% |
|
Taiwan |
5.8% |
|
Switzerland |
5.3% |
|
Hong Kong |
3.6% |
|
Other |
18.2% |
|
Table Summary
Financials |
22.6% |
Information Technology |
19.4% |
Industrials |
13.9% |
Health Care |
8.4% |
Materials |
7.5% |
Communication Services |
6.3% |
Energy |
5.8% |
Consumer Discretionary |
5.4% |
Consumer Staples |
5.3% |
Utilities |
4.4% | |
| Largest Holdings [Text Block] |
Table Summary
Samsung Electronics Co., Ltd. |
6.6% |
Taiwan Semiconductor Manufacturing Co., Ltd. |
4.9% |
Tokyo Electron Ltd. |
3.8% |
Anglo American PLC |
2.7% |
BNP Paribas SA |
2.7% |
Roche Holding Ag |
2.6% |
Iberdrola SA |
2.5% |
Royal Bank of Canada |
2.2% |
Bank of Ireland Group PLC |
2.2% |
Siemens AG, Registered Shares |
2.1% | |
| Material Fund Change [Text Block] |
|
| C000138362 |
|
| Shareholder Report [Line Items] |
|
| Fund Name |
Columbia International Dividend Income Fund
|
| Class Name |
Institutional 2 Class
|
| Trading Symbol |
CADPX
|
| Annual or Semi-Annual Statement [Text Block] |
This annual shareholder report contains important information about Columbia International Dividend Income Fund (the Fund) for the period of September 1, 2025 to August 31, 2026.
|
| Additional Information [Text Block] |
You can find additional information about the Fund at columbiathreadneedleus.com/resources/literature. You can also request more information by contacting us at 1-800-345-6611.
|
| Additional Information Phone Number |
1-800-345-6611
|
| Additional Information Website |
columbiathreadneedleus.com/resources/literature
|
| Expenses [Text Block] |
What were the Fund costs for the reporting period? (Based on a hypothetical $10,000 investment)
Table Summary
Class |
Cost of a $10,000 investment |
Cost paid as a percentage of a $10,000 investment |
Institutional 2 Class |
$94 |
0.81% | |
| Expenses Paid, Amount |
$ 94
|
| Expense Ratio, Percent |
0.81%
|
| Factors Affecting Performance [Text Block] |
Management's Discussion of Fund Performance The performance of Institutional 2 Class shares for the period presented is shown in the Average Annual Total Returns table. Top Performance ContributorsStock selection | Selections in the information technology and health care sectors boosted the Fund’s performance relative to the benchmark during the annual period. Allocation | An underweight allocation to the consumer discretionary sector contributed to relative performance. Individual holdings | Positions in Samsung Electronics, an electronics company, Tokyo Electron, a semiconductor company, and Anglo American, a mining company, were among the top contributors to the Fund’s relative performance during the period. Top Performance DetractorsStock selection | Selections in the materials and consumer staples sectors hurt the Fund’s performance relative to the benchmark during the period. Allocation | An overweight allocation to the communication services sector detracted from relative performance. Individual holdings | Positions in PT Bank Rakyat Indonesia, a financial services company, BT Group, a communication services company, and Deutsche Telekom, a telecommunications company, were among the top detractors from relative performance during the period. |
| Performance Past Does Not Indicate Future [Text] |
The Fund's past performance is not a good predictor of the Fund's future performance.
|
| Line Graph [Table Text Block] |
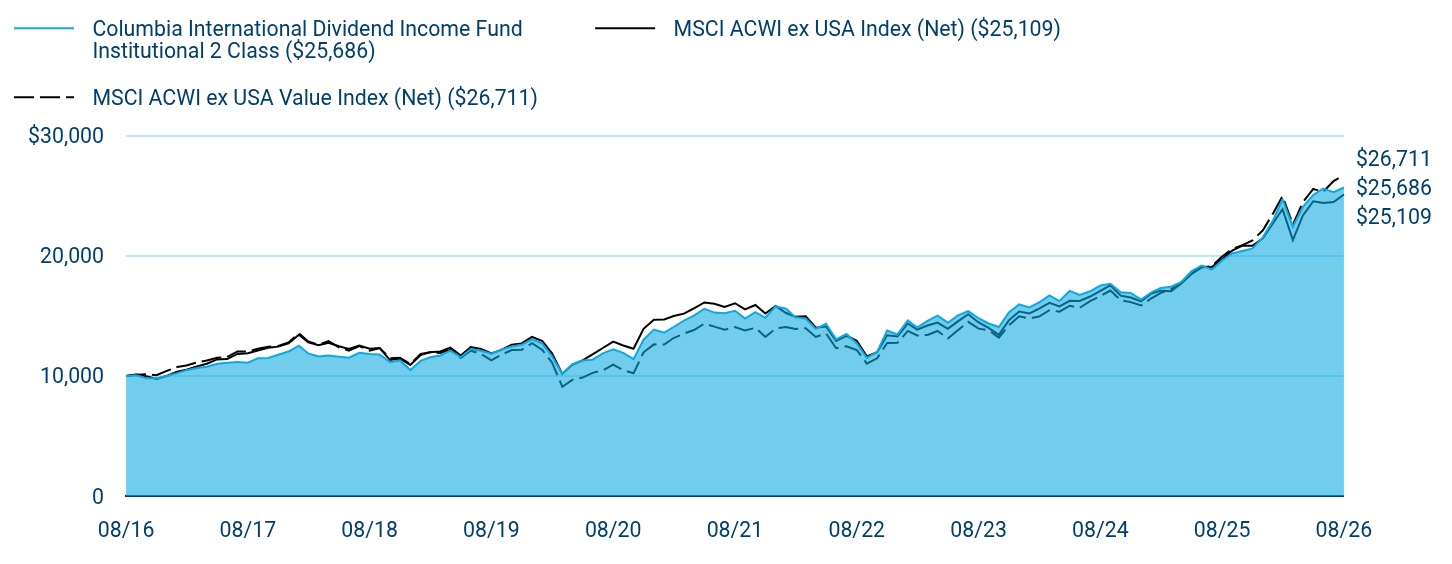
Table Summary
|
Columbia International Dividend Income Fund Institutional 2 Class ($25,686) |
MSCI ACWI ex USA Index (Net) ($25,109) |
MSCI ACWI ex USA Value Index (Net) ($26,711) |
08/16 |
$10,000 |
$10,000 |
$10,000 |
09/16 |
$10,054 |
$10,123 |
$10,091 |
10/16 |
$9,800 |
$9,978 |
$10,146 |
11/16 |
$9,800 |
$9,747 |
$10,060 |
12/16 |
$9,992 |
$9,996 |
$10,423 |
01/17 |
$10,232 |
$10,350 |
$10,745 |
02/17 |
$10,471 |
$10,515 |
$10,874 |
03/17 |
$10,653 |
$10,782 |
$11,118 |
04/17 |
$10,767 |
$11,013 |
$11,275 |
05/17 |
$11,003 |
$11,370 |
$11,509 |
06/17 |
$11,086 |
$11,405 |
$11,572 |
07/17 |
$11,153 |
$11,826 |
$12,025 |
08/17 |
$11,092 |
$11,888 |
$12,030 |
09/17 |
$11,471 |
$12,108 |
$12,266 |
10/17 |
$11,490 |
$12,336 |
$12,431 |
11/17 |
$11,765 |
$12,436 |
$12,495 |
12/17 |
$12,026 |
$12,714 |
$12,784 |
01/18 |
$12,521 |
$13,423 |
$13,543 |
02/18 |
$11,871 |
$12,790 |
$12,872 |
03/18 |
$11,624 |
$12,564 |
$12,593 |
04/18 |
$11,705 |
$12,765 |
$12,903 |
05/18 |
$11,599 |
$12,470 |
$12,378 |
06/18 |
$11,512 |
$12,236 |
$12,109 |
07/18 |
$11,926 |
$12,528 |
$12,484 |
08/18 |
$11,826 |
$12,266 |
$12,098 |
09/18 |
$11,782 |
$12,322 |
$12,317 |
10/18 |
$11,143 |
$11,320 |
$11,471 |
11/18 |
$11,288 |
$11,427 |
$11,514 |
12/18 |
$10,484 |
$10,910 |
$10,998 |
01/19 |
$11,260 |
$11,734 |
$11,824 |
02/19 |
$11,554 |
$11,963 |
$11,968 |
03/19 |
$11,705 |
$12,034 |
$11,914 |
04/19 |
$12,099 |
$12,352 |
$12,166 |
05/19 |
$11,554 |
$11,689 |
$11,483 |
06/19 |
$12,237 |
$12,393 |
$12,100 |
07/19 |
$12,098 |
$12,243 |
$11,826 |
08/19 |
$11,853 |
$11,865 |
$11,297 |
09/19 |
$12,191 |
$12,170 |
$11,762 |
10/19 |
$12,445 |
$12,595 |
$12,153 |
11/19 |
$12,592 |
$12,706 |
$12,177 |
12/19 |
$13,061 |
$13,256 |
$12,727 |
01/20 |
$12,696 |
$12,900 |
$12,162 |
02/20 |
$11,653 |
$11,881 |
$11,124 |
03/20 |
$10,154 |
$10,160 |
$9,093 |
04/20 |
$10,962 |
$10,930 |
$9,671 |
05/20 |
$11,277 |
$11,288 |
$9,863 |
06/20 |
$11,348 |
$11,798 |
$10,254 |
07/20 |
$11,872 |
$12,324 |
$10,470 |
08/20 |
$12,217 |
$12,852 |
$10,940 |
09/20 |
$11,920 |
$12,536 |
$10,487 |
10/20 |
$11,395 |
$12,266 |
$10,216 |
11/20 |
$13,012 |
$13,916 |
$11,964 |
12/20 |
$13,852 |
$14,668 |
$12,628 |
01/21 |
$13,605 |
$14,700 |
$12,607 |
02/21 |
$14,071 |
$14,991 |
$13,153 |
03/21 |
$14,602 |
$15,181 |
$13,520 |
04/21 |
$15,013 |
$15,628 |
$13,823 |
05/21 |
$15,586 |
$16,117 |
$14,348 |
06/21 |
$15,271 |
$16,012 |
$14,105 |
07/21 |
$15,221 |
$15,748 |
$13,854 |
08/21 |
$15,421 |
$16,048 |
$14,065 |
09/21 |
$14,769 |
$15,534 |
$13,778 |
10/21 |
$15,302 |
$15,905 |
$14,005 |
11/21 |
$14,841 |
$15,188 |
$13,244 |
12/21 |
$15,785 |
$15,816 |
$13,949 |
01/22 |
$15,607 |
$15,233 |
$14,073 |
02/22 |
$14,879 |
$14,932 |
$13,903 |
03/22 |
$14,757 |
$14,956 |
$13,967 |
04/22 |
$13,919 |
$14,016 |
$13,243 |
05/22 |
$14,338 |
$14,117 |
$13,530 |
06/22 |
$13,042 |
$12,903 |
$12,304 |
07/22 |
$13,487 |
$13,344 |
$12,468 |
08/22 |
$12,698 |
$12,915 |
$12,157 |
09/22 |
$11,504 |
$11,624 |
$11,020 |
10/22 |
$11,999 |
$11,972 |
$11,466 |
11/22 |
$13,778 |
$13,385 |
$12,747 |
12/22 |
$13,450 |
$13,285 |
$12,750 |
01/23 |
$14,612 |
$14,363 |
$13,741 |
02/23 |
$14,027 |
$13,858 |
$13,364 |
03/23 |
$14,573 |
$14,197 |
$13,408 |
04/23 |
$15,011 |
$14,444 |
$13,741 |
05/23 |
$14,430 |
$13,919 |
$13,121 |
06/23 |
$15,040 |
$14,543 |
$13,804 |
07/23 |
$15,393 |
$15,134 |
$14,502 |
08/23 |
$14,800 |
$14,451 |
$13,933 |
09/23 |
$14,363 |
$13,994 |
$13,794 |
10/23 |
$14,071 |
$13,417 |
$13,194 |
11/23 |
$15,286 |
$14,625 |
$14,206 |
12/23 |
$15,950 |
$15,360 |
$14,957 |
01/24 |
$15,704 |
$15,207 |
$14,772 |
02/24 |
$16,115 |
$15,592 |
$14,944 |
03/24 |
$16,695 |
$16,079 |
$15,465 |
04/24 |
$16,233 |
$15,791 |
$15,351 |
05/24 |
$17,066 |
$16,249 |
$15,841 |
06/24 |
$16,732 |
$16,234 |
$15,661 |
07/24 |
$17,048 |
$16,610 |
$16,229 |
08/24 |
$17,522 |
$17,083 |
$16,636 |
09/24 |
$17,669 |
$17,543 |
$17,110 |
10/24 |
$16,966 |
$16,682 |
$16,302 |
11/24 |
$16,907 |
$16,531 |
$16,142 |
12/24 |
$16,362 |
$16,210 |
$15,860 |
01/25 |
$16,960 |
$16,863 |
$16,464 |
02/25 |
$17,320 |
$17,097 |
$16,912 |
03/25 |
$17,424 |
$17,058 |
$17,221 |
04/25 |
$17,795 |
$17,674 |
$17,765 |
05/25 |
$18,715 |
$18,484 |
$18,498 |
06/25 |
$19,189 |
$19,111 |
$19,016 |
07/25 |
$18,859 |
$19,056 |
$19,147 |
08/25 |
$19,617 |
$19,717 |
$19,939 |
09/25 |
$20,189 |
$20,427 |
$20,561 |
10/25 |
$20,406 |
$20,840 |
$20,893 |
11/25 |
$20,613 |
$20,835 |
$21,279 |
12/25 |
$21,534 |
$21,459 |
$22,125 |
01/26 |
$22,979 |
$22,743 |
$23,546 |
02/26 |
$24,703 |
$23,885 |
$24,963 |
03/26 |
$22,427 |
$21,308 |
$22,585 |
04/26 |
$24,085 |
$23,364 |
$24,456 |
05/26 |
$25,054 |
$24,541 |
$25,563 |
06/26 |
$25,601 |
$24,396 |
$25,330 |
07/26 |
$25,292 |
$24,480 |
$26,220 |
08/26 |
$25,686 |
$25,109 |
$26,711 |
|
| Average Annual Return [Table Text Block] |
Table Summary
Average Annual Total Returns (%) |
1 year |
5 years |
10 years |
Institutional 2 ClassFootnote Reference(a) |
30.94 |
10.74 |
9.89 |
MSCI ACWI ex USA Index (Net) |
27.35 |
9.37 |
9.64 |
MSCI ACWI ex USA Value Index (Net) |
33.96 |
13.69 |
10.32 | |
| No Deduction of Taxes [Text Block] |
Performance does not reflect the deduction of taxes that a shareholder may pay on fund distributions or on the redemptions of fund shares.
|
| Updated Performance Information Location [Text Block] |
columbiathreadneedleus.com/investment-products/mutual-funds
|
| AssetsNet |
$ 702,004,492
|
| Holdings Count | Holding |
63
|
| Advisory Fees Paid, Amount |
$ 4,934,854
|
| InvestmentCompanyPortfolioTurnover |
12.00%
|
| Additional Fund Statistics [Text Block] |
Table Summary
Fund net assets |
$702,004,492 |
Total number of portfolio holdings |
63 |
Management services fees (represents 0.76% of Fund average net assets) |
$4,934,854 |
Portfolio turnover for the reporting period |
12% | |
| Holdings [Text Block] |
Table Summary
Japan |
14.5% |
|
United Kingdom |
13.0% |
|
United States |
8.8% |
|
France |
8.7% |
|
Germany |
8.0% |
|
South Korea |
7.1% |
|
Canada |
6.5% |
|
Taiwan |
5.8% |
|
Switzerland |
5.3% |
|
Hong Kong |
3.6% |
|
Other |
18.2% |
|
Table Summary
Financials |
22.6% |
Information Technology |
19.4% |
Industrials |
13.9% |
Health Care |
8.4% |
Materials |
7.5% |
Communication Services |
6.3% |
Energy |
5.8% |
Consumer Discretionary |
5.4% |
Consumer Staples |
5.3% |
Utilities |
4.4% | |
| Largest Holdings [Text Block] |
Table Summary
Samsung Electronics Co., Ltd. |
6.6% |
Taiwan Semiconductor Manufacturing Co., Ltd. |
4.9% |
Tokyo Electron Ltd. |
3.8% |
Anglo American PLC |
2.7% |
BNP Paribas SA |
2.7% |
Roche Holding Ag |
2.6% |
Iberdrola SA |
2.5% |
Royal Bank of Canada |
2.2% |
Bank of Ireland Group PLC |
2.2% |
Siemens AG, Registered Shares |
2.1% | |
| Material Fund Change [Text Block] |
|
| C000078988 |
|
| Shareholder Report [Line Items] |
|
| Fund Name |
Columbia International Dividend Income Fund
|
| Class Name |
Institutional 3 Class
|
| Trading Symbol |
CLSYX
|
| Annual or Semi-Annual Statement [Text Block] |
This annual shareholder report contains important information about Columbia International Dividend Income Fund (the Fund) for the period of September 1, 2025 to August 31, 2026.
|
| Additional Information [Text Block] |
You can find additional information about the Fund at columbiathreadneedleus.com/resources/literature. You can also request more information by contacting us at 1-800-345-6611.
|
| Additional Information Phone Number |
1-800-345-6611
|
| Additional Information Website |
columbiathreadneedleus.com/resources/literature
|
| Expenses [Text Block] |
What were the Fund costs for the reporting period? (Based on a hypothetical $10,000 investment)
Table Summary
Class |
Cost of a $10,000 investment |
Cost paid as a percentage of a $10,000 investment |
Institutional 3 Class |
$88 |
0.76% | |
| Expenses Paid, Amount |
$ 88
|
| Expense Ratio, Percent |
0.76%
|
| Factors Affecting Performance [Text Block] |
Management's Discussion of Fund Performance The performance of Institutional 3 Class shares for the period presented is shown in the Average Annual Total Returns table. Top Performance ContributorsStock selection | Selections in the information technology and health care sectors boosted the Fund’s performance relative to the benchmark during the annual period. Allocation | An underweight allocation to the consumer discretionary sector contributed to relative performance. Individual holdings | Positions in Samsung Electronics, an electronics company, Tokyo Electron, a semiconductor company, and Anglo American, a mining company, were among the top contributors to the Fund’s relative performance during the period. Top Performance DetractorsStock selection | Selections in the materials and consumer staples sectors hurt the Fund’s performance relative to the benchmark during the period. Allocation | An overweight allocation to the communication services sector detracted from relative performance. Individual holdings | Positions in PT Bank Rakyat Indonesia, a financial services company, BT Group, a communication services company, and Deutsche Telekom, a telecommunications company, were among the top detractors from relative performance during the period. |
| Performance Past Does Not Indicate Future [Text] |
The Fund's past performance is not a good predictor of the Fund's future performance.
|
| Line Graph [Table Text Block] |
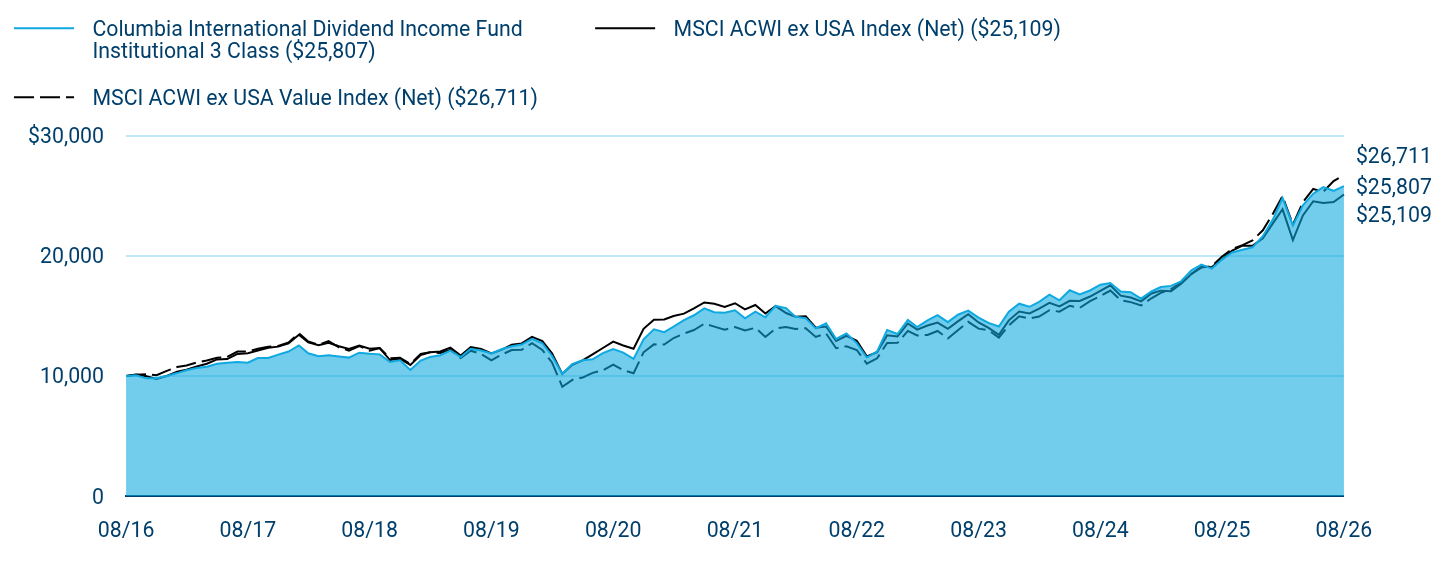
Table Summary
|
Columbia International Dividend Income Fund Institutional 3 Class ($25,807) |
MSCI ACWI ex USA Index (Net) ($25,109) |
MSCI ACWI ex USA Value Index (Net) ($26,711) |
08/16 |
$10,000 |
$10,000 |
$10,000 |
09/16 |
$10,055 |
$10,123 |
$10,091 |
10/16 |
$9,795 |
$9,978 |
$10,146 |
11/16 |
$9,801 |
$9,747 |
$10,060 |
12/16 |
$9,995 |
$9,996 |
$10,423 |
01/17 |
$10,234 |
$10,350 |
$10,745 |
02/17 |
$10,473 |
$10,515 |
$10,874 |
03/17 |
$10,661 |
$10,782 |
$11,118 |
04/17 |
$10,770 |
$11,013 |
$11,275 |
05/17 |
$11,005 |
$11,370 |
$11,509 |
06/17 |
$11,089 |
$11,405 |
$11,572 |
07/17 |
$11,156 |
$11,826 |
$12,025 |
08/17 |
$11,095 |
$11,888 |
$12,030 |
09/17 |
$11,482 |
$12,108 |
$12,266 |
10/17 |
$11,494 |
$12,336 |
$12,431 |
11/17 |
$11,775 |
$12,436 |
$12,495 |
12/17 |
$12,031 |
$12,714 |
$12,784 |
01/18 |
$12,532 |
$13,423 |
$13,543 |
02/18 |
$11,883 |
$12,790 |
$12,872 |
03/18 |
$11,632 |
$12,564 |
$12,593 |
04/18 |
$11,719 |
$12,765 |
$12,903 |
05/18 |
$11,613 |
$12,470 |
$12,378 |
06/18 |
$11,522 |
$12,236 |
$12,109 |
07/18 |
$11,935 |
$12,528 |
$12,484 |
08/18 |
$11,841 |
$12,266 |
$12,098 |
09/18 |
$11,793 |
$12,322 |
$12,317 |
10/18 |
$11,161 |
$11,320 |
$11,471 |
11/18 |
$11,300 |
$11,427 |
$11,514 |
12/18 |
$10,498 |
$10,910 |
$10,998 |
01/19 |
$11,274 |
$11,734 |
$11,824 |
02/19 |
$11,567 |
$11,963 |
$11,968 |
03/19 |
$11,719 |
$12,034 |
$11,914 |
04/19 |
$12,113 |
$12,352 |
$12,166 |
05/19 |
$11,568 |
$11,689 |
$11,483 |
06/19 |
$12,253 |
$12,393 |
$12,100 |
07/19 |
$12,120 |
$12,243 |
$11,826 |
08/19 |
$11,875 |
$11,865 |
$11,297 |
09/19 |
$12,216 |
$12,170 |
$11,762 |
10/19 |
$12,463 |
$12,595 |
$12,153 |
11/19 |
$12,610 |
$12,706 |
$12,177 |
12/19 |
$13,087 |
$13,256 |
$12,727 |
01/20 |
$12,722 |
$12,900 |
$12,162 |
02/20 |
$11,680 |
$11,881 |
$11,124 |
03/20 |
$10,176 |
$10,160 |
$9,093 |
04/20 |
$10,983 |
$10,930 |
$9,671 |
05/20 |
$11,305 |
$11,288 |
$9,863 |
06/20 |
$11,378 |
$11,798 |
$10,254 |
07/20 |
$11,895 |
$12,324 |
$10,470 |
08/20 |
$12,240 |
$12,852 |
$10,940 |
09/20 |
$11,944 |
$12,536 |
$10,487 |
10/20 |
$11,419 |
$12,266 |
$10,216 |
11/20 |
$13,043 |
$13,916 |
$11,964 |
12/20 |
$13,879 |
$14,668 |
$12,628 |
01/21 |
$13,639 |
$14,700 |
$12,607 |
02/21 |
$14,105 |
$14,991 |
$13,153 |
03/21 |
$14,638 |
$15,181 |
$13,520 |
04/21 |
$15,049 |
$15,628 |
$13,823 |
05/21 |
$15,622 |
$16,117 |
$14,348 |
06/21 |
$15,309 |
$16,012 |
$14,105 |
07/21 |
$15,259 |
$15,748 |
$13,854 |
08/21 |
$15,459 |
$16,048 |
$14,065 |
09/21 |
$14,802 |
$15,534 |
$13,778 |
10/21 |
$15,342 |
$15,905 |
$14,005 |
11/21 |
$14,881 |
$15,188 |
$13,244 |
12/21 |
$15,826 |
$15,816 |
$13,949 |
01/22 |
$15,648 |
$15,233 |
$14,073 |
02/22 |
$14,921 |
$14,932 |
$13,903 |
03/22 |
$14,801 |
$14,956 |
$13,967 |
04/22 |
$13,954 |
$14,016 |
$13,243 |
05/22 |
$14,373 |
$14,117 |
$13,530 |
06/22 |
$13,078 |
$12,903 |
$12,304 |
07/22 |
$13,532 |
$13,344 |
$12,468 |
08/22 |
$12,734 |
$12,915 |
$12,157 |
09/22 |
$11,532 |
$11,624 |
$11,020 |
10/22 |
$12,037 |
$11,972 |
$11,466 |
11/22 |
$13,817 |
$13,385 |
$12,747 |
12/22 |
$13,491 |
$13,285 |
$12,750 |
01/23 |
$14,654 |
$14,363 |
$13,741 |
02/23 |
$14,068 |
$13,858 |
$13,364 |
03/23 |
$14,617 |
$14,197 |
$13,408 |
04/23 |
$15,063 |
$14,444 |
$13,741 |
05/23 |
$14,474 |
$13,919 |
$13,121 |
06/23 |
$15,095 |
$14,543 |
$13,804 |
07/23 |
$15,440 |
$15,134 |
$14,502 |
08/23 |
$14,854 |
$14,451 |
$13,933 |
09/23 |
$14,409 |
$13,994 |
$13,794 |
10/23 |
$14,117 |
$13,417 |
$13,194 |
11/23 |
$15,342 |
$14,625 |
$14,206 |
12/23 |
$16,009 |
$15,360 |
$14,957 |
01/24 |
$15,754 |
$15,207 |
$14,772 |
02/24 |
$16,166 |
$15,592 |
$14,944 |
03/24 |
$16,757 |
$16,079 |
$15,465 |
04/24 |
$16,294 |
$15,791 |
$15,351 |
05/24 |
$17,129 |
$16,249 |
$15,841 |
06/24 |
$16,788 |
$16,234 |
$15,661 |
07/24 |
$17,113 |
$16,610 |
$16,229 |
08/24 |
$17,596 |
$17,083 |
$16,636 |
09/24 |
$17,738 |
$17,543 |
$17,110 |
10/24 |
$17,033 |
$16,682 |
$16,302 |
11/24 |
$16,974 |
$16,531 |
$16,142 |
12/24 |
$16,429 |
$16,210 |
$15,860 |
01/25 |
$17,028 |
$16,863 |
$16,464 |
02/25 |
$17,399 |
$17,097 |
$16,912 |
03/25 |
$17,495 |
$17,058 |
$17,221 |
04/25 |
$17,876 |
$17,674 |
$17,765 |
05/25 |
$18,789 |
$18,484 |
$18,498 |
06/25 |
$19,266 |
$19,111 |
$19,016 |
07/25 |
$18,936 |
$19,056 |
$19,147 |
08/25 |
$19,704 |
$19,717 |
$19,939 |
09/25 |
$20,279 |
$20,427 |
$20,561 |
10/25 |
$20,496 |
$20,840 |
$20,893 |
11/25 |
$20,704 |
$20,835 |
$21,279 |
12/25 |
$21,630 |
$21,459 |
$22,125 |
01/26 |
$23,078 |
$22,743 |
$23,546 |
02/26 |
$24,815 |
$23,885 |
$24,963 |
03/26 |
$22,528 |
$21,308 |
$22,585 |
04/26 |
$24,199 |
$23,364 |
$24,456 |
05/26 |
$25,171 |
$24,541 |
$25,563 |
06/26 |
$25,722 |
$24,396 |
$25,330 |
07/26 |
$25,412 |
$24,480 |
$26,220 |
08/26 |
$25,807 |
$25,109 |
$26,711 |
|
| Average Annual Return [Table Text Block] |
Table Summary
Average Annual Total Returns (%) |
1 year |
5 years |
10 years |
Institutional 3 ClassFootnote Reference(a) |
30.97 |
10.79 |
9.94 |
MSCI ACWI ex USA Index (Net) |
27.35 |
9.37 |
9.64 |
MSCI ACWI ex USA Value Index (Net) |
33.96 |
13.69 |
10.32 | |
| No Deduction of Taxes [Text Block] |
Performance does not reflect the deduction of taxes that a shareholder may pay on fund distributions or on the redemptions of fund shares.
|
| Updated Performance Information Location [Text Block] |
columbiathreadneedleus.com/investment-products/mutual-funds
|
| AssetsNet |
$ 702,004,492
|
| Holdings Count | Holding |
63
|
| Advisory Fees Paid, Amount |
$ 4,934,854
|
| InvestmentCompanyPortfolioTurnover |
12.00%
|
| Additional Fund Statistics [Text Block] |
Table Summary
Fund net assets |
$702,004,492 |
Total number of portfolio holdings |
63 |
Management services fees (represents 0.76% of Fund average net assets) |
$4,934,854 |
Portfolio turnover for the reporting period |
12% | |
| Holdings [Text Block] |
Table Summary
Japan |
14.5% |
|
United Kingdom |
13.0% |
|
United States |
8.8% |
|
France |
8.7% |
|
Germany |
8.0% |
|
South Korea |
7.1% |
|
Canada |
6.5% |
|
Taiwan |
5.8% |
|
Switzerland |
5.3% |
|
Hong Kong |
3.6% |
|
Other |
18.2% |
|
Table Summary
Financials |
22.6% |
Information Technology |
19.4% |
Industrials |
13.9% |
Health Care |
8.4% |
Materials |
7.5% |
Communication Services |
6.3% |
Energy |
5.8% |
Consumer Discretionary |
5.4% |
Consumer Staples |
5.3% |
Utilities |
4.4% | |
| Largest Holdings [Text Block] |
Table Summary
Samsung Electronics Co., Ltd. |
6.6% |
Taiwan Semiconductor Manufacturing Co., Ltd. |
4.9% |
Tokyo Electron Ltd. |
3.8% |
Anglo American PLC |
2.7% |
BNP Paribas SA |
2.7% |
Roche Holding Ag |
2.6% |
Iberdrola SA |
2.5% |
Royal Bank of Canada |
2.2% |
Bank of Ireland Group PLC |
2.2% |
Siemens AG, Registered Shares |
2.1% | |
| Material Fund Change [Text Block] |
|
| C000253717 |
|
| Shareholder Report [Line Items] |
|
| Fund Name |
Columbia International Dividend Income Fund
|
| Class Name |
Class S
|
| Trading Symbol |
CSVEX
|
| Annual or Semi-Annual Statement [Text Block] |
This annual shareholder report contains important information about Columbia International Dividend Income Fund (the Fund) for the period of September 1, 2025 to August 31, 2026.
|
| Additional Information [Text Block] |
You can find additional information about the Fund at columbiathreadneedleus.com/resources/literature. You can also request more information by contacting us at 1-800-345-6611.
|
| Additional Information Phone Number |
1-800-345-6611
|
| Additional Information Website |
columbiathreadneedleus.com/resources/literature
|
| Expenses [Text Block] |
What were the Fund costs for the reporting period? (Based on a hypothetical $10,000 investment)
Table Summary
Class |
Cost of a $10,000 investment |
Cost paid as a percentage of a $10,000 investment |
Class S |
$107 |
0.93% | |
| Expenses Paid, Amount |
$ 107
|
| Expense Ratio, Percent |
0.93%
|
| Factors Affecting Performance [Text Block] |
Management's Discussion of Fund Performance The performance of Class S shares for the period presented is shown in the Average Annual Total Returns table. Top Performance ContributorsStock selection | Selections in the information technology and health care sectors boosted the Fund’s performance relative to the benchmark during the annual period. Allocation | An underweight allocation to the consumer discretionary sector contributed to relative performance. Individual holdings | Positions in Samsung Electronics, an electronics company, Tokyo Electron, a semiconductor company, and Anglo American, a mining company, were among the top contributors to the Fund’s relative performance during the period. Top Performance DetractorsStock selection | Selections in the materials and consumer staples sectors hurt the Fund’s performance relative to the benchmark during the period. Allocation | An overweight allocation to the communication services sector detracted from relative performance. Individual holdings | Positions in PT Bank Rakyat Indonesia, a financial services company, BT Group, a communication services company, and Deutsche Telekom, a telecommunications company, were among the top detractors from relative performance during the period. |
| Performance Past Does Not Indicate Future [Text] |
The Fund's past performance is not a good predictor of the Fund's future performance.
|
| Line Graph [Table Text Block] |
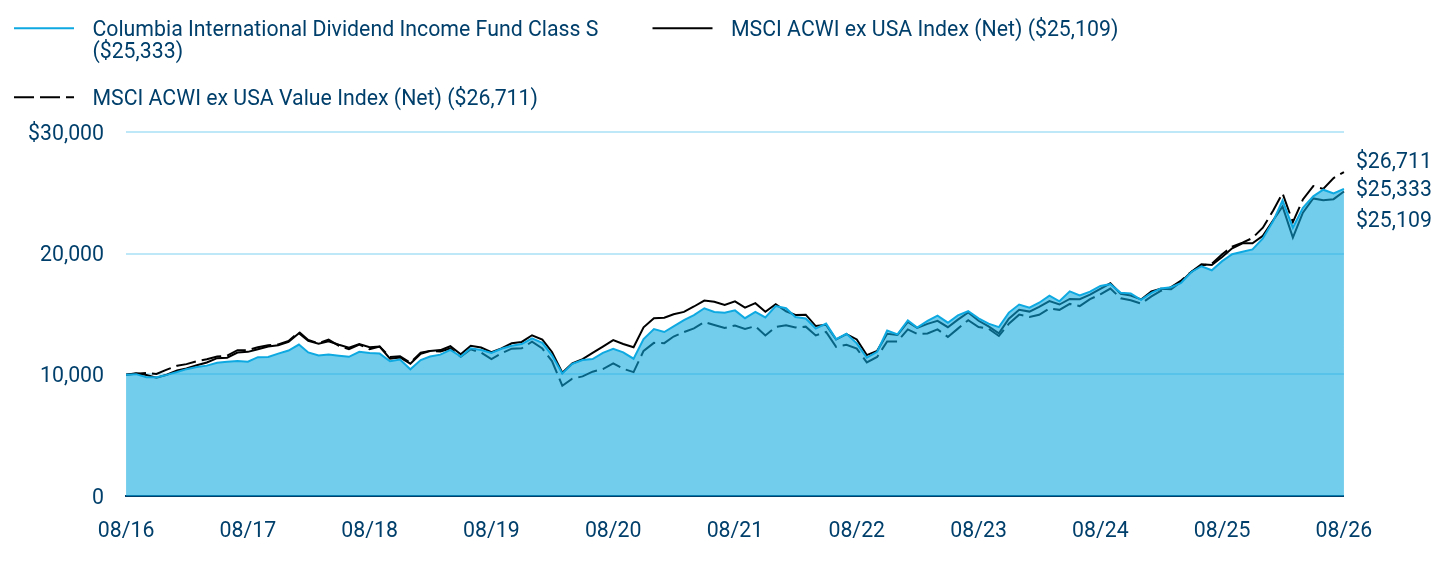
Table Summary
|
Columbia International Dividend Income Fund Class S ($25,333) |
MSCI ACWI ex USA Index (Net) ($25,109) |
MSCI ACWI ex USA Value Index (Net) ($26,711) |
08/16 |
$10,000 |
$10,000 |
$10,000 |
09/16 |
$10,049 |
$10,123 |
$10,091 |
10/16 |
$9,790 |
$9,978 |
$10,146 |
11/16 |
$9,796 |
$9,747 |
$10,060 |
12/16 |
$9,990 |
$9,996 |
$10,423 |
01/17 |
$10,222 |
$10,350 |
$10,745 |
02/17 |
$10,461 |
$10,515 |
$10,874 |
03/17 |
$10,644 |
$10,782 |
$11,118 |
04/17 |
$10,752 |
$11,013 |
$11,275 |
05/17 |
$10,987 |
$11,370 |
$11,509 |
06/17 |
$11,066 |
$11,405 |
$11,572 |
07/17 |
$11,138 |
$11,826 |
$12,025 |
08/17 |
$11,072 |
$11,888 |
$12,030 |
09/17 |
$11,452 |
$12,108 |
$12,266 |
10/17 |
$11,464 |
$12,336 |
$12,431 |
11/17 |
$11,739 |
$12,436 |
$12,495 |
12/17 |
$12,000 |
$12,714 |
$12,784 |
01/18 |
$12,492 |
$13,423 |
$13,543 |
02/18 |
$11,840 |
$12,790 |
$12,872 |
03/18 |
$11,596 |
$12,564 |
$12,593 |
04/18 |
$11,676 |
$12,765 |
$12,903 |
05/18 |
$11,571 |
$12,470 |
$12,378 |
06/18 |
$11,480 |
$12,236 |
$12,109 |
07/18 |
$11,886 |
$12,528 |
$12,484 |
08/18 |
$11,792 |
$12,266 |
$12,098 |
09/18 |
$11,745 |
$12,322 |
$12,317 |
10/18 |
$11,110 |
$11,320 |
$11,471 |
11/18 |
$11,248 |
$11,427 |
$11,514 |
12/18 |
$10,445 |
$10,910 |
$10,998 |
01/19 |
$11,216 |
$11,734 |
$11,824 |
02/19 |
$11,508 |
$11,963 |
$11,968 |
03/19 |
$11,660 |
$12,034 |
$11,914 |
04/19 |
$12,052 |
$12,352 |
$12,166 |
05/19 |
$11,504 |
$11,689 |
$11,483 |
06/19 |
$12,185 |
$12,393 |
$12,100 |
07/19 |
$12,047 |
$12,243 |
$11,826 |
08/19 |
$11,804 |
$11,865 |
$11,297 |
09/19 |
$12,143 |
$12,170 |
$11,762 |
10/19 |
$12,388 |
$12,595 |
$12,153 |
11/19 |
$12,527 |
$12,706 |
$12,177 |
12/19 |
$13,002 |
$13,256 |
$12,727 |
01/20 |
$12,632 |
$12,900 |
$12,162 |
02/20 |
$11,598 |
$11,881 |
$11,124 |
03/20 |
$10,106 |
$10,160 |
$9,093 |
04/20 |
$10,907 |
$10,930 |
$9,671 |
05/20 |
$11,219 |
$11,288 |
$9,863 |
06/20 |
$11,293 |
$11,798 |
$10,254 |
07/20 |
$11,806 |
$12,324 |
$10,470 |
08/20 |
$12,141 |
$12,852 |
$10,940 |
09/20 |
$11,850 |
$12,536 |
$10,487 |
10/20 |
$11,322 |
$12,266 |
$10,216 |
11/20 |
$12,939 |
$13,916 |
$11,964 |
12/20 |
$13,768 |
$14,668 |
$12,628 |
01/21 |
$13,523 |
$14,700 |
$12,607 |
02/21 |
$13,984 |
$14,991 |
$13,153 |
03/21 |
$14,506 |
$15,181 |
$13,520 |
04/21 |
$14,913 |
$15,628 |
$13,823 |
05/21 |
$15,481 |
$16,117 |
$14,348 |
06/21 |
$15,170 |
$16,012 |
$14,105 |
07/21 |
$15,114 |
$15,748 |
$13,854 |
08/21 |
$15,311 |
$16,048 |
$14,065 |
09/21 |
$14,662 |
$15,534 |
$13,778 |
10/21 |
$15,188 |
$15,905 |
$14,005 |
11/21 |
$14,726 |
$15,188 |
$13,244 |
12/21 |
$15,666 |
$15,816 |
$13,949 |
01/22 |
$15,482 |
$15,233 |
$14,073 |
02/22 |
$14,763 |
$14,932 |
$13,903 |
03/22 |
$14,638 |
$14,956 |
$13,967 |
04/22 |
$13,808 |
$14,016 |
$13,243 |
05/22 |
$14,215 |
$14,117 |
$13,530 |
06/22 |
$12,937 |
$12,903 |
$12,304 |
07/22 |
$13,377 |
$13,344 |
$12,468 |
08/22 |
$12,589 |
$12,915 |
$12,157 |
09/22 |
$11,405 |
$11,624 |
$11,020 |
10/22 |
$11,894 |
$11,972 |
$11,466 |
11/22 |
$13,651 |
$13,385 |
$12,747 |
12/22 |
$13,330 |
$13,285 |
$12,750 |
01/23 |
$14,477 |
$14,363 |
$13,741 |
02/23 |
$13,891 |
$13,858 |
$13,364 |
03/23 |
$14,434 |
$14,197 |
$13,408 |
04/23 |
$14,873 |
$14,444 |
$13,741 |
05/23 |
$14,292 |
$13,919 |
$13,121 |
06/23 |
$14,898 |
$14,543 |
$13,804 |
07/23 |
$15,238 |
$15,134 |
$14,502 |
08/23 |
$14,652 |
$14,451 |
$13,933 |
09/23 |
$14,217 |
$13,994 |
$13,794 |
10/23 |
$13,929 |
$13,417 |
$13,194 |
11/23 |
$15,127 |
$14,625 |
$14,206 |
12/23 |
$15,786 |
$15,360 |
$14,957 |
01/24 |
$15,535 |
$15,207 |
$14,772 |
02/24 |
$15,940 |
$15,592 |
$14,944 |
03/24 |
$16,515 |
$16,079 |
$15,465 |
04/24 |
$16,059 |
$15,791 |
$15,351 |
05/24 |
$16,881 |
$16,249 |
$15,841 |
06/24 |
$16,545 |
$16,234 |
$15,661 |
07/24 |
$16,856 |
$16,610 |
$16,229 |
08/24 |
$17,324 |
$17,083 |
$16,636 |
09/24 |
$17,471 |
$17,543 |
$17,110 |
10/24 |
$16,770 |
$16,682 |
$16,302 |
11/24 |
$16,712 |
$16,531 |
$16,142 |
12/24 |
$16,177 |
$16,210 |
$15,860 |
01/25 |
$16,757 |
$16,863 |
$16,464 |
02/25 |
$17,121 |
$17,097 |
$16,912 |
03/25 |
$17,217 |
$17,058 |
$17,221 |
04/25 |
$17,583 |
$17,674 |
$17,765 |
05/25 |
$18,479 |
$18,484 |
$18,498 |
06/25 |
$18,948 |
$19,111 |
$19,016 |
07/25 |
$18,614 |
$19,056 |
$19,147 |
08/25 |
$19,369 |
$19,717 |
$19,939 |
09/25 |
$19,933 |
$20,427 |
$20,561 |
10/25 |
$20,146 |
$20,840 |
$20,893 |
11/25 |
$20,341 |
$20,835 |
$21,279 |
12/25 |
$21,248 |
$21,459 |
$22,125 |
01/26 |
$22,669 |
$22,743 |
$23,546 |
02/26 |
$24,372 |
$23,885 |
$24,963 |
03/26 |
$22,129 |
$21,308 |
$22,585 |
04/26 |
$23,758 |
$23,364 |
$24,456 |
05/26 |
$24,710 |
$24,541 |
$25,563 |
06/26 |
$25,259 |
$24,396 |
$25,330 |
07/26 |
$24,946 |
$24,480 |
$26,220 |
08/26 |
$25,333 |
$25,109 |
$26,711 |
|
| Average Annual Return [Table Text Block] |
Table Summary
Average Annual Total Returns (%) |
1 year |
5 years |
10 years |
Class SFootnote Reference(a)Footnote Reference(b) |
30.79 |
10.59 |
9.74 |
MSCI ACWI ex USA Index (Net) |
27.35 |
9.37 |
9.64 |
MSCI ACWI ex USA Value Index (Net) |
33.96 |
13.69 |
10.32 | |
| No Deduction of Taxes [Text Block] |
Performance does not reflect the deduction of taxes that a shareholder may pay on fund distributions or on the redemptions of fund shares.
|
| Updated Performance Information Location [Text Block] |
columbiathreadneedleus.com/investment-products/mutual-funds
|
| AssetsNet |
$ 702,004,492
|
| Holdings Count | Holding |
63
|
| Advisory Fees Paid, Amount |
$ 4,934,854
|
| InvestmentCompanyPortfolioTurnover |
12.00%
|
| Additional Fund Statistics [Text Block] |
Table Summary
Fund net assets |
$702,004,492 |
Total number of portfolio holdings |
63 |
Management services fees (represents 0.76% of Fund average net assets) |
$4,934,854 |
Portfolio turnover for the reporting period |
12% | |
| Holdings [Text Block] |
Table Summary
Japan |
14.5% |
|
United Kingdom |
13.0% |
|
United States |
8.8% |
|
France |
8.7% |
|
Germany |
8.0% |
|
South Korea |
7.1% |
|
Canada |
6.5% |
|
Taiwan |
5.8% |
|
Switzerland |
5.3% |
|
Hong Kong |
3.6% |
|
Other |
18.2% |
|
Table Summary
Financials |
22.6% |
Information Technology |
19.4% |
Industrials |
13.9% |
Health Care |
8.4% |
Materials |
7.5% |
Communication Services |
6.3% |
Energy |
5.8% |
Consumer Discretionary |
5.4% |
Consumer Staples |
5.3% |
Utilities |
4.4% | |
| Largest Holdings [Text Block] |
Table Summary
Samsung Electronics Co., Ltd. |
6.6% |
Taiwan Semiconductor Manufacturing Co., Ltd. |
4.9% |
Tokyo Electron Ltd. |
3.8% |
Anglo American PLC |
2.7% |
BNP Paribas SA |
2.7% |
Roche Holding Ag |
2.6% |
Iberdrola SA |
2.5% |
Royal Bank of Canada |
2.2% |
Bank of Ireland Group PLC |
2.2% |
Siemens AG, Registered Shares |
2.1% | |
| Material Fund Change [Text Block] |
|
| C000032847 |
|
| Shareholder Report [Line Items] |
|
| Fund Name |
Columbia Select Mid Cap Growth Fund
|
| Class Name |
Class A
|
| Trading Symbol |
CBSAX
|
| Annual or Semi-Annual Statement [Text Block] |
This annual shareholder report contains important information about Columbia Select Mid Cap Growth Fund (the Fund) for the period of September 1, 2025 to August 31, 2026.
|
| Additional Information [Text Block] |
You can find additional information about the Fund at columbiathreadneedleus.com/resources/literature. You can also request more information by contacting us at 1-800-345-6611.
|
| Additional Information Phone Number |
1-800-345-6611
|
| Additional Information Website |
columbiathreadneedleus.com/resources/literature
|
| Expenses [Text Block] |
What were the Fund costs for the reporting period? (Based on a hypothetical $10,000 investment)
Table Summary
Class |
Cost of a $10,000 investment |
Cost paid as a percentage of a $10,000 investment |
Class A |
$118 |
1.11% | |
| Expenses Paid, Amount |
$ 118
|
| Expense Ratio, Percent |
1.11%
|
| Factors Affecting Performance [Text Block] |
Management's Discussion of Fund Performance The performance of Class A shares for the period presented is shown in the Average Annual Total Returns table. Top Performance ContributorsStock selection | Selections in the information technology and industrials sectors boosted the Fund’s performance relative to the benchmark during the period. Allocation | An overweight allocation to the materials sector contributed to relative performance. Individual holdings | Positions in Kioxia Holdings, an electronic technology company, Carpenter Technology, a specialty metal company, and Lumentum Holdings, an electrical products company, were among the top contributors to the Fund’s relative performance during the period. Top Performance DetractorsStock selection | Selections in the materials and utilities sectors hurt the Fund’s performance relative to the benchmark during the period. Allocation | An overweight allocation to the communication services sector detracted from relative performance. Individual holdings | Positions in Spotify Technology, a digital music services company, Astera Labs, a semiconductor company, and Cloudflare, a technology services company, were among the top detractors from relative performance during the period. |
| Performance Past Does Not Indicate Future [Text] |
The Fund's past performance is not a good predictor of the Fund's future performance.
|
| Line Graph [Table Text Block] |
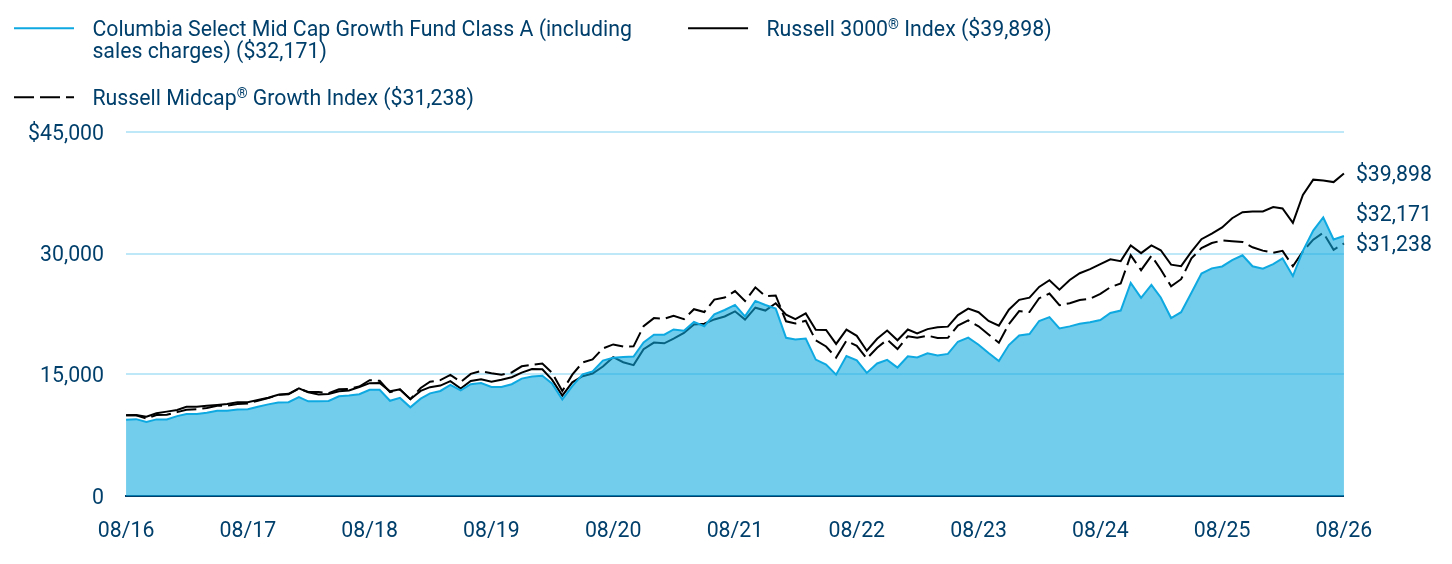
Table Summary
|
Columbia Select Mid Cap Growth Fund Class A (including sales charges) ($32,171) |
Russell 3000® Index ($39,898) |
Russell Midcap® Growth Index ($31,238) |
08/16 |
$9,425 |
$10,000 |
$10,000 |
09/16 |
$9,508 |
$10,016 |
$9,995 |
10/16 |
$9,155 |
$9,799 |
$9,589 |
11/16 |
$9,478 |
$10,238 |
$10,006 |
12/16 |
$9,456 |
$10,437 |
$10,041 |
01/17 |
$9,879 |
$10,634 |
$10,375 |
02/17 |
$10,155 |
$11,029 |
$10,674 |
03/17 |
$10,143 |
$11,037 |
$10,733 |
04/17 |
$10,311 |
$11,154 |
$10,892 |
05/17 |
$10,546 |
$11,268 |
$11,152 |
06/17 |
$10,554 |
$11,370 |
$11,185 |
07/17 |
$10,714 |
$11,584 |
$11,372 |
08/17 |
$10,742 |
$11,606 |
$11,452 |
09/17 |
$11,049 |
$11,889 |
$11,776 |
10/17 |
$11,337 |
$12,149 |
$12,106 |
11/17 |
$11,573 |
$12,518 |
$12,510 |
12/17 |
$11,595 |
$12,643 |
$12,578 |
01/18 |
$12,237 |
$13,309 |
$13,289 |
02/18 |
$11,709 |
$12,819 |
$12,872 |
03/18 |
$11,723 |
$12,561 |
$12,851 |
04/18 |
$11,750 |
$12,609 |
$12,730 |
05/18 |
$12,338 |
$12,965 |
$13,206 |
06/18 |
$12,420 |
$13,050 |
$13,257 |
07/18 |
$12,588 |
$13,483 |
$13,541 |
08/18 |
$13,130 |
$13,956 |
$14,322 |
09/18 |
$13,130 |
$13,979 |
$14,261 |
10/18 |
$11,777 |
$12,950 |
$12,849 |
11/18 |
$12,137 |
$13,209 |
$13,176 |
12/18 |
$10,967 |
$11,980 |
$11,980 |
01/19 |
$12,038 |
$13,008 |
$13,357 |
02/19 |
$12,695 |
$13,466 |
$14,140 |
03/19 |
$12,994 |
$13,662 |
$14,331 |
04/19 |
$13,754 |
$14,208 |
$14,975 |
05/19 |
$13,057 |
$13,289 |
$14,114 |
06/19 |
$13,823 |
$14,222 |
$15,105 |
07/19 |
$13,978 |
$14,433 |
$15,457 |
08/19 |
$13,495 |
$14,139 |
$15,176 |
09/19 |
$13,483 |
$14,387 |
$15,003 |
10/19 |
$13,829 |
$14,697 |
$15,281 |
11/19 |
$14,525 |
$15,256 |
$16,041 |
12/19 |
$14,784 |
$15,696 |
$16,229 |
01/20 |
$14,878 |
$15,679 |
$16,381 |
02/20 |
$13,916 |
$14,395 |
$15,252 |
03/20 |
$11,947 |
$12,416 |
$12,977 |
04/20 |
$13,601 |
$14,060 |
$15,009 |
05/20 |
$15,054 |
$14,812 |
$16,517 |
06/20 |
$15,407 |
$15,151 |
$16,904 |
07/20 |
$16,759 |
$16,011 |
$18,254 |
08/20 |
$17,093 |
$17,171 |
$18,751 |
09/20 |
$17,193 |
$16,546 |
$18,489 |
10/20 |
$17,262 |
$16,188 |
$18,511 |
11/20 |
$18,992 |
$18,158 |
$20,998 |
12/20 |
$19,942 |
$18,975 |
$22,005 |
01/21 |
$19,949 |
$18,890 |
$21,931 |
02/21 |
$20,607 |
$19,481 |
$22,306 |
03/21 |
$20,444 |
$20,179 |
$21,880 |
04/21 |
$21,531 |
$21,219 |
$23,110 |
05/21 |
$21,006 |
$21,316 |
$22,757 |
06/21 |
$22,484 |
$21,842 |
$24,303 |
07/21 |
$23,009 |
$22,211 |
$24,553 |
08/21 |
$23,638 |
$22,845 |
$25,346 |
09/21 |
$22,226 |
$21,820 |
$24,118 |
10/21 |
$24,133 |
$23,295 |
$25,809 |
11/21 |
$23,623 |
$22,941 |
$24,719 |
12/21 |
$23,175 |
$23,844 |
$24,806 |
01/22 |
$19,569 |
$22,441 |
$21,605 |
02/22 |
$19,358 |
$21,876 |
$21,342 |
03/22 |
$19,478 |
$22,585 |
$21,685 |
04/22 |
$16,872 |
$20,558 |
$19,243 |
05/22 |
$16,248 |
$20,531 |
$18,498 |
06/22 |
$15,010 |
$18,813 |
$17,116 |
07/22 |
$17,312 |
$20,578 |
$19,210 |
08/22 |
$16,789 |
$19,810 |
$18,581 |
09/22 |
$15,230 |
$17,973 |
$17,004 |
10/22 |
$16,395 |
$19,447 |
$18,340 |
11/22 |
$16,845 |
$20,462 |
$19,338 |
12/22 |
$15,890 |
$19,264 |
$18,177 |
01/23 |
$17,276 |
$20,591 |
$19,764 |
02/23 |
$17,129 |
$20,110 |
$19,568 |
03/23 |
$17,661 |
$20,647 |
$19,838 |
04/23 |
$17,377 |
$20,867 |
$19,551 |
05/23 |
$17,578 |
$20,949 |
$19,563 |
06/23 |
$19,083 |
$22,379 |
$21,075 |
07/23 |
$19,597 |
$23,181 |
$21,713 |
08/23 |
$18,716 |
$22,734 |
$20,997 |
09/23 |
$17,698 |
$21,651 |
$19,974 |
10/23 |
$16,698 |
$21,077 |
$18,955 |
11/23 |
$18,670 |
$23,042 |
$21,267 |
12/23 |
$19,854 |
$24,265 |
$22,879 |
01/24 |
$20,028 |
$24,534 |
$22,756 |
02/24 |
$21,652 |
$25,862 |
$24,467 |
03/24 |
$22,129 |
$26,696 |
$25,052 |
04/24 |
$20,725 |
$25,521 |
$23,597 |
05/24 |
$20,982 |
$26,727 |
$23,849 |
06/24 |
$21,313 |
$27,554 |
$24,247 |
07/24 |
$21,505 |
$28,066 |
$24,394 |
08/24 |
$21,762 |
$28,677 |
$25,000 |
09/24 |
$22,643 |
$29,271 |
$25,833 |
10/24 |
$22,936 |
$29,056 |
$26,284 |
11/24 |
$26,368 |
$30,989 |
$29,788 |
12/24 |
$24,502 |
$30,041 |
$27,936 |
01/25 |
$26,121 |
$30,990 |
$29,719 |
02/25 |
$24,555 |
$30,396 |
$28,025 |
03/25 |
$22,017 |
$28,623 |
$25,947 |
04/25 |
$22,737 |
$28,431 |
$26,819 |
05/25 |
$25,140 |
$30,233 |
$29,390 |
06/25 |
$27,510 |
$31,769 |
$30,670 |
07/25 |
$28,158 |
$32,469 |
$31,293 |
08/25 |
$28,398 |
$33,220 |
$31,606 |
09/25 |
$29,182 |
$34,366 |
$31,522 |
10/25 |
$29,777 |
$35,103 |
$31,434 |
11/25 |
$28,419 |
$35,199 |
$30,767 |
12/25 |
$28,130 |
$35,192 |
$30,355 |
01/26 |
$28,689 |
$35,738 |
$30,091 |
02/26 |
$29,402 |
$35,568 |
$30,329 |
03/26 |
$27,215 |
$33,800 |
$28,428 |
04/26 |
$30,329 |
$37,248 |
$30,267 |
05/26 |
$32,836 |
$39,135 |
$31,706 |
06/26 |
$34,453 |
$39,015 |
$32,563 |
07/26 |
$31,731 |
$38,833 |
$30,461 |
08/26 |
$32,171 |
$39,898 |
$31,238 |
|
| Average Annual Return [Table Text Block] |
Table Summary
Average Annual Total Returns (%) |
1 year |
5 years |
10 years |
Class A (excluding sales charges) |
13.28 |
6.36 |
13.06 |
Class A (including sales charges) |
6.77 |
5.11 |
12.39 |
Russell 3000® Index |
20.10 |
11.80 |
14.84 |
Russell Midcap® Growth Index |
(1.16) |
4.27 |
12.06 | |
| No Deduction of Taxes [Text Block] |
Performance does not reflect the deduction of taxes that a shareholder may pay on fund distributions or on the redemptions of fund shares.
|
| Updated Performance Information Location [Text Block] |
columbiathreadneedleus.com/investment-products/mutual-funds
|
| AssetsNet |
$ 2,314,312,681
|
| Holdings Count | Holding |
68
|
| Advisory Fees Paid, Amount |
$ 14,922,003
|
| InvestmentCompanyPortfolioTurnover |
214.00%
|
| Additional Fund Statistics [Text Block] |
Table Summary
Fund net assets |
$2,314,312,681 |
Total number of portfolio holdings |
68 |
Management services fees (represents 0.75% of Fund average net assets) |
$14,922,003 |
Portfolio turnover for the reporting period |
214% | |
| Holdings [Text Block] |
Table Summary
Information Technology |
31.6% |
Industrials |
13.9% |
Health Care |
13.7% |
Consumer Discretionary |
11.9% |
Communication Services |
8.9% |
Energy |
4.3% |
Materials |
3.6% |
Financials |
3.5% |
Consumer Staples |
2.2% |
Utilities |
0.3% |
Table Summary
Common Stocks |
93.9% |
Money Market Funds |
7.1% | |
| Largest Holdings [Text Block] |
Table Summary
Snowflake, Inc., Class A |
4.8% |
Take-Two Interactive Software, Inc. |
3.7% |
Datadog, Inc., Class A |
2.8% |
Cloudflare, Inc. |
2.7% |
Targa Resources Corp. |
2.3% |
SharkNinja, Inc. |
2.3% |
Casey's General Stores, Inc. |
2.2% |
Lattice Semiconductor Corp. |
2.1% |
ICON PLC |
2.1% |
Argenx SE, ADR |
2.1% | |
| Material Fund Change [Text Block] |
|
| C000032849 |
|
| Shareholder Report [Line Items] |
|
| Fund Name |
Columbia Select Mid Cap Growth Fund
|
| Class Name |
Class C
|
| Trading Symbol |
CMCCX
|
| Annual or Semi-Annual Statement [Text Block] |
This annual shareholder report contains important information about Columbia Select Mid Cap Growth Fund (the Fund) for the period of September 1, 2025 to August 31, 2026.
|
| Additional Information [Text Block] |
You can find additional information about the Fund at columbiathreadneedleus.com/resources/literature. You can also request more information by contacting us at 1-800-345-6611.
|
| Additional Information Phone Number |
1-800-345-6611
|
| Additional Information Website |
columbiathreadneedleus.com/resources/literature
|
| Expenses [Text Block] |
What were the Fund costs for the reporting period? (Based on a hypothetical $10,000 investment)
Table Summary
Class |
Cost of a $10,000 investment |
Cost paid as a percentage of a $10,000 investment |
Class C |
$198 |
1.86% | |
| Expenses Paid, Amount |
$ 198
|
| Expense Ratio, Percent |
1.86%
|
| Factors Affecting Performance [Text Block] |
Management's Discussion of Fund Performance The performance of Class C shares for the period presented is shown in the Average Annual Total Returns table. Top Performance ContributorsStock selection | Selections in the information technology and industrials sectors boosted the Fund’s performance relative to the benchmark during the period. Allocation | An overweight allocation to the materials sector contributed to relative performance. Individual holdings | Positions in Kioxia Holdings, an electronic technology company, Carpenter Technology, a specialty metal company, and Lumentum Holdings, an electrical products company, were among the top contributors to the Fund’s relative performance during the period. Top Performance DetractorsStock selection | Selections in the materials and utilities sectors hurt the Fund’s performance relative to the benchmark during the period. Allocation | An overweight allocation to the communication services sector detracted from relative performance. Individual holdings | Positions in Spotify Technology, a digital music services company, Astera Labs, a semiconductor company, and Cloudflare, a technology services company, were among the top detractors from relative performance during the period. |
| Performance Past Does Not Indicate Future [Text] |
The Fund's past performance is not a good predictor of the Fund's future performance.
|
| Line Graph [Table Text Block] |
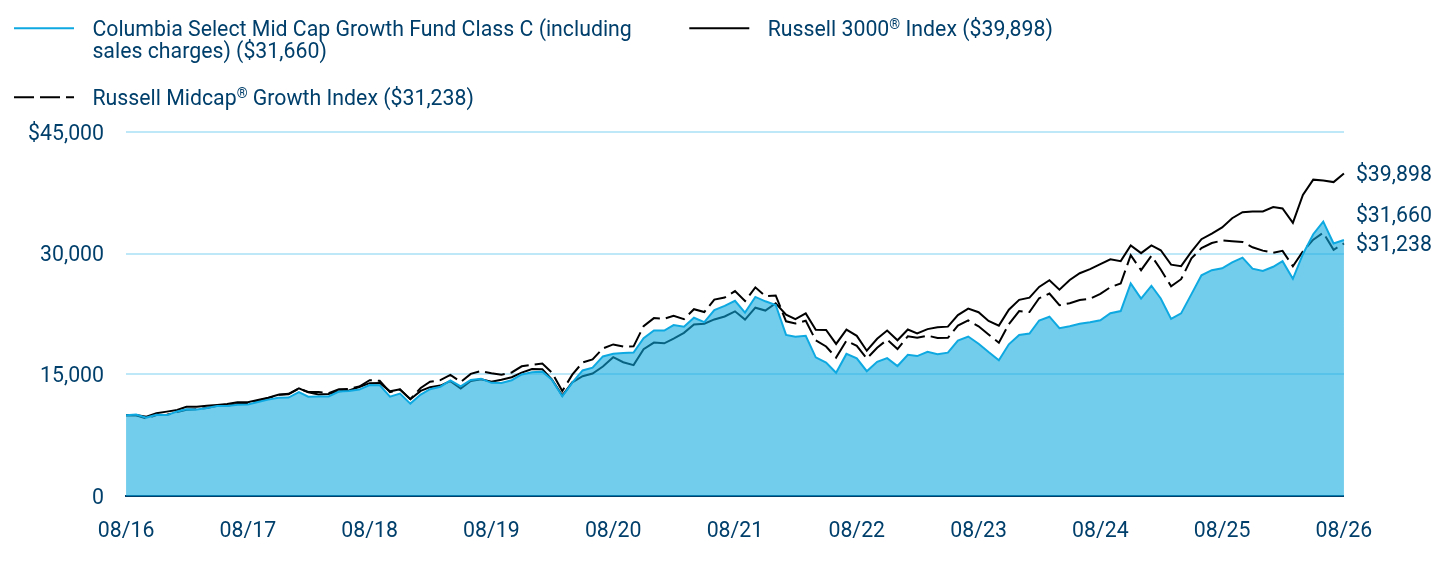
Table Summary
|
Columbia Select Mid Cap Growth Fund Class C (including sales charges) ($31,660) |
Russell 3000® Index ($39,898) |
Russell Midcap® Growth Index ($31,238) |
08/16 |
$10,000 |
$10,000 |
$10,000 |
09/16 |
$10,083 |
$10,016 |
$9,995 |
10/16 |
$9,700 |
$9,799 |
$9,589 |
11/16 |
$10,037 |
$10,238 |
$10,006 |
12/16 |
$10,009 |
$10,437 |
$10,041 |
01/17 |
$10,448 |
$10,634 |
$10,375 |
02/17 |
$10,734 |
$11,029 |
$10,674 |
03/17 |
$10,715 |
$11,037 |
$10,733 |
04/17 |
$10,883 |
$11,154 |
$10,892 |
05/17 |
$11,125 |
$11,268 |
$11,152 |
06/17 |
$11,129 |
$11,370 |
$11,185 |
07/17 |
$11,292 |
$11,584 |
$11,372 |
08/17 |
$11,312 |
$11,606 |
$11,452 |
09/17 |
$11,628 |
$11,889 |
$11,776 |
10/17 |
$11,924 |
$12,149 |
$12,106 |
11/17 |
$12,166 |
$12,518 |
$12,510 |
12/17 |
$12,180 |
$12,643 |
$12,578 |
01/18 |
$12,844 |
$13,309 |
$13,289 |
02/18 |
$12,283 |
$12,819 |
$12,872 |
03/18 |
$12,295 |
$12,561 |
$12,851 |
04/18 |
$12,312 |
$12,609 |
$12,730 |
05/18 |
$12,924 |
$12,965 |
$13,206 |
06/18 |
$12,998 |
$13,050 |
$13,257 |
07/18 |
$13,164 |
$13,483 |
$13,541 |
08/18 |
$13,719 |
$13,956 |
$14,322 |
09/18 |
$13,713 |
$13,979 |
$14,261 |
10/18 |
$12,295 |
$12,950 |
$12,849 |
11/18 |
$12,661 |
$13,209 |
$13,176 |
12/18 |
$11,430 |
$11,980 |
$11,980 |
01/19 |
$12,543 |
$13,008 |
$13,357 |
02/19 |
$13,217 |
$13,466 |
$14,140 |
03/19 |
$13,520 |
$13,662 |
$14,331 |
04/19 |
$14,300 |
$14,208 |
$14,975 |
05/19 |
$13,565 |
$13,289 |
$14,114 |
06/19 |
$14,353 |
$14,222 |
$15,105 |
07/19 |
$14,512 |
$14,433 |
$15,457 |
08/19 |
$13,997 |
$14,139 |
$15,176 |
09/19 |
$13,982 |
$14,387 |
$15,003 |
10/19 |
$14,323 |
$14,697 |
$15,281 |
11/19 |
$15,042 |
$15,256 |
$16,041 |
12/19 |
$15,298 |
$15,696 |
$16,229 |
01/20 |
$15,383 |
$15,679 |
$16,381 |
02/20 |
$14,373 |
$14,395 |
$15,252 |
03/20 |
$12,335 |
$12,416 |
$12,977 |
04/20 |
$14,033 |
$14,060 |
$15,009 |
05/20 |
$15,528 |
$14,812 |
$16,517 |
06/20 |
$15,876 |
$15,151 |
$16,904 |
07/20 |
$17,268 |
$16,011 |
$18,254 |
08/20 |
$17,591 |
$17,171 |
$18,751 |
09/20 |
$17,684 |
$16,546 |
$18,489 |
10/20 |
$17,752 |
$16,188 |
$18,511 |
11/20 |
$19,518 |
$18,158 |
$20,998 |
12/20 |
$20,482 |
$18,975 |
$22,005 |
01/21 |
$20,471 |
$18,890 |
$21,931 |
02/21 |
$21,140 |
$19,481 |
$22,306 |
03/21 |
$20,952 |
$20,179 |
$21,880 |
04/21 |
$22,049 |
$21,219 |
$23,110 |
05/21 |
$21,505 |
$21,316 |
$22,757 |
06/21 |
$23,009 |
$21,842 |
$24,303 |
07/21 |
$23,521 |
$22,211 |
$24,553 |
08/21 |
$24,148 |
$22,845 |
$25,346 |
09/21 |
$22,696 |
$21,820 |
$24,118 |
10/21 |
$24,628 |
$23,295 |
$25,809 |
11/21 |
$24,085 |
$22,941 |
$24,719 |
12/21 |
$23,626 |
$23,844 |
$24,806 |
01/22 |
$19,929 |
$22,441 |
$21,605 |
02/22 |
$19,702 |
$21,876 |
$21,342 |
03/22 |
$19,815 |
$22,585 |
$21,685 |
04/22 |
$17,153 |
$20,558 |
$19,243 |
05/22 |
$16,515 |
$20,531 |
$18,498 |
06/22 |
$15,240 |
$18,813 |
$17,116 |
07/22 |
$17,578 |
$20,578 |
$19,210 |
08/22 |
$17,025 |
$19,810 |
$18,581 |
09/22 |
$15,439 |
$17,973 |
$17,004 |
10/22 |
$16,600 |
$19,447 |
$18,340 |
11/22 |
$17,053 |
$20,462 |
$19,338 |
12/22 |
$16,076 |
$19,264 |
$18,177 |
01/23 |
$17,464 |
$20,591 |
$19,764 |
02/23 |
$17,308 |
$20,110 |
$19,568 |
03/23 |
$17,833 |
$20,647 |
$19,838 |
04/23 |
$17,535 |
$20,867 |
$19,551 |
05/23 |
$17,733 |
$20,949 |
$19,563 |
06/23 |
$19,221 |
$22,379 |
$21,075 |
07/23 |
$19,730 |
$23,181 |
$21,713 |
08/23 |
$18,838 |
$22,734 |
$20,997 |
09/23 |
$17,804 |
$21,651 |
$19,974 |
10/23 |
$16,784 |
$21,077 |
$18,955 |
11/23 |
$18,767 |
$23,042 |
$21,267 |
12/23 |
$19,929 |
$24,265 |
$22,879 |
01/24 |
$20,099 |
$24,534 |
$22,756 |
02/24 |
$21,713 |
$25,862 |
$24,467 |
03/24 |
$22,181 |
$26,696 |
$25,052 |
04/24 |
$20,750 |
$25,521 |
$23,597 |
05/24 |
$20,991 |
$26,727 |
$23,849 |
06/24 |
$21,317 |
$27,554 |
$24,247 |
07/24 |
$21,501 |
$28,066 |
$24,394 |
08/24 |
$21,742 |
$28,677 |
$25,000 |
09/24 |
$22,606 |
$29,271 |
$25,833 |
10/24 |
$22,875 |
$29,056 |
$26,284 |
11/24 |
$26,288 |
$30,989 |
$29,788 |
12/24 |
$24,419 |
$30,041 |
$27,936 |
01/25 |
$26,006 |
$30,990 |
$29,719 |
02/25 |
$24,436 |
$30,396 |
$28,025 |
03/25 |
$21,901 |
$28,623 |
$25,947 |
04/25 |
$22,591 |
$28,431 |
$26,819 |
05/25 |
$24,971 |
$30,233 |
$29,390 |
06/25 |
$27,299 |
$31,769 |
$30,670 |
07/25 |
$27,937 |
$32,469 |
$31,293 |
08/25 |
$28,161 |
$33,220 |
$31,606 |
09/25 |
$28,903 |
$34,366 |
$31,522 |
10/25 |
$29,489 |
$35,103 |
$31,434 |
11/25 |
$28,127 |
$35,199 |
$30,767 |
12/25 |
$27,828 |
$35,192 |
$30,355 |
01/26 |
$28,360 |
$35,738 |
$30,091 |
02/26 |
$29,041 |
$35,568 |
$30,329 |
03/26 |
$26,870 |
$33,800 |
$28,428 |
04/26 |
$29,914 |
$37,248 |
$30,267 |
05/26 |
$32,384 |
$39,135 |
$31,706 |
06/26 |
$33,938 |
$39,015 |
$32,563 |
07/26 |
$31,234 |
$38,833 |
$30,461 |
08/26 |
$31,660 |
$39,898 |
$31,238 |
|
| Average Annual Return [Table Text Block] |
Table Summary
Average Annual Total Returns (%) |
1 year |
5 years |
10 years |
Class C (excluding sales charges) |
12.42 |
5.57 |
12.22 |
Class C (including sales charges) |
11.51 |
5.57 |
12.22 |
Russell 3000® Index |
20.10 |
11.80 |
14.84 |
Russell Midcap® Growth Index |
(1.16) |
4.27 |
12.06 | |
| No Deduction of Taxes [Text Block] |
Performance does not reflect the deduction of taxes that a shareholder may pay on fund distributions or on the redemptions of fund shares.
|
| Updated Performance Information Location [Text Block] |
columbiathreadneedleus.com/investment-products/mutual-funds
|
| AssetsNet |
$ 2,314,312,681
|
| Holdings Count | Holding |
68
|
| Advisory Fees Paid, Amount |
$ 14,922,003
|
| InvestmentCompanyPortfolioTurnover |
214.00%
|
| Additional Fund Statistics [Text Block] |
Table Summary
Fund net assets |
$2,314,312,681 |
Total number of portfolio holdings |
68 |
Management services fees (represents 0.75% of Fund average net assets) |
$14,922,003 |
Portfolio turnover for the reporting period |
214% | |
| Holdings [Text Block] |
Table Summary
Information Technology |
31.6% |
Industrials |
13.9% |
Health Care |
13.7% |
Consumer Discretionary |
11.9% |
Communication Services |
8.9% |
Energy |
4.3% |
Materials |
3.6% |
Financials |
3.5% |
Consumer Staples |
2.2% |
Utilities |
0.3% |
Table Summary
Common Stocks |
93.9% |
Money Market Funds |
7.1% | |
| Largest Holdings [Text Block] |
Table Summary
Snowflake, Inc., Class A |
4.8% |
Take-Two Interactive Software, Inc. |
3.7% |
Datadog, Inc., Class A |
2.8% |
Cloudflare, Inc. |
2.7% |
Targa Resources Corp. |
2.3% |
SharkNinja, Inc. |
2.3% |
Casey's General Stores, Inc. |
2.2% |
Lattice Semiconductor Corp. |
2.1% |
ICON PLC |
2.1% |
Argenx SE, ADR |
2.1% | |
| Material Fund Change [Text Block] |
|
| C000032854 |
|
| Shareholder Report [Line Items] |
|
| Fund Name |
Columbia Select Mid Cap Growth Fund
|
| Class Name |
Institutional Class
|
| Trading Symbol |
CLSPX
|
| Annual or Semi-Annual Statement [Text Block] |
This annual shareholder report contains important information about Columbia Select Mid Cap Growth Fund (the Fund) for the period of September 1, 2025 to August 31, 2026.
|
| Additional Information [Text Block] |
You can find additional information about the Fund at columbiathreadneedleus.com/resources/literature. You can also request more information by contacting us at 1-800-345-6611.
|
| Additional Information Phone Number |
1-800-345-6611
|
| Additional Information Website |
columbiathreadneedleus.com/resources/literature
|
| Expenses [Text Block] |
What were the Fund costs for the reporting period? (Based on a hypothetical $10,000 investment)
Table Summary
Class |
Cost of a $10,000 investment |
Cost paid as a percentage of a $10,000 investment |
Institutional Class |
$92 |
0.86% | |
| Expenses Paid, Amount |
$ 92
|
| Expense Ratio, Percent |
0.86%
|
| Factors Affecting Performance [Text Block] |
Management's Discussion of Fund Performance The performance of Institutional Class shares for the period presented is shown in the Average Annual Total Returns table. Top Performance ContributorsStock selection | Selections in the information technology and industrials sectors boosted the Fund’s performance relative to the benchmark during the period. Allocation | An overweight allocation to the materials sector contributed to relative performance. Individual holdings | Positions in Kioxia Holdings, an electronic technology company, Carpenter Technology, a specialty metal company, and Lumentum Holdings, an electrical products company, were among the top contributors to the Fund’s relative performance during the period. Top Performance DetractorsStock selection | Selections in the materials and utilities sectors hurt the Fund’s performance relative to the benchmark during the period. Allocation | An overweight allocation to the communication services sector detracted from relative performance. Individual holdings | Positions in Spotify Technology, a digital music services company, Astera Labs, a semiconductor company, and Cloudflare, a technology services company, were among the top detractors from relative performance during the period. |
| Performance Past Does Not Indicate Future [Text] |
The Fund's past performance is not a good predictor of the Fund's future performance.
|
| Line Graph [Table Text Block] |
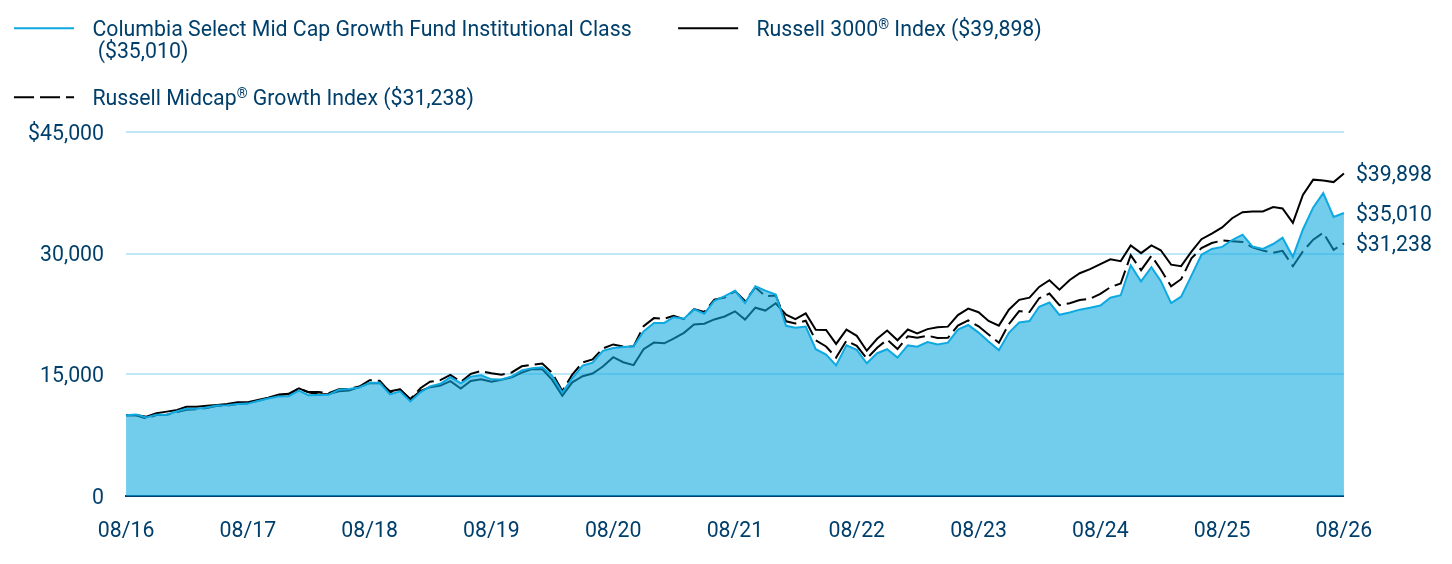
Table Summary
|
Columbia Select Mid Cap Growth Fund Institutional Class ($35,010) |
Russell 3000® Index ($39,898) |
Russell Midcap® Growth Index ($31,238) |
08/16 |
$10,000 |
$10,000 |
$10,000 |
09/16 |
$10,094 |
$10,016 |
$9,995 |
10/16 |
$9,717 |
$9,799 |
$9,589 |
11/16 |
$10,064 |
$10,238 |
$10,006 |
12/16 |
$10,043 |
$10,437 |
$10,041 |
01/17 |
$10,492 |
$10,634 |
$10,375 |
02/17 |
$10,788 |
$11,029 |
$10,674 |
03/17 |
$10,780 |
$11,037 |
$10,733 |
04/17 |
$10,957 |
$11,154 |
$10,892 |
05/17 |
$11,209 |
$11,268 |
$11,152 |
06/17 |
$11,221 |
$11,370 |
$11,185 |
07/17 |
$11,393 |
$11,584 |
$11,372 |
08/17 |
$11,429 |
$11,606 |
$11,452 |
09/17 |
$11,754 |
$11,889 |
$11,776 |
10/17 |
$12,067 |
$12,149 |
$12,106 |
11/17 |
$12,319 |
$12,518 |
$12,510 |
12/17 |
$12,341 |
$12,643 |
$12,578 |
01/18 |
$13,028 |
$13,309 |
$13,289 |
02/18 |
$12,469 |
$12,819 |
$12,872 |
03/18 |
$12,491 |
$12,561 |
$12,851 |
04/18 |
$12,523 |
$12,609 |
$12,730 |
05/18 |
$13,150 |
$12,965 |
$13,206 |
06/18 |
$13,241 |
$13,050 |
$13,257 |
07/18 |
$13,419 |
$13,483 |
$13,541 |
08/18 |
$14,000 |
$13,956 |
$14,322 |
09/18 |
$14,005 |
$13,979 |
$14,261 |
10/18 |
$12,569 |
$12,950 |
$12,849 |
11/18 |
$12,950 |
$13,209 |
$13,176 |
12/18 |
$11,702 |
$11,980 |
$11,980 |
01/19 |
$12,851 |
$13,008 |
$13,357 |
02/19 |
$13,559 |
$13,466 |
$14,140 |
03/19 |
$13,876 |
$13,662 |
$14,331 |
04/19 |
$14,691 |
$14,208 |
$14,975 |
05/19 |
$13,949 |
$13,289 |
$14,114 |
06/19 |
$14,770 |
$14,222 |
$15,105 |
07/19 |
$14,940 |
$14,433 |
$15,457 |
08/19 |
$14,430 |
$14,139 |
$15,176 |
09/19 |
$14,419 |
$14,387 |
$15,003 |
10/19 |
$14,793 |
$14,697 |
$15,281 |
11/19 |
$15,540 |
$15,256 |
$16,041 |
12/19 |
$15,817 |
$15,696 |
$16,229 |
01/20 |
$15,921 |
$15,679 |
$16,381 |
02/20 |
$14,889 |
$14,395 |
$15,252 |
03/20 |
$12,790 |
$12,416 |
$12,977 |
04/20 |
$14,564 |
$14,060 |
$15,009 |
05/20 |
$16,124 |
$14,812 |
$16,517 |
06/20 |
$16,504 |
$15,151 |
$16,904 |
07/20 |
$17,959 |
$16,011 |
$18,254 |
08/20 |
$18,316 |
$17,171 |
$18,751 |
09/20 |
$18,426 |
$16,546 |
$18,489 |
10/20 |
$18,512 |
$16,188 |
$18,511 |
11/20 |
$20,366 |
$18,158 |
$20,998 |
12/20 |
$21,390 |
$18,975 |
$22,005 |
01/21 |
$21,404 |
$18,890 |
$21,931 |
02/21 |
$22,116 |
$19,481 |
$22,306 |
03/21 |
$21,938 |
$20,179 |
$21,880 |
04/21 |
$23,112 |
$21,219 |
$23,110 |
05/21 |
$22,557 |
$21,316 |
$22,757 |
06/21 |
$24,152 |
$21,842 |
$24,303 |
07/21 |
$24,714 |
$22,211 |
$24,553 |
08/21 |
$25,397 |
$22,845 |
$25,346 |
09/21 |
$23,881 |
$21,820 |
$24,118 |
10/21 |
$25,938 |
$23,295 |
$25,809 |
11/21 |
$25,397 |
$22,941 |
$24,719 |
12/21 |
$24,917 |
$23,844 |
$24,806 |
01/22 |
$21,049 |
$22,441 |
$21,605 |
02/22 |
$20,824 |
$21,876 |
$21,342 |
03/22 |
$20,963 |
$22,585 |
$21,685 |
04/22 |
$18,157 |
$20,558 |
$19,243 |
05/22 |
$17,492 |
$20,531 |
$18,498 |
06/22 |
$16,162 |
$18,813 |
$17,116 |
07/22 |
$18,649 |
$20,578 |
$19,210 |
08/22 |
$18,088 |
$19,810 |
$18,581 |
09/22 |
$16,413 |
$17,973 |
$17,004 |
10/22 |
$17,665 |
$19,447 |
$18,340 |
11/22 |
$18,157 |
$20,462 |
$19,338 |
12/22 |
$17,129 |
$19,264 |
$18,177 |
01/23 |
$18,631 |
$20,591 |
$19,764 |
02/23 |
$18,467 |
$20,110 |
$19,568 |
03/23 |
$19,046 |
$20,647 |
$19,838 |
04/23 |
$18,752 |
$20,867 |
$19,551 |
05/23 |
$18,968 |
$20,949 |
$19,563 |
06/23 |
$20,591 |
$22,379 |
$21,075 |
07/23 |
$21,153 |
$23,181 |
$21,713 |
08/23 |
$20,211 |
$22,734 |
$20,997 |
09/23 |
$19,106 |
$21,651 |
$19,974 |
10/23 |
$18,044 |
$21,077 |
$18,955 |
11/23 |
$20,177 |
$23,042 |
$21,267 |
12/23 |
$21,455 |
$24,265 |
$22,879 |
01/24 |
$21,645 |
$24,534 |
$22,756 |
02/24 |
$23,406 |
$25,862 |
$24,467 |
03/24 |
$23,933 |
$26,696 |
$25,052 |
04/24 |
$22,413 |
$25,521 |
$23,597 |
05/24 |
$22,698 |
$26,727 |
$23,849 |
06/24 |
$23,052 |
$27,554 |
$24,247 |
07/24 |
$23,276 |
$28,066 |
$24,394 |
08/24 |
$23,561 |
$28,677 |
$25,000 |
09/24 |
$24,520 |
$29,271 |
$25,833 |
10/24 |
$24,830 |
$29,056 |
$26,284 |
11/24 |
$28,552 |
$30,989 |
$29,788 |
12/24 |
$26,542 |
$30,041 |
$27,936 |
01/25 |
$28,303 |
$30,990 |
$29,719 |
02/25 |
$26,610 |
$30,396 |
$28,025 |
03/25 |
$23,863 |
$28,623 |
$25,947 |
04/25 |
$24,656 |
$28,431 |
$26,819 |
05/25 |
$27,268 |
$30,233 |
$29,390 |
06/25 |
$29,841 |
$31,769 |
$30,670 |
07/25 |
$30,557 |
$32,469 |
$31,293 |
08/25 |
$30,818 |
$33,220 |
$31,606 |
09/25 |
$31,669 |
$34,366 |
$31,522 |
10/25 |
$32,327 |
$35,103 |
$31,434 |
11/25 |
$30,856 |
$35,199 |
$30,767 |
12/25 |
$30,556 |
$35,192 |
$30,355 |
01/26 |
$31,172 |
$35,738 |
$30,091 |
02/26 |
$31,940 |
$35,568 |
$30,329 |
03/26 |
$29,572 |
$33,800 |
$28,428 |
04/26 |
$32,967 |
$37,248 |
$30,267 |
05/26 |
$35,702 |
$39,135 |
$31,706 |
06/26 |
$37,465 |
$39,015 |
$32,563 |
07/26 |
$34,513 |
$38,833 |
$30,461 |
08/26 |
$35,010 |
$39,898 |
$31,238 |
|
| Average Annual Return [Table Text Block] |
Table Summary
Average Annual Total Returns (%) |
1 year |
5 years |
10 years |
Institutional Class |
13.61 |
6.63 |
13.35 |
Russell 3000® Index |
20.10 |
11.80 |
14.84 |
Russell Midcap® Growth Index |
(1.16) |
4.27 |
12.06 | |
| No Deduction of Taxes [Text Block] |
Performance does not reflect the deduction of taxes that a shareholder may pay on fund distributions or on the redemptions of fund shares.
|
| Updated Performance Information Location [Text Block] |
columbiathreadneedleus.com/investment-products/mutual-funds
|
| AssetsNet |
$ 2,314,312,681
|
| Holdings Count | Holding |
68
|
| Advisory Fees Paid, Amount |
$ 14,922,003
|
| InvestmentCompanyPortfolioTurnover |
214.00%
|
| Additional Fund Statistics [Text Block] |
Table Summary
Fund net assets |
$2,314,312,681 |
Total number of portfolio holdings |
68 |
Management services fees (represents 0.75% of Fund average net assets) |
$14,922,003 |
Portfolio turnover for the reporting period |
214% | |
| Holdings [Text Block] |
Table Summary
Information Technology |
31.6% |
Industrials |
13.9% |
Health Care |
13.7% |
Consumer Discretionary |
11.9% |
Communication Services |
8.9% |
Energy |
4.3% |
Materials |
3.6% |
Financials |
3.5% |
Consumer Staples |
2.2% |
Utilities |
0.3% |
Table Summary
Common Stocks |
93.9% |
Money Market Funds |
7.1% | |
| Largest Holdings [Text Block] |
Table Summary
Snowflake, Inc., Class A |
4.8% |
Take-Two Interactive Software, Inc. |
3.7% |
Datadog, Inc., Class A |
2.8% |
Cloudflare, Inc. |
2.7% |
Targa Resources Corp. |
2.3% |
SharkNinja, Inc. |
2.3% |
Casey's General Stores, Inc. |
2.2% |
Lattice Semiconductor Corp. |
2.1% |
ICON PLC |
2.1% |
Argenx SE, ADR |
2.1% | |
| Material Fund Change [Text Block] |
|
| C000094669 |
|
| Shareholder Report [Line Items] |
|
| Fund Name |
Columbia Select Mid Cap Growth Fund
|
| Class Name |
Institutional 2 Class
|
| Trading Symbol |
CMGVX
|
| Annual or Semi-Annual Statement [Text Block] |
This annual shareholder report contains important information about Columbia Select Mid Cap Growth Fund (the Fund) for the period of September 1, 2025 to August 31, 2026.
|
| Additional Information [Text Block] |
You can find additional information about the Fund at columbiathreadneedleus.com/resources/literature. You can also request more information by contacting us at 1-800-345-6611.
|
| Additional Information Phone Number |
1-800-345-6611
|
| Additional Information Website |
columbiathreadneedleus.com/resources/literature
|
| Expenses [Text Block] |
What were the Fund costs for the reporting period? (Based on a hypothetical $10,000 investment)
Table Summary
Class |
Cost of a $10,000 investment |
Cost paid as a percentage of a $10,000 investment |
Institutional 2 Class |
$88 |
0.82% | |
| Expenses Paid, Amount |
$ 88
|
| Expense Ratio, Percent |
0.82%
|
| Factors Affecting Performance [Text Block] |
Management's Discussion of Fund Performance The performance of Institutional 2 Class shares for the period presented is shown in the Average Annual Total Returns table. Top Performance ContributorsStock selection | Selections in the information technology and industrials sectors boosted the Fund’s performance relative to the benchmark during the period. Allocation | An overweight allocation to the materials sector contributed to relative performance. Individual holdings | Positions in Kioxia Holdings, an electronic technology company, Carpenter Technology, a specialty metal company, and Lumentum Holdings, an electrical products company, were among the top contributors to the Fund’s relative performance during the period. Top Performance DetractorsStock selection | Selections in the materials and utilities sectors hurt the Fund’s performance relative to the benchmark during the period. Allocation | An overweight allocation to the communication services sector detracted from relative performance. Individual holdings | Positions in Spotify Technology, a digital music services company, Astera Labs, a semiconductor company, and Cloudflare, a technology services company, were among the top detractors from relative performance during the period. |
| Performance Past Does Not Indicate Future [Text] |
The Fund's past performance is not a good predictor of the Fund's future performance.
|
| Line Graph [Table Text Block] |
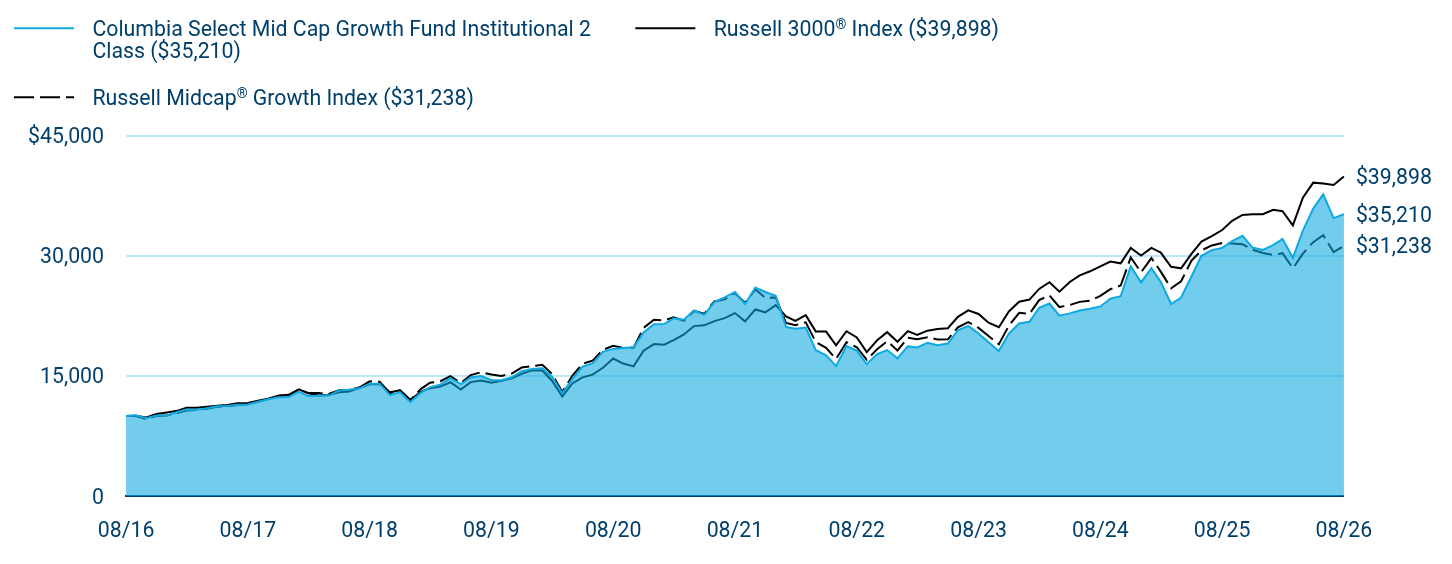
Table Summary
|
Columbia Select Mid Cap Growth Fund Institutional 2 Class ($35,210) |
Russell 3000® Index ($39,898) |
Russell Midcap® Growth Index ($31,238) |
08/16 |
$10,000 |
$10,000 |
$10,000 |
09/16 |
$10,090 |
$10,016 |
$9,995 |
10/16 |
$9,718 |
$9,799 |
$9,589 |
11/16 |
$10,064 |
$10,238 |
$10,006 |
12/16 |
$10,042 |
$10,437 |
$10,041 |
01/17 |
$10,496 |
$10,634 |
$10,375 |
02/17 |
$10,795 |
$11,029 |
$10,674 |
03/17 |
$10,783 |
$11,037 |
$10,733 |
04/17 |
$10,962 |
$11,154 |
$10,892 |
05/17 |
$11,217 |
$11,268 |
$11,152 |
06/17 |
$11,229 |
$11,370 |
$11,185 |
07/17 |
$11,404 |
$11,584 |
$11,372 |
08/17 |
$11,440 |
$11,606 |
$11,452 |
09/17 |
$11,766 |
$11,889 |
$11,776 |
10/17 |
$12,077 |
$12,149 |
$12,106 |
11/17 |
$12,332 |
$12,518 |
$12,510 |
12/17 |
$12,355 |
$12,643 |
$12,578 |
01/18 |
$13,046 |
$13,309 |
$13,289 |
02/18 |
$12,486 |
$12,819 |
$12,872 |
03/18 |
$12,508 |
$12,561 |
$12,851 |
04/18 |
$12,540 |
$12,609 |
$12,730 |
05/18 |
$13,168 |
$12,965 |
$13,206 |
06/18 |
$13,262 |
$13,050 |
$13,257 |
07/18 |
$13,443 |
$13,483 |
$13,541 |
08/18 |
$14,026 |
$13,956 |
$14,322 |
09/18 |
$14,026 |
$13,979 |
$14,261 |
10/18 |
$12,590 |
$12,950 |
$12,849 |
11/18 |
$12,973 |
$13,209 |
$13,176 |
12/18 |
$11,726 |
$11,980 |
$11,980 |
01/19 |
$12,877 |
$13,008 |
$13,357 |
02/19 |
$13,585 |
$13,466 |
$14,140 |
03/19 |
$13,905 |
$13,662 |
$14,331 |
04/19 |
$14,725 |
$14,208 |
$14,975 |
05/19 |
$13,978 |
$13,289 |
$14,114 |
06/19 |
$14,804 |
$14,222 |
$15,105 |
07/19 |
$14,978 |
$14,433 |
$15,457 |
08/19 |
$14,461 |
$14,139 |
$15,176 |
09/19 |
$14,456 |
$14,387 |
$15,003 |
10/19 |
$14,826 |
$14,697 |
$15,281 |
11/19 |
$15,579 |
$15,256 |
$16,041 |
12/19 |
$15,859 |
$15,696 |
$16,229 |
01/20 |
$15,962 |
$15,679 |
$16,381 |
02/20 |
$14,934 |
$14,395 |
$15,252 |
03/20 |
$12,822 |
$12,416 |
$12,977 |
04/20 |
$14,605 |
$14,060 |
$15,009 |
05/20 |
$16,169 |
$14,812 |
$16,517 |
06/20 |
$16,553 |
$15,151 |
$16,904 |
07/20 |
$18,013 |
$16,011 |
$18,254 |
08/20 |
$18,372 |
$17,171 |
$18,751 |
09/20 |
$18,482 |
$16,546 |
$18,489 |
10/20 |
$18,567 |
$16,188 |
$18,511 |
11/20 |
$20,429 |
$18,158 |
$20,998 |
12/20 |
$21,459 |
$18,975 |
$22,005 |
01/21 |
$21,473 |
$18,890 |
$21,931 |
02/21 |
$22,184 |
$19,481 |
$22,306 |
03/21 |
$22,008 |
$20,179 |
$21,880 |
04/21 |
$23,185 |
$21,219 |
$23,110 |
05/21 |
$22,628 |
$21,316 |
$22,757 |
06/21 |
$24,227 |
$21,842 |
$24,303 |
07/21 |
$24,798 |
$22,211 |
$24,553 |
08/21 |
$25,488 |
$22,845 |
$25,346 |
09/21 |
$23,967 |
$21,820 |
$24,118 |
10/21 |
$26,031 |
$23,295 |
$25,809 |
11/21 |
$25,481 |
$22,941 |
$24,719 |
12/21 |
$25,005 |
$23,844 |
$24,806 |
01/22 |
$21,119 |
$22,441 |
$21,605 |
02/22 |
$20,897 |
$21,876 |
$21,342 |
03/22 |
$21,034 |
$22,585 |
$21,685 |
04/22 |
$18,230 |
$20,558 |
$19,243 |
05/22 |
$17,557 |
$20,531 |
$18,498 |
06/22 |
$16,227 |
$18,813 |
$17,116 |
07/22 |
$18,716 |
$20,578 |
$19,210 |
08/22 |
$18,162 |
$19,810 |
$18,581 |
09/22 |
$16,474 |
$17,973 |
$17,004 |
10/22 |
$17,736 |
$19,447 |
$18,340 |
11/22 |
$18,230 |
$20,462 |
$19,338 |
12/22 |
$17,199 |
$19,264 |
$18,177 |
01/23 |
$18,707 |
$20,591 |
$19,764 |
02/23 |
$18,545 |
$20,110 |
$19,568 |
03/23 |
$19,133 |
$20,647 |
$19,838 |
04/23 |
$18,826 |
$20,867 |
$19,551 |
05/23 |
$19,048 |
$20,949 |
$19,563 |
06/23 |
$20,684 |
$22,379 |
$21,075 |
07/23 |
$21,247 |
$23,181 |
$21,713 |
08/23 |
$20,301 |
$22,734 |
$20,997 |
09/23 |
$19,193 |
$21,651 |
$19,974 |
10/23 |
$18,119 |
$21,077 |
$18,955 |
11/23 |
$20,267 |
$23,042 |
$21,267 |
12/23 |
$21,554 |
$24,265 |
$22,879 |
01/24 |
$21,750 |
$24,534 |
$22,756 |
02/24 |
$23,514 |
$25,862 |
$24,467 |
03/24 |
$24,042 |
$26,696 |
$25,052 |
04/24 |
$22,525 |
$25,521 |
$23,597 |
05/24 |
$22,806 |
$26,727 |
$23,849 |
06/24 |
$23,164 |
$27,554 |
$24,247 |
07/24 |
$23,395 |
$28,066 |
$24,394 |
08/24 |
$23,676 |
$28,677 |
$25,000 |
09/24 |
$24,639 |
$29,271 |
$25,833 |
10/24 |
$24,954 |
$29,056 |
$26,284 |
11/24 |
$28,696 |
$30,989 |
$29,788 |
12/24 |
$26,681 |
$30,041 |
$27,936 |
01/25 |
$28,454 |
$30,990 |
$29,719 |
02/25 |
$26,747 |
$30,396 |
$28,025 |
03/25 |
$23,983 |
$28,623 |
$25,947 |
04/25 |
$24,784 |
$28,431 |
$26,819 |
05/25 |
$27,415 |
$30,233 |
$29,390 |
06/25 |
$29,998 |
$31,769 |
$30,670 |
07/25 |
$30,713 |
$32,469 |
$31,293 |
08/25 |
$30,989 |
$33,220 |
$31,606 |
09/25 |
$31,838 |
$34,366 |
$31,522 |
10/25 |
$32,505 |
$35,103 |
$31,434 |
11/25 |
$31,027 |
$35,199 |
$30,767 |
12/25 |
$30,722 |
$35,192 |
$30,355 |
01/26 |
$31,339 |
$35,738 |
$30,091 |
02/26 |
$32,115 |
$35,568 |
$30,329 |
03/26 |
$29,744 |
$33,800 |
$28,428 |
04/26 |
$33,157 |
$37,248 |
$30,267 |
05/26 |
$35,901 |
$39,135 |
$31,706 |
06/26 |
$37,677 |
$39,015 |
$32,563 |
07/26 |
$34,710 |
$38,833 |
$30,461 |
08/26 |
$35,210 |
$39,898 |
$31,238 |
|
| Average Annual Return [Table Text Block] |
Table Summary
Average Annual Total Returns (%) |
1 year |
5 years |
10 years |
Institutional 2 Class |
13.62 |
6.68 |
13.41 |
Russell 3000® Index |
20.10 |
11.80 |
14.84 |
Russell Midcap® Growth Index |
(1.16) |
4.27 |
12.06 | |
| No Deduction of Taxes [Text Block] |
Performance does not reflect the deduction of taxes that a shareholder may pay on fund distributions or on the redemptions of fund shares.
|
| Updated Performance Information Location [Text Block] |
columbiathreadneedleus.com/investment-products/mutual-funds
|
| AssetsNet |
$ 2,314,312,681
|
| Holdings Count | Holding |
68
|
| Advisory Fees Paid, Amount |
$ 14,922,003
|
| InvestmentCompanyPortfolioTurnover |
214.00%
|
| Additional Fund Statistics [Text Block] |
Table Summary
Fund net assets |
$2,314,312,681 |
Total number of portfolio holdings |
68 |
Management services fees (represents 0.75% of Fund average net assets) |
$14,922,003 |
Portfolio turnover for the reporting period |
214% | |
| Holdings [Text Block] |
Table Summary
Information Technology |
31.6% |
Industrials |
13.9% |
Health Care |
13.7% |
Consumer Discretionary |
11.9% |
Communication Services |
8.9% |
Energy |
4.3% |
Materials |
3.6% |
Financials |
3.5% |
Consumer Staples |
2.2% |
Utilities |
0.3% |
Table Summary
Common Stocks |
93.9% |
Money Market Funds |
7.1% | |
| Largest Holdings [Text Block] |
Table Summary
Snowflake, Inc., Class A |
4.8% |
Take-Two Interactive Software, Inc. |
3.7% |
Datadog, Inc., Class A |
2.8% |
Cloudflare, Inc. |
2.7% |
Targa Resources Corp. |
2.3% |
SharkNinja, Inc. |
2.3% |
Casey's General Stores, Inc. |
2.2% |
Lattice Semiconductor Corp. |
2.1% |
ICON PLC |
2.1% |
Argenx SE, ADR |
2.1% | |
| Material Fund Change [Text Block] |
|
| C000078986 |
|
| Shareholder Report [Line Items] |
|
| Fund Name |
Columbia Select Mid Cap Growth Fund
|
| Class Name |
Institutional 3 Class
|
| Trading Symbol |
CMGYX
|
| Annual or Semi-Annual Statement [Text Block] |
This annual shareholder report contains important information about Columbia Select Mid Cap Growth Fund (the Fund) for the period of September 1, 2025 to August 31, 2026.
|
| Additional Information [Text Block] |
You can find additional information about the Fund at columbiathreadneedleus.com/resources/literature. You can also request more information by contacting us at 1-800-345-6611.
|
| Additional Information Phone Number |
1-800-345-6611
|
| Additional Information Website |
columbiathreadneedleus.com/resources/literature
|
| Expenses [Text Block] |
What were the Fund costs for the reporting period? (Based on a hypothetical $10,000 investment)
Table Summary
Class |
Cost of a $10,000 investment |
Cost paid as a percentage of a $10,000 investment |
Institutional 3 Class |
$82 |
0.77% | |
| Expenses Paid, Amount |
$ 82
|
| Expense Ratio, Percent |
0.77%
|
| Factors Affecting Performance [Text Block] |
Management's Discussion of Fund Performance The performance of Institutional 3 Class shares for the period presented is shown in the Average Annual Total Returns table. Top Performance ContributorsStock selection | Selections in the information technology and industrials sectors boosted the Fund’s performance relative to the benchmark during the period. Allocation | An overweight allocation to the materials sector contributed to relative performance. Individual holdings | Positions in Kioxia Holdings, an electronic technology company, Carpenter Technology, a specialty metal company, and Lumentum Holdings, an electrical products company, were among the top contributors to the Fund’s relative performance during the period. Top Performance DetractorsStock selection | Selections in the materials and utilities sectors hurt the Fund’s performance relative to the benchmark during the period. Allocation | An overweight allocation to the communication services sector detracted from relative performance. Individual holdings | Positions in Spotify Technology, a digital music services company, Astera Labs, a semiconductor company, and Cloudflare, a technology services company, were among the top detractors from relative performance during the period. |
| Performance Past Does Not Indicate Future [Text] |
The Fund's past performance is not a good predictor of the Fund's future performance.
|
| Line Graph [Table Text Block] |
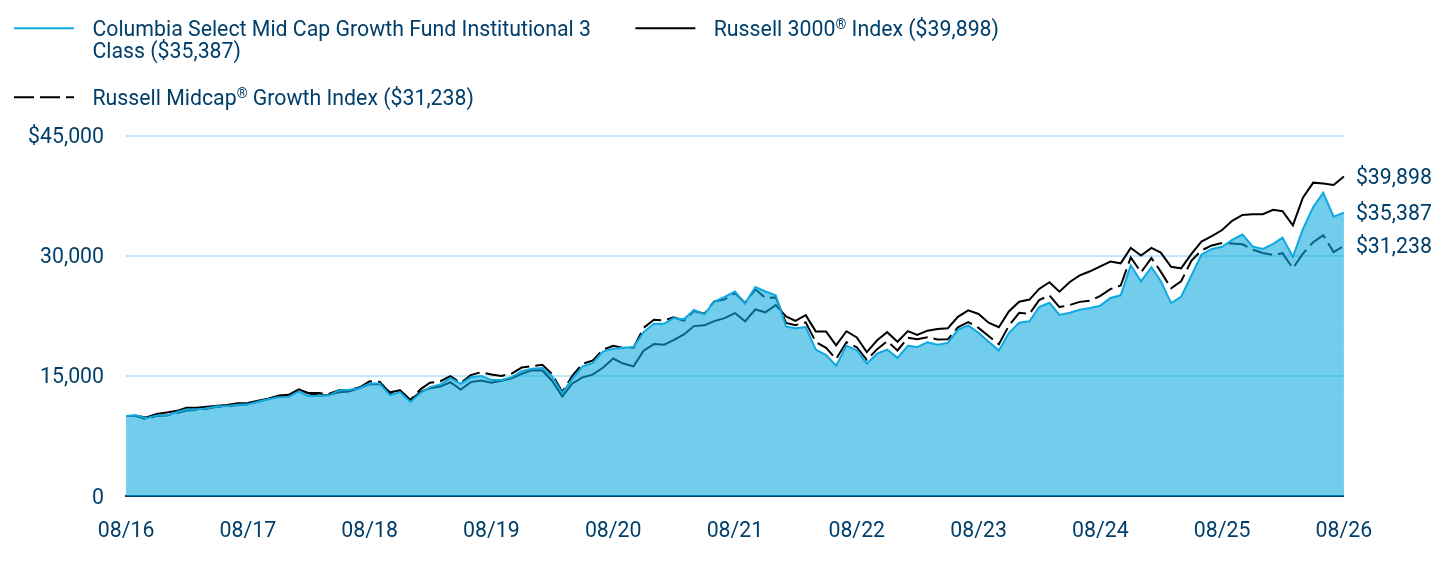
Table Summary
|
Columbia Select Mid Cap Growth Fund Institutional 3 Class ($35,387) |
Russell 3000® Index ($39,898) |
Russell Midcap® Growth Index ($31,238) |
08/16 |
$10,000 |
$10,000 |
$10,000 |
09/16 |
$10,094 |
$10,016 |
$9,995 |
10/16 |
$9,718 |
$9,799 |
$9,589 |
11/16 |
$10,068 |
$10,238 |
$10,006 |
12/16 |
$10,043 |
$10,437 |
$10,041 |
01/17 |
$10,497 |
$10,634 |
$10,375 |
02/17 |
$10,796 |
$11,029 |
$10,674 |
03/17 |
$10,788 |
$11,037 |
$10,733 |
04/17 |
$10,967 |
$11,154 |
$10,892 |
05/17 |
$11,222 |
$11,268 |
$11,152 |
06/17 |
$11,234 |
$11,370 |
$11,185 |
07/17 |
$11,409 |
$11,584 |
$11,372 |
08/17 |
$11,445 |
$11,606 |
$11,452 |
09/17 |
$11,772 |
$11,889 |
$11,776 |
10/17 |
$12,086 |
$12,149 |
$12,106 |
11/17 |
$12,337 |
$12,518 |
$12,510 |
12/17 |
$12,366 |
$12,643 |
$12,578 |
01/18 |
$13,053 |
$13,309 |
$13,289 |
02/18 |
$12,493 |
$12,819 |
$12,872 |
03/18 |
$12,515 |
$12,561 |
$12,851 |
04/18 |
$12,547 |
$12,609 |
$12,730 |
05/18 |
$13,180 |
$12,965 |
$13,206 |
06/18 |
$13,270 |
$13,050 |
$13,257 |
07/18 |
$13,455 |
$13,483 |
$13,541 |
08/18 |
$14,038 |
$13,956 |
$14,322 |
09/18 |
$14,043 |
$13,979 |
$14,261 |
10/18 |
$12,601 |
$12,950 |
$12,849 |
11/18 |
$12,985 |
$13,209 |
$13,176 |
12/18 |
$11,741 |
$11,980 |
$11,980 |
01/19 |
$12,894 |
$13,008 |
$13,357 |
02/19 |
$13,602 |
$13,466 |
$14,140 |
03/19 |
$13,922 |
$13,662 |
$14,331 |
04/19 |
$14,743 |
$14,208 |
$14,975 |
05/19 |
$13,995 |
$13,289 |
$14,114 |
06/19 |
$14,821 |
$14,222 |
$15,105 |
07/19 |
$14,996 |
$14,433 |
$15,457 |
08/19 |
$14,484 |
$14,139 |
$15,176 |
09/19 |
$14,479 |
$14,387 |
$15,003 |
10/19 |
$14,850 |
$14,697 |
$15,281 |
11/19 |
$15,603 |
$15,256 |
$16,041 |
12/19 |
$15,883 |
$15,696 |
$16,229 |
01/20 |
$15,987 |
$15,679 |
$16,381 |
02/20 |
$14,957 |
$14,395 |
$15,252 |
03/20 |
$12,844 |
$12,416 |
$12,977 |
04/20 |
$14,629 |
$14,060 |
$15,009 |
05/20 |
$16,200 |
$14,812 |
$16,517 |
06/20 |
$16,584 |
$15,151 |
$16,904 |
07/20 |
$18,045 |
$16,011 |
$18,254 |
08/20 |
$18,404 |
$17,171 |
$18,751 |
09/20 |
$18,520 |
$16,546 |
$18,489 |
10/20 |
$18,605 |
$16,188 |
$18,511 |
11/20 |
$20,475 |
$18,158 |
$20,998 |
12/20 |
$21,506 |
$18,975 |
$22,005 |
01/21 |
$21,520 |
$18,890 |
$21,931 |
02/21 |
$22,232 |
$19,481 |
$22,306 |
03/21 |
$22,063 |
$20,179 |
$21,880 |
04/21 |
$23,240 |
$21,219 |
$23,110 |
05/21 |
$22,683 |
$21,316 |
$22,757 |
06/21 |
$24,284 |
$21,842 |
$24,303 |
07/21 |
$24,855 |
$22,211 |
$24,553 |
08/21 |
$25,546 |
$22,845 |
$25,346 |
09/21 |
$24,023 |
$21,820 |
$24,118 |
10/21 |
$26,096 |
$23,295 |
$25,809 |
11/21 |
$25,546 |
$22,941 |
$24,719 |
12/21 |
$25,070 |
$23,844 |
$24,806 |
01/22 |
$21,180 |
$22,441 |
$21,605 |
02/22 |
$20,950 |
$21,876 |
$21,342 |
03/22 |
$21,095 |
$22,585 |
$21,685 |
04/22 |
$18,280 |
$20,558 |
$19,243 |
05/22 |
$17,606 |
$20,531 |
$18,498 |
06/22 |
$16,275 |
$18,813 |
$17,116 |
07/22 |
$18,774 |
$20,578 |
$19,210 |
08/22 |
$18,211 |
$19,810 |
$18,581 |
09/22 |
$16,523 |
$17,973 |
$17,004 |
10/22 |
$17,794 |
$19,447 |
$18,340 |
11/22 |
$18,280 |
$20,462 |
$19,338 |
12/22 |
$17,256 |
$19,264 |
$18,177 |
01/23 |
$18,766 |
$20,591 |
$19,764 |
02/23 |
$18,604 |
$20,110 |
$19,568 |
03/23 |
$19,192 |
$20,647 |
$19,838 |
04/23 |
$18,894 |
$20,867 |
$19,551 |
05/23 |
$19,116 |
$20,949 |
$19,563 |
06/23 |
$20,753 |
$22,379 |
$21,075 |
07/23 |
$21,316 |
$23,181 |
$21,713 |
08/23 |
$20,370 |
$22,734 |
$20,997 |
09/23 |
$19,261 |
$21,651 |
$19,974 |
10/23 |
$18,186 |
$21,077 |
$18,955 |
11/23 |
$20,344 |
$23,042 |
$21,267 |
12/23 |
$21,641 |
$24,265 |
$22,879 |
01/24 |
$21,828 |
$24,534 |
$22,756 |
02/24 |
$23,611 |
$25,862 |
$24,467 |
03/24 |
$24,140 |
$26,696 |
$25,052 |
04/24 |
$22,613 |
$25,521 |
$23,597 |
05/24 |
$22,894 |
$26,727 |
$23,849 |
06/24 |
$23,261 |
$27,554 |
$24,247 |
07/24 |
$23,483 |
$28,066 |
$24,394 |
08/24 |
$23,773 |
$28,677 |
$25,000 |
09/24 |
$24,737 |
$29,271 |
$25,833 |
10/24 |
$25,061 |
$29,056 |
$26,284 |
11/24 |
$28,823 |
$30,989 |
$29,788 |
12/24 |
$26,797 |
$30,041 |
$27,936 |
01/25 |
$28,572 |
$30,990 |
$29,719 |
02/25 |
$26,864 |
$30,396 |
$28,025 |
03/25 |
$24,088 |
$28,623 |
$25,947 |
04/25 |
$24,889 |
$28,431 |
$26,819 |
05/25 |
$27,532 |
$30,233 |
$29,390 |
06/25 |
$30,136 |
$31,769 |
$30,670 |
07/25 |
$30,861 |
$32,469 |
$31,293 |
08/25 |
$31,128 |
$33,220 |
$31,606 |
09/25 |
$31,987 |
$34,366 |
$31,522 |
10/25 |
$32,655 |
$35,103 |
$31,434 |
11/25 |
$31,166 |
$35,199 |
$30,767 |
12/25 |
$30,864 |
$35,192 |
$30,355 |
01/26 |
$31,492 |
$35,738 |
$30,091 |
02/26 |
$32,269 |
$35,568 |
$30,329 |
03/26 |
$29,885 |
$33,800 |
$28,428 |
04/26 |
$33,323 |
$37,248 |
$30,267 |
05/26 |
$36,079 |
$39,135 |
$31,706 |
06/26 |
$37,867 |
$39,015 |
$32,563 |
07/26 |
$34,887 |
$38,833 |
$30,461 |
08/26 |
$35,387 |
$39,898 |
$31,238 |
|
| Average Annual Return [Table Text Block] |
Table Summary
Average Annual Total Returns (%) |
1 year |
5 years |
10 years |
Institutional 3 Class |
13.68 |
6.73 |
13.47 |
Russell 3000® Index |
20.10 |
11.80 |
14.84 |
Russell Midcap® Growth Index |
(1.16) |
4.27 |
12.06 | |
| No Deduction of Taxes [Text Block] |
Performance does not reflect the deduction of taxes that a shareholder may pay on fund distributions or on the redemptions of fund shares.
|
| Updated Performance Information Location [Text Block] |
columbiathreadneedleus.com/investment-products/mutual-funds
|
| AssetsNet |
$ 2,314,312,681
|
| Holdings Count | Holding |
68
|
| Advisory Fees Paid, Amount |
$ 14,922,003
|
| InvestmentCompanyPortfolioTurnover |
214.00%
|
| Additional Fund Statistics [Text Block] |
Table Summary
Fund net assets |
$2,314,312,681 |
Total number of portfolio holdings |
68 |
Management services fees (represents 0.75% of Fund average net assets) |
$14,922,003 |
Portfolio turnover for the reporting period |
214% | |
| Holdings [Text Block] |
Table Summary
Information Technology |
31.6% |
Industrials |
13.9% |
Health Care |
13.7% |
Consumer Discretionary |
11.9% |
Communication Services |
8.9% |
Energy |
4.3% |
Materials |
3.6% |
Financials |
3.5% |
Consumer Staples |
2.2% |
Utilities |
0.3% |
Table Summary
Common Stocks |
93.9% |
Money Market Funds |
7.1% | |
| Largest Holdings [Text Block] |
Table Summary
Snowflake, Inc., Class A |
4.8% |
Take-Two Interactive Software, Inc. |
3.7% |
Datadog, Inc., Class A |
2.8% |
Cloudflare, Inc. |
2.7% |
Targa Resources Corp. |
2.3% |
SharkNinja, Inc. |
2.3% |
Casey's General Stores, Inc. |
2.2% |
Lattice Semiconductor Corp. |
2.1% |
ICON PLC |
2.1% |
Argenx SE, ADR |
2.1% | |
| Material Fund Change [Text Block] |
|
| C000253714 |
|
| Shareholder Report [Line Items] |
|
| Fund Name |
Columbia Select Mid Cap Growth Fund
|
| Class Name |
Class S
|
| Trading Symbol |
CLSDX
|
| Annual or Semi-Annual Statement [Text Block] |
This annual shareholder report contains important information about Columbia Select Mid Cap Growth Fund (the Fund) for the period of September 1, 2025 to August 31, 2026.
|
| Additional Information [Text Block] |
You can find additional information about the Fund at columbiathreadneedleus.com/resources/literature. You can also request more information by contacting us at 1-800-345-6611.
|
| Additional Information Phone Number |
1-800-345-6611
|
| Additional Information Website |
columbiathreadneedleus.com/resources/literature
|
| Expenses [Text Block] |
What were the Fund costs for the reporting period? (Based on a hypothetical $10,000 investment)
Table Summary
Class |
Cost of a $10,000 investment |
Cost paid as a percentage of a $10,000 investment |
Class S |
$92 |
0.86% | |
| Expenses Paid, Amount |
$ 92
|
| Expense Ratio, Percent |
0.86%
|
| Factors Affecting Performance [Text Block] |
Management's Discussion of Fund Performance The performance of Class S shares for the period presented is shown in the Average Annual Total Returns table. Top Performance ContributorsStock selection | Selections in the information technology and industrials sectors boosted the Fund’s performance relative to the benchmark during the period. Allocation | An overweight allocation to the materials sector contributed to relative performance. Individual holdings | Positions in Kioxia Holdings, an electronic technology company, Carpenter Technology, a specialty metal company, and Lumentum Holdings, an electrical products company, were among the top contributors to the Fund’s relative performance during the period. Top Performance DetractorsStock selection | Selections in the materials and utilities sectors hurt the Fund’s performance relative to the benchmark during the period. Allocation | An overweight allocation to the communication services sector detracted from relative performance. Individual holdings | Positions in Spotify Technology, a digital music services company, Astera Labs, a semiconductor company, and Cloudflare, a technology services company, were among the top detractors from relative performance during the period. |
| Performance Past Does Not Indicate Future [Text] |
The Fund's past performance is not a good predictor of the Fund's future performance.
|
| Line Graph [Table Text Block] |
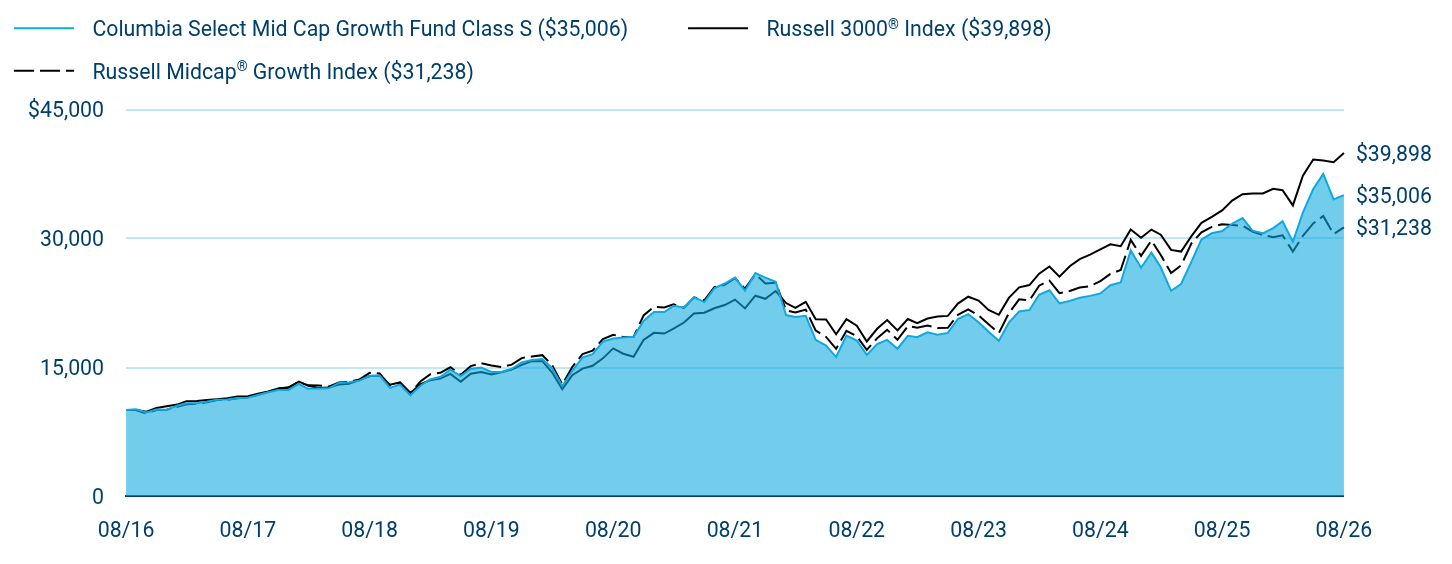
Table Summary
|
Columbia Select Mid Cap Growth Fund Class S ($35,006) |
Russell 3000® Index ($39,898) |
Russell Midcap® Growth Index ($31,238) |
08/16 |
$10,000 |
$10,000 |
$10,000 |
09/16 |
$10,094 |
$10,016 |
$9,995 |
10/16 |
$9,717 |
$9,799 |
$9,589 |
11/16 |
$10,064 |
$10,238 |
$10,006 |
12/16 |
$10,043 |
$10,437 |
$10,041 |
01/17 |
$10,492 |
$10,634 |
$10,375 |
02/17 |
$10,788 |
$11,029 |
$10,674 |
03/17 |
$10,780 |
$11,037 |
$10,733 |
04/17 |
$10,957 |
$11,154 |
$10,892 |
05/17 |
$11,209 |
$11,268 |
$11,152 |
06/17 |
$11,221 |
$11,370 |
$11,185 |
07/17 |
$11,393 |
$11,584 |
$11,372 |
08/17 |
$11,429 |
$11,606 |
$11,452 |
09/17 |
$11,754 |
$11,889 |
$11,776 |
10/17 |
$12,067 |
$12,149 |
$12,106 |
11/17 |
$12,319 |
$12,518 |
$12,510 |
12/17 |
$12,341 |
$12,643 |
$12,578 |
01/18 |
$13,028 |
$13,309 |
$13,289 |
02/18 |
$12,469 |
$12,819 |
$12,872 |
03/18 |
$12,491 |
$12,561 |
$12,851 |
04/18 |
$12,523 |
$12,609 |
$12,730 |
05/18 |
$13,150 |
$12,965 |
$13,206 |
06/18 |
$13,241 |
$13,050 |
$13,257 |
07/18 |
$13,419 |
$13,483 |
$13,541 |
08/18 |
$14,000 |
$13,956 |
$14,322 |
09/18 |
$14,005 |
$13,979 |
$14,261 |
10/18 |
$12,569 |
$12,950 |
$12,849 |
11/18 |
$12,950 |
$13,209 |
$13,176 |
12/18 |
$11,702 |
$11,980 |
$11,980 |
01/19 |
$12,851 |
$13,008 |
$13,357 |
02/19 |
$13,559 |
$13,466 |
$14,140 |
03/19 |
$13,876 |
$13,662 |
$14,331 |
04/19 |
$14,691 |
$14,208 |
$14,975 |
05/19 |
$13,949 |
$13,289 |
$14,114 |
06/19 |
$14,770 |
$14,222 |
$15,105 |
07/19 |
$14,940 |
$14,433 |
$15,457 |
08/19 |
$14,430 |
$14,139 |
$15,176 |
09/19 |
$14,419 |
$14,387 |
$15,003 |
10/19 |
$14,793 |
$14,697 |
$15,281 |
11/19 |
$15,540 |
$15,256 |
$16,041 |
12/19 |
$15,817 |
$15,696 |
$16,229 |
01/20 |
$15,921 |
$15,679 |
$16,381 |
02/20 |
$14,889 |
$14,395 |
$15,252 |
03/20 |
$12,790 |
$12,416 |
$12,977 |
04/20 |
$14,564 |
$14,060 |
$15,009 |
05/20 |
$16,124 |
$14,812 |
$16,517 |
06/20 |
$16,504 |
$15,151 |
$16,904 |
07/20 |
$17,959 |
$16,011 |
$18,254 |
08/20 |
$18,316 |
$17,171 |
$18,751 |
09/20 |
$18,426 |
$16,546 |
$18,489 |
10/20 |
$18,512 |
$16,188 |
$18,511 |
11/20 |
$20,366 |
$18,158 |
$20,998 |
12/20 |
$21,390 |
$18,975 |
$22,005 |
01/21 |
$21,404 |
$18,890 |
$21,931 |
02/21 |
$22,116 |
$19,481 |
$22,306 |
03/21 |
$21,938 |
$20,179 |
$21,880 |
04/21 |
$23,112 |
$21,219 |
$23,110 |
05/21 |
$22,557 |
$21,316 |
$22,757 |
06/21 |
$24,152 |
$21,842 |
$24,303 |
07/21 |
$24,714 |
$22,211 |
$24,553 |
08/21 |
$25,397 |
$22,845 |
$25,346 |
09/21 |
$23,881 |
$21,820 |
$24,118 |
10/21 |
$25,938 |
$23,295 |
$25,809 |
11/21 |
$25,397 |
$22,941 |
$24,719 |
12/21 |
$24,917 |
$23,844 |
$24,806 |
01/22 |
$21,049 |
$22,441 |
$21,605 |
02/22 |
$20,824 |
$21,876 |
$21,342 |
03/22 |
$20,963 |
$22,585 |
$21,685 |
04/22 |
$18,157 |
$20,558 |
$19,243 |
05/22 |
$17,492 |
$20,531 |
$18,498 |
06/22 |
$16,162 |
$18,813 |
$17,116 |
07/22 |
$18,649 |
$20,578 |
$19,210 |
08/22 |
$18,088 |
$19,810 |
$18,581 |
09/22 |
$16,413 |
$17,973 |
$17,004 |
10/22 |
$17,665 |
$19,447 |
$18,340 |
11/22 |
$18,157 |
$20,462 |
$19,338 |
12/22 |
$17,129 |
$19,264 |
$18,177 |
01/23 |
$18,631 |
$20,591 |
$19,764 |
02/23 |
$18,467 |
$20,110 |
$19,568 |
03/23 |
$19,046 |
$20,647 |
$19,838 |
04/23 |
$18,752 |
$20,867 |
$19,551 |
05/23 |
$18,968 |
$20,949 |
$19,563 |
06/23 |
$20,591 |
$22,379 |
$21,075 |
07/23 |
$21,153 |
$23,181 |
$21,713 |
08/23 |
$20,211 |
$22,734 |
$20,997 |
09/23 |
$19,106 |
$21,651 |
$19,974 |
10/23 |
$18,044 |
$21,077 |
$18,955 |
11/23 |
$20,177 |
$23,042 |
$21,267 |
12/23 |
$21,455 |
$24,265 |
$22,879 |
01/24 |
$21,645 |
$24,534 |
$22,756 |
02/24 |
$23,406 |
$25,862 |
$24,467 |
03/24 |
$23,933 |
$26,696 |
$25,052 |
04/24 |
$22,413 |
$25,521 |
$23,597 |
05/24 |
$22,698 |
$26,727 |
$23,849 |
06/24 |
$23,052 |
$27,554 |
$24,247 |
07/24 |
$23,276 |
$28,066 |
$24,394 |
08/24 |
$23,561 |
$28,677 |
$25,000 |
09/24 |
$24,520 |
$29,271 |
$25,833 |
10/24 |
$24,839 |
$29,056 |
$26,284 |
11/24 |
$28,560 |
$30,989 |
$29,788 |
12/24 |
$26,551 |
$30,041 |
$27,936 |
01/25 |
$28,311 |
$30,990 |
$29,719 |
02/25 |
$26,609 |
$30,396 |
$28,025 |
03/25 |
$23,862 |
$28,623 |
$25,947 |
04/25 |
$24,655 |
$28,431 |
$26,819 |
05/25 |
$27,267 |
$30,233 |
$29,390 |
06/25 |
$29,840 |
$31,769 |
$30,670 |
07/25 |
$30,555 |
$32,469 |
$31,293 |
08/25 |
$30,817 |
$33,220 |
$31,606 |
09/25 |
$31,668 |
$34,366 |
$31,522 |
10/25 |
$32,325 |
$35,103 |
$31,434 |
11/25 |
$30,855 |
$35,199 |
$30,767 |
12/25 |
$30,552 |
$35,192 |
$30,355 |
01/26 |
$31,168 |
$35,738 |
$30,091 |
02/26 |
$31,947 |
$35,568 |
$30,329 |
03/26 |
$29,579 |
$33,800 |
$28,428 |
04/26 |
$32,974 |
$37,248 |
$30,267 |
05/26 |
$35,709 |
$39,135 |
$31,706 |
06/26 |
$37,460 |
$39,015 |
$32,563 |
07/26 |
$34,509 |
$38,833 |
$30,461 |
08/26 |
$35,006 |
$39,898 |
$31,238 |
|
| Average Annual Return [Table Text Block] |
Table Summary
Average Annual Total Returns (%) |
1 year |
5 years |
10 years |
Class SFootnote Reference(a) |
13.60 |
6.63 |
13.35 |
Russell 3000® Index |
20.10 |
11.80 |
14.84 |
Russell Midcap® Growth Index |
(1.16) |
4.27 |
12.06 | |
| No Deduction of Taxes [Text Block] |
Performance does not reflect the deduction of taxes that a shareholder may pay on fund distributions or on the redemptions of fund shares.
|
| Updated Performance Information Location [Text Block] |
columbiathreadneedleus.com/investment-products/mutual-funds
|
| AssetsNet |
$ 2,314,312,681
|
| Holdings Count | Holding |
68
|
| Advisory Fees Paid, Amount |
$ 14,922,003
|
| InvestmentCompanyPortfolioTurnover |
214.00%
|
| Additional Fund Statistics [Text Block] |
Table Summary
Fund net assets |
$2,314,312,681 |
Total number of portfolio holdings |
68 |
Management services fees (represents 0.75% of Fund average net assets) |
$14,922,003 |
Portfolio turnover for the reporting period |
214% | |
| Holdings [Text Block] |
Table Summary
Information Technology |
31.6% |
Industrials |
13.9% |
Health Care |
13.7% |
Consumer Discretionary |
11.9% |
Communication Services |
8.9% |
Energy |
4.3% |
Materials |
3.6% |
Financials |
3.5% |
Consumer Staples |
2.2% |
Utilities |
0.3% |
Table Summary
Common Stocks |
93.9% |
Money Market Funds |
7.1% | |
| Largest Holdings [Text Block] |
Table Summary
Snowflake, Inc., Class A |
4.8% |
Take-Two Interactive Software, Inc. |
3.7% |
Datadog, Inc., Class A |
2.8% |
Cloudflare, Inc. |
2.7% |
Targa Resources Corp. |
2.3% |
SharkNinja, Inc. |
2.3% |
Casey's General Stores, Inc. |
2.2% |
Lattice Semiconductor Corp. |
2.1% |
ICON PLC |
2.1% |
Argenx SE, ADR |
2.1% | |
| Material Fund Change [Text Block] |
|
| C000032868 |
|
| Shareholder Report [Line Items] |
|
| Fund Name |
Columbia Small Cap Growth Fund
|
| Class Name |
Class A
|
| Trading Symbol |
CGOAX
|
| Annual or Semi-Annual Statement [Text Block] |
This annual shareholder report contains important information about Columbia Small Cap Growth Fund (the Fund) for the period of September 1, 2025 to August 31, 2026.
|
| Additional Information [Text Block] |
You can find additional information about the Fund at columbiathreadneedleus.com/resources/literature. You can also request more information by contacting us at 1-800-345-6611.
|
| Additional Information Phone Number |
1-800-345-6611
|
| Additional Information Website |
columbiathreadneedleus.com/resources/literature
|
| Expenses [Text Block] |
What were the Fund costs for the reporting period? (Based on a hypothetical $10,000 investment)
Table Summary
Class |
Cost of a $10,000 investment |
Cost paid as a percentage of a $10,000 investment |
Class A |
$134 |
1.18% | |
| Expenses Paid, Amount |
$ 134
|
| Expense Ratio, Percent |
1.18%
|
| Factors Affecting Performance [Text Block] |
Management's Discussion of Fund Performance The performance of Class A shares for the period presented is shown in the Average Annual Total Returns table. Top Performance ContributorsStock selection | Selections in the information technology and health care sectors boosted the Fund’s performance relative to the benchmark during the annual period. Allocation | An underweight allocation to the information technology sector contributed to relative performance. Individual holdings | Positions in Lumentum Holdings, an electrical products company, Hut 8, a data processing services company, and SiTime Corp, a semiconductor company, were among the top contributors to the Fund’s relative performance during the period. Top Performance DetractorsStock selection | Selections in the consumer discretionary and energy sectors hurt the Fund’s performance relative to the benchmark during the period. Allocation | An overweight allocation to the consumer discretionary sector detracted from relative performance. Individual holdings | Positions in Ollie’s Bargain Outlet Holdings, a department store company, Karman Holdings, an aerospace & defense company, and Modine Manufacturing, an industrial machinery company, were among the top detractors from relative performance during the period. |
| Performance Past Does Not Indicate Future [Text] |
The Fund's past performance is not a good predictor of the Fund's future performance.
|
| Line Graph [Table Text Block] |
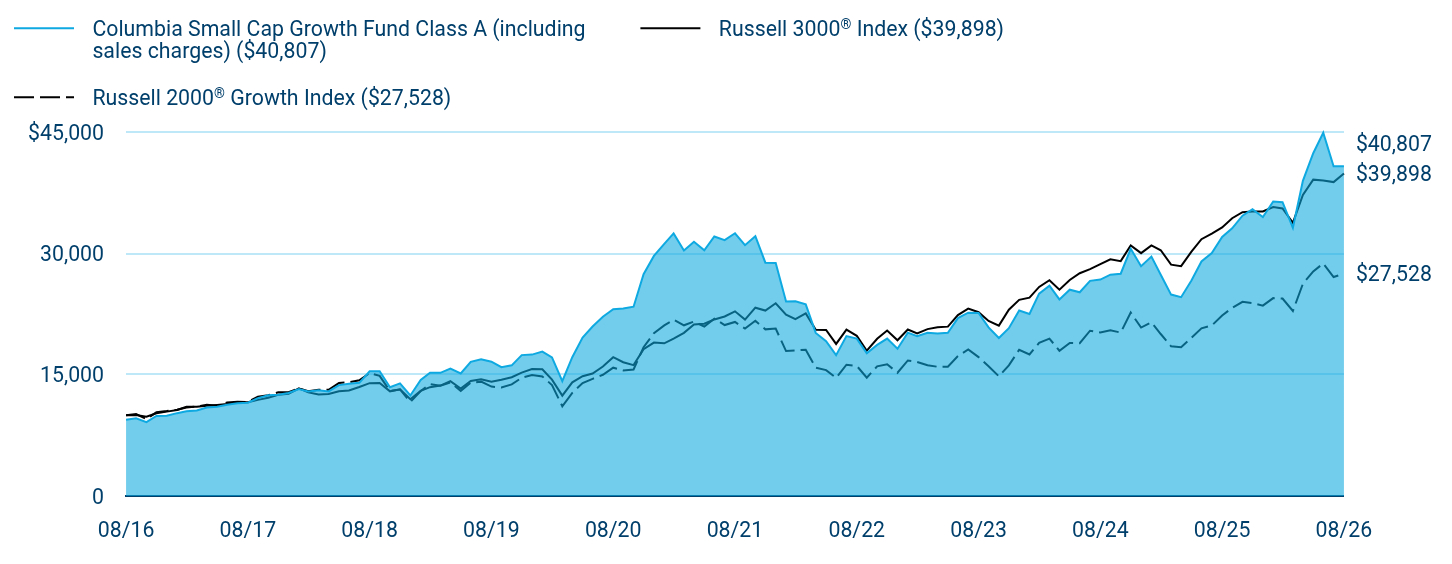
Table Summary
|
Columbia Small Cap Growth Fund Class A (including sales charges) ($40,807) |
Russell 3000® Index ($39,898) |
Russell 2000® Growth Index ($27,528) |
08/16 |
$9,427 |
$10,000 |
$10,000 |
09/16 |
$9,618 |
$10,016 |
$10,144 |
10/16 |
$9,133 |
$9,799 |
$9,514 |
11/16 |
$9,896 |
$10,238 |
$10,365 |
12/16 |
$9,916 |
$10,437 |
$10,506 |
01/17 |
$10,249 |
$10,634 |
$10,677 |
02/17 |
$10,486 |
$11,029 |
$10,939 |
03/17 |
$10,569 |
$11,037 |
$11,068 |
04/17 |
$10,943 |
$11,154 |
$11,272 |
05/17 |
$11,049 |
$11,268 |
$11,169 |
06/17 |
$11,292 |
$11,370 |
$11,554 |
07/17 |
$11,470 |
$11,584 |
$11,652 |
08/17 |
$11,542 |
$11,606 |
$11,639 |
09/17 |
$12,105 |
$11,889 |
$12,272 |
10/17 |
$12,467 |
$12,149 |
$12,462 |
11/17 |
$12,532 |
$12,518 |
$12,820 |
12/17 |
$12,736 |
$12,643 |
$12,835 |
01/18 |
$13,219 |
$13,309 |
$13,335 |
02/18 |
$12,925 |
$12,819 |
$12,956 |
03/18 |
$13,079 |
$12,561 |
$13,130 |
04/18 |
$12,939 |
$12,609 |
$13,143 |
05/18 |
$13,715 |
$12,965 |
$13,970 |
06/18 |
$13,883 |
$13,050 |
$14,080 |
07/18 |
$14,002 |
$13,483 |
$14,322 |
08/18 |
$15,422 |
$13,956 |
$15,213 |
09/18 |
$15,436 |
$13,979 |
$14,857 |
10/18 |
$13,456 |
$12,950 |
$12,977 |
11/18 |
$13,939 |
$13,209 |
$13,180 |
12/18 |
$12,439 |
$11,980 |
$11,640 |
01/19 |
$14,343 |
$13,008 |
$12,985 |
02/19 |
$15,253 |
$13,466 |
$13,823 |
03/19 |
$15,237 |
$13,662 |
$13,636 |
04/19 |
$15,751 |
$14,208 |
$14,051 |
05/19 |
$15,161 |
$13,289 |
$13,009 |
06/19 |
$16,602 |
$14,222 |
$14,011 |
07/19 |
$16,922 |
$14,433 |
$14,148 |
08/19 |
$16,619 |
$14,139 |
$13,537 |
09/19 |
$15,928 |
$14,387 |
$13,426 |
10/19 |
$16,164 |
$14,697 |
$13,808 |
11/19 |
$17,428 |
$15,256 |
$14,621 |
12/19 |
$17,491 |
$15,696 |
$14,956 |
01/20 |
$17,860 |
$15,679 |
$14,791 |
02/20 |
$17,150 |
$14,395 |
$13,723 |
03/20 |
$14,207 |
$12,416 |
$11,103 |
04/20 |
$17,168 |
$14,060 |
$12,756 |
05/20 |
$19,604 |
$14,812 |
$13,962 |
06/20 |
$20,960 |
$15,151 |
$14,498 |
07/20 |
$22,178 |
$16,011 |
$14,996 |
08/20 |
$23,109 |
$17,171 |
$15,876 |
09/20 |
$23,192 |
$16,546 |
$15,536 |
10/20 |
$23,414 |
$16,188 |
$15,654 |
11/20 |
$27,445 |
$18,158 |
$18,414 |
12/20 |
$29,697 |
$18,975 |
$20,135 |
01/21 |
$31,197 |
$18,890 |
$21,106 |
02/21 |
$32,489 |
$19,481 |
$21,803 |
03/21 |
$30,363 |
$20,179 |
$21,117 |
04/21 |
$31,446 |
$21,219 |
$21,578 |
05/21 |
$30,392 |
$21,316 |
$20,961 |
06/21 |
$32,102 |
$21,842 |
$21,944 |
07/21 |
$31,655 |
$22,211 |
$21,145 |
08/21 |
$32,499 |
$22,845 |
$21,529 |
09/21 |
$31,028 |
$21,820 |
$20,704 |
10/21 |
$32,132 |
$23,295 |
$21,673 |
11/21 |
$28,862 |
$22,941 |
$20,615 |
12/21 |
$28,828 |
$23,844 |
$20,706 |
01/22 |
$24,055 |
$22,441 |
$17,931 |
02/22 |
$24,099 |
$21,876 |
$18,009 |
03/22 |
$23,713 |
$22,585 |
$18,092 |
04/22 |
$20,174 |
$20,558 |
$15,872 |
05/22 |
$19,149 |
$20,531 |
$15,572 |
06/22 |
$17,418 |
$18,813 |
$14,608 |
07/22 |
$19,777 |
$20,578 |
$16,244 |
08/22 |
$19,469 |
$19,810 |
$16,091 |
09/22 |
$17,650 |
$17,973 |
$14,644 |
10/22 |
$18,697 |
$19,447 |
$16,033 |
11/22 |
$19,469 |
$20,462 |
$16,295 |
12/22 |
$18,223 |
$19,264 |
$15,249 |
01/23 |
$20,207 |
$20,591 |
$16,765 |
02/23 |
$19,777 |
$20,110 |
$16,584 |
03/23 |
$20,185 |
$20,647 |
$16,175 |
04/23 |
$20,097 |
$20,867 |
$15,987 |
05/23 |
$20,196 |
$20,949 |
$15,990 |
06/23 |
$22,004 |
$22,379 |
$17,315 |
07/23 |
$22,677 |
$23,181 |
$18,125 |
08/23 |
$22,633 |
$22,734 |
$17,181 |
09/23 |
$20,858 |
$21,651 |
$16,048 |
10/23 |
$19,546 |
$21,077 |
$14,810 |
11/23 |
$20,758 |
$23,042 |
$16,159 |
12/23 |
$22,941 |
$24,265 |
$18,094 |
01/24 |
$22,522 |
$24,534 |
$17,514 |
02/24 |
$25,036 |
$25,862 |
$18,936 |
03/24 |
$26,017 |
$26,696 |
$19,466 |
04/24 |
$24,319 |
$25,521 |
$17,967 |
05/24 |
$25,521 |
$26,727 |
$18,929 |
06/24 |
$25,201 |
$27,554 |
$18,897 |
07/24 |
$26,612 |
$28,066 |
$20,444 |
08/24 |
$26,778 |
$28,677 |
$20,218 |
09/24 |
$27,373 |
$29,271 |
$20,487 |
10/24 |
$27,494 |
$29,056 |
$20,215 |
11/24 |
$30,581 |
$30,989 |
$22,693 |
12/24 |
$28,431 |
$30,041 |
$20,836 |
01/25 |
$29,622 |
$30,990 |
$21,494 |
02/25 |
$27,373 |
$30,396 |
$20,039 |
03/25 |
$24,915 |
$28,623 |
$18,520 |
04/25 |
$24,595 |
$28,431 |
$18,401 |
05/25 |
$26,667 |
$30,233 |
$19,582 |
06/25 |
$29,016 |
$31,769 |
$20,736 |
07/25 |
$30,041 |
$32,469 |
$21,089 |
08/25 |
$32,036 |
$33,220 |
$22,336 |
09/25 |
$33,106 |
$34,366 |
$23,264 |
10/25 |
$34,682 |
$35,103 |
$24,017 |
11/25 |
$35,487 |
$35,199 |
$23,853 |
12/25 |
$34,517 |
$35,192 |
$23,547 |
01/26 |
$36,440 |
$35,738 |
$24,483 |
02/26 |
$36,347 |
$35,568 |
$24,424 |
03/26 |
$33,174 |
$33,800 |
$22,886 |
04/26 |
$38,988 |
$37,248 |
$26,248 |
05/26 |
$42,405 |
$39,135 |
$27,781 |
06/26 |
$44,930 |
$39,015 |
$28,769 |
07/26 |
$40,795 |
$38,833 |
$27,083 |
08/26 |
$40,807 |
$39,898 |
$27,528 |
|
| Average Annual Return [Table Text Block] |
Table Summary
Average Annual Total Returns (%) |
1 year |
5 years |
10 years |
Class A (excluding sales charges) |
27.38 |
4.66 |
15.78 |
Class A (including sales charges) |
20.06 |
3.43 |
15.10 |
Russell 3000® Index |
20.10 |
11.80 |
14.84 |
Russell 2000® Growth Index |
23.25 |
5.04 |
10.66 | |
| No Deduction of Taxes [Text Block] |
Performance does not reflect the deduction of taxes that a shareholder may pay on fund distributions or on the redemptions of fund shares.
|
| Updated Performance Information Location [Text Block] |
columbiathreadneedleus.com/investment-products/mutual-funds
|
| AssetsNet |
$ 3,523,383,703
|
| Holdings Count | Holding |
118
|
| Advisory Fees Paid, Amount |
$ 25,318,711
|
| InvestmentCompanyPortfolioTurnover |
180.00%
|
| Additional Fund Statistics [Text Block] |
Table Summary
Fund net assets |
$3,523,383,703 |
Total number of portfolio holdings |
118 |
Management services fees (represents 0.79% of Fund average net assets) |
$25,318,711 |
Portfolio turnover for the reporting period |
180% | |
| Holdings [Text Block] |
Table Summary
Health Care |
27.5% |
Information Technology |
21.6% |
Industrials |
18.1% |
Consumer Discretionary |
10.9% |
Communication Services |
5.7% |
Financials |
5.4% |
Energy |
4.8% |
Materials |
2.6% |
Consumer Staples |
1.4% |
Utilities |
0.2% |
Table Summary
Common Stocks |
98.2% |
Money Market Funds |
1.0% | |
| Largest Holdings [Text Block] |
Table Summary
Guardant Health, Inc. |
2.9% |
Brinker International, Inc. |
2.4% |
Sphere Entertainment Co. |
2.4% |
Charles River Laboratories International, Inc. |
2.3% |
ICON PLC |
2.2% |
DigitalOcean Holdings, Inc. |
2.2% |
Karman Holdings, Inc. |
2.2% |
Rush Street Interactive, Inc. |
2.1% |
InterDigital, Inc. |
2.1% |
Repligen Corp. |
2.0% | |
| Material Fund Change [Text Block] |
|
| C000032870 |
|
| Shareholder Report [Line Items] |
|
| Fund Name |
Columbia Small Cap Growth Fund
|
| Class Name |
Class C
|
| Trading Symbol |
CGOCX
|
| Annual or Semi-Annual Statement [Text Block] |
This annual shareholder report contains important information about Columbia Small Cap Growth Fund (the Fund) for the period of September 1, 2025 to August 31, 2026.
|
| Additional Information [Text Block] |
You can find additional information about the Fund at columbiathreadneedleus.com/resources/literature. You can also request more information by contacting us at 1-800-345-6611.
|
| Additional Information Phone Number |
1-800-345-6611
|
| Additional Information Website |
columbiathreadneedleus.com/resources/literature
|
| Expenses [Text Block] |
What were the Fund costs for the reporting period? (Based on a hypothetical $10,000 investment)
Table Summary
Class |
Cost of a $10,000 investment |
Cost paid as a percentage of a $10,000 investment |
Class C |
$218 |
1.93% | |
| Expenses Paid, Amount |
$ 218
|
| Expense Ratio, Percent |
1.93%
|
| Factors Affecting Performance [Text Block] |
Management's Discussion of Fund Performance The performance of Class C shares for the period presented is shown in the Average Annual Total Returns table. Top Performance ContributorsStock selection | Selections in the information technology and health care sectors boosted the Fund’s performance relative to the benchmark during the annual period. Allocation | An underweight allocation to the information technology sector contributed to relative performance. Individual holdings | Positions in Lumentum Holdings, an electrical products company, Hut 8, a data processing services company, and SiTime Corp, a semiconductor company, were among the top contributors to the Fund’s relative performance during the period. Top Performance DetractorsStock selection | Selections in the consumer discretionary and energy sectors hurt the Fund’s performance relative to the benchmark during the period. Allocation | An overweight allocation to the consumer discretionary sector detracted from relative performance. Individual holdings | Positions in Ollie’s Bargain Outlet Holdings, a department store company, Karman Holdings, an aerospace & defense company, and Modine Manufacturing, an industrial machinery company, were among the top detractors from relative performance during the period. |
| Performance Past Does Not Indicate Future [Text] |
The Fund's past performance is not a good predictor of the Fund's future performance.
|
| Line Graph [Table Text Block] |
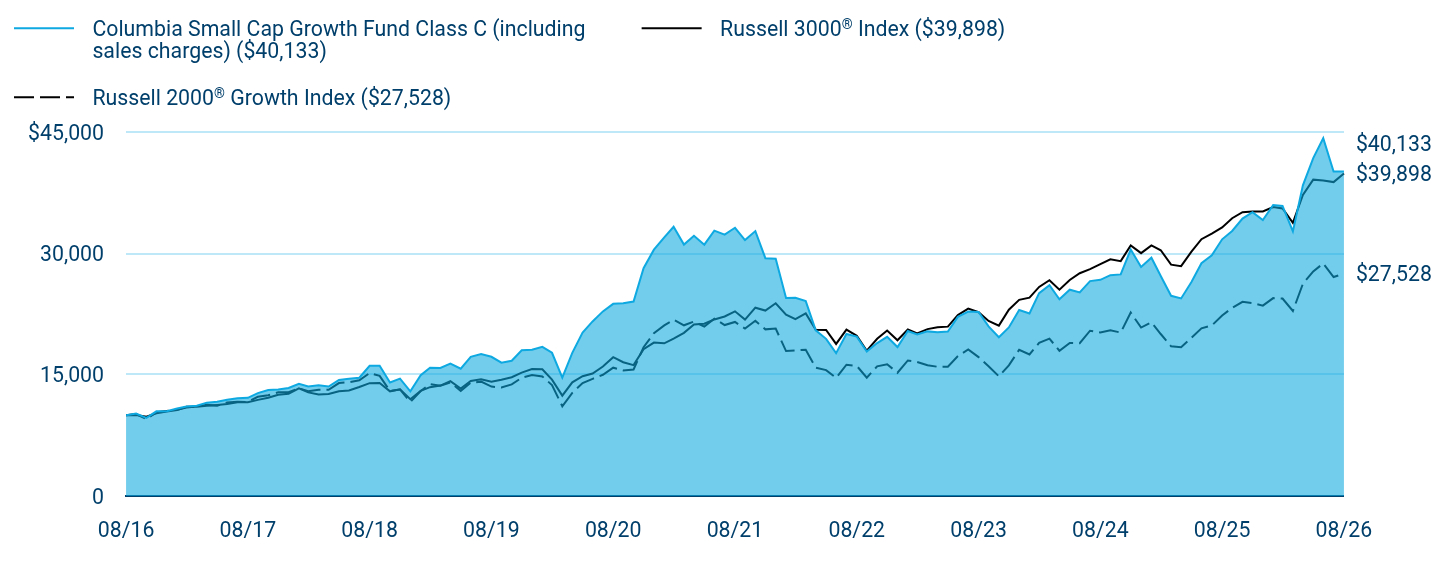
Table Summary
|
Columbia Small Cap Growth Fund Class C (including sales charges) ($40,133) |
Russell 3000® Index ($39,898) |
Russell 2000® Growth Index ($27,528) |
08/16 |
$10,000 |
$10,000 |
$10,000 |
09/16 |
$10,197 |
$10,016 |
$10,144 |
10/16 |
$9,668 |
$9,799 |
$9,514 |
11/16 |
$10,475 |
$10,238 |
$10,365 |
12/16 |
$10,491 |
$10,437 |
$10,506 |
01/17 |
$10,833 |
$10,634 |
$10,677 |
02/17 |
$11,078 |
$11,029 |
$10,939 |
03/17 |
$11,160 |
$11,037 |
$11,068 |
04/17 |
$11,546 |
$11,154 |
$11,272 |
05/17 |
$11,650 |
$11,268 |
$11,169 |
06/17 |
$11,896 |
$11,370 |
$11,554 |
07/17 |
$12,081 |
$11,584 |
$11,652 |
08/17 |
$12,148 |
$11,606 |
$11,639 |
09/17 |
$12,728 |
$11,889 |
$12,272 |
10/17 |
$13,107 |
$12,149 |
$12,462 |
11/17 |
$13,166 |
$12,518 |
$12,820 |
12/17 |
$13,366 |
$12,643 |
$12,835 |
01/18 |
$13,869 |
$13,309 |
$13,335 |
02/18 |
$13,546 |
$12,819 |
$12,956 |
03/18 |
$13,708 |
$12,561 |
$13,130 |
04/18 |
$13,546 |
$12,609 |
$13,143 |
05/18 |
$14,354 |
$12,965 |
$13,970 |
06/18 |
$14,516 |
$13,050 |
$14,080 |
07/18 |
$14,633 |
$13,483 |
$14,322 |
08/18 |
$16,106 |
$13,956 |
$15,213 |
09/18 |
$16,115 |
$13,979 |
$14,857 |
10/18 |
$14,040 |
$12,950 |
$12,977 |
11/18 |
$14,525 |
$13,209 |
$13,180 |
12/18 |
$12,957 |
$11,980 |
$11,640 |
01/19 |
$14,933 |
$13,008 |
$12,985 |
02/19 |
$15,876 |
$13,466 |
$13,823 |
03/19 |
$15,842 |
$13,662 |
$13,636 |
04/19 |
$16,370 |
$14,208 |
$14,051 |
05/19 |
$15,752 |
$13,289 |
$13,009 |
06/19 |
$17,223 |
$14,222 |
$14,011 |
07/19 |
$17,549 |
$14,433 |
$14,148 |
08/19 |
$17,223 |
$14,139 |
$13,537 |
09/19 |
$16,493 |
$14,387 |
$13,426 |
10/19 |
$16,729 |
$14,697 |
$13,808 |
11/19 |
$18,031 |
$15,256 |
$14,621 |
12/19 |
$18,083 |
$15,696 |
$14,956 |
01/20 |
$18,458 |
$15,679 |
$14,791 |
02/20 |
$17,720 |
$14,395 |
$13,723 |
03/20 |
$14,656 |
$12,416 |
$11,103 |
04/20 |
$17,707 |
$14,060 |
$12,756 |
05/20 |
$20,208 |
$14,812 |
$13,962 |
06/20 |
$21,597 |
$15,151 |
$14,498 |
07/20 |
$22,835 |
$16,011 |
$14,996 |
08/20 |
$23,772 |
$17,171 |
$15,876 |
09/20 |
$23,848 |
$16,546 |
$15,536 |
10/20 |
$24,060 |
$16,188 |
$15,654 |
11/20 |
$28,187 |
$18,158 |
$18,414 |
12/20 |
$30,470 |
$18,975 |
$20,135 |
01/21 |
$31,991 |
$18,890 |
$21,106 |
02/21 |
$33,306 |
$19,481 |
$21,803 |
03/21 |
$31,100 |
$20,179 |
$21,117 |
04/21 |
$32,183 |
$21,219 |
$21,578 |
05/21 |
$31,087 |
$21,316 |
$20,961 |
06/21 |
$32,827 |
$21,842 |
$21,944 |
07/21 |
$32,333 |
$22,211 |
$21,145 |
08/21 |
$33,183 |
$22,845 |
$21,529 |
09/21 |
$31,662 |
$21,820 |
$20,704 |
10/21 |
$32,772 |
$23,295 |
$21,673 |
11/21 |
$29,415 |
$22,941 |
$20,615 |
12/21 |
$29,356 |
$23,844 |
$20,706 |
01/22 |
$24,484 |
$22,441 |
$17,931 |
02/22 |
$24,515 |
$21,876 |
$18,009 |
03/22 |
$24,108 |
$22,585 |
$18,092 |
04/22 |
$20,489 |
$20,558 |
$15,872 |
05/22 |
$19,440 |
$20,531 |
$15,572 |
06/22 |
$17,670 |
$18,813 |
$14,608 |
07/22 |
$20,051 |
$20,578 |
$16,244 |
08/22 |
$19,722 |
$19,810 |
$16,091 |
09/22 |
$17,873 |
$17,973 |
$14,644 |
10/22 |
$18,923 |
$19,447 |
$16,033 |
11/22 |
$19,690 |
$20,462 |
$16,295 |
12/22 |
$18,422 |
$19,264 |
$15,249 |
01/23 |
$20,411 |
$20,591 |
$16,765 |
02/23 |
$19,972 |
$20,110 |
$16,584 |
03/23 |
$20,364 |
$20,647 |
$16,175 |
04/23 |
$20,270 |
$20,867 |
$15,987 |
05/23 |
$20,348 |
$20,949 |
$15,990 |
06/23 |
$22,165 |
$22,379 |
$17,315 |
07/23 |
$22,823 |
$23,181 |
$18,125 |
08/23 |
$22,761 |
$22,734 |
$17,181 |
09/23 |
$20,975 |
$21,651 |
$16,048 |
10/23 |
$19,643 |
$21,077 |
$14,810 |
11/23 |
$20,850 |
$23,042 |
$16,159 |
12/23 |
$23,011 |
$24,265 |
$18,094 |
01/24 |
$22,573 |
$24,534 |
$17,514 |
02/24 |
$25,095 |
$25,862 |
$18,936 |
03/24 |
$26,066 |
$26,696 |
$19,466 |
04/24 |
$24,343 |
$25,521 |
$17,967 |
05/24 |
$25,518 |
$26,727 |
$18,929 |
06/24 |
$25,189 |
$27,554 |
$18,897 |
07/24 |
$26,583 |
$28,066 |
$20,444 |
08/24 |
$26,740 |
$28,677 |
$20,218 |
09/24 |
$27,319 |
$29,271 |
$20,487 |
10/24 |
$27,413 |
$29,056 |
$20,215 |
11/24 |
$30,483 |
$30,989 |
$22,693 |
12/24 |
$28,322 |
$30,041 |
$20,836 |
01/25 |
$29,481 |
$30,990 |
$21,494 |
02/25 |
$27,225 |
$30,396 |
$20,039 |
03/25 |
$24,766 |
$28,623 |
$18,520 |
04/25 |
$24,437 |
$28,431 |
$18,401 |
05/25 |
$26,473 |
$30,233 |
$19,582 |
06/25 |
$28,792 |
$31,769 |
$20,736 |
07/25 |
$29,778 |
$32,469 |
$21,089 |
08/25 |
$31,752 |
$33,220 |
$22,336 |
09/25 |
$32,786 |
$34,366 |
$23,264 |
10/25 |
$34,321 |
$35,103 |
$24,017 |
11/25 |
$35,104 |
$35,199 |
$23,853 |
12/25 |
$34,129 |
$35,192 |
$23,547 |
01/26 |
$35,992 |
$35,738 |
$24,483 |
02/26 |
$35,875 |
$35,568 |
$24,424 |
03/26 |
$32,732 |
$33,800 |
$22,886 |
04/26 |
$38,437 |
$37,248 |
$26,248 |
05/26 |
$41,796 |
$39,135 |
$27,781 |
06/26 |
$44,258 |
$39,015 |
$28,769 |
07/26 |
$40,150 |
$38,833 |
$27,083 |
08/26 |
$40,133 |
$39,898 |
$27,528 |
|
| Average Annual Return [Table Text Block] |
Table Summary
Average Annual Total Returns (%) |
1 year |
5 years |
10 years |
Class C (excluding sales charges) |
26.39 |
3.88 |
14.91 |
Class C (including sales charges) |
25.39 |
3.88 |
14.91 |
Russell 3000® Index |
20.10 |
11.80 |
14.84 |
Russell 2000® Growth Index |
23.25 |
5.04 |
10.66 | |
| No Deduction of Taxes [Text Block] |
Performance does not reflect the deduction of taxes that a shareholder may pay on fund distributions or on the redemptions of fund shares.
|
| Updated Performance Information Location [Text Block] |
columbiathreadneedleus.com/investment-products/mutual-funds
|
| AssetsNet |
$ 3,523,383,703
|
| Holdings Count | Holding |
118
|
| Advisory Fees Paid, Amount |
$ 25,318,711
|
| InvestmentCompanyPortfolioTurnover |
180.00%
|
| Additional Fund Statistics [Text Block] |
Table Summary
Fund net assets |
$3,523,383,703 |
Total number of portfolio holdings |
118 |
Management services fees (represents 0.79% of Fund average net assets) |
$25,318,711 |
Portfolio turnover for the reporting period |
180% | |
| Holdings [Text Block] |
Table Summary
Health Care |
27.5% |
Information Technology |
21.6% |
Industrials |
18.1% |
Consumer Discretionary |
10.9% |
Communication Services |
5.7% |
Financials |
5.4% |
Energy |
4.8% |
Materials |
2.6% |
Consumer Staples |
1.4% |
Utilities |
0.2% |
Table Summary
Common Stocks |
98.2% |
Money Market Funds |
1.0% | |
| Largest Holdings [Text Block] |
Table Summary
Guardant Health, Inc. |
2.9% |
Brinker International, Inc. |
2.4% |
Sphere Entertainment Co. |
2.4% |
Charles River Laboratories International, Inc. |
2.3% |
ICON PLC |
2.2% |
DigitalOcean Holdings, Inc. |
2.2% |
Karman Holdings, Inc. |
2.2% |
Rush Street Interactive, Inc. |
2.1% |
InterDigital, Inc. |
2.1% |
Repligen Corp. |
2.0% | |
| Material Fund Change [Text Block] |
|
| C000032871 |
|
| Shareholder Report [Line Items] |
|
| Fund Name |
Columbia Small Cap Growth Fund
|
| Class Name |
Institutional Class
|
| Trading Symbol |
CMSCX
|
| Annual or Semi-Annual Statement [Text Block] |
This annual shareholder report contains important information about Columbia Small Cap Growth Fund (the Fund) for the period of September 1, 2025 to August 31, 2026.
|
| Additional Information [Text Block] |
You can find additional information about the Fund at columbiathreadneedleus.com/resources/literature. You can also request more information by contacting us at 1-800-345-6611.
|
| Additional Information Phone Number |
1-800-345-6611
|
| Additional Information Website |
columbiathreadneedleus.com/resources/literature
|
| Expenses [Text Block] |
What were the Fund costs for the reporting period? (Based on a hypothetical $10,000 investment)
Table Summary
Class |
Cost of a $10,000 investment |
Cost paid as a percentage of a $10,000 investment |
Institutional Class |
$106 |
0.93% | |
| Expenses Paid, Amount |
$ 106
|
| Expense Ratio, Percent |
0.93%
|
| Factors Affecting Performance [Text Block] |
Management's Discussion of Fund Performance The performance of Institutional Class shares for the period presented is shown in the Average Annual Total Returns table. Top Performance ContributorsStock selection | Selections in the information technology and health care sectors boosted the Fund’s performance relative to the benchmark during the annual period. Allocation | An underweight allocation to the information technology sector contributed to relative performance. Individual holdings | Positions in Lumentum Holdings, an electrical products company, Hut 8, a data processing services company, and SiTime Corp, a semiconductor company, were among the top contributors to the Fund’s relative performance during the period. Top Performance DetractorsStock selection | Selections in the consumer discretionary and energy sectors hurt the Fund’s performance relative to the benchmark during the period. Allocation | An overweight allocation to the consumer discretionary sector detracted from relative performance. Individual holdings | Positions in Ollie’s Bargain Outlet Holdings, a department store company, Karman Holdings, an aerospace & defense company, and Modine Manufacturing, an industrial machinery company, were among the top detractors from relative performance during the period. |
| Performance Past Does Not Indicate Future [Text] |
The Fund's past performance is not a good predictor of the Fund's future performance.
|
| Line Graph [Table Text Block] |
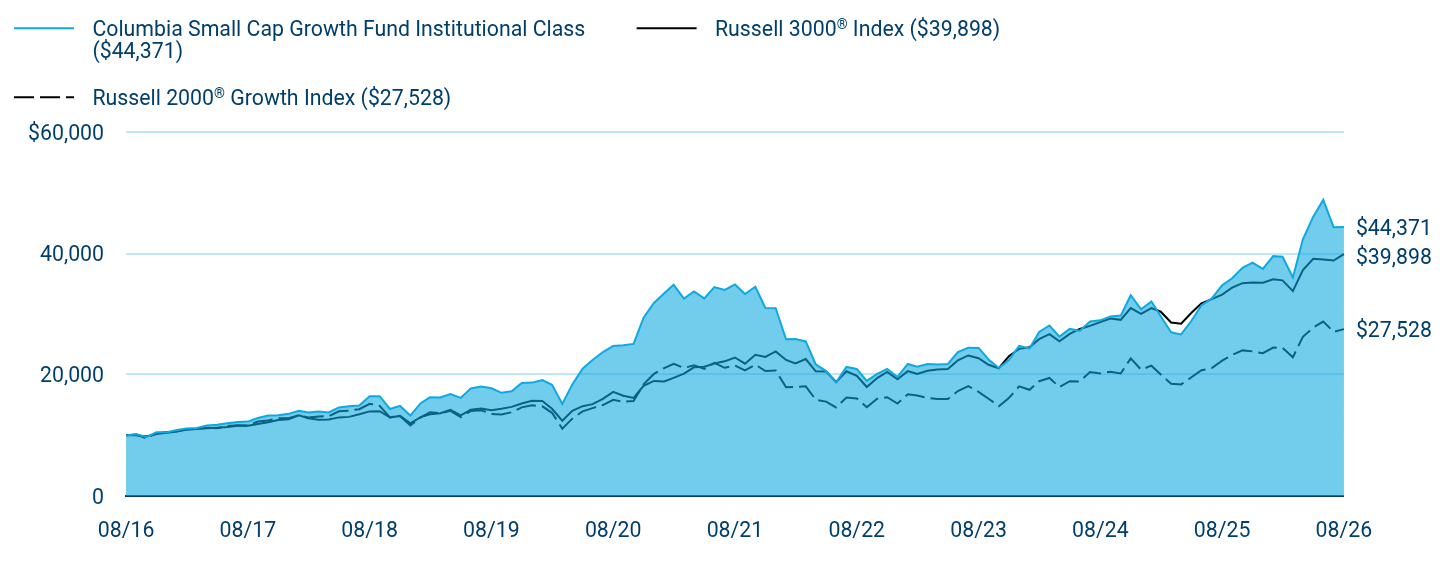
Table Summary
|
Columbia Small Cap Growth Fund Institutional Class ($44,371) |
Russell 3000® Index ($39,898) |
Russell 2000® Growth Index ($27,528) |
08/16 |
$10,000 |
$10,000 |
$10,000 |
09/16 |
$10,204 |
$10,016 |
$10,144 |
10/16 |
$9,691 |
$9,799 |
$9,514 |
11/16 |
$10,502 |
$10,238 |
$10,365 |
12/16 |
$10,523 |
$10,437 |
$10,506 |
01/17 |
$10,882 |
$10,634 |
$10,677 |
02/17 |
$11,140 |
$11,029 |
$10,939 |
03/17 |
$11,223 |
$11,037 |
$11,068 |
04/17 |
$11,625 |
$11,154 |
$11,272 |
05/17 |
$11,744 |
$11,268 |
$11,169 |
06/17 |
$11,996 |
$11,370 |
$11,554 |
07/17 |
$12,194 |
$11,584 |
$11,652 |
08/17 |
$12,272 |
$11,606 |
$11,639 |
09/17 |
$12,870 |
$11,889 |
$12,272 |
10/17 |
$13,266 |
$12,149 |
$12,462 |
11/17 |
$13,332 |
$12,518 |
$12,820 |
12/17 |
$13,549 |
$12,643 |
$12,835 |
01/18 |
$14,068 |
$13,309 |
$13,335 |
02/18 |
$13,760 |
$12,819 |
$12,956 |
03/18 |
$13,921 |
$12,561 |
$13,130 |
04/18 |
$13,774 |
$12,609 |
$13,143 |
05/18 |
$14,609 |
$12,965 |
$13,970 |
06/18 |
$14,791 |
$13,050 |
$14,080 |
07/18 |
$14,918 |
$13,483 |
$14,322 |
08/18 |
$16,433 |
$13,956 |
$15,213 |
09/18 |
$16,454 |
$13,979 |
$14,857 |
10/18 |
$14,349 |
$12,950 |
$12,977 |
11/18 |
$14,861 |
$13,209 |
$13,180 |
12/18 |
$13,271 |
$11,980 |
$11,640 |
01/19 |
$15,307 |
$13,008 |
$12,985 |
02/19 |
$16,279 |
$13,466 |
$13,823 |
03/19 |
$16,262 |
$13,662 |
$13,636 |
04/19 |
$16,815 |
$14,208 |
$14,051 |
05/19 |
$16,186 |
$13,289 |
$13,009 |
06/19 |
$17,728 |
$14,222 |
$14,011 |
07/19 |
$18,072 |
$14,433 |
$14,148 |
08/19 |
$17,762 |
$14,139 |
$13,537 |
09/19 |
$17,016 |
$14,387 |
$13,426 |
10/19 |
$17,276 |
$14,697 |
$13,808 |
11/19 |
$18,633 |
$15,256 |
$14,621 |
12/19 |
$18,704 |
$15,696 |
$14,956 |
01/20 |
$19,106 |
$15,679 |
$14,791 |
02/20 |
$18,348 |
$14,395 |
$13,723 |
03/20 |
$15,197 |
$12,416 |
$11,103 |
04/20 |
$18,376 |
$14,060 |
$12,756 |
05/20 |
$20,988 |
$14,812 |
$13,962 |
06/20 |
$22,440 |
$15,151 |
$14,498 |
07/20 |
$23,746 |
$16,011 |
$14,996 |
08/20 |
$24,750 |
$17,171 |
$15,876 |
09/20 |
$24,851 |
$16,546 |
$15,536 |
10/20 |
$25,088 |
$16,188 |
$15,654 |
11/20 |
$29,417 |
$18,158 |
$18,414 |
12/20 |
$31,831 |
$18,975 |
$20,135 |
01/21 |
$33,448 |
$18,890 |
$21,106 |
02/21 |
$34,839 |
$19,481 |
$21,803 |
03/21 |
$32,575 |
$20,179 |
$21,117 |
04/21 |
$33,732 |
$21,219 |
$21,578 |
05/21 |
$32,605 |
$21,316 |
$20,961 |
06/21 |
$34,457 |
$21,842 |
$21,944 |
07/21 |
$33,977 |
$22,211 |
$21,145 |
08/21 |
$34,898 |
$22,845 |
$21,529 |
09/21 |
$33,320 |
$21,820 |
$20,704 |
10/21 |
$34,516 |
$23,295 |
$21,673 |
11/21 |
$31,007 |
$22,941 |
$20,615 |
12/21 |
$30,980 |
$23,844 |
$20,706 |
01/22 |
$25,853 |
$22,441 |
$17,931 |
02/22 |
$25,907 |
$21,876 |
$18,009 |
03/22 |
$25,497 |
$22,585 |
$18,092 |
04/22 |
$21,697 |
$20,558 |
$15,872 |
05/22 |
$20,596 |
$20,531 |
$15,572 |
06/22 |
$18,739 |
$18,813 |
$14,608 |
07/22 |
$21,287 |
$20,578 |
$16,244 |
08/22 |
$20,952 |
$19,810 |
$16,091 |
09/22 |
$18,998 |
$17,973 |
$14,644 |
10/22 |
$20,142 |
$19,447 |
$16,033 |
11/22 |
$20,974 |
$20,462 |
$16,295 |
12/22 |
$19,635 |
$19,264 |
$15,249 |
01/23 |
$21,772 |
$20,591 |
$16,765 |
02/23 |
$21,308 |
$20,110 |
$16,584 |
03/23 |
$21,762 |
$20,647 |
$16,175 |
04/23 |
$21,675 |
$20,867 |
$15,987 |
05/23 |
$21,783 |
$20,949 |
$15,990 |
06/23 |
$23,737 |
$22,379 |
$17,315 |
07/23 |
$24,460 |
$23,181 |
$18,125 |
08/23 |
$24,417 |
$22,734 |
$17,181 |
09/23 |
$22,517 |
$21,651 |
$16,048 |
10/23 |
$21,103 |
$21,077 |
$14,810 |
11/23 |
$22,420 |
$23,042 |
$16,159 |
12/23 |
$24,773 |
$24,265 |
$18,094 |
01/24 |
$24,331 |
$24,534 |
$17,514 |
02/24 |
$27,051 |
$25,862 |
$18,936 |
03/24 |
$28,120 |
$26,696 |
$19,466 |
04/24 |
$26,285 |
$25,521 |
$17,967 |
05/24 |
$27,591 |
$26,727 |
$18,929 |
06/24 |
$27,245 |
$27,554 |
$18,897 |
07/24 |
$28,778 |
$28,066 |
$20,444 |
08/24 |
$28,972 |
$28,677 |
$20,218 |
09/24 |
$29,620 |
$29,271 |
$20,487 |
10/24 |
$29,760 |
$29,056 |
$20,215 |
11/24 |
$33,107 |
$30,989 |
$22,693 |
12/24 |
$30,786 |
$30,041 |
$20,836 |
01/25 |
$32,070 |
$30,990 |
$21,494 |
02/25 |
$29,652 |
$30,396 |
$20,039 |
03/25 |
$26,997 |
$28,623 |
$18,520 |
04/25 |
$26,652 |
$28,431 |
$18,401 |
05/25 |
$28,908 |
$30,233 |
$19,582 |
06/25 |
$31,455 |
$31,769 |
$20,736 |
07/25 |
$32,578 |
$32,469 |
$21,089 |
08/25 |
$34,747 |
$33,220 |
$22,336 |
09/25 |
$35,913 |
$34,366 |
$23,264 |
10/25 |
$37,629 |
$35,103 |
$24,017 |
11/25 |
$38,504 |
$35,199 |
$23,853 |
12/25 |
$37,470 |
$35,192 |
$23,547 |
01/26 |
$39,563 |
$35,738 |
$24,483 |
02/26 |
$39,461 |
$35,568 |
$24,424 |
03/26 |
$36,033 |
$33,800 |
$22,886 |
04/26 |
$42,346 |
$37,248 |
$26,248 |
05/26 |
$46,079 |
$39,135 |
$27,781 |
06/26 |
$48,839 |
$39,015 |
$28,769 |
07/26 |
$44,348 |
$38,833 |
$27,083 |
08/26 |
$44,371 |
$39,898 |
$27,528 |
|
| Average Annual Return [Table Text Block] |
Table Summary
Average Annual Total Returns (%) |
1 year |
5 years |
10 years |
Institutional Class |
27.69 |
4.92 |
16.07 |
Russell 3000® Index |
20.10 |
11.80 |
14.84 |
Russell 2000® Growth Index |
23.25 |
5.04 |
10.66 | |
| No Deduction of Taxes [Text Block] |
Performance does not reflect the deduction of taxes that a shareholder may pay on fund distributions or on the redemptions of fund shares.
|
| Updated Performance Information Location [Text Block] |
columbiathreadneedleus.com/investment-products/mutual-funds
|
| AssetsNet |
$ 3,523,383,703
|
| Holdings Count | Holding |
118
|
| Advisory Fees Paid, Amount |
$ 25,318,711
|
| InvestmentCompanyPortfolioTurnover |
180.00%
|
| Additional Fund Statistics [Text Block] |
Table Summary
Fund net assets |
$3,523,383,703 |
Total number of portfolio holdings |
118 |
Management services fees (represents 0.79% of Fund average net assets) |
$25,318,711 |
Portfolio turnover for the reporting period |
180% | |
| Holdings [Text Block] |
Table Summary
Health Care |
27.5% |
Information Technology |
21.6% |
Industrials |
18.1% |
Consumer Discretionary |
10.9% |
Communication Services |
5.7% |
Financials |
5.4% |
Energy |
4.8% |
Materials |
2.6% |
Consumer Staples |
1.4% |
Utilities |
0.2% |
Table Summary
Common Stocks |
98.2% |
Money Market Funds |
1.0% | |
| Largest Holdings [Text Block] |
Table Summary
Guardant Health, Inc. |
2.9% |
Brinker International, Inc. |
2.4% |
Sphere Entertainment Co. |
2.4% |
Charles River Laboratories International, Inc. |
2.3% |
ICON PLC |
2.2% |
DigitalOcean Holdings, Inc. |
2.2% |
Karman Holdings, Inc. |
2.2% |
Rush Street Interactive, Inc. |
2.1% |
InterDigital, Inc. |
2.1% |
Repligen Corp. |
2.0% | |
| Material Fund Change [Text Block] |
|
| C000121792 |
|
| Shareholder Report [Line Items] |
|
| Fund Name |
Columbia Small Cap Growth Fund
|
| Class Name |
Institutional 2 Class
|
| Trading Symbol |
CSCRX
|
| Annual or Semi-Annual Statement [Text Block] |
This annual shareholder report contains important information about Columbia Small Cap Growth Fund (the Fund) for the period of September 1, 2025 to August 31, 2026.
|
| Additional Information [Text Block] |
You can find additional information about the Fund at columbiathreadneedleus.com/resources/literature. You can also request more information by contacting us at 1-800-345-6611.
|
| Additional Information Phone Number |
1-800-345-6611
|
| Additional Information Website |
columbiathreadneedleus.com/resources/literature
|
| Expenses [Text Block] |
What were the Fund costs for the reporting period? (Based on a hypothetical $10,000 investment)
Table Summary
Class |
Cost of a $10,000 investment |
Cost paid as a percentage of a $10,000 investment |
Institutional 2 Class |
$99 |
0.87% | |
| Expenses Paid, Amount |
$ 99
|
| Expense Ratio, Percent |
0.87%
|
| Factors Affecting Performance [Text Block] |
Management's Discussion of Fund Performance The performance of Institutional 2 Class shares for the period presented is shown in the Average Annual Total Returns table. Top Performance ContributorsStock selection | Selections in the information technology and health care sectors boosted the Fund’s performance relative to the benchmark during the annual period. Allocation | An underweight allocation to the information technology sector contributed to relative performance. Individual holdings | Positions in Lumentum Holdings, an electrical products company, Hut 8, a data processing services company, and SiTime Corp, a semiconductor company, were among the top contributors to the Fund’s relative performance during the period. Top Performance DetractorsStock selection | Selections in the consumer discretionary and energy sectors hurt the Fund’s performance relative to the benchmark during the period. Allocation | An overweight allocation to the consumer discretionary sector detracted from relative performance. Individual holdings | Positions in Ollie’s Bargain Outlet Holdings, a department store company, Karman Holdings, an aerospace & defense company, and Modine Manufacturing, an industrial machinery company, were among the top detractors from relative performance during the period. |
| Performance Past Does Not Indicate Future [Text] |
The Fund's past performance is not a good predictor of the Fund's future performance.
|
| Line Graph [Table Text Block] |
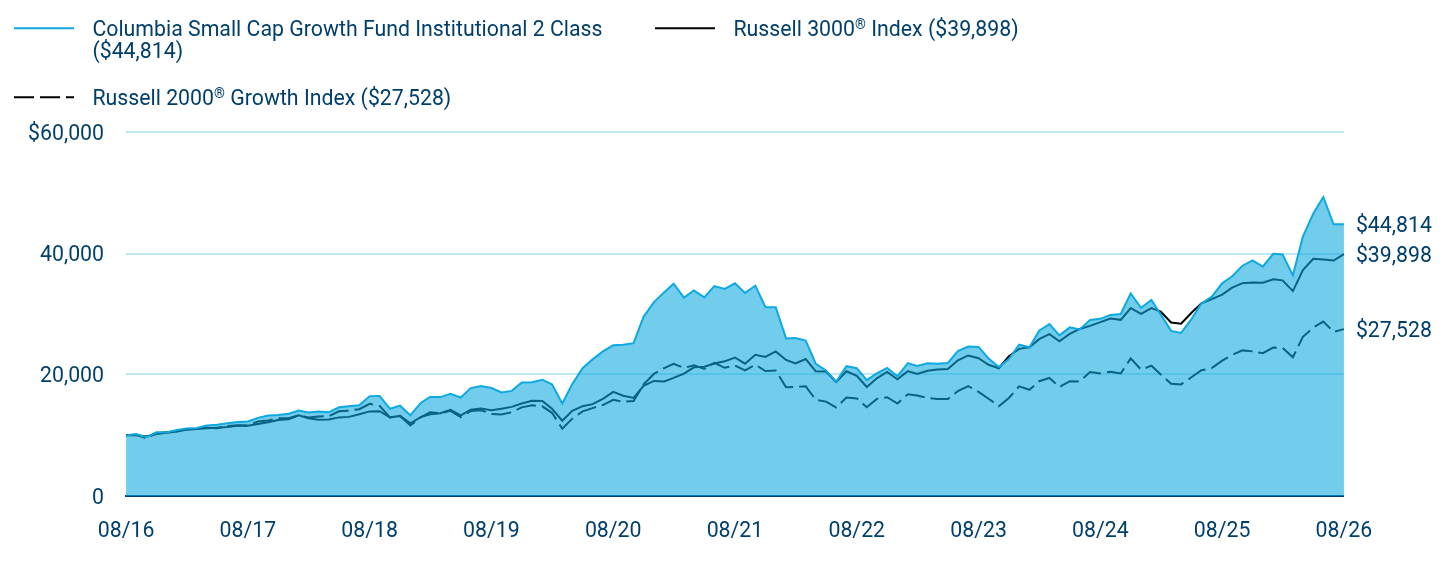
Table Summary
|
Columbia Small Cap Growth Fund Institutional 2 Class ($44,814) |
Russell 3000® Index ($39,898) |
Russell 2000® Growth Index ($27,528) |
08/16 |
$10,000 |
$10,000 |
$10,000 |
09/16 |
$10,208 |
$10,016 |
$10,144 |
10/16 |
$9,694 |
$9,799 |
$9,514 |
11/16 |
$10,509 |
$10,238 |
$10,365 |
12/16 |
$10,528 |
$10,437 |
$10,506 |
01/17 |
$10,885 |
$10,634 |
$10,677 |
02/17 |
$11,146 |
$11,029 |
$10,939 |
03/17 |
$11,235 |
$11,037 |
$11,068 |
04/17 |
$11,633 |
$11,154 |
$11,272 |
05/17 |
$11,752 |
$11,268 |
$11,169 |
06/17 |
$12,008 |
$11,370 |
$11,554 |
07/17 |
$12,204 |
$11,584 |
$11,652 |
08/17 |
$12,287 |
$11,606 |
$11,639 |
09/17 |
$12,887 |
$11,889 |
$12,272 |
10/17 |
$13,279 |
$12,149 |
$12,462 |
11/17 |
$13,351 |
$12,518 |
$12,820 |
12/17 |
$13,573 |
$12,643 |
$12,835 |
01/18 |
$14,095 |
$13,309 |
$13,335 |
02/18 |
$13,781 |
$12,819 |
$12,956 |
03/18 |
$13,948 |
$12,561 |
$13,130 |
04/18 |
$13,802 |
$12,609 |
$13,143 |
05/18 |
$14,637 |
$12,965 |
$13,970 |
06/18 |
$14,818 |
$13,050 |
$14,080 |
07/18 |
$14,950 |
$13,483 |
$14,322 |
08/18 |
$16,474 |
$13,956 |
$15,213 |
09/18 |
$16,495 |
$13,979 |
$14,857 |
10/18 |
$14,387 |
$12,950 |
$12,977 |
11/18 |
$14,902 |
$13,209 |
$13,180 |
12/18 |
$13,304 |
$11,980 |
$11,640 |
01/19 |
$15,345 |
$13,008 |
$12,985 |
02/19 |
$16,333 |
$13,466 |
$13,823 |
03/19 |
$16,316 |
$13,662 |
$13,636 |
04/19 |
$16,873 |
$14,208 |
$14,051 |
05/19 |
$16,250 |
$13,289 |
$13,009 |
06/19 |
$17,794 |
$14,222 |
$14,011 |
07/19 |
$18,142 |
$14,433 |
$14,148 |
08/19 |
$17,819 |
$14,139 |
$13,537 |
09/19 |
$17,080 |
$14,387 |
$13,426 |
10/19 |
$17,337 |
$14,697 |
$13,808 |
11/19 |
$18,707 |
$15,256 |
$14,621 |
12/19 |
$18,772 |
$15,696 |
$14,956 |
01/20 |
$19,179 |
$15,679 |
$14,791 |
02/20 |
$18,419 |
$14,395 |
$13,723 |
03/20 |
$15,255 |
$12,416 |
$11,103 |
04/20 |
$18,456 |
$14,060 |
$12,756 |
05/20 |
$21,069 |
$14,812 |
$13,962 |
06/20 |
$22,534 |
$15,151 |
$14,498 |
07/20 |
$23,854 |
$16,011 |
$14,996 |
08/20 |
$24,858 |
$17,171 |
$15,876 |
09/20 |
$24,957 |
$16,546 |
$15,536 |
10/20 |
$25,201 |
$16,188 |
$15,654 |
11/20 |
$29,551 |
$18,158 |
$18,414 |
12/20 |
$31,983 |
$18,975 |
$20,135 |
01/21 |
$33,602 |
$18,890 |
$21,106 |
02/21 |
$35,008 |
$19,481 |
$21,803 |
03/21 |
$32,729 |
$20,179 |
$21,117 |
04/21 |
$33,893 |
$21,219 |
$21,578 |
05/21 |
$32,768 |
$21,316 |
$20,961 |
06/21 |
$34,630 |
$21,842 |
$21,944 |
07/21 |
$34,145 |
$22,211 |
$21,145 |
08/21 |
$35,076 |
$22,845 |
$21,529 |
09/21 |
$33,496 |
$21,820 |
$20,704 |
10/21 |
$34,688 |
$23,295 |
$21,673 |
11/21 |
$31,168 |
$22,941 |
$20,615 |
12/21 |
$31,148 |
$23,844 |
$20,706 |
01/22 |
$25,994 |
$22,441 |
$17,931 |
02/22 |
$26,048 |
$21,876 |
$18,009 |
03/22 |
$25,642 |
$22,585 |
$18,092 |
04/22 |
$21,811 |
$20,558 |
$15,872 |
05/22 |
$20,712 |
$20,531 |
$15,572 |
06/22 |
$18,855 |
$18,813 |
$14,608 |
07/22 |
$21,406 |
$20,578 |
$16,244 |
08/22 |
$21,086 |
$19,810 |
$16,091 |
09/22 |
$19,122 |
$17,973 |
$14,644 |
10/22 |
$20,264 |
$19,447 |
$16,033 |
11/22 |
$21,107 |
$20,462 |
$16,295 |
12/22 |
$19,762 |
$19,264 |
$15,249 |
01/23 |
$21,929 |
$20,591 |
$16,765 |
02/23 |
$21,459 |
$20,110 |
$16,584 |
03/23 |
$21,907 |
$20,647 |
$16,175 |
04/23 |
$21,822 |
$20,867 |
$15,987 |
05/23 |
$21,939 |
$20,949 |
$15,990 |
06/23 |
$23,913 |
$22,379 |
$17,315 |
07/23 |
$24,639 |
$23,181 |
$18,125 |
08/23 |
$24,596 |
$22,734 |
$17,181 |
09/23 |
$22,686 |
$21,651 |
$16,048 |
10/23 |
$21,267 |
$21,077 |
$14,810 |
11/23 |
$22,590 |
$23,042 |
$16,159 |
12/23 |
$24,959 |
$24,265 |
$18,094 |
01/24 |
$24,522 |
$24,534 |
$17,514 |
02/24 |
$27,275 |
$25,862 |
$18,936 |
03/24 |
$28,342 |
$26,696 |
$19,466 |
04/24 |
$26,506 |
$25,521 |
$17,967 |
05/24 |
$27,819 |
$26,727 |
$18,929 |
06/24 |
$27,478 |
$27,554 |
$18,897 |
07/24 |
$29,025 |
$28,066 |
$20,444 |
08/24 |
$29,217 |
$28,677 |
$20,218 |
09/24 |
$29,868 |
$29,271 |
$20,487 |
10/24 |
$30,017 |
$29,056 |
$20,215 |
11/24 |
$33,400 |
$30,989 |
$22,693 |
12/24 |
$31,052 |
$30,041 |
$20,836 |
01/25 |
$32,354 |
$30,990 |
$21,494 |
02/25 |
$29,921 |
$30,396 |
$20,039 |
03/25 |
$27,232 |
$28,623 |
$18,520 |
04/25 |
$26,901 |
$28,431 |
$18,401 |
05/25 |
$29,174 |
$30,233 |
$19,582 |
06/25 |
$31,746 |
$31,769 |
$20,736 |
07/25 |
$32,877 |
$32,469 |
$21,089 |
08/25 |
$35,075 |
$33,220 |
$22,336 |
09/25 |
$36,249 |
$34,366 |
$23,264 |
10/25 |
$37,988 |
$35,103 |
$24,017 |
11/25 |
$38,874 |
$35,199 |
$23,853 |
12/25 |
$37,837 |
$35,192 |
$23,547 |
01/26 |
$39,950 |
$35,738 |
$24,483 |
02/26 |
$39,850 |
$35,568 |
$24,424 |
03/26 |
$36,395 |
$33,800 |
$22,886 |
04/26 |
$42,768 |
$37,248 |
$26,248 |
05/26 |
$46,547 |
$39,135 |
$27,781 |
06/26 |
$49,320 |
$39,015 |
$28,769 |
07/26 |
$44,803 |
$38,833 |
$27,083 |
08/26 |
$44,814 |
$39,898 |
$27,528 |
|
| Average Annual Return [Table Text Block] |
Table Summary
Average Annual Total Returns (%) |
1 year |
5 years |
10 years |
Institutional 2 Class |
27.77 |
5.02 |
16.18 |
Russell 3000® Index |
20.10 |
11.80 |
14.84 |
Russell 2000® Growth Index |
23.25 |
5.04 |
10.66 | |
| No Deduction of Taxes [Text Block] |
Performance does not reflect the deduction of taxes that a shareholder may pay on fund distributions or on the redemptions of fund shares.
|
| Updated Performance Information Location [Text Block] |
columbiathreadneedleus.com/investment-products/mutual-funds
|
| AssetsNet |
$ 3,523,383,703
|
| Holdings Count | Holding |
118
|
| Advisory Fees Paid, Amount |
$ 25,318,711
|
| InvestmentCompanyPortfolioTurnover |
180.00%
|
| Additional Fund Statistics [Text Block] |
Table Summary
Fund net assets |
$3,523,383,703 |
Total number of portfolio holdings |
118 |
Management services fees (represents 0.79% of Fund average net assets) |
$25,318,711 |
Portfolio turnover for the reporting period |
180% | |
| Holdings [Text Block] |
Table Summary
Health Care |
27.5% |
Information Technology |
21.6% |
Industrials |
18.1% |
Consumer Discretionary |
10.9% |
Communication Services |
5.7% |
Financials |
5.4% |
Energy |
4.8% |
Materials |
2.6% |
Consumer Staples |
1.4% |
Utilities |
0.2% |
Table Summary
Common Stocks |
98.2% |
Money Market Funds |
1.0% | |
| Largest Holdings [Text Block] |
Table Summary
Guardant Health, Inc. |
2.9% |
Brinker International, Inc. |
2.4% |
Sphere Entertainment Co. |
2.4% |
Charles River Laboratories International, Inc. |
2.3% |
ICON PLC |
2.2% |
DigitalOcean Holdings, Inc. |
2.2% |
Karman Holdings, Inc. |
2.2% |
Rush Street Interactive, Inc. |
2.1% |
InterDigital, Inc. |
2.1% |
Repligen Corp. |
2.0% | |
| Material Fund Change [Text Block] |
|
| C000078987 |
|
| Shareholder Report [Line Items] |
|
| Fund Name |
Columbia Small Cap Growth Fund
|
| Class Name |
Institutional 3 Class
|
| Trading Symbol |
CSGYX
|
| Annual or Semi-Annual Statement [Text Block] |
This annual shareholder report contains important information about Columbia Small Cap Growth Fund (the Fund) for the period of September 1, 2025 to August 31, 2026.
|
| Additional Information [Text Block] |
You can find additional information about the Fund at columbiathreadneedleus.com/resources/literature. You can also request more information by contacting us at 1-800-345-6611.
|
| Additional Information Phone Number |
1-800-345-6611
|
| Additional Information Website |
columbiathreadneedleus.com/resources/literature
|
| Expenses [Text Block] |
What were the Fund costs for the reporting period? (Based on a hypothetical $10,000 investment)
Table Summary
Class |
Cost of a $10,000 investment |
Cost paid as a percentage of a $10,000 investment |
Institutional 3 Class |
$93 |
0.82% | |
| Expenses Paid, Amount |
$ 93
|
| Expense Ratio, Percent |
0.82%
|
| Factors Affecting Performance [Text Block] |
Management's Discussion of Fund Performance The performance of Institutional 3 Class shares for the period presented is shown in the Average Annual Total Returns table. Top Performance ContributorsStock selection | Selections in the information technology and health care sectors boosted the Fund’s performance relative to the benchmark during the annual period. Allocation | An underweight allocation to the information technology sector contributed to relative performance. Individual holdings | Positions in Lumentum Holdings, an electrical products company, Hut 8, a data processing services company, and SiTime Corp, a semiconductor company, were among the top contributors to the Fund’s relative performance during the period. Top Performance DetractorsStock selection | Selections in the consumer discretionary and energy sectors hurt the Fund’s performance relative to the benchmark during the period. Allocation | An overweight allocation to the consumer discretionary sector detracted from relative performance. Individual holdings | Positions in Ollie’s Bargain Outlet Holdings, a department store company, Karman Holdings, an aerospace & defense company, and Modine Manufacturing, an industrial machinery company, were among the top detractors from relative performance during the period. |
| Performance Past Does Not Indicate Future [Text] |
The Fund's past performance is not a good predictor of the Fund's future performance.
|
| Line Graph [Table Text Block] |
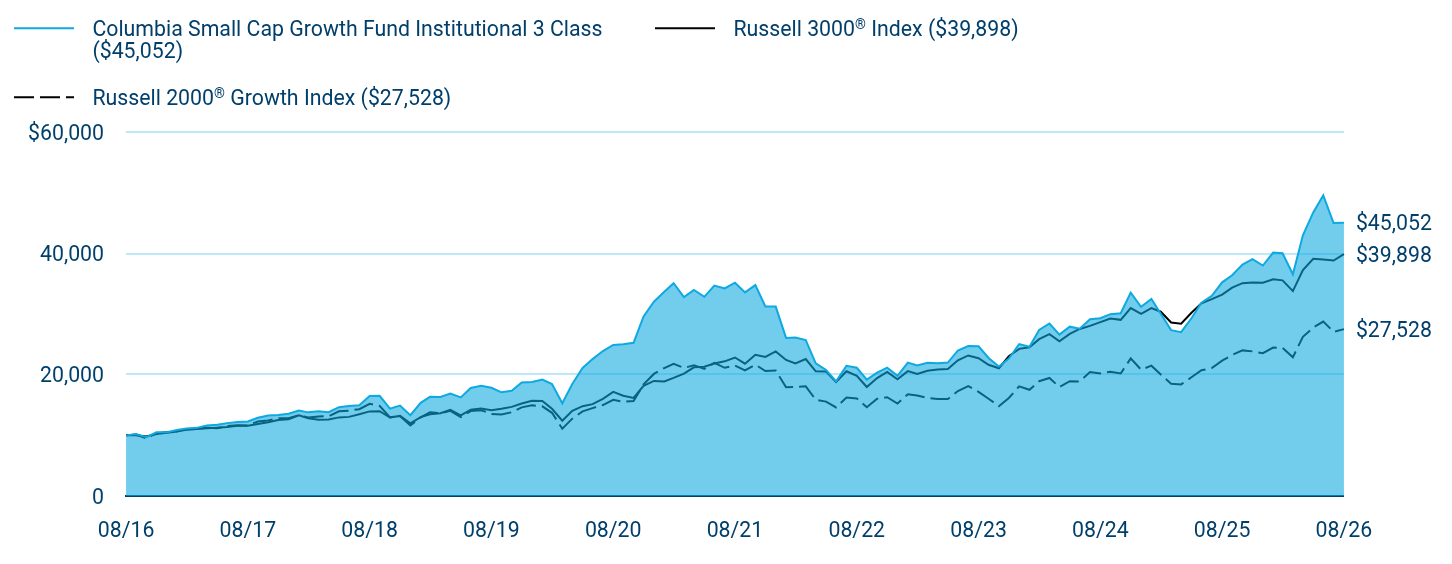
Table Summary
|
Columbia Small Cap Growth Fund Institutional 3 Class ($45,052) |
Russell 3000® Index ($39,898) |
Russell 2000® Growth Index ($27,528) |
08/16 |
$10,000 |
$10,000 |
$10,000 |
09/16 |
$10,206 |
$10,016 |
$10,144 |
10/16 |
$9,696 |
$9,799 |
$9,514 |
11/16 |
$10,510 |
$10,238 |
$10,365 |
12/16 |
$10,534 |
$10,437 |
$10,506 |
01/17 |
$10,887 |
$10,634 |
$10,677 |
02/17 |
$11,147 |
$11,029 |
$10,939 |
03/17 |
$11,241 |
$11,037 |
$11,068 |
04/17 |
$11,642 |
$11,154 |
$11,272 |
05/17 |
$11,759 |
$11,268 |
$11,169 |
06/17 |
$12,019 |
$11,370 |
$11,554 |
07/17 |
$12,213 |
$11,584 |
$11,652 |
08/17 |
$12,296 |
$11,606 |
$11,639 |
09/17 |
$12,897 |
$11,889 |
$12,272 |
10/17 |
$13,291 |
$12,149 |
$12,462 |
11/17 |
$13,362 |
$12,518 |
$12,820 |
12/17 |
$13,582 |
$12,643 |
$12,835 |
01/18 |
$14,106 |
$13,309 |
$13,335 |
02/18 |
$13,796 |
$12,819 |
$12,956 |
03/18 |
$13,962 |
$12,561 |
$13,130 |
04/18 |
$13,817 |
$12,609 |
$13,143 |
05/18 |
$14,658 |
$12,965 |
$13,970 |
06/18 |
$14,837 |
$13,050 |
$14,080 |
07/18 |
$14,968 |
$13,483 |
$14,322 |
08/18 |
$16,491 |
$13,956 |
$15,213 |
09/18 |
$16,518 |
$13,979 |
$14,857 |
10/18 |
$14,403 |
$12,950 |
$12,977 |
11/18 |
$14,919 |
$13,209 |
$13,180 |
12/18 |
$13,322 |
$11,980 |
$11,640 |
01/19 |
$15,374 |
$13,008 |
$12,985 |
02/19 |
$16,351 |
$13,466 |
$13,823 |
03/19 |
$16,335 |
$13,662 |
$13,636 |
04/19 |
$16,893 |
$14,208 |
$14,051 |
05/19 |
$16,269 |
$13,289 |
$13,009 |
06/19 |
$17,812 |
$14,222 |
$14,011 |
07/19 |
$18,165 |
$14,433 |
$14,148 |
08/19 |
$17,853 |
$14,139 |
$13,537 |
09/19 |
$17,106 |
$14,387 |
$13,426 |
10/19 |
$17,369 |
$14,697 |
$13,808 |
11/19 |
$18,740 |
$15,256 |
$14,621 |
12/19 |
$18,808 |
$15,696 |
$14,956 |
01/20 |
$19,210 |
$15,679 |
$14,791 |
02/20 |
$18,460 |
$14,395 |
$13,723 |
03/20 |
$15,286 |
$12,416 |
$11,103 |
04/20 |
$18,486 |
$14,060 |
$12,756 |
05/20 |
$21,114 |
$14,812 |
$13,962 |
06/20 |
$22,581 |
$15,151 |
$14,498 |
07/20 |
$23,904 |
$16,011 |
$14,996 |
08/20 |
$24,914 |
$17,171 |
$15,876 |
09/20 |
$25,012 |
$16,546 |
$15,536 |
10/20 |
$25,262 |
$16,188 |
$15,654 |
11/20 |
$29,625 |
$18,158 |
$18,414 |
12/20 |
$32,051 |
$18,975 |
$20,135 |
01/21 |
$33,679 |
$18,890 |
$21,106 |
02/21 |
$35,088 |
$19,481 |
$21,803 |
03/21 |
$32,808 |
$20,179 |
$21,117 |
04/21 |
$33,977 |
$21,219 |
$21,578 |
05/21 |
$32,855 |
$21,316 |
$20,961 |
06/21 |
$34,714 |
$21,842 |
$21,944 |
07/21 |
$34,235 |
$22,211 |
$21,145 |
08/21 |
$35,174 |
$22,845 |
$21,529 |
09/21 |
$33,584 |
$21,820 |
$20,704 |
10/21 |
$34,791 |
$23,295 |
$21,673 |
11/21 |
$31,255 |
$22,941 |
$20,615 |
12/21 |
$31,237 |
$23,844 |
$20,706 |
01/22 |
$26,077 |
$22,441 |
$17,931 |
02/22 |
$26,129 |
$21,876 |
$18,009 |
03/22 |
$25,719 |
$22,585 |
$18,092 |
04/22 |
$21,885 |
$20,558 |
$15,872 |
05/22 |
$20,779 |
$20,531 |
$15,572 |
06/22 |
$18,915 |
$18,813 |
$14,608 |
07/22 |
$21,474 |
$20,578 |
$16,244 |
08/22 |
$21,148 |
$19,810 |
$16,091 |
09/22 |
$19,189 |
$17,973 |
$14,644 |
10/22 |
$20,337 |
$19,447 |
$16,033 |
11/22 |
$21,180 |
$20,462 |
$16,295 |
12/22 |
$19,831 |
$19,264 |
$15,249 |
01/23 |
$22,001 |
$20,591 |
$16,765 |
02/23 |
$21,527 |
$20,110 |
$16,584 |
03/23 |
$21,990 |
$20,647 |
$16,175 |
04/23 |
$21,906 |
$20,867 |
$15,987 |
05/23 |
$22,012 |
$20,949 |
$15,990 |
06/23 |
$24,002 |
$22,379 |
$17,315 |
07/23 |
$24,729 |
$23,181 |
$18,125 |
08/23 |
$24,697 |
$22,734 |
$17,181 |
09/23 |
$22,770 |
$21,651 |
$16,048 |
10/23 |
$21,348 |
$21,077 |
$14,810 |
11/23 |
$22,675 |
$23,042 |
$16,159 |
12/23 |
$25,066 |
$24,265 |
$18,094 |
01/24 |
$24,613 |
$24,534 |
$17,514 |
02/24 |
$27,383 |
$25,862 |
$18,936 |
03/24 |
$28,457 |
$26,696 |
$19,466 |
04/24 |
$26,614 |
$25,521 |
$17,967 |
05/24 |
$27,930 |
$26,727 |
$18,929 |
06/24 |
$27,593 |
$27,554 |
$18,897 |
07/24 |
$29,142 |
$28,066 |
$20,444 |
08/24 |
$29,331 |
$28,677 |
$20,218 |
09/24 |
$29,995 |
$29,271 |
$20,487 |
10/24 |
$30,142 |
$29,056 |
$20,215 |
11/24 |
$33,544 |
$30,989 |
$22,693 |
12/24 |
$31,195 |
$30,041 |
$20,836 |
01/25 |
$32,501 |
$30,990 |
$21,494 |
02/25 |
$30,058 |
$30,396 |
$20,039 |
03/25 |
$27,362 |
$28,623 |
$18,520 |
04/25 |
$27,014 |
$28,431 |
$18,401 |
05/25 |
$29,310 |
$30,233 |
$19,582 |
06/25 |
$31,890 |
$31,769 |
$20,736 |
07/25 |
$33,028 |
$32,469 |
$21,089 |
08/25 |
$35,240 |
$33,220 |
$22,336 |
09/25 |
$36,419 |
$34,366 |
$23,264 |
10/25 |
$38,167 |
$35,103 |
$24,017 |
11/25 |
$39,063 |
$35,199 |
$23,853 |
12/25 |
$38,014 |
$35,192 |
$23,547 |
01/26 |
$40,143 |
$35,738 |
$24,483 |
02/26 |
$40,044 |
$35,568 |
$24,424 |
03/26 |
$36,569 |
$33,800 |
$22,886 |
04/26 |
$42,989 |
$37,248 |
$26,248 |
05/26 |
$46,773 |
$39,135 |
$27,781 |
06/26 |
$49,575 |
$39,015 |
$28,769 |
07/26 |
$45,030 |
$38,833 |
$27,083 |
08/26 |
$45,052 |
$39,898 |
$27,528 |
|
| Average Annual Return [Table Text Block] |
Table Summary
Average Annual Total Returns (%) |
1 year |
5 years |
10 years |
Institutional 3 Class |
27.84 |
5.07 |
16.24 |
Russell 3000® Index |
20.10 |
11.80 |
14.84 |
Russell 2000® Growth Index |
23.25 |
5.04 |
10.66 | |
| No Deduction of Taxes [Text Block] |
Performance does not reflect the deduction of taxes that a shareholder may pay on fund distributions or on the redemptions of fund shares.
|
| Updated Performance Information Location [Text Block] |
columbiathreadneedleus.com/investment-products/mutual-funds
|
| AssetsNet |
$ 3,523,383,703
|
| Holdings Count | Holding |
118
|
| Advisory Fees Paid, Amount |
$ 25,318,711
|
| InvestmentCompanyPortfolioTurnover |
180.00%
|
| Additional Fund Statistics [Text Block] |
Table Summary
Fund net assets |
$3,523,383,703 |
Total number of portfolio holdings |
118 |
Management services fees (represents 0.79% of Fund average net assets) |
$25,318,711 |
Portfolio turnover for the reporting period |
180% | |
| Holdings [Text Block] |
Table Summary
Health Care |
27.5% |
Information Technology |
21.6% |
Industrials |
18.1% |
Consumer Discretionary |
10.9% |
Communication Services |
5.7% |
Financials |
5.4% |
Energy |
4.8% |
Materials |
2.6% |
Consumer Staples |
1.4% |
Utilities |
0.2% |
Table Summary
Common Stocks |
98.2% |
Money Market Funds |
1.0% | |
| Largest Holdings [Text Block] |
Table Summary
Guardant Health, Inc. |
2.9% |
Brinker International, Inc. |
2.4% |
Sphere Entertainment Co. |
2.4% |
Charles River Laboratories International, Inc. |
2.3% |
ICON PLC |
2.2% |
DigitalOcean Holdings, Inc. |
2.2% |
Karman Holdings, Inc. |
2.2% |
Rush Street Interactive, Inc. |
2.1% |
InterDigital, Inc. |
2.1% |
Repligen Corp. |
2.0% | |
| Material Fund Change [Text Block] |
|
| C000094677 |
|
| Shareholder Report [Line Items] |
|
| Fund Name |
Columbia Small Cap Growth Fund
|
| Class Name |
Class R
|
| Trading Symbol |
CCRIX
|
| Annual or Semi-Annual Statement [Text Block] |
This annual shareholder report contains important information about Columbia Small Cap Growth Fund (the Fund) for the period of September 1, 2025 to August 31, 2026.
|
| Additional Information [Text Block] |
You can find additional information about the Fund at columbiathreadneedleus.com/resources/literature. You can also request more information by contacting us at 1-800-345-6611.
|
| Additional Information Phone Number |
1-800-345-6611
|
| Additional Information Website |
columbiathreadneedleus.com/resources/literature
|
| Expenses [Text Block] |
What were the Fund costs for the reporting period? (Based on a hypothetical $10,000 investment)
Table Summary
Class |
Cost of a $10,000 investment |
Cost paid as a percentage of a $10,000 investment |
Class R |
$163 |
1.44% | |
| Expenses Paid, Amount |
$ 163
|
| Expense Ratio, Percent |
1.44%
|
| Factors Affecting Performance [Text Block] |
Management's Discussion of Fund Performance The performance of Class R shares for the period presented is shown in the Average Annual Total Returns table. Top Performance ContributorsStock selection | Selections in the information technology and health care sectors boosted the Fund’s performance relative to the benchmark during the annual period. Allocation | An underweight allocation to the information technology sector contributed to relative performance. Individual holdings | Positions in Lumentum Holdings, an electrical products company, Hut 8, a data processing services company, and SiTime Corp, a semiconductor company, were among the top contributors to the Fund’s relative performance during the period. Top Performance DetractorsStock selection | Selections in the consumer discretionary and energy sectors hurt the Fund’s performance relative to the benchmark during the period. Allocation | An overweight allocation to the consumer discretionary sector detracted from relative performance. Individual holdings | Positions in Ollie’s Bargain Outlet Holdings, a department store company, Karman Holdings, an aerospace & defense company, and Modine Manufacturing, an industrial machinery company, were among the top detractors from relative performance during the period. |
| Performance Past Does Not Indicate Future [Text] |
The Fund's past performance is not a good predictor of the Fund's future performance.
|
| Line Graph [Table Text Block] |
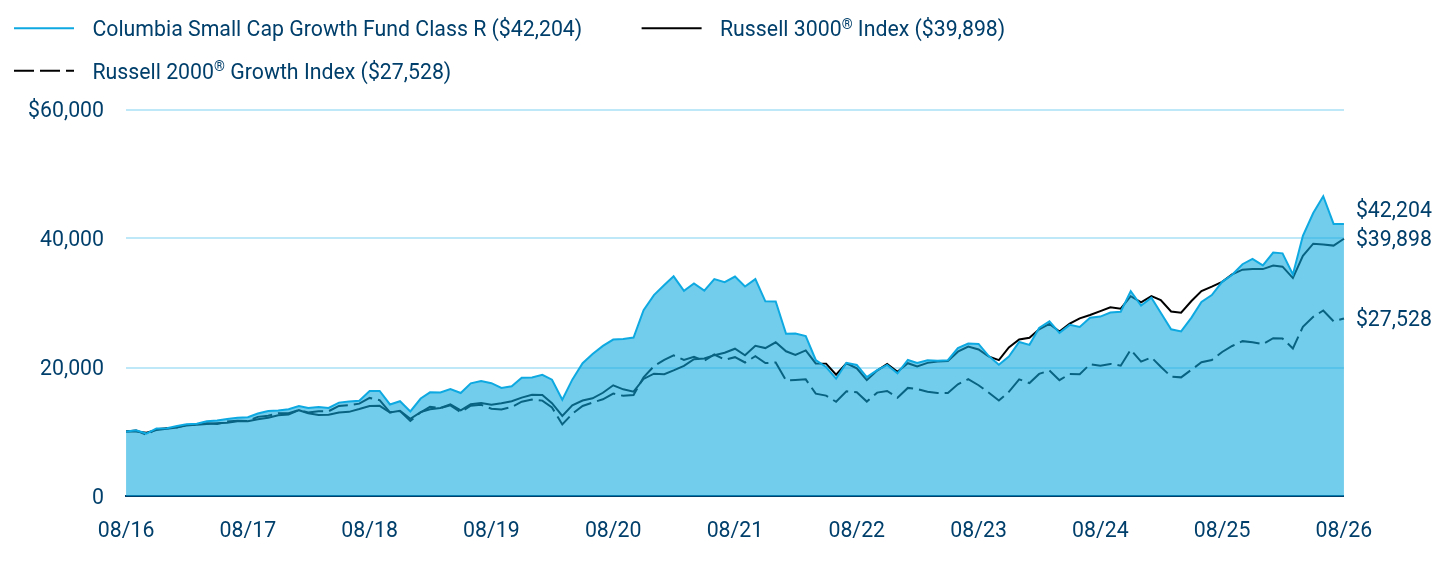
Table Summary
|
Columbia Small Cap Growth Fund Class R ($42,204) |
Russell 3000® Index ($39,898) |
Russell 2000® Growth Index ($27,528) |
08/16 |
$10,000 |
$10,000 |
$10,000 |
09/16 |
$10,200 |
$10,016 |
$10,144 |
10/16 |
$9,682 |
$9,799 |
$9,514 |
11/16 |
$10,488 |
$10,238 |
$10,365 |
12/16 |
$10,509 |
$10,437 |
$10,506 |
01/17 |
$10,854 |
$10,634 |
$10,677 |
02/17 |
$11,110 |
$11,029 |
$10,939 |
03/17 |
$11,193 |
$11,037 |
$11,068 |
04/17 |
$11,583 |
$11,154 |
$11,272 |
05/17 |
$11,698 |
$11,268 |
$11,169 |
06/17 |
$11,947 |
$11,370 |
$11,554 |
07/17 |
$12,133 |
$11,584 |
$11,652 |
08/17 |
$12,210 |
$11,606 |
$11,639 |
09/17 |
$12,804 |
$11,889 |
$12,272 |
10/17 |
$13,188 |
$12,149 |
$12,462 |
11/17 |
$13,252 |
$12,518 |
$12,820 |
12/17 |
$13,457 |
$12,643 |
$12,835 |
01/18 |
$13,970 |
$13,309 |
$13,335 |
02/18 |
$13,653 |
$12,819 |
$12,956 |
03/18 |
$13,811 |
$12,561 |
$13,130 |
04/18 |
$13,660 |
$12,609 |
$13,143 |
05/18 |
$14,482 |
$12,965 |
$13,970 |
06/18 |
$14,656 |
$13,050 |
$14,080 |
07/18 |
$14,777 |
$13,483 |
$14,322 |
08/18 |
$16,270 |
$13,956 |
$15,213 |
09/18 |
$16,285 |
$13,979 |
$14,857 |
10/18 |
$14,196 |
$12,950 |
$12,977 |
11/18 |
$14,694 |
$13,209 |
$13,180 |
12/18 |
$13,117 |
$11,980 |
$11,640 |
01/19 |
$15,120 |
$13,008 |
$12,985 |
02/19 |
$16,075 |
$13,466 |
$13,823 |
03/19 |
$16,057 |
$13,662 |
$13,636 |
04/19 |
$16,594 |
$14,208 |
$14,051 |
05/19 |
$15,966 |
$13,289 |
$13,009 |
06/19 |
$17,477 |
$14,222 |
$14,011 |
07/19 |
$17,814 |
$14,433 |
$14,148 |
08/19 |
$17,495 |
$14,139 |
$13,537 |
09/19 |
$16,758 |
$14,387 |
$13,426 |
10/19 |
$17,004 |
$14,697 |
$13,808 |
11/19 |
$18,333 |
$15,256 |
$14,621 |
12/19 |
$18,392 |
$15,696 |
$14,956 |
01/20 |
$18,781 |
$15,679 |
$14,791 |
02/20 |
$18,034 |
$14,395 |
$13,723 |
03/20 |
$14,925 |
$12,416 |
$11,103 |
04/20 |
$18,044 |
$14,060 |
$12,756 |
05/20 |
$20,594 |
$14,812 |
$13,962 |
06/20 |
$22,019 |
$15,151 |
$14,498 |
07/20 |
$23,284 |
$16,011 |
$14,996 |
08/20 |
$24,261 |
$17,171 |
$15,876 |
09/20 |
$24,341 |
$16,546 |
$15,536 |
10/20 |
$24,570 |
$16,188 |
$15,654 |
11/20 |
$28,804 |
$18,158 |
$18,414 |
12/20 |
$31,154 |
$18,975 |
$20,135 |
01/21 |
$32,721 |
$18,890 |
$21,106 |
02/21 |
$34,063 |
$19,481 |
$21,803 |
03/21 |
$31,830 |
$20,179 |
$21,117 |
04/21 |
$32,957 |
$21,219 |
$21,578 |
05/21 |
$31,841 |
$21,316 |
$20,961 |
06/21 |
$33,634 |
$21,842 |
$21,944 |
07/21 |
$33,151 |
$22,211 |
$21,145 |
08/21 |
$34,031 |
$22,845 |
$21,529 |
09/21 |
$32,485 |
$21,820 |
$20,704 |
10/21 |
$33,634 |
$23,295 |
$21,673 |
11/21 |
$30,198 |
$22,941 |
$20,615 |
12/21 |
$30,165 |
$23,844 |
$20,706 |
01/22 |
$25,170 |
$22,441 |
$17,931 |
02/22 |
$25,205 |
$21,876 |
$18,009 |
03/22 |
$24,800 |
$22,585 |
$18,092 |
04/22 |
$21,092 |
$20,558 |
$15,872 |
05/22 |
$20,007 |
$20,531 |
$15,572 |
06/22 |
$18,207 |
$18,813 |
$14,608 |
07/22 |
$20,663 |
$20,578 |
$16,244 |
08/22 |
$20,329 |
$19,810 |
$16,091 |
09/22 |
$18,433 |
$17,973 |
$14,644 |
10/22 |
$19,530 |
$19,447 |
$16,033 |
11/22 |
$20,329 |
$20,462 |
$16,295 |
12/22 |
$19,017 |
$19,264 |
$15,249 |
01/23 |
$21,092 |
$20,591 |
$16,765 |
02/23 |
$20,627 |
$20,110 |
$16,584 |
03/23 |
$21,056 |
$20,647 |
$16,175 |
04/23 |
$20,961 |
$20,867 |
$15,987 |
05/23 |
$21,056 |
$20,949 |
$15,990 |
06/23 |
$22,940 |
$22,379 |
$17,315 |
07/23 |
$23,632 |
$23,181 |
$18,125 |
08/23 |
$23,584 |
$22,734 |
$17,181 |
09/23 |
$21,736 |
$21,651 |
$16,048 |
10/23 |
$20,365 |
$21,077 |
$14,810 |
11/23 |
$21,617 |
$23,042 |
$16,159 |
12/23 |
$23,882 |
$24,265 |
$18,094 |
01/24 |
$23,441 |
$24,534 |
$17,514 |
02/24 |
$26,064 |
$25,862 |
$18,936 |
03/24 |
$27,077 |
$26,696 |
$19,466 |
04/24 |
$25,301 |
$25,521 |
$17,967 |
05/24 |
$26,541 |
$26,727 |
$18,929 |
06/24 |
$26,207 |
$27,554 |
$18,897 |
07/24 |
$27,662 |
$28,066 |
$20,444 |
08/24 |
$27,829 |
$28,677 |
$20,218 |
09/24 |
$28,449 |
$29,271 |
$20,487 |
10/24 |
$28,568 |
$29,056 |
$20,215 |
11/24 |
$31,775 |
$30,989 |
$22,693 |
12/24 |
$29,534 |
$30,041 |
$20,836 |
01/25 |
$30,750 |
$30,990 |
$21,494 |
02/25 |
$28,425 |
$30,396 |
$20,039 |
03/25 |
$25,861 |
$28,623 |
$18,520 |
04/25 |
$25,527 |
$28,431 |
$18,401 |
05/25 |
$27,674 |
$30,233 |
$19,582 |
06/25 |
$30,094 |
$31,769 |
$20,736 |
07/25 |
$31,155 |
$32,469 |
$21,089 |
08/25 |
$33,218 |
$33,220 |
$22,336 |
09/25 |
$34,315 |
$34,366 |
$23,264 |
10/25 |
$35,948 |
$35,103 |
$24,017 |
11/25 |
$36,771 |
$35,199 |
$23,853 |
12/25 |
$35,769 |
$35,192 |
$23,547 |
01/26 |
$37,747 |
$35,738 |
$24,483 |
02/26 |
$37,634 |
$35,568 |
$24,424 |
03/26 |
$34,354 |
$33,800 |
$22,886 |
04/26 |
$40,351 |
$37,248 |
$26,248 |
05/26 |
$43,894 |
$39,135 |
$27,781 |
06/26 |
$46,498 |
$39,015 |
$28,769 |
07/26 |
$42,204 |
$38,833 |
$27,083 |
08/26 |
$42,204 |
$39,898 |
$27,528 |
|
| Average Annual Return [Table Text Block] |
Table Summary
Average Annual Total Returns (%) |
1 year |
5 years |
10 years |
Class R |
27.05 |
4.40 |
15.49 |
Russell 3000® Index |
20.10 |
11.80 |
14.84 |
Russell 2000® Growth Index |
23.25 |
5.04 |
10.66 | |
| No Deduction of Taxes [Text Block] |
Performance does not reflect the deduction of taxes that a shareholder may pay on fund distributions or on the redemptions of fund shares.
|
| Updated Performance Information Location [Text Block] |
columbiathreadneedleus.com/investment-products/mutual-funds
|
| AssetsNet |
$ 3,523,383,703
|
| Holdings Count | Holding |
118
|
| Advisory Fees Paid, Amount |
$ 25,318,711
|
| InvestmentCompanyPortfolioTurnover |
180.00%
|
| Additional Fund Statistics [Text Block] |
Table Summary
Fund net assets |
$3,523,383,703 |
Total number of portfolio holdings |
118 |
Management services fees (represents 0.79% of Fund average net assets) |
$25,318,711 |
Portfolio turnover for the reporting period |
180% | |
| Holdings [Text Block] |
Table Summary
Health Care |
27.5% |
Information Technology |
21.6% |
Industrials |
18.1% |
Consumer Discretionary |
10.9% |
Communication Services |
5.7% |
Financials |
5.4% |
Energy |
4.8% |
Materials |
2.6% |
Consumer Staples |
1.4% |
Utilities |
0.2% |
Table Summary
Common Stocks |
98.2% |
Money Market Funds |
1.0% | |
| Largest Holdings [Text Block] |
Table Summary
Guardant Health, Inc. |
2.9% |
Brinker International, Inc. |
2.4% |
Sphere Entertainment Co. |
2.4% |
Charles River Laboratories International, Inc. |
2.3% |
ICON PLC |
2.2% |
DigitalOcean Holdings, Inc. |
2.2% |
Karman Holdings, Inc. |
2.2% |
Rush Street Interactive, Inc. |
2.1% |
InterDigital, Inc. |
2.1% |
Repligen Corp. |
2.0% | |
| Material Fund Change [Text Block] |
|
| C000253716 |
|
| Shareholder Report [Line Items] |
|
| Fund Name |
Columbia Small Cap Growth Fund
|
| Class Name |
Class S
|
| Trading Symbol |
CMSHX
|
| Annual or Semi-Annual Statement [Text Block] |
This annual shareholder report contains important information about Columbia Small Cap Growth Fund (the Fund) for the period of September 1, 2025 to August 31, 2026.
|
| Additional Information [Text Block] |
You can find additional information about the Fund at columbiathreadneedleus.com/resources/literature. You can also request more information by contacting us at 1-800-345-6611.
|
| Additional Information Phone Number |
1-800-345-6611
|
| Additional Information Website |
columbiathreadneedleus.com/resources/literature
|
| Expenses [Text Block] |
What were the Fund costs for the reporting period? (Based on a hypothetical $10,000 investment)
Table Summary
Class |
Cost of a $10,000 investment |
Cost paid as a percentage of a $10,000 investment |
Class S |
$106 |
0.93% | |
| Expenses Paid, Amount |
$ 106
|
| Expense Ratio, Percent |
0.93%
|
| Factors Affecting Performance [Text Block] |
Management's Discussion of Fund Performance The performance of Class S shares for the period presented is shown in the Average Annual Total Returns table. Top Performance ContributorsStock selection | Selections in the information technology and health care sectors boosted the Fund’s performance relative to the benchmark during the annual period. Allocation | An underweight allocation to the information technology sector contributed to relative performance. Individual holdings | Positions in Lumentum Holdings, an electrical products company, Hut 8, a data processing services company, and SiTime Corp, a semiconductor company, were among the top contributors to the Fund’s relative performance during the period. Top Performance DetractorsStock selection | Selections in the consumer discretionary and energy sectors hurt the Fund’s performance relative to the benchmark during the period. Allocation | An overweight allocation to the consumer discretionary sector detracted from relative performance. Individual holdings | Positions in Ollie’s Bargain Outlet Holdings, a department store company, Karman Holdings, an aerospace & defense company, and Modine Manufacturing, an industrial machinery company, were among the top detractors from relative performance during the period. |
| Performance Past Does Not Indicate Future [Text] |
The Fund's past performance is not a good predictor of the Fund's future performance.
|
| Line Graph [Table Text Block] |
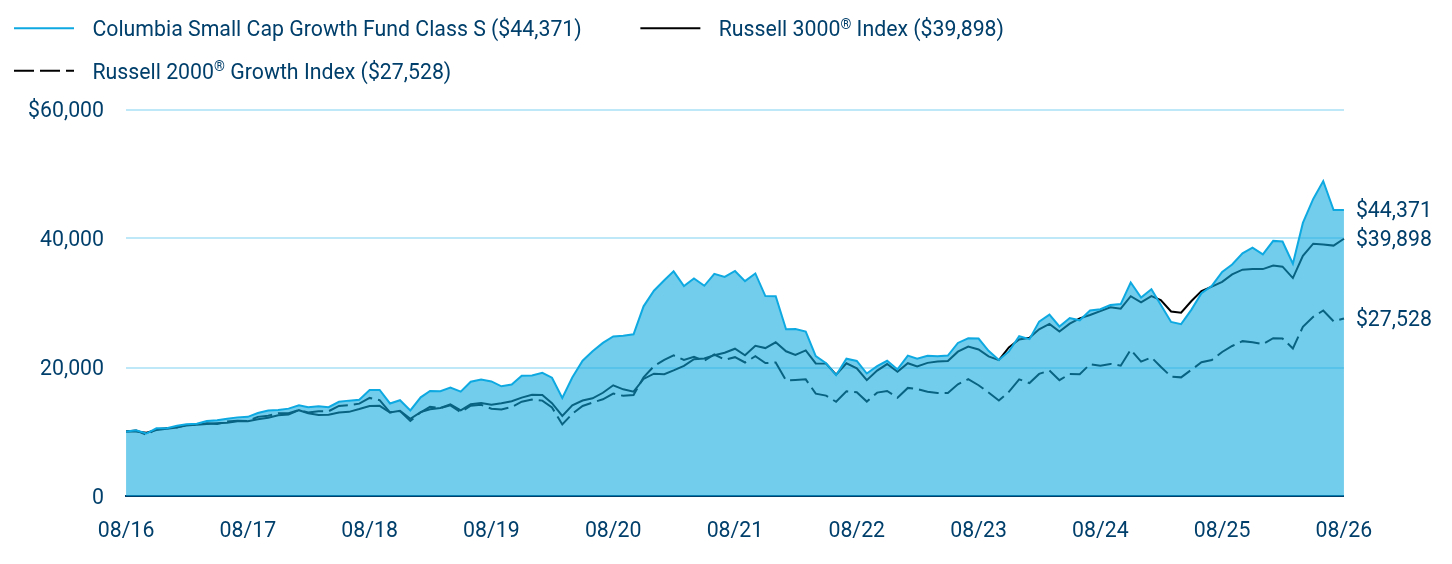
Table Summary
|
Columbia Small Cap Growth Fund Class S ($44,371) |
Russell 3000® Index ($39,898) |
Russell 2000® Growth Index ($27,528) |
08/16 |
$10,000 |
$10,000 |
$10,000 |
09/16 |
$10,204 |
$10,016 |
$10,144 |
10/16 |
$9,691 |
$9,799 |
$9,514 |
11/16 |
$10,502 |
$10,238 |
$10,365 |
12/16 |
$10,523 |
$10,437 |
$10,506 |
01/17 |
$10,882 |
$10,634 |
$10,677 |
02/17 |
$11,140 |
$11,029 |
$10,939 |
03/17 |
$11,223 |
$11,037 |
$11,068 |
04/17 |
$11,625 |
$11,154 |
$11,272 |
05/17 |
$11,744 |
$11,268 |
$11,169 |
06/17 |
$11,996 |
$11,370 |
$11,554 |
07/17 |
$12,194 |
$11,584 |
$11,652 |
08/17 |
$12,272 |
$11,606 |
$11,639 |
09/17 |
$12,870 |
$11,889 |
$12,272 |
10/17 |
$13,266 |
$12,149 |
$12,462 |
11/17 |
$13,332 |
$12,518 |
$12,820 |
12/17 |
$13,549 |
$12,643 |
$12,835 |
01/18 |
$14,068 |
$13,309 |
$13,335 |
02/18 |
$13,760 |
$12,819 |
$12,956 |
03/18 |
$13,921 |
$12,561 |
$13,130 |
04/18 |
$13,774 |
$12,609 |
$13,143 |
05/18 |
$14,609 |
$12,965 |
$13,970 |
06/18 |
$14,791 |
$13,050 |
$14,080 |
07/18 |
$14,918 |
$13,483 |
$14,322 |
08/18 |
$16,433 |
$13,956 |
$15,213 |
09/18 |
$16,454 |
$13,979 |
$14,857 |
10/18 |
$14,349 |
$12,950 |
$12,977 |
11/18 |
$14,861 |
$13,209 |
$13,180 |
12/18 |
$13,271 |
$11,980 |
$11,640 |
01/19 |
$15,307 |
$13,008 |
$12,985 |
02/19 |
$16,279 |
$13,466 |
$13,823 |
03/19 |
$16,262 |
$13,662 |
$13,636 |
04/19 |
$16,815 |
$14,208 |
$14,051 |
05/19 |
$16,186 |
$13,289 |
$13,009 |
06/19 |
$17,728 |
$14,222 |
$14,011 |
07/19 |
$18,072 |
$14,433 |
$14,148 |
08/19 |
$17,762 |
$14,139 |
$13,537 |
09/19 |
$17,016 |
$14,387 |
$13,426 |
10/19 |
$17,276 |
$14,697 |
$13,808 |
11/19 |
$18,633 |
$15,256 |
$14,621 |
12/19 |
$18,704 |
$15,696 |
$14,956 |
01/20 |
$19,106 |
$15,679 |
$14,791 |
02/20 |
$18,348 |
$14,395 |
$13,723 |
03/20 |
$15,197 |
$12,416 |
$11,103 |
04/20 |
$18,376 |
$14,060 |
$12,756 |
05/20 |
$20,988 |
$14,812 |
$13,962 |
06/20 |
$22,440 |
$15,151 |
$14,498 |
07/20 |
$23,746 |
$16,011 |
$14,996 |
08/20 |
$24,750 |
$17,171 |
$15,876 |
09/20 |
$24,851 |
$16,546 |
$15,536 |
10/20 |
$25,088 |
$16,188 |
$15,654 |
11/20 |
$29,417 |
$18,158 |
$18,414 |
12/20 |
$31,831 |
$18,975 |
$20,135 |
01/21 |
$33,448 |
$18,890 |
$21,106 |
02/21 |
$34,839 |
$19,481 |
$21,803 |
03/21 |
$32,575 |
$20,179 |
$21,117 |
04/21 |
$33,732 |
$21,219 |
$21,578 |
05/21 |
$32,605 |
$21,316 |
$20,961 |
06/21 |
$34,457 |
$21,842 |
$21,944 |
07/21 |
$33,977 |
$22,211 |
$21,145 |
08/21 |
$34,898 |
$22,845 |
$21,529 |
09/21 |
$33,320 |
$21,820 |
$20,704 |
10/21 |
$34,516 |
$23,295 |
$21,673 |
11/21 |
$31,007 |
$22,941 |
$20,615 |
12/21 |
$30,980 |
$23,844 |
$20,706 |
01/22 |
$25,853 |
$22,441 |
$17,931 |
02/22 |
$25,907 |
$21,876 |
$18,009 |
03/22 |
$25,497 |
$22,585 |
$18,092 |
04/22 |
$21,697 |
$20,558 |
$15,872 |
05/22 |
$20,596 |
$20,531 |
$15,572 |
06/22 |
$18,739 |
$18,813 |
$14,608 |
07/22 |
$21,287 |
$20,578 |
$16,244 |
08/22 |
$20,952 |
$19,810 |
$16,091 |
09/22 |
$18,998 |
$17,973 |
$14,644 |
10/22 |
$20,142 |
$19,447 |
$16,033 |
11/22 |
$20,974 |
$20,462 |
$16,295 |
12/22 |
$19,635 |
$19,264 |
$15,249 |
01/23 |
$21,772 |
$20,591 |
$16,765 |
02/23 |
$21,308 |
$20,110 |
$16,584 |
03/23 |
$21,762 |
$20,647 |
$16,175 |
04/23 |
$21,675 |
$20,867 |
$15,987 |
05/23 |
$21,783 |
$20,949 |
$15,990 |
06/23 |
$23,737 |
$22,379 |
$17,315 |
07/23 |
$24,460 |
$23,181 |
$18,125 |
08/23 |
$24,417 |
$22,734 |
$17,181 |
09/23 |
$22,517 |
$21,651 |
$16,048 |
10/23 |
$21,103 |
$21,077 |
$14,810 |
11/23 |
$22,420 |
$23,042 |
$16,159 |
12/23 |
$24,773 |
$24,265 |
$18,094 |
01/24 |
$24,331 |
$24,534 |
$17,514 |
02/24 |
$27,051 |
$25,862 |
$18,936 |
03/24 |
$28,120 |
$26,696 |
$19,466 |
04/24 |
$26,285 |
$25,521 |
$17,967 |
05/24 |
$27,591 |
$26,727 |
$18,929 |
06/24 |
$27,245 |
$27,554 |
$18,897 |
07/24 |
$28,778 |
$28,066 |
$20,444 |
08/24 |
$28,972 |
$28,677 |
$20,218 |
09/24 |
$29,620 |
$29,271 |
$20,487 |
10/24 |
$29,760 |
$29,056 |
$20,215 |
11/24 |
$33,117 |
$30,989 |
$22,693 |
12/24 |
$30,786 |
$30,041 |
$20,836 |
01/25 |
$32,081 |
$30,990 |
$21,494 |
02/25 |
$29,652 |
$30,396 |
$20,039 |
03/25 |
$26,997 |
$28,623 |
$18,520 |
04/25 |
$26,652 |
$28,431 |
$18,401 |
05/25 |
$28,908 |
$30,233 |
$19,582 |
06/25 |
$31,455 |
$31,769 |
$20,736 |
07/25 |
$32,578 |
$32,469 |
$21,089 |
08/25 |
$34,747 |
$33,220 |
$22,336 |
09/25 |
$35,913 |
$34,366 |
$23,264 |
10/25 |
$37,629 |
$35,103 |
$24,017 |
11/25 |
$38,504 |
$35,199 |
$23,853 |
12/25 |
$37,470 |
$35,192 |
$23,547 |
01/26 |
$39,563 |
$35,738 |
$24,483 |
02/26 |
$39,461 |
$35,568 |
$24,424 |
03/26 |
$36,033 |
$33,800 |
$22,886 |
04/26 |
$42,357 |
$37,248 |
$26,248 |
05/26 |
$46,079 |
$39,135 |
$27,781 |
06/26 |
$48,839 |
$39,015 |
$28,769 |
07/26 |
$44,348 |
$38,833 |
$27,083 |
08/26 |
$44,371 |
$39,898 |
$27,528 |
|
| Average Annual Return [Table Text Block] |
Table Summary
Average Annual Total Returns (%) |
1 year |
5 years |
10 years |
Class SFootnote Reference(a) |
27.69 |
4.92 |
16.07 |
Russell 3000® Index |
20.10 |
11.80 |
14.84 |
Russell 2000® Growth Index |
23.25 |
5.04 |
10.66 | |
| No Deduction of Taxes [Text Block] |
Performance does not reflect the deduction of taxes that a shareholder may pay on fund distributions or on the redemptions of fund shares.
|
| Updated Performance Information Location [Text Block] |
columbiathreadneedleus.com/investment-products/mutual-funds
|
| AssetsNet |
$ 3,523,383,703
|
| Holdings Count | Holding |
118
|
| Advisory Fees Paid, Amount |
$ 25,318,711
|
| InvestmentCompanyPortfolioTurnover |
180.00%
|
| Additional Fund Statistics [Text Block] |
Table Summary
Fund net assets |
$3,523,383,703 |
Total number of portfolio holdings |
118 |
Management services fees (represents 0.79% of Fund average net assets) |
$25,318,711 |
Portfolio turnover for the reporting period |
180% | |
| Holdings [Text Block] |
Table Summary
Health Care |
27.5% |
Information Technology |
21.6% |
Industrials |
18.1% |
Consumer Discretionary |
10.9% |
Communication Services |
5.7% |
Financials |
5.4% |
Energy |
4.8% |
Materials |
2.6% |
Consumer Staples |
1.4% |
Utilities |
0.2% |
Table Summary
Common Stocks |
98.2% |
Money Market Funds |
1.0% | |
| Largest Holdings [Text Block] |
Table Summary
Guardant Health, Inc. |
2.9% |
Brinker International, Inc. |
2.4% |
Sphere Entertainment Co. |
2.4% |
Charles River Laboratories International, Inc. |
2.3% |
ICON PLC |
2.2% |
DigitalOcean Holdings, Inc. |
2.2% |
Karman Holdings, Inc. |
2.2% |
Rush Street Interactive, Inc. |
2.1% |
InterDigital, Inc. |
2.1% |
Repligen Corp. |
2.0% | |
| Material Fund Change [Text Block] |
|
| C000029358 |
|
| Shareholder Report [Line Items] |
|
| Fund Name |
Columbia Strategic Income Fund
|
| Class Name |
Class A
|
| Trading Symbol |
COSIX
|
| Annual or Semi-Annual Statement [Text Block] |
This annual shareholder report contains important information about Columbia Strategic Income Fund (the Fund) for the period of September 1, 2025 to August 31, 2026.
|
| Additional Information [Text Block] |
You can find additional information about the Fund at columbiathreadneedleus.com/resources/literature. You can also request more information by contacting us at 1-800-345-6611.
|
| Additional Information Phone Number |
1-800-345-6611
|
| Additional Information Website |
columbiathreadneedleus.com/resources/literature
|
| Expenses [Text Block] |
What were the Fund costs for the reporting period? (Based on a hypothetical $10,000 investment)
Table Summary
Class |
Cost of a $10,000 investment |
Cost paid as a percentage of a $10,000 investment |
Class A |
$94 |
0.93% | |
| Expenses Paid, Amount |
$ 94
|
| Expense Ratio, Percent |
0.93%
|
| Factors Affecting Performance [Text Block] |
Management's Discussion of Fund Performance The performance of Class A shares for the period presented is shown in the Average Annual Total Returns table. Top Performance ContributorsHigh-yield corporate bonds | High-yield corporates were the largest contributor to the Fund’s relative performance during the period. Resilient issuer fundamentals and steady investor demand supported the sector, and its meaningful income advantage over Treasuries drove positive excess returns. The allocation added value relative to the benchmark, which has no exposure to below-investment-grade corporates. Emerging market debt | Emerging market debt was the second-largest contributor to relative performance during the period, supported by improving sovereign and corporate credit conditions and strong demand for higher-yielding assets. The Fund's overweight allocation to the sector added value relative to the benchmark. High-yield bank loans | Bank loans contributed positively to relative performance during the period, as elevated short-term interest rates and supportive credit conditions benefited the Fund's higher-income, floating-rate holdings. The allocation added value relative to the benchmark, which does not hold these securities. Top Performance DetractorsAgency mortgage-backed securities | Agency mortgage-backed-securities (MBS) detracted most from the Fund’s performance relative to the benchmark, driven by the Fund's inverse interest-only (IIO) holdings, which are not held in the benchmark. Coupons on these securities move inversely to short-term rates, and they were pressured as the market repriced from expecting Federal Reserve rate cuts to the possibility of hikes. Agency MBS still contributed positively to absolute return. Interest rate positioning | Interest rate positioning detracted from relative performance during the period, as yield curve positioning and implementation costs associated with the Fund’s interest rate derivatives weighed on relative results. Overall, interest rate factors still contributed positively to absolute return, as income from higher starting yields outweighed the price impact of rising Treasury yields. Investment-grade corporate bonds | The Fund’s underweight allocation to investment-grade corporates detracted from relative performance, as the sector continued to generate positive returns despite historically tight spreads. The allocation also contributed positively to absolute return. |
| Performance Past Does Not Indicate Future [Text] |
The Fund's past performance is not a good predictor of the Fund's future performance.
|
| Line Graph [Table Text Block] |
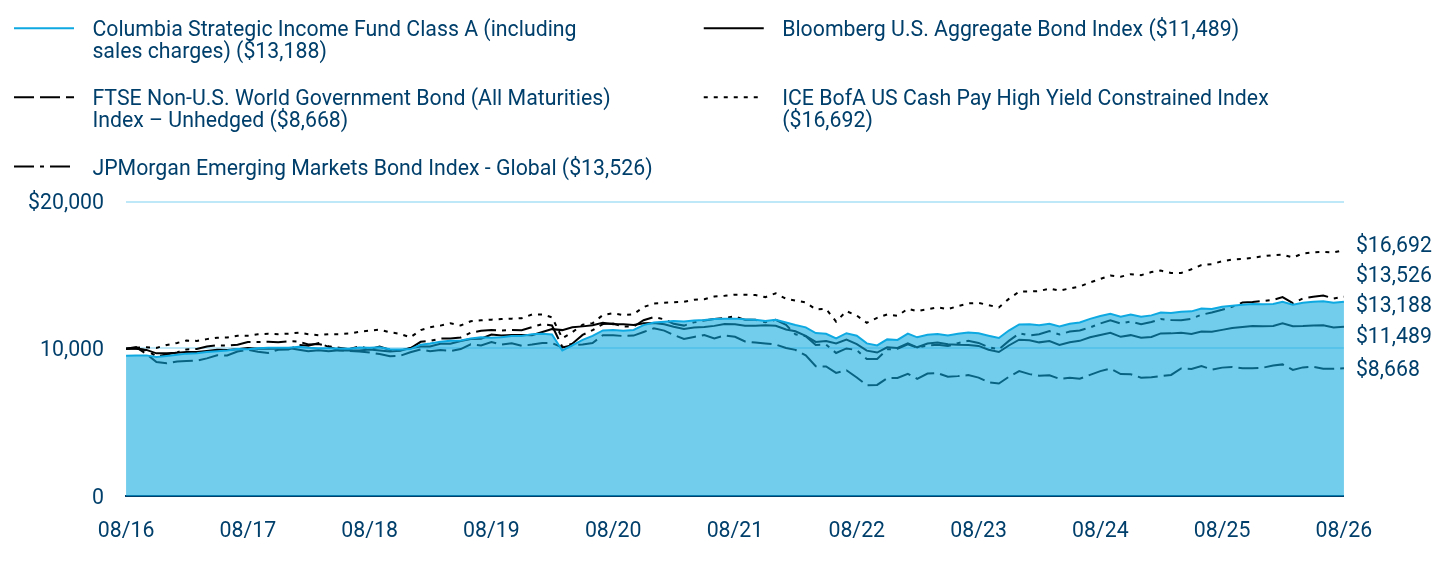
Table Summary
|
Columbia Strategic Income Fund Class A (including sales charges) ($13,188) |
Bloomberg U.S. Aggregate Bond Index ($11,489) |
FTSE Non-U.S. World Government Bond (All Maturities) Index – Unhedged ($8,668) |
ICE BofA US Cash Pay High Yield Constrained Index ($16,692) |
JPMorgan Emerging Markets Bond Index - Global ($13,526) |
08/16 |
$9,522 |
$10,000 |
$10,000 |
$10,000 |
$10,000 |
09/16 |
$9,545 |
$9,994 |
$10,104 |
$10,065 |
$10,034 |
10/16 |
$9,545 |
$9,918 |
$9,642 |
$10,095 |
$9,887 |
11/16 |
$9,434 |
$9,683 |
$9,097 |
$10,055 |
$9,475 |
12/16 |
$9,508 |
$9,697 |
$9,009 |
$10,252 |
$9,611 |
01/17 |
$9,595 |
$9,716 |
$9,137 |
$10,389 |
$9,749 |
02/17 |
$9,664 |
$9,781 |
$9,168 |
$10,552 |
$9,952 |
03/17 |
$9,685 |
$9,776 |
$9,191 |
$10,529 |
$9,986 |
04/17 |
$9,773 |
$9,851 |
$9,340 |
$10,648 |
$10,149 |
05/17 |
$9,826 |
$9,927 |
$9,553 |
$10,745 |
$10,233 |
06/17 |
$9,878 |
$9,917 |
$9,541 |
$10,756 |
$10,207 |
07/17 |
$9,980 |
$9,960 |
$9,803 |
$10,880 |
$10,274 |
08/17 |
$9,967 |
$10,049 |
$9,924 |
$10,878 |
$10,452 |
09/17 |
$10,026 |
$10,001 |
$9,786 |
$10,976 |
$10,450 |
10/17 |
$10,068 |
$10,007 |
$9,713 |
$11,018 |
$10,469 |
11/17 |
$10,062 |
$9,994 |
$9,931 |
$10,987 |
$10,441 |
12/17 |
$10,070 |
$10,040 |
$9,940 |
$11,019 |
$10,507 |
01/18 |
$10,130 |
$9,925 |
$10,258 |
$11,089 |
$10,487 |
02/18 |
$10,056 |
$9,830 |
$10,192 |
$10,984 |
$10,281 |
03/18 |
$10,033 |
$9,894 |
$10,379 |
$10,915 |
$10,320 |
04/18 |
$10,026 |
$9,820 |
$10,126 |
$10,988 |
$10,169 |
05/18 |
$10,019 |
$9,890 |
$9,893 |
$10,986 |
$10,059 |
06/18 |
$9,996 |
$9,878 |
$9,848 |
$11,025 |
$9,957 |
07/18 |
$10,074 |
$9,880 |
$9,809 |
$11,149 |
$10,163 |
08/18 |
$10,069 |
$9,944 |
$9,737 |
$11,229 |
$9,967 |
09/18 |
$10,098 |
$9,880 |
$9,633 |
$11,294 |
$10,144 |
10/18 |
$9,957 |
$9,802 |
$9,493 |
$11,109 |
$9,917 |
11/18 |
$9,940 |
$9,860 |
$9,517 |
$11,010 |
$9,878 |
12/18 |
$9,973 |
$10,041 |
$9,759 |
$10,769 |
$10,023 |
01/19 |
$10,268 |
$10,148 |
$9,950 |
$11,264 |
$10,465 |
02/19 |
$10,353 |
$10,142 |
$9,820 |
$11,454 |
$10,531 |
03/19 |
$10,475 |
$10,337 |
$9,907 |
$11,566 |
$10,684 |
04/19 |
$10,543 |
$10,339 |
$9,844 |
$11,728 |
$10,696 |
05/19 |
$10,559 |
$10,523 |
$9,976 |
$11,579 |
$10,758 |
06/19 |
$10,699 |
$10,655 |
$10,296 |
$11,863 |
$11,085 |
07/19 |
$10,769 |
$10,679 |
$10,224 |
$11,924 |
$11,213 |
08/19 |
$10,749 |
$10,955 |
$10,451 |
$11,972 |
$11,274 |
09/19 |
$10,783 |
$10,897 |
$10,285 |
$12,009 |
$11,233 |
10/19 |
$10,853 |
$10,930 |
$10,371 |
$12,038 |
$11,275 |
11/19 |
$10,867 |
$10,924 |
$10,193 |
$12,070 |
$11,257 |
12/19 |
$10,988 |
$10,917 |
$10,278 |
$12,320 |
$11,468 |
01/20 |
$11,019 |
$11,127 |
$10,390 |
$12,321 |
$11,667 |
02/20 |
$10,959 |
$11,327 |
$10,384 |
$12,131 |
$11,573 |
03/20 |
$9,881 |
$11,260 |
$10,084 |
$10,709 |
$10,120 |
04/20 |
$10,223 |
$11,460 |
$10,237 |
$11,116 |
$10,342 |
05/20 |
$10,603 |
$11,514 |
$10,286 |
$11,621 |
$10,935 |
06/20 |
$10,874 |
$11,586 |
$10,385 |
$11,729 |
$11,254 |
07/20 |
$11,238 |
$11,759 |
$10,916 |
$12,286 |
$11,670 |
08/20 |
$11,269 |
$11,665 |
$10,907 |
$12,409 |
$11,704 |
09/20 |
$11,221 |
$11,658 |
$10,861 |
$12,281 |
$11,511 |
10/20 |
$11,275 |
$11,606 |
$10,889 |
$12,337 |
$11,497 |
11/20 |
$11,599 |
$11,720 |
$11,135 |
$12,826 |
$11,928 |
12/20 |
$11,770 |
$11,736 |
$11,385 |
$13,072 |
$12,142 |
01/21 |
$11,828 |
$11,652 |
$11,225 |
$13,114 |
$11,995 |
02/21 |
$11,881 |
$11,484 |
$10,938 |
$13,157 |
$11,687 |
03/21 |
$11,845 |
$11,340 |
$10,654 |
$13,179 |
$11,566 |
04/21 |
$11,912 |
$11,430 |
$10,799 |
$13,323 |
$11,787 |
05/21 |
$11,952 |
$11,467 |
$10,932 |
$13,359 |
$11,915 |
06/21 |
$12,010 |
$11,548 |
$10,702 |
$13,540 |
$12,021 |
07/21 |
$12,026 |
$11,677 |
$10,900 |
$13,590 |
$12,086 |
08/21 |
$12,040 |
$11,655 |
$10,809 |
$13,665 |
$12,196 |
09/21 |
$11,990 |
$11,554 |
$10,491 |
$13,668 |
$11,957 |
10/21 |
$11,959 |
$11,551 |
$10,418 |
$13,644 |
$11,964 |
11/21 |
$11,875 |
$11,585 |
$10,353 |
$13,502 |
$11,791 |
12/21 |
$11,955 |
$11,555 |
$10,284 |
$13,761 |
$11,959 |
01/22 |
$11,777 |
$11,306 |
$10,048 |
$13,384 |
$11,613 |
02/22 |
$11,603 |
$11,180 |
$9,920 |
$13,262 |
$10,974 |
03/22 |
$11,445 |
$10,869 |
$9,551 |
$13,141 |
$10,851 |
04/22 |
$11,056 |
$10,457 |
$8,806 |
$12,663 |
$10,257 |
05/22 |
$11,012 |
$10,524 |
$8,789 |
$12,700 |
$10,276 |
06/22 |
$10,693 |
$10,359 |
$8,357 |
$11,837 |
$9,707 |
07/22 |
$11,049 |
$10,612 |
$8,534 |
$12,551 |
$10,017 |
08/22 |
$10,879 |
$10,313 |
$8,040 |
$12,247 |
$9,900 |
09/22 |
$10,361 |
$9,867 |
$7,525 |
$11,757 |
$9,299 |
10/22 |
$10,225 |
$9,739 |
$7,538 |
$12,095 |
$9,306 |
11/22 |
$10,631 |
$10,097 |
$7,994 |
$12,327 |
$9,953 |
12/22 |
$10,597 |
$10,052 |
$8,014 |
$12,234 |
$9,991 |
01/23 |
$11,023 |
$10,361 |
$8,298 |
$12,709 |
$10,302 |
02/23 |
$10,772 |
$10,093 |
$7,957 |
$12,545 |
$10,075 |
03/23 |
$10,948 |
$10,350 |
$8,312 |
$12,684 |
$10,215 |
04/23 |
$11,003 |
$10,412 |
$8,338 |
$12,806 |
$10,267 |
05/23 |
$10,894 |
$10,299 |
$8,093 |
$12,683 |
$10,176 |
06/23 |
$11,012 |
$10,262 |
$8,137 |
$12,888 |
$10,372 |
07/23 |
$11,105 |
$10,255 |
$8,205 |
$13,073 |
$10,539 |
08/23 |
$11,049 |
$10,189 |
$8,038 |
$13,112 |
$10,392 |
09/23 |
$10,882 |
$9,931 |
$7,717 |
$12,957 |
$10,099 |
10/23 |
$10,722 |
$9,774 |
$7,638 |
$12,795 |
$9,953 |
11/23 |
$11,233 |
$10,216 |
$8,093 |
$13,381 |
$10,529 |
12/23 |
$11,641 |
$10,608 |
$8,481 |
$13,875 |
$11,035 |
01/24 |
$11,666 |
$10,578 |
$8,273 |
$13,876 |
$10,905 |
02/24 |
$11,595 |
$10,429 |
$8,164 |
$13,914 |
$10,980 |
03/24 |
$11,695 |
$10,525 |
$8,191 |
$14,079 |
$11,189 |
04/24 |
$11,509 |
$10,259 |
$7,958 |
$13,937 |
$10,965 |
05/24 |
$11,686 |
$10,433 |
$8,022 |
$14,091 |
$11,164 |
06/24 |
$11,781 |
$10,532 |
$7,959 |
$14,223 |
$11,238 |
07/24 |
$12,025 |
$10,778 |
$8,226 |
$14,500 |
$11,443 |
08/24 |
$12,213 |
$10,933 |
$8,478 |
$14,734 |
$11,710 |
09/24 |
$12,363 |
$11,079 |
$8,644 |
$14,972 |
$11,920 |
10/24 |
$12,175 |
$10,805 |
$8,277 |
$14,887 |
$11,706 |
11/24 |
$12,315 |
$10,919 |
$8,267 |
$15,057 |
$11,845 |
12/24 |
$12,164 |
$10,740 |
$8,031 |
$14,991 |
$11,668 |
01/25 |
$12,260 |
$10,797 |
$8,066 |
$15,199 |
$11,811 |
02/25 |
$12,452 |
$11,035 |
$8,134 |
$15,300 |
$12,006 |
03/25 |
$12,419 |
$11,039 |
$8,217 |
$15,137 |
$11,941 |
04/25 |
$12,505 |
$11,082 |
$8,658 |
$15,137 |
$11,931 |
05/25 |
$12,534 |
$11,003 |
$8,626 |
$15,392 |
$12,033 |
06/25 |
$12,729 |
$11,172 |
$8,823 |
$15,676 |
$12,307 |
07/25 |
$12,701 |
$11,143 |
$8,579 |
$15,737 |
$12,452 |
08/25 |
$12,851 |
$11,276 |
$8,714 |
$15,933 |
$12,643 |
09/25 |
$12,921 |
$11,399 |
$8,753 |
$16,054 |
$12,847 |
10/25 |
$12,974 |
$11,470 |
$8,673 |
$16,085 |
$13,130 |
11/25 |
$13,033 |
$11,541 |
$8,672 |
$16,169 |
$13,169 |
12/25 |
$13,012 |
$11,524 |
$8,711 |
$16,273 |
$13,237 |
01/26 |
$13,036 |
$11,537 |
$8,853 |
$16,352 |
$13,311 |
02/26 |
$13,190 |
$11,726 |
$8,934 |
$16,382 |
$13,497 |
03/26 |
$12,989 |
$11,519 |
$8,558 |
$16,187 |
$13,086 |
04/26 |
$13,115 |
$11,532 |
$8,729 |
$16,461 |
$13,417 |
05/26 |
$13,182 |
$11,568 |
$8,767 |
$16,541 |
$13,527 |
06/26 |
$13,225 |
$11,596 |
$8,640 |
$16,578 |
$13,614 |
07/26 |
$13,112 |
$11,445 |
$8,633 |
$16,531 |
$13,404 |
08/26 |
$13,188 |
$11,489 |
$8,668 |
$16,692 |
$13,526 |
|
| Average Annual Return [Table Text Block] |
Table Summary
Average Annual Total Returns (%) |
1 year |
5 years |
10 years |
Class A (excluding sales charges) |
2.62 |
1.84 |
3.31 |
Class A (including sales charges) |
(2.24) |
0.85 |
2.81 |
Bloomberg U.S. Aggregate Bond Index |
1.89 |
(0.29) |
1.40 |
FTSE Non-U.S. World Government Bond (All Maturities) Index – Unhedged |
(0.54) |
(4.32) |
(1.42) |
ICE BofA US Cash Pay High Yield Constrained Index |
4.77 |
4.08 |
5.26 |
JPMorgan Emerging Markets Bond Index - Global |
6.99 |
2.09 |
3.07 | |
| No Deduction of Taxes [Text Block] |
Performance does not reflect the deduction of taxes that a shareholder may pay on fund distributions or on the redemptions of fund shares.
|
| Updated Performance Information Location [Text Block] |
columbiathreadneedleus.com/investment-products/mutual-funds
|
| AssetsNet |
$ 5,957,083,457
|
| Holdings Count | Holding |
1,262
|
| Advisory Fees Paid, Amount |
$ 32,956,876
|
| InvestmentCompanyPortfolioTurnover |
245.00%
|
| Additional Fund Statistics [Text Block] |
Table Summary
Fund net assets |
$5,957,083,457 |
Total number of portfolio holdings |
1,262 |
Management services fees (represents 0.55% of Fund average net assets) |
$32,956,876 |
Portfolio turnover for the reporting period |
245% |
Portfolio turnover as of the end of the period excluding transactions in to be announced securities |
59% | |
| Holdings [Text Block] |
Table Summary
|
Long |
Interest Rate Risk |
36.9% |
Credit Risk |
0.8% |
|
Short |
Interest Rate Risk |
29.5% |
Credit Risk |
2.8% |
Table Summary
Corporate Bonds & Notes |
35.6% |
Residential Mortgage-Backed Securities - Agency |
26.3% |
Senior Loans |
19.7% |
Foreign Government Obligations |
9.5% |
Asset-Backed Securities - Non-Agency |
8.9% |
Residential Mortgage-Backed Securities - Non-Agency |
8.2% |
Money Market Funds |
4.1% |
Other |
1.8% | |
| Material Fund Change [Text Block] |
|
| C000029360 |
|
| Shareholder Report [Line Items] |
|
| Fund Name |
Columbia Strategic Income Fund
|
| Class Name |
Class C
|
| Trading Symbol |
CLSCX
|
| Annual or Semi-Annual Statement [Text Block] |
This annual shareholder report contains important information about Columbia Strategic Income Fund (the Fund) for the period of September 1, 2025 to August 31, 2026.
|
| Additional Information [Text Block] |
You can find additional information about the Fund at columbiathreadneedleus.com/resources/literature. You can also request more information by contacting us at 1-800-345-6611.
|
| Additional Information Phone Number |
1-800-345-6611
|
| Additional Information Website |
columbiathreadneedleus.com/resources/literature
|
| Expenses [Text Block] |
What were the Fund costs for the reporting period? (Based on a hypothetical $10,000 investment)
Table Summary
Class |
Cost of a $10,000 investment |
Cost paid as a percentage of a $10,000 investment |
Class C |
$170 |
1.68% | |
| Expenses Paid, Amount |
$ 170
|
| Expense Ratio, Percent |
1.68%
|
| Factors Affecting Performance [Text Block] |
Management's Discussion of Fund Performance The performance of Class C shares for the period presented is shown in the Average Annual Total Returns table. Top Performance ContributorsHigh-yield corporate bonds | High-yield corporates were the largest contributor to the Fund’s relative performance during the period. Resilient issuer fundamentals and steady investor demand supported the sector, and its meaningful income advantage over Treasuries drove positive excess returns. The allocation added value relative to the benchmark, which has no exposure to below-investment-grade corporates. Emerging market debt | Emerging market debt was the second-largest contributor to relative performance during the period, supported by improving sovereign and corporate credit conditions and strong demand for higher-yielding assets. The Fund's overweight allocation to the sector added value relative to the benchmark. High-yield bank loans | Bank loans contributed positively to relative performance during the period, as elevated short-term interest rates and supportive credit conditions benefited the Fund's higher-income, floating-rate holdings. The allocation added value relative to the benchmark, which does not hold these securities. Top Performance DetractorsAgency mortgage-backed securities | Agency mortgage-backed-securities (MBS) detracted most from the Fund’s performance relative to the benchmark, driven by the Fund's inverse interest-only (IIO) holdings, which are not held in the benchmark. Coupons on these securities move inversely to short-term rates, and they were pressured as the market repriced from expecting Federal Reserve rate cuts to the possibility of hikes. Agency MBS still contributed positively to absolute return. Interest rate positioning | Interest rate positioning detracted from relative performance during the period, as yield curve positioning and implementation costs associated with the Fund’s interest rate derivatives weighed on relative results. Overall, interest rate factors still contributed positively to absolute return, as income from higher starting yields outweighed the price impact of rising Treasury yields. Investment-grade corporate bonds | The Fund’s underweight allocation to investment-grade corporates detracted from relative performance, as the sector continued to generate positive returns despite historically tight spreads. The allocation also contributed positively to absolute return. |
| Performance Past Does Not Indicate Future [Text] |
The Fund's past performance is not a good predictor of the Fund's future performance.
|
| Line Graph [Table Text Block] |
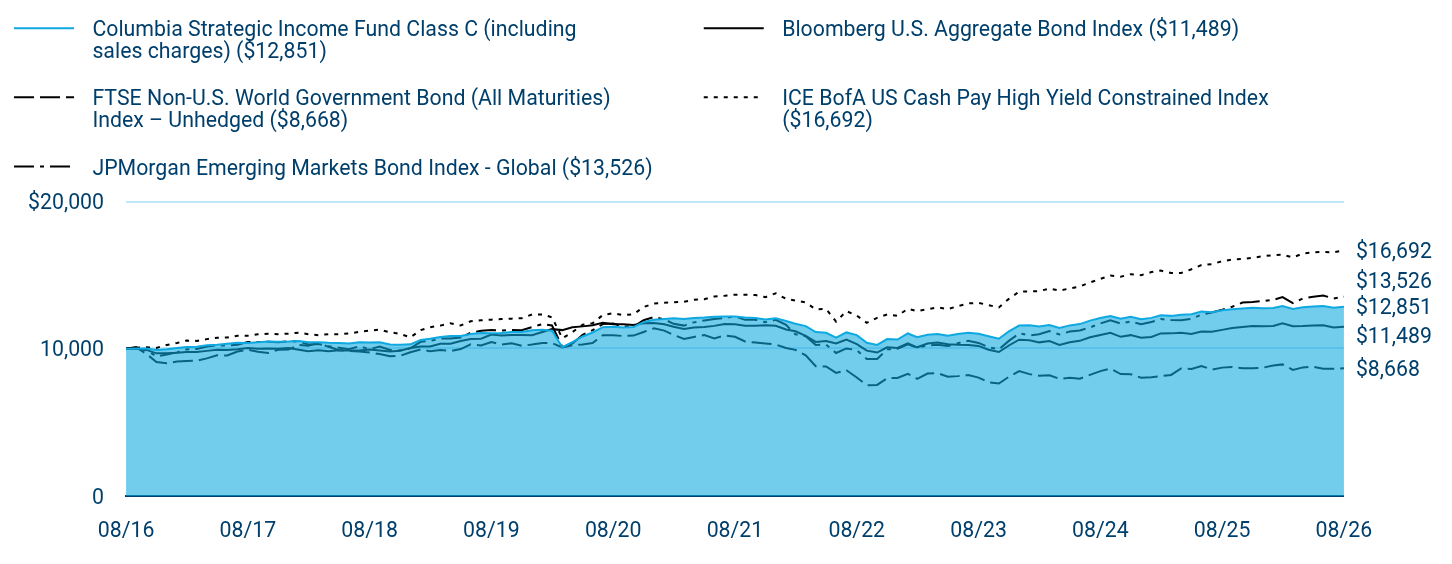
Table Summary
|
Columbia Strategic Income Fund Class C (including sales charges) ($12,851) |
Bloomberg U.S. Aggregate Bond Index ($11,489) |
FTSE Non-U.S. World Government Bond (All Maturities) Index – Unhedged ($8,668) |
ICE BofA US Cash Pay High Yield Constrained Index ($16,692) |
JPMorgan Emerging Markets Bond Index - Global ($13,526) |
08/16 |
$10,000 |
$10,000 |
$10,000 |
$10,000 |
$10,000 |
09/16 |
$10,017 |
$9,994 |
$10,104 |
$10,065 |
$10,034 |
10/16 |
$10,011 |
$9,918 |
$9,642 |
$10,095 |
$9,887 |
11/16 |
$9,906 |
$9,683 |
$9,097 |
$10,055 |
$9,475 |
12/16 |
$9,960 |
$9,697 |
$9,009 |
$10,252 |
$9,611 |
01/17 |
$10,045 |
$9,716 |
$9,137 |
$10,389 |
$9,749 |
02/17 |
$10,112 |
$9,781 |
$9,168 |
$10,552 |
$9,952 |
03/17 |
$10,127 |
$9,776 |
$9,191 |
$10,529 |
$9,986 |
04/17 |
$10,229 |
$9,851 |
$9,340 |
$10,648 |
$10,149 |
05/17 |
$10,262 |
$9,927 |
$9,553 |
$10,745 |
$10,233 |
06/17 |
$10,327 |
$9,917 |
$9,541 |
$10,756 |
$10,207 |
07/17 |
$10,409 |
$9,960 |
$9,803 |
$10,880 |
$10,274 |
08/17 |
$10,389 |
$10,049 |
$9,924 |
$10,878 |
$10,452 |
09/17 |
$10,444 |
$10,001 |
$9,786 |
$10,976 |
$10,450 |
10/17 |
$10,482 |
$10,007 |
$9,713 |
$11,018 |
$10,469 |
11/17 |
$10,469 |
$9,994 |
$9,931 |
$10,987 |
$10,441 |
12/17 |
$10,488 |
$10,040 |
$9,940 |
$11,019 |
$10,507 |
01/18 |
$10,527 |
$9,925 |
$10,258 |
$11,089 |
$10,487 |
02/18 |
$10,444 |
$9,830 |
$10,192 |
$10,984 |
$10,281 |
03/18 |
$10,431 |
$9,894 |
$10,379 |
$10,915 |
$10,320 |
04/18 |
$10,400 |
$9,820 |
$10,126 |
$10,988 |
$10,169 |
05/18 |
$10,386 |
$9,890 |
$9,893 |
$10,986 |
$10,059 |
06/18 |
$10,355 |
$9,878 |
$9,848 |
$11,025 |
$9,957 |
07/18 |
$10,430 |
$9,880 |
$9,809 |
$11,149 |
$10,163 |
08/18 |
$10,418 |
$9,944 |
$9,737 |
$11,229 |
$9,967 |
09/18 |
$10,442 |
$9,880 |
$9,633 |
$11,294 |
$10,144 |
10/18 |
$10,290 |
$9,802 |
$9,493 |
$11,109 |
$9,917 |
11/18 |
$10,266 |
$9,860 |
$9,517 |
$11,010 |
$9,878 |
12/18 |
$10,293 |
$10,041 |
$9,759 |
$10,769 |
$10,023 |
01/19 |
$10,590 |
$10,148 |
$9,950 |
$11,264 |
$10,465 |
02/19 |
$10,673 |
$10,142 |
$9,820 |
$11,454 |
$10,531 |
03/19 |
$10,791 |
$10,337 |
$9,907 |
$11,566 |
$10,684 |
04/19 |
$10,855 |
$10,339 |
$9,844 |
$11,728 |
$10,696 |
05/19 |
$10,865 |
$10,523 |
$9,976 |
$11,579 |
$10,758 |
06/19 |
$11,002 |
$10,655 |
$10,296 |
$11,863 |
$11,085 |
07/19 |
$11,067 |
$10,679 |
$10,224 |
$11,924 |
$11,213 |
08/19 |
$11,039 |
$10,955 |
$10,451 |
$11,972 |
$11,274 |
09/19 |
$11,068 |
$10,897 |
$10,285 |
$12,009 |
$11,233 |
10/19 |
$11,132 |
$10,930 |
$10,371 |
$12,038 |
$11,275 |
11/19 |
$11,140 |
$10,924 |
$10,193 |
$12,070 |
$11,257 |
12/19 |
$11,257 |
$10,917 |
$10,278 |
$12,320 |
$11,468 |
01/20 |
$11,282 |
$11,127 |
$10,390 |
$12,321 |
$11,667 |
02/20 |
$11,214 |
$11,327 |
$10,384 |
$12,131 |
$11,573 |
03/20 |
$10,103 |
$11,260 |
$10,084 |
$10,709 |
$10,120 |
04/20 |
$10,447 |
$11,460 |
$10,237 |
$11,116 |
$10,342 |
05/20 |
$10,829 |
$11,514 |
$10,286 |
$11,621 |
$10,935 |
06/20 |
$11,099 |
$11,586 |
$10,385 |
$11,729 |
$11,254 |
07/20 |
$11,463 |
$11,759 |
$10,916 |
$12,286 |
$11,670 |
08/20 |
$11,488 |
$11,665 |
$10,907 |
$12,409 |
$11,704 |
09/20 |
$11,432 |
$11,658 |
$10,861 |
$12,281 |
$11,511 |
10/20 |
$11,474 |
$11,606 |
$10,889 |
$12,337 |
$11,497 |
11/20 |
$11,802 |
$11,720 |
$11,135 |
$12,826 |
$11,928 |
12/20 |
$11,969 |
$11,736 |
$11,385 |
$13,072 |
$12,142 |
01/21 |
$12,020 |
$11,652 |
$11,225 |
$13,114 |
$11,995 |
02/21 |
$12,067 |
$11,484 |
$10,938 |
$13,157 |
$11,687 |
03/21 |
$12,023 |
$11,340 |
$10,654 |
$13,179 |
$11,566 |
04/21 |
$12,079 |
$11,430 |
$10,799 |
$13,323 |
$11,787 |
05/21 |
$12,116 |
$11,467 |
$10,932 |
$13,359 |
$11,915 |
06/21 |
$12,168 |
$11,548 |
$10,702 |
$13,540 |
$12,021 |
07/21 |
$12,176 |
$11,677 |
$10,900 |
$13,590 |
$12,086 |
08/21 |
$12,178 |
$11,655 |
$10,809 |
$13,665 |
$12,196 |
09/21 |
$12,120 |
$11,554 |
$10,491 |
$13,668 |
$11,957 |
10/21 |
$12,081 |
$11,551 |
$10,418 |
$13,644 |
$11,964 |
11/21 |
$11,989 |
$11,585 |
$10,353 |
$13,502 |
$11,791 |
12/21 |
$12,067 |
$11,555 |
$10,284 |
$13,761 |
$11,959 |
01/22 |
$11,875 |
$11,306 |
$10,048 |
$13,384 |
$11,613 |
02/22 |
$11,698 |
$11,180 |
$9,920 |
$13,262 |
$10,974 |
03/22 |
$11,531 |
$10,869 |
$9,551 |
$13,141 |
$10,851 |
04/22 |
$11,132 |
$10,457 |
$8,806 |
$12,663 |
$10,257 |
05/22 |
$11,081 |
$10,524 |
$8,789 |
$12,700 |
$10,276 |
06/22 |
$10,753 |
$10,359 |
$8,357 |
$11,837 |
$9,707 |
07/22 |
$11,104 |
$10,612 |
$8,534 |
$12,551 |
$10,017 |
08/22 |
$10,922 |
$10,313 |
$8,040 |
$12,247 |
$9,900 |
09/22 |
$10,400 |
$9,867 |
$7,525 |
$11,757 |
$9,299 |
10/22 |
$10,252 |
$9,739 |
$7,538 |
$12,095 |
$9,306 |
11/22 |
$10,653 |
$10,097 |
$7,994 |
$12,327 |
$9,953 |
12/22 |
$10,617 |
$10,052 |
$8,014 |
$12,234 |
$9,991 |
01/23 |
$11,032 |
$10,361 |
$8,298 |
$12,709 |
$10,302 |
02/23 |
$10,774 |
$10,093 |
$7,957 |
$12,545 |
$10,075 |
03/23 |
$10,944 |
$10,350 |
$8,312 |
$12,684 |
$10,215 |
04/23 |
$10,998 |
$10,412 |
$8,338 |
$12,806 |
$10,267 |
05/23 |
$10,876 |
$10,299 |
$8,093 |
$12,683 |
$10,176 |
06/23 |
$10,993 |
$10,262 |
$8,137 |
$12,888 |
$10,372 |
07/23 |
$11,079 |
$10,255 |
$8,205 |
$13,073 |
$10,539 |
08/23 |
$11,011 |
$10,189 |
$8,038 |
$13,112 |
$10,392 |
09/23 |
$10,838 |
$9,931 |
$7,717 |
$12,957 |
$10,099 |
10/23 |
$10,672 |
$9,774 |
$7,638 |
$12,795 |
$9,953 |
11/23 |
$11,173 |
$10,216 |
$8,093 |
$13,381 |
$10,529 |
12/23 |
$11,572 |
$10,608 |
$8,481 |
$13,875 |
$11,035 |
01/24 |
$11,590 |
$10,578 |
$8,273 |
$13,876 |
$10,905 |
02/24 |
$11,512 |
$10,429 |
$8,164 |
$13,914 |
$10,980 |
03/24 |
$11,605 |
$10,525 |
$8,191 |
$14,079 |
$11,189 |
04/24 |
$11,413 |
$10,259 |
$7,958 |
$13,937 |
$10,965 |
05/24 |
$11,581 |
$10,433 |
$8,022 |
$14,091 |
$11,164 |
06/24 |
$11,669 |
$10,532 |
$7,959 |
$14,223 |
$11,238 |
07/24 |
$11,903 |
$10,778 |
$8,226 |
$14,500 |
$11,443 |
08/24 |
$12,082 |
$10,933 |
$8,478 |
$14,734 |
$11,710 |
09/24 |
$12,223 |
$11,079 |
$8,644 |
$14,972 |
$11,920 |
10/24 |
$12,029 |
$10,805 |
$8,277 |
$14,887 |
$11,706 |
11/24 |
$12,161 |
$10,919 |
$8,267 |
$15,057 |
$11,845 |
12/24 |
$12,004 |
$10,740 |
$8,031 |
$14,991 |
$11,668 |
01/25 |
$12,091 |
$10,797 |
$8,066 |
$15,199 |
$11,811 |
02/25 |
$12,268 |
$11,035 |
$8,134 |
$15,300 |
$12,006 |
03/25 |
$12,227 |
$11,039 |
$8,217 |
$15,137 |
$11,941 |
04/25 |
$12,310 |
$11,082 |
$8,658 |
$15,137 |
$11,931 |
05/25 |
$12,331 |
$11,003 |
$8,626 |
$15,392 |
$12,033 |
06/25 |
$12,516 |
$11,172 |
$8,823 |
$15,676 |
$12,307 |
07/25 |
$12,475 |
$11,143 |
$8,579 |
$15,737 |
$12,452 |
08/25 |
$12,615 |
$11,276 |
$8,714 |
$15,933 |
$12,643 |
09/25 |
$12,682 |
$11,399 |
$8,753 |
$16,054 |
$12,847 |
10/25 |
$12,725 |
$11,470 |
$8,673 |
$16,085 |
$13,130 |
11/25 |
$12,770 |
$11,541 |
$8,672 |
$16,169 |
$13,169 |
12/25 |
$12,742 |
$11,524 |
$8,711 |
$16,273 |
$13,237 |
01/26 |
$12,757 |
$11,537 |
$8,853 |
$16,352 |
$13,311 |
02/26 |
$12,901 |
$11,726 |
$8,934 |
$16,382 |
$13,497 |
03/26 |
$12,695 |
$11,519 |
$8,558 |
$16,187 |
$13,086 |
04/26 |
$12,811 |
$11,532 |
$8,729 |
$16,461 |
$13,417 |
05/26 |
$12,869 |
$11,568 |
$8,767 |
$16,541 |
$13,527 |
06/26 |
$12,903 |
$11,596 |
$8,640 |
$16,578 |
$13,614 |
07/26 |
$12,785 |
$11,445 |
$8,633 |
$16,531 |
$13,404 |
08/26 |
$12,851 |
$11,489 |
$8,668 |
$16,692 |
$13,526 |
|
| Average Annual Return [Table Text Block] |
Table Summary
Average Annual Total Returns (%) |
1 year |
5 years |
10 years |
Class C (excluding sales charges) |
1.87 |
1.08 |
2.54 |
Class C (including sales charges) |
0.89 |
1.08 |
2.54 |
Bloomberg U.S. Aggregate Bond Index |
1.89 |
(0.29) |
1.40 |
FTSE Non-U.S. World Government Bond (All Maturities) Index – Unhedged |
(0.54) |
(4.32) |
(1.42) |
ICE BofA US Cash Pay High Yield Constrained Index |
4.77 |
4.08 |
5.26 |
JPMorgan Emerging Markets Bond Index - Global |
6.99 |
2.09 |
3.07 | |
| No Deduction of Taxes [Text Block] |
Performance does not reflect the deduction of taxes that a shareholder may pay on fund distributions or on the redemptions of fund shares.
|
| Updated Performance Information Location [Text Block] |
columbiathreadneedleus.com/investment-products/mutual-funds
|
| AssetsNet |
$ 5,957,083,457
|
| Holdings Count | Holding |
1,262
|
| Advisory Fees Paid, Amount |
$ 32,956,876
|
| InvestmentCompanyPortfolioTurnover |
245.00%
|
| Additional Fund Statistics [Text Block] |
Table Summary
Fund net assets |
$5,957,083,457 |
Total number of portfolio holdings |
1,262 |
Management services fees (represents 0.55% of Fund average net assets) |
$32,956,876 |
Portfolio turnover for the reporting period |
245% |
Portfolio turnover as of the end of the period excluding transactions in to be announced securities |
59% | |
| Holdings [Text Block] |
Table Summary
|
Long |
Interest Rate Risk |
36.9% |
Credit Risk |
0.8% |
|
Short |
Interest Rate Risk |
29.5% |
Credit Risk |
2.8% |
Table Summary
Corporate Bonds & Notes |
35.6% |
Residential Mortgage-Backed Securities - Agency |
26.3% |
Senior Loans |
19.7% |
Foreign Government Obligations |
9.5% |
Asset-Backed Securities - Non-Agency |
8.9% |
Residential Mortgage-Backed Securities - Non-Agency |
8.2% |
Money Market Funds |
4.1% |
Other |
1.8% | |
| Material Fund Change [Text Block] |
|
| C000029362 |
|
| Shareholder Report [Line Items] |
|
| Fund Name |
Columbia Strategic Income Fund
|
| Class Name |
Institutional Class
|
| Trading Symbol |
LSIZX
|
| Annual or Semi-Annual Statement [Text Block] |
This annual shareholder report contains important information about Columbia Strategic Income Fund (the Fund) for the period of September 1, 2025 to August 31, 2026.
|
| Additional Information [Text Block] |
You can find additional information about the Fund at columbiathreadneedleus.com/resources/literature. You can also request more information by contacting us at 1-800-345-6611.
|
| Additional Information Phone Number |
1-800-345-6611
|
| Additional Information Website |
columbiathreadneedleus.com/resources/literature
|
| Expenses [Text Block] |
What were the Fund costs for the reporting period? (Based on a hypothetical $10,000 investment)
Table Summary
Class |
Cost of a $10,000 investment |
Cost paid as a percentage of a $10,000 investment |
Institutional Class |
$69 |
0.68% | |
| Expenses Paid, Amount |
$ 69
|
| Expense Ratio, Percent |
0.68%
|
| Factors Affecting Performance [Text Block] |
Management's Discussion of Fund Performance The performance of Institutional Class shares for the period presented is shown in the Average Annual Total Returns table. Top Performance ContributorsHigh-yield corporate bonds | High-yield corporates were the largest contributor to the Fund’s relative performance during the period. Resilient issuer fundamentals and steady investor demand supported the sector, and its meaningful income advantage over Treasuries drove positive excess returns. The allocation added value relative to the benchmark, which has no exposure to below-investment-grade corporates. Emerging market debt | Emerging market debt was the second-largest contributor to relative performance during the period, supported by improving sovereign and corporate credit conditions and strong demand for higher-yielding assets. The Fund's overweight allocation to the sector added value relative to the benchmark. High-yield bank loans | Bank loans contributed positively to relative performance during the period, as elevated short-term interest rates and supportive credit conditions benefited the Fund's higher-income, floating-rate holdings. The allocation added value relative to the benchmark, which does not hold these securities. Top Performance DetractorsAgency mortgage-backed securities | Agency mortgage-backed-securities (MBS) detracted most from the Fund’s performance relative to the benchmark, driven by the Fund's inverse interest-only (IIO) holdings, which are not held in the benchmark. Coupons on these securities move inversely to short-term rates, and they were pressured as the market repriced from expecting Federal Reserve rate cuts to the possibility of hikes. Agency MBS still contributed positively to absolute return. Interest rate positioning | Interest rate positioning detracted from relative performance during the period, as yield curve positioning and implementation costs associated with the Fund’s interest rate derivatives weighed on relative results. Overall, interest rate factors still contributed positively to absolute return, as income from higher starting yields outweighed the price impact of rising Treasury yields. Investment-grade corporate bonds | The Fund’s underweight allocation to investment-grade corporates detracted from relative performance, as the sector continued to generate positive returns despite historically tight spreads. The allocation also contributed positively to absolute return. |
| Performance Past Does Not Indicate Future [Text] |
The Fund's past performance is not a good predictor of the Fund's future performance.
|
| Line Graph [Table Text Block] |
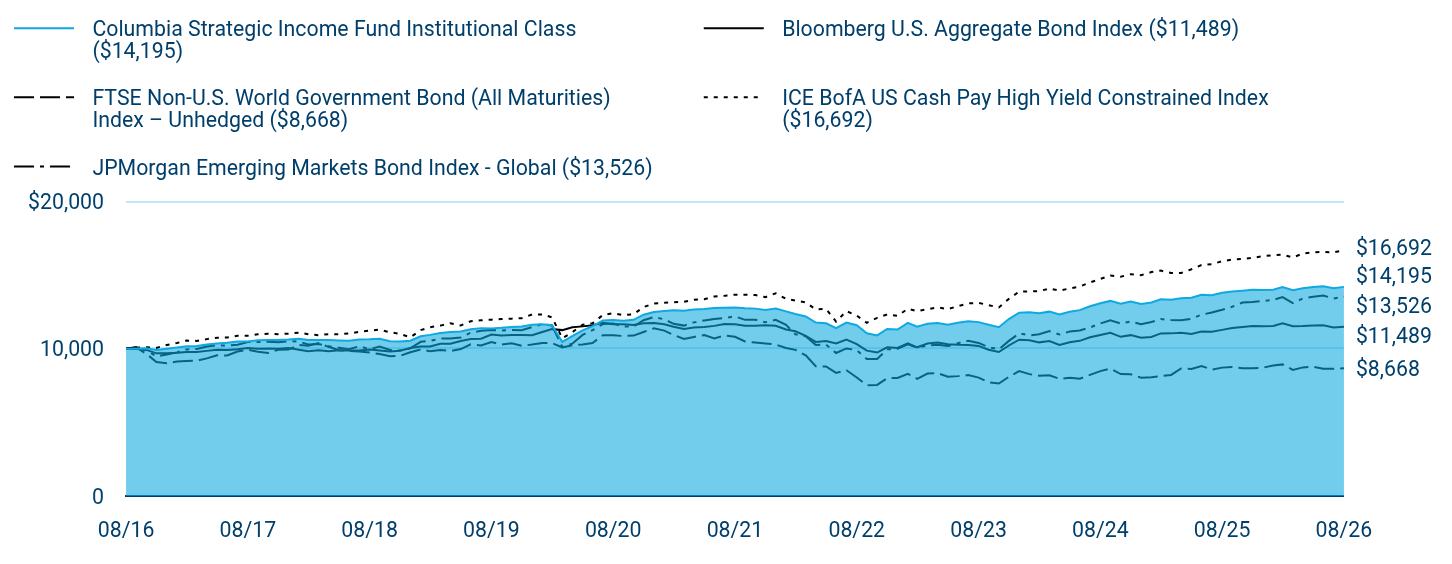
Table Summary
|
Columbia Strategic Income Fund Institutional Class ($14,195) |
Bloomberg U.S. Aggregate Bond Index ($11,489) |
FTSE Non-U.S. World Government Bond (All Maturities) Index – Unhedged ($8,668) |
ICE BofA US Cash Pay High Yield Constrained Index ($16,692) |
JPMorgan Emerging Markets Bond Index - Global ($13,526) |
08/16 |
$10,000 |
$10,000 |
$10,000 |
$10,000 |
$10,000 |
09/16 |
$10,009 |
$9,994 |
$10,104 |
$10,065 |
$10,034 |
10/16 |
$10,028 |
$9,918 |
$9,642 |
$10,095 |
$9,887 |
11/16 |
$9,912 |
$9,683 |
$9,097 |
$10,055 |
$9,475 |
12/16 |
$9,993 |
$9,697 |
$9,009 |
$10,252 |
$9,611 |
01/17 |
$10,088 |
$9,716 |
$9,137 |
$10,389 |
$9,749 |
02/17 |
$10,164 |
$9,781 |
$9,168 |
$10,552 |
$9,952 |
03/17 |
$10,189 |
$9,776 |
$9,191 |
$10,529 |
$9,986 |
04/17 |
$10,284 |
$9,851 |
$9,340 |
$10,648 |
$10,149 |
05/17 |
$10,344 |
$9,927 |
$9,553 |
$10,745 |
$10,233 |
06/17 |
$10,402 |
$9,917 |
$9,541 |
$10,756 |
$10,207 |
07/17 |
$10,494 |
$9,960 |
$9,803 |
$10,880 |
$10,274 |
08/17 |
$10,483 |
$10,049 |
$9,924 |
$10,878 |
$10,452 |
09/17 |
$10,565 |
$10,001 |
$9,786 |
$10,976 |
$10,450 |
10/17 |
$10,596 |
$10,007 |
$9,713 |
$11,018 |
$10,469 |
11/17 |
$10,591 |
$9,994 |
$9,931 |
$10,987 |
$10,441 |
12/17 |
$10,620 |
$10,040 |
$9,940 |
$11,019 |
$10,507 |
01/18 |
$10,668 |
$9,925 |
$10,258 |
$11,089 |
$10,487 |
02/18 |
$10,591 |
$9,830 |
$10,192 |
$10,984 |
$10,281 |
03/18 |
$10,587 |
$9,894 |
$10,379 |
$10,915 |
$10,320 |
04/18 |
$10,582 |
$9,820 |
$10,126 |
$10,988 |
$10,169 |
05/18 |
$10,559 |
$9,890 |
$9,893 |
$10,986 |
$10,059 |
06/18 |
$10,535 |
$9,878 |
$9,848 |
$11,025 |
$9,957 |
07/18 |
$10,621 |
$9,880 |
$9,809 |
$11,149 |
$10,163 |
08/18 |
$10,637 |
$9,944 |
$9,737 |
$11,229 |
$9,967 |
09/18 |
$10,670 |
$9,880 |
$9,633 |
$11,294 |
$10,144 |
10/18 |
$10,503 |
$9,802 |
$9,493 |
$11,109 |
$9,917 |
11/18 |
$10,487 |
$9,860 |
$9,517 |
$11,010 |
$9,878 |
12/18 |
$10,542 |
$10,041 |
$9,759 |
$10,769 |
$10,023 |
01/19 |
$10,843 |
$10,148 |
$9,950 |
$11,264 |
$10,465 |
02/19 |
$10,937 |
$10,142 |
$9,820 |
$11,454 |
$10,531 |
03/19 |
$11,069 |
$10,337 |
$9,907 |
$11,566 |
$10,684 |
04/19 |
$11,127 |
$10,339 |
$9,844 |
$11,728 |
$10,696 |
05/19 |
$11,165 |
$10,523 |
$9,976 |
$11,579 |
$10,758 |
06/19 |
$11,318 |
$10,655 |
$10,296 |
$11,863 |
$11,085 |
07/19 |
$11,395 |
$10,679 |
$10,224 |
$11,924 |
$11,213 |
08/19 |
$11,376 |
$10,955 |
$10,451 |
$11,972 |
$11,274 |
09/19 |
$11,415 |
$10,897 |
$10,285 |
$12,009 |
$11,233 |
10/19 |
$11,474 |
$10,930 |
$10,371 |
$12,038 |
$11,275 |
11/19 |
$11,511 |
$10,924 |
$10,193 |
$12,070 |
$11,257 |
12/19 |
$11,625 |
$10,917 |
$10,278 |
$12,320 |
$11,468 |
01/20 |
$11,660 |
$11,127 |
$10,390 |
$12,321 |
$11,667 |
02/20 |
$11,598 |
$11,327 |
$10,384 |
$12,131 |
$11,573 |
03/20 |
$10,457 |
$11,260 |
$10,084 |
$10,709 |
$10,120 |
04/20 |
$10,848 |
$11,460 |
$10,237 |
$11,116 |
$10,342 |
05/20 |
$11,241 |
$11,514 |
$10,286 |
$11,621 |
$10,935 |
06/20 |
$11,536 |
$11,586 |
$10,385 |
$11,729 |
$11,254 |
07/20 |
$11,911 |
$11,759 |
$10,916 |
$12,286 |
$11,670 |
08/20 |
$11,947 |
$11,665 |
$10,907 |
$12,409 |
$11,704 |
09/20 |
$11,903 |
$11,658 |
$10,861 |
$12,281 |
$11,511 |
10/20 |
$11,958 |
$11,606 |
$10,889 |
$12,337 |
$11,497 |
11/20 |
$12,306 |
$11,720 |
$11,135 |
$12,826 |
$11,928 |
12/20 |
$12,489 |
$11,736 |
$11,385 |
$13,072 |
$12,142 |
01/21 |
$12,554 |
$11,652 |
$11,225 |
$13,114 |
$11,995 |
02/21 |
$12,613 |
$11,484 |
$10,938 |
$13,157 |
$11,687 |
03/21 |
$12,582 |
$11,340 |
$10,654 |
$13,179 |
$11,566 |
04/21 |
$12,653 |
$11,430 |
$10,799 |
$13,323 |
$11,787 |
05/21 |
$12,698 |
$11,467 |
$10,932 |
$13,359 |
$11,915 |
06/21 |
$12,764 |
$11,548 |
$10,702 |
$13,540 |
$12,021 |
07/21 |
$12,783 |
$11,677 |
$10,900 |
$13,590 |
$12,086 |
08/21 |
$12,796 |
$11,655 |
$10,809 |
$13,665 |
$12,196 |
09/21 |
$12,745 |
$11,554 |
$10,491 |
$13,668 |
$11,957 |
10/21 |
$12,719 |
$11,551 |
$10,418 |
$13,644 |
$11,964 |
11/21 |
$12,631 |
$11,585 |
$10,353 |
$13,502 |
$11,791 |
12/21 |
$12,720 |
$11,555 |
$10,284 |
$13,761 |
$11,959 |
01/22 |
$12,530 |
$11,306 |
$10,048 |
$13,384 |
$11,613 |
02/22 |
$12,349 |
$11,180 |
$9,920 |
$13,262 |
$10,974 |
03/22 |
$12,185 |
$10,869 |
$9,551 |
$13,141 |
$10,851 |
04/22 |
$11,776 |
$10,457 |
$8,806 |
$12,663 |
$10,257 |
05/22 |
$11,725 |
$10,524 |
$8,789 |
$12,700 |
$10,276 |
06/22 |
$11,392 |
$10,359 |
$8,357 |
$11,837 |
$9,707 |
07/22 |
$11,770 |
$10,612 |
$8,534 |
$12,551 |
$10,017 |
08/22 |
$11,594 |
$10,313 |
$8,040 |
$12,247 |
$9,900 |
09/22 |
$11,044 |
$9,867 |
$7,525 |
$11,757 |
$9,299 |
10/22 |
$10,899 |
$9,739 |
$7,538 |
$12,095 |
$9,306 |
11/22 |
$11,337 |
$10,097 |
$7,994 |
$12,327 |
$9,953 |
12/22 |
$11,302 |
$10,052 |
$8,014 |
$12,234 |
$9,991 |
01/23 |
$11,757 |
$10,361 |
$8,298 |
$12,709 |
$10,302 |
02/23 |
$11,491 |
$10,093 |
$7,957 |
$12,545 |
$10,075 |
03/23 |
$11,686 |
$10,350 |
$8,312 |
$12,684 |
$10,215 |
04/23 |
$11,749 |
$10,412 |
$8,338 |
$12,806 |
$10,267 |
05/23 |
$11,627 |
$10,299 |
$8,093 |
$12,683 |
$10,176 |
06/23 |
$11,763 |
$10,262 |
$8,137 |
$12,888 |
$10,372 |
07/23 |
$11,862 |
$10,255 |
$8,205 |
$13,073 |
$10,539 |
08/23 |
$11,803 |
$10,189 |
$8,038 |
$13,112 |
$10,392 |
09/23 |
$11,629 |
$9,931 |
$7,717 |
$12,957 |
$10,099 |
10/23 |
$11,457 |
$9,774 |
$7,638 |
$12,795 |
$9,953 |
11/23 |
$12,011 |
$10,216 |
$8,093 |
$13,381 |
$10,529 |
12/23 |
$12,447 |
$10,608 |
$8,481 |
$13,875 |
$11,035 |
01/24 |
$12,477 |
$10,578 |
$8,273 |
$13,876 |
$10,905 |
02/24 |
$12,402 |
$10,429 |
$8,164 |
$13,914 |
$10,980 |
03/24 |
$12,514 |
$10,525 |
$8,191 |
$14,079 |
$11,189 |
04/24 |
$12,320 |
$10,259 |
$7,958 |
$13,937 |
$10,965 |
05/24 |
$12,509 |
$10,433 |
$8,022 |
$14,091 |
$11,164 |
06/24 |
$12,616 |
$10,532 |
$7,959 |
$14,223 |
$11,238 |
07/24 |
$12,879 |
$10,778 |
$8,226 |
$14,500 |
$11,443 |
08/24 |
$13,082 |
$10,933 |
$8,478 |
$14,734 |
$11,710 |
09/24 |
$13,243 |
$11,079 |
$8,644 |
$14,972 |
$11,920 |
10/24 |
$13,046 |
$10,805 |
$8,277 |
$14,887 |
$11,706 |
11/24 |
$13,202 |
$10,919 |
$8,267 |
$15,057 |
$11,845 |
12/24 |
$13,040 |
$10,740 |
$8,031 |
$14,991 |
$11,668 |
01/25 |
$13,141 |
$10,797 |
$8,066 |
$15,199 |
$11,811 |
02/25 |
$13,354 |
$11,035 |
$8,134 |
$15,300 |
$12,006 |
03/25 |
$13,320 |
$11,039 |
$8,217 |
$15,137 |
$11,941 |
04/25 |
$13,417 |
$11,082 |
$8,658 |
$15,137 |
$11,931 |
05/25 |
$13,452 |
$11,003 |
$8,626 |
$15,392 |
$12,033 |
06/25 |
$13,663 |
$11,172 |
$8,823 |
$15,676 |
$12,307 |
07/25 |
$13,635 |
$11,143 |
$8,579 |
$15,737 |
$12,452 |
08/25 |
$13,797 |
$11,276 |
$8,714 |
$15,933 |
$12,643 |
09/25 |
$13,876 |
$11,399 |
$8,753 |
$16,054 |
$12,847 |
10/25 |
$13,937 |
$11,470 |
$8,673 |
$16,085 |
$13,130 |
11/25 |
$13,998 |
$11,541 |
$8,672 |
$16,169 |
$13,169 |
12/25 |
$13,979 |
$11,524 |
$8,711 |
$16,273 |
$13,237 |
01/26 |
$14,008 |
$11,537 |
$8,853 |
$16,352 |
$13,311 |
02/26 |
$14,180 |
$11,726 |
$8,934 |
$16,382 |
$13,497 |
03/26 |
$13,968 |
$11,519 |
$8,558 |
$16,187 |
$13,086 |
04/26 |
$14,103 |
$11,532 |
$8,729 |
$16,461 |
$13,417 |
05/26 |
$14,180 |
$11,568 |
$8,767 |
$16,541 |
$13,527 |
06/26 |
$14,230 |
$11,596 |
$8,640 |
$16,578 |
$13,614 |
07/26 |
$14,109 |
$11,445 |
$8,633 |
$16,531 |
$13,404 |
08/26 |
$14,195 |
$11,489 |
$8,668 |
$16,692 |
$13,526 |
|
| Average Annual Return [Table Text Block] |
Table Summary
Average Annual Total Returns (%) |
1 year |
5 years |
10 years |
Institutional Class |
2.89 |
2.10 |
3.57 |
Bloomberg U.S. Aggregate Bond Index |
1.89 |
(0.29) |
1.40 |
FTSE Non-U.S. World Government Bond (All Maturities) Index – Unhedged |
(0.54) |
(4.32) |
(1.42) |
ICE BofA US Cash Pay High Yield Constrained Index |
4.77 |
4.08 |
5.26 |
JPMorgan Emerging Markets Bond Index - Global |
6.99 |
2.09 |
3.07 | |
| No Deduction of Taxes [Text Block] |
Performance does not reflect the deduction of taxes that a shareholder may pay on fund distributions or on the redemptions of fund shares.
|
| Updated Performance Information Location [Text Block] |
columbiathreadneedleus.com/investment-products/mutual-funds
|
| AssetsNet |
$ 5,957,083,457
|
| Holdings Count | Holding |
1,262
|
| Advisory Fees Paid, Amount |
$ 32,956,876
|
| InvestmentCompanyPortfolioTurnover |
245.00%
|
| Additional Fund Statistics [Text Block] |
Table Summary
Fund net assets |
$5,957,083,457 |
Total number of portfolio holdings |
1,262 |
Management services fees (represents 0.55% of Fund average net assets) |
$32,956,876 |
Portfolio turnover for the reporting period |
245% |
Portfolio turnover as of the end of the period excluding transactions in to be announced securities |
59% | |
| Holdings [Text Block] |
Table Summary
|
Long |
Interest Rate Risk |
36.9% |
Credit Risk |
0.8% |
|
Short |
Interest Rate Risk |
29.5% |
Credit Risk |
2.8% |
Table Summary
Corporate Bonds & Notes |
35.6% |
Residential Mortgage-Backed Securities - Agency |
26.3% |
Senior Loans |
19.7% |
Foreign Government Obligations |
9.5% |
Asset-Backed Securities - Non-Agency |
8.9% |
Residential Mortgage-Backed Securities - Non-Agency |
8.2% |
Money Market Funds |
4.1% |
Other |
1.8% | |
| Material Fund Change [Text Block] |
|
| C000094663 |
|
| Shareholder Report [Line Items] |
|
| Fund Name |
Columbia Strategic Income Fund
|
| Class Name |
Institutional 2 Class
|
| Trading Symbol |
CTIVX
|
| Annual or Semi-Annual Statement [Text Block] |
This annual shareholder report contains important information about Columbia Strategic Income Fund (the Fund) for the period of September 1, 2025 to August 31, 2026.
|
| Additional Information [Text Block] |
You can find additional information about the Fund at columbiathreadneedleus.com/resources/literature. You can also request more information by contacting us at 1-800-345-6611.
|
| Additional Information Phone Number |
1-800-345-6611
|
| Additional Information Website |
columbiathreadneedleus.com/resources/literature
|
| Expenses [Text Block] |
What were the Fund costs for the reporting period? (Based on a hypothetical $10,000 investment)
Table Summary
Class |
Cost of a $10,000 investment |
Cost paid as a percentage of a $10,000 investment |
Institutional 2 Class |
$65 |
0.64% | |
| Expenses Paid, Amount |
$ 65
|
| Expense Ratio, Percent |
0.64%
|
| Factors Affecting Performance [Text Block] |
Management's Discussion of Fund Performance The performance of Institutional 2 Class shares for the period presented is shown in the Average Annual Total Returns table. Top Performance ContributorsHigh-yield corporate bonds | High-yield corporates were the largest contributor to the Fund’s relative performance during the period. Resilient issuer fundamentals and steady investor demand supported the sector, and its meaningful income advantage over Treasuries drove positive excess returns. The allocation added value relative to the benchmark, which has no exposure to below-investment-grade corporates. Emerging market debt | Emerging market debt was the second-largest contributor to relative performance during the period, supported by improving sovereign and corporate credit conditions and strong demand for higher-yielding assets. The Fund's overweight allocation to the sector added value relative to the benchmark. High-yield bank loans | Bank loans contributed positively to relative performance during the period, as elevated short-term interest rates and supportive credit conditions benefited the Fund's higher-income, floating-rate holdings. The allocation added value relative to the benchmark, which does not hold these securities. Top Performance DetractorsAgency mortgage-backed securities | Agency mortgage-backed-securities (MBS) detracted most from the Fund’s performance relative to the benchmark, driven by the Fund's inverse interest-only (IIO) holdings, which are not held in the benchmark. Coupons on these securities move inversely to short-term rates, and they were pressured as the market repriced from expecting Federal Reserve rate cuts to the possibility of hikes. Agency MBS still contributed positively to absolute return. Interest rate positioning | Interest rate positioning detracted from relative performance during the period, as yield curve positioning and implementation costs associated with the Fund’s interest rate derivatives weighed on relative results. Overall, interest rate factors still contributed positively to absolute return, as income from higher starting yields outweighed the price impact of rising Treasury yields. Investment-grade corporate bonds | The Fund’s underweight allocation to investment-grade corporates detracted from relative performance, as the sector continued to generate positive returns despite historically tight spreads. The allocation also contributed positively to absolute return. |
| Performance Past Does Not Indicate Future [Text] |
The Fund's past performance is not a good predictor of the Fund's future performance.
|
| Line Graph [Table Text Block] |
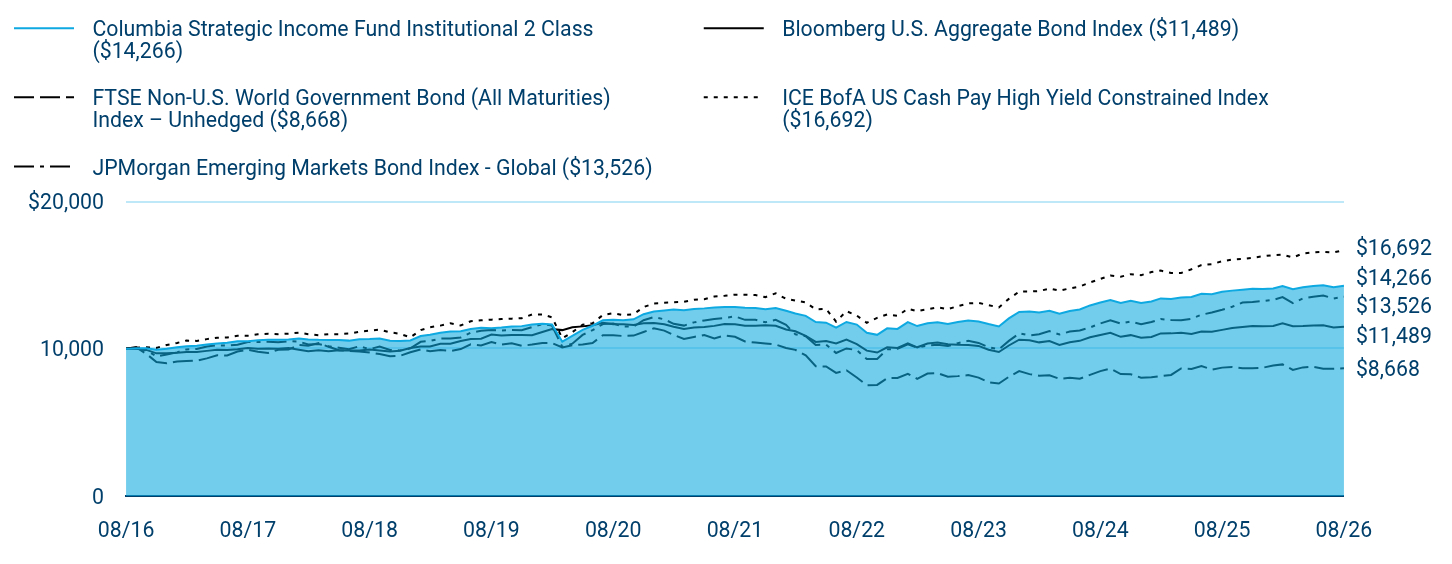
Table Summary
|
Columbia Strategic Income Fund Institutional 2 Class ($14,266) |
Bloomberg U.S. Aggregate Bond Index ($11,489) |
FTSE Non-U.S. World Government Bond (All Maturities) Index – Unhedged ($8,668) |
ICE BofA US Cash Pay High Yield Constrained Index ($16,692) |
JPMorgan Emerging Markets Bond Index - Global ($13,526) |
08/16 |
$10,000 |
$10,000 |
$10,000 |
$10,000 |
$10,000 |
09/16 |
$10,027 |
$9,994 |
$10,104 |
$10,065 |
$10,034 |
10/16 |
$10,030 |
$9,918 |
$9,642 |
$10,095 |
$9,887 |
11/16 |
$9,932 |
$9,683 |
$9,097 |
$10,055 |
$9,475 |
12/16 |
$9,996 |
$9,697 |
$9,009 |
$10,252 |
$9,611 |
01/17 |
$10,092 |
$9,716 |
$9,137 |
$10,389 |
$9,749 |
02/17 |
$10,168 |
$9,781 |
$9,168 |
$10,552 |
$9,952 |
03/17 |
$10,194 |
$9,776 |
$9,191 |
$10,529 |
$9,986 |
04/17 |
$10,290 |
$9,851 |
$9,340 |
$10,648 |
$10,149 |
05/17 |
$10,350 |
$9,927 |
$9,553 |
$10,745 |
$10,233 |
06/17 |
$10,408 |
$9,917 |
$9,541 |
$10,756 |
$10,207 |
07/17 |
$10,502 |
$9,960 |
$9,803 |
$10,880 |
$10,274 |
08/17 |
$10,508 |
$10,049 |
$9,924 |
$10,878 |
$10,452 |
09/17 |
$10,574 |
$10,001 |
$9,786 |
$10,976 |
$10,450 |
10/17 |
$10,605 |
$10,007 |
$9,713 |
$11,018 |
$10,469 |
11/17 |
$10,600 |
$9,994 |
$9,931 |
$10,987 |
$10,441 |
12/17 |
$10,630 |
$10,040 |
$9,940 |
$11,019 |
$10,507 |
01/18 |
$10,697 |
$9,925 |
$10,258 |
$11,089 |
$10,487 |
02/18 |
$10,620 |
$9,830 |
$10,192 |
$10,984 |
$10,281 |
03/18 |
$10,598 |
$9,894 |
$10,379 |
$10,915 |
$10,320 |
04/18 |
$10,593 |
$9,820 |
$10,126 |
$10,988 |
$10,169 |
05/18 |
$10,589 |
$9,890 |
$9,893 |
$10,986 |
$10,059 |
06/18 |
$10,547 |
$9,878 |
$9,848 |
$11,025 |
$9,957 |
07/18 |
$10,634 |
$9,880 |
$9,809 |
$11,149 |
$10,163 |
08/18 |
$10,649 |
$9,944 |
$9,737 |
$11,229 |
$9,967 |
09/18 |
$10,683 |
$9,880 |
$9,633 |
$11,294 |
$10,144 |
10/18 |
$10,535 |
$9,802 |
$9,493 |
$11,109 |
$9,917 |
11/18 |
$10,519 |
$9,860 |
$9,517 |
$11,010 |
$9,878 |
12/18 |
$10,556 |
$10,041 |
$9,759 |
$10,769 |
$10,023 |
01/19 |
$10,857 |
$10,148 |
$9,950 |
$11,264 |
$10,465 |
02/19 |
$10,952 |
$10,142 |
$9,820 |
$11,454 |
$10,531 |
03/19 |
$11,085 |
$10,337 |
$9,907 |
$11,566 |
$10,684 |
04/19 |
$11,162 |
$10,339 |
$9,844 |
$11,728 |
$10,696 |
05/19 |
$11,182 |
$10,523 |
$9,976 |
$11,579 |
$10,758 |
06/19 |
$11,335 |
$10,655 |
$10,296 |
$11,863 |
$11,085 |
07/19 |
$11,413 |
$10,679 |
$10,224 |
$11,924 |
$11,213 |
08/19 |
$11,395 |
$10,955 |
$10,451 |
$11,972 |
$11,274 |
09/19 |
$11,434 |
$10,897 |
$10,285 |
$12,009 |
$11,233 |
10/19 |
$11,512 |
$10,930 |
$10,371 |
$12,038 |
$11,275 |
11/19 |
$11,531 |
$10,924 |
$10,193 |
$12,070 |
$11,257 |
12/19 |
$11,645 |
$10,917 |
$10,278 |
$12,320 |
$11,468 |
01/20 |
$11,700 |
$11,127 |
$10,390 |
$12,321 |
$11,667 |
02/20 |
$11,638 |
$11,327 |
$10,384 |
$12,131 |
$11,573 |
03/20 |
$10,477 |
$11,260 |
$10,084 |
$10,709 |
$10,120 |
04/20 |
$10,868 |
$11,460 |
$10,237 |
$11,116 |
$10,342 |
05/20 |
$11,282 |
$11,514 |
$10,286 |
$11,621 |
$10,935 |
06/20 |
$11,558 |
$11,586 |
$10,385 |
$11,729 |
$11,254 |
07/20 |
$11,935 |
$11,759 |
$10,916 |
$12,286 |
$11,670 |
08/20 |
$11,971 |
$11,665 |
$10,907 |
$12,409 |
$11,704 |
09/20 |
$11,937 |
$11,658 |
$10,861 |
$12,281 |
$11,511 |
10/20 |
$11,993 |
$11,606 |
$10,889 |
$12,337 |
$11,497 |
11/20 |
$12,342 |
$11,720 |
$11,135 |
$12,826 |
$11,928 |
12/20 |
$12,525 |
$11,736 |
$11,385 |
$13,072 |
$12,142 |
01/21 |
$12,591 |
$11,652 |
$11,225 |
$13,114 |
$11,995 |
02/21 |
$12,651 |
$11,484 |
$10,938 |
$13,157 |
$11,687 |
03/21 |
$12,614 |
$11,340 |
$10,654 |
$13,179 |
$11,566 |
04/21 |
$12,691 |
$11,430 |
$10,799 |
$13,323 |
$11,787 |
05/21 |
$12,736 |
$11,467 |
$10,932 |
$13,359 |
$11,915 |
06/21 |
$12,802 |
$11,548 |
$10,702 |
$13,540 |
$12,021 |
07/21 |
$12,823 |
$11,677 |
$10,900 |
$13,590 |
$12,086 |
08/21 |
$12,836 |
$11,655 |
$10,809 |
$13,665 |
$12,196 |
09/21 |
$12,785 |
$11,554 |
$10,491 |
$13,668 |
$11,957 |
10/21 |
$12,760 |
$11,551 |
$10,418 |
$13,644 |
$11,964 |
11/21 |
$12,671 |
$11,585 |
$10,353 |
$13,502 |
$11,791 |
12/21 |
$12,761 |
$11,555 |
$10,284 |
$13,761 |
$11,959 |
01/22 |
$12,570 |
$11,306 |
$10,048 |
$13,384 |
$11,613 |
02/22 |
$12,390 |
$11,180 |
$9,920 |
$13,262 |
$10,974 |
03/22 |
$12,226 |
$10,869 |
$9,551 |
$13,141 |
$10,851 |
04/22 |
$11,811 |
$10,457 |
$8,806 |
$12,663 |
$10,257 |
05/22 |
$11,766 |
$10,524 |
$8,789 |
$12,700 |
$10,276 |
06/22 |
$11,432 |
$10,359 |
$8,357 |
$11,837 |
$9,707 |
07/22 |
$11,812 |
$10,612 |
$8,534 |
$12,551 |
$10,017 |
08/22 |
$11,636 |
$10,313 |
$8,040 |
$12,247 |
$9,900 |
09/22 |
$11,085 |
$9,867 |
$7,525 |
$11,757 |
$9,299 |
10/22 |
$10,939 |
$9,739 |
$7,538 |
$12,095 |
$9,306 |
11/22 |
$11,379 |
$10,097 |
$7,994 |
$12,327 |
$9,953 |
12/22 |
$11,344 |
$10,052 |
$8,014 |
$12,234 |
$9,991 |
01/23 |
$11,801 |
$10,361 |
$8,298 |
$12,709 |
$10,302 |
02/23 |
$11,535 |
$10,093 |
$7,957 |
$12,545 |
$10,075 |
03/23 |
$11,731 |
$10,350 |
$8,312 |
$12,684 |
$10,215 |
04/23 |
$11,794 |
$10,412 |
$8,338 |
$12,806 |
$10,267 |
05/23 |
$11,672 |
$10,299 |
$8,093 |
$12,683 |
$10,176 |
06/23 |
$11,809 |
$10,262 |
$8,137 |
$12,888 |
$10,372 |
07/23 |
$11,908 |
$10,255 |
$8,205 |
$13,073 |
$10,539 |
08/23 |
$11,850 |
$10,189 |
$8,038 |
$13,112 |
$10,392 |
09/23 |
$11,671 |
$9,931 |
$7,717 |
$12,957 |
$10,099 |
10/23 |
$11,504 |
$9,774 |
$7,638 |
$12,795 |
$9,953 |
11/23 |
$12,054 |
$10,216 |
$8,093 |
$13,381 |
$10,529 |
12/23 |
$12,498 |
$10,608 |
$8,481 |
$13,875 |
$11,035 |
01/24 |
$12,529 |
$10,578 |
$8,273 |
$13,876 |
$10,905 |
02/24 |
$12,453 |
$10,429 |
$8,164 |
$13,914 |
$10,980 |
03/24 |
$12,566 |
$10,525 |
$8,191 |
$14,079 |
$11,189 |
04/24 |
$12,366 |
$10,259 |
$7,958 |
$13,937 |
$10,965 |
05/24 |
$12,563 |
$10,433 |
$8,022 |
$14,091 |
$11,164 |
06/24 |
$12,664 |
$10,532 |
$7,959 |
$14,223 |
$11,238 |
07/24 |
$12,935 |
$10,778 |
$8,226 |
$14,500 |
$11,443 |
08/24 |
$13,139 |
$10,933 |
$8,478 |
$14,734 |
$11,710 |
09/24 |
$13,307 |
$11,079 |
$8,644 |
$14,972 |
$11,920 |
10/24 |
$13,103 |
$10,805 |
$8,277 |
$14,887 |
$11,706 |
11/24 |
$13,260 |
$10,919 |
$8,267 |
$15,057 |
$11,845 |
12/24 |
$13,097 |
$10,740 |
$8,031 |
$14,991 |
$11,668 |
01/25 |
$13,200 |
$10,797 |
$8,066 |
$15,199 |
$11,811 |
02/25 |
$13,414 |
$11,035 |
$8,134 |
$15,300 |
$12,006 |
03/25 |
$13,380 |
$11,039 |
$8,217 |
$15,137 |
$11,941 |
04/25 |
$13,478 |
$11,082 |
$8,658 |
$15,137 |
$11,931 |
05/25 |
$13,514 |
$11,003 |
$8,626 |
$15,392 |
$12,033 |
06/25 |
$13,726 |
$11,172 |
$8,823 |
$15,676 |
$12,307 |
07/25 |
$13,698 |
$11,143 |
$8,579 |
$15,737 |
$12,452 |
08/25 |
$13,861 |
$11,276 |
$8,714 |
$15,933 |
$12,643 |
09/25 |
$13,941 |
$11,399 |
$8,753 |
$16,054 |
$12,847 |
10/25 |
$14,008 |
$11,470 |
$8,673 |
$16,085 |
$13,130 |
11/25 |
$14,070 |
$11,541 |
$8,672 |
$16,169 |
$13,169 |
12/25 |
$14,051 |
$11,524 |
$8,711 |
$16,273 |
$13,237 |
01/26 |
$14,081 |
$11,537 |
$8,853 |
$16,352 |
$13,311 |
02/26 |
$14,248 |
$11,726 |
$8,934 |
$16,382 |
$13,497 |
03/26 |
$14,035 |
$11,519 |
$8,558 |
$16,187 |
$13,086 |
04/26 |
$14,171 |
$11,532 |
$8,729 |
$16,461 |
$13,417 |
05/26 |
$14,249 |
$11,568 |
$8,767 |
$16,541 |
$13,527 |
06/26 |
$14,299 |
$11,596 |
$8,640 |
$16,578 |
$13,614 |
07/26 |
$14,178 |
$11,445 |
$8,633 |
$16,531 |
$13,404 |
08/26 |
$14,266 |
$11,489 |
$8,668 |
$16,692 |
$13,526 |
|
| Average Annual Return [Table Text Block] |
Table Summary
Average Annual Total Returns (%) |
1 year |
5 years |
10 years |
Institutional 2 Class |
2.92 |
2.13 |
3.62 |
Bloomberg U.S. Aggregate Bond Index |
1.89 |
(0.29) |
1.40 |
FTSE Non-U.S. World Government Bond (All Maturities) Index – Unhedged |
(0.54) |
(4.32) |
(1.42) |
ICE BofA US Cash Pay High Yield Constrained Index |
4.77 |
4.08 |
5.26 |
JPMorgan Emerging Markets Bond Index - Global |
6.99 |
2.09 |
3.07 | |
| No Deduction of Taxes [Text Block] |
Performance does not reflect the deduction of taxes that a shareholder may pay on fund distributions or on the redemptions of fund shares.
|
| Updated Performance Information Location [Text Block] |
columbiathreadneedleus.com/investment-products/mutual-funds
|
| AssetsNet |
$ 5,957,083,457
|
| Holdings Count | Holding |
1,262
|
| Advisory Fees Paid, Amount |
$ 32,956,876
|
| InvestmentCompanyPortfolioTurnover |
245.00%
|
| Additional Fund Statistics [Text Block] |
Table Summary
Fund net assets |
$5,957,083,457 |
Total number of portfolio holdings |
1,262 |
Management services fees (represents 0.55% of Fund average net assets) |
$32,956,876 |
Portfolio turnover for the reporting period |
245% |
Portfolio turnover as of the end of the period excluding transactions in to be announced securities |
59% | |
| Holdings [Text Block] |
Table Summary
|
Long |
Interest Rate Risk |
36.9% |
Credit Risk |
0.8% |
|
Short |
Interest Rate Risk |
29.5% |
Credit Risk |
2.8% |
Table Summary
Corporate Bonds & Notes |
35.6% |
Residential Mortgage-Backed Securities - Agency |
26.3% |
Senior Loans |
19.7% |
Foreign Government Obligations |
9.5% |
Asset-Backed Securities - Non-Agency |
8.9% |
Residential Mortgage-Backed Securities - Non-Agency |
8.2% |
Money Market Funds |
4.1% |
Other |
1.8% | |
| Material Fund Change [Text Block] |
|
| C000129839 |
|
| Shareholder Report [Line Items] |
|
| Fund Name |
Columbia Strategic Income Fund
|
| Class Name |
Institutional 3 Class
|
| Trading Symbol |
CPHUX
|
| Annual or Semi-Annual Statement [Text Block] |
This annual shareholder report contains important information about Columbia Strategic Income Fund (the Fund) for the period of September 1, 2025 to August 31, 2026.
|
| Additional Information [Text Block] |
You can find additional information about the Fund at columbiathreadneedleus.com/resources/literature. You can also request more information by contacting us at 1-800-345-6611.
|
| Additional Information Phone Number |
1-800-345-6611
|
| Additional Information Website |
columbiathreadneedleus.com/resources/literature
|
| Expenses [Text Block] |
What were the Fund costs for the reporting period? (Based on a hypothetical $10,000 investment)
Table Summary
Class |
Cost of a $10,000 investment |
Cost paid as a percentage of a $10,000 investment |
Institutional 3 Class |
$60 |
0.59% | |
| Expenses Paid, Amount |
$ 60
|
| Expense Ratio, Percent |
0.59%
|
| Factors Affecting Performance [Text Block] |
Management's Discussion of Fund Performance The performance of Institutional 3 Class shares for the period presented is shown in the Average Annual Total Returns table. Top Performance ContributorsHigh-yield corporate bonds | High-yield corporates were the largest contributor to the Fund’s relative performance during the period. Resilient issuer fundamentals and steady investor demand supported the sector, and its meaningful income advantage over Treasuries drove positive excess returns. The allocation added value relative to the benchmark, which has no exposure to below-investment-grade corporates. Emerging market debt | Emerging market debt was the second-largest contributor to relative performance during the period, supported by improving sovereign and corporate credit conditions and strong demand for higher-yielding assets. The Fund's overweight allocation to the sector added value relative to the benchmark. High-yield bank loans | Bank loans contributed positively to relative performance during the period, as elevated short-term interest rates and supportive credit conditions benefited the Fund's higher-income, floating-rate holdings. The allocation added value relative to the benchmark, which does not hold these securities. Top Performance DetractorsAgency mortgage-backed securities | Agency mortgage-backed-securities (MBS) detracted most from the Fund’s performance relative to the benchmark, driven by the Fund's inverse interest-only (IIO) holdings, which are not held in the benchmark. Coupons on these securities move inversely to short-term rates, and they were pressured as the market repriced from expecting Federal Reserve rate cuts to the possibility of hikes. Agency MBS still contributed positively to absolute return. Interest rate positioning | Interest rate positioning detracted from relative performance during the period, as yield curve positioning and implementation costs associated with the Fund’s interest rate derivatives weighed on relative results. Overall, interest rate factors still contributed positively to absolute return, as income from higher starting yields outweighed the price impact of rising Treasury yields. Investment-grade corporate bonds | The Fund’s underweight allocation to investment-grade corporates detracted from relative performance, as the sector continued to generate positive returns despite historically tight spreads. The allocation also contributed positively to absolute return. |
| Performance Past Does Not Indicate Future [Text] |
The Fund's past performance is not a good predictor of the Fund's future performance.
|
| Line Graph [Table Text Block] |
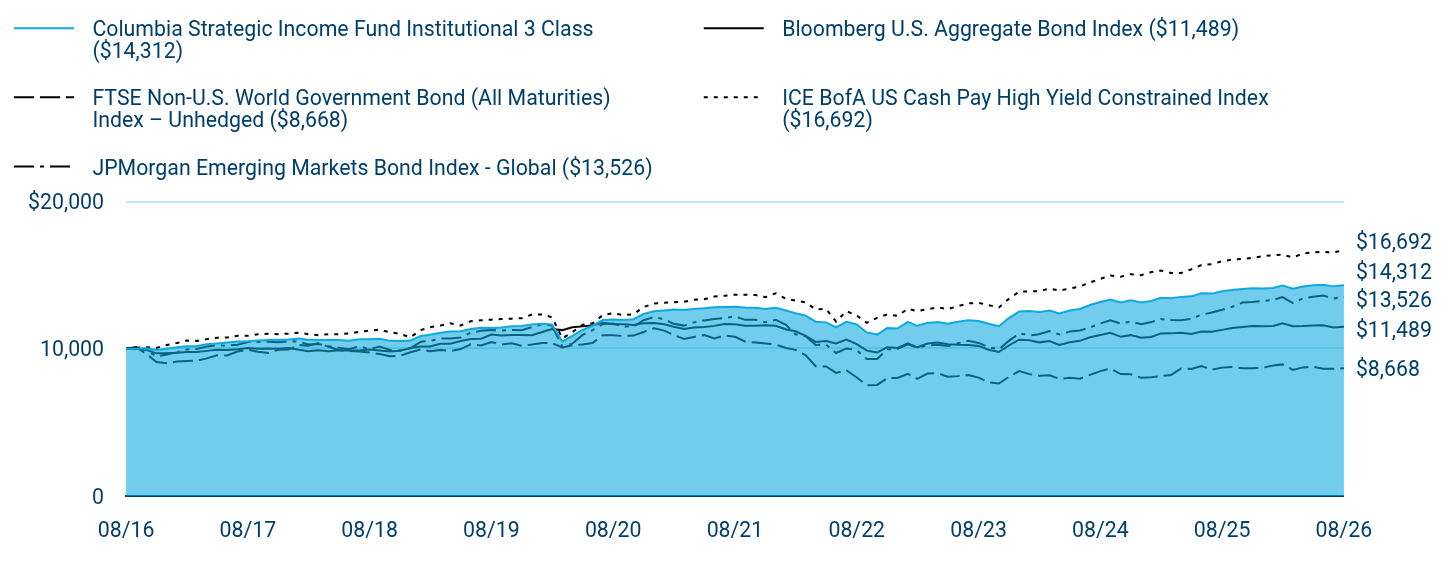
Table Summary
|
Columbia Strategic Income Fund Institutional 3 Class ($14,312) |
Bloomberg U.S. Aggregate Bond Index ($11,489) |
FTSE Non-U.S. World Government Bond (All Maturities) Index – Unhedged ($8,668) |
ICE BofA US Cash Pay High Yield Constrained Index ($16,692) |
JPMorgan Emerging Markets Bond Index - Global ($13,526) |
08/16 |
$10,000 |
$10,000 |
$10,000 |
$10,000 |
$10,000 |
09/16 |
$10,010 |
$9,994 |
$10,104 |
$10,065 |
$10,034 |
10/16 |
$10,031 |
$9,918 |
$9,642 |
$10,095 |
$9,887 |
11/16 |
$9,916 |
$9,683 |
$9,097 |
$10,055 |
$9,475 |
12/16 |
$9,998 |
$9,697 |
$9,009 |
$10,252 |
$9,611 |
01/17 |
$10,094 |
$9,716 |
$9,137 |
$10,389 |
$9,749 |
02/17 |
$10,172 |
$9,781 |
$9,168 |
$10,552 |
$9,952 |
03/17 |
$10,180 |
$9,776 |
$9,191 |
$10,529 |
$9,986 |
04/17 |
$10,294 |
$9,851 |
$9,340 |
$10,648 |
$10,149 |
05/17 |
$10,355 |
$9,927 |
$9,553 |
$10,745 |
$10,233 |
06/17 |
$10,414 |
$9,917 |
$9,541 |
$10,756 |
$10,207 |
07/17 |
$10,490 |
$9,960 |
$9,803 |
$10,880 |
$10,274 |
08/17 |
$10,497 |
$10,049 |
$9,924 |
$10,878 |
$10,452 |
09/17 |
$10,563 |
$10,001 |
$9,786 |
$10,976 |
$10,450 |
10/17 |
$10,594 |
$10,007 |
$9,713 |
$11,018 |
$10,469 |
11/17 |
$10,608 |
$9,994 |
$9,931 |
$10,987 |
$10,441 |
12/17 |
$10,620 |
$10,040 |
$9,940 |
$11,019 |
$10,507 |
01/18 |
$10,688 |
$9,925 |
$10,258 |
$11,089 |
$10,487 |
02/18 |
$10,612 |
$9,830 |
$10,192 |
$10,984 |
$10,281 |
03/18 |
$10,590 |
$9,894 |
$10,379 |
$10,915 |
$10,320 |
04/18 |
$10,586 |
$9,820 |
$10,126 |
$10,988 |
$10,169 |
05/18 |
$10,581 |
$9,890 |
$9,893 |
$10,986 |
$10,059 |
06/18 |
$10,541 |
$9,878 |
$9,848 |
$11,025 |
$9,957 |
07/18 |
$10,646 |
$9,880 |
$9,809 |
$11,149 |
$10,163 |
08/18 |
$10,644 |
$9,944 |
$9,737 |
$11,229 |
$9,967 |
09/18 |
$10,678 |
$9,880 |
$9,633 |
$11,294 |
$10,144 |
10/18 |
$10,530 |
$9,802 |
$9,493 |
$11,109 |
$9,917 |
11/18 |
$10,514 |
$9,860 |
$9,517 |
$11,010 |
$9,878 |
12/18 |
$10,552 |
$10,041 |
$9,759 |
$10,769 |
$10,023 |
01/19 |
$10,855 |
$10,148 |
$9,950 |
$11,264 |
$10,465 |
02/19 |
$10,950 |
$10,142 |
$9,820 |
$11,454 |
$10,531 |
03/19 |
$11,084 |
$10,337 |
$9,907 |
$11,566 |
$10,684 |
04/19 |
$11,161 |
$10,339 |
$9,844 |
$11,728 |
$10,696 |
05/19 |
$11,182 |
$10,523 |
$9,976 |
$11,579 |
$10,758 |
06/19 |
$11,337 |
$10,655 |
$10,296 |
$11,863 |
$11,085 |
07/19 |
$11,415 |
$10,679 |
$10,224 |
$11,924 |
$11,213 |
08/19 |
$11,397 |
$10,955 |
$10,451 |
$11,972 |
$11,274 |
09/19 |
$11,437 |
$10,897 |
$10,285 |
$12,009 |
$11,233 |
10/19 |
$11,516 |
$10,930 |
$10,371 |
$12,038 |
$11,275 |
11/19 |
$11,535 |
$10,924 |
$10,193 |
$12,070 |
$11,257 |
12/19 |
$11,650 |
$10,917 |
$10,278 |
$12,320 |
$11,468 |
01/20 |
$11,687 |
$11,127 |
$10,390 |
$12,321 |
$11,667 |
02/20 |
$11,645 |
$11,327 |
$10,384 |
$12,131 |
$11,573 |
03/20 |
$10,479 |
$11,260 |
$10,084 |
$10,709 |
$10,120 |
04/20 |
$10,873 |
$11,460 |
$10,237 |
$11,116 |
$10,342 |
05/20 |
$11,269 |
$11,514 |
$10,286 |
$11,621 |
$10,935 |
06/20 |
$11,566 |
$11,586 |
$10,385 |
$11,729 |
$11,254 |
07/20 |
$11,945 |
$11,759 |
$10,916 |
$12,286 |
$11,670 |
08/20 |
$11,982 |
$11,665 |
$10,907 |
$12,409 |
$11,704 |
09/20 |
$11,943 |
$11,658 |
$10,861 |
$12,281 |
$11,511 |
10/20 |
$12,000 |
$11,606 |
$10,889 |
$12,337 |
$11,497 |
11/20 |
$12,351 |
$11,720 |
$11,135 |
$12,826 |
$11,928 |
12/20 |
$12,535 |
$11,736 |
$11,385 |
$13,072 |
$12,142 |
01/21 |
$12,596 |
$11,652 |
$11,225 |
$13,114 |
$11,995 |
02/21 |
$12,657 |
$11,484 |
$10,938 |
$13,157 |
$11,687 |
03/21 |
$12,627 |
$11,340 |
$10,654 |
$13,179 |
$11,566 |
04/21 |
$12,698 |
$11,430 |
$10,799 |
$13,323 |
$11,787 |
05/21 |
$12,745 |
$11,467 |
$10,932 |
$13,359 |
$11,915 |
06/21 |
$12,812 |
$11,548 |
$10,702 |
$13,540 |
$12,021 |
07/21 |
$12,833 |
$11,677 |
$10,900 |
$13,590 |
$12,086 |
08/21 |
$12,852 |
$11,655 |
$10,809 |
$13,665 |
$12,196 |
09/21 |
$12,801 |
$11,554 |
$10,491 |
$13,668 |
$11,957 |
10/21 |
$12,771 |
$11,551 |
$10,418 |
$13,644 |
$11,964 |
11/21 |
$12,688 |
$11,585 |
$10,353 |
$13,502 |
$11,791 |
12/21 |
$12,779 |
$11,555 |
$10,284 |
$13,761 |
$11,959 |
01/22 |
$12,588 |
$11,306 |
$10,048 |
$13,384 |
$11,613 |
02/22 |
$12,407 |
$11,180 |
$9,920 |
$13,262 |
$10,974 |
03/22 |
$12,242 |
$10,869 |
$9,551 |
$13,141 |
$10,851 |
04/22 |
$11,831 |
$10,457 |
$8,806 |
$12,663 |
$10,257 |
05/22 |
$11,786 |
$10,524 |
$8,789 |
$12,700 |
$10,276 |
06/22 |
$11,446 |
$10,359 |
$8,357 |
$11,837 |
$9,707 |
07/22 |
$11,828 |
$10,612 |
$8,534 |
$12,551 |
$10,017 |
08/22 |
$11,651 |
$10,313 |
$8,040 |
$12,247 |
$9,900 |
09/22 |
$11,103 |
$9,867 |
$7,525 |
$11,757 |
$9,299 |
10/22 |
$10,957 |
$9,739 |
$7,538 |
$12,095 |
$9,306 |
11/22 |
$11,395 |
$10,097 |
$7,994 |
$12,327 |
$9,953 |
12/22 |
$11,365 |
$10,052 |
$8,014 |
$12,234 |
$9,991 |
01/23 |
$11,820 |
$10,361 |
$8,298 |
$12,709 |
$10,302 |
02/23 |
$11,553 |
$10,093 |
$7,957 |
$12,545 |
$10,075 |
03/23 |
$11,750 |
$10,350 |
$8,312 |
$12,684 |
$10,215 |
04/23 |
$11,814 |
$10,412 |
$8,338 |
$12,806 |
$10,267 |
05/23 |
$11,697 |
$10,299 |
$8,093 |
$12,683 |
$10,176 |
06/23 |
$11,830 |
$10,262 |
$8,137 |
$12,888 |
$10,372 |
07/23 |
$11,931 |
$10,255 |
$8,205 |
$13,073 |
$10,539 |
08/23 |
$11,872 |
$10,189 |
$8,038 |
$13,112 |
$10,392 |
09/23 |
$11,698 |
$9,931 |
$7,717 |
$12,957 |
$10,099 |
10/23 |
$11,525 |
$9,774 |
$7,638 |
$12,795 |
$9,953 |
11/23 |
$12,079 |
$10,216 |
$8,093 |
$13,381 |
$10,529 |
12/23 |
$12,521 |
$10,608 |
$8,481 |
$13,875 |
$11,035 |
01/24 |
$12,552 |
$10,578 |
$8,273 |
$13,876 |
$10,905 |
02/24 |
$12,482 |
$10,429 |
$8,164 |
$13,914 |
$10,980 |
03/24 |
$12,591 |
$10,525 |
$8,191 |
$14,079 |
$11,189 |
04/24 |
$12,395 |
$10,259 |
$7,958 |
$13,937 |
$10,965 |
05/24 |
$12,594 |
$10,433 |
$8,022 |
$14,091 |
$11,164 |
06/24 |
$12,697 |
$10,532 |
$7,959 |
$14,223 |
$11,238 |
07/24 |
$12,964 |
$10,778 |
$8,226 |
$14,500 |
$11,443 |
08/24 |
$13,170 |
$10,933 |
$8,478 |
$14,734 |
$11,710 |
09/24 |
$13,339 |
$11,079 |
$8,644 |
$14,972 |
$11,920 |
10/24 |
$13,141 |
$10,805 |
$8,277 |
$14,887 |
$11,706 |
11/24 |
$13,293 |
$10,919 |
$8,267 |
$15,057 |
$11,845 |
12/24 |
$13,130 |
$10,740 |
$8,031 |
$14,991 |
$11,668 |
01/25 |
$13,240 |
$10,797 |
$8,066 |
$15,199 |
$11,811 |
02/25 |
$13,450 |
$11,035 |
$8,134 |
$15,300 |
$12,006 |
03/25 |
$13,417 |
$11,039 |
$8,217 |
$15,137 |
$11,941 |
04/25 |
$13,516 |
$11,082 |
$8,658 |
$15,137 |
$11,931 |
05/25 |
$13,552 |
$11,003 |
$8,626 |
$15,392 |
$12,033 |
06/25 |
$13,766 |
$11,172 |
$8,823 |
$15,676 |
$12,307 |
07/25 |
$13,738 |
$11,143 |
$8,579 |
$15,737 |
$12,452 |
08/25 |
$13,903 |
$11,276 |
$8,714 |
$15,933 |
$12,643 |
09/25 |
$13,985 |
$11,399 |
$8,753 |
$16,054 |
$12,847 |
10/25 |
$14,047 |
$11,470 |
$8,673 |
$16,085 |
$13,130 |
11/25 |
$14,110 |
$11,541 |
$8,672 |
$16,169 |
$13,169 |
12/25 |
$14,091 |
$11,524 |
$8,711 |
$16,273 |
$13,237 |
01/26 |
$14,122 |
$11,537 |
$8,853 |
$16,352 |
$13,311 |
02/26 |
$14,291 |
$11,726 |
$8,934 |
$16,382 |
$13,497 |
03/26 |
$14,076 |
$11,519 |
$8,558 |
$16,187 |
$13,086 |
04/26 |
$14,221 |
$11,532 |
$8,729 |
$16,461 |
$13,417 |
05/26 |
$14,300 |
$11,568 |
$8,767 |
$16,541 |
$13,527 |
06/26 |
$14,345 |
$11,596 |
$8,640 |
$16,578 |
$13,614 |
07/26 |
$14,230 |
$11,445 |
$8,633 |
$16,531 |
$13,404 |
08/26 |
$14,312 |
$11,489 |
$8,668 |
$16,692 |
$13,526 |
|
| Average Annual Return [Table Text Block] |
Table Summary
Average Annual Total Returns (%) |
1 year |
5 years |
10 years |
Institutional 3 Class |
2.94 |
2.18 |
3.65 |
Bloomberg U.S. Aggregate Bond Index |
1.89 |
(0.29) |
1.40 |
FTSE Non-U.S. World Government Bond (All Maturities) Index – Unhedged |
(0.54) |
(4.32) |
(1.42) |
ICE BofA US Cash Pay High Yield Constrained Index |
4.77 |
4.08 |
5.26 |
JPMorgan Emerging Markets Bond Index - Global |
6.99 |
2.09 |
3.07 | |
| No Deduction of Taxes [Text Block] |
Performance does not reflect the deduction of taxes that a shareholder may pay on fund distributions or on the redemptions of fund shares.
|
| Updated Performance Information Location [Text Block] |
columbiathreadneedleus.com/investment-products/mutual-funds
|
| AssetsNet |
$ 5,957,083,457
|
| Holdings Count | Holding |
1,262
|
| Advisory Fees Paid, Amount |
$ 32,956,876
|
| InvestmentCompanyPortfolioTurnover |
245.00%
|
| Additional Fund Statistics [Text Block] |
Table Summary
Fund net assets |
$5,957,083,457 |
Total number of portfolio holdings |
1,262 |
Management services fees (represents 0.55% of Fund average net assets) |
$32,956,876 |
Portfolio turnover for the reporting period |
245% |
Portfolio turnover as of the end of the period excluding transactions in to be announced securities |
59% | |
| Holdings [Text Block] |
Table Summary
|
Long |
Interest Rate Risk |
36.9% |
Credit Risk |
0.8% |
|
Short |
Interest Rate Risk |
29.5% |
Credit Risk |
2.8% |
Table Summary
Corporate Bonds & Notes |
35.6% |
Residential Mortgage-Backed Securities - Agency |
26.3% |
Senior Loans |
19.7% |
Foreign Government Obligations |
9.5% |
Asset-Backed Securities - Non-Agency |
8.9% |
Residential Mortgage-Backed Securities - Non-Agency |
8.2% |
Money Market Funds |
4.1% |
Other |
1.8% | |
| Material Fund Change [Text Block] |
|
| C000094661 |
|
| Shareholder Report [Line Items] |
|
| Fund Name |
Columbia Strategic Income Fund
|
| Class Name |
Class R
|
| Trading Symbol |
CSNRX
|
| Annual or Semi-Annual Statement [Text Block] |
This annual shareholder report contains important information about Columbia Strategic Income Fund (the Fund) for the period of September 1, 2025 to August 31, 2026.
|
| Additional Information [Text Block] |
You can find additional information about the Fund at columbiathreadneedleus.com/resources/literature. You can also request more information by contacting us at 1-800-345-6611.
|
| Additional Information Phone Number |
1-800-345-6611
|
| Additional Information Website |
columbiathreadneedleus.com/resources/literature
|
| Expenses [Text Block] |
What were the Fund costs for the reporting period? (Based on a hypothetical $10,000 investment)
Table Summary
Class |
Cost of a $10,000 investment |
Cost paid as a percentage of a $10,000 investment |
Class R |
$119 |
1.18% | |
| Expenses Paid, Amount |
$ 119
|
| Expense Ratio, Percent |
1.18%
|
| Factors Affecting Performance [Text Block] |
Management's Discussion of Fund Performance The performance of Class R shares for the period presented is shown in the Average Annual Total Returns table. Top Performance ContributorsHigh-yield corporate bonds | High-yield corporates were the largest contributor to the Fund’s relative performance during the period. Resilient issuer fundamentals and steady investor demand supported the sector, and its meaningful income advantage over Treasuries drove positive excess returns. The allocation added value relative to the benchmark, which has no exposure to below-investment-grade corporates. Emerging market debt | Emerging market debt was the second-largest contributor to relative performance during the period, supported by improving sovereign and corporate credit conditions and strong demand for higher-yielding assets. The Fund's overweight allocation to the sector added value relative to the benchmark. High-yield bank loans | Bank loans contributed positively to relative performance during the period, as elevated short-term interest rates and supportive credit conditions benefited the Fund's higher-income, floating-rate holdings. The allocation added value relative to the benchmark, which does not hold these securities. Top Performance DetractorsAgency mortgage-backed securities | Agency mortgage-backed-securities (MBS) detracted most from the Fund’s performance relative to the benchmark, driven by the Fund's inverse interest-only (IIO) holdings, which are not held in the benchmark. Coupons on these securities move inversely to short-term rates, and they were pressured as the market repriced from expecting Federal Reserve rate cuts to the possibility of hikes. Agency MBS still contributed positively to absolute return. Interest rate positioning | Interest rate positioning detracted from relative performance during the period, as yield curve positioning and implementation costs associated with the Fund’s interest rate derivatives weighed on relative results. Overall, interest rate factors still contributed positively to absolute return, as income from higher starting yields outweighed the price impact of rising Treasury yields. Investment-grade corporate bonds | The Fund’s underweight allocation to investment-grade corporates detracted from relative performance, as the sector continued to generate positive returns despite historically tight spreads. The allocation also contributed positively to absolute return. |
| Performance Past Does Not Indicate Future [Text] |
The Fund's past performance is not a good predictor of the Fund's future performance.
|
| Line Graph [Table Text Block] |
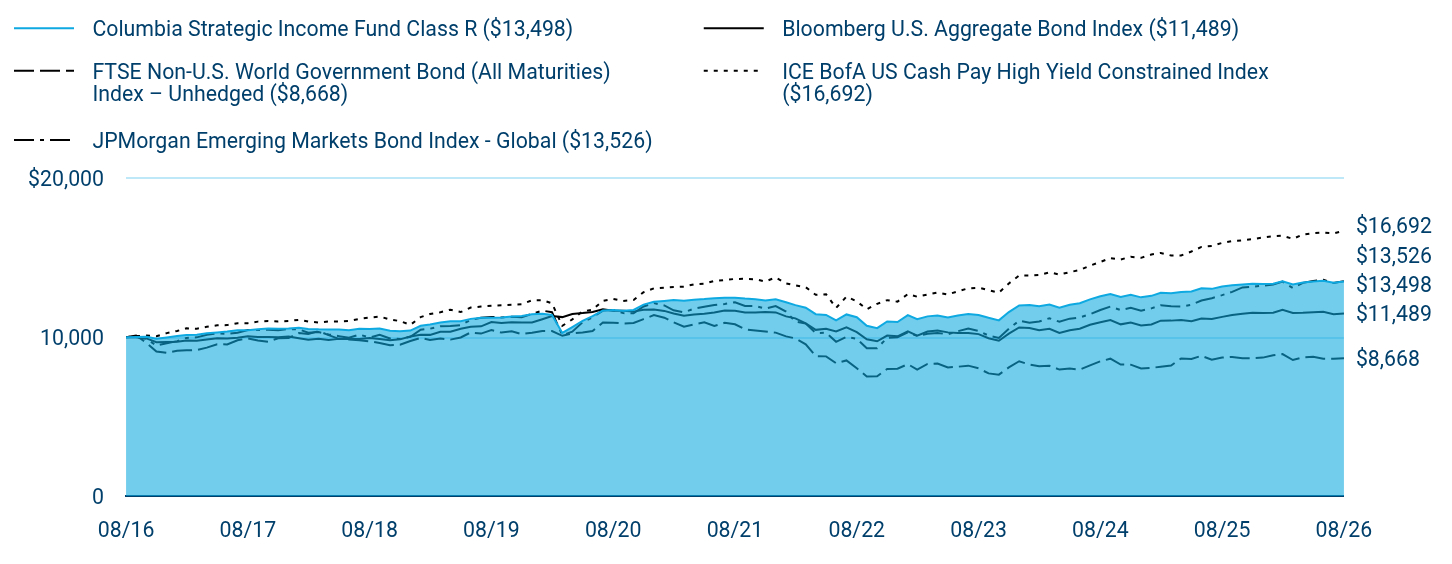
Table Summary
|
Columbia Strategic Income Fund Class R ($13,498) |
Bloomberg U.S. Aggregate Bond Index ($11,489) |
FTSE Non-U.S. World Government Bond (All Maturities) Index – Unhedged ($8,668) |
ICE BofA US Cash Pay High Yield Constrained Index ($16,692) |
JPMorgan Emerging Markets Bond Index - Global ($13,526) |
08/16 |
$10,000 |
$10,000 |
$10,000 |
$10,000 |
$10,000 |
09/16 |
$10,005 |
$9,994 |
$10,104 |
$10,065 |
$10,034 |
10/16 |
$10,019 |
$9,918 |
$9,642 |
$10,095 |
$9,887 |
11/16 |
$9,902 |
$9,683 |
$9,097 |
$10,055 |
$9,475 |
12/16 |
$9,977 |
$9,697 |
$9,009 |
$10,252 |
$9,611 |
01/17 |
$10,065 |
$9,716 |
$9,137 |
$10,389 |
$9,749 |
02/17 |
$10,136 |
$9,781 |
$9,168 |
$10,552 |
$9,952 |
03/17 |
$10,156 |
$9,776 |
$9,191 |
$10,529 |
$9,986 |
04/17 |
$10,244 |
$9,851 |
$9,340 |
$10,648 |
$10,149 |
05/17 |
$10,298 |
$9,927 |
$9,553 |
$10,745 |
$10,233 |
06/17 |
$10,350 |
$9,917 |
$9,541 |
$10,756 |
$10,207 |
07/17 |
$10,436 |
$9,960 |
$9,803 |
$10,880 |
$10,274 |
08/17 |
$10,438 |
$10,049 |
$9,924 |
$10,878 |
$10,452 |
09/17 |
$10,497 |
$10,001 |
$9,786 |
$10,976 |
$10,450 |
10/17 |
$10,539 |
$10,007 |
$9,713 |
$11,018 |
$10,469 |
11/17 |
$10,530 |
$9,994 |
$9,931 |
$10,987 |
$10,441 |
12/17 |
$10,536 |
$10,040 |
$9,940 |
$11,019 |
$10,507 |
01/18 |
$10,597 |
$9,925 |
$10,258 |
$11,089 |
$10,487 |
02/18 |
$10,518 |
$9,830 |
$10,192 |
$10,984 |
$10,281 |
03/18 |
$10,492 |
$9,894 |
$10,379 |
$10,915 |
$10,320 |
04/18 |
$10,482 |
$9,820 |
$10,126 |
$10,988 |
$10,169 |
05/18 |
$10,473 |
$9,890 |
$9,893 |
$10,986 |
$10,059 |
06/18 |
$10,429 |
$9,878 |
$9,848 |
$11,025 |
$9,957 |
07/18 |
$10,526 |
$9,880 |
$9,809 |
$11,149 |
$10,163 |
08/18 |
$10,518 |
$9,944 |
$9,737 |
$11,229 |
$9,967 |
09/18 |
$10,546 |
$9,880 |
$9,633 |
$11,294 |
$10,144 |
10/18 |
$10,398 |
$9,802 |
$9,493 |
$11,109 |
$9,917 |
11/18 |
$10,378 |
$9,860 |
$9,517 |
$11,010 |
$9,878 |
12/18 |
$10,410 |
$10,041 |
$9,759 |
$10,769 |
$10,023 |
01/19 |
$10,713 |
$10,148 |
$9,950 |
$11,264 |
$10,465 |
02/19 |
$10,800 |
$10,142 |
$9,820 |
$11,454 |
$10,531 |
03/19 |
$10,923 |
$10,337 |
$9,907 |
$11,566 |
$10,684 |
04/19 |
$10,992 |
$10,339 |
$9,844 |
$11,728 |
$10,696 |
05/19 |
$11,006 |
$10,523 |
$9,976 |
$11,579 |
$10,758 |
06/19 |
$11,149 |
$10,655 |
$10,296 |
$11,863 |
$11,085 |
07/19 |
$11,219 |
$10,679 |
$10,224 |
$11,924 |
$11,213 |
08/19 |
$11,214 |
$10,955 |
$10,451 |
$11,972 |
$11,274 |
09/19 |
$11,229 |
$10,897 |
$10,285 |
$12,009 |
$11,233 |
10/19 |
$11,299 |
$10,930 |
$10,371 |
$12,038 |
$11,275 |
11/19 |
$11,330 |
$10,924 |
$10,193 |
$12,070 |
$11,257 |
12/19 |
$11,434 |
$10,917 |
$10,278 |
$12,320 |
$11,468 |
01/20 |
$11,464 |
$11,127 |
$10,390 |
$12,321 |
$11,667 |
02/20 |
$11,399 |
$11,327 |
$10,384 |
$12,131 |
$11,573 |
03/20 |
$10,264 |
$11,260 |
$10,084 |
$10,709 |
$10,120 |
04/20 |
$10,634 |
$11,460 |
$10,237 |
$11,116 |
$10,342 |
05/20 |
$11,025 |
$11,514 |
$10,286 |
$11,621 |
$10,935 |
06/20 |
$11,321 |
$11,586 |
$10,385 |
$11,729 |
$11,254 |
07/20 |
$11,676 |
$11,759 |
$10,916 |
$12,286 |
$11,670 |
08/20 |
$11,705 |
$11,665 |
$10,907 |
$12,409 |
$11,704 |
09/20 |
$11,663 |
$11,658 |
$10,861 |
$12,281 |
$11,511 |
10/20 |
$11,711 |
$11,606 |
$10,889 |
$12,337 |
$11,497 |
11/20 |
$12,048 |
$11,720 |
$11,135 |
$12,826 |
$11,928 |
12/20 |
$12,222 |
$11,736 |
$11,385 |
$13,072 |
$12,142 |
01/21 |
$12,279 |
$11,652 |
$11,225 |
$13,114 |
$11,995 |
02/21 |
$12,331 |
$11,484 |
$10,938 |
$13,157 |
$11,687 |
03/21 |
$12,291 |
$11,340 |
$10,654 |
$13,179 |
$11,566 |
04/21 |
$12,358 |
$11,430 |
$10,799 |
$13,323 |
$11,787 |
05/21 |
$12,396 |
$11,467 |
$10,932 |
$13,359 |
$11,915 |
06/21 |
$12,454 |
$11,548 |
$10,702 |
$13,540 |
$12,021 |
07/21 |
$12,472 |
$11,677 |
$10,900 |
$13,590 |
$12,086 |
08/21 |
$12,480 |
$11,655 |
$10,809 |
$13,665 |
$12,196 |
09/21 |
$12,426 |
$11,554 |
$10,491 |
$13,668 |
$11,957 |
10/21 |
$12,391 |
$11,551 |
$10,418 |
$13,644 |
$11,964 |
11/21 |
$12,302 |
$11,585 |
$10,353 |
$13,502 |
$11,791 |
12/21 |
$12,387 |
$11,555 |
$10,284 |
$13,761 |
$11,959 |
01/22 |
$12,196 |
$11,306 |
$10,048 |
$13,384 |
$11,613 |
02/22 |
$12,015 |
$11,180 |
$9,920 |
$13,262 |
$10,974 |
03/22 |
$11,850 |
$10,869 |
$9,551 |
$13,141 |
$10,851 |
04/22 |
$11,443 |
$10,457 |
$8,806 |
$12,663 |
$10,257 |
05/22 |
$11,395 |
$10,524 |
$8,789 |
$12,700 |
$10,276 |
06/22 |
$11,060 |
$10,359 |
$8,357 |
$11,837 |
$9,707 |
07/22 |
$11,428 |
$10,612 |
$8,534 |
$12,551 |
$10,017 |
08/22 |
$11,252 |
$10,313 |
$8,040 |
$12,247 |
$9,900 |
09/22 |
$10,713 |
$9,867 |
$7,525 |
$11,757 |
$9,299 |
10/22 |
$10,566 |
$9,739 |
$7,538 |
$12,095 |
$9,306 |
11/22 |
$10,986 |
$10,097 |
$7,994 |
$12,327 |
$9,953 |
12/22 |
$10,953 |
$10,052 |
$8,014 |
$12,234 |
$9,991 |
01/23 |
$11,383 |
$10,361 |
$8,298 |
$12,709 |
$10,302 |
02/23 |
$11,123 |
$10,093 |
$7,957 |
$12,545 |
$10,075 |
03/23 |
$11,307 |
$10,350 |
$8,312 |
$12,684 |
$10,215 |
04/23 |
$11,361 |
$10,412 |
$8,338 |
$12,806 |
$10,267 |
05/23 |
$11,241 |
$10,299 |
$8,093 |
$12,683 |
$10,176 |
06/23 |
$11,365 |
$10,262 |
$8,137 |
$12,888 |
$10,372 |
07/23 |
$11,458 |
$10,255 |
$8,205 |
$13,073 |
$10,539 |
08/23 |
$11,398 |
$10,189 |
$8,038 |
$13,112 |
$10,392 |
09/23 |
$11,220 |
$9,931 |
$7,717 |
$12,957 |
$10,099 |
10/23 |
$11,054 |
$9,774 |
$7,638 |
$12,795 |
$9,953 |
11/23 |
$11,579 |
$10,216 |
$8,093 |
$13,381 |
$10,529 |
12/23 |
$11,994 |
$10,608 |
$8,481 |
$13,875 |
$11,035 |
01/24 |
$12,018 |
$10,578 |
$8,273 |
$13,876 |
$10,905 |
02/24 |
$11,942 |
$10,429 |
$8,164 |
$13,914 |
$10,980 |
03/24 |
$12,048 |
$10,525 |
$8,191 |
$14,079 |
$11,189 |
04/24 |
$11,850 |
$10,259 |
$7,958 |
$13,937 |
$10,965 |
05/24 |
$12,034 |
$10,433 |
$8,022 |
$14,091 |
$11,164 |
06/24 |
$12,129 |
$10,532 |
$7,959 |
$14,223 |
$11,238 |
07/24 |
$12,375 |
$10,778 |
$8,226 |
$14,500 |
$11,443 |
08/24 |
$12,570 |
$10,933 |
$8,478 |
$14,734 |
$11,710 |
09/24 |
$12,720 |
$11,079 |
$8,644 |
$14,972 |
$11,920 |
10/24 |
$12,526 |
$10,805 |
$8,277 |
$14,887 |
$11,706 |
11/24 |
$12,666 |
$10,919 |
$8,267 |
$15,057 |
$11,845 |
12/24 |
$12,504 |
$10,740 |
$8,031 |
$14,991 |
$11,668 |
01/25 |
$12,599 |
$10,797 |
$8,066 |
$15,199 |
$11,811 |
02/25 |
$12,793 |
$11,035 |
$8,134 |
$15,300 |
$12,006 |
03/25 |
$12,756 |
$11,039 |
$8,217 |
$15,137 |
$11,941 |
04/25 |
$12,846 |
$11,082 |
$8,658 |
$15,137 |
$11,931 |
05/25 |
$12,874 |
$11,003 |
$8,626 |
$15,392 |
$12,033 |
06/25 |
$13,070 |
$11,172 |
$8,823 |
$15,676 |
$12,307 |
07/25 |
$13,038 |
$11,143 |
$8,579 |
$15,737 |
$12,452 |
08/25 |
$13,189 |
$11,276 |
$8,714 |
$15,933 |
$12,643 |
09/25 |
$13,263 |
$11,399 |
$8,753 |
$16,054 |
$12,847 |
10/25 |
$13,314 |
$11,470 |
$8,673 |
$16,085 |
$13,130 |
11/25 |
$13,365 |
$11,541 |
$8,672 |
$16,169 |
$13,169 |
12/25 |
$13,342 |
$11,524 |
$8,711 |
$16,273 |
$13,237 |
01/26 |
$13,363 |
$11,537 |
$8,853 |
$16,352 |
$13,311 |
02/26 |
$13,518 |
$11,726 |
$8,934 |
$16,382 |
$13,497 |
03/26 |
$13,310 |
$11,519 |
$8,558 |
$16,187 |
$13,086 |
04/26 |
$13,435 |
$11,532 |
$8,729 |
$16,461 |
$13,417 |
05/26 |
$13,507 |
$11,568 |
$8,767 |
$16,541 |
$13,527 |
06/26 |
$13,548 |
$11,596 |
$8,640 |
$16,578 |
$13,614 |
07/26 |
$13,424 |
$11,445 |
$8,633 |
$16,531 |
$13,404 |
08/26 |
$13,498 |
$11,489 |
$8,668 |
$16,692 |
$13,526 |
|
| Average Annual Return [Table Text Block] |
Table Summary
Average Annual Total Returns (%) |
1 year |
5 years |
10 years |
Class R |
2.35 |
1.58 |
3.05 |
Bloomberg U.S. Aggregate Bond Index |
1.89 |
(0.29) |
1.40 |
FTSE Non-U.S. World Government Bond (All Maturities) Index – Unhedged |
(0.54) |
(4.32) |
(1.42) |
ICE BofA US Cash Pay High Yield Constrained Index |
4.77 |
4.08 |
5.26 |
JPMorgan Emerging Markets Bond Index - Global |
6.99 |
2.09 |
3.07 | |
| No Deduction of Taxes [Text Block] |
Performance does not reflect the deduction of taxes that a shareholder may pay on fund distributions or on the redemptions of fund shares.
|
| Updated Performance Information Location [Text Block] |
columbiathreadneedleus.com/investment-products/mutual-funds
|
| AssetsNet |
$ 5,957,083,457
|
| Holdings Count | Holding |
1,262
|
| Advisory Fees Paid, Amount |
$ 32,956,876
|
| InvestmentCompanyPortfolioTurnover |
245.00%
|
| Additional Fund Statistics [Text Block] |
Table Summary
Fund net assets |
$5,957,083,457 |
Total number of portfolio holdings |
1,262 |
Management services fees (represents 0.55% of Fund average net assets) |
$32,956,876 |
Portfolio turnover for the reporting period |
245% |
Portfolio turnover as of the end of the period excluding transactions in to be announced securities |
59% | |
| Holdings [Text Block] |
Table Summary
|
Long |
Interest Rate Risk |
36.9% |
Credit Risk |
0.8% |
|
Short |
Interest Rate Risk |
29.5% |
Credit Risk |
2.8% |
Table Summary
Corporate Bonds & Notes |
35.6% |
Residential Mortgage-Backed Securities - Agency |
26.3% |
Senior Loans |
19.7% |
Foreign Government Obligations |
9.5% |
Asset-Backed Securities - Non-Agency |
8.9% |
Residential Mortgage-Backed Securities - Non-Agency |
8.2% |
Money Market Funds |
4.1% |
Other |
1.8% | |
| Material Fund Change [Text Block] |
|
| C000253710 |
|
| Shareholder Report [Line Items] |
|
| Fund Name |
Columbia Strategic Income Fund
|
| Class Name |
Class S
|
| Trading Symbol |
LSIDX
|
| Annual or Semi-Annual Statement [Text Block] |
This annual shareholder report contains important information about Columbia Strategic Income Fund (the Fund) for the period of September 1, 2025 to August 31, 2026.
|
| Additional Information [Text Block] |
You can find additional information about the Fund at columbiathreadneedleus.com/resources/literature. You can also request more information by contacting us at 1-800-345-6611.
|
| Additional Information Phone Number |
1-800-345-6611
|
| Additional Information Website |
columbiathreadneedleus.com/resources/literature
|
| Expenses [Text Block] |
What were the Fund costs for the reporting period? (Based on a hypothetical $10,000 investment)
Table Summary
Class |
Cost of a $10,000 investment |
Cost paid as a percentage of a $10,000 investment |
Class S |
$69 |
0.68% | |
| Expenses Paid, Amount |
$ 69
|
| Expense Ratio, Percent |
0.68%
|
| Factors Affecting Performance [Text Block] |
Management's Discussion of Fund Performance The performance of Class S shares for the period presented is shown in the Average Annual Total Returns table. Top Performance ContributorsHigh-yield corporate bonds | High-yield corporates were the largest contributor to the Fund’s relative performance during the period. Resilient issuer fundamentals and steady investor demand supported the sector, and its meaningful income advantage over Treasuries drove positive excess returns. The allocation added value relative to the benchmark, which has no exposure to below-investment-grade corporates. Emerging market debt | Emerging market debt was the second-largest contributor to relative performance during the period, supported by improving sovereign and corporate credit conditions and strong demand for higher-yielding assets. The Fund's overweight allocation to the sector added value relative to the benchmark. High-yield bank loans | Bank loans contributed positively to relative performance during the period, as elevated short-term interest rates and supportive credit conditions benefited the Fund's higher-income, floating-rate holdings. The allocation added value relative to the benchmark, which does not hold these securities. Top Performance DetractorsAgency mortgage-backed securities | Agency mortgage-backed-securities (MBS) detracted most from the Fund’s performance relative to the benchmark, driven by the Fund's inverse interest-only (IIO) holdings, which are not held in the benchmark. Coupons on these securities move inversely to short-term rates, and they were pressured as the market repriced from expecting Federal Reserve rate cuts to the possibility of hikes. Agency MBS still contributed positively to absolute return. Interest rate positioning | Interest rate positioning detracted from relative performance during the period, as yield curve positioning and implementation costs associated with the Fund’s interest rate derivatives weighed on relative results. Overall, interest rate factors still contributed positively to absolute return, as income from higher starting yields outweighed the price impact of rising Treasury yields. Investment-grade corporate bonds | The Fund’s underweight allocation to investment-grade corporates detracted from relative performance, as the sector continued to generate positive returns despite historically tight spreads. The allocation also contributed positively to absolute return. |
| Performance Past Does Not Indicate Future [Text] |
The Fund's past performance is not a good predictor of the Fund's future performance.
|
| Line Graph [Table Text Block] |
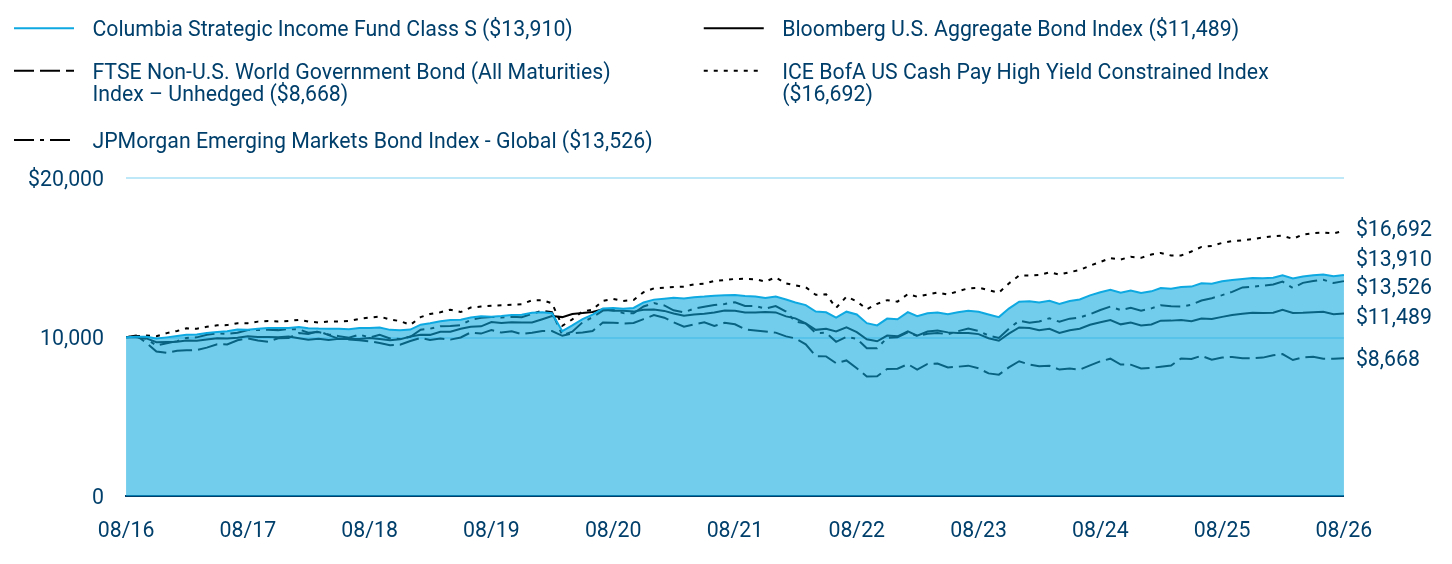
Table Summary
|
Columbia Strategic Income Fund Class S ($13,910) |
Bloomberg U.S. Aggregate Bond Index ($11,489) |
FTSE Non-U.S. World Government Bond (All Maturities) Index – Unhedged ($8,668) |
ICE BofA US Cash Pay High Yield Constrained Index ($16,692) |
JPMorgan Emerging Markets Bond Index - Global ($13,526) |
08/16 |
$10,000 |
$10,000 |
$10,000 |
$10,000 |
$10,000 |
09/16 |
$10,023 |
$9,994 |
$10,104 |
$10,065 |
$10,034 |
10/16 |
$10,023 |
$9,918 |
$9,642 |
$10,095 |
$9,887 |
11/16 |
$9,908 |
$9,683 |
$9,097 |
$10,055 |
$9,475 |
12/16 |
$9,985 |
$9,697 |
$9,009 |
$10,252 |
$9,611 |
01/17 |
$10,076 |
$9,716 |
$9,137 |
$10,389 |
$9,749 |
02/17 |
$10,149 |
$9,781 |
$9,168 |
$10,552 |
$9,952 |
03/17 |
$10,171 |
$9,776 |
$9,191 |
$10,529 |
$9,986 |
04/17 |
$10,263 |
$9,851 |
$9,340 |
$10,648 |
$10,149 |
05/17 |
$10,319 |
$9,927 |
$9,553 |
$10,745 |
$10,233 |
06/17 |
$10,374 |
$9,917 |
$9,541 |
$10,756 |
$10,207 |
07/17 |
$10,480 |
$9,960 |
$9,803 |
$10,880 |
$10,274 |
08/17 |
$10,467 |
$10,049 |
$9,924 |
$10,878 |
$10,452 |
09/17 |
$10,528 |
$10,001 |
$9,786 |
$10,976 |
$10,450 |
10/17 |
$10,573 |
$10,007 |
$9,713 |
$11,018 |
$10,469 |
11/17 |
$10,567 |
$9,994 |
$9,931 |
$10,987 |
$10,441 |
12/17 |
$10,575 |
$10,040 |
$9,940 |
$11,019 |
$10,507 |
01/18 |
$10,638 |
$9,925 |
$10,258 |
$11,089 |
$10,487 |
02/18 |
$10,561 |
$9,830 |
$10,192 |
$10,984 |
$10,281 |
03/18 |
$10,536 |
$9,894 |
$10,379 |
$10,915 |
$10,320 |
04/18 |
$10,529 |
$9,820 |
$10,126 |
$10,988 |
$10,169 |
05/18 |
$10,522 |
$9,890 |
$9,893 |
$10,986 |
$10,059 |
06/18 |
$10,497 |
$9,878 |
$9,848 |
$11,025 |
$9,957 |
07/18 |
$10,579 |
$9,880 |
$9,809 |
$11,149 |
$10,163 |
08/18 |
$10,574 |
$9,944 |
$9,737 |
$11,229 |
$9,967 |
09/18 |
$10,605 |
$9,880 |
$9,633 |
$11,294 |
$10,144 |
10/18 |
$10,457 |
$9,802 |
$9,493 |
$11,109 |
$9,917 |
11/18 |
$10,439 |
$9,860 |
$9,517 |
$11,010 |
$9,878 |
12/18 |
$10,473 |
$10,041 |
$9,759 |
$10,769 |
$10,023 |
01/19 |
$10,783 |
$10,148 |
$9,950 |
$11,264 |
$10,465 |
02/19 |
$10,873 |
$10,142 |
$9,820 |
$11,454 |
$10,531 |
03/19 |
$11,000 |
$10,337 |
$9,907 |
$11,566 |
$10,684 |
04/19 |
$11,072 |
$10,339 |
$9,844 |
$11,728 |
$10,696 |
05/19 |
$11,089 |
$10,523 |
$9,976 |
$11,579 |
$10,758 |
06/19 |
$11,236 |
$10,655 |
$10,296 |
$11,863 |
$11,085 |
07/19 |
$11,309 |
$10,679 |
$10,224 |
$11,924 |
$11,213 |
08/19 |
$11,288 |
$10,955 |
$10,451 |
$11,972 |
$11,274 |
09/19 |
$11,324 |
$10,897 |
$10,285 |
$12,009 |
$11,233 |
10/19 |
$11,397 |
$10,930 |
$10,371 |
$12,038 |
$11,275 |
11/19 |
$11,412 |
$10,924 |
$10,193 |
$12,070 |
$11,257 |
12/19 |
$11,540 |
$10,917 |
$10,278 |
$12,320 |
$11,468 |
01/20 |
$11,572 |
$11,127 |
$10,390 |
$12,321 |
$11,667 |
02/20 |
$11,509 |
$11,327 |
$10,384 |
$12,131 |
$11,573 |
03/20 |
$10,377 |
$11,260 |
$10,084 |
$10,709 |
$10,120 |
04/20 |
$10,736 |
$11,460 |
$10,237 |
$11,116 |
$10,342 |
05/20 |
$11,135 |
$11,514 |
$10,286 |
$11,621 |
$10,935 |
06/20 |
$11,420 |
$11,586 |
$10,385 |
$11,729 |
$11,254 |
07/20 |
$11,802 |
$11,759 |
$10,916 |
$12,286 |
$11,670 |
08/20 |
$11,835 |
$11,665 |
$10,907 |
$12,409 |
$11,704 |
09/20 |
$11,784 |
$11,658 |
$10,861 |
$12,281 |
$11,511 |
10/20 |
$11,840 |
$11,606 |
$10,889 |
$12,337 |
$11,497 |
11/20 |
$12,181 |
$11,720 |
$11,135 |
$12,826 |
$11,928 |
12/20 |
$12,361 |
$11,736 |
$11,385 |
$13,072 |
$12,142 |
01/21 |
$12,421 |
$11,652 |
$11,225 |
$13,114 |
$11,995 |
02/21 |
$12,477 |
$11,484 |
$10,938 |
$13,157 |
$11,687 |
03/21 |
$12,439 |
$11,340 |
$10,654 |
$13,179 |
$11,566 |
04/21 |
$12,510 |
$11,430 |
$10,799 |
$13,323 |
$11,787 |
05/21 |
$12,551 |
$11,467 |
$10,932 |
$13,359 |
$11,915 |
06/21 |
$12,612 |
$11,548 |
$10,702 |
$13,540 |
$12,021 |
07/21 |
$12,629 |
$11,677 |
$10,900 |
$13,590 |
$12,086 |
08/21 |
$12,644 |
$11,655 |
$10,809 |
$13,665 |
$12,196 |
09/21 |
$12,592 |
$11,554 |
$10,491 |
$13,668 |
$11,957 |
10/21 |
$12,559 |
$11,551 |
$10,418 |
$13,644 |
$11,964 |
11/21 |
$12,471 |
$11,585 |
$10,353 |
$13,502 |
$11,791 |
12/21 |
$12,555 |
$11,555 |
$10,284 |
$13,761 |
$11,959 |
01/22 |
$12,367 |
$11,306 |
$10,048 |
$13,384 |
$11,613 |
02/22 |
$12,185 |
$11,180 |
$9,920 |
$13,262 |
$10,974 |
03/22 |
$12,019 |
$10,869 |
$9,551 |
$13,141 |
$10,851 |
04/22 |
$11,610 |
$10,457 |
$8,806 |
$12,663 |
$10,257 |
05/22 |
$11,564 |
$10,524 |
$8,789 |
$12,700 |
$10,276 |
06/22 |
$11,229 |
$10,359 |
$8,357 |
$11,837 |
$9,707 |
07/22 |
$11,603 |
$10,612 |
$8,534 |
$12,551 |
$10,017 |
08/22 |
$11,425 |
$10,313 |
$8,040 |
$12,247 |
$9,900 |
09/22 |
$10,881 |
$9,867 |
$7,525 |
$11,757 |
$9,299 |
10/22 |
$10,738 |
$9,739 |
$7,538 |
$12,095 |
$9,306 |
11/22 |
$11,165 |
$10,097 |
$7,994 |
$12,327 |
$9,953 |
12/22 |
$11,128 |
$10,052 |
$8,014 |
$12,234 |
$9,991 |
01/23 |
$11,576 |
$10,361 |
$8,298 |
$12,709 |
$10,302 |
02/23 |
$11,312 |
$10,093 |
$7,957 |
$12,545 |
$10,075 |
03/23 |
$11,498 |
$10,350 |
$8,312 |
$12,684 |
$10,215 |
04/23 |
$11,555 |
$10,412 |
$8,338 |
$12,806 |
$10,267 |
05/23 |
$11,441 |
$10,299 |
$8,093 |
$12,683 |
$10,176 |
06/23 |
$11,564 |
$10,262 |
$8,137 |
$12,888 |
$10,372 |
07/23 |
$11,662 |
$10,255 |
$8,205 |
$13,073 |
$10,539 |
08/23 |
$11,603 |
$10,189 |
$8,038 |
$13,112 |
$10,392 |
09/23 |
$11,428 |
$9,931 |
$7,717 |
$12,957 |
$10,099 |
10/23 |
$11,260 |
$9,774 |
$7,638 |
$12,795 |
$9,953 |
11/23 |
$11,796 |
$10,216 |
$8,093 |
$13,381 |
$10,529 |
12/23 |
$12,225 |
$10,608 |
$8,481 |
$13,875 |
$11,035 |
01/24 |
$12,251 |
$10,578 |
$8,273 |
$13,876 |
$10,905 |
02/24 |
$12,176 |
$10,429 |
$8,164 |
$13,914 |
$10,980 |
03/24 |
$12,282 |
$10,525 |
$8,191 |
$14,079 |
$11,189 |
04/24 |
$12,087 |
$10,259 |
$7,958 |
$13,937 |
$10,965 |
05/24 |
$12,272 |
$10,433 |
$8,022 |
$14,091 |
$11,164 |
06/24 |
$12,372 |
$10,532 |
$7,959 |
$14,223 |
$11,238 |
07/24 |
$12,628 |
$10,778 |
$8,226 |
$14,500 |
$11,443 |
08/24 |
$12,826 |
$10,933 |
$8,478 |
$14,734 |
$11,710 |
09/24 |
$12,984 |
$11,079 |
$8,644 |
$14,972 |
$11,920 |
10/24 |
$12,790 |
$10,805 |
$8,277 |
$14,887 |
$11,706 |
11/24 |
$12,937 |
$10,919 |
$8,267 |
$15,057 |
$11,845 |
12/24 |
$12,778 |
$10,740 |
$8,031 |
$14,991 |
$11,668 |
01/25 |
$12,883 |
$10,797 |
$8,066 |
$15,199 |
$11,811 |
02/25 |
$13,086 |
$11,035 |
$8,134 |
$15,300 |
$12,006 |
03/25 |
$13,053 |
$11,039 |
$8,217 |
$15,137 |
$11,941 |
04/25 |
$13,148 |
$11,082 |
$8,658 |
$15,137 |
$11,931 |
05/25 |
$13,182 |
$11,003 |
$8,626 |
$15,392 |
$12,033 |
06/25 |
$13,389 |
$11,172 |
$8,823 |
$15,676 |
$12,307 |
07/25 |
$13,361 |
$11,143 |
$8,579 |
$15,737 |
$12,452 |
08/25 |
$13,520 |
$11,276 |
$8,714 |
$15,933 |
$12,643 |
09/25 |
$13,597 |
$11,399 |
$8,753 |
$16,054 |
$12,847 |
10/25 |
$13,657 |
$11,470 |
$8,673 |
$16,085 |
$13,130 |
11/25 |
$13,723 |
$11,541 |
$8,672 |
$16,169 |
$13,169 |
12/25 |
$13,704 |
$11,524 |
$8,711 |
$16,273 |
$13,237 |
01/26 |
$13,733 |
$11,537 |
$8,853 |
$16,352 |
$13,311 |
02/26 |
$13,896 |
$11,726 |
$8,934 |
$16,382 |
$13,497 |
03/26 |
$13,687 |
$11,519 |
$8,558 |
$16,187 |
$13,086 |
04/26 |
$13,820 |
$11,532 |
$8,729 |
$16,461 |
$13,417 |
05/26 |
$13,895 |
$11,568 |
$8,767 |
$16,541 |
$13,527 |
06/26 |
$13,944 |
$11,596 |
$8,640 |
$16,578 |
$13,614 |
07/26 |
$13,826 |
$11,445 |
$8,633 |
$16,531 |
$13,404 |
08/26 |
$13,910 |
$11,489 |
$8,668 |
$16,692 |
$13,526 |
|
| Average Annual Return [Table Text Block] |
Table Summary
Average Annual Total Returns (%) |
1 year |
5 years |
10 years |
Class SFootnote Reference(a) |
2.89 |
1.93 |
3.36 |
Bloomberg U.S. Aggregate Bond Index |
1.89 |
(0.29) |
1.40 |
FTSE Non-U.S. World Government Bond (All Maturities) Index – Unhedged |
(0.54) |
(4.32) |
(1.42) |
ICE BofA US Cash Pay High Yield Constrained Index |
4.77 |
4.08 |
5.26 |
JPMorgan Emerging Markets Bond Index - Global |
6.99 |
2.09 |
3.07 | |
| No Deduction of Taxes [Text Block] |
Performance does not reflect the deduction of taxes that a shareholder may pay on fund distributions or on the redemptions of fund shares.
|
| Updated Performance Information Location [Text Block] |
columbiathreadneedleus.com/investment-products/mutual-funds
|
| AssetsNet |
$ 5,957,083,457
|
| Holdings Count | Holding |
1,262
|
| Advisory Fees Paid, Amount |
$ 32,956,876
|
| InvestmentCompanyPortfolioTurnover |
245.00%
|
| Additional Fund Statistics [Text Block] |
Table Summary
Fund net assets |
$5,957,083,457 |
Total number of portfolio holdings |
1,262 |
Management services fees (represents 0.55% of Fund average net assets) |
$32,956,876 |
Portfolio turnover for the reporting period |
245% |
Portfolio turnover as of the end of the period excluding transactions in to be announced securities |
59% | |
| Holdings [Text Block] |
Table Summary
|
Long |
Interest Rate Risk |
36.9% |
Credit Risk |
0.8% |
|
Short |
Interest Rate Risk |
29.5% |
Credit Risk |
2.8% |
Table Summary
Corporate Bonds & Notes |
35.6% |
Residential Mortgage-Backed Securities - Agency |
26.3% |
Senior Loans |
19.7% |
Foreign Government Obligations |
9.5% |
Asset-Backed Securities - Non-Agency |
8.9% |
Residential Mortgage-Backed Securities - Non-Agency |
8.2% |
Money Market Funds |
4.1% |
Other |
1.8% | |
| Material Fund Change [Text Block] |
|
| C000179757 |
|
| Shareholder Report [Line Items] |
|
| Fund Name |
Multi-Manager Alternative Strategies Fund
|
| Class Name |
Institutional Class
|
| Trading Symbol |
CZAMX
|
| Annual or Semi-Annual Statement [Text Block] |
This annual shareholder report contains important information about Multi-Manager Alternative Strategies Fund (the Fund) for the period of September 1, 2025 to August 31, 2026.
|
| Additional Information [Text Block] |
You can find additional information about the Fund at columbiathreadneedleus.com/resources/literature. You can also request more information by contacting us at 1-800-345-6611.
|
| Material Fund Change Notice [Text Block] |
This report describes changes to the Fund that occurred during the reporting period.
|
| Additional Information Phone Number |
1-800-345-6611
|
| Additional Information Email |
<span style="box-sizing: border-box; color: rgb(0, 63, 107); display: inline; flex-wrap: nowrap; font-size: 13.3333px; font-weight: 400; grid-area: auto; line-height: 16px; margin: 0px; overflow: visible; text-align: left; text-align-last: auto; white-space-collapse: preserve-breaks;">serviceinquiries@columbiathreadneedle.com</span>
|
| Additional Information Website |
columbiathreadneedleus.com/resources/literature
|
| Expenses [Text Block] |
What were the Fund costs for the reporting period? (Based on a hypothetical $10,000 investment)
Table Summary
Class |
Cost of a $10,000 investment |
Cost paid as a percentage of a $10,000 investment |
Institutional Class |
$130 |
1.25% | |
| Expenses Paid, Amount |
$ 130
|
| Expense Ratio, Percent |
1.25%
|
| Factors Affecting Performance [Text Block] |
Management's Discussion of Fund Performance The performance of Institutional Class shares for the period presented is shown in the Average Annual Total Returns table. Top Performance ContributorsStrategy | On an absolute basis, the managed futures strategy, which is quantitative and primarily employs a trend following approach, contributed strong gains for the Fund during the period. Unconstrained fixed-income allocations added to Fund performance, in large part because of accretive sector allocation. Asset classes | Managers employing a managed futures strategy generated most of their returns across equity and commodity markets. While the long equity positioning globally was additive, Asian markets such as Taiwan and Japan performed best. Within commodities, long exposure to precious metals in late 2025, as well as energy markets in early 2026, drove performance. The significant precious metals rally was in part driven by the weakening U.S. dollar. Managers employing unconstrained fixed-income strategies delivered gains across high-yield corporates, investment-grade corporates and non-agency mortgage-backed securities. Top Performance DetractorsAsset classes | Managers employing a managed futures strategy incurred modest absolute losses in the fixed-income markets in the absence of any sustained trends. The models’ exposure to the fixed income remained muted for most of the period. Managers employing an unconstrained fixed-income strategy were negatively impacted by their duration exposure as interest rates moved higher. Nevertheless, the losses were contained as the managers maintained below-average duration exposure. |
| Performance Past Does Not Indicate Future [Text] |
The Fund's past performance is not a good predictor of the Fund's future performance.
|
| Line Graph [Table Text Block] |
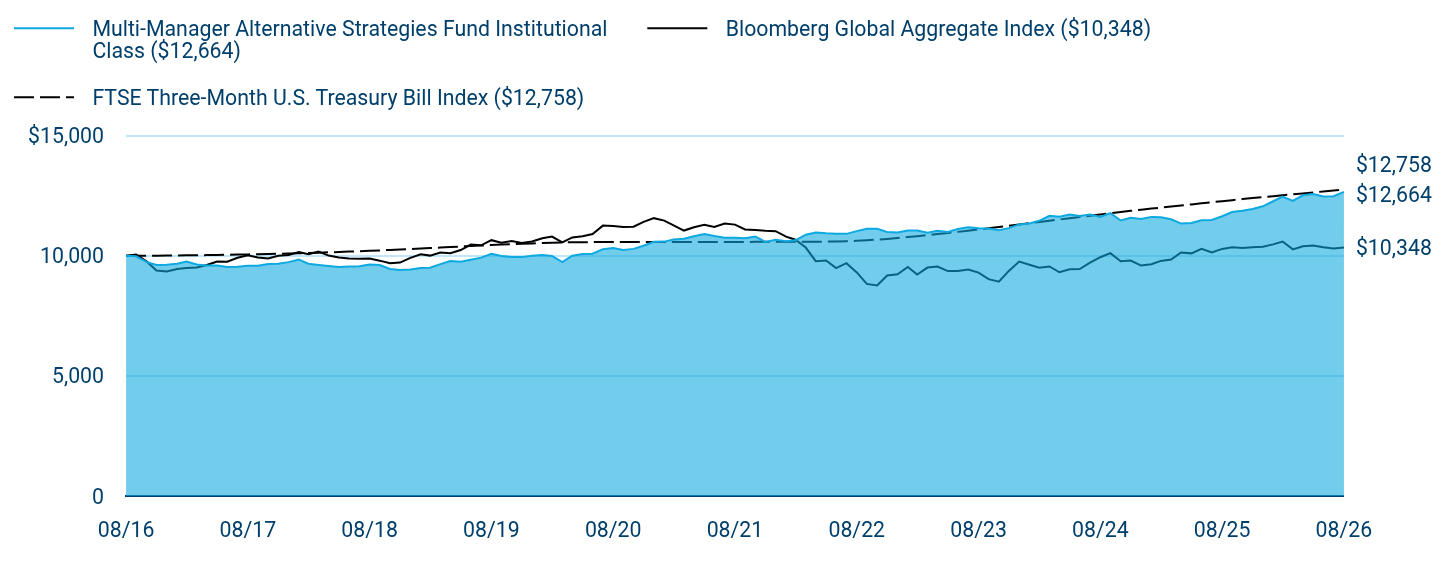
Table Summary
|
Multi-Manager Alternative Strategies Fund Institutional Class ($12,664) |
Bloomberg Global Aggregate Index ($10,348) |
FTSE Three-Month U.S. Treasury Bill Index ($12,758) |
08/16 |
$10,000 |
$10,000 |
$10,000 |
09/16 |
$9,979 |
$10,055 |
$10,002 |
10/16 |
$9,746 |
$9,776 |
$10,005 |
11/16 |
$9,619 |
$9,388 |
$10,007 |
12/16 |
$9,630 |
$9,344 |
$10,011 |
01/17 |
$9,672 |
$9,450 |
$10,014 |
02/17 |
$9,757 |
$9,494 |
$10,018 |
03/17 |
$9,640 |
$9,509 |
$10,023 |
04/17 |
$9,598 |
$9,616 |
$10,028 |
05/17 |
$9,598 |
$9,765 |
$10,034 |
06/17 |
$9,534 |
$9,756 |
$10,041 |
07/17 |
$9,545 |
$9,920 |
$10,049 |
08/17 |
$9,587 |
$10,019 |
$10,058 |
09/17 |
$9,587 |
$9,929 |
$10,067 |
10/17 |
$9,661 |
$9,891 |
$10,076 |
11/17 |
$9,672 |
$10,001 |
$10,085 |
12/17 |
$9,736 |
$10,035 |
$10,095 |
01/18 |
$9,842 |
$10,155 |
$10,106 |
02/18 |
$9,672 |
$10,065 |
$10,117 |
03/18 |
$9,619 |
$10,172 |
$10,130 |
04/18 |
$9,576 |
$10,009 |
$10,144 |
05/18 |
$9,534 |
$9,933 |
$10,159 |
06/18 |
$9,555 |
$9,889 |
$10,174 |
07/18 |
$9,566 |
$9,873 |
$10,191 |
08/18 |
$9,640 |
$9,883 |
$10,208 |
09/18 |
$9,619 |
$9,798 |
$10,225 |
10/18 |
$9,449 |
$9,688 |
$10,244 |
11/18 |
$9,407 |
$9,719 |
$10,263 |
12/18 |
$9,428 |
$9,915 |
$10,283 |
01/19 |
$9,493 |
$10,066 |
$10,304 |
02/19 |
$9,504 |
$10,008 |
$10,323 |
03/19 |
$9,654 |
$10,133 |
$10,344 |
04/19 |
$9,784 |
$10,103 |
$10,365 |
05/19 |
$9,751 |
$10,240 |
$10,387 |
06/19 |
$9,838 |
$10,467 |
$10,408 |
07/19 |
$9,924 |
$10,438 |
$10,428 |
08/19 |
$10,085 |
$10,650 |
$10,448 |
09/19 |
$9,988 |
$10,542 |
$10,466 |
10/19 |
$9,945 |
$10,612 |
$10,484 |
11/19 |
$9,945 |
$10,532 |
$10,500 |
12/19 |
$10,002 |
$10,593 |
$10,514 |
01/20 |
$10,035 |
$10,728 |
$10,529 |
02/20 |
$9,991 |
$10,801 |
$10,542 |
03/20 |
$9,738 |
$10,559 |
$10,555 |
04/20 |
$10,002 |
$10,766 |
$10,564 |
05/20 |
$10,079 |
$10,813 |
$10,568 |
06/20 |
$10,090 |
$10,909 |
$10,570 |
07/20 |
$10,277 |
$11,257 |
$10,571 |
08/20 |
$10,321 |
$11,240 |
$10,572 |
09/20 |
$10,244 |
$11,200 |
$10,573 |
10/20 |
$10,288 |
$11,210 |
$10,574 |
11/20 |
$10,420 |
$11,414 |
$10,575 |
12/20 |
$10,580 |
$11,567 |
$10,575 |
01/21 |
$10,591 |
$11,465 |
$10,576 |
02/21 |
$10,680 |
$11,268 |
$10,577 |
03/21 |
$10,713 |
$11,051 |
$10,577 |
04/21 |
$10,813 |
$11,191 |
$10,578 |
05/21 |
$10,902 |
$11,296 |
$10,578 |
06/21 |
$10,824 |
$11,196 |
$10,578 |
07/21 |
$10,747 |
$11,345 |
$10,578 |
08/21 |
$10,747 |
$11,298 |
$10,579 |
09/21 |
$10,735 |
$11,098 |
$10,579 |
10/21 |
$10,802 |
$11,071 |
$10,580 |
11/21 |
$10,580 |
$11,038 |
$10,580 |
12/21 |
$10,665 |
$11,023 |
$10,580 |
01/22 |
$10,609 |
$10,797 |
$10,581 |
02/22 |
$10,643 |
$10,669 |
$10,582 |
03/22 |
$10,879 |
$10,344 |
$10,583 |
04/22 |
$10,969 |
$9,777 |
$10,586 |
05/22 |
$10,935 |
$9,804 |
$10,591 |
06/22 |
$10,913 |
$9,489 |
$10,599 |
07/22 |
$10,913 |
$9,691 |
$10,610 |
08/22 |
$11,026 |
$9,308 |
$10,625 |
09/22 |
$11,127 |
$8,830 |
$10,646 |
10/22 |
$11,127 |
$8,769 |
$10,673 |
11/22 |
$10,992 |
$9,182 |
$10,703 |
12/22 |
$10,969 |
$9,232 |
$10,739 |
01/23 |
$11,054 |
$9,535 |
$10,779 |
02/23 |
$11,054 |
$9,218 |
$10,816 |
03/23 |
$10,957 |
$9,509 |
$10,860 |
04/23 |
$11,042 |
$9,551 |
$10,903 |
05/23 |
$10,993 |
$9,365 |
$10,949 |
06/23 |
$11,115 |
$9,364 |
$10,996 |
07/23 |
$11,187 |
$9,429 |
$11,046 |
08/23 |
$11,151 |
$9,300 |
$11,097 |
09/23 |
$11,139 |
$9,028 |
$11,147 |
10/23 |
$11,066 |
$8,920 |
$11,200 |
11/23 |
$11,151 |
$9,370 |
$11,251 |
12/23 |
$11,306 |
$9,759 |
$11,304 |
01/24 |
$11,344 |
$9,625 |
$11,357 |
02/24 |
$11,456 |
$9,504 |
$11,406 |
03/24 |
$11,667 |
$9,556 |
$11,459 |
04/24 |
$11,630 |
$9,315 |
$11,510 |
05/24 |
$11,717 |
$9,437 |
$11,564 |
06/24 |
$11,655 |
$9,451 |
$11,616 |
07/24 |
$11,717 |
$9,712 |
$11,670 |
08/24 |
$11,617 |
$9,941 |
$11,724 |
09/24 |
$11,779 |
$10,111 |
$11,775 |
10/24 |
$11,468 |
$9,772 |
$11,826 |
11/24 |
$11,580 |
$9,805 |
$11,873 |
12/24 |
$11,531 |
$9,595 |
$11,920 |
01/25 |
$11,620 |
$9,649 |
$11,966 |
02/25 |
$11,607 |
$9,787 |
$12,006 |
03/25 |
$11,518 |
$9,847 |
$12,051 |
04/25 |
$11,340 |
$10,137 |
$12,094 |
05/25 |
$11,366 |
$10,101 |
$12,139 |
06/25 |
$11,480 |
$10,292 |
$12,183 |
07/25 |
$11,493 |
$10,139 |
$12,228 |
08/25 |
$11,646 |
$10,286 |
$12,274 |
09/25 |
$11,824 |
$10,354 |
$12,317 |
10/25 |
$11,874 |
$10,327 |
$12,361 |
11/25 |
$11,951 |
$10,351 |
$12,402 |
12/25 |
$12,060 |
$10,378 |
$12,444 |
01/26 |
$12,270 |
$10,475 |
$12,484 |
02/26 |
$12,467 |
$10,593 |
$12,520 |
03/26 |
$12,284 |
$10,267 |
$12,559 |
04/26 |
$12,520 |
$10,395 |
$12,598 |
05/26 |
$12,572 |
$10,430 |
$12,638 |
06/26 |
$12,467 |
$10,356 |
$12,677 |
07/26 |
$12,480 |
$10,301 |
$12,717 |
08/26 |
$12,664 |
$10,348 |
$12,758 |
|
| Average Annual Return [Table Text Block] |
Table Summary
Average Annual Total Returns (%) |
1 year |
5 years |
10 years |
Institutional ClassFootnote Reference(a)Footnote Reference(b) |
8.75 |
3.34 |
2.39 |
Bloomberg Global Aggregate Index |
0.60 |
(1.74) |
0.34 |
FTSE Three-Month U.S. Treasury Bill Index |
3.95 |
3.82 |
2.47 | |
| No Deduction of Taxes [Text Block] |
Performance does not reflect the deduction of taxes that a shareholder may pay on fund distributions or on the redemptions of fund shares.
|
| Updated Performance Information Location [Text Block] |
columbiathreadneedleus.com/investment-products/mutual-funds
|
| AssetsNet |
$ 616,045,563
|
| Holdings Count | Holding |
1,668
|
| Advisory Fees Paid, Amount |
$ 6,161,853
|
| InvestmentCompanyPortfolioTurnover |
165.00%
|
| Additional Fund Statistics [Text Block] |
Table Summary
Fund net assets |
$616,045,563 |
Total number of portfolio holdings |
1,668 |
Management services fees (represents 1.09% of Fund average net assets) |
$6,161,853 |
Portfolio turnover for the reporting period |
165% | |
| Holdings [Text Block] |
Table Summary
|
Long |
Foreign Exchange Risk |
50.0% |
Interest Rate Risk |
13.7% |
Equity Risk |
13.0% |
Commodity-Related Investment Risk |
11.6% |
Credit Risk |
4.1% |
|
Short |
Interest Rate Risk |
106.7% |
Foreign Exchange Risk |
33.3% |
Credit Risk |
7.3% |
Equity Risk |
2.0% |
Commodity-Related Investment Risk |
1.7% |
Table Summary
Corporate Bonds & Notes |
31.4% |
Money Market Funds |
26.9% |
Residential Mortgage-Backed Securities - Non-Agency |
9.9% |
Residential Mortgage-Backed Securities - Agency |
6.4% |
Foreign Government Obligations |
5.8% |
Asset-Backed Securities - Non-Agency |
4.9% |
Commercial Mortgage-Backed Securities - Non-Agency |
4.4% |
Senior Loans |
3.3% |
U.S. Treasury Obligations |
2.3% |
Other |
2.8% |
Corporate Bonds & Notes |
(0.3%) | |
| Material Fund Change [Text Block] |
This is a summary of the changes to the Fund. For more complete information, you may review the Fund’s prospectus, which is available at columbiathreadneedleus.com/resources/literature or upon request at 1-800-345-6611. Effective March 5, 2026, MidOcean Credit Fund Management, L.P. assumed day-to-day management of a portion of the Fund’s portfolio. |
| Material Fund Change Adviser [Text Block] |
Effective March 5, 2026, MidOcean Credit Fund Management, L.P. assumed day-to-day management of a portion of the Fund’s portfolio.
|
| Summary of Change Legend [Text Block] |
This is a summary of the changes to the Fund. For more complete information, you may review the Fund’s prospectus, which is available at columbiathreadneedleus.com/resources/literature or upon request at 1-800-345-6611.
|
| Updated Prospectus Phone Number |
1-800-345-6611
|
| Updated Prospectus Web Address |
columbiathreadneedleus.com/resources/literature
|
| C000199958 |
|
| Shareholder Report [Line Items] |
|
| Fund Name |
Multi-Manager International Equity Strategies Fund
|
| Class Name |
Institutional Class
|
| Trading Symbol |
CMIEX
|
| Annual or Semi-Annual Statement [Text Block] |
This annual shareholder report contains important information about Multi-Manager International Equity Strategies Fund (the Fund) for the period of September 1, 2025 to August 31, 2026.
|
| Additional Information [Text Block] |
You can find additional information about the Fund at columbiathreadneedleus.com/resources/literature. You can also request more information by contacting us at 1-800-345-6611.
|
| Additional Information Phone Number |
1-800-345-6611
|
| Additional Information Website |
columbiathreadneedleus.com/resources/literature
|
| Expenses [Text Block] |
What were the Fund costs for the reporting period? (Based on a hypothetical $10,000 investment)
Table Summary
Class |
Cost of a $10,000 investment |
Cost paid as a percentage of a $10,000 investment |
Institutional Class |
$101 |
0.91% | |
| Expenses Paid, Amount |
$ 101
|
| Expense Ratio, Percent |
0.91%
|
| Factors Affecting Performance [Text Block] |
Management's Discussion of Fund Performance The performance of Institutional Class shares for the period presented is shown in the Average Annual Total Returns table. Top Performance ContributorsStock selection | Selection in Japan boosted the Fund’s benchmark relative performance during the annual period. From a sector perspective, selection within the information technology sector added to the Fund’s benchmark relative performance during the period. Allocations | Out-of-benchmark allocations to both South Korea and Taiwan buoyed the Fund’s relative performance during the period, specifically securities held within the information technology sector. Individual holdings | Positions in Kioxia, a Japan-based memory chip manufacturer; Samsung Electronics, a manufacturer of electronics and computer peripherals based in South Korea; Renesas Electronics, a Japan-based semiconductor manufacturer; Infineon Technologies, a German-based manufacturer of semiconductors for the automotive industry; and Taiwan Semiconductor Manufacturing Co., were among the top contributors to the Fund’s relative performance. Top Performance DetractorsStock selection | Selection in the Netherlands and the United Kingdom detracted from the Fund’s benchmark relative performance during the period. From a sector perspective, selection within the consumer discretionary sector detracted from benchmark relative performance. Allocations | An out-of-benchmark allocation to China and an overweight to the communication services sector detracted from relative performance during the period. Individual holdings | Fund positions in Tencent, a China-based FinTech and provider of online and mobile games; Alstom, a France-based provider of main-line and urban transportation; and Carnival, an operator of cruise ships, were among the top detractors from relative performance during the period. No exposure to HSBC, a United Kingdom-based financial services company; and a relative underweight to ASML, a Netherlands-based manufacturer of semiconductor equipment, also detracted from relative performance during the period. |
| Performance Past Does Not Indicate Future [Text] |
The Fund's past performance is not a good predictor of the Fund's future performance.
|
| Line Graph [Table Text Block] |
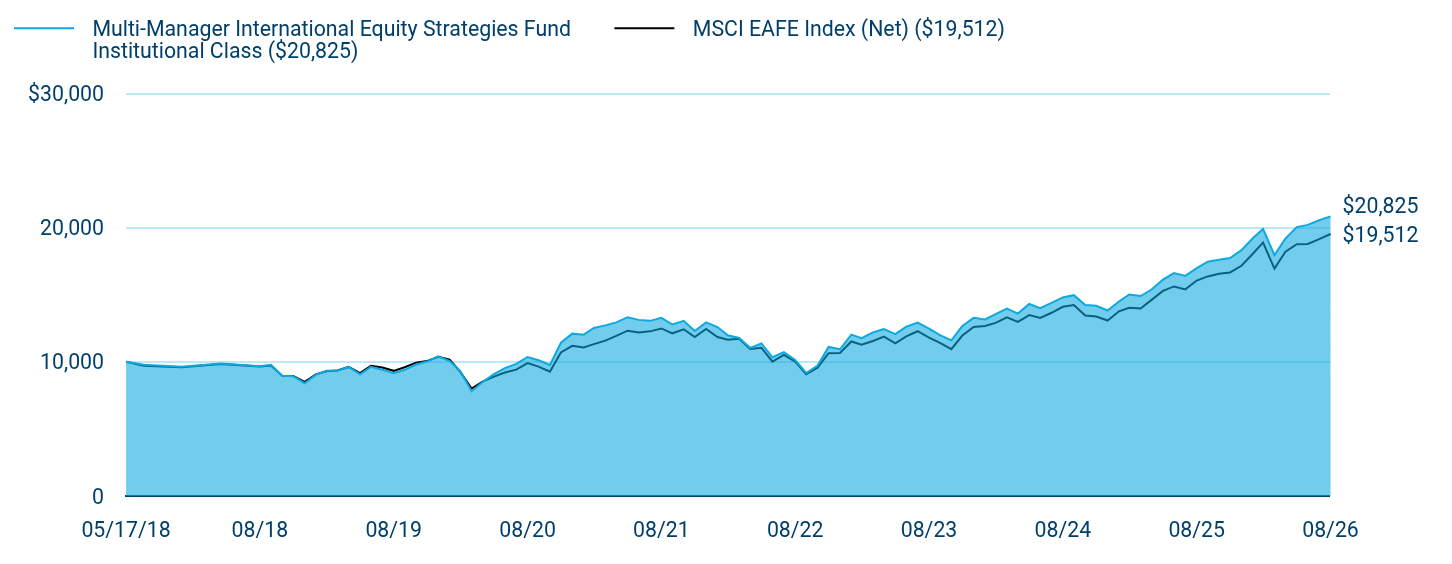
Table Summary
|
Multi-Manager International Equity Strategies Fund Institutional Class ($20,825) |
MSCI EAFE Index (Net) ($19,512) |
05/17/18 |
$10,000 |
$10,000 |
05/31/18 |
$9,780 |
$9,707 |
06/30/18 |
$9,620 |
$9,588 |
07/31/18 |
$9,860 |
$9,825 |
08/31/18 |
$9,670 |
$9,635 |
09/30/18 |
$9,770 |
$9,718 |
10/31/18 |
$8,960 |
$8,945 |
11/30/18 |
$8,920 |
$8,934 |
12/31/18 |
$8,399 |
$8,500 |
01/31/19 |
$9,034 |
$9,059 |
02/28/19 |
$9,326 |
$9,289 |
03/31/19 |
$9,337 |
$9,348 |
04/30/19 |
$9,619 |
$9,611 |
05/31/19 |
$9,054 |
$9,149 |
06/30/19 |
$9,619 |
$9,692 |
07/31/19 |
$9,397 |
$9,569 |
08/31/19 |
$9,135 |
$9,321 |
09/30/19 |
$9,397 |
$9,588 |
10/31/19 |
$9,790 |
$9,933 |
11/30/19 |
$10,012 |
$10,045 |
12/31/19 |
$10,405 |
$10,371 |
01/31/20 |
$10,054 |
$10,155 |
02/29/20 |
$9,299 |
$9,237 |
03/31/20 |
$7,801 |
$8,004 |
04/30/20 |
$8,483 |
$8,521 |
05/31/20 |
$9,082 |
$8,892 |
06/30/20 |
$9,527 |
$9,195 |
07/31/20 |
$9,837 |
$9,409 |
08/31/20 |
$10,353 |
$9,893 |
09/30/20 |
$10,105 |
$9,636 |
10/31/20 |
$9,764 |
$9,251 |
11/30/20 |
$11,417 |
$10,685 |
12/31/20 |
$12,090 |
$11,182 |
01/31/21 |
$12,016 |
$11,063 |
02/28/21 |
$12,508 |
$11,311 |
03/31/21 |
$12,707 |
$11,571 |
04/30/21 |
$12,927 |
$11,919 |
05/31/21 |
$13,314 |
$12,308 |
06/30/21 |
$13,115 |
$12,169 |
07/31/21 |
$13,042 |
$12,261 |
08/31/21 |
$13,262 |
$12,477 |
09/30/21 |
$12,770 |
$12,115 |
10/31/21 |
$13,042 |
$12,413 |
11/30/21 |
$12,288 |
$11,835 |
12/31/21 |
$12,926 |
$12,441 |
01/31/22 |
$12,580 |
$11,840 |
02/28/22 |
$11,963 |
$11,631 |
03/31/22 |
$11,768 |
$11,705 |
04/30/22 |
$11,033 |
$10,948 |
05/31/22 |
$11,357 |
$11,030 |
06/30/22 |
$10,330 |
$10,007 |
07/31/22 |
$10,708 |
$10,505 |
08/31/22 |
$10,124 |
$10,006 |
09/30/22 |
$9,162 |
$9,070 |
10/31/22 |
$9,713 |
$9,558 |
11/30/22 |
$11,098 |
$10,635 |
12/31/22 |
$10,928 |
$10,643 |
01/31/23 |
$12,014 |
$11,505 |
02/28/23 |
$11,748 |
$11,265 |
03/31/23 |
$12,180 |
$11,544 |
04/30/23 |
$12,435 |
$11,870 |
05/31/23 |
$12,058 |
$11,368 |
06/30/23 |
$12,613 |
$11,885 |
07/31/23 |
$12,912 |
$12,270 |
08/31/23 |
$12,457 |
$11,800 |
09/30/23 |
$11,981 |
$11,397 |
10/31/23 |
$11,593 |
$10,935 |
11/30/23 |
$12,657 |
$11,949 |
12/31/23 |
$13,265 |
$12,584 |
01/31/24 |
$13,152 |
$12,657 |
02/29/24 |
$13,549 |
$12,888 |
03/31/24 |
$13,957 |
$13,312 |
04/30/24 |
$13,583 |
$12,971 |
05/31/24 |
$14,297 |
$13,474 |
06/30/24 |
$13,991 |
$13,256 |
07/31/24 |
$14,376 |
$13,645 |
08/31/24 |
$14,784 |
$14,089 |
09/30/24 |
$14,954 |
$14,219 |
10/31/24 |
$14,229 |
$13,446 |
11/30/24 |
$14,161 |
$13,369 |
12/31/24 |
$13,815 |
$13,065 |
01/31/25 |
$14,486 |
$13,752 |
02/28/25 |
$15,010 |
$14,019 |
03/31/25 |
$14,889 |
$13,962 |
04/30/25 |
$15,376 |
$14,602 |
05/31/25 |
$16,108 |
$15,270 |
06/30/25 |
$16,596 |
$15,606 |
07/31/25 |
$16,388 |
$15,387 |
08/31/25 |
$16,974 |
$16,043 |
09/30/25 |
$17,449 |
$16,350 |
10/31/25 |
$17,596 |
$16,543 |
11/30/25 |
$17,717 |
$16,645 |
12/31/25 |
$18,310 |
$17,145 |
01/31/26 |
$19,189 |
$18,039 |
02/28/26 |
$19,881 |
$18,874 |
03/31/26 |
$17,938 |
$16,932 |
04/30/26 |
$19,162 |
$18,193 |
05/31/26 |
$20,027 |
$18,751 |
06/30/26 |
$20,187 |
$18,764 |
07/31/26 |
$20,533 |
$19,131 |
08/31/26 |
$20,825 |
$19,512 |
|
| Average Annual Return [Table Text Block] |
Table Summary
Average Annual Total Returns (%) |
1 year |
5 years |
Since Fund Inception |
Institutional ClassFootnote Reference(a) |
22.69 |
9.45 |
9.25 |
MSCI EAFE Index (Net) |
21.62 |
9.35 |
8.40 | |
| No Deduction of Taxes [Text Block] |
Performance does not reflect the deduction of taxes that a shareholder may pay on fund distributions or on the redemptions of fund shares.
|
| Updated Performance Information Location [Text Block] |
columbiathreadneedleus.com/investment-products/mutual-funds
|
| AssetsNet |
$ 3,024,459,911
|
| Holdings Count | Holding |
551
|
| Advisory Fees Paid, Amount |
$ 24,323,713
|
| InvestmentCompanyPortfolioTurnover |
50.00%
|
| Additional Fund Statistics [Text Block] |
Table Summary
Fund net assets |
$3,024,459,911 |
Total number of portfolio holdings |
551 |
Management services fees (represents 0.77% of Fund average net assets) |
$24,323,713 |
Portfolio turnover for the reporting period |
50% | |
| Holdings [Text Block] |
Table Summary
Japan |
15.7% |
|
United Kingdom |
15.5% |
|
France |
11.5% |
|
Germany |
9.9% |
|
Netherlands |
5.2% |
|
Switzerland |
5.0% |
|
United States |
4.5% |
|
China |
4.5% |
|
Italy |
4.4% |
|
Hong Kong |
3.9% |
|
Other |
19.3% |
|
Table Summary
Financials |
21.9% |
Information Technology |
17.0% |
Industrials |
16.7% |
Health Care |
11.2% |
Consumer Discretionary |
9.7% |
Communication Services |
6.1% |
Consumer Staples |
5.9% |
Materials |
4.9% |
Energy |
3.0% |
Utilities |
1.9% |
Other |
0.4% | |
| Largest Holdings [Text Block] |
Table Summary
SAP SE |
2.2% |
ASML Holding NV |
2.1% |
Roche Holding Ag |
2.0% |
Tencent Holdings Ltd. |
1.8% |
Kering SA |
1.8% |
Rolls-Royce Holdings PLC |
1.4% |
BNP Paribas SA |
1.2% |
Reckitt Benckiser Group PLC |
1.2% |
Taiwan Semiconductor Manufacturing Co., Ltd. |
1.2% |
Siemens AG, Registered Shares |
1.2% | |
| Material Fund Change [Text Block] |
|
| C000179756 |
|
| Shareholder Report [Line Items] |
|
| Fund Name |
Multi-Manager Small Cap Equity Strategies Fund
|
| Class Name |
Institutional Class
|
| Trading Symbol |
CZMSX
|
| Annual or Semi-Annual Statement [Text Block] |
This annual shareholder report contains important information about Multi-Manager Small Cap Equity Strategies Fund (the Fund) for the period of September 1, 2025 to August 31, 2026.
|
| Additional Information [Text Block] |
You can find additional information about the Fund at columbiathreadneedleus.com/resources/literature. You can also request more information by contacting us at 1-800-345-6611.
|
| Material Fund Change Notice [Text Block] |
This report describes changes to the Fund that occurred during the reporting period.
|
| Additional Information Phone Number |
1-800-345-6611
|
| Additional Information Website |
columbiathreadneedleus.com/resources/literature
|
| Expenses [Text Block] |
What were the Fund costs for the reporting period? (Based on a hypothetical $10,000 investment)
Table Summary
Class |
Cost of a $10,000 investment |
Cost paid as a percentage of a $10,000 investment |
Institutional Class |
$105 |
0.97% | |
| Expenses Paid, Amount |
$ 105
|
| Expense Ratio, Percent |
0.97%
|
| Factors Affecting Performance [Text Block] |
Management's Discussion of Fund Performance The performance of Institutional Class shares for the period presented is shown in the Average Annual Total Returns table. Top Performance ContributorsStock selection | Selection within the energy, financials and consumer staples sectors held up best during the period. Selection within the communication services sector also contributed positively to the Fund’s performance relative to the benchmark. Allocations | Although overall sector allocation results detracted from relative performance, underweights to the real estate, utilities and materials sectors contributed positively over the period. Individual holdings | Positions in Veradermics, a late clinical-stage biopharmaceutical company; Vicor Corporation, a manufacturer of modular power components and power-conversion systems; and Digi International, a provider of internet connectivity products, services and solutions, were among the top contributors to the Fund’s relative performance. Top Performance DetractorsStock selection | Overall, selection results detracted from the Fund’s performance relative to the benchmark, lagging most within the information technology, industrials and health care sectors. Selection within the consumer discretionary and real estate sectors also detracted over the period. Allocations | Overall, sector allocation results detracted from relative performance. The Fund’s underweight to the health care sector, particularly the biotechnology industry, was the largest detractor. An overweight to the consumer discretionary sector and an underweight to the energy sector, as well as a cash drag, also detracted over the period. Individual holdings | An underweight to Bloom Energy, a provider of onsite power solutions using solid oxide fuel-cell technology, was the largest detractor relative to the benchmark over the period. Out-of-benchmark holdings FirstService, a provider of outsourced residential property management and other essential property services, and BlackLine, a provider of cloud software that automates financial close and accounting processes, were also among the Fund’s top relative detractors during the period. |
| Performance Past Does Not Indicate Future [Text] |
The Fund's past performance is not a good predictor of the Fund's future performance.
|
| Line Graph [Table Text Block] |
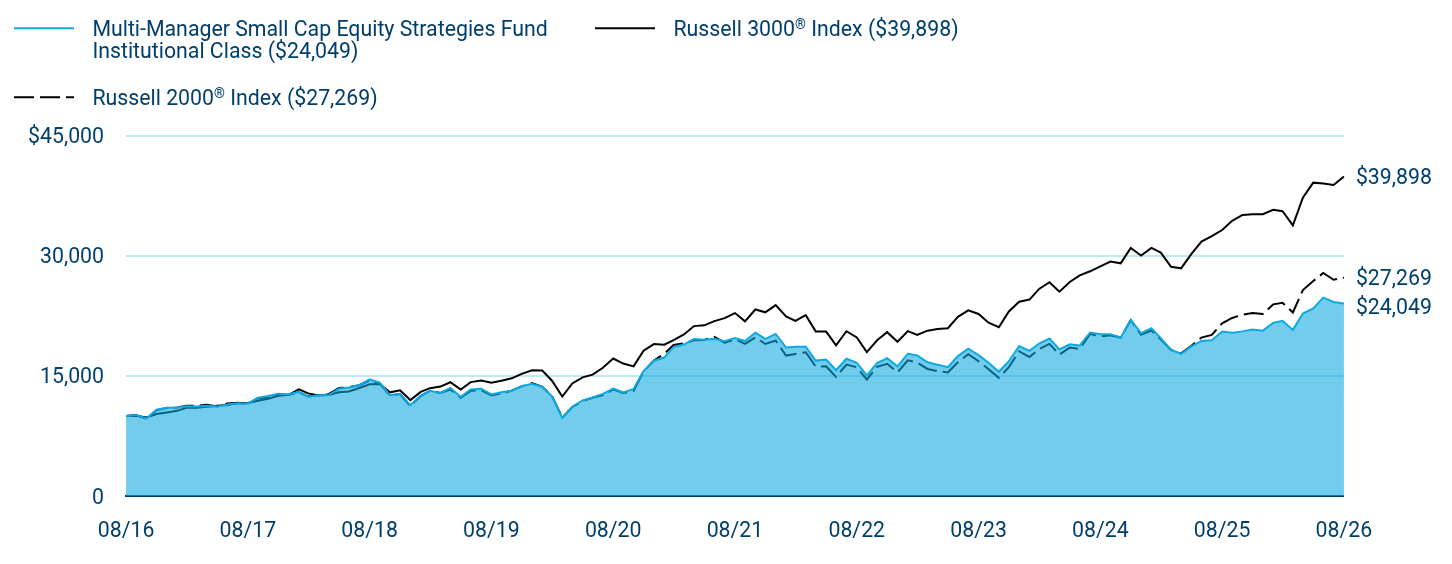
Table Summary
|
Multi-Manager Small Cap Equity Strategies Fund Institutional Class ($24,049) |
Russell 3000® Index ($39,898) |
Russell 2000® Index ($27,269) |
08/16 |
$10,000 |
$10,000 |
$10,000 |
09/16 |
$10,127 |
$10,016 |
$10,111 |
10/16 |
$9,671 |
$9,799 |
$9,631 |
11/16 |
$10,784 |
$10,238 |
$10,705 |
12/16 |
$11,036 |
$10,437 |
$11,005 |
01/17 |
$11,066 |
$10,634 |
$11,048 |
02/17 |
$11,218 |
$11,029 |
$11,261 |
03/17 |
$11,172 |
$11,037 |
$11,276 |
04/17 |
$11,286 |
$11,154 |
$11,400 |
05/17 |
$11,165 |
$11,268 |
$11,168 |
06/17 |
$11,431 |
$11,370 |
$11,554 |
07/17 |
$11,575 |
$11,584 |
$11,640 |
08/17 |
$11,529 |
$11,606 |
$11,491 |
09/17 |
$12,289 |
$11,889 |
$12,209 |
10/17 |
$12,494 |
$12,149 |
$12,313 |
11/17 |
$12,783 |
$12,518 |
$12,668 |
12/17 |
$12,712 |
$12,643 |
$12,616 |
01/18 |
$12,999 |
$13,309 |
$12,946 |
02/18 |
$12,433 |
$12,819 |
$12,445 |
03/18 |
$12,589 |
$12,561 |
$12,606 |
04/18 |
$12,613 |
$12,609 |
$12,715 |
05/18 |
$13,384 |
$12,965 |
$13,487 |
06/18 |
$13,540 |
$13,050 |
$13,583 |
07/18 |
$13,868 |
$13,483 |
$13,820 |
08/18 |
$14,557 |
$13,956 |
$14,416 |
09/18 |
$14,163 |
$13,979 |
$14,069 |
10/18 |
$12,589 |
$12,950 |
$12,541 |
11/18 |
$12,777 |
$13,209 |
$12,740 |
12/18 |
$11,346 |
$11,980 |
$11,227 |
01/19 |
$12,527 |
$13,008 |
$12,490 |
02/19 |
$13,144 |
$13,466 |
$13,139 |
03/19 |
$12,880 |
$13,662 |
$12,864 |
04/19 |
$13,497 |
$14,208 |
$13,301 |
05/19 |
$12,377 |
$13,289 |
$12,267 |
06/19 |
$13,312 |
$14,222 |
$13,134 |
07/19 |
$13,400 |
$14,433 |
$13,209 |
08/19 |
$12,686 |
$14,139 |
$12,557 |
09/19 |
$12,968 |
$14,387 |
$12,818 |
10/19 |
$13,153 |
$14,697 |
$13,156 |
11/19 |
$13,709 |
$15,256 |
$13,698 |
12/19 |
$14,025 |
$15,696 |
$14,093 |
01/20 |
$13,635 |
$15,679 |
$13,641 |
02/20 |
$12,462 |
$14,395 |
$12,492 |
03/20 |
$9,744 |
$12,416 |
$9,778 |
04/20 |
$11,144 |
$14,060 |
$11,121 |
05/20 |
$11,935 |
$14,812 |
$11,845 |
06/20 |
$12,298 |
$15,151 |
$12,264 |
07/20 |
$12,762 |
$16,011 |
$12,603 |
08/20 |
$13,416 |
$17,171 |
$13,313 |
09/20 |
$12,944 |
$16,546 |
$12,868 |
10/20 |
$13,371 |
$16,188 |
$13,138 |
11/20 |
$15,598 |
$18,158 |
$15,560 |
12/20 |
$16,897 |
$18,975 |
$16,905 |
01/21 |
$17,289 |
$18,890 |
$17,756 |
02/21 |
$18,620 |
$19,481 |
$18,863 |
03/21 |
$18,912 |
$20,179 |
$19,052 |
04/21 |
$19,596 |
$21,219 |
$19,452 |
05/21 |
$19,523 |
$21,316 |
$19,493 |
06/21 |
$19,623 |
$21,842 |
$19,870 |
07/21 |
$19,322 |
$22,211 |
$19,153 |
08/21 |
$19,715 |
$22,845 |
$19,581 |
09/21 |
$19,359 |
$21,820 |
$19,004 |
10/21 |
$20,380 |
$23,295 |
$19,812 |
11/21 |
$19,623 |
$22,941 |
$18,987 |
12/21 |
$20,242 |
$23,844 |
$19,411 |
01/22 |
$18,540 |
$22,441 |
$17,542 |
02/22 |
$18,647 |
$21,876 |
$17,729 |
03/22 |
$18,637 |
$22,585 |
$17,950 |
04/22 |
$16,913 |
$20,558 |
$16,171 |
05/22 |
$17,031 |
$20,531 |
$16,195 |
06/22 |
$15,703 |
$18,813 |
$14,863 |
07/22 |
$17,138 |
$20,578 |
$16,415 |
08/22 |
$16,645 |
$19,810 |
$16,079 |
09/22 |
$15,072 |
$17,973 |
$14,538 |
10/22 |
$16,613 |
$19,447 |
$16,139 |
11/22 |
$17,202 |
$20,462 |
$16,516 |
12/22 |
$16,201 |
$19,264 |
$15,444 |
01/23 |
$17,769 |
$20,591 |
$16,949 |
02/23 |
$17,545 |
$20,110 |
$16,663 |
03/23 |
$16,696 |
$20,647 |
$15,867 |
04/23 |
$16,401 |
$20,867 |
$15,581 |
05/23 |
$16,095 |
$20,949 |
$15,437 |
06/23 |
$17,474 |
$22,379 |
$16,693 |
07/23 |
$18,394 |
$23,181 |
$17,713 |
08/23 |
$17,616 |
$22,734 |
$16,827 |
09/23 |
$16,637 |
$21,651 |
$15,837 |
10/23 |
$15,517 |
$21,077 |
$14,757 |
11/23 |
$16,837 |
$23,042 |
$16,092 |
12/23 |
$18,735 |
$24,265 |
$18,058 |
01/24 |
$18,133 |
$24,534 |
$17,356 |
02/24 |
$19,048 |
$25,862 |
$18,337 |
03/24 |
$19,687 |
$26,696 |
$18,994 |
04/24 |
$18,313 |
$25,521 |
$17,657 |
05/24 |
$18,952 |
$26,727 |
$18,543 |
06/24 |
$18,783 |
$27,554 |
$18,371 |
07/24 |
$20,422 |
$28,066 |
$20,238 |
08/24 |
$20,217 |
$28,677 |
$19,935 |
09/24 |
$20,217 |
$29,271 |
$20,075 |
10/24 |
$19,795 |
$29,056 |
$19,785 |
11/24 |
$21,988 |
$30,989 |
$21,955 |
12/24 |
$20,338 |
$30,041 |
$20,142 |
01/25 |
$20,945 |
$30,990 |
$20,670 |
02/25 |
$19,719 |
$30,396 |
$19,564 |
03/25 |
$18,244 |
$28,623 |
$18,233 |
04/25 |
$17,760 |
$28,431 |
$17,811 |
05/25 |
$18,702 |
$30,233 |
$18,763 |
06/25 |
$19,371 |
$31,769 |
$19,782 |
07/25 |
$19,446 |
$32,469 |
$20,126 |
08/25 |
$20,549 |
$33,220 |
$21,563 |
09/25 |
$20,388 |
$34,366 |
$22,234 |
10/25 |
$20,561 |
$35,103 |
$22,637 |
11/25 |
$20,784 |
$35,199 |
$22,854 |
12/25 |
$20,652 |
$35,192 |
$22,721 |
01/26 |
$21,622 |
$35,738 |
$23,937 |
02/26 |
$21,878 |
$35,568 |
$24,130 |
03/26 |
$20,746 |
$33,800 |
$22,923 |
04/26 |
$22,795 |
$37,248 |
$25,722 |
05/26 |
$23,415 |
$39,135 |
$26,846 |
06/26 |
$24,777 |
$39,015 |
$27,849 |
07/26 |
$24,237 |
$38,833 |
$27,005 |
08/26 |
$24,049 |
$39,898 |
$27,269 |
|
| Average Annual Return [Table Text Block] |
Table Summary
Average Annual Total Returns (%) |
1 year |
5 years |
10 years |
Institutional ClassFootnote Reference(a)Footnote Reference(b) |
17.03 |
4.05 |
9.17 |
Russell 3000® Index |
20.10 |
11.80 |
14.84 |
Russell 2000® Index |
26.46 |
6.85 |
10.55 | |
| No Deduction of Taxes [Text Block] |
Performance does not reflect the deduction of taxes that a shareholder may pay on fund distributions or on the redemptions of fund shares.
|
| Updated Performance Information Location [Text Block] |
columbiathreadneedleus.com/investment-products/mutual-funds
|
| AssetsNet |
$ 1,143,728,234
|
| Holdings Count | Holding |
770
|
| Advisory Fees Paid, Amount |
$ 11,435,429
|
| InvestmentCompanyPortfolioTurnover |
78.00%
|
| Additional Fund Statistics [Text Block] |
Table Summary
Fund net assets |
$1,143,728,234 |
Total number of portfolio holdings |
770 |
Management services fees (represents 0.82% of Fund average net assets) |
$11,435,429 |
Portfolio turnover for the reporting period |
78% | |
| Holdings [Text Block] |
Table Summary
Financials |
18.7% |
Industrials |
13.8% |
Health Care |
12.0% |
Consumer Discretionary |
9.6% |
Information Technology |
9.3% |
Energy |
5.1% |
Materials |
3.7% |
Real Estate |
2.8% |
Consumer Staples |
2.2% |
Communication Services |
2.0% |
Other |
1.7% |
Table Summary
Common Stocks |
80.9% |
Exchange-Traded Equity Funds |
18.5% |
Other |
0.4% | |
| Largest Holdings [Text Block] |
Table Summary
iShares S&P Small-Cap 600 Growth ETF |
18.5% |
Bread Financial Holdings, Inc. |
0.6% |
Fluor Corp. |
0.6% |
JFrog Ltd. |
0.5% |
Commercial Metals Co. |
0.5% |
First BanCorp |
0.5% |
Southwest Gas Holdings, Inc. |
0.5% |
BankUnited, Inc. |
0.5% |
Rush Enterprises, Inc., Class A |
0.5% |
Andersons, Inc. (The) |
0.4% | |
| Material Fund Change [Text Block] |
This is a summary of the changes to the Fund. For more complete information, you may review the Fund’s prospectus, which is available at columbiathreadneedleus.com/resources/literature or upon request at 1-800-345-6611. Effective August 21, 2026, Conestoga Capital Advisors, LLC no longer serves as a subadviser to the Fund. Effective on or about October 26, 2026, and November 30, 2026, Stephens Investment Management Group, LLC and Emerald Advisers, LLC each are assuming day-to-day management of a portion of the Fund’s portfolio, respectively. Additionally, effective on or about November 27, 2026, J.P. Morgan Investment Management Inc. no longer serves as a subadviser to the Fund. Effective August 21, 2026, the Fund's Principal Investment Strategies includes the ability to invest in exchange traded funds. |
| Material Fund Change Strategies [Text Block] |
Effective August 21, 2026, the Fund's Principal Investment Strategies includes the ability to invest in exchange traded funds.
|
| Material Fund Change Adviser [Text Block] |
Effective August 21, 2026, Conestoga Capital Advisors, LLC no longer serves as a subadviser to the Fund. Effective on or about October 26, 2026, and November 30, 2026, Stephens Investment Management Group, LLC and Emerald Advisers, LLC each are assuming day-to-day management of a portion of the Fund’s portfolio, respectively. Additionally, effective on or about November 27, 2026, J.P. Morgan Investment Management Inc. no longer serves as a subadviser to the Fund.
|
| Summary of Change Legend [Text Block] |
This is a summary of the changes to the Fund. For more complete information, you may review the Fund’s prospectus, which is available at columbiathreadneedleus.com/resources/literature or upon request at 1-800-345-6611.
|
| Updated Prospectus Phone Number |
1-800-345-6611
|
| Updated Prospectus Web Address |
columbiathreadneedleus.com/resources/literature
|
| C000179755 |
|
| Shareholder Report [Line Items] |
|
| Fund Name |
Multi-Manager Total Return Bond Strategies Fund
|
| Class Name |
Institutional Class
|
| Trading Symbol |
CTRZX
|
| Annual or Semi-Annual Statement [Text Block] |
This annual shareholder report contains important information about Multi-Manager Total Return Bond Strategies Fund (the Fund) for the period of September 1, 2025 to August 31, 2026.
|
| Additional Information [Text Block] |
You can find additional information about the Fund at columbiathreadneedleus.com/resources/literature. You can also request more information by contacting us at 1-800-345-6611.
|
| Additional Information Phone Number |
1-800-345-6611
|
| Additional Information Website |
columbiathreadneedleus.com/resources/literature
|
| Expenses [Text Block] |
What were the Fund costs for the reporting period? (Based on a hypothetical $10,000 investment)
Table Summary
Class |
Cost of a $10,000 investment |
Cost paid as a percentage of a $10,000 investment |
Institutional Class |
$48 |
0.48% | |
| Expenses Paid, Amount |
$ 48
|
| Expense Ratio, Percent |
0.48%
|
| Factors Affecting Performance [Text Block] |
Management's Discussion of Fund Performance The performance of Institutional Class shares for the period presented is shown in the Average Annual Total Returns table. Top Performance ContributorsAllocations | Positive contributions to the Fund’s performance relative to the benchmark were driven by overweight exposures to credit sectors. Non-benchmark sectors including high-yield bonds, non-agency mortgage-backed securities, collateralized loan obligations and emerging market bonds all contributed positively from an allocation perspective. Security selection | Security selection was also a positive contributor to the Fund’s relative performance. Within investment-grade corporates, positioning favored financials and the banking sector contributed positively. Within industrials, issue selection within the healthcare and pharmaceutical sectors contributed, while in utilities, selections within electric utilities were the largest contributors. Finally, issue selection in commercial mortgage-backed securities contributed positively. Top Performance DetractorsInvestment-grade corporates | The Fund’s underweight allocation to investment-grade corporate bonds detracted from relative performance as this was among the benchmark’s best-performing sectors during the period. Government securities | Positioning within the Treasury sector detracted. Though an underweight allocation relative to the benchmark was a positive contributor, ongoing interest rate re-positioning using both Treasury bonds and derivatives detracted modestly. Interest rate positioning | The Fund’s positioning with respect to interest rates detracted from performance relative to the benchmark over the period as interest rates rose. Positioning emphasized the front end of the yield curve where interest rates rose most sharply. |
| Performance Past Does Not Indicate Future [Text] |
The Fund's past performance is not a good predictor of the Fund's future performance.
|
| Line Graph [Table Text Block] |
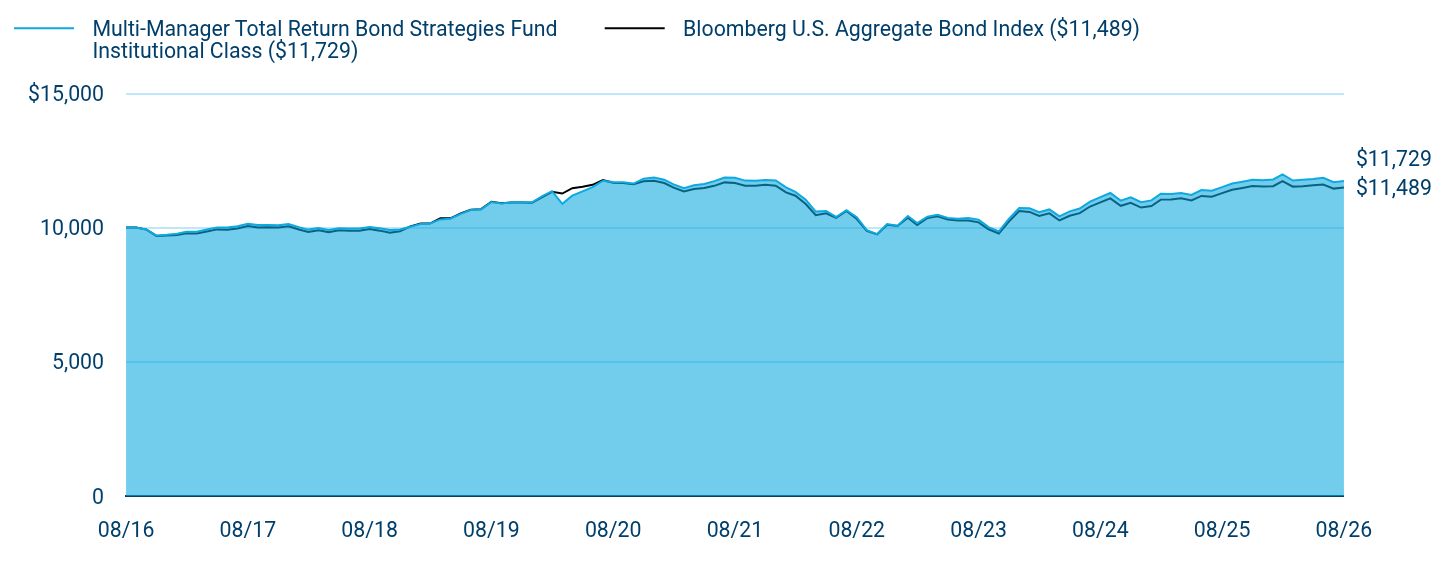
Table Summary
|
Multi-Manager Total Return Bond Strategies Fund Institutional Class ($11,729) |
Bloomberg U.S. Aggregate Bond Index ($11,489) |
08/16 |
$10,000 |
$10,000 |
09/16 |
$9,996 |
$9,994 |
10/16 |
$9,926 |
$9,918 |
11/16 |
$9,696 |
$9,683 |
12/16 |
$9,724 |
$9,697 |
01/17 |
$9,763 |
$9,716 |
02/17 |
$9,839 |
$9,781 |
03/17 |
$9,842 |
$9,776 |
04/17 |
$9,921 |
$9,851 |
05/17 |
$10,001 |
$9,927 |
06/17 |
$10,001 |
$9,917 |
07/17 |
$10,042 |
$9,960 |
08/17 |
$10,132 |
$10,049 |
09/17 |
$10,091 |
$10,001 |
10/17 |
$10,089 |
$10,007 |
11/17 |
$10,084 |
$9,994 |
12/17 |
$10,123 |
$10,040 |
01/18 |
$10,010 |
$9,925 |
02/18 |
$9,919 |
$9,830 |
03/18 |
$9,981 |
$9,894 |
04/18 |
$9,901 |
$9,820 |
05/18 |
$9,973 |
$9,890 |
06/18 |
$9,957 |
$9,878 |
07/18 |
$9,961 |
$9,880 |
08/18 |
$10,014 |
$9,944 |
09/18 |
$9,965 |
$9,880 |
10/18 |
$9,905 |
$9,802 |
11/18 |
$9,925 |
$9,860 |
12/18 |
$10,024 |
$10,041 |
01/19 |
$10,131 |
$10,148 |
02/19 |
$10,146 |
$10,142 |
03/19 |
$10,297 |
$10,337 |
04/19 |
$10,323 |
$10,339 |
05/19 |
$10,507 |
$10,523 |
06/19 |
$10,649 |
$10,655 |
07/19 |
$10,676 |
$10,679 |
08/19 |
$10,949 |
$10,955 |
09/19 |
$10,895 |
$10,897 |
10/19 |
$10,937 |
$10,930 |
11/19 |
$10,933 |
$10,924 |
12/19 |
$10,933 |
$10,917 |
01/20 |
$11,168 |
$11,127 |
02/20 |
$11,351 |
$11,327 |
03/20 |
$10,879 |
$11,260 |
04/20 |
$11,181 |
$11,460 |
05/20 |
$11,344 |
$11,514 |
06/20 |
$11,498 |
$11,586 |
07/20 |
$11,739 |
$11,759 |
08/20 |
$11,690 |
$11,665 |
09/20 |
$11,685 |
$11,658 |
10/20 |
$11,632 |
$11,606 |
11/20 |
$11,816 |
$11,720 |
12/20 |
$11,860 |
$11,736 |
01/21 |
$11,776 |
$11,652 |
02/21 |
$11,602 |
$11,484 |
03/21 |
$11,461 |
$11,340 |
04/21 |
$11,568 |
$11,430 |
05/21 |
$11,617 |
$11,467 |
06/21 |
$11,724 |
$11,548 |
07/21 |
$11,854 |
$11,677 |
08/21 |
$11,849 |
$11,655 |
09/21 |
$11,743 |
$11,554 |
10/21 |
$11,738 |
$11,551 |
11/21 |
$11,768 |
$11,585 |
12/21 |
$11,747 |
$11,555 |
01/22 |
$11,490 |
$11,306 |
02/22 |
$11,324 |
$11,180 |
03/22 |
$11,033 |
$10,869 |
04/22 |
$10,591 |
$10,457 |
05/22 |
$10,611 |
$10,524 |
06/22 |
$10,389 |
$10,359 |
07/22 |
$10,643 |
$10,612 |
08/22 |
$10,380 |
$10,313 |
09/22 |
$9,896 |
$9,867 |
10/22 |
$9,752 |
$9,739 |
11/22 |
$10,124 |
$10,097 |
12/22 |
$10,065 |
$10,052 |
01/23 |
$10,427 |
$10,361 |
02/23 |
$10,165 |
$10,093 |
03/23 |
$10,399 |
$10,350 |
04/23 |
$10,469 |
$10,412 |
05/23 |
$10,350 |
$10,299 |
06/23 |
$10,325 |
$10,262 |
07/23 |
$10,349 |
$10,255 |
08/23 |
$10,290 |
$10,189 |
09/23 |
$10,014 |
$9,931 |
10/23 |
$9,849 |
$9,774 |
11/23 |
$10,317 |
$10,216 |
12/23 |
$10,724 |
$10,608 |
01/24 |
$10,714 |
$10,578 |
02/24 |
$10,569 |
$10,429 |
03/24 |
$10,669 |
$10,525 |
04/24 |
$10,410 |
$10,259 |
05/24 |
$10,599 |
$10,433 |
06/24 |
$10,703 |
$10,532 |
07/24 |
$10,959 |
$10,778 |
08/24 |
$11,126 |
$10,933 |
09/24 |
$11,283 |
$11,079 |
10/24 |
$10,997 |
$10,805 |
11/24 |
$11,117 |
$10,919 |
12/24 |
$10,940 |
$10,740 |
01/25 |
$11,007 |
$10,797 |
02/25 |
$11,253 |
$11,035 |
03/25 |
$11,244 |
$11,039 |
04/25 |
$11,285 |
$11,082 |
05/25 |
$11,209 |
$11,003 |
06/25 |
$11,393 |
$11,172 |
07/25 |
$11,366 |
$11,143 |
08/25 |
$11,500 |
$11,276 |
09/25 |
$11,634 |
$11,399 |
10/25 |
$11,703 |
$11,470 |
11/25 |
$11,775 |
$11,541 |
12/25 |
$11,756 |
$11,524 |
01/26 |
$11,786 |
$11,537 |
02/26 |
$11,976 |
$11,726 |
03/26 |
$11,747 |
$11,519 |
04/26 |
$11,775 |
$11,532 |
05/26 |
$11,803 |
$11,568 |
06/26 |
$11,847 |
$11,596 |
07/26 |
$11,685 |
$11,445 |
08/26 |
$11,729 |
$11,489 |
|
| Average Annual Return [Table Text Block] |
Table Summary
Average Annual Total Returns (%) |
1 year |
5 years |
10 years |
Institutional ClassFootnote Reference(a)Footnote Reference(b) |
1.99 |
(0.20) |
1.61 |
Bloomberg U.S. Aggregate Bond Index |
1.89 |
(0.29) |
1.40 | |
| No Deduction of Taxes [Text Block] |
Performance does not reflect the deduction of taxes that a shareholder may pay on fund distributions or on the redemptions of fund shares.
|
| Updated Performance Information Location [Text Block] |
columbiathreadneedleus.com/investment-products/mutual-funds
|
| AssetsNet |
$ 11,867,921,814
|
| Holdings Count | Holding |
3,855
|
| Advisory Fees Paid, Amount |
$ 56,218,021
|
| InvestmentCompanyPortfolioTurnover |
226.00%
|
| Additional Fund Statistics [Text Block] |
Table Summary
Fund net assets |
$11,867,921,814 |
Total number of portfolio holdings |
3,855 |
Management services fees (represents 0.44% of Fund average net assets) |
$56,218,021 |
Portfolio turnover for the reporting period |
226% | |
| Holdings [Text Block] |
Table Summary
|
Long |
Interest Rate Risk |
29.3% |
Foreign Exchange Risk |
2.9% |
Credit Risk |
0.4% |
|
Short |
Interest Rate Risk |
16.4% |
Table Summary
Corporate Bonds & Notes |
27.5% |
Residential Mortgage-Backed Securities - Agency |
25.6% |
U.S. Treasury Obligations |
17.4% |
Asset-Backed Securities - Non-Agency |
12.2% |
Commercial Mortgage-Backed Securities - Non-Agency |
6.5% |
Residential Mortgage-Backed Securities - Non-Agency |
6.1% |
Money Market Funds |
5.8% |
Foreign Government Obligations |
3.2% |
Senior Loans |
1.1% |
Other |
0.7% | |
| Material Fund Change [Text Block] |
|
| C000215205 |
|
| Shareholder Report [Line Items] |
|
| Fund Name |
Multisector Bond SMA Completion Portfolio
|
| Trading Symbol |
MBSAX
|
| Annual or Semi-Annual Statement [Text Block] |
This annual shareholder report contains important information about Multisector Bond SMA Completion Portfolio (the Fund) for the period of September 1, 2025 to August 31, 2026.
|
| Additional Information [Text Block] |
You can find additional information about the Fund at columbiathreadneedleus.com/resources/literature. You can also request more information by contacting us at 1-800-345-6611.
|
| Additional Information Phone Number |
1-800-345-6611
|
| Additional Information Website |
columbiathreadneedleus.com/resources/literature
|
| Expenses [Text Block] |
What were the Fund costs for the reporting period? (Based on a hypothetical $10,000 investment)
Table Summary
Fund |
Cost of a $10,000 investment |
Cost paid as a percentage of a $10,000 investment |
Multisector Bond SMA Completion Portfolio |
$0 |
0.00% | |
| Expenses Paid, Amount |
$ 0
|
| Expense Ratio, Percent |
0.00%
|
| Factors Affecting Performance [Text Block] |
Management's Discussion of Fund Performance The performance of the Fund for the period presented is shown in the Average Annual Total Returns table. Top Performance ContributorsHigh-yield corporate bonds | High-yield corporates were the largest contributor to the Fund’s relative performance during the period. Resilient issuer fundamentals and steady investor demand supported the sector, and its meaningful income advantage over Treasuries drove positive excess returns. The allocation added value relative to the benchmark, which has no exposure to below-investment-grade corporates. Emerging market debt | Emerging market debt was the second-largest contributor to relative performance during the period, supported by improving sovereign and corporate credit conditions and strong demand for higher-yielding assets. The Fund's overweight allocation to the sector added value relative to the benchmark. High-yield bank loans | Bank loans contributed positively to relative performance during the period, as elevated short-term interest rates and supportive credit conditions benefited the Fund’s higher-income, floating-rate holdings. The allocation added value relative to the benchmark, which does not hold these securities. Top Performance DetractorsInterest rate positioning | Interest rate positioning was the largest detractor from relative performance during the period. Negative convexity from the Fund’s agency mortgage-backed securities holdings and implementation costs associated with its interest rate derivatives weighed on relative results. Overall, interest rate factors still contributed positively to absolute return, as income from higher starting yields outweighed the price impact of rising Treasury yields. Investment-grade corporate bonds | An underweight allocation to investment-grade corporates detracted from relative performance, as the sector performed well within the benchmark. The allocation still contributed positively to absolute return. |
| Performance Past Does Not Indicate Future [Text] |
The Fund's past performance is not a good predictor of the Fund's future performance.
|
| Line Graph [Table Text Block] |
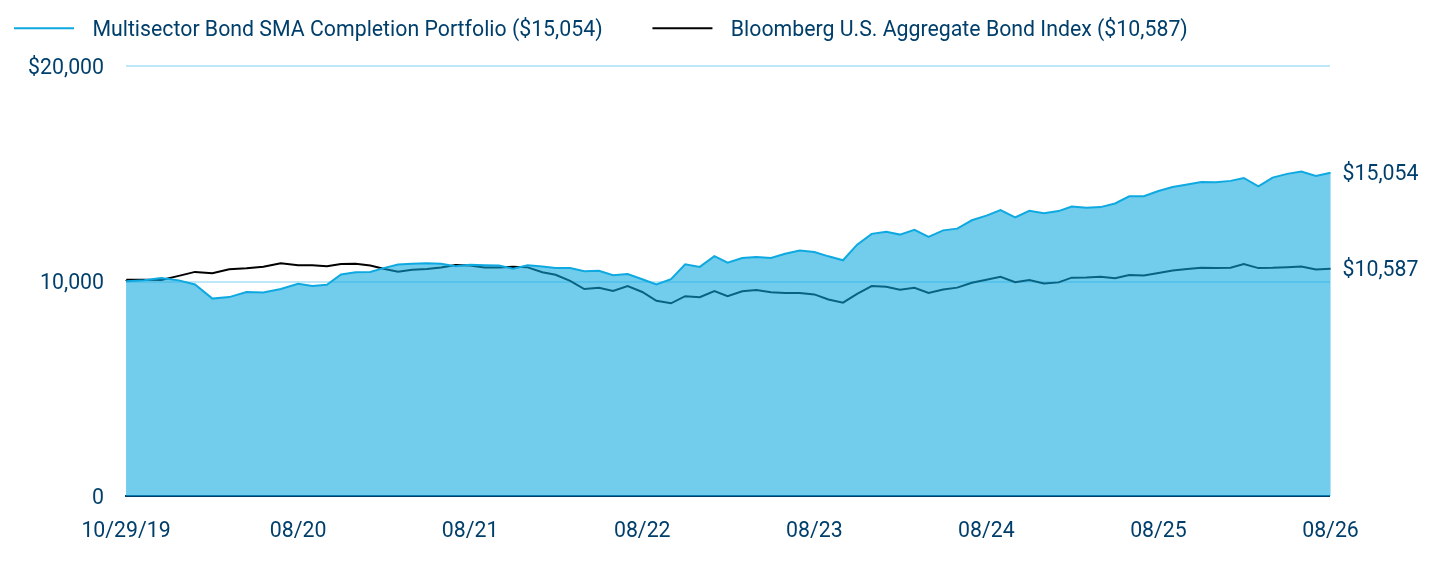
Table Summary
|
Multisector Bond SMA Completion Portfolio ($15,054) |
Bloomberg U.S. Aggregate Bond Index ($10,587) |
10/29/19 |
$10,000 |
$10,000 |
10/31/19 |
$10,000 |
$10,072 |
11/30/19 |
$10,050 |
$10,066 |
12/31/19 |
$10,152 |
$10,059 |
01/31/20 |
$10,043 |
$10,253 |
02/29/20 |
$9,853 |
$10,437 |
03/31/20 |
$9,193 |
$10,376 |
04/30/20 |
$9,263 |
$10,561 |
05/31/20 |
$9,504 |
$10,610 |
06/30/20 |
$9,474 |
$10,677 |
07/31/20 |
$9,640 |
$10,836 |
08/31/20 |
$9,884 |
$10,749 |
09/30/20 |
$9,778 |
$10,743 |
10/31/20 |
$9,833 |
$10,695 |
11/30/20 |
$10,316 |
$10,800 |
12/31/20 |
$10,420 |
$10,814 |
01/31/21 |
$10,431 |
$10,737 |
02/28/21 |
$10,612 |
$10,582 |
03/31/21 |
$10,777 |
$10,450 |
04/30/21 |
$10,822 |
$10,532 |
05/31/21 |
$10,843 |
$10,567 |
06/30/21 |
$10,812 |
$10,641 |
07/31/21 |
$10,704 |
$10,760 |
08/31/21 |
$10,765 |
$10,739 |
09/30/21 |
$10,749 |
$10,646 |
10/31/21 |
$10,735 |
$10,644 |
11/30/21 |
$10,582 |
$10,675 |
12/31/21 |
$10,744 |
$10,648 |
01/31/22 |
$10,684 |
$10,418 |
02/28/22 |
$10,623 |
$10,302 |
03/31/22 |
$10,614 |
$10,016 |
04/30/22 |
$10,473 |
$9,636 |
05/31/22 |
$10,491 |
$9,698 |
06/30/22 |
$10,278 |
$9,546 |
07/31/22 |
$10,338 |
$9,779 |
08/31/22 |
$10,096 |
$9,503 |
09/30/22 |
$9,848 |
$9,092 |
10/31/22 |
$10,097 |
$8,974 |
11/30/22 |
$10,788 |
$9,304 |
12/31/22 |
$10,671 |
$9,262 |
01/31/23 |
$11,170 |
$9,547 |
02/28/23 |
$10,863 |
$9,301 |
03/31/23 |
$11,084 |
$9,537 |
04/30/23 |
$11,127 |
$9,595 |
05/31/23 |
$11,082 |
$9,490 |
06/30/23 |
$11,284 |
$9,456 |
07/31/23 |
$11,430 |
$9,450 |
08/31/23 |
$11,366 |
$9,389 |
09/30/23 |
$11,162 |
$9,151 |
10/31/23 |
$10,979 |
$9,006 |
11/30/23 |
$11,705 |
$9,414 |
12/31/23 |
$12,210 |
$9,775 |
01/31/24 |
$12,309 |
$9,748 |
02/29/24 |
$12,174 |
$9,610 |
03/31/24 |
$12,396 |
$9,699 |
04/30/24 |
$12,072 |
$9,454 |
05/31/24 |
$12,372 |
$9,614 |
06/30/24 |
$12,451 |
$9,705 |
07/31/24 |
$12,841 |
$9,932 |
08/31/24 |
$13,059 |
$10,074 |
09/30/24 |
$13,311 |
$10,209 |
10/31/24 |
$12,980 |
$9,956 |
11/30/24 |
$13,284 |
$10,061 |
12/31/24 |
$13,168 |
$9,897 |
01/31/25 |
$13,269 |
$9,949 |
02/28/25 |
$13,482 |
$10,168 |
03/31/25 |
$13,430 |
$10,172 |
04/30/25 |
$13,455 |
$10,212 |
05/31/25 |
$13,625 |
$10,139 |
06/30/25 |
$13,959 |
$10,295 |
07/31/25 |
$13,958 |
$10,268 |
08/31/25 |
$14,207 |
$10,390 |
09/30/25 |
$14,392 |
$10,504 |
10/31/25 |
$14,505 |
$10,569 |
11/30/25 |
$14,623 |
$10,635 |
12/31/25 |
$14,617 |
$10,619 |
01/31/26 |
$14,676 |
$10,631 |
02/28/26 |
$14,812 |
$10,805 |
03/31/26 |
$14,419 |
$10,614 |
04/30/26 |
$14,828 |
$10,626 |
05/31/26 |
$15,002 |
$10,659 |
06/30/26 |
$15,113 |
$10,685 |
07/31/26 |
$14,909 |
$10,546 |
08/31/26 |
$15,054 |
$10,587 |
|
| Average Annual Return [Table Text Block] |
Table Summary
Average Annual Total Returns (%) |
1 year |
5 years |
Since Fund Inception |
Multisector Bond SMA Completion Portfolio |
5.96 |
6.94 |
6.16 |
Bloomberg U.S. Aggregate Bond Index |
1.89 |
(0.29) |
0.84 | |
| No Deduction of Taxes [Text Block] |
Performance does not reflect the deduction of taxes that a shareholder may pay on fund distributions or on the redemptions of fund shares.
|
| Updated Performance Information Location [Text Block] |
columbiathreadneedleus.com/investment-products/mutual-funds
|
| AssetsNet |
$ 111,122,240
|
| Holdings Count | Holding |
292
|
| Advisory Fees Paid, Amount |
$ 0
|
| InvestmentCompanyPortfolioTurnover |
517.00%
|
| Additional Fund Statistics [Text Block] |
Table Summary
Fund net assets |
$111,122,240 |
Total number of portfolio holdings |
292 |
Management services fees (represents 0.0% of Fund average net assets) |
$- |
Portfolio turnover for the reporting period |
517% | |
| Holdings [Text Block] |
Table Summary
|
Long |
Credit Risk |
61.8% |
Interest Rate Risk |
23.9% |
|
Short |
Interest Rate Risk |
4.1% |
Table Summary
Residential Mortgage-Backed Securities - Agency |
45.3% |
Senior Loans |
27.5% |
Money Market Funds |
27.1% |
Foreign Government Obligations |
14.4% |
Asset-Backed Securities - Non-Agency |
11.6% |
Residential Mortgage-Backed Securities - Non-Agency |
6.9% |
U.S. Treasury Obligations |
2.1% |
Other |
0.8% | |
| Material Fund Change [Text Block] |
|
| C000214277 |
|
| Shareholder Report [Line Items] |
|
| Fund Name |
Overseas SMA Completion Portfolio
|
| Trading Symbol |
OSCBX
|
| Annual or Semi-Annual Statement [Text Block] |
This annual shareholder report contains important information about Overseas SMA Completion Portfolio (the Fund) for the period of September 1, 2025 to August 31, 2026.
|
| Additional Information [Text Block] |
You can find additional information about the Fund at columbiathreadneedleus.com/resources/literature. You can also request more information by contacting us at 1-800-345-6611.
|
| Additional Information Phone Number |
1-800-345-6611
|
| Additional Information Website |
columbiathreadneedleus.com/resources/literature
|
| Expenses [Text Block] |
What were the Fund costs for the reporting period? (Based on a hypothetical $10,000 investment)
Table Summary
Fund |
Cost of a $10,000 investment |
Cost paid as a percentage of a $10,000 investment |
Overseas SMA Completion Portfolio |
$0 |
0.00% | |
| Expenses Paid, Amount |
$ 0
|
| Expense Ratio, Percent |
0.00%
|
| Factors Affecting Performance [Text Block] |
Management's Discussion of Fund Performance The performance of the Fund for the period presented is shown in the Average Annual Total Returns table. Top Performance ContributorsStock selection | Selections in the financials sector boosted the Fund’s performance relative to the benchmark during the period. Allocations | A larger allocation to the information technology sector and smaller average allocations to the consumer staples and communication services sectors buoyed the Fund’s relative performance during the period. Individual holdings | Positions in Mebuki Financial Group, a Japanese regional bank; BPER Banca, an Italian bank; Piraeus Bank, a Greek bank; Iyogin Holdings, a Japanese regional bank; and Macnica Holdings, a Japanese electronic component and semiconductor company, were top contributors to the Fund’s relative performance during the period. Top Performance DetractorsStock selection | Selections in the consumer discretionary, communication services and consumer staples sectors hurt the Fund’s performance relative to the benchmark during the period. Allocations | Larger weightings in the consumer discretionary and real estate sectors and a smaller weighting in the financials sector detracted from the Fund’s relative performance. Individual holdings | Fund positions in Sankyo, a Japanese pachinko machine maker; Nippon Television, a Japanese broadcasting company; Emaar Properties, a United Arab Emirates property developer; Shimamura, a Japanese clothing retailer; and MatsukiyoCocokara, a Japanese pharmacy chain, were top detractors from the Fund’s relative performance during the period. |
| Performance Past Does Not Indicate Future [Text] |
The Fund's past performance is not a good predictor of the Fund's future performance.
|
| Line Graph [Table Text Block] |
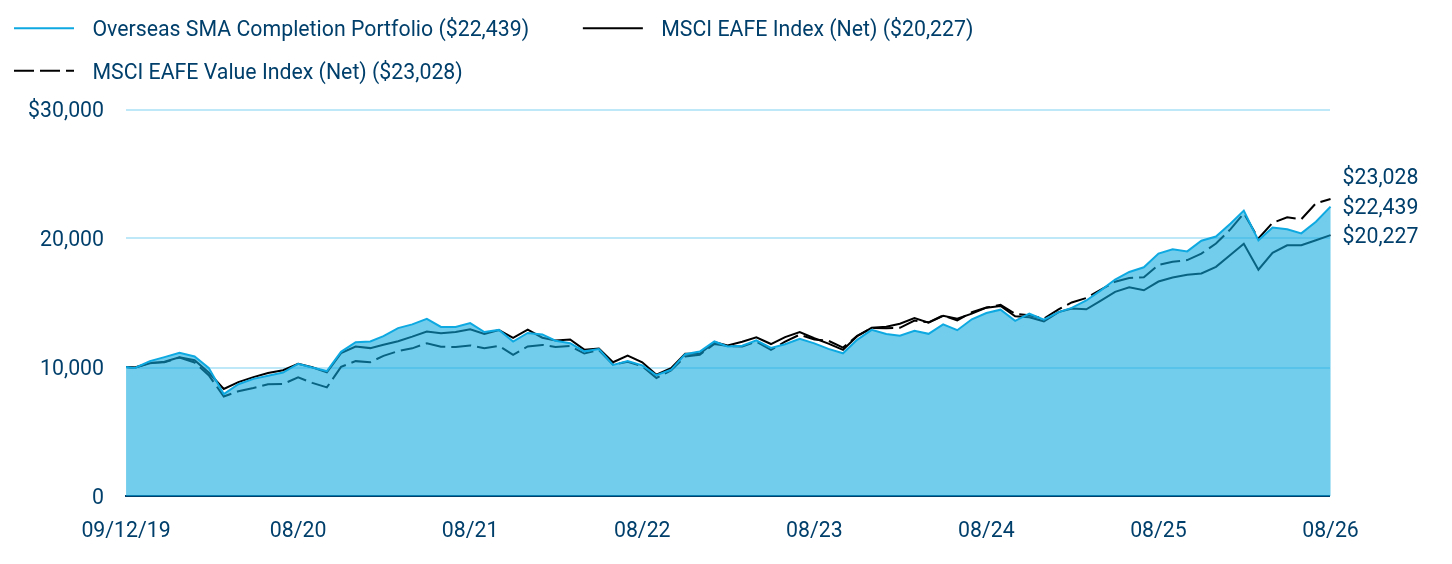
Table Summary
|
Overseas SMA Completion Portfolio ($22,439) |
MSCI EAFE Index (Net) ($20,227) |
MSCI EAFE Value Index (Net) ($23,028) |
09/12/19 |
$10,000 |
$10,000 |
$10,000 |
09/30/19 |
$9,925 |
$9,940 |
$9,961 |
10/31/19 |
$10,458 |
$10,297 |
$10,321 |
11/30/19 |
$10,767 |
$10,413 |
$10,362 |
12/31/19 |
$11,102 |
$10,751 |
$10,740 |
01/31/20 |
$10,823 |
$10,527 |
$10,352 |
02/29/20 |
$9,936 |
$9,575 |
$9,372 |
03/31/20 |
$7,908 |
$8,297 |
$7,712 |
04/30/20 |
$8,669 |
$8,833 |
$8,124 |
05/31/20 |
$9,083 |
$9,218 |
$8,371 |
06/30/20 |
$9,319 |
$9,532 |
$8,670 |
07/31/20 |
$9,573 |
$9,754 |
$8,687 |
08/31/20 |
$10,257 |
$10,255 |
$9,195 |
09/30/20 |
$9,961 |
$9,989 |
$8,773 |
10/31/20 |
$9,691 |
$9,590 |
$8,420 |
11/30/20 |
$11,178 |
$11,077 |
$10,014 |
12/31/20 |
$11,921 |
$11,592 |
$10,458 |
01/31/21 |
$11,981 |
$11,468 |
$10,376 |
02/28/21 |
$12,401 |
$11,726 |
$10,871 |
03/31/21 |
$13,018 |
$11,995 |
$11,236 |
04/30/21 |
$13,310 |
$12,356 |
$11,451 |
05/31/21 |
$13,738 |
$12,759 |
$11,848 |
06/30/21 |
$13,113 |
$12,615 |
$11,575 |
07/31/21 |
$13,104 |
$12,710 |
$11,546 |
08/31/21 |
$13,413 |
$12,935 |
$11,677 |
09/30/21 |
$12,718 |
$12,559 |
$11,463 |
10/31/21 |
$12,881 |
$12,868 |
$11,646 |
11/30/21 |
$11,981 |
$12,269 |
$10,945 |
12/31/21 |
$12,647 |
$12,897 |
$11,597 |
01/31/22 |
$12,528 |
$12,274 |
$11,718 |
02/28/22 |
$12,042 |
$12,057 |
$11,558 |
03/31/22 |
$11,849 |
$12,135 |
$11,636 |
04/30/22 |
$11,216 |
$11,350 |
$11,047 |
05/31/22 |
$11,391 |
$11,435 |
$11,319 |
06/30/22 |
$10,162 |
$10,374 |
$10,192 |
07/31/22 |
$10,473 |
$10,891 |
$10,404 |
08/31/22 |
$10,134 |
$10,373 |
$10,053 |
09/30/22 |
$9,364 |
$9,403 |
$9,152 |
10/31/22 |
$9,786 |
$9,909 |
$9,742 |
11/30/22 |
$10,996 |
$11,025 |
$10,813 |
12/31/22 |
$11,200 |
$11,034 |
$10,949 |
01/31/23 |
$11,982 |
$11,927 |
$11,795 |
02/28/23 |
$11,591 |
$11,678 |
$11,629 |
03/31/23 |
$11,648 |
$11,968 |
$11,599 |
04/30/23 |
$12,077 |
$12,305 |
$11,973 |
05/31/23 |
$11,477 |
$11,785 |
$11,328 |
06/30/23 |
$11,772 |
$12,321 |
$11,965 |
07/31/23 |
$12,192 |
$12,720 |
$12,509 |
08/31/23 |
$11,839 |
$12,232 |
$12,138 |
09/30/23 |
$11,410 |
$11,815 |
$12,035 |
10/31/23 |
$11,067 |
$11,336 |
$11,506 |
11/30/23 |
$12,106 |
$12,388 |
$12,418 |
12/31/23 |
$12,886 |
$13,046 |
$13,024 |
01/31/24 |
$12,563 |
$13,121 |
$13,016 |
02/29/24 |
$12,422 |
$13,361 |
$13,039 |
03/31/24 |
$12,805 |
$13,801 |
$13,608 |
04/30/24 |
$12,574 |
$13,447 |
$13,469 |
05/31/24 |
$13,310 |
$13,968 |
$14,000 |
06/30/24 |
$12,856 |
$13,742 |
$13,610 |
07/31/24 |
$13,703 |
$14,146 |
$14,248 |
08/31/24 |
$14,187 |
$14,606 |
$14,613 |
09/30/24 |
$14,449 |
$14,740 |
$14,820 |
10/31/24 |
$13,582 |
$13,939 |
$14,124 |
11/30/24 |
$14,136 |
$13,860 |
$14,015 |
12/31/24 |
$13,673 |
$13,545 |
$13,765 |
01/31/25 |
$14,263 |
$14,256 |
$14,467 |
02/28/25 |
$14,584 |
$14,533 |
$15,006 |
03/31/25 |
$15,164 |
$14,474 |
$15,356 |
04/30/25 |
$15,925 |
$15,137 |
$15,979 |
05/31/25 |
$16,783 |
$15,830 |
$16,620 |
06/30/25 |
$17,373 |
$16,179 |
$16,909 |
07/31/25 |
$17,737 |
$15,951 |
$16,953 |
08/31/25 |
$18,799 |
$16,632 |
$17,923 |
09/30/25 |
$19,131 |
$16,950 |
$18,159 |
10/31/25 |
$18,970 |
$17,149 |
$18,297 |
11/30/25 |
$19,796 |
$17,256 |
$18,794 |
12/31/25 |
$20,122 |
$17,773 |
$19,580 |
01/31/26 |
$21,137 |
$18,701 |
$20,696 |
02/28/26 |
$22,130 |
$19,566 |
$21,922 |
03/31/26 |
$19,824 |
$17,553 |
$19,971 |
04/30/26 |
$20,817 |
$18,860 |
$21,182 |
05/31/26 |
$20,685 |
$19,439 |
$21,618 |
06/30/26 |
$20,365 |
$19,452 |
$21,466 |
07/31/26 |
$21,270 |
$19,833 |
$22,700 |
08/31/26 |
$22,439 |
$20,227 |
$23,028 |
|
| Average Annual Return [Table Text Block] |
Table Summary
Average Annual Total Returns (%) |
1 year |
5 years |
Since Fund Inception |
Overseas SMA Completion Portfolio |
19.36 |
10.84 |
12.29 |
MSCI EAFE Index (Net) |
21.62 |
9.35 |
10.64 |
MSCI EAFE Value Index (Net) |
28.49 |
14.55 |
12.71 | |
| No Deduction of Taxes [Text Block] |
Performance does not reflect the deduction of taxes that a shareholder may pay on fund distributions or on the redemptions of fund shares.
|
| Updated Performance Information Location [Text Block] |
columbiathreadneedleus.com/investment-products/mutual-funds
|
| AssetsNet |
$ 22,625,341
|
| Holdings Count | Holding |
44
|
| Advisory Fees Paid, Amount |
$ 0
|
| InvestmentCompanyPortfolioTurnover |
38.00%
|
| Additional Fund Statistics [Text Block] |
Table Summary
Fund net assets |
$22,625,341 |
Total number of portfolio holdings |
44 |
Management services fees (represents 0.0% of Fund average net assets) |
$- |
Portfolio turnover for the reporting period |
38% | |
| Holdings [Text Block] |
Table Summary
Japan |
42.1% |
|
Italy |
10.3% |
|
Greece |
5.7% |
|
Netherlands |
4.5% |
|
United Kingdom |
3.8% |
|
Singapore |
3.3% |
|
Poland |
3.0% |
|
Norway |
3.0% |
|
Canada |
2.7% |
|
Jersey |
2.7% |
|
Other |
18.8% |
|
Table Summary
Financials |
33.7% |
Industrials |
15.1% |
Information Technology |
12.0% |
Consumer Discretionary |
9.5% |
Consumer Staples |
7.3% |
Energy |
4.7% |
Health Care |
4.6% |
Materials |
4.3% |
Real Estate |
3.6% |
Communication Services |
3.1% | |
| Largest Holdings [Text Block] |
Table Summary
Piraeus Bank SA |
5.7% |
Mebuki Financial Group, Inc. |
5.5% |
BPER Banca SPA |
5.3% |
ASR Nederland NV |
4.5% |
Toyota Tsusho Corp. |
4.1% |
TP Icap Group PLC |
3.8% |
Tokyo Tatemono Co., Ltd. |
3.6% |
Daiwabo Holdings Co., Ltd. |
3.3% |
Venture Corp., Ltd. |
3.3% |
Macnica Holdings, Inc. |
3.3% | |
| Material Fund Change [Text Block] |
|