Shareholder Report
Aug. 31, 2026
USD ($)
Holding
WHAT WERE THE FUND COSTS FOR THE LAST YEAR?
(Based on a hypothetical $10,000 investment)
Costs of a $10,000 investment |
Costs paid as a percentage of a $10,000 investment | |
PGIM California Muni Income Fund—Class A |
$69 |
0.68% |
WHAT AFFECTED THE FUND’S PERFORMANCE DURING THE REPORTING PERIOD?
■ During the reporting period, the Bloomberg Municipal Bond Index generated positive total returns, with intermediate bonds leading performance. Following three 25-basis-point rate cuts in 2025, the U.S. Federal Reserve (Fed) adopted a more hawkish tone in 2026 as inflation concerns rose amid geopolitical tensions, which put upward pressure on oil prices, and renewed tariff escalations. In light of demand, Municipal-to-Treasury ratios richened — particularly in the second quarter of 2026 as investors reassessed the possibility of a rate hike — but cheapened in July and August as rate volatility increased and supply remained elevated. That said, resilient consumer spending, robust capital and business investment, and continued tax revenue generation supported municipal credit fundamentals.
■ The following contributed most to the Fund’s performance relative to the Bloomberg California 1-15 Year Municipal Intermediate Index (the “Index”) during the period: a significant overweight to the long end of the yield curve as the curve flattened; overweight positioning in housing bonds, particularly Freddie Mac multi-family deals; and overweight positioning in airport bonds.
■ The following detracted most from the Fund’s performance relative to the Index during the period: duration positioning, as municipal bond rates sold off in line with broader market sentiment, and positioning in specific university housing bonds.
■ The Fund uses derivatives when they facilitate implementation of the overall investment approach. During the period, financial futures were used to help manage duration positioning and yield curve exposure. In addition, credit default swaps were used to manage credit risk. Financial futures contributed to performance, while credit default swaps had a negligible impact.
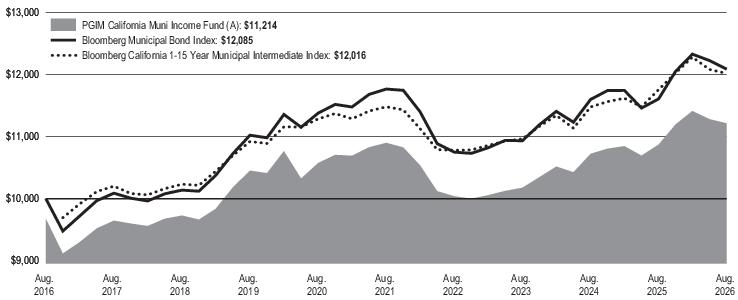
Average Annual Total Returns as of 8/31/2026 | |||
One Year (%) |
Five Years (%) |
Ten Years (%) | |
Class A with sales charges |
-0.21% |
-0.09% |
1.15% |
Class A without sales charges |
3.14% |
0.57% |
1.49% |
Bloomberg Municipal Bond Index |
4.12% |
0.54% |
1.91% |
Bloomberg California 1-15 Year Municipal Intermediate Index |
2.22% |
0.92% |
N/A |
WHAT ARE SOME KEY FUND STATISTICS AS OF 8/31/2026?
Fund’s net assets |
$ 398,264,188 |
Number of fund holdings |
282 |
Total advisory fees paid for the year |
$ 984,375 |
Portfolio turnover rate for the year |
31% |
WHAT ARE SOME CHARACTERISTICS OF THE FUND’S HOLDINGS AS OF 8/31/2026?
Credit Quality expressed as a percentage of total investments as of 8/31/2026 (%) | |
AAA |
7.0 |
AA |
51.1 |
A |
23.6 |
BBB |
12.3 |
BB |
1.2 |
Not Rated |
4.3 |
Cash/Cash Equivalents |
0.5 |
Total |
100.0 |
WHAT WERE THE FUND COSTS FOR THE LAST YEAR?
(Based on a hypothetical $10,000 investment)
Costs of a $10,000 investment |
Costs paid as a percentage of a $10,000 investment | |
PGIM California Muni Income Fund—Class C |
$165 |
1.63% |
WHAT AFFECTED THE FUND’S PERFORMANCE DURING THE REPORTING PERIOD?
■ During the reporting period, the Bloomberg Municipal Bond Index generated positive total returns, with intermediate bonds leading performance. Following three 25-basis-point rate cuts in 2025, the U.S. Federal Reserve (Fed) adopted a more hawkish tone in 2026 as inflation concerns rose amid geopolitical tensions, which put upward pressure on oil prices, and renewed tariff escalations. In light of demand, Municipal-to-Treasury ratios richened — particularly in the second quarter of 2026 as investors reassessed the possibility of a rate hike — but cheapened in July and August as rate volatility increased and supply remained elevated. That said, resilient consumer spending, robust capital and business investment, and continued tax revenue generation supported municipal credit fundamentals.
■ The following contributed most to the Fund’s performance relative to the Bloomberg California 1-15 Year Municipal Intermediate Index (the “Index”) during the period: a significant overweight to the long end of the yield curve as the curve flattened; overweight positioning in housing bonds, particularly Freddie Mac multi-family deals; and overweight positioning in airport bonds.
■ The following detracted most from the Fund’s performance relative to the Index during the period: duration positioning, as municipal bond rates sold off in line with broader market sentiment, and positioning in specific university housing bonds.
■ The Fund uses derivatives when they facilitate implementation of the overall investment approach. During the period, financial futures were used to help manage duration positioning and yield curve exposure. In addition, credit default swaps were used to manage credit risk. Financial futures contributed to performance, while credit default swaps had a negligible impact.
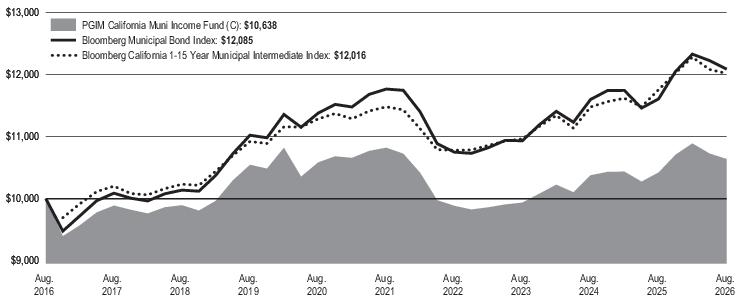
Average Annual Total Returns as of 8/31/2026 | |||
One Year (%) |
Five Years (%) |
Ten Years (%) | |
Class C with sales charges |
1.07% |
-0.34% |
0.62% |
Class C without sales charges |
2.07% |
-0.34% |
0.62% |
Bloomberg Municipal Bond Index |
4.12% |
0.54% |
1.91% |
Bloomberg California 1-15 Year Municipal Intermediate Index |
2.22% |
0.92% |
N/A |
WHAT ARE SOME KEY FUND STATISTICS AS OF 8/31/2026?
Fund’s net assets |
$ 398,264,188 |
Number of fund holdings |
282 |
Total advisory fees paid for the year |
$ 984,375 |
Portfolio turnover rate for the year |
31% |
WHAT ARE SOME CHARACTERISTICS OF THE FUND’S HOLDINGS AS OF 8/31/2026?
Credit Quality expressed as a percentage of total investments as of 8/31/2026 (%) | |
AAA |
7.0 |
AA |
51.1 |
A |
23.6 |
BBB |
12.3 |
BB |
1.2 |
Not Rated |
4.3 |
Cash/Cash Equivalents |
0.5 |
Total |
100.0 |
WHAT WERE THE FUND COSTS FOR THE LAST YEAR?
(Based on a hypothetical $10,000 investment)
Costs of a $10,000 investment |
Costs paid as a percentage of a $10,000 investment | |
PGIM California Muni Income Fund—Class Z |
$40 |
0.39% |
WHAT AFFECTED THE FUND’S PERFORMANCE DURING THE REPORTING PERIOD?
■ During the reporting period, the Bloomberg Municipal Bond Index generated positive total returns, with intermediate bonds leading performance. Following three 25-basis-point rate cuts in 2025, the U.S. Federal Reserve (Fed) adopted a more hawkish tone in 2026 as inflation concerns rose amid geopolitical tensions, which put upward pressure on oil prices, and renewed tariff escalations. In light of demand, Municipal-to-Treasury ratios richened — particularly in the second quarter of 2026 as investors reassessed the possibility of a rate hike — but cheapened in July and August as rate volatility increased and supply remained elevated. That said, resilient consumer spending, robust capital and business investment, and continued tax revenue generation supported municipal credit fundamentals.
■ The following contributed most to the Fund’s performance relative to the Bloomberg California 1-15 Year Municipal Intermediate Index (the “Index”) during the period: a significant overweight to the long end of the yield curve as the curve flattened; overweight positioning in housing bonds, particularly Freddie Mac multi-family deals; and overweight positioning in airport bonds.
■ The following detracted most from the Fund’s performance relative to the Index during the period: duration positioning, as municipal bond rates sold off in line with broader market sentiment, and positioning in specific university housing bonds.
■ The Fund uses derivatives when they facilitate implementation of the overall investment approach. During the period, financial futures were used to help manage duration positioning and yield curve exposure. In addition, credit default swaps were used to manage credit risk. Financial futures contributed to performance, while credit default swaps had a negligible impact.
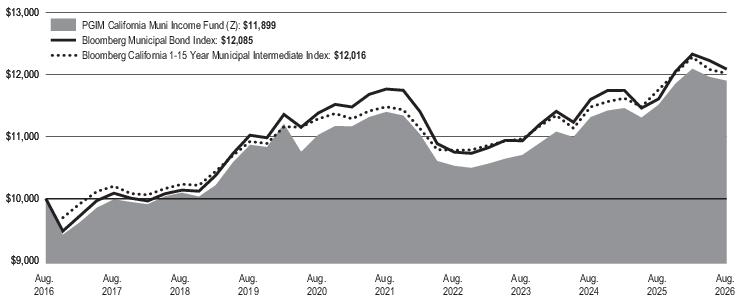
Average Annual Total Returns as of 8/31/2026 | |||
One Year (%) |
Five Years (%) |
Ten Years (%) | |
Class Z |
3.34% |
0.87% |
1.75% |
Bloomberg Municipal Bond Index |
4.12% |
0.54% |
1.91% |
Bloomberg California 1-15 Year Municipal Intermediate Index |
2.22% |
0.92% |
N/A |
WHAT ARE SOME KEY FUND STATISTICS AS OF 8/31/2026?
Fund’s net assets |
$ 398,264,188 |
Number of fund holdings |
282 |
Total advisory fees paid for the year |
$ 984,375 |
Portfolio turnover rate for the year |
31% |
WHAT ARE SOME CHARACTERISTICS OF THE FUND’S HOLDINGS AS OF 8/31/2026?
Credit Quality expressed as a percentage of total investments as of 8/31/2026 (%) | |
AAA |
7.0 |
AA |
51.1 |
A |
23.6 |
BBB |
12.3 |
BB |
1.2 |
Not Rated |
4.3 |
Cash/Cash Equivalents |
0.5 |
Total |
100.0 |
WHAT WERE THE FUND COSTS FOR THE LAST YEAR?
(Based on a hypothetical $10,000 investment)
Costs of a $10,000 investment |
Costs paid as a percentage of a $10,000 investment | |
PGIM California Muni Income Fund—Class R6 |
$39 |
0.38% |
WHAT AFFECTED THE FUND’S PERFORMANCE DURING THE REPORTING PERIOD?
■ During the reporting period, the Bloomberg Municipal Bond Index generated positive total returns, with intermediate bonds leading performance. Following three 25-basis-point rate cuts in 2025, the U.S. Federal Reserve (Fed) adopted a more hawkish tone in 2026 as inflation concerns rose amid geopolitical tensions, which put upward pressure on oil prices, and renewed tariff escalations. In light of demand, Municipal-to-Treasury ratios richened — particularly in the second quarter of 2026 as investors reassessed the possibility of a rate hike — but cheapened in July and August as rate volatility increased and supply remained elevated. That said, resilient consumer spending, robust capital and business investment, and continued tax revenue generation supported municipal credit fundamentals.
■ The following contributed most to the Fund’s performance relative to the Bloomberg California 1-15 Year Municipal Intermediate Index (the “Index”) during the period: a significant overweight to the long end of the yield curve as the curve flattened; overweight positioning in housing bonds, particularly Freddie Mac multi-family deals; and overweight positioning in airport bonds.
■ The following detracted most from the Fund’s performance relative to the Index during the period: duration positioning, as municipal bond rates sold off in line with broader market sentiment, and positioning in specific university housing bonds.
■ The Fund uses derivatives when they facilitate implementation of the overall investment approach. During the period, financial futures were used to help manage duration positioning and yield curve exposure. In addition, credit default swaps were used to manage credit risk. Financial futures contributed to performance, while credit default swaps had a negligible impact.
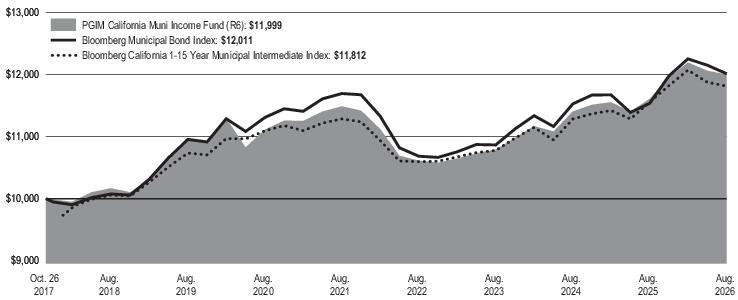
Average Annual Total Returns as of 8/31/2026 | |||
One Year (%) |
Five Years (%) |
Since Inception (%) | |
Class R6 |
3.35% |
0.88% |
2.08% (10/26/2017) |
Bloomberg Municipal Bond Index |
4.12% |
0.54% |
2.10% |
Bloomberg California 1-15 Year Municipal Intermediate Index |
2.22% |
0.92% |
1.90% |
WHAT ARE SOME KEY FUND STATISTICS AS OF 8/31/2026?
Fund’s net assets |
$ 398,264,188 |
Number of fund holdings |
282 |
Total advisory fees paid for the year |
$ 984,375 |
Portfolio turnover rate for the year |
31% |
WHAT ARE SOME CHARACTERISTICS OF THE FUND’S HOLDINGS AS OF 8/31/2026?
Credit Quality expressed as a percentage of total investments as of 8/31/2026 (%) | |
AAA |
7.0 |
AA |
51.1 |
A |
23.6 |
BBB |
12.3 |
BB |
1.2 |
Not Rated |
4.3 |
Cash/Cash Equivalents |
0.5 |
Total |
100.0 |