TRANSALTA CORPORATION
Management’s Discussion and Analysis
This Management’s Discussion and Analysis (MD&A) contains forward-looking statements. These statements are based on certain estimates and assumptions and involve risks and uncertainties. Actual results may differ materially. Refer to the "Forward-Looking Statements" section of this MD&A for additional information.
Table of Contents
This MD&A should be read in conjunction with our unaudited interim condensed consolidated financial statements as at and for the nine months ended Sept. 30, 2026 and 2025, the audited annual consolidated financial statements and MD&A (2025 Annual MD&A) contained within our 2025 Annual Report. In this MD&A, unless the context otherwise requires, “we”, “our”, “us”, the “Company” and “TransAlta” refer to TransAlta Corporation and its subsidiaries. The unaudited interim condensed consolidated financial statements have been prepared in accordance with International Financial Reporting Standards (IFRS) for Canadian publicly accountable enterprises as issued by the International Accounting Standards Board (IASB). All tabular amounts in the following discussion are in millions of Canadian dollars unless otherwise noted, except amounts per share, which are in whole dollars to the nearest two decimals. This MD&A is dated Nov. 2, 2026. Additional information with respect to TransAlta, including our Annual Information form (AIF) for the year ended Dec. 31, 2025, is available on SEDAR+ at www.sedarplus.ca, on EDGAR at www.sec.gov and on our website at www.transalta.com. Information on or connected to our website is not incorporated by reference herein. For the Glossary of Key Terms used in this MD&A refer to the 2025 Annual Report.
Forward-Looking Statements
This MD&A includes "forward-looking information" within the meaning of applicable Canadian securities laws and "forward-looking statements" within the meaning of applicable U.S. securities laws, including the Private Securities Litigation Reform Act of 1995 (collectively referred to herein as "forward-looking statements").
Forward-looking statements are not facts, but only predictions and generally can be identified by the use of statements that include phrases such as "may", "will", "can", "could", "would", "shall", "believe", "expect", "estimate", "anticipate", "intend", "plan", "forecast", "foresee", "potential", "enable", "continue" or other comparable terminology. In particular, this MD&A contains forward-looking statements about the following, among other things:
•Our 2026 Outlook and the targets contained therein;
•Our hedging assumptions;
•Our estimated spot price sensitivity and the associated impacts on our Adjusted EBITDA target;
•Our expectation that cash flow from our operating activities will be sufficient to meet our short and long-term financial obligations;
•Our expectations about strategies for growth and expansion;
•Expected costs and schedules for planned projects, including the Centralia planned coal-to-gas conversion project;
•The power generation industry generally and the supply of, and demand for, electricity;
•The cyclicality of our business;
•The expected impact of future tax and accounting changes; and
•Expected industry, market and economic conditions.
The forward-looking statements contained in this MD&A are based on many assumptions including, but not limited to, the following:
•No significant changes to applicable laws and regulations, including carbon pricing, renewable energy incentives, royalty rates and climate-related regulations;
•No unexpected delays in obtaining required regulatory and other third-party approvals;
•No material adverse impacts to investment and credit markets;
•power price, gas commodity price, transport cost and hedging assumptions;
•interest and foreign exchange rates;
•demand for, and growth of, electricity generation;
•No significant changes to the integrity and reliability of our facilities;
•No significant changes to the Company's debt and credit ratings and the Company's ability to access the capital markets on reasonable terms;
•No significant changes to the Company's ability to develop, access or implement, on a timely basis and on reasonable terms, the technology necessary to efficiently and effectively operate the Company's assets and achieve expected future results;
•No significant supply chain disruptions or shortages of raw materials or skilled labour; and
•No material changes to international trade laws, regulations, agreements, treaties, taxes, tariffs, duties or policies of Canada, the United States or other countries.
These assumptions are based on information currently available to TransAlta, including information obtained from third-party sources. Actual results may differ materially from those predicted by such assumptions. Factors that may adversely impact what is expressed or implied by forward-looking statements contained in this MD&A include, but are not limited to:
•Changes in supply and demand for electricity;
•Fluctuations in power prices;
•Our ability to contract our electricity generation for prices that will provide expected returns and replace contracts as they expire;
•Risks associated with development projects and acquisitions;
•Our ability to develop, access or implement, on a timely basis and on reasonable terms, the technology necessary to efficiently and effectively operate our assets and achieve expected future results;
•Any difficulty raising needed capital in the future on reasonable terms;
•Long-term commitments on gas transportation capacity that may not be fully utilized over time;
•Changes to legislative, regulatory and political environments, including changes to environmental laws, including but not limited to carbon pricing, renewable energy policies and emissions regulations in Canada, the United States and Australia;
•Operational risks involving our facilities, including unplanned outages and equipment failure, which may result in reductions in electricity production;
•Grid reliability, including but not limited to disruptions in the transmission and distribution of electricity;
•Impairments and/or writedowns of assets;
•Adverse impacts on our information technology systems, including increased cybersecurity threats;
•Commodity risk management and energy-trading risks, including but not limited to counterparty credit risks;
•Reduced labour availability, ability to continue to staff our operations and facilities, loss of key personnel and other labour relations matters;
•Disruptions to our supply chains;
•Climate change-related risks, including the increased frequency and severity of extreme weather events, and
the impact of such extreme weather events on electricity supply and demand;
•Reductions to our generating units' relative efficiency or capacity factors;
•General economic risks, including deterioration of equity markets, increasing interest rates, changes to foreign exchange rates or rising inflation;
•General domestic and international political developments, including potential trade tariffs;
•Industry risk and competition, including from emerging technologies affecting the demand, generation, distribution or storage of electricity;
•Inadequacy or unavailability of insurance coverage;
•Increases in the Company's income taxes and any risk of reassessments;
•Legal, regulatory and contractual disputes and proceedings involving the Company; and
•Reputational and stakeholder-related risks.
The foregoing risk factors, among others, are described in further detail in the "Risk Management" section of the 2025 Annual Report.
Readers are urged to consider these factors carefully when evaluating the forward-looking statements, which reflect the Company's expectations only as of the date of this MD&A and are cautioned not to place undue reliance on them. The forward-looking statements included in this document are made only as of the date of its release and we do not undertake to publicly update these forward-looking statements to reflect new information, future events or otherwise, except as required by applicable laws. The purpose of the financial outlooks contained in this document is to give the reader information about management's current expectations and plans and readers are cautioned that such information may not be appropriate for other purposes. In light of these risks, uncertainties and assumptions, the forward-looking statements might occur to a different extent or at a different time than we have described, or might not occur at all. We cannot assure that projected results or events will be achieved.
Description of the Business
TransAlta Corporation is one of Canada’s largest publicly traded power generators, with operations across Canada, the United States (U.S.) and Western Australia. Our diversified fleet includes hydro, wind, solar, battery storage and thermal generation, complemented by asset optimization and energy marketing activities. As one of Canada’s largest producers of wind and thermal generation and Alberta’s largest producer of hydroelectric power, TransAlta remains committed to a diverse generation mix. With strong cash flows underpinned by a high-quality portfolio, TransAlta strives to deliver sustainable long-term shareholder value in an evolving energy landscape. We have four generation segments including Hydro, Wind and Solar, Gas and Energy Transition, along with two non-generation segments including Energy Marketing and Corporate.
Our diversified portfolio consists of both high-quality contracted and merchant cash flows. Our merchant cash
flow streams are derived from our unique hydro portfolio, legacy and peaking thermal assets and wind assets. Our merchant exposure is primarily in Alberta, where 61 per cent of our generating capacity is located and 77 per cent is exposed to the merchant market.
In Alberta, the Company manages its merchant exposure by executing hedging strategies that include a significant base of commercial and industrial customers, supplemented with financial hedges. A significant portion of our thermal and hydro generation capacity in Alberta may be hedged to enhance cash flow predictability while maintaining exposure to market upside.
Refer to the "2026 Outlook" and the "Optimization of the Alberta Portfolio" sections of this MD&A for further details.
The following table provides our consolidated ownership by segment of our facilities across Alberta and other regions in which we operate as at Sept. 30, 2026:
| | | | | | | | | | | | | | | | | | | | |
As at Sept. 30, 2026 | | Hydro | Wind & Solar | Gas(4)(5) | | | | Total |
| Alberta | Gross installed capacity (MW)(2) | 834 | | 764 | | 3,650 | | | | | 5,248 | |
| Number of facilities | 17 | | 14 | | 15 | | | | | 46 | |
| Weighted average contract life (years) | — | | 15 | | 8 | | | | | 10 | |
| Contracted capacity (MW) | — | | 336 | | 887 | | | | | 1,223 | |
| Contracted capacity as a % of total capacity (%) | — | | 44 | | 24 | | | | | 23 | |
| | | | | | | | |
| | | | | | | |
| | | | | | | |
| | | | | | | |
| | | | | | | |
| | | | | | | |
| | | | | | | | |
| | | | | | | |
| | | | | | | |
| | | | | | | |
| | | | | | | |
| | | | | | | |
| | | | | | | | |
| | | | | | | |
| | | | | | | |
| | | | | | | |
| | | | | | | |
Other regions(1) | Gross installed capacity (MW)(2) | 88 | | 1,823 | | 1,464 | | | | | 3,375 | |
| Number of facilities | 7 | | 22 | | 14 | | | | | 43 | |
| Weighted average contract life (years) | 13 | | 10 | | 7 | | | | | 9 | |
| Contracted capacity (MW) | 88 | | 1,823 | | 1,464 | | | | | 3,375 | |
| Contracted capacity as a % of total capacity (%) | 100 | | 100 | | 100 | | | | | 100 | |
| Total | Gross installed capacity (MW)(2) | 922 | | 2,587 | | 5,114 | | | | | 8,623 | |
| Number of facilities | 24 | | 36 | | 29 | | | | | 89 | |
| Weighted average contract life (years) | 13 | | 10 | | 7 | | | | | 9 | |
| Contracted capacity (MW) | 88 | | 2,159 | | 2,351 | | | | | 4,598 | |
Contracted capacity as a % of total capacity (%)(3) | 10 | | 83 | | 46 | | | | | 53 | |
| | | | | | | | |
(1)Other regions include the U.S., Western Australia and Canada, excluding Alberta. Gross installed capacity across all segments for the U.S., Western Australia and Canada, excluding Alberta, totaled 1,024 MW, 498 MW and 1,853 MW, respectively, with the number of facilities across all segments totaling 10, 9 and 24, respectively. Refer to 2025 Annual Report for details.
(2)Gross installed capacity for consolidated reporting is based on a proportionate interest held in a facility.
(3)Majority of our total installed contracted capacity is contracted with creditworthy counterparties.
(4)On Feb. 2, 2026, the Company closed the acquisition of Far North Power Corporation (Far North) for a purchase price of $95 million from an affiliate of Hut 8 Corporation, subject to working capital and other adjustments. Gas segment includes gross installed capacity of 310 MW from four natural gas-fired facilities in Ontario attributable to the acquisition of Far North.
(5)Gas segment excludes Ada Cogeneration facility in the U.S. due to its retirement on Jan. 5, 2026.
Following Centralia's cessation of coal-fired operations at the end of 2025 in the normal course, the Energy Transition segment is no longer considered a reportable segment. The segment has therefore been excluded from the table above. Refer to Note 17 of our unaudited interim condensed consolidated financial statements for details.
The Company continues to take all measures necessary to ensure that Centralia Unit 2 complies with the Order received from the U.S. Department of Energy and intends to exercise its right to seek recovery of eligible costs through future petitions. Refer to the "Significant and Subsequent Events" section for details.
Highlights
| | | | | | | | | | | | | | |
| 3 months ended Sept. 30 | 9 months ended Sept. 30 |
| (in millions of Canadian dollars except where noted) | 2026 | 2025 | 2026 | 2025 |
Operational information(1) | | | | |
| Availability (%) | 92.6 | | 92.7 | | 92.2 | | 93.1 | |
| Production (GWh) | 5,260 | | 6,151 | | 15,424 | | 17,796 | |
Select financial information(1) | | | | |
| Revenues | 536 | | 615 | | 1,588 | | 1,806 | |
| | | | |
| | | | |
| | | | |
Adjusted EBITDA(2) | 264 | | 238 | | 759 | | 857 | |
Adjusted Earnings before Income Taxes(2) | 91 | | 17 | | 226 | | 167 | |
| Earnings (loss) before income taxes | 100 | | (53) | | 203 | | (99) | |
Adjusted Net Earnings (Loss) Attributable to Common Shareholders(2) | 56 | | (8) | | 128 | | 76 | |
| Net earnings (loss) attributable to common shareholders | 63 | | (62) | | 111 | | (128) | |
Cash flows(1) | | | | |
| Cash flow from operating activities | 132 | | 251 | | 317 | | 415 | |
Funds from operations(2) | 146 | | 156 | | 484 | | 587 | |
Free cash flow(2) | 93 | | 105 | | 338 | | 421 | |
Per share(1) | | | | |
| Weighted average number of common shares outstanding (in millions) | 316 | | 297 | | 305 | | 297 | |
Adjusted Net Earnings (Loss) Attributable to Common Shareholders per share(2)(3)(4) | 0.18 | | (0.02) | | 0.37 | | 0.26 | |
Net earnings (loss) per share attributable to common shareholders, basic and diluted(4) | 0.20 | | (0.20) | | 0.32 | | (0.43) | |
| Dividends declared per common share | 0.07 | | 0.065 | | 0.14 | | 0.13 | |
| | | | |
Cash flow from operating activities per share(5) | 0.42 | | 0.85 | | 1.04 | | 1.40 | |
Funds from operations per share(2)(3) | 0.46 | | 0.53 | | 1.59 | | 1.98 | |
Free cash flow per share(2)(3) | 0.29 | | 0.35 | | 1.11 | | 1.42 | |
(1)IFRS financial statements for the nine months ended Sept. 30, 2025 include the results attributable to Poplar Hill and Rainbow Lake facilities (collectively, the Required Divestitures), which the Company divested in accordance with a consent agreement entered into with the Commissioner of Competition for Canada. Our non-IFRS measures and operational Key Performance Indicators exclude the results of the Required Divestitures.
(2)These are non-IFRS measures and ratios, which are not defined and have no standardized meaning under IFRS and may not be comparable to similar measures presented by other issuers. Refer to the "Segmented Financial Performance and Operating Results by Geographical Location" section of this MD&A for further discussion of these items. Also, refer to the "Non-IFRS and Supplementary Financial Measures" section of this MD&A for more information regarding these non-IFRS measures and ratios, including, where applicable, reconciliations to measures calculated in accordance with IFRS.
(3)Adjusted Net Earnings (Loss) Attributable to Common Shareholders per share, funds from operations (FFO) per share and free cash flow (FCF) per share are calculated using the weighted average number of common shares outstanding during the period. Refer to the "Non-IFRS and Supplementary Financial Measures" section of this MD&A for more information regarding these non-IFRS measures and ratios.
(4)Net earnings (loss) attributable to common shareholders and Adjusted Net Earnings (Loss) Attributable to Common Shareholders used in calculating net earnings (loss) per share attributable to common shareholders and Adjusted Net Earnings (Loss) Attributable to Common Shareholders per share reflect the cumulative preferred share dividend entitlement required for the current period.
(5)Represents a supplementary financial measure and is calculated as cash flow from operating activities for the period divided by the weighted average number of common shares outstanding during the period.
| | | | | | | | |
| (in millions of Canadian dollars except where noted) | | |
| As at | Sept. 30, 2026 | Dec. 31, 2025 |
| Liquidity and capital resources | | |
Available liquidity(1) | 1,867 | | 1,500 | |
Adjusted Net Debt to Adjusted EBITDA (times)(2)(3) | 4.1 | | 4.0 | |
Adjusted Net Debt(2)(4) | 4,121 | | 4,396 | |
| Assets and liabilities | | |
| Total assets | 8,766 | | 8,661 | |
Total long-term liabilities(5) | 5,170 | | 5,366 | |
| Total liabilities | 6,829 | | 7,196 | |
(1)Available liquidity is a supplementary financial measure and is calculated as the sum of total available capacity under the committed credit and term facilities and cash and cash equivalents less bank overdraft and the amounts drawn under the non-committed demand facilities.
(2)These are non-IFRS measures and ratios, which are not defined and have no standardized meaning under IFRS and may not be comparable to similar measures presented by other issuers. Refer to the "Segmented Financial Performance and Operating Results by Geographical Location" section of this MD&A for further discussion of these items. Also, refer to the "Non-IFRS and Supplementary Financial Measures" section of this MD&A for more information regarding these non-IFRS measures and ratios, including, where applicable, reconciliations to measures calculated in accordance with IFRS.
(3)The most directly comparable IFRS ratio to Adjusted Net Debt to Adjusted EBITDA (times) is calculated as credit facilities, long-term debt and lease liabilities of $3,470 million (Dec. 31, 2025 — $3,593 million) divided by earnings before income taxes for the last four quarters of $161 million (Dec. 31, 2025 — loss before income taxes $141 million) and is equal to 22 times (Dec. 31, 2025 — (25) times). Refer to the "Financial Condition" section of this MD&A for details of the calculation.
(4)The most directly comparable IFRS measure to Adjusted Net Debt is total credit facilities, long-term debt and lease liabilities, which is equal to $3,470 million (Dec. 31, 2025 — $3,593 million). Refer to the table in the "Financial Condition" section of this MD&A for more details on the composition of Adjusted Net Debt.
(5)Total long-term liabilities are equal to total non-current liabilities in the consolidated statements of financial position under IFRS.
Significant and Subsequent Events - Third Quarter 2026
Mothballing of Battle River Units 4 and 5 and Extension of the Mothballing of Sundance 6
On Nov. 2, 2026, the Company provided notice to the Alberta Electric System Operator (AESO) that Battle River Units 4 and 5 will be mothballed effective March 1, 2027, for a period of time up to Jan. 1, 2029 and extended the mothballing of Sundance 6 for a period of time up to April 1, 2029. The Company maintains the flexibility to return the mothballed units to service when market fundamentals improve or contracting opportunities are secured. Battle River Units 4 and 5 will remain available and fully operational through to March 1, 2027.
Sale of minority interest in Oklahoma wind portfolio
On Oct. 22, 2026, the Company completed the sale of a 49 per cent minority ownership interest in its 500 MW Oklahoma wind portfolio to Ares Infrastructure funds for cash proceeds of US$305 million, before customary closing adjustments. The portfolio comprises the 100 MW White Rock West, 200 MW White Rock East and 200 MW
Horizon Hill wind facilities. The Company will continue to provide operational oversight under a long-term asset management agreement.
Acquisition of Mountain Peak Power and Canyon Peak Power and associated public offering of common shares
On Oct. 22, 2026, the Company closed the acquisition of Mountain Peak Power and Canyon Peak Power, two fully contracted natural gas-fired peaking facilities totaling 318 MW near Denver, Colorado from an indirect subsidiary of Blackstone, Inc. (the Acquisition). The purchase price for the Acquisition was US$1 billion, including the assumption of US$750 million of project debt.
On June 9, 2026 the Company closed a public offering of 18,230,000 common shares at a price of $19.20 per share through a syndicate of underwriters, for total gross proceeds of approximately $350 million, which was used to fund the cash portion of the purchase price for the Acquisition. The proceeds received in advance of the Acquisition were partially used to repay the drawn amounts under the syndicated credit facility.
Centralia Unit 2 Mandated to Remain Available for additional 90 days
On Sept. 14, 2026, the Company received another order from the U.S. Department of Energy (the Order) requiring that our 700 MW Centralia Unit 2 facility (Facility) remain available for operation for an additional period of 90 days, until Dec. 12, 2026. As previously communicated, the Company has been subject to the Order from the U.S. Department of Energy since Dec. 16, 2025. The Company
continues to comply with the Order and continues to work with the federal and state governments in relation thereto. The Facility had no generation during the nine months ended Sept. 30, 2026.
Declaration of Common Share Dividend
On Oct. 27, 2026, TransAlta's Board of Directors approved a quarterly dividend payment of $0.070 per common share payable on Jan. 1, 2027.
Operating and Financial Performance
Operating Performance
The following table provides availability (%) by segment:
| | | | | | | | | | | | | | | |
| 3 months ended Sept. 30, | 9 months ended Sept. 30, | |
| 2026 | 2025 | 2026 | 2025 | |
| Hydro | 94.9 | | 82.9 | | 93.2 | | 91.1 | | |
| Wind and Solar | 93.7 | | 94.3 | | 93.5 | | 94.3 | | |
| Gas | 91.5 | | 95.4 | | 91.2 | | 93.7 | | |
Energy Transition(1) | 67.4 | | 83.3 | | 89.0 | | 87.2 | | |
Availability(1) (%) | 92.6 | | 92.7 | | 92.2 | | 93.1 | | |
(1)Centralia Unit 2 facility ceased coal-fired operations at the end of 2025 in the normal course and therefore, the Facility is excluded from total availability in the current period. The Facility continues to comply with the Order received from the U.S. Department of Energy.
Availability measures the percentage of time a facility is able to produce electricity and is a key indicator of fleet performance.
Availability for the three and nine months ended Sept. 30, 2026 was 92.6 and 92.2 per cent compared to 92.7 and 93.1 per cent, respectively, for the same periods in 2025, primarily due to:
•Higher planned and unplanned maintenance outages in the Gas segment; and
•Higher unplanned maintenance outages in the Wind and Solar segment; partially offset by
•Lower planned maintenance outages in the Hydro segment.
Production and Long-Term Average Generation
The following table provides the production and long-term average generation by segment:
| | | | | | | | | | | | | | | | | | | | | | | |
| 2026 | | 2025 |
| 3 months ended Sept. 30 | Actual production (GWh) | LTA generation (GWh) | Production as a % of LTA | | Actual production (GWh) | LTA generation (GWh) | Production as a % of LTA |
| Hydro | 666 | | 563 | | 118 | % | | 623 | | 573 | | 109 | % |
| Wind and Solar | 1,243 | | 1,195 | | 104 | % | | 1,028 | | 1,472 | | 70 | % |
| | | | | | | |
| | | | | | | |
| Gas | 3,351 | | | | | 3,514 | | | |
| Energy Transition | — | | | | | 986 | | | |
| | | | | | | |
| | | | | | | |
| Total | 5,260 | | | | | 6,151 | | | |
| | | | | | | |
| | | | | | | | | | | | | | | | | | | | | | | |
| 2026 | | 2025 |
| 9 months ended Sept. 30 | Actual production (GWh) | LTA generation (GWh) | Production as a % of LTA | | Actual production (GWh) | LTA generation (GWh) | Production as a % of LTA |
| Hydro | 1,711 | | 1,504 | | 114 | % | | 1,578 | | 1,568 | | 101 | % |
| Wind and Solar | 4,739 | | 4,719 | | 100 | % | | 4,446 | | 5,282 | | 84 | % |
| | | | | | | |
| | | | | | | |
| Gas | 8,974 | | | | | 9,504 | | | |
| Energy Transition | — | | | | | 2,268 | | | |
| | | | | | | |
| | | | | | | |
| Total | 15,424 | | | | | 17,796 | | | |
In addition to availability, the Company uses long‑term average (LTA) generation as a key performance indicator for its renewable facilities, comparing actual production to expected long‑term output. While Hydro and Wind and Solar production can vary period to period, over longer durations, facilities are expected to perform in-line with their LTA, which represents an annualized energy output expected from our facilities based on historical resource data, observed operating performance and forward‑looking assumptions about future conditions. LTA generation is not applicable to the Gas segment, as these dispatchable facilities operate based on market conditions, and merchant and customer demand.
Total production for the three and nine months ended Sept. 30, 2026, decreased by 891 and 2,372 GWh, or 14 and 13 per cent, respectively, compared to the same periods in 2025, primarily due to:
•No production at Centralia Unit 2 in the Energy Transition segment. Refer to the "Description of the Business" section of this MD&A; and
•Higher dispatch optimization in Alberta in the Gas segment due to lower market prices; and
•Retirement of the Ada Cogeneration facility in the U.S. in Jan. 2026; partially offset by
•Higher production volumes in the Wind and Solar segment due to higher wind resource; and
•Higher production in the Gas segment due to the addition of the Far North facilities.
Total production for the nine months ended Sept. 30, 2026 was further impacted by higher production in the Hydro segment due to higher water resource.
Financial Performance Review of Consolidated Information
| | | | | | | | | | | | | | |
| | |
| 3 months ended Sept. 30, | 9 months ended Sept. 30, |
| 2026 | 2025 | 2026 | 2025 |
| Revenues | 536 | | 615 | | 1,588 | | 1,806 | |
| | | | |
| | | | |
| Gross Margin | 411 | | 353 | | 1,205 | | 1,119 | |
| Operations, maintenance and administration | (174) | | (179) | | (530) | | (525) | |
| Depreciation and amortization | (104) | | (135) | | (314) | | (431) | |
| | | | |
| | | | |
| | | | |
| Interest expense | (75) | | (85) | | (241) | | (266) | |
| | | | |
| Earnings (loss) before income taxes | 100 | | (53) | | 203 | | (99) | |
| | | | |
| Net earnings (loss) attributable to common shareholders | 63 | | (62) | | 111 | | (128) | |
| | | | |
| | | | |
Adjusted Earnings before Income Taxes(1) | 91 | | 17 | | 226 | | 167 | |
Adjusted Net Earnings (Loss) Attributable to Common Shareholders(1) | 56 | | (8) | | 128 | | 76 | |
| | | | |
| | | | |
| | | | |
(1)These are non-IFRS measures. Refer to the "Non-IFRS and Supplementary Financial Measures" section of this MD&A.
Three months ended Sept. 30, 2026 Variance Analysis (2026 versus 2025)
Revenues for the three months ended Sept. 30, 2026, decreased by $79 million, or 13 per cent, compared to the same period in 2025, primarily due to:
•No production at Centralia Unit 2;
•Lower revenue from the Sarnia gas facility due to contract renewal at a lower price and the retirement of the Ada Cogeneration facility; and
•Lower revenues in the Gas and Hydro segments due to lower spot and ancillary services prices in the Alberta market, partially offset by higher merchant and ancillary
services volumes in the Hydro segment; partially offset by
•Higher unrealized mark-to-market gains on derivatives primarily due to a decrease in forward market prices and forecasted volumes in the current period;
•Higher revenues in the Gas segment from the addition of the Far North facilities; and
•Higher revenues in the Wind and Solar segment due to higher wind resource across all regions.
Mark-to-market gains in the current period were also impacted by the adoption of IFRS 9 hedge accounting, effective Jan. 1, 2026. Refer to the "Material Accounting Policies, Accounting Changes and Critical Accounting Estimates" section of this MD&A for details.
Gross Margin for the three months ended Sept. 30, 2026, increased by $58 million, or 16 per cent, compared to the same period in 2025, primarily due to:
•Higher carbon compliance recovery due to the planned utilization of emission credits, which reduced the 2026 carbon compliance obligation in the current period; partially offset by
•The factors which decreased revenues as explained above.
OM&A expenses for the three months ended Sept. 30, 2026 decreased by $5 million, or three per cent, compared to the same period in 2025, primarily due to:
•Lower spending due to one-time costs incurred during the prior period and current period saving initiatives; and
•Lower spending following the successful completion of an upgrade to our enterprise resource planning (ERP) system; partially offset by
•Higher spending associated with Centralia Unit 2 to comply with the Order; and
•Addition of OM&A from the acquisition of the Far North facilities.
Depreciation and amortization for the three months ended Sept. 30, 2026, decreased by $31 million, or 23 per cent, compared to the same period in 2025, primarily due to:
•Lower depreciation in the Gas segment in the current period due to a change in the useful life assumptions in 2025 for the Sheerness facilities; and
•Lower depreciation for Centralia Unit 2 due to the cessation of coal-fired operations in the normal course.
Interest expense for the three months ended Sept. 30, 2026, decreased by $10 million, or 12 per cent, compared to 2025, primarily due to lower interest on certain senior notes following their refinancing at lower interest rates during 2025 and lower average outstanding debt.
Earnings before income taxes for the three months ended Sept. 30, 2026, increased by $153 million, or 289 per cent, from loss before income taxes in the same period in 2025, primarily due to the items noted above.
Net earnings attributable to common shareholders for the three months ended Sept. 30, 2026, increased by $125 million, or 202 per cent, from net loss attributable to common shareholders in the same period of 2025, primarily due to:
•The items noted above; partially offset by
•Higher income taxes due to an increase in earnings before income taxes.
Adjusted Earnings before Income Taxes for the three months ended Sept. 30, 2026, increased by $74 million, or 435 per cent, compared to the same period in 2025, primarily due to:
•The factors causing higher Adjusted EBITDA described in the "Adjusted EBITDA" section of this MD&A; and
•Lower depreciation and amortization, and lower interest expense as explained above.
Adjusted Net Earnings Attributable to Common Shareholders for the three months ended Sept. 30, 2026 increased from Adjusted Net Loss attributable to Common Shareholders in the same period in 2025 primarily due to higher Adjusted Earnings before Income Taxes as explained above.
Nine months ended Sept. 30, 2026 Variance Analysis (2026 versus 2025)
Revenues for the nine months ended Sept. 30, 2026 totalled $1,588 million, a decrease of $218 million, or 12 per cent, compared to the same period in 2025, primarily due to:
•No production at Centralia Unit 2;
•Lower revenues for the Hydro and Gas segments due to lower spot and ancillary services prices in the Alberta market, net of favourable hedge pricing;
•Lower revenue from the Sarnia gas facility due to a contract renewal at a lower price and the retirement of the Ada Cogeneration facility; and
•Lower environmental and tax attributes revenues in the Hydro segment due to lower sales of emission credits to third parties; partially offset by
•Higher unrealized mark-to-market gains on derivatives primarily due to a decrease in forward market prices and forecasted volumes, and an increase in favourable hedge positions settled, which generated positive contributions over settled spot prices;
•Higher merchant revenues in the Gas segment in Eastern Canada driven by higher realized prices and generation; and
•Higher revenues in the Gas segment from the addition of the Far North facilities.
Mark-to-market gains in the current period were also impacted by the adoption of IFRS 9 hedge accounting, effective Jan. 1, 2026. Refer to the "Material Accounting Policies, Accounting Changes and Critical Accounting Estimates" section of this MD&A for details.
Gross Margin for the nine months ended Sept. 30, 2026 increased by $86 million, or eight per cent, compared to the same period in 2025, primarily due to:
•A carbon compliance recovery compared to carbon compliance costs in the same period of 2025; and
•The factors which decreased revenues as explained above.
OM&A expenses for the nine months ended Sept. 30, 2026 increased by $5 million, or one per cent, compared to the same period in 2025, primarily due to:
•Higher termination, restructuring and legal costs; and
•Addition of OM&A from the acquisition of the Far North facilities; partially offset by
•Lower spending due to one-time costs incurred during the prior period and current period saving initiatives; and
•Lower spending following the successful completion of an upgrade to our ERP system.
Depreciation and amortization for the nine months ended Sept. 30, 2026 totalled $314 million, a decrease of $117 million, or 27 per cent, compared to the same period in 2025, primarily due to the factors listed above in the three months ended Sept. 30, 2026 variance analysis.
Interest expense for the nine months ended Sept. 30, 2026 totalled $241 million, a decrease of $25 million, or nine per cent, compared to the same period in 2025, due to:
•Lower interest on certain senior notes following their refinancing at lower interest rates during 2025 and lower average outstanding debt;
•Lower credit facility fees, bank charges and other interest.
Earnings before income taxes for the nine months ended Sept. 30, 2026 totalled $203 million, an increase of $302 million, or 305 per cent, from loss before income taxes in the same period in 2025, primarily due to:
•The items noted above;
•Higher asset impairment reversals primarily related to a change in the discount rates on decommissioning and restoration provisions on retired assets;
•An impairment charge, net of impairment reversals, in the comparative period related to certain Wind and Solar facilities due to changes in expected production volumes and price assumptions;
•Higher unrealized and realized foreign exchange gains mainly due to favourable changes in foreign currency rates; and
•Higher other operating income due to legal settlement recoveries; partially offset by
•Impairment reversal in the comparative period related to generation equipment classified as held for sale.
Net earnings attributable to common shareholders for the nine months ended Sept. 30, 2026 increased by $239 million, or 187 per cent, from net loss attributable to common shareholders in the same period in 2025, primarily due to:
•The items noted above; partially offset by
•Higher income taxes due to an increase in earnings before income taxes, and
•Higher net earnings attributable to non-controlling interests in the current period.
Adjusted Earnings before Income Taxes for the nine months ended Sept. 30, 2026, increased by $59 million, or 35 per cent, compared to the same period in 2025, primarily due to:
•The factors causing lower Adjusted EBITDA described in the "Adjusted EBITDA" section of this MD&A; partially offset by
•Lower depreciation and amortization, and lower interest expense as explained above.
Adjusted Net Earnings Attributable to Common Shareholders for the nine months ended Sept. 30, 2026, increased by $52 million, or 68 per cent, compared to the same period in 2025, primarily due to:
•The factors causing higher Adjusted Earnings before Income Taxes explained above and the associated tax effect; partially offset by
•Higher net earnings attributable to non-controlling interests as explained above.
Refer to the "Segmented Financial Performance and Operating Results by Geographical Location" section for additional information.
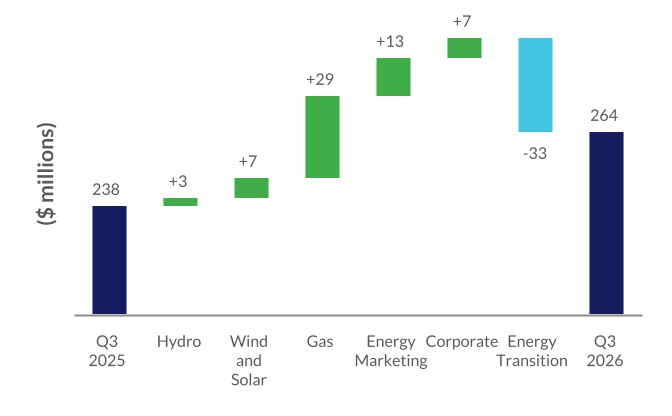
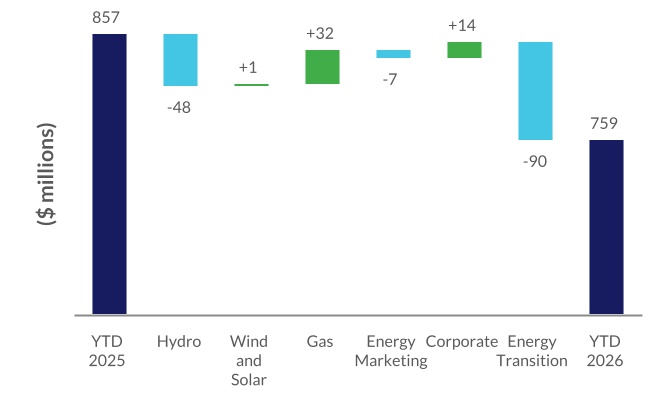
Adjusted EBITDA1
For the three months ended Sept. 30, 2026, the Company's Adjusted EBITDA increased by $26 million, or 11 per cent, compared to the same period in 2025. For the nine months ended Sept. 30, 2026, the Company's Adjusted EBITDA decreased by $98 million, or 11 per cent, compared to the same period in 2025.
The segments impacting Adjusted EBITDA are summarized as follows:
| | | | | |
Q3 2026 vs Q3 2025 | YTD 2026 vs YTD 2025 |
(1)Adjusted EBITDA is a non-IFRS measure. Refer to the "Non-IFRS and Supplementary Financial Measures" section of this MD&A. For the three and nine months ended Sept. 30, 2026, the most directly comparable IFRS measure is earnings before income taxes of $100 million and $203 million, respectively (loss before income taxes of $53 million and $99 million for the three and nine months ended Sept. 30, 2025). Refer to the "Reconciliation of Non-IFRS Measures on a Consolidated Basis by Segments" section of this MD&A.
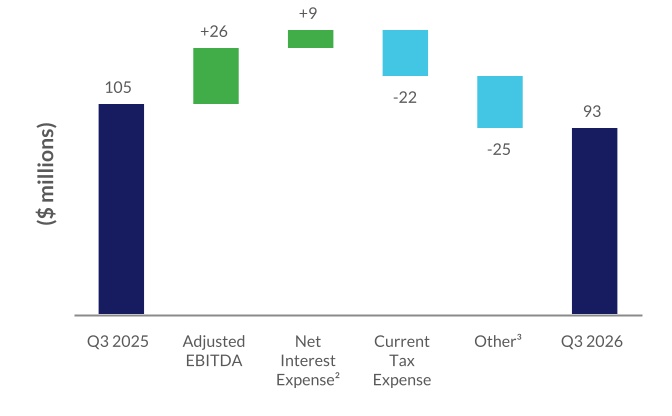
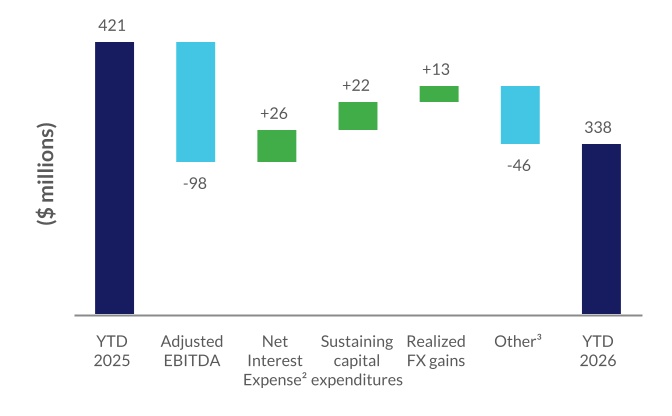
Free Cash Flow1
For the three and nine months ended Sept. 30, 2026, the Company's FCF decreased by $12 million, or 11 per cent, and $83 million, or 20 per cent, respectively, compared to the same periods in 2025.
The major factors impacting FCF are summarized as follows:
| | | | | |
Q3 2026 vs Q3 2025 | YTD 2026 vs YTD 2025 |
(1)FCF is a non-IFRS measure, is not defined and has no standardized meaning under IFRS and may not be comparable to similar measures presented by other issuers. Refer to the "Non-IFRS and Supplementary Financial Measures" section of this MD&A for more information regarding this measure. The most directly comparable IFRS measure is cash flow from operating activities, which was $132 million and $251 million for the three months ended Sept. 30, 2026 and 2025, respectively and $317 million and $415 million for the nine months ended Sept. 30, 2026 and 2025, respectively. Refer to the "Cash Flows" section of this MD&A.
(2)Net Interest Expense is a non-IFRS measure. Net Interest Expense reconciliation is available in "Financial Condition" section of this MD&A. The most directly comparable IFRS measure is interest expense of $75 million and $85 million for the three months ended Sept. 30, 2026 and 2025, respectively and $241 million and $266 million for the nine months ended Sept. 30, 2026 and 2025, respectively.
(3)Other for the three months ended Sept. 30, 2026 primarily consists of changes in contract assets and liabilities of $26 million and other miscellaneous items. Other for the nine months ended Sept. 30, 2026 primarily consists of changes in contract assets and liabilities of $31 million and legal settlement of $12 million and other miscellaneous items.
For 2026, the Company reaffirms Adjusted EBITDA to be in the range of $950 million to $1,050 million and FCF to be in the range of $350 million to $450 million. For details, please refer to the "2026 Outlook" section of the 2025 Annual Report for the assumptions which have remained the same.
The following table outlines our expectations on key financial targets and related assumptions for 2026 and should be read in conjunction with the narrative discussion that follows and the "Risk Management" section of the 2025 Annual MD&A:
| | | | | | | | | | | | | |
| Measure | 9 months ended Sept. 30, 2026(2) | 2026 Target(3) | | | 2025 Actual(4) |
Adjusted EBITDA(1) | $759 million | $950 million to $1,050 million | | | $1,104 million |
FCF(1) | $338 million | $350 million to $450 million | | | $514 million |
FCF per share(1) | $1.11 | $1.18 to $1.51 | | | $1.73 |
| Dividend per share | $0.14 | $0.28 annualized | | | $0.26 annualized |
(1)These are non-IFRS measures. Refer to the "Reconciliation of Non-IFRS Measures" section of this MD&A for further discussion of these items, including, where applicable, reconciliations to measures calculated in accordance with IFRS. See also the "Non-IFRS and Supplementary Financial Measures" section of this MD&A.
(2)The nine month ended Sept. 30, 2026 amounts for the most directly comparable IFRS measures for Adjusted EBITDA and FCF were as follows: Earnings before income taxes of $203 million and cash flow from operating activities of $317 million. The most directly comparable IFRS ratio to FCF per share is cash flow from operating activities per share of $1.04. Refer to the "Non-IFRS and Supplementary Financial Measures" section of this MD&A for additional information.
(3)Represents forward-looking information.
(4)The actual 2025 amounts for the most directly comparable IFRS measures for Adjusted EBITDA and FCF were as follows: Loss before income taxes of $141 million and Cash flow from operating activities of $646 million. The most directly comparable IFRS ratio to FCF per share is cash flow from operating activities per share of $2.18. Refer to the "Non-IFRS and Supplementary Financial Measures" section of this MD&A for additional information.
The Company's 2026 outlook may be impacted by a number of factors, including hedging assumptions detailed further below.
Alberta Hedging
| | | | | | | | | | | | | |
| Range of hedging assumptions | | | Q4 2026 | Full Year 2026 | Full year 2027 |
| Hedged production (GWh) | | | 2,061 | | 9,364 | | 6,732 | |
| Hedge price ($/MWh) | | | $67 | $65 | $65 |
| Hedged gas amounts (GJ) | | | 9.1 million | 40.9 million | 33.5 million |
| Hedge gas prices ($/GJ) | | | $3.14 | $3.04 | $2.68 |
Alberta spot price sensitivity: a +/- $1 per MWh change in spot price is expected to have a +/- $1 million impact on Adjusted EBITDA for the remainder of 2026.
Segmented Financial Performance and Operating Results by Geographical Location
Segmented information is prepared on the same basis that the Company manages its business, evaluates financial results and makes key operating decisions. The following table reflects the Adjusted EBITDA by segment across the regions we operate in for the three and nine months ended Sept. 30, 2026 and 2025:
| | | | | | | | | | | | | | | | | | | | | | | | |
| | | | | | | | |
| | | | | | | | |
| | | | | | | | |
| | | | | | | | |
| | | | | | | | |
| | | | | | | | |
| | | | | | | | |
| | | | | | | | |
| | | | | | | | |
| | | | | | | | |
| | | | | | | | |
| | | | | | | | |
| | | | | | | | |
| | | | | | | | |
| | | | | | | | |
| | | | | | | | |
| 3 months ended Sept. 30, 2026 | | Hydro | Wind & Solar(2) | Gas | Energy Marketing | Corporate | Energy Transition | Total |
| Alberta | | 71 | | (2) | | 79 | | 30 | | (28) | | (2) | | 148 | |
| Canada, excluding Alberta | | 5 | | 18 | | 31 | | — | | — | | — | | 54 | |
| U.S. | | — | | 33 | | — | | — | | — | | (3) | | 30 | |
| Western Australia | | — | | 3 | | 29 | | — | | — | | — | | 32 | |
Adjusted EBITDA(1) | | 76 | | 52 | | 139 | | 30 | | (28) | | (5) | | 264 | |
Adjusted Earnings (Loss) before Income Taxes(1) | | 68 | | 1 | | 98 | | 30 | | (101) | | (5) | | 91 | |
| Earnings (loss) before income taxes | | 68 | | 24 | | 92 | | 23 | | (96) | | (11) | | 100 | |
| | | | | | | | |
| 3 months ended Sept. 30, 2025 | | Hydro | Wind & Solar(2) | Gas | Energy Marketing | Corporate | Energy Transition | Total |
| Alberta | | 68 | | — | | 55 | | 17 | | (35) | | (2) | | 103 | |
| Canada, excluding Alberta | | 5 | | 15 | | 27 | | — | | — | | — | | 47 | |
| U.S. | | — | | 28 | | 4 | | — | | — | | 30 | | 62 | |
| Western Australia | | — | | 2 | | 24 | | — | | — | | — | | 26 | |
Adjusted EBITDA(1) | | 73 | | 45 | | 110 | | 17 | | (35) | | 28 | | 238 | |
Adjusted Earnings (Loss) before Income Taxes(1) | | 64 | | (7) | | 51 | | 17 | | (125) | | 17 | | 17 | |
| Earnings (loss) before income taxes | | 67 | | (106) | | 63 | | 24 | | (124) | | 23 | | (53) | |
| | | | | | | | |
(1)Adjusted EBITDA and Adjusted Earnings (Loss) before Income Taxes are non-IFRS measures. Refer to the "Non-IFRS and Supplementary Financial Measures" section of this MD&A.
(2)Earnings (loss) before income taxes for the Wind and Solar segment exclude the contribution from Skookumchuck wind facility.
| | | | | | | | | | | | | | | | | | | | | | | | |
| 9 months ended Sept. 30, 2026 | | Hydro | Wind & Solar(2) | Gas | Energy Marketing | Corporate | Energy Transition | Total |
| Alberta | | 189 | | 32 | | 221 | | 57 | | (101) | | (6) | | 392 | |
| Canada, excluding Alberta | | 9 | | 77 | | 71 | | — | | — | | — | | 157 | |
| U.S. | | — | | 121 | | (1) | | — | | — | | — | | 120 | |
| Western Australia | | — | | 7 | | 83 | | — | | — | | — | | 90 | |
Adjusted EBITDA(1) | | 198 | | 237 | | 374 | | 57 | | (101) | | (6) | | 759 | |
Adjusted Earnings (Loss) before Income Taxes(1) | | 170 | | 87 | | 250 | | 57 | | (331) | | (7) | | 226 | |
| Earnings (loss) before income taxes | | 170 | | 104 | | 249 | | 69 | | (370) | | (19) | | 203 | |
| | | | | | | | |
| 9 months ended Sept. 30, 2025 | | Hydro | Wind & Solar(2) | Gas | Energy Marketing | Corporate | Energy Transition | Total |
| Alberta | | 235 | | 31 | | 181 | | 64 | | (115) | | (7) | | 389 | |
| Canada, excluding Alberta | | 11 | | 95 | | 81 | | — | | — | | — | | 187 | |
| U.S. | | — | | 104 | | 9 | | — | | — | | 91 | | 204 | |
| Western Australia | | — | | 6 | | 71 | | — | | — | | — | | 77 | |
Adjusted EBITDA(1) | | 246 | | 236 | | 342 | | 64 | | (115) | | 84 | | 857 | |
Adjusted Earnings (Loss) before Income Taxes(1) | | 220 | | 79 | | 145 | | 62 | | (384) | | 45 | | 167 | |
| Earnings (loss) before income taxes | | 226 | | (127) | | 105 | | 72 | | (425) | | 50 | | (99) | |
| | | | | | | | |
(1)Adjusted EBITDA and Adjusted Earnings (Loss) before Income Taxes are non-IFRS measures. Refer to the "Non-IFRS and Supplementary Financial Measures" section of this MD&A.
(2)Earnings (loss) before income taxes for the Wind and Solar segment exclude the contribution from Skookumchuck wind facility.
Hydro
| | | | | | | | | | | | | | | | | | | | | | | | | | | | |
| | | | | | | | |
| | | 3 months ended Sept. 30 | 9 months ended Sept. 30 |
| | | 2026 | 2025 | Change | 2026 | 2025 | Change |
| | | | | | | | | | |
| | | | | | | | | | |
| | | | | | | | | | |
| | | | | | | | | | |
| Production | | | | | | | | | | |
| Contract production (GWh) | | | 94 | | 99 | | (5) | | (5) | % | 266 | | 276 | | (10) | | (4) | % |
| Merchant production (GWh) | | | 572 | | 524 | | 48 | | 9 | % | 1,445 | | 1,302 | | 143 | | 11 | % |
| Total energy production (GWh) | | | 666 | | 623 | | 43 | | 7 | % | 1,711 | | 1,578 | | 133 | | 8 | % |
Ancillary service volumes (GWh)(1) | | | 755 | | 674 | | 81 | | 12 | % | 2,311 | | 2,173 | | 138 | | 6 | % |
| | | | | | | | | | |
Alberta Hydro Assets ancillary services revenues(1) | | | 31 | | 32 | | (1) | | (3) | % | 78 | | 85 | | (7) | | (8) | % |
Alberta Hydro Assets revenues(2) | | | 34 | | 38 | | (4) | | (11) | % | 88 | | 103 | | (15) | | (15) | % |
Other Hydro Assets revenues and other Hydro revenues(3) | | | 15 | | 22 | | (7) | | (32) | % | 42 | | 46 | | (4) | | (9) | % |
| | | | | | | | | | |
| Environmental and tax attributes revenues | | | 15 | | — | | 15 | | — | % | 44 | | 70 | | (26) | | (37) | % |
| | | | | | | | | | |
| | | | | | | | | | |
Adjusted Revenues(4) | | | 95 | | 92 | | 3 | | 3 | % | 252 | | 304 | | (52) | | (17) | % |
| | | | | | | | | | |
| | | | | | | | | | |
| | | | | | | | | | |
| | | | | | | | | | |
| | | | | | | | | | |
Adjusted EBITDA(4) | | | 76 | | 73 | | 3 | | 4 | % | 198 | | 246 | | (48) | | (20) | % |
| | | | | | | | | | |
| | | | | | | | | | |
| Earnings before income taxes | | | 68 | | 67 | | 1 | | 1 | % | 170 | | 226 | | (56) | | (25) | % |
| | | | | | | | | | |
| | | | | | | | | | |
| | | | | | | | | | |
| | | | | | | | | | |
| | | | | | | | | | |
| | | | | | | | | | |
(1)Alberta Hydro Assets ancillary services revenues is a supplementary financial measure. Alberta Hydro Assets ancillary services revenues are revenues earned from providing services required to ensure that the interconnected electric system is operated in a manner that provides a satisfactory level of service with acceptable levels of voltage and frequency as described in the AESO Consolidated Authoritative Document Glossary.
(2)Alberta Hydro Assets revenues is a supplementary financial measure and is comprised of revenues from 13 hydro facilities on the Bow and North Saskatchewan river systems, as well as revenues from swaps and forward hedges.
(3)Other Hydro Assets revenues is a supplementary financial measure and consists of revenues from our hydro facilities in British Columbia, Ontario and Alberta (other than the Alberta Hydro Assets). Other Hydro revenues is a supplementary financial measure and includes revenues from our transmission business and other contractual arrangements, including the flood mitigation agreement with the Government of Alberta and black start services.
(4)Adjusted Revenues and Adjusted EBITDA are non-IFRS measures, are not defined and have no standardized meaning under IFRS and may not be comparable to similar measures presented by other issuers. Refer to the "Non-IFRS and Supplementary Financial Measures" section of this MD&A for more information regarding these measures. The most directly comparable IFRS measure to Adjusted Revenues is revenues of $95 million and $252 million for the three and nine months ended Sept. 30, 2026, respectively (Sept. 30, 2025 — $95 million and $310 million), to Adjusted EBITDA — earnings before income taxes of $68 million and $170 million for the three and nine months ended Sept. 30, 2026, respectively (Sept. 30, 2025 — $67 million and $226 million).
Adjusted Revenues and Adjusted EBITDA for the three months ended Sept. 30, 2026 increased compared to the same period in 2025, primarily due to:
•Higher environmental and tax attributes revenues due to higher intercompany sales of emission credits to the Gas segment; and
•Higher merchant and ancillary services volumes due to higher water resource and availability; partially offset by
•Lower spot and ancillary services prices in the Alberta market, net of favourable hedge pricing.
Earnings before income taxes for the three months ended Sept. 30, 2026 were comparable to the same period in 2025.
Adjusted Revenues, Adjusted EBITDA and earnings before income taxes for the nine months ended Sept. 30, 2026 decreased compared to the same period in 2025, primarily due to:
•Lower environmental and tax attributes revenues due to lower intercompany sales of emission credits to the Gas segment and lower sales of emission credits to third parties; and
•Lower spot and ancillary services prices in the Alberta market, net of favourable hedge pricing; partially offset by
•Higher merchant and ancillary services volumes due to higher water resource and availability.
Earnings before income taxes for the nine months ended Sept. 30, 2026 were further impacted by lower unrealized mark-to-market gains on derivatives due to changes in forward market prices in the current period.
For further discussion on Alberta market conditions and pricing, refer to the "Optimization of Alberta Portfolio" section of this MD&A.
Wind and Solar | | | | | | | | | | | | | | | | | | | | | | | | | | | | | |
| | | | | | | | | |
| | | 3 months ended Sept. 30 | 9 months ended Sept. 30 | |
| | | 2026 | 2025 | Change | 2026 | 2025 | Change | |
| | | | | | | | | | | |
| | | | | | | | | | | |
| | | | | | | | | | | |
| | | | | | | | | | | |
| Production | | | | | | | | | | | |
| Contract production (GWh) | | | 1,064 | | 897 | | 167 | | 19 | % | 3,959 | | 3,799 | | 160 | | 4 | % | |
| Merchant production (GWh) | | | 179 | | 131 | | 48 | | 37 | % | 780 | | 647 | | 133 | | 21 | % | |
| Total production (GWh) | | | 1,243 | | 1,028 | | 215 | | 21 | % | 4,739 | | 4,446 | | 293 | | 7 | % | |
| | | | | | | | | | | |
| | | | | | | | | | | |
| | | | | | | | | | | |
Adjusted Revenues(1)(2)(3) | | | 88 | | 83 | | 5 | | 6 | % | 345 | | 357 | | (12) | | (3) | % | |
| | | | | | | | | | | |
| | | | | | | | | | | |
| | | | | | | | | | | |
| | | | | | | | | | | |
| | | | | | | | | | | |
| | | | | | | | | | | |
Adjusted EBITDA(2)(3) | | | 52 | | 45 | | 7 | | 16 | % | 237 | | 236 | | 1 | | — | % | |
| | | | | | | | | | | |
| | | | | | | | | | | |
Earnings (loss) before income taxes(4) | | | 24 | | (106) | | 130 | | (123) | % | 104 | | (127) | | 231 | | (182) | % | |
| Supplementary information: | | | | | | | | | | | |
Environmental and tax attributes revenues(1) | | | 19 | | 18 | | 1 | | 6 | % | 82 | | 83 | | (1) | | (1) | % | |
| | | | | | | | | | | |
| | | | | | | | | | | |
(1)Production Tax Credits related to the U.S. wind facilities that are subject to tax equity financing arrangements are excluded from the Environmental and tax attributes revenues line and are included under Adjusted Revenues line.
(2)The Skookumchuck wind facility has been included on a proportionate basis in the Wind and Solar segment.
(3)Adjusted Revenues and Adjusted EBITDA are non-IFRS measures. The most directly comparable IFRS measure to Adjusted Revenues is revenues of $108 million and $336 million for the three and nine months ended Sept. 30, 2026, respectively (Sept. 30, 2025 — $(1) million and $155 million) and to Adjusted EBITDA — earnings before income taxes of $24 million and $104 million for the three and nine months ended Sept. 30, 2026, respectively (Sept. 30, 2025 — loss before income taxes $106 million and $127 million).
(4)Earnings before income taxes exclude the contribution from Skookumchuck wind facility.
Adjusted Revenues and Adjusted EBITDA for the three months ended Sept. 30, 2026 increased compared to the same period in 2025, primarily due to higher wind resource across all regions.
Adjusted Revenues for the nine months ended Sept. 30, 2026 decreased compared to the same period in 2025, primarily due to:
•Lower availability and wind resource in Eastern Canada; and
•Lower spot power prices in the Alberta market; partially offset by
•Higher wind resource in Western Canada and the U.S.
Adjusted EBITDA for the nine months ended Sept. 30, 2026 was comparable to the same period in 2025, primarily due to:
•Lower purchased power and OM&A across the fleet; partially offset by
•Lower Adjusted Revenues as explained above.
Earnings before income taxes for the three and nine months ended Sept. 30, 2026 increased from loss before income taxes for the same periods in 2025, primarily due to:
•Higher unrealized mark-to-market gains on derivatives primarily due to a decrease in forward market prices and forecasted volumes on the long-term wind energy sales contracts related to the Oklahoma and Garden Plain facilities, partially offset by an increase in forward market prices on wind energy sales contract related to Big Level facility; and
•Lower impairment charges in the current period.
Earnings before income taxes for the nine months ended Sept. 30, 2026 were further impacted by higher legal settlement recoveries compared to the same period in 2025.
Mark-to-market gains in the current period were also impacted by the adoption of IFRS 9 hedge accounting, effective Jan. 1, 2026. Refer to the "Material Accounting Policies, Accounting Changes and Critical Accounting Estimates" section of this MD&A for details.
Gas
| | | | | | | | | | | | | | | | | | | | | | | | | | | | |
| | | | | | | | |
| | | 3 months ended Sept. 30 | 9 months ended Sept. 30 |
| | | 2026 | 2025 | Change | 2026 | 2025 | Change |
| | | | | | | | | | |
| | | | | | | | | | |
| | | | | | | | | | |
| Contract sales volume (GWh) | | | 2,349 | | 2,337 | | 12 | | 1 | % | 6,930 | | 7,084 | | (154) | | (2) | % |
| Merchant sales volume (GWh) | | | 1,243 | | 1,402 | | (159) | | (11) | % | 2,786 | | 3,274 | | (488) | | (15) | % |
Purchased power (GWh)(1) | | | (241) | | (225) | | (16) | | 7 | % | (742) | | (854) | | 112 | | (13) | % |
| Total production (GWh) | | | 3,351 | | 3,514 | | (163) | | (5) | % | 8,974 | | 9,504 | | (530) | | (6) | % |
| | | | | | | | | | |
Adjusted Revenues(2) | | | 325 | | 321 | | 4 | | 1 | % | 971 | | 969 | | 2 | | — | % |
| | | | | | | | | | |
| | | | | | | | | | |
| | | | | | | | | | |
| | | | | | | | | | |
| | | | | | | | | | |
Adjusted EBITDA(2) | | | 139 | | 110 | | 29 | | 26 | % | 374 | | 342 | | 32 | | 9 | % |
| | | | | | | | | | |
| | | | | | | | | | |
| Earnings before income taxes | | | 92 | | 63 | | 29 | | 46 | % | 249 | | 105 | | 144 | | 137 | % |
| | | | | | | | | | |
| Supplementary information: | | | | | | | | | | |
| Carbon compliance costs | | | (3) | | (35) | | 32 | | (91) | % | (36) | | (76) | | 40 | | (53) | % |
| | | | | | | | | | |
| | | | | | | | | | |
| | | | | | | | | | |
(1)Power required to fulfil contractual obligations is included in purchased power.
(2)Adjusted Revenues and Adjusted EBITDA are non-IFRS measures. The most directly comparable IFRS measure to Adjusted Revenues is revenues of $315 million and $956 million for the three and nine months ended Sept. 30, 2026, respectively (Sept. 30, 2025 — $326 million and $920 million) and to Adjusted EBITDA — earnings before income taxes of $92 million and $249 million for the three and nine months ended Sept. 30, 2026, respectively (Sept. 30, 2025 — earnings before income taxes of $63 million and $105 million).
Adjusted Revenues for the three and nine months ended Sept. 30, 2026 increased compared to the same periods in 2025, primarily due to:
•Positive contribution from the acquisition of Far North facilities; and
•Higher merchant revenue in Eastern Canada driven by higher realized prices and generation; partially offset by
•Lower revenue from the Sarnia gas facility due to contract renewal at a lower price and the retirement of the Ada Cogeneration facility; and
•Higher dispatch optimization in the Alberta market.
Adjusted EBITDA for the three and nine months ended Sept. 30, 2026 increased compared to the same periods in 2025, primarily due to:
•Lower carbon compliance costs due to the planned utilization of emission credits, which reduced the 2026 carbon compliance obligation in the current period; and
•Higher Adjusted Revenues as explained above; partially offset by
•Higher Adjusted OM&A due to the addition of the Far North facilities.
Adjusted EBITDA for the nine months ended Sept. 30, 2026 was further impacted by lower purchased power costs due to lower market prices.
Earnings before income taxes for the three and nine months ended Sept. 30, 2026 increased compared to the same periods in 2025, primarily due to:
•Higher Adjusted EBITDA as explained above; and
•Lower depreciation driven by a change in the useful life assumptions in 2025 for the Sheerness facilities.
Earnings before income taxes for the three months ended Sept. 30, 2026 were further impacted by lower unrealized mark-to-market gains due to changes in forward market prices in the current period.
Earnings before income taxes for the nine months ended Sept. 30, 2026 were further impacted by higher unrealized mark-to-market gains due to changes in forward market prices in the current period.
Energy Marketing | | | | | | | | | | | | | | | | | | | | | | | | | | | | |
| | | | | | | | |
| | | 3 months ended Sept. 30 | 9 months ended Sept. 30 |
| | | 2026 | 2025 | Change | 2026 | 2025 | Change |
Adjusted Revenues(1) | | | 38 | | 30 | | 8 | | 27 | % | 85 | | 92 | | (7) | | (8) | % |
| | | | | | | | | | |
| | | | | | | | | | |
Adjusted EBITDA(1) | | | 30 | | 17 | | 13 | | 76 | % | 57 | | 64 | | (7) | | (11) | % |
| | | | | | | | | | |
| | | | | | | | | | |
| Earnings before income taxes | | | 23 | | 24 | | (1) | | (4) | % | 69 | | 72 | | (3) | | (4) | % |
| | | | | | | | | | |
(1)Adjusted Revenues and Adjusted EBITDA are non-IFRS measures. The most directly comparable IFRS measure to Adjusted Revenues is revenues of $31 million and $97 million for the three and nine months ended Sept. 30, 2026, respectively (Sept. 30, 2025 — $37 million and $102 million) and to Adjusted EBITDA — earnings before income taxes of $23 million and $69 million for the three and nine months ended Sept. 30, 2026, respectively (Sept. 30, 2025 — $24 million and $72 million).
Adjusted Revenues and Adjusted EBITDA for the three months ended Sept. 30, 2026 were higher compared to the same period in 2025, reflecting:
•Stronger performance across the U.S. power and natural gas markets despite a more subdued volatility environment; and
•Higher realized gains on settled trades.
Earnings before income taxes for the three months ended Sept. 30, 2026 were comparable to the same period in the prior year due to:
•Higher Adjusted EBITDA as explained above; partially offset by
•Higher unrealized mark-to-market losses on derivatives due to changes in forward market prices.
Adjusted Revenues and Adjusted EBITDA for the nine months ended Sept. 30, 2026 were lower compared to the same period in 2025, primarily due to comparatively subdued market volatility across Western U.S.
Earnings before income taxes for the nine months ended Sept. 30, 2026 decreased compared to the same period in 2025, due to:
•Lower Adjusted EBITDA as explained above; partially offset by
•Higher unrealized mark-to-market gains on derivatives due to changes in forward market prices.
Corporate
| | | | | | | | | | | | | | | | | | | | | | | | | | |
| | | | | | | |
| 3 months ended Sept. 30 | 9 months ended Sept. 30 |
| 2026 | 2025 | Change | 2026 | 2025 | Change |
| | | | | | | | |
| | | | | | | | |
Adjusted EBITDA(1) | (28) | | (35) | | 7 | | (20) | % | (101) | | (115) | | 14 | | (12) | % |
| | | | | | | | |
| | | | | | | | |
| | | | | | | | |
| | | | | | | | |
| | | | | | | | |
| | | | | | | | |
| Loss before income taxes | (96) | | (124) | | 28 | | (23) | % | (370) | | (425) | | 55 | | (13) | % |
| | | | | | | | |
| | | | | | | | |
| | | | | | | | |
| | | | | | | | |
| | | | | | | | |
| | | | | | | | |
| | | | | | | | |
| | | | | | | | |
| | | | | | | | |
(1)Adjusted EBITDA are non-IFRS measures. The most directly comparable IFRS measure to Adjusted EBITDA is loss before income taxes of $96 million and $370 million for the three and nine months ended Sept. 30, 2026, respectively (Sept. 30, 2025 — $124 million and $425 million).
Adjusted EBITDA for the three and nine months ended Sept. 30, 2026 increased compared to the same periods in 2025, primarily due to lower OM&A driven by one-time costs incurred during the prior period and current period saving initiatives.
Loss before income taxes for the three and nine months ended Sept. 30, 2026 decreased compared to the same periods in 2025 due to:
•Lower interest expense on certain senior notes, following their refinancing at lower interest rates during 2025 and lower average outstanding debt; and
•Lower spending following the successful completion of an upgrade to our ERP system.
Loss before income taxes for the nine months ended Sept. 30, 2026 was further impacted by:
•Higher foreign exchange gains driven by favourable changes in foreign currency rates; and
•Lower credit facility fees, bank charges and other interest; partially offset by
•Higher termination and restructuring costs; and
•Higher legal costs arising from cost determinations made after the conclusion of arbitration proceedings in the first quarter of 2026.
Energy Transition(1)
| | | | | | | | | | | | | | | | | | | | | | | | | | | | |
| | | | | | | | |
| | | 3 months ended Sept. 30 | 9 months ended Sept. 30 |
| | | 2026 | 2025 | Change | 2026 | 2025 | Change |
| | | | | | | | | | |
| | | | | | | | | | |
| | | | | | | | | | |
| | | | | | | | | | |
| | | | | | | | | | |
| | | | | | | | | | |
| | | | | | | | | | |
Total production(2) (GWh) | | | — | | 986 | | (986) | | (100) | % | — | | 2,268 | | (2,268) | | (100) | % |
| | | | | | | | | | |
Adjusted Revenues(3) | | | 2 | | 148 | | (146) | | (99) | % | 7 | | 389 | | (382) | | (98) | % |
| | | | | | | | | | |
| | | | | | | | | | |
| | | | | | | | | | |
| | | | | | | | | | |
| | | | | | | | | | |
| | | | | | | | | | |
Adjusted EBITDA(3) | | | (5) | | 28 | | (33) | | (118) | % | (6) | | 84 | | (90) | | (107) | % |
| | | | | | | | | | |
| | | | | | | | | | |
| (Loss) earnings before income taxes | | | (11) | | 23 | | (34) | | (148) | % | (19) | | 50 | | (69) | | (138) | % |
| Supplementary information: | | | | | | | | | | |
Highvale mine reclamation spend(4) | | | 3 | | 2 | | 1 | | 50 | % | 8 | | 8 | | — | | — | % |
Centralia mine reclamation spend(4) | | | 5 | | 4 | | 1 | | 25 | % | 12 | | 12 | | — | | — | % |
| | | | | | | | | | |
| | | | | | | | | | |
(1)The Energy Transition segment is a non-reportable segment as at Sept. 30, 2026. Refer to Note 17 of the condensed consolidated financial statements the nine months ended Sept. 30, 2026.
(2)Centralia Unit 2 facility ceased coal-fired operations at the end of 2025 in the normal course. The Facility continues to comply with the Order received from the United States Department of Energy.
(3)Adjusted Revenues and Adjusted EBITDA are non-IFRS measures. The most directly comparable IFRS measure to Adjusted Revenues is revenues of $2 million and $7 million for the three and nine months ended Sept. 30, 2026, respectively (Sept. 30, 2025 — $158 million and $385 million) and to Adjusted EBITDA — loss before income taxes of $11 million and $19 million for the three and nine months ended Sept. 30, 2026 (Sept. 30, 2025 — earnings before income taxes $23 million and $50 million).
(4)Highvale and Centralia mine reclamation spending, which represent the costs necessary to bring the sites to their original condition, are supplementary financial measures and are included in the decommissioning and restoration liabilities settled during the period in the Condensed Consolidated Statements of Financial Position under IFRS.
Centralia ceased coal-fired operations at the end of 2025 in the normal course, therefore there is no production in the current period. The Company continues to take all measures necessary to ensure that Centralia Unit 2 is available to operate in accordance with the Order received from the U.S. Department of Energy. The costs to comply with the Order have been recorded in OM&A and are
excluded from Adjusted EBITDA. Refer to the "Significant and Subsequent Events" and "Regulatory Updates" sections for details.
Mine reclamation spend for the three and nine months ended Sept. 30, 2026 was consistent with the same periods in 2025.
Optimization of the Alberta Portfolio
The Alberta electricity portfolio metrics disclosed below are supplementary financial measures used to provide additional insight into the segment performance in the Alberta market.
Approximately 61 per cent of our generating capacity is located in Alberta, with 77 per cent exposed to the merchant market. Our portfolio of assets consists of hydro, wind, battery storage and natural gas generation facilities.
Our hydro and gas fleets provide ancillary services, with hydro assets also supporting grid reliability, including black start capability and contributing to drought mitigation through regulated river flows. Our Alberta wind and hydro assets generate environmental credits sold to third parties and our Gas segment.
Portfolio performance is supported by fuel and asset diversity, enabling optimization between energy production
and ancillary services. A significant portion of our Alberta capacity is hedged through commercial and industrial customer contracts and financial instruments to enhance cash‑flow stability.
During periods of low market prices, we may elect not to dispatch gas generation and instead monetize contracted or hedged positions. In the nine months ended Sept. 30, 2026, this strategy resulted in higher margins for the portfolio through realized hedging gains and lower operating costs.
In anticipation of the risk of lower prices in 2026, the Company deployed a defensive strategy to increase financial hedges for the merchant portfolio at attractive margins. Realized gains and losses on financial hedges are included in Adjusted Revenues in the tables below.
The following table provides information for the Company's Alberta electricity portfolio:
| | | | | | | | | | | | | | | | | | | | | | | | | | | | | | | | | |
| 2026 | 2025 | |
| 3 months ended Sept. 30 | Hydro | Wind & Solar | Gas | | Total | Hydro | Wind & Solar | Gas | | Total | | | | | |
| Gross installed capacity (MW) | 834 | | 764 | | 3,650 | | | 5,248 | | 834 | | 764 | | 3,650 | | | 5,248 | | | | | | |
Total production(1) (GWh) | 572 | | 330 | | 2,120 | | | 3,022 | | 524 | | 245 | | 2,437 | | | 3,206 | | | | | | |
| Contract production (GWh) | — | | 155 | | 1,284 | | | 1,439 | | — | | 114 | | 1,345 | | | 1,459 | | | | | | |
| Merchant production (GWh) | 572 | | 175 | | 836 | | | 1,583 | | 524 | | 131 | | 1,092 | | | 1,747 | | | | | | |
| | | | | | | | | | | | | | | |
| Ancillary services volumes (GWh) | 755 | | 11 | | 164 | | | 930 | | 674 | | 13 | | 282 | | | 969 | | | | | | |
| Hedged volumes (GWh) | 430 | | 11 | | 2,066 | | | 2,507 | | 393 | | 18 | | 2,105 | | | 2,516 | | | | | | |
| Production contracted or hedged (%) | 75 | % | 50 | % | 158 | % | | 131 | % | 75 | % | 54 | % | 142 | % | | 124 | % | | | | | |
| Hedged volumes as a percentage of gross installed capacity (%) | 24 | % | 1 | % | 26 | % | | 22 | % | 22 | % | 1 | % | 26 | % | | 22 | % | | | | | |
| | | | | | | | | | | | | | | |
Adjusted Revenues(2)(3) ($) | 88 | | 12 | | 188 | | | 288 | | 86 | | 15 | | 198 | | | 299 | | | | | | |
| Fuel ($) | (2) | | (2) | | (74) | | | (78) | | (2) | | (2) | | (70) | | | (74) | | | | | | |
| Purchased power ($) | (2) | | (1) | | (11) | | | (14) | | (1) | | (1) | | (14) | | | (16) | | | | | | |
Carbon compliance recovery (costs)(3)($) | — | | — | | 8 | | | 8 | | — | | — | | (28) | | | (28) | | | | | | |
Adjusted Gross Margin ($) | 84 | | 9 | | 111 | | | 204 | | 83 | | 12 | | 86 | | | 181 | | | | | | |
| | | | | | | | | | | | | | | |
(1)Total production includes contract and merchant production and excludes ancillary services volumes.
(2)Revenues have been adjusted to exclude the impact of unrealized mark-to-market gains or losses. The Energy Transition segment is a non-reportable segment as at Sept. 30, 2026 and is no longer included in the table above. Refer to Note 17 of the condensed consolidated financial statements for the nine months ended Sept. 30, 2026.
(3)The intercompany sales of emission credits from the Hydro and Wind and Solar segments to the Gas segment are eliminated on consolidation in the Corporate segment. Refer to the "Non-IFRS and Supplementary Financial Measures" section of this MD&A.
Three months ended Sept. 30, 2026
Total production for the Alberta portfolio for the three months ended Sept. 30, 2026, was 3,022 GWh, compared to 3,206 GWh for the same period in 2025, a decrease of 184 GWh, or six per cent, primarily due to:
•Lower merchant production in the Gas segment due to higher dispatch optimization driven by lower market prices; partially offset by
•Higher production in the Wind and Solar segment due to higher wind resource; and
•Higher production in the Hydro segment due to higher water resource and availability.
Ancillary services volumes for the three months ended Sept. 30, 2026 were comparable to the same period of 2025.
| | | | | | | | | | | | | | | | | | | | | | | | | | | | | | | | | | |
| 2026 | 2025 | | | | | | |
| 9 months ended Sept. 30 | Hydro | Wind & Solar | Gas | | Total | Hydro | Wind & Solar | Gas | | Total | | | | | | |
| Gross installed capacity (MW) | 834 | | 764 | | 3,650 | | | 5,248 | | 834 | | 764 | | 3,650 | | | 5,248 | | | | | | | |
Total production(1) (GWh) | 1,445 | | 1,428 | | 5,727 | | | 8,600 | | 1,302 | | 1,242 | | 6,324 | | | 8,868 | | | | | | | |
| Contract production (GWh) | — | | 660 | | 3,777 | | | 4,437 | | — | | 595 | | 3,863 | | | 4,458 | | | | | | | |
| Merchant production (GWh) | 1,445 | | 768 | | 1,950 | | | 4,163 | | 1,302 | | 647 | | 2,461 | | | 4,410 | | | | | | | |
| Ancillary services volumes (GWh) | 2,311 | | 37 | | 485 | | | 2,833 | | 2,173 | | 50 | | 653 | | | 2,876 | | | | | | | |
| | | | | | | | | | | | | | | | |
| Hedged volumes (GWh) | 1,106 | | 48 | | 6,151 | | | 7,305 | | 996 | | 84 | | 5,684 | | | 6,764 | | | | | | | |
| Production contracted or hedged (%) | 77 | % | 50 | % | 173 | % | | 137 | % | 76 | % | 55 | % | 151 | % | | 127 | % | | | | | | |
Hedged volumes as a percentage
of gross installed capacity (%) | 20 | % | 1 | % | 26 | % | | 21 | % | 18 | % | 2 | % | 24 | % | | 20 | % | | | | | | |
| | | | | | | | | | | | | | | | |
Adjusted Revenues(2)(3) ($) | 234 | | 73 | | 581 | | | 888 | | 285 | | 79 | | 594 | | | 958 | | | | | | | |
| Fuel ($) | (3) | | (6) | | (223) | | | (232) | | (5) | | (9) | | (231) | | | (245) | | | | | | | |
| Purchased power ($) | (7) | | (2) | | (26) | | | (35) | | (8) | | (2) | | (39) | | | (49) | | | | | | | |
Carbon compliance costs(3) ($) | — | | — | | (11) | | | (11) | | — | | (2) | | (51) | | | (53) | | | | | | | |
Adjusted Gross Margin(2) ($) | 224 | | 65 | | 321 | | | 610 | | 272 | | 66 | | 273 | | | 611 | | | | | | | |
(1)Total production includes contract and merchant production and excludes ancillary services volumes.
(2)Revenues have been adjusted to exclude the impact of unrealized mark-to-market gains or losses. The Energy Transition segment is a non-reportable segment as at Sept. 30, 2026 and is no longer included in the table above. Refer to Note 17 of the condensed consolidated financial statements for the nine months ended Sept. 30, 2026.
(3)The intercompany sales of emission credits from the Hydro and Wind and Solar segments to the Gas segment are eliminated on consolidation in the Corporate segment. Refer to the "Non-IFRS and Supplementary Financial Measures" section of this MD&A.
Nine months ended Sept. 30, 2026
Total production for the Alberta portfolio for the nine months ended Sept. 30, 2026 was 8,600 GWh, compared to 8,868 GWh in 2025, a decrease of 268 GWh, or three per cent, primarily due to:
•Lower merchant production in the Gas segment due to higher dispatch optimization driven by lower market prices; partially offset by
•Higher production volumes in the Wind and Solar segment due to higher wind resource; and
•Higher production in the Hydro segment due to higher water resource and availability.
Ancillary services volumes for the nine months ended Sept. 30, 2026 were comparable to the same period in 2025.
The following table provides selected information for the Company's Alberta electricity portfolio:
| | | | | | | | | | | | | | | |
| | | |
| 3 months ended Sept. 30 | 9 months ended Sept. 30 | |
| 2026 | 2025 | 2026 | 2025 | |
| Alberta Market | | | | | |
| Spot power price average per MWh | 36 | | 51 | | 32 | | 44 | | |
| Natural gas price (AECO) per GJ | 1.50 | | 0.63 | | 1.66 | | 1.43 | | |
| Statutory carbon compliance price per tonne | 95 | | 95 | | 95 | | 95 | | |
| Alberta Portfolio Results | | | | | |
Realized merchant power price per MWh(1) | 95 | | 103 | | 104 | | 107 | | |
Ancillary services price per MWh(2) | 40 | | 45 | | 34 | | 37 | | |
| Hydro energy spot power price per MWh | 43 | | 76 | | 41 | | 76 | | |
| Hydro ancillary services price per MWh | 41 | | 47 | | 34 | | 39 | | |
| Wind energy spot power price per MWh | 19 | | 28 | | 18 | | 23 | | |
| Gas spot power price per MWh | 55 | | 79 | | 56 | | 66 | | |
Hedged power price average per MWh(3) | 64 | | 66 | | 64 | | 69 | | |
| Hedged volume (GWh) | 2,507 | | 2,516 | | 7,305 | | 6,764 | | |
Fuel cost per MWh(4) | 37 | | 30 | | 41 | | 39 | | |
Carbon compliance (recovery) cost per MWh(5) | (4) | | 11 | | 2 | | 8 | | |
| | | | | |
(1)Realized merchant power price per MWh for the Alberta electricity portfolio is a supplementary financial measure and represents the average price realized as a result of the Company's merchant power sales and portfolio optimization activities. It is calculated as merchant revenues (excluding assets under long-term contract and ancillary revenues, but including the impact of realized gains and losses from derivatives and trading activities) for the reporting period divided by total merchant GWh produced during the reporting period.
(2)Ancillary services price per MWh for the Alberta electricity portfolio is a supplementary financial measure and represents the average ancillary services price across Hydro, Gas and Wind and Solar segments.
(3)Hedged power price average per MWh is a supplementary financial measure and is calculated as the average sales price for all hedges and direct customer sales during the reporting period.
(4)Fuel cost per MWh is a supplementary financial measure and is calculated as total fuel costs for the facilities in Alberta divided by production from carbon-emitting generation in the Gas segment.
(5)Carbon compliance per MWh is a supplementary financial measure and is calculated as total carbon compliance costs for the Gas segment in Alberta divided by production from carbon-emitting generation in the Gas segment.
The average spot power price per MWh in Alberta for the three and nine months ended Sept. 30, 2026, decreased by $15 and $12 per MWh, respectively, compared to the same periods in 2025, primarily due to the impact of milder weather during the current period.
The realized merchant power price per MWh of production for Alberta for the three and nine months ended Sept. 30, 2026, was impacted by:
•Lower average spot and hedge power prices during the current period; and
•Favourable hedge positions settling in the period and production optimization, which generated positive contributions over settled spot prices in Alberta.
Fuel cost per MWh for the three months ended Sept. 30, 2026 increased by $7 per MWh primarily due to higher natural gas prices.
Fuel cost per MWh for the nine months ended Sept. 30, 2026, was comparable to the same period in 2025.
Carbon compliance recovery per MWh for the three months ended Sept. 30, 2026 increased by $15 per MWh and carbon compliance costs for the nine months ended Sept. 30, 2026 decreased by $6 per MWh compared to the same periods in 2025, primarily due to the planned utilization of emission credits, which reduced the 2026 carbon compliance obligation in the current period.
Financial Condition
Balance Sheet Analysis
The following table highlights significant changes in the Consolidated Statements of Financial Position from Dec. 31, 2025 to Sept. 30, 2026:
| | | | | | | | | | | | |
| As at | Sept. 30, 2026 | Dec. 31, 2025 | Increase/(decrease) | |
| Total current assets | 1,440 | | 1,336 | | 104 | | |
| Total non-current assets | 7,326 | | 7,325 | | 1 | | |
| Total assets | 8,766 | | 8,661 | | 105 | | |
| | | | |
| Total current liabilities | 1,659 | | 1,830 | | (171) | | |
| Total non-current liabilities | 5,170 | | 5,366 | | (196) | | |
| Total liabilities | 6,829 | | 7,196 | | (367) | | |
| | | | |
| | | | |
Non-Current Assets
Non-current assets as at Sept. 30, 2026, were $7,326 million, an increase of $1 million from $7,325 million as at Dec. 31, 2025, primarily due to higher long-term prepaids, included in other assets, related to a turbine reservation payment, partially offset by lower property, plant and equipment (PP&E) and intangible assets primarily due to depreciation and amortization of $325 million for the nine months ended Sept. 30, 2026. This was partially offset by an increase in PP&E due to the acquisition of Far North totaling $102 million, capital additions of $125 million and higher foreign exchange gains on translation of foreign-currency denominated balances to the presentation currency.
Non-Current Liabilities
Non-current liabilities as at Sept. 30, 2026, were $5,170 million, a decrease of $196 million from $5,366 million as at Dec. 31, 2025, mainly due to a decrease in credit facilities, long-term debt and lease liabilities driven by no cash
drawings outstanding under the syndicated credit facility, partially offset by an increase in the carrying value of USD denominated debt due to an increase in foreign exchange rates. Non-current liabilities were further impacted by a decrease in risk management liabilities due to lower market prices across multiple markets on existing and new contracts and volume changes, partially offset by contract settlements and changes in foreign exchange rates.
Contractual Obligations
For changes to the Company’s contractual obligations during the nine months ended Sept. 30, 2026 refer to Note 15 of the condensed consolidated financial statements for the nine months ended Sept. 30, 2026. The Company’s significant contractual commitments are described in Note 36 Commitments and Contingencies of the consolidated financial statements for the year ended Dec. 31, 2025 and "Financial Condition" section of the Annual MD&A for the year ended Dec. 31, 2025.
Financial Capital
The Company is focused on maintaining a strong balance sheet and financial position to ensure access to sufficient financial capital. The Company expects cash flow from operating activities to be sufficient to meet its obligations, support sustaining capital expenditures and fund dividends over both the short- and long-term. Given its financing track record in recent years, the Company has robust access to capital markets for future funding needs. The Company maintains a strong financial position, with $1.9 billion in liquidity as at Sept. 30, 2026. Credit facilities are the primary source of short-term liquidity after internally generated cash flow.
The deficit of current assets relative to current liabilities, including the current portion of long-term debt and lease liabilities, was $219 million as at Sept. 30, 2026 (Dec. 31, 2025 – $494 million). The working capital deficit is primarily
caused by the classification of exchangeable securities totaling $750 million as current liabilities as a result of Brookfield's conversion option that can be exercised at any time after Dec. 31, 2024, although there is no obligation to deliver cash equivalent resources and Brookfield cannot call for repayment. Refer to Note 26 of the 2025 consolidated financial statements for details.
The Company manages working capital deficits primarily through cash generated from operating activities and the availability of credit facilities. Management regularly monitors liquidity and funding requirements, and evaluates the Company's capital structure in light of prevailing market conditions. Current leverage levels are considered manageable, they reflect management’s ongoing assessment of the risk profile and cash flow characteristics associated with the Company’s assets.
On July 24, 2026, S&P Global Ratings affirmed the Company’s senior unsecured debt rating and issuer credit rating of BB+ and revised its outlook from stable to negative. On June 18, 2026, Moody's Ratings affirmed the Company's Ba1 rating with a stable outlook. The Company’s Morningstar DBRS ratings remain unchanged as
disclosed in the 2025 Annual Report. For information on Company's credit ratings, refer to "Financial Condition" section of the 2025 Annual Report. Risks associated with our credit ratings are discussed in the "Risk Management" section of the 2025 Annual Report.
Capital Structure
Our capital structure consists of the following components as shown below:
| | | | | | | | | | | | | | | | | | | |
| As at | Sept. 30, 2026 | | Dec. 31, 2025 | |
| $ | % of total | | $ | % of total | | |
| | | | | | | |
| Senior unsecured debt | 1,673 | | 29 | | | 1,639 | | 29 | | | |
| | | | | | | |
| | | | | | | |
| Credit facilities | — | | — | | | 95 | | 2 | | | |
| Non-recourse debt | 1,446 | | 25 | | | 1,471 | | 26 | | | |
| | | | | | | |
| | | | | | | |
| | | | | | | |
| | | | | | | |
| | | | | | | |
| | | | | | | |
| | | | | | | |
| | | | | | | |
| Recourse debt - OCP LP Bond | 139 | | 2 | | | 166 | | 3 | | | |
| | | | | | | |
| Tax equity financing | 64 | | 1 | | | 76 | | 1 | | | |
| Lease liabilities | 148 | | 3 | | | 146 | | 3 | | | |
Credit facilities, long-term debt and lease liabilities(1) | 3,470 | | 60 | | | 3,593 | | 64 | | | |
| Add: Exchangeable debentures | 350 | | 6 | | | 350 | | 6 | | | |
| | | | | | | |
| Less: Cash and cash equivalents | (345) | | (6) | | | (205) | | (3) | | | |
Less: TransAlta OCP LP restricted cash(2) | (17) | | — | | | (17) | | — | | | |
| Less: Fair value of foreign exchange forward contracts on foreign-currency denominated debt | (8) | | — | | | 4 | | — | | | |
Total Consolidated Net Debt(3)(4)(5) | 3,450 | | 60 | | | 3,725 | | 67 | | | |
Exchangeable preferred securities(5) | 400 | | 7 | | | 400 | | 7 | | | |
| Total equity | 1,937 | | 33 | | | 1,465 | | 26 | | | |
| | | | | | | |
| | | | | | | |
| | | | | | | |
| | | | | | | |
| | | | | | | |
| Total capital | 5,787 | | 100 | | | 5,590 | | 100 | | | |
| | | | | | | |
(1)Credit facilities, long-term debt and lease liabilities consist of current and non-current portions in the Condensed Consolidated Statements of Financial Position.
(2)Principal portion of the TransAlta OCP LP restricted cash related to the TransAlta OCP LP bonds, as this cash is restricted specifically to repay the bonds.
(3)Total Consolidated Net Debt is a non-IFRS measure, which is not defined and has no standardized meaning under IFRS and may not be comparable to similar measures presented by other issuers. The most directly comparable IFRS measure is total credit facilities, long-term debt and lease liabilities. Refer to the "Non-IFRS and Supplementary Financial Measures" section of this MD&A for further discussion.
(4)Tax equity financing for the Skookumchuck wind facility, an equity-accounted joint venture, is not represented in these amounts.
(5)Total Consolidated Net Debt excludes the exchangeable preferred shares as they are considered equity with dividend payments for credit purposes.
Credit Facilities
The Company's credit facilities are summarized in Note 11 of the condensed consolidated financial statements.
As at Sept. 30, 2026, the Company had total committed capacity of $2.2 billion, against which $489 million of letters of credit were issued and nil was drawn in cash. Under the $400 million non-committed capacity, the Company issued $211 million of fully backstopped letters of credit, which reduced the available capacity on the committed credit facilities.
In addition to the net $1.5 billion of remaining committed capacity, the Company held $345 million in cash and cash equivalents, resulting in total available liquidity of approximately $1.9 billion as at Sept. 30, 2026.
TransAlta's debt has terms and conditions, including financial covenants, that are considered ordinary and customary. As at Sept. 30, 2026, the Company was in compliance with all of its debt covenants and all undrawn amounts under the credit facilities are fully available.
On July 17, 2026, the Company executed agreements to extend its committed credit facilities totalling $2.1 billion with a syndicate of lenders. The revised agreements extend the maturity dates of the syndicated credit facility from June 30, 2029 to June 30, 2030 and the bilateral credit facilities from June 30, 2027 to June 30, 2028.
As at Sept. 30, 2026, the Company provided $74 million in surety-backed letters of credits as security for commodity trading activities.
Non-Recourse Debt and Other
All non-recourse debt and the OCP LP Bond are subject to customary financing covenants that may restrict the Company’s ability to access funds generated by the facilities’ operations. Funds may be distributed to parent entities upon satisfaction of quarterly distribution tests, including applicable debt service coverage ratio thresholds. These requirements were met in the third quarter of 2026 for all entities, with the exception of Melancthon Wolfe Wind LP. The funds in this entity that have accumulated will remain there until the debt-service coverage ratio distribution threshold is met.
Certain non-recourse bonds require that reserve accounts be established and funded through cash held on deposit and/or by providing letters of credit. Additionally, cash held by certain subsidiaries is not accessible by other corporate entities as the funds are designated solely for project-level major maintenance costs. As at Sept. 30, 2026, $100 million (Dec. 31, 2025 – $101 million) of cash was subject to such restrictions.
Adjusted Net Debt to Adjusted EBITDA
The methodologies and ratios used by rating agencies to assess our credit rating are not publicly disclosed. We have developed our own definitions of ratios and targets to help evaluate the strength of our financial position.
These metrics and ratios are not defined and have no standardized meaning under IFRS and may not be comparable to those used by other entities or by rating agencies.
| | | | | | | | | | | | |
| (in millions of Canadian dollars except where noted) | | | | |
| As at | Sept. 30, 2026 | | Dec. 31, 2025 | |
Credit facilities, long-term debt and lease liabilities(1) | 3,470 | | | 3,593 | | |
| Exchangeable debentures | 350 | | | 350 | | |
| Less: Cash and cash equivalents | (345) | | | (205) | | |
| | | | |
Add: 50 per cent of issued preferred shares and exchangeable preferred shares(2) | 671 | | | 671 | | |
Other(3) | (25) | | | (13) | | |
Adjusted Net Debt(4) | 4,121 | | | 4,396 | | |
Adjusted EBITDA(5) | 1,006 | | | 1,104 | | |
| Adjusted Net Debt to Adjusted EBITDA (times) | 4.1 | | | 4.0 | | |
| | | | |
| | | | |
(1)Consists of current and non-current portions of long-term debt, which includes lease liabilities and tax equity financing.
(2)Exchangeable preferred shares are considered equity with dividend payments for credit-rating purposes. For accounting purposes, they are accounted for as debt with interest expense in the condensed consolidated financial statements. For purposes of this ratio, we consider 50 per cent of issued preferred shares, including exchangeable preferred shares, as debt.
(3)Includes principal portion of TransAlta OCP restricted cash of $17 million as at Sept. 30, 2026 (Dec. 31, 2025 - $17 million) and fair value of hedging instruments on debt (included in risk management assets and/or liabilities on the Condensed Consolidated Statements of Financial Position).
(4)The tax equity financing for the Skookumchuck wind facility, an equity-accounted joint venture, is not represented in this amount. Adjusted Net Debt is a non-IFRS measure, is not defined and has no standardized meaning under IFRS and may not be comparable to similar measures presented by other issuers. Presenting this item from period to period provides management and investors with the ability to evaluate earnings trends more readily in comparison with prior periods’ results. Refer to the "Non-IFRS and Supplementary Financial Measures" section of this MD&A.
(5)Last four quarters.
We use the Adjusted Net Debt to Adjusted EBITDA ratio as a measurement of financial leverage and an assessment of our ability to service debt. Our long-term target for Adjusted Net Debt to Adjusted EBITDA ratio is 3.0 to 4.0 times.
Our Adjusted Net Debt to Adjusted EBITDA ratio as at Sept. 30, 2026 was higher compared to Dec. 31, 2025 due to lower trailing twelve months Adjusted EBITDA, partially offset by lower net debt as at Sept. 30, 2026, compared to Dec. 31, 2025.
Returns to Providers of Capital
Interest Income and Interest Expense
The components of interest expense are disclosed in Note 7 of the condensed consolidated financial statements. Net Interest Expense in the reconciliation of our Adjusted EBITDA to our FFO and FCF is calculated as follows:
| | | | | | | | | | | | | | |
| 3 months ended Sept. 30 | 9 months ended Sept. 30 |
| 2026 | 2025 | 2026 | 2025 |
| Interest expense | 75 | | 85 | | 241 | | 266 | |
| Less: Interest Income | (7) | | (7) | | (21) | | (18) | |
Less: non-cash items(1) | (11) | | (12) | | (42) | | (44) | |
| | | | |
| | | | |
| | | | |
| | | | |
| | | | |
| | | | |
Net Interest Expense(2) | 57 | | 66 | | 178 | | 204 | |
(1)Non-cash items consists of accretion of provisions, financing cost amortization, interest paid in kind and other non-cash items.
(2)Net Interest Expense is a non-IFRS measure, is not defined and has no standardized meaning under IFRS and may not be comparable to similar measures presented by other issuers.
Interest expense for the three and nine months ended Sept. 30, 2026 was lower compared to the same periods in 2025, primarily due to lower interest on certain senior notes, following their refinancing at lower interest rates during 2025 and lower average outstanding debt.
Interest expense for the nine months ended Sept. 30, 2026 was further impacted by lower credit facility fees, bank charges and other interest.
Interest income for the three and nine months ended Sept. 30, 2026 was comparable to the same periods in 2025.
Series B Preferred Shares conversion
On March 31, 2026, holders of Series B preferred shares converted 1,148,549 of the 2,370,087 outstanding Series B shares into Series A shares on a one‑for‑one basis. As a result of the conversion, on Sept. 30, 2026, the Company had 10,778,462 Series A Shares and 1,221,538 Series B Shares issued and outstanding.
Other Series Preferred Shares
Other Series preferred shares outstanding for the nine months ended Sept. 30, 2026 remained unchanged.
Share Capital
On June 9, 2026, TransAlta completed a public offering of 18,230,000 common shares at a price of $19.20 per share for total gross proceeds of approximately $350 million. Refer to the "Significant and Subsequent Events" section of this MD&A for details.
For details on common and preferred shares issued and outstanding refer to Notes 12 and 13 of the condensed consolidated financial statements.
As at Nov. 2, 2026, the outstanding number of common shares was 316.3 million. The outstanding number of preferred shares was as follows: Series A 10.8 million, Series B 1.2 million, Series C 10.0 million, Series D 1.0 million, Series E 9.0 million and Series G 6.6 million.
Cash Flows
The following table highlights significant changes in the Condensed Consolidated Statements of Cash Flows for the nine months ended Sept. 30, 2026 and Sept. 30, 2025:
| | | | | | | | | | | |
| | |
| 9 months ended Sept. 30 | 2026 | 2025 | Change |
| Cash and cash equivalents, beginning of period | 205 | | 337 | | (132) | |
| Provided by (used in): | | | |
| Operating activities | 317 | | 415 | | (98) | |
| Investing activities | (184) | | (302) | | 118 | |
| Financing activities | 1 | | (241) | | 242 | |
| Effect of translation on foreign currency cash | 6 | | 2 | | 4 | |
| | | |
| Cash and cash equivalents, end of period | 345 | | 211 | | 134 | |
Cash Flow from Operating Activities
Cash from operating activities decreased in the nine months ended Sept. 30, 2026. Cash flow from operations before changes in working capital was lower primarily due to the same factors impacting Adjusted EBITDA. This was further impacted by favourable working capital movements primarily driven by lower collateral provided compared to the same period of prior year.
Cash Flow used in Investing Activities
Cash used in investing activities for the nine months ended Sept. 30, 2026, decreased compared to the same period in 2025, primarily due to Nova facilities issued during the same period of 2025 and lower PP&E additions in the current period due to lower major maintenance for our Canadian gas facilities. This was partially offset by the cash paid to acquire the Far North facilities in the current period.
Cash Flow from Financing Activities
Cash from financing activities for the nine months ended Sept. 30, 2026, increased compared to cash used in the same period in 2025, primarily due to a public offering of common shares in the current period (refer to the "Significant and Subsequent events" section of this MD&A), partially offset by higher repayment of cash drawings under the syndicated credit facility. During the same period in 2025, cash used in financing activities was higher primarily due to a repayment $400 million variable rate term loan facility and repayments under the syndicated credit facility, which was offset by the issuance of $450 million senior notes.
Capital Expenditures
Sustaining capital, growth and development capital expenditures represent supplementary financial measures used to present our spending related to the safe and reliable operation of our existing facilities and the
construction of projects, respectively. Refer to the "Capital Expenditures" section of the 2025 Annual Report for more details.
Sustaining Capital Expenditures
The Company's sustaining capital expenditures by segment are summarized in the table below:
| | | | | | | | | | | | | | | |
| 3 months ended Sept. 30 | 9 months ended Sept. 30 | |
| 2026 | 2025 | 2026 | 2025 | |
| Hydro | 5 | | 22 | | 14 | | 32 | | |
| Wind and Solar | 6 | | 7 | | 14 | | 18 | | |
| Gas | 24 | | 5 | | 61 | | 56 | | |
| | | | | |
| Corporate | 4 | | 3 | | 10 | | 11 | | |
| | | | | |
| Sustaining capital expenditures | 39 | | 37 | | 99 | | 117 | | |
Total sustaining capital expenditures for the three months ended Sept. 30, 2026 increased by $2 million, compared to the same period in 2025, primarily due to:
•Higher major maintenance at our Canadian gas facilities; partially offset by
•Lower major maintenance at our Hydro facilities in Alberta.
Total sustaining capital expenditures for the nine months ended Sept. 30, 2026 decreased by $18 million, compared to the same period in 2025, primarily due to lower major maintenance at our Hydro facilities in Alberta due to timing of spend.
Growth and Development Capital Expenditures
On December 9, 2025, the Company entered into a tolling agreement with Puget Sound Energy to convert the 700 MW Centralia Unit 2 facility from coal to natural gas. The agreement provides contracted capacity payments through 2044.
The project is expected to require approximately US$600 million of capital. A final investment decision is expected in early 2027, with operations anticipated to begin in late 2028.
The following table provides our growth and development spending by segment:
| | | | | | | | | | | | | | | |
| 3 months ended Sept. 30 | 9 months ended Sept. 30 | |
| 2026 | 2025 | 2026 | 2025 | |
| Hydro | 1 | | 1 | | 3 | | 2 | | |
| | | | | |
| Gas | 7 | | 17 | | 12 | | 43 | | |
| Energy Transition | 11 | | 2 | | 20 | | 4 | | |
| | | | | |
| Growth and development expenditures | 19 | | 20 | | 35 | | 49 | | |
Growth and development expenditures for the three and nine months ended Sept. 30, 2026 were lower compared to the same periods in 2025 primarily due to:
•Lower spend in the Gas segment due to completion of the Mount Keith West network upgrade transmission project; partially offset by
•Higher spending in the Energy Transition segment related to the Centralia conversion from coal to natural gas, which extends the operating life of the existing facility.
Additionally, spend in the Gas segment was higher in the nine months ended Sept. 30, 2025 due to capital expenditures at Sarnia, which improved facility performance.
Refer to the "Strategic Priorities" section of the 2025 Annual Report for more details.
Projects under Construction
The Mount Keith West network upgrade transmission project was completed during the nine months ended Sept. 30, 2026.
Accordingly, the Company derecognized $39 million from the assets under construction and recognized a finance lease receivable.
Other Consolidated Analysis
Related-Party Transactions
There were no material related party transactions during the nine months ended Sept. 30, 2026. Refer to Note 35 of the 2025 audited annual consolidated financial statements for further details.
Commitments
During the nine months ended Sept. 30, 2026, the Company entered into a $45 million maintenance agreement for one of its facilities, running until 2036, and signed a turbine reservation contract with a remaining expected payment of $28 million due in Oct. 2026. The Company has not incurred any other material contractual commitments in the nine months ended Sept. 30, 2026, either directly or through its interests in joint operations and joint ventures. For the current material outstanding commitments, please refer to Note 15 Commitments and Contingencies in the condensed consolidated financial statements and Note 36 of the 2025 audited annual consolidated financial statements.
Contingencies
For the current material outstanding contingencies, please refer to Note 36 of the 2025 audited annual consolidated financial statements. There were no material changes to the contingencies during the nine months ended Sept. 30, 2026.
Off-balance sheet arrangements
As at Sept. 30, 2026, the Company provided $74 million in surety-backed letters of credits as security for commodity trading activities. The Company has not entered into any other material off-balance sheet arrangements during the nine months ended Sept. 30, 2026. Refer to the "Financial Condition" section of the 2025 Annual MD&A.
Selected Quarterly Information
Our results are seasonal due to the nature of the electricity market and related fuel costs. Higher maintenance costs are often incurred in the spring and fall when electricity prices are expected to be lower, and electricity prices generally increase in the peak winter and summer months in our main markets due to increased heating and cooling loads. Margins are also typically impacted in the second quarter due to the volume of hydro production resulting
from spring runoff and rainfall in the Pacific Northwest. Typically, hydroelectric facilities generate most of their electricity and revenues during the spring months when melting snow starts feeding watersheds and rivers. Inversely, wind speeds are historically greater during the cold winter months and lower in the warm summer months.
| | | | | | | | | | | | | | |
| Q4 2025 | Q1 2026 | Q2 2026 | Q3 2026 |
| Revenues | 599 | | 565 | | 487 | | 536 | |
| Gross margin | 301 | | 361 | | 433 | | 411 | |
| OM&A | 186 | | 181 | | 175 | | 174 | |
| Depreciation and amortization | 148 | | 105 | | 105 | | 104 | |
| | | | |
| (Loss) earnings before income taxes | (42) | | 23 | | 80 | | 100 | |
| | | | |
| | | | |
| Net (loss) earnings attributable to common shareholders | (62) | | 13 | | 35 | | 63 | |
Net (loss) earnings per share attributable to common shareholders, basic and diluted(1) | (0.21) | | 0.04 | | 0.12 | | 0.20 | |
| | | | |
| | | | |
| | | | |
| | | | | | | | | | | | | | |
| Q4 2024 | Q1 2025 | Q2 2025 | Q3 2025 |
| Revenues | 678 | | 758 | | 433 | | 615 | |
| Gross margin | 390 | | 432 | | 334 | | 353 | |
| OM&A | 234 | | 173 | | 173 | | 179 | |
| Depreciation and amortization | 143 | | 146 | | 150 | | 135 | |
| (Loss) earnings before income taxes | (51) | | 49 | | (95) | | (53) | |
| Net (loss) earnings attributable to common shareholders | (65) | | 46 | | (112) | | (62) | |
Net (loss) earnings per share attributable to common shareholders, basic and diluted(1) | (0.22) | | 0.15 | | (0.38) | | (0.20) | |
| | | | |
| | | | — | |
| | | | |
(1)Basic and diluted (loss) earnings per share attributable to common shareholders is calculated in each period using the basic and diluted weighted average common shares outstanding during the period, respectively. As a result, the sum of the (loss) earnings per share for the four quarters making up the calendar year may sometimes differ from the annual earnings (loss) per share.
Operating results have been impacted by the following events:
•The acquisition of Far North on Feb. 2, 2026;
•The acquisition of Heartland on Dec. 4, 2024; and
•No production at Centralia starting Jan. 1, 2026 due to the cessation of coal-fired operations in the normal course.
Refer to the "Description of the Business" section of this MD&A.
In addition to the items described above, revenues have been impacted by:
•Alberta spot and hedged power prices, which were trending downwards;
•Mid-Columbia power prices until the fourth quarter of 2025, which were trending downwards;
•Ontario spot power prices, which were trending upwards during 2025 and the first quarter of 2026;
•The effects of unrealized mark-to-market gains and losses from hedging and derivative positions due to changes in forward market prices as well as changes in forecasted volumes; and
•The effects of realized mark-to-market gains and losses on settled trades.
Effective Jan. 1, 2026, certain VPPA contracts were designated as cash flow hedges. As a result, the effective portion of unrealized gains and losses due to changes in fair value is recognized in other comprehensive income, while the ineffective portion is recognized in revenue.
Gross Margin has been impacted by:
•Factors impacting revenues as described above;
•Natural gas prices;
•Purchased power costs;
•Carbon compliance costs which fluctuate based on the timing of transfers of emission credits between segments and changes in statutory carbon compliance costs.
OM&A has been impacted by:
•Lower spending in certain quarters due to cost saving initiatives;
•Higher spending on strategic and growth initiatives;
•Termination, restructuring and facility shutdown costs;
•Legal costs arising from cost determinations made after the conclusion of arbitration proceedings in the first quarter of 2026;
•Costs associated with Centralia to comply with the Order during 2026;
•Brazeau penalties assessed by the Alberta Market Surveillance Administrator in the fourth quarter of 2024
for self-reported contraventions pertaining to ancillary services provided during 2021 and 2022;
•Heartland acquisition-related transaction and restructuring costs in the fourth quarter of 2024; and
•Our ERP system upgrade during the fourth quarter of 2024, all four quarters of 2025 and the first quarter of 2026.
Depreciation has been impacted by:
•Lower depreciation in the Gas segment in 2026 due to a change in the useful life assumptions for the Sheerness facilities; and
•Lower depreciation for Centralia Unit 2 facility due to the cessation of coal-fired operations in the normal course in the end of 2025.
Earnings (loss) before income taxes and Net (loss) earnings attributable to common shareholders have been impacted by the factors explained above.
Financial Instruments
For details on Financial instruments refer to Note 14 of the notes to the audited annual 2025 consolidated financial statements and Note 8 of our unaudited interim condensed consolidated financial statements as at and for the nine months ended Sept. 30, 2026.
We may enter into commodity transactions involving non-standard features for which market-observable data is not available. These transactions are defined under IFRS as Level III instruments. Level III instruments incorporate inputs that are not observable from the market and fair value is therefore determined using valuation techniques. Fair values are validated by using reasonably possible alternative assumptions as inputs to valuation techniques
and any material differences are disclosed in the notes to the unaudited interim condensed consolidated financial statements.
At Sept. 30, 2026, Level III instruments had a net liabilities carrying value of $297 million (Dec. 31, 2025 – net liabilities $312 million). The Level III liabilities decreased during the nine months ended Sept. 30, 2026 due to lower volatility in market prices across multiple markets on existing and new contracts and volume changes, partially offset by contract settlements and changes in foreign exchange rates. Our risk management profile and practices have not changed materially from Dec. 31, 2025.
Non-IFRS and Supplementary Financial Measures
We use a number of financial measures to evaluate our performance and the performance of our business segments, including measures and ratios that are presented on a non-IFRS basis, as described below. Unless otherwise indicated, all amounts are in Canadian dollars and have been derived from our condensed consolidated financial statements prepared in accordance with IFRS. We believe that these non-IFRS amounts, measures and ratios, read together with our IFRS amounts, provide readers with a better understanding of how management assesses results.
Non-IFRS amounts, measures and ratios do not have standardized meanings under IFRS. They are unlikely to be
comparable to similar measures presented by other companies and should not be viewed in isolation from, as an alternative to, or more meaningful than our IFRS results.
We calculate adjusted measures by adjusting certain IFRS measures for certain items that we do not believe reflect our ongoing operations in the period. Except as otherwise described, these adjusted measures are calculated on a consistent basis from period to period.
Non-IFRS Financial Measures
This section provides additional information on these non-IFRS measures, including their reconciliation to the most comparable IFRS measure.
Adjusted EBITDA
Each business segment assumes responsibility for its operating results measured by Adjusted EBITDA. Adjusted EBITDA is an important metric for management that represents our core operational results.
Interest, taxes, depreciation and amortization are not included, as differences in accounting treatment may distort our core business results. In addition, certain reclassifications and adjustments are made to better assess results, excluding those items that may not be reflective of ongoing business performance. This presentation may facilitate the readers' analysis of trends. The most directly comparable IFRS measure is earnings before income taxes.
The following are descriptions of the adjustments made to arrive at the non-IFRS measures:
Adjusted Revenue
Adjusted Revenues are revenues (the most directly comparable IFRS measure) adjusted to exclude:
•The impact of unrealized mark-to-market gains or losses and unrealized foreign exchange gains or losses on commodity transactions.
•Certain assets that we own in Canada and Western Australia are fully contracted and recorded as finance leases under IFRS. We believe that it is more appropriate to reflect the payments we receive under the contracts as a capacity payment in our revenues instead of as finance lease income and a decrease in finance lease receivables.
•Revenues from the Required Divestitures as they do not reflect ongoing business performance.
Adjusted Fuel and Purchased Power
Adjusted Fuel and Purchased Power is fuel and purchased power (the most directly comparable IFRS measure) adjusted to exclude fuel and purchased power from the Required Divestitures as it does not reflect ongoing business performance.
Adjusted OM&A
Adjusted OM&A is OM&A (the most directly comparable IFRS measure) adjusted to exclude:
•Termination and restructuring costs mainly for costs incurred as part of strategic decisions, and that do not represent ongoing business performance and are not reflective of the Company's ability to generate cash flows in the future. Termination and restructuring costs mainly include termination, severance, and related costs.
•Legal costs arising from cost determinations made after the conclusion of arbitration proceedings that are not reflective of ongoing business performance.
•Expenses related to an ongoing compliance with the federal directive from the U.S. Department of Energy (the Order) requiring Centralia to remain available beyond its planned coal-operating period and Centralia community fund (Fund) expenses. The Fund was established under the Company’s obligations in the Energy Transition Bill related to the retirement of coal operations at Centralia, with a total commitment of US$55 million over the 2015–2026 period. With the coal facility reaching end of life on Dec. 31, 2025, and all commercial operations now ceased in the normal course, expenditures associated with the Order and the Fund in 2026 no longer relate to a revenue-generating facility and are not reflective of ongoing business performance.
•ERP integration costs representing planning, design and implementation costs of upgrades to the existing ERP system as they represent project costs that do not occur on a regular basis, and therefore do not reflect ongoing business performance.
•Acquisition-related transaction and restructuring costs, mainly comprising severance, legal and consultant fees as these do not reflect ongoing business performance.
•OM&A from the Required Divestitures as it does not reflect ongoing business performance.
Adjusted Net Other Operating Income
Adjusted Net Other Operating Income is net other operating income (the most directly comparable IFRS measure) adjusted to exclude:
•Legal settlement recoveries related to investing activities and not reflective of operating performance.
•Insurance recoveries related to a property claim for an unplanned maintenance outage which is not reflective of ongoing business performance.
•Insurance recoveries related to the Kent Hills replacement costs of the tower collapse as these relate to investing activities and are not reflective of ongoing business performance.
Additional Adjustments
Adjustments to Earnings (Loss) in Addition to Interest, Taxes, Depreciation and Amortization
•Fair value change in contingent consideration payable is not included as it is not reflective of ongoing business performance.
•Asset impairment charges and reversals are not included as these are accounting adjustments that impact depreciation and amortization and do not reflect ongoing business performance.
Any gains or losses on asset sales or foreign exchange gains or losses are not included as these are not part of operating income.
Adjustments for Equity-Accounted Investments
During the fourth quarter of 2020, we acquired a 49 per cent interest in the Skookumchuck wind facility, which is treated as an equity investment under IFRS and our proportionate share of the net earnings is reflected as equity income on the statement of earnings under IFRS. As this investment is part of our regular power-generating operations, we have included our proportionate share of Adjusted EBITDA for the Skookumchuck wind facility in our total Adjusted EBITDA. In addition, in the Wind and Solar adjusted results, we have included our proportionate share of revenues and expenses to reflect the full operational results of this investment. We have not included Adjusted EBITDA of other equity-accounted investments in our total Adjusted EBITDA as they do not represent our regular power-generating operations.
Adjusted Earnings (Loss) before Income Taxes
Adjusted Earnings (Loss) before Income Taxes represents segmented earnings (loss) adjusted for certain items that we believe do not reflect ongoing business performance and is an important metric for evaluating performance trends in each segment.
For details of the adjustments made to earnings (loss) before income taxes (the most directly comparable IFRS measure) to calculate Adjusted Earnings (Loss) before Income Taxes, refer to the "Reconciliation of Non-IFRS Measures on a Consolidated Basis by Segment" section of this MD&A.
Adjusted Net Earnings (Loss) Attributable to Common Shareholders
Adjusted Net Earnings (Loss) Attributable to Common Shareholders represents net earnings (loss) attributable to common shareholders adjusted for specific reclassifications and adjustments and their tax impact, and is an important metric for evaluating performance. For details of the reclassifications and adjustments made to net earnings (loss) attributable to common shareholders (the most directly comparable IFRS measure), please refer to the reconciliation of net earnings attributable to common shareholders to Adjusted Net Earnings Attributable to Common Shareholders of this section of MD&A.
Adjusted Net Earnings (Loss) per Common Share Attributable to Common Shareholders
Adjusted Net Earnings (Loss) per Common Share Attributable to Common Shareholders is calculated as
Adjusted Net Earnings (Loss) attributable to Common Shareholders divided by a weighted average number of common shares outstanding during the period. The measure is useful in showing the earnings per common share for our core operational results as it excludes the impact of items that do not reflect an ongoing business performance. Adjusted Net Earnings (Loss) Attributable per Common Share is a non-IFRS ratio and the most directly comparable IFRS measure is net income (loss) per common share attributable to common shareholders. Refer to the reconciliation of net earnings attributable to common shareholders to Adjusted Net Earnings Attributable to Common Shareholders of this section of MD&A.
Funds From Operations (FFO)
FFO is an important metric as it provides a proxy for cash generated from operating activities before changes in working capital and provides the ability to evaluate cash flow trends in comparison with results from prior periods. FFO is a non-IFRS measure. For a description of the adjustments made to cash flow from operating activities (the most directly comparable IFRS measure) to calculate FFO, refer to the "Reconciliation of Cash Flow from Operations to FFO and FCF" section of this MD&A.
Adjustments to Cash Flow from Operations
•FFO related to the Skookumchuck wind facility, which is treated as an equity-accounted investment under IFRS and equity income, net of distributions from joint ventures, is included in cash flow from operations under IFRS. As this investment is part of our regular power-generating operations, we have included our proportionate share of FFO.
•Payments received on finance lease receivables are reclassified to reflect cash from operations.
•We adjust for the items included in the cash flow from operating activities related to the decision made in prior years to accelerate being off-coal (Clean energy transition provisions and adjustments).
•Penalties totalling $33 million were issued by the Alberta Market Surveillance Administrator for self-reported contraventions pertaining to ancillary services provided during 2021 and 2022 at our Brazeau hydro facility. The penalties were paid during the first quarter of 2025 and have been excluded from FFO composition.
•Other adjustments primarily include costs associated with acquisition-related transactions, restructuring costs and legal costs related to arbitration proceedings that are not reflective of ongoing business performance, payments/receipts for production tax credits, which are reductions to tax equity debt and distributions from equity-accounted joint ventures.
Free Cash Flow (FCF)
FCF is an important metric as it represents the amount of cash that is available to invest in growth initiatives, make scheduled principal debt repayments, repay maturing debt, pay common share dividends or repurchase common shares, and it provides the ability to compare cash flow trends with results from prior periods. Changes in working capital are excluded so that FFO and FCF are not distorted by changes that we consider temporary in nature, reflecting, among other things, the impact of seasonal factors and timing of receipts and payments. FCF is a non-IFRS measure. For a description of the adjustments made to cash flow from operating activities (the most directly comparable IFRS measure) to calculate FCF, refer to the "Reconciliation of Cash Flow from Operations to FFO and FCF" section of this MD&A.
Adjusted Net Debt
Adjusted Net Debt is calculated as a sum of current and non-current portions of credit facilities, long-term debt and lease liabilities, exchangeable debentures, 50 per cent of issued preferred shares and exchangeable preferred shares, less cash and cash equivalents, less the principal portion of TransAlta OCP restricted cash and fair value of hedging instruments on debt. Presenting this item from period to period provides management and investors with the ability to evaluate leverage trends more readily in comparison with prior periods’ results. The most directly comparable IFRS measure is total credit facilities, long-term debt and lease liabilities.
Total Consolidated Net Debt
Total consolidated debt is calculated as a sum of current and non-current portions of credit facilities, long-term debt and lease liabilities, exchangeable debentures, less principal portion of TransAlta OCP restricted cash. Total Consolidated Net Debt excludes the exchangeable preferred shares as they are considered equity with dividend payments for credit purposes. Presenting this item from period to period provides management and investors with the ability to evaluate leverage trends more readily in comparison with prior periods’ results. The most directly comparable IFRS measure is total credit facilities, long-term debt and lease liabilities; for reconciliation, refer to "Financial Capital" section of this MD&A.
Net Interest Expense
Net Interest Expense is calculated as total interest expense less total interest income and non-cash items. For detailed calculation refer to the table in the "Reconciliation of Adjusted EBITDA to FFO and FCF" section of this MD&A. Net Interest Expense is a proxy for the actual cash interest paid that approximates the cash outflow in the FFO and FCF calculation. The most directly comparable IFRS measure is total interest expense.
Adjusted Gross Margin
Adjusted Gross Margin is calculated as Adjusted Revenues less Adjusted Fuel and Purchased Power and carbon compliance costs, where adjustments to revenue or fuel and purchased power were applied as stated above. The Skookumchuck wind facility has been included on a proportionate basis in the Wind and Solar segment. The most directly comparable IFRS measure is gross margin in the Condensed Consolidated Statement of Earnings (Loss).
Non-IFRS Ratios
FFO per share, FCF per share and Adjusted Net Debt to Adjusted EBITDA are non-IFRS ratios that are presented in this MD&A. Refer to the "Reconciliation of Cash Flow from Operations to FFO and FCF" and "Financial Capital" sections of this MD&A for additional information.
FFO per Share and FCF per Share
FFO per share and FCF per share are calculated using the weighted average number of common shares outstanding during the period.
Supplementary Financial Measures
•Available liquidity
•Cash flow from operating activities per share
•Sustaining capital expenditures
•Growth and development expenditures
•Alberta Hydro Assets ancillary services revenues
•Alberta Hydro Assets revenues
•Other Hydro Assets revenues
•Other Hydro revenues
•Highvale mine reclamation spend
•Centralia mine reclamation spend
•Realized foreign exchange gain (loss)
•Unrealized foreign exchange gain (loss)
•The Alberta electricity portfolio metrics
•Realized merchant power price per MWh
•Ancillary services price per MWh
•Hedged power price average per MWh
•Fuel cost per MWh
•Carbon compliance per MWh
Reconciliation of Non-IFRS Measures on a Consolidated Basis by Segment
The following table reflects Adjusted EBITDA and Adjusted Earnings (Loss) before income taxes by segment and provides reconciliation to earnings (loss) before income taxes for the three months ended Sept. 30, 2026:
| | | | | | | | | | | | | | | | | | | | | | | | | | | | | | | | |
| Hydro | Wind & Solar(1) | Gas | Energy
Marketing | Corporate | Energy Transition | Total | Equity- accounted investments(1) | Reclass adjustments | IFRS financials |
| Revenues | 95 | | 110 | | 315 | | 31 | | (15) | | 2 | | 538 | | (2) | | — | | 536 | |
| Reclassifications and adjustments: | | | | | | | | | | |
| Unrealized mark-to-market (gain) loss | — | | (24) | | (3) | | 7 | | — | | — | | (20) | | — | | 20 | | — | |
| | | | | | | | | | |
| Decrease in finance lease receivable | — | | 1 | | 7 | | — | | — | | — | | 8 | | — | | (8) | | — | |
| Finance lease income | — | | 1 | | 6 | | — | | — | | — | | 7 | | — | | (7) | | — | |
| | | | | | | | | | |
| | | | | | | | | | |
| | | | | | | | | | |
Adjusted Revenue | 95 | | 88 | | 325 | | 38 | | (15) | | 2 | | 533 | | (2) | | 5 | | 536 | |
| Fuel and purchased power | (5) | | (6) | | (126) | | — | | 1 | | — | | (136) | | — | | — | | (136) | |
| | | | | | | | | | |
| | | | | | | | | | |
| | | | | | | | | | |
| | | | | | | | | | |
| Carbon compliance (costs) recovery | — | | — | | (3) | | — | | 14 | | — | | 11 | | — | | — | | 11 | |
Adjusted Gross Margin | 90 | | 82 | | 196 | | 38 | | — | | 2 | | 408 | | (2) | | 5 | | 411 | |
| OM&A | (13) | | (26) | | (63) | | (8) | | (32) | | (34) | | (176) | | 2 | | — | | (174) | |
| Reclassifications and adjustments: | | | | | | | | | | |
| | | | | | | | | | |
| | | | | | | | | | |
| Centralia Order compliance costs and community fund expenses | — | | — | | — | | — | | — | | 27 | | 27 | | — | | (27) | | — | |
| | | | | | | | | | |
| ERP integration costs | — | | — | | — | | — | | 2 | | — | | 2 | | — | | (2) | | — | |
| Acquisition-related transaction and restructuring costs | — | | — | | — | | — | | 3 | | — | | 3 | | — | | (3) | | — | |
| Adjusted OM&A | (13) | | (26) | | (63) | | (8) | | (27) | | (7) | | (144) | | 2 | | (32) | | (174) | |
| Taxes, other than income taxes | (1) | | (5) | | (5) | | — | | (1) | | — | | (12) | | — | | — | | (12) | |
Net other operating income | — | | 1 | | 14 | | — | | — | | — | | 15 | | — | | — | | 15 | |
| Reclassifications and adjustments: | | | | | | | | | | |
| Insurance recovery | — | | — | | (3) | | — | | — | | — | | (3) | | — | | 3 | | — | |
| Adjusted Net other operating income | — | | 1 | | 11 | | — | | — | | — | | 12 | | — | | 3 | | 15 | |
Adjusted EBITDA(2) | 76 | | 52 | | 139 | | 30 | | (28) | | (5) | | 264 | | | | |
| Depreciation and amortization | (8) | | (51) | | (41) | | — | | (5) | | — | | (105) | | 1 | | — | | (104) | |
| Equity loss | — | | — | | — | | — | | (1) | | — | | (1) | | — | | — | | (1) | |
| Interest income | — | | — | | — | | — | | 9 | | — | | 9 | | (2) | | — | | 7 | |
| Interest expense | — | | — | | — | | — | | (76) | | — | | (76) | | 1 | | — | | (75) | |
| | | | | | | | | | |
Adjusted Earnings (Loss) before income taxes(2) | 68 | | 1 | | 98 | | 30 | | (101) | | (5) | | 91 | | | | |
| Reclassifications and adjustments above | — | | 22 | | (7) | | (7) | | (5) | | (27) | | (24) | | | | |
| Finance lease income | — | | 1 | | 6 | | — | | — | | — | | 7 | | — | | — | | 7 | |
| | | | | | | | | | |
| | | | | | | | | | |
| Asset impairment (charges) reversals | — | | — | | (5) | | — | | — | | 15 | | 10 | | — | | — | | 10 | |
| | | | | | | | | | |
Unrealized foreign exchange gain(3) | — | | — | | — | | — | | 4 | | — | | 4 | | — | | — | | 4 | |
| Gain on sale of assets and other | — | | — | | — | | — | | 6 | | 6 | | 12 | | — | | — | | 12 | |
| Earnings (loss) before income taxes | 68 | | 24 | | 92 | | 23 | | (96) | | (11) | | 100 | | — | | — | | 100 | |
(1)The Skookumchuck wind facility has been included on a proportionate basis in the Wind and Solar segment.
(2)Adjusted EBITDA, Adjusted Earnings (Loss) before income taxes are non-IFRS measures, are not defined and has no standardized meaning under IFRS and may not be comparable to similar measures presented by other issuers. Refer to the "Non-IFRS and Supplementary Financial Measures" section of this MD&A.
(3)Unrealized foreign exchange (loss) gain is a supplementary financial measures. Refer to the "Non-IFRS and Supplementary Financial Measures" section of this MD&A for more details.
The following table reflects Adjusted EBITDA and Adjusted Earnings (Loss) before income taxes by segment and provides reconciliation to earnings (loss) before income taxes for the three months ended Sept. 30, 2025:
| | | | | | | | | | | | | | | | | | | | | | | | | | | | | | | | |
| Hydro | Wind & Solar(1) | Gas | Energy
Marketing | Corporate | Energy Transition | Total | Equity- accounted investments(1) | Reclass adjustments | IFRS financials |
| Revenues | 95 | | 3 | | 326 | | 37 | | — | | 158 | | 619 | | (4) | | — | | 615 | |
| Reclassifications and adjustments: | | | | | | | | | | |
| Unrealized mark-to-market (gain) loss | (3) | | 78 | | (12) | | (8) | | — | | (10) | | 45 | | — | | (45) | | — | |
| | | | | | | | | | |
| Decrease in finance lease receivable | — | | 1 | | 7 | | — | | — | | — | | 8 | | — | | (8) | | — | |
| Finance lease income | — | | 1 | | 5 | | — | | — | | — | | 6 | | — | | (6) | | — | |
Revenues from Required Divestitures | — | | — | | (4) | | — | | — | | — | | (4) | | — | | 4 | | — | |
| | | | | | | | | | |
| Unrealized foreign exchange (gain) loss on commodity | — | | — | | (1) | | 1 | | — | | — | | — | | — | | — | | — | |
| Adjusted Revenue | 92 | | 83 | | 321 | | 30 | | — | | 148 | | 674 | | (4) | | (55) | | 615 | |
| Fuel and purchased power | (5) | | (5) | | (119) | | — | | — | | (98) | | (227) | | — | | — | | (227) | |
| Reclassifications and adjustments: | | | | | | | | | | |
Fuel and purchased power related to Required Divestitures | — | | — | | (1) | | — | | — | | — | | (1) | | — | | 1 | | — | |
| | | | | | | | | | |
| | | | | | | | | | |
| | | | | | | | | | |
Adjusted Fuel and Purchased Power | (5) | | (5) | | (120) | | — | | — | | (98) | | (228) | | — | | 1 | | (227) | |
| Carbon compliance costs | — | | — | | (35) | | — | | — | | — | | (35) | | — | | — | | (35) | |
| Adjusted Gross Margin | 87 | | 78 | | 166 | | 30 | | — | | 50 | | 411 | | (4) | | (54) | | 353 | |
| OM&A | (14) | | (28) | | (64) | | (13) | | (41) | | (20) | | (180) | | 1 | | — | | (179) | |
| Reclassifications and adjustments: | | | | | | | | | | |
| OM&A related to Required Divestitures | — | | — | | 2 | | — | | — | | — | | 2 | | — | | (2) | | — | |
ERP integration costs | — | | — | | — | | — | | 6 | | — | | 6 | | — | | (6) | | — | |
Acquisition-related transaction and restructuring costs | — | | — | | — | | — | | 1 | | — | | 1 | | — | | (1) | | — | |
| Adjusted OM&A | (14) | | (28) | | (62) | | (13) | | (34) | | (20) | | (171) | | 1 | | (9) | | (179) | |
| Taxes, other than income taxes | — | | (5) | | (5) | | — | | (1) | | (2) | | (13) | | 1 | | — | | (12) | |
| Net other operating income | — | | — | | 11 | | — | | — | | — | | 11 | | — | | — | | 11 | |
| | | | | | | | | | |
| | | | | | | | | | |
| | | | | | | | | | |
| | | | | | | | | | |
Adjusted EBITDA(2) | 73 | | 45 | | 110 | | 17 | | (35) | | 28 | | 238 | | | | |
| Depreciation and amortization | (9) | | (52) | | (59) | | — | | (6) | | (11) | | (137) | | 2 | | — | | (135) | |
| Equity loss | — | | — | | — | | — | | (1) | | — | | (1) | | — | | — | | (1) | |
| Interest income | — | | — | | — | | — | | 9 | | — | | 9 | | (2) | | — | | 7 | |
| Interest expense | — | | — | | — | | — | | (87) | | — | | (87) | | 2 | | — | | (85) | |
Realized foreign exchange loss(3) | — | | — | | — | | — | | (5) | | — | | (5) | | — | | — | | (5) | |
Adjusted Earnings (Loss) before income taxes(2) | 64 | | (7) | | 51 | | 17 | | (125) | | 17 | | 17 | | | | |
| Reclassifications and adjustments above | 3 | | (80) | | 4 | | 7 | | (7) | | 10 | | (63) | | | | |
| Finance lease income | — | | 1 | | 5 | | — | | — | | — | | 6 | | — | | — | | 6 | |
| | | | | | | | | | |
Fair value change in contingent consideration payable | — | | — | | 3 | | — | | — | | — | | 3 | | — | | — | | 3 | |
| Asset impairment charges | — | | (20) | | (3) | | — | | — | | (4) | | (27) | | — | | — | | (27) | |
| Unrealized foreign exchange gain | — | | — | | — | | — | | 8 | | — | | 8 | | — | | — | | 8 | |
| Gain on sale of assets and other | — | | — | | 3 | | — | | — | | — | | 3 | | — | | — | | 3 | |
| Earnings (loss) before income taxes | 67 | | (106) | | 63 | | 24 | | (124) | | 23 | | (53) | | — | | — | | (53) | |
(1)The Skookumchuck wind facility has been included on a proportionate basis in the Wind and Solar segment.
(2)Adjusted EBITDA, Adjusted Earnings (Loss) before income taxes are non-IFRS measures, are not defined, have no standardized meaning under IFRS and may not be comparable to similar measures presented by other issuers. Refer to the "Non-IFRS and Supplementary Financial Measures" section of this MD&A.
(3)Realized and unrealized foreign exchange (loss) gain are supplementary financial measures. Refer to the "Non-IFRS and Supplementary Financial Measures" section of this MD&A for more details.
The following table reflects Adjusted EBITDA by segment and provides reconciliation to earnings (loss) before income taxes for the nine months ended Sept. 30, 2026:
| | | | | | | | | | | | | | | | | | | | | | | | | | | | | | | | |
| Hydro | Wind & Solar(1) | Gas | Energy
Marketing | Corporate | Energy Transition | Total | Equity- accounted investments(1) | Reclass adjustments | IFRS financials |
| Revenues | 252 | | 350 | | 956 | | 97 | | (60) | | 7 | | 1,602 | | (14) | | — | | 1,588 | |
| Reclassifications and adjustments: | | | | | | | | | | |
| Unrealized mark-to-market gain | — | | (11) | | (21) | | (12) | | — | | — | | (44) | | — | | 44 | | — | |
| | | | | | | | | | |
| Decrease in finance lease receivable | — | | 2 | | 22 | | — | | — | | — | | 24 | | — | | (24) | | — | |
| Finance lease income | — | | 4 | | 16 | | — | | — | | — | | 20 | | — | | (20) | | — | |
| | | | | | | | | | |
| | | | | | | | | | |
| Unrealized foreign exchange gain on commodity | — | | — | | (2) | | — | | — | | — | | (2) | | — | | 2 | | — | |
Adjusted Revenue | 252 | | 345 | | 971 | | 85 | | (60) | | 7 | | 1,600 | | (14) | | 2 | | 1,588 | |
| Fuel and purchased power | (13) | | (17) | | (377) | | — | | — | | — | | (407) | | — | | — | | (407) | |
| | | | | | | | | | |
| | | | | | | | | | |
| | | | | | | | | | |
| | | | | | | | | | |
| Carbon compliance (costs) recovery | — | | — | | (36) | | — | | 60 | | — | | 24 | | — | | — | | 24 | |
Adjusted Gross Margin | 239 | 328 | | 558 | | 85 | | — | | 7 | | 1,217 | | (14) | | 2 | | 1,205 | |
| OM&A | (38) | | (77) | | (202) | | (28) | | (137) | | (52) | | (534) | | 4 | | — | | (530) | |
| Reclassifications and adjustments: | | | | | | | | | | |
| Termination and restructuring costs | — | | — | | — | | — | | 18 | | — | | 18 | | — | | (18) | | — | |
Legal costs related to arbitration proceedings | — | | — | | — | | — | | 9 | | — | | 9 | | — | | (9) | | — | |
| | | | | | | | | | |
| Centralia Order compliance costs and community fund expenses | — | | — | | — | | — | | — | | 38 | | 38 | | — | | (38) | | — | |
ERP integration costs | — | | — | | — | | — | | 6 | | — | | 6 | | — | | (6) | | — | |
| Acquisition-related transaction and restructuring costs | — | | — | | — | | — | | 4 | | — | | 4 | | — | | (4) | | — | |
| Adjusted OM&A | (38) | | (77) | | (202) | | (28) | | (100) | | (14) | | (459) | | 4 | | (75) | | (530) | |
| Taxes, other than income taxes | (3) | | (17) | | (15) | | — | | (1) | | — | | (36) | | — | | — | | (36) | |
| Net other operating income | — | | 15 | | 36 | | — | | — | | 1 | | 52 | | — | | — | | 52 | |
| Reclassifications and adjustments: | | | | | | | | | | |
| Legal settlement recoveries | — | | (12) | | — | | — | | — | | — | | (12) | | — | | 12 | | — | |
| Insurance recovery | — | | — | | (3) | | — | | — | | — | | (3) | | — | | 3 | | — | |
Adjusted Net Other Operating Income | — | | 3 | | 33 | | — | | — | | 1 | | 37 | | — | | 15 | | 52 | |
Adjusted EBITDA(2) | 198 | 237 | | 374 | | 57 | | (101) | | (6) | | 759 | | | | |
| Depreciation and amortization | (28) | | (150) | | (124) | | — | | (14) | | (1) | | (317) | | 3 | | — | | (314) | |
| Equity (loss) income | — | | — | | — | | — | | (1) | | — | | (1) | | — | | 4 | | 3 | |
| Interest income | — | | — | | — | | — | | 22 | | — | | 22 | | (1) | | — | | 21 | |
| Interest expense | — | | — | | — | | — | | (245) | | — | | (245) | | 4 | | — | | (241) | |
Realized foreign exchange gain(3) | — | | — | | — | | — | | 8 | | — | | 8 | | — | | — | | 8 | |
Adjusted Earnings (Loss) before income taxes(2) | 170 | 87 | | 250 | | 57 | | (331) | | (7) | | 226 | | | | |
| Reclassifications and adjustments above: | — | | 17 | | (12) | | 12 | | (37) | | (38) | | (58) | | | | |
Finance lease income | — | | 4 | | 16 | | — | | — | | — | | 20 | | — | | — | | 20 | |
Skookumchuck earnings reclass to Equity income(1) | — | | (4) | | — | | — | | 4 | | — | | — | | — | | — | | — | |
| | | | | | | | | | |
Asset impairment (charges) reversals | — | | — | | (5) | | — | | (10) | | 20 | | 5 | | — | | — | | 5 | |
| Gain on sale of assets and other | — | | — | | — | | — | | 4 | | 6 | | 10 | | — | | — | | 10 | |
| | | | | | | | | | |
Earnings (loss) before income taxes | 170 | 104 | | 249 | | 69 | | (370) | | (19) | | 203 | | — | | — | | 203 | |
(1)The Skookumchuck wind facility has been included on a proportionate basis in the Wind and Solar segment.
(2)Adjusted EBITDA, Adjusted Earnings (loss) before income taxes are non-IFRS measures, are not defined, have no standardized meaning under IFRS and may not be comparable to similar measures presented by other issuers. Refer to the "Non-IFRS and Supplementary Financial Measures" section of this MD&A.
(3)Realized foreign exchange (loss) gain is a supplementary financial measure. Refer to the "Non-IFRS and Supplementary Financial Measures" section of this MD&A for more details.
The following table reflects Adjusted EBITDA by segment and provides reconciliation to earnings (loss) before income taxes for the nine months ended Sept. 30, 2025:
| | | | | | | | | | | | | | | | | | | | | | | | | | | | | | | | |
| Hydro | Wind & Solar(1) | Gas | Energy
Marketing | Corporate | Energy Transition | Total | Equity- accounted investments(1) | Reclass adjustments | IFRS financials |
| Revenues | 310 | | 169 | | 920 | | 102 | | (66) | | 385 | | 1,820 | | (14) | | — | | 1,806 | |
| Reclassifications and adjustments: | | | | | | | | | | |
| Unrealized mark-to-market (gain) loss | (6) | | 182 | | 27 | | (9) | | — | | 4 | | 198 | | — | | (198) | | — | |
| | | | | | | | | | |
| Decrease in finance lease receivable | — | | 2 | | 21 | | — | | — | | — | | 23 | | — | | (23) | | — | |
| Finance lease income | — | | 4 | | 13 | | — | | — | | — | | 17 | | — | | (17) | | — | |
| Revenues from Required Divestitures | — | | — | | (11) | | — | | — | | — | | (11) | | — | | 11 | | — | |
| | | | | | | | | | |
| Unrealized foreign exchange gain on commodity | — | | — | | (1) | | (1) | | — | | — | | (2) | | — | | 2 | | — | |
| Adjusted Revenue | 304 | | 357 | | 969 | | 92 | | (66) | | 389 | | 2,045 | | (14) | | (225) | | 1,806 | |
| Fuel and purchased power | (16) | | (24) | | (388) | | — | | (2) | | (247) | | (677) | | — | | — | | (677) | |
| Reclassifications and adjustments: | | | | | | | | | | |
| Fuel and purchased power related to Required Divestitures | — | | — | | 2 | | — | | — | | — | | 2 | | — | | (2) | | — | |
Adjusted Fuel and Purchased Power | (16) | | (24) | | (386) | | — | | (2) | | (247) | | (675) | | — | | (2) | | (677) | |
Carbon compliance (costs) recovery | — | | (2) | | (76) | | — | | 68 | | — | | (10) | | — | | — | | (10) | |
Adjusted Gross Margin | 288 | | 331 | | 507 | | 92 | | — | | 142 | | 1,360 | | (14) | | (227) | | 1,119 | |
| OM&A | (40) | | (82) | | (188) | | (28) | | (135) | | (55) | | (528) | | 3 | | — | | (525) | |
| Reclassification and adjustments: | | | | | | | | | | |
| OM&A related to Required Divestitures | — | | — | | 5 | | — | | — | | — | | 5 | | — | | (5) | | — | |
| ERP integration costs | — | | — | | — | | — | | 16 | | — | | 16 | | — | | (16) | | — | |
| Acquisition-related transaction and restructuring costs | — | | — | | — | | — | | 6 | | — | | 6 | | — | | (6) | | — | |
| Adjusted OM&A | (40) | | (82) | | (183) | | (28) | | (113) | | (55) | | (501) | | 3 | | (27) | | (525) | |
| Taxes, other than income taxes | (2) | | (15) | | (15) | | — | | (2) | | (3) | | (37) | | 1 | | — | | (36) | |
| Net other operating income | — | | 4 | | 33 | | — | | — | | — | | 37 | | — | | — | | 37 | |
| Reclassifications and adjustments: | | | | | | | | | | |
| Insurance recovery | — | | (2) | | — | | — | | — | | — | | (2) | | — | | 2 | | — | |
Adjusted Net Other Operating Income | — | | 2 | | 33 | | — | | — | | — | | 35 | | — | | 2 | | 37 | |
Adjusted EBITDA(2) | 246 | | 236 | | 342 | | 64 | | (115) | | 84 | | 857 | | | | |
| Depreciation and amortization | (26) | | (157) | | (197) | | (2) | | (15) | | (39) | | (436) | | 5 | | — | | (431) | |
| Equity income | — | | — | | — | | — | | (2) | | — | | (2) | | — | | 4 | | 2 | |
| Interest income | — | | — | | — | | — | | 21 | | — | | 21 | | (3) | | — | | 18 | |
| Interest expense | — | | — | | — | | — | | (270) | | — | | (270) | | 4 | | — | | (266) | |
Realized foreign exchange loss(3) | — | | — | | — | | — | | (3) | | — | | (3) | | — | | — | | (3) | |
Adjusted earnings (loss) before income taxes(2) | 220 | | 79 | | 145 | | 62 | | (384) | | 45 | | 167 | | | | |
| Reclassifications and adjustments above | 6 | | (186) | | (56) | | 10 | | (22) | | (4) | | (252) | | | | |
| Finance lease income | — | | 4 | | 13 | | — | | — | | — | | 17 | | — | | — | | 17 | |
Skookumchuck earnings reclass to equity income(1) | — | | (4) | | — | | — | | 4 | | — | | — | | — | | — | | — | |
| Fair value change in contingent consideration payable | — | | — | | 37 | | — | | — | | — | | 37 | | — | | — | | 37 | |
| Asset impairment (charges) reversals | — | | (20) | | (37) | | — | | (7) | | 9 | | (55) | | — | | — | | (55) | |
| Gain on sale of assets and other | — | | — | | 3 | | — | | (1) | | — | | 2 | | | — | | 2 | |
Unrealized foreign exchange loss(3) | — | | — | | — | | — | | (15) | | — | | (15) | | — | | — | | (15) | |
| Earnings (loss) before income taxes | 226 | | (127) | | 105 | | 72 | | (425) | | 50 | | (99) | | — | | — | | (99) | |
(1)The Skookumchuck wind facility has been included on a proportionate basis in the Wind and Solar segment.
(2)Adjusted EBITDA, Adjusted Earnings (Loss) before income taxes are non-IFRS measures, are not defined, have no standardized meaning under IFRS and may not be comparable to similar measures presented by other issuers. Refer to the "Non-IFRS and Supplementary Financial Measures" section of this MD&A.
(3)Realized and unrealized foreign exchange (loss) gain are supplementary financial measures. Refer to the "Non-IFRS and Supplementary Financial Measures" section of this MD&A for more details.
Reconciliation of Net Earnings Attributable to Common Shareholders to Adjusted Net Earnings Attributable to Common Shareholders
The following table reflects reconciliation of net earnings (loss) attributable to common shareholders to Adjusted Net Earnings Attributable to Common Shareholders for the three and nine months ended Sept. 30, 2026 and 2025:
| | | | | | | | | | | | | | | |
| | | |
| 3 months ended Sept. 30 | 9 months ended Sept. 30, | |
| (in millions of Canadian dollars except where noted) | 2026 | 2025 | 2026 | 2025 | |
| | | | | |
| | | | | |
| | | | | |
| | | | | |
| | | | | |
| Net earnings (loss) attributable to common shareholders | 63 | | (62) | | 111 | | (128) | | |
| Adjustments and reclassifications (pre-tax): | | | | | |
| | | | | |
| | | | | |
| | | | | |
| | | | | |
| | | | | |
| Adjustments and reclassifications to revenues | (5) | | 55 | | (2) | | 225 | | |
| | | | | |
| | | | | |
| Adjustments and reclassifications to fuel and purchased power | — | | (1) | | — | | 2 | | |
| | | | | |
| | | | | |
| Adjustments and reclassifications to OM&A | 32 | | 9 | | 75 | | 27 | | |
| | | | | |
| Adjustments and reclassifications to net other operating income | (3) | | — | | (15) | | (2) | | |
| Fair value gain on contingent consideration | — | | (3) | | — | | (37) | | |
| Finance lease income | (7) | | (6) | | (20) | | (17) | | |
| Asset impairment (reversals) charges | (10) | | 27 | | (5) | | 55 | | |
| Gain on sale of assets and other | (12) | | (3) | | (10) | | (2) | | |
Unrealized foreign exchange (gain) loss(1) | (4) | | (8) | | — | | 15 | | |
Calculated tax expense on adjustments and reclassifications(2) | 2 | | (16) | | (6) | | (62) | | |
Adjusted Net Earnings (Loss) Attributable to Common Shareholders(3) | 56 | | (8) | | 128 | | 76 | | |
| Weighted average number of common shares outstanding in the period (in millions) | 316 | | 297 | | 305 | | 297 | | |
Net earnings (loss) per common share attributable to common shareholders(4) | 0.20 | | (0.20) | | 0.32 | | (0.43) | | |
| Adjustments and reclassifications (net of tax) | (0.02) | | 0.18 | | 0.05 | | 0.69 | | |
Adjusted Net Earnings (Loss) per Common Share Attributable to Common Shareholders(3)(4) | 0.18 | | (0.02) | | 0.37 | | 0.26 | | |
| | | | | |
(1)Unrealized foreign exchange (gain) loss is a supplementary financial measure. Refer to the "Non-IFRS and Supplementary Financial Measures" section of this MD&A for more details.
(2)Represents a theoretical tax calculated by applying the Company's consolidated effective tax rate of 23.3 per cent for the three and nine months ended Sept. 30, 2026 and Sept. 30, 2025 — 23.3 per cent. The amount does not take into account the impact of different tax jurisdictions the Company's operations are domiciled and does not include the impact of deferred taxes.
(3)Adjusted Net Earnings (Loss) Attributable to Common Shareholders and Adjusted Net Earnings (Loss) per Common Share attributable to Common Shareholders are non-IFRS measures, are not defined, have no standardized meaning under IFRS and may not be comparable to similar measures presented by other issuers. The most directly comparable IFRS measures are net earnings (loss) attributable to common shareholders and net earnings (loss) per share attributable to common shareholders, basic and diluted. Refer to the "Non-IFRS and Supplementary Financial Measures" section of this MD&A for more details.
(4)Net earnings (loss) attributable to common shareholders and Adjusted Net Earnings (Loss) Attributable to Common Shareholders used in calculating net earnings (loss) per common share attributable to common shareholders and Adjusted Net Earnings (Loss) per Common Share Attributable to Common Shareholders reflect the cumulative preferred share dividend entitlement required for the current period.
Reconciliation of Cash Flow from Operations to FFO and FCF
The table below reconciles our cash flow from operating activities to our FFO and FCF:
| | | | | | | | | | | | | | | |
| | | |
| 3 months ended Sept. 30 | 9 months ended Sept. 30, | |
| (in millions of Canadian dollars except where noted) | 2026 | 2025 | 2026 | 2025 | |
Cash flow from operating activities(1) | 132 | | 251 | | 317 | | 415 | | |
| Change in non-cash operating working capital balances | (32) | | (104) | | 69 | | 94 | | |
| Cash flow from operations before changes in working capital | 100 | | 147 | | 386 | | 509 | | |
| Adjustments | | | | | |
Share of adjusted FFO from joint venture(1) | — | | 1 | | 4 | | 4 | | |
| Decrease in finance lease receivable | 8 | | 8 | | 24 | | 23 | | |
| Brazeau penalties payment | — | | — | | — | | 33 | | |
| Clean energy transition provisions and adjustments | 8 | | — | | 8 | | — | | |
| | | | | |
| | | | | |
| | | | | |
| Centralia Order compliance costs and community fund expenses | 38 | | — | | 38 | | — | | |
Other(2) | (8) | | — | | 24 | | 18 | | |
FFO(4) | 146 | | 156 | | 484 | | 587 | | |
| Deduct: | | | | | |
Sustaining capital expenditures(1) | (35) | | (37) | | (95) | | (117) | | |
| | | | | |
| Dividends paid on preferred shares | (14) | | (14) | | (41) | | (40) | | |
| Distributions paid to subsidiaries’ non-controlling interests | (3) | | (1) | | (8) | | (3) | | |
| | | | | |
Other(3) | (1) | | 1 | | (2) | | (6) | | |
FCF(4) | 93 | | 105 | | 338 | | 421 | | |
| Weighted average number of common shares outstanding in the period | 316 | | 297 | | 305 | | 297 | | |
| Cash flow from operating activities per share | 0.42 | | 0.85 | | 1.04 | | 1.40 | | |
FFO per share(4) | 0.46 | | 0.53 | | 1.59 | | 1.98 | | |
FCF per share(4) | 0.29 | | 0.35 | | 1.11 | | 1.42 | | |
(1)Includes our share of amounts for the Skookumchuck wind facility, an equity-accounted joint venture. Sustaining capital expenditures are presented net of the associated property damage insurance recoveries. Supplementary financial measure. Refer to the "Non-IFRS and Supplementary Financial Measures" section of this MD&A for more details.
(2)Other consists of production tax credits, which is a reduction to tax equity debt, adjustments to OM&A that are not reflective of ongoing operations and distributions from an equity-accounted joint venture.
(3)Other consists of principal payments on lease liabilities and unsecured loan advances by the Company's subsidiary, Kent Hills Wind LP to its 17 per cent partner.
(4)These items are non-IFRS measures, which are not defined and have no standardized meaning under IFRS and may not be comparable to similar measures presented by other issuers. Refer to the "Non-IFRS and Supplementary Financial Measures" section of this MD&A.
Reconciliation of Adjusted EBITDA to FFO and FCF
The table below provides a reconciliation of our Adjusted EBITDA to our FFO and FCF:
| | | | | | | | | | | | | | | |
| | | |
| 3 months ended Sept. 30 | 9 months ended Sept. 30, | |
| 2026 | 2025 | 2026 | 2025 | |
Adjusted EBITDA(1)(2) | 264 | | 238 | | 759 | | 857 | | |
| Provisions | (7) | | (4) | | (6) | | 2 | | |
Net Interest Expense(3) | (57) | | (66) | | (178) | | (204) | | |
| Current income tax (expense) recovery | (20) | | 2 | | (58) | | (57) | | |
Realized foreign exchange (loss) gain(4) | (1) | | (2) | | 13 | | — | | |
| Decommissioning and restoration costs settled | (10) | | (11) | | (24) | | (31) | | |
Other non-cash items(5) | (23) | | (1) | | (22) | | 20 | | |
FFO(2)(7) | 146 | | 156 | | 484 | | 587 | | |
| Deduct: | | | | | |
Sustaining capital(2)(4) | (35) | | (37) | | (95) | | (117) | | |
| | | | | |
| Dividends paid on preferred shares | (14) | | (14) | | (41) | | (40) | | |
| Distributions paid to subsidiaries’ non-controlling interests | (3) | | (1) | | (8) | | (3) | | |
| | | | | |
Other(6) | (1) | | 1 | | (2) | | (6) | | |
FCF(2)(7) | 93 | | 105 | | 338 | | 421 | | |
(1)Adjusted EBITDA is defined in the "Non-IFRS and Supplementary Financial Measures" section of this MD&A and reconciled to earnings before income taxes above.
(2)Includes our share of amounts for the Skookumchuck wind facility, an equity-accounted joint venture. Sustaining capital expenditures are presented net of the associated property damage insurance recoveries.
(3)Net Interest Expense is a non-IFRS measure, not defined and has no standardized meaning under IFRS and may not be comparable to similar measures presented by other issuers. Net Interest Expense includes interest expense less interest income and excludes non-cash items like financing amortization and accretion. Net Interest Expense reconciliation is available in "Financial Condition" section of this MD&A.
(4)Supplementary financial measure. Refer to the "Non-IFRS and Supplementary Financial Measures" section of this MD&A for more details.
(5)Other non-cash items primarily consist of changes in contract assets and liabilities, deferred payments, onerous contracts, legal settlement and incentive accruals.
(6)Other consists of principal payments on lease liabilities and unsecured loan advances by the Company's subsidiary, Kent Hills Wind LP to its 17 per cent partner.
(7)These items are non-IFRS measures, are not defined and have no standardized meaning under IFRS and may not be comparable to similar measures presented by other issuers. FFO and FCF are defined in the "Non-IFRS and Supplementary Financial Measures" section of this MD&A and reconciled to cash flow from operating activities above.
Material Accounting Policies, Accounting Changes and Critical Accounting Estimates
Material Accounting Policies and Accounting Changes
Our material accounting policies are described in Note 2 of the consolidated financial statements for the year ended Dec. 31, 2025.
In accordance with the amendments to IFRS 9 Financial Instruments and IFRS 7 Financial Instruments, effective Jan. 1, 2026, the Company has prospectively designated certain pre-existing VPPAs within the Wind and Solar segment as held for hedging and has applied hedge accounting. As a result, the effective portion of changes in the fair value of these hedging derivatives, arising on or after Jan. 1, 2026, will be recognised in OCI while any ineffective portion will be recognized in net earnings. The transitional provisions did not permit retrospective designation.
For a description of current and future accounting changes impacting our business, refer to Note 2 of the condensed consolidated financial statements for the nine months ended Sept. 30, 2026.
Critical Accounting Judgments and Estimates
The preparation of the condensed consolidated financial statements in accordance with IFRS requires management to apply judgment and to develop estimates and assumptions based on the conditions and information available as of the reporting date. These judgments, estimates, and assumptions influence the reported amounts of assets, liabilities, revenue, and expenses, and actual results may differ from those estimates.
Management reviews these judgments and estimates on a continuous basis. Any revisions are recognized in the period in which they are identified and in any subsequent periods impacted by the change. Refer to Note 2 of the consolidated financial statements for the year ended Dec. 31, 2025 for a description of our significant accounting judgments and key sources of estimation uncertainty.
Valuation of PP&E and Goodwill
An assessment is made at each reporting date as to whether there is any indication that an impairment loss may exist or that a previously recognized impairment loss may no longer exist or may have decreased. An impairment exists when the carrying amount of an asset exceeds its recoverable amount, which is the higher of its fair value less costs of disposal and its value in use. An impairment loss recognized in a prior period is reversed if there has been a change in the estimates used to determine the asset's recoverable amount.
During the three months ended Sept. 30, 2026, for the purposes of the 2026 goodwill impairment review, the Company determined the recoverable amounts of Wind and Solar, and Gas segments by calculating the fair value less costs of disposal using discounted cash flow projections. In 2026, the Company relied on the recoverable amounts determined in 2025 for the Hydro and Energy Marketing segments in performing the 2026 goodwill impairment review. The recoverable amounts are based on the Company's long-range forecasts for the periods extending to the last planned asset retirement in 2086. The resulting fair value measurements are categorized within Level III of the fair value hierarchy. No impairment of goodwill arose for any segment.
During three and nine months ended Sept. 30, 2026, there were no significant changes in estimates, however, significant estimation uncertainty and judgment is applied in determining the recoverable amount of the Wind and Solar, and Gas segments, due to the sensitivity of the significant assumptions to the future cash flows and the effect that changes in these assumptions would have on the recoverable amount.
Refer to Note 2(Q)(II) of the Company's 2025 audited annual consolidated financial statements for further details on the significant accounting judgments and key sources of estimation uncertainty.
Governance and Risk Management
Our business activities expose us to a variety of risks and opportunities including, but not limited to, regulatory changes, rapidly changing market dynamics and increased volatility in our key commodity markets. Our goal is to manage these risks and opportunities so that we are in a position to develop our business and achieve our goals while remaining reasonably protected from an unacceptable level of risk or financial exposure. We use a multi-level risk management oversight structure to manage the risks and opportunities arising from our business
activities, the markets in which we operate and the political environments and structures with which we interact.
Please refer to the "Risk Management" section of our 2025 Annual MD&A and Note 9 of our unaudited interim condensed consolidated financial statements for the nine months ended Sept. 30, 2026 for details on our risks and how we manage them.
There have been no material changes to the Company’s risk profile from those disclosed in the 2025 Annual MD&A.
Regulatory Updates
Refer to the Significant and Subsequent Events and Risk Management discussions in our 2025 Annual MD&A for further details on the corporation's assessment and management of policy and regulatory risks that supplement the recent developments as discussed below:
Canada
Federal
The Liberal government in Canada was elected on April 28, 2025, as a minority government. Through by-election results and floor crossings, the Liberal party now holds a majority of the seats in the House of Commons.
On Nov. 27, 2025, the Canadian and Alberta governments signed a Memorandum of Understanding (MOU) that among other items, agreed to place the Canadian Electricity Regulations (CER) in abeyance, upon completion of a new carbon pricing agreement administered through Alberta's TIER program.
On May 15, 2026, the governments signed the implementation agreement to operationalize the MOU. That same week, a National Electricity Strategy was released and proposed doubling generation capacity by 2050 and providing some flexibility with the CER to allow greater use of natural gas, expanded carbon offset flexibility and extended lifespans for existing assets.
In June, the federal government released a federal AI Strategy. The MOU, AI and electricity strategies focus on enabling large scale economic growth driven by electrification and digital infrastructure while maintaining system reliability and competitiveness.
Alberta
On Jun. 9, 2026, the Government released a new Data Centre Regulation for new large data centres (≥ 75 MW) seeking system access service to connect to the transmission system, including a "bring your own generation" requirement. The regulation introduces the concept of "tethering" under which a large load data centre system access service request is linked to a new or modified system access service request for a generating unit, energy storage facility or deemed underutilized facility. Tethering requires the large load data centre to identify the power source that will satisfy the resource adequacy or "bring your own generation" requirement for serving the new large load. The regulation also authorizes the AESO to designate an existing generating unit as underutilized and eligible to be tethered to a new large load data centre.
On Jun. 25, 2026, the AESO followed the release of the Data Centre Regulation with a proposed new Phase 2a connection process for large loads. The proposed process sets out requirements for large load data centres requesting grid connection, including tethering to new gas-fired generation and satisfying mandatory and project readiness checklist requirements before a connection request may advance. The Phase 2a process will apply to data centre projects that have in-service dates in 2028 and beyond. The first intake into the Phase 2a process is expected in fall 2026.
United States
On Sept. 11, 2026, the U.S. Department of Energy (U.S. DOE) issued its fourth consecutive 90-day Order for the Centralia facility for the period of Sept. 13 to Dec. 11, 2026.
On Aug. 5, 2026, TransAlta filed a petition for cost recovery with the Federal Energy Regulatory Commission (FERC) for the second 90-day 202(c) Order. On Oct. 1 and 19, 2026, respectively, FERC rejected the Company's cost recovery petition for the first and second 90-day Orders; both rulings affirmed the Company's ability to recover costs and allows for filing new petitions. The Company continues to work with the state and federal governments in relation to the Order and filing.
On July 31, 2026, the state of Washington Department of Ecology issued a draft Prevention of Significant Deterioration Permit and Mitigated Determination of Non-Significance for the Centralia Coal-to-Gas conversion project (CtG Project), and accepted public comments through Sept. 15, 2026. On Sept. 3, 2026, the state of Washington Southwest Clean Air Agency issued a draft Air Discharge Permit for the CtG Project and accepted public comments through Oct. 9, 2026. Both are draft decisions and final permits have not yet been issued.
At the federal level, TransAlta continues to monitor policies and agency developments related to our business, including but not limited to: wind, solar and battery tax credits; permit issuance for land-based wind and solar projects; electricity infrastructure permitting reform legislation; large load integration; and regulatory reforms for thermal power generation.
Australia
In 2025, the federal and Western Australian governments both held elections, resulting in majority, renewed terms for both incumbent governments. TransAlta continues to monitor policy developments in Australia.
Disclosure Controls and Procedures
Management is responsible for establishing and maintaining adequate internal control over financial reporting (ICFR) and disclosure controls and procedures (DC&P). During the three and nine months ended Sept. 30, 2026, the majority of our workforce supporting and executing our ICFR and DC&P continue to work on a hybrid basis. The Company has implemented appropriate controls and oversight for both in-office and remote work. There has been minimal impact to the design and performance of our internal controls.
ICFR is a framework designed to provide reasonable assurance regarding the reliability of financial reporting and the preparation of the condensed consolidated financial statements for external purposes in accordance with IFRS. Management has used the Internal Control – Integrated Framework issued by the Committee of Sponsoring Organizations of the Treadway Commission (2013 framework) to assess the effectiveness of the Company’s ICFR.
DC&P refer to controls and other procedures designed to ensure that information required to be disclosed in the reports we file or submit under securities legislation is recorded, processed, summarized and reported within the time frame specified in applicable securities legislation. DC&P include, without limitation, controls and procedures designed to ensure that information required to be disclosed by us in our reports that we file or submit under applicable securities legislation is accumulated and communicated to management, including our Chief Executive Officer and Chief Financial Officer, as appropriate to allow timely decisions regarding our required disclosure.
Together, the ICFR and DC&P frameworks provide internal control over financial reporting and disclosure. In designing and evaluating our ICFR and DC&P, management recognizes that any controls and procedures, no matter how well designed and operated, can provide only reasonable assurance of achieving the desired control objectives and as such may not prevent or detect all misstatements and management is required to apply its judgment in evaluating and implementing possible controls and procedures.
Further, the effectiveness of ICFR is subject to the risk that controls may become inadequate because of changes in conditions or that the degree of compliance with policies or procedures may change.
In Jan. 2026, the Company implemented an upgrade to our Enterprise Resource Planning (ERP) system across the organization resulting in the modification to a number of its internal controls. No other changes to the internal control over financial reporting occurred during the three and nine months ended Sept. 30, 2026 that materially affected, or are reasonably likely to materially affect, the Company's internal control over financial reporting. Management will continue to evaluate the Company's disclosure controls, procedures and internal control over financial reporting to make modifications as deemed necessary.
In accordance with the provisions of National Instrument (NI) 52-109 and consistent with U.S. Securities and Exchange Commission guidance, the scope of the evaluation did not include internal controls over financial reporting of Far North, which the Company acquired on Feb. 2, 2026. Far North was excluded from management's evaluation of the effectiveness of the Company's internal control over financial reporting as at Sept. 30, 2026, due to the proximity of the acquisition to the end of the reporting period. Further details related to the acquisition are disclosed in Note 3 of the condensed consolidated financial statements for the nine months ended Sept. 30, 2026. Far North's total and net assets represented approximately one and five per cent of the Company's total and net assets, respectively, as at Sept. 30, 2026 and two and three per cent of the Company's revenues and net earnings, respectively, for the nine months ended Sept. 30, 2026.
Management has evaluated, with the participation of our Chief Executive Officer and Chief Financial Officer, the effectiveness of our ICFR and DC&P as of the end of the period covered by this MD&A. Based on the foregoing evaluation, our Chief Executive Officer and Chief Financial Officer have concluded that, as at Sept. 30, 2026, the end of the period covered by this MD&A, our ICFR and DC&P were effective.