
Adtran Holdings NASDAQ: ADTN Q3 2026 financial results November 3, 2026

Financial results Q3 2026 Third quarter 2026
IMPORTANT INFORMATION Cautionary note regarding forward-looking statements Statements and graphics contained in this investor presentation which are not historical facts, such as those relating to market trends, future global optical demand, future demand across end markets, future demand driver growth (including with respect to expected engagements with pluggable optics, expansion of fiber networks, high-risk vendor replacement, demand for secure critical networks, and hyperscale demand for data center interconnect and next-generation connectivity), future gross margin percentage due to changing customer and product mix, future investment and other focus areas and cost-out actions, and ADTRAN Holdings’ strategy, outlook and financial guidance, are forward-looking statements within the meaning of the Private Securities Litigation Reform Act of 1995. Forward-looking statements can also generally be identified by the use of words such as “believe,” “expect,” “intend,” “estimate,” “anticipate,” “will,” “may,” “could,” “look forward,” and similar expressions. In addition, ADTRAN Holdings, through its senior management, may from time to time make forward-looking public statements concerning the matters described herein. All such projections and other forward-looking information speak only as of the date hereof, and ADTRAN Holdings undertakes no duty to publicly update or revise such forward-looking information, whether as a result of new information, future events, or otherwise, except to the extent as may be required by law. All such forward-looking statements are estimates and reflect management’s best judgment based upon current information. Actual events or results may differ materially from those anticipated in these forward-looking statements as a result of a variety of factors. While it is impossible to identify all such factors, factors which have caused and may in the future cause actual events or results to differ materially from those estimated by ADTRAN Holdings include, but are not limited to, those listed on the next page.
IMPORTANT INFORMATION Cautionary note regarding forward-looking statements (i) risks and uncertainties relating to our ability to remain in compliance with the covenants set forth in and satisfy the payment obligations under our credit agreement and convertible notes, to satisfy our payment obligations to Adtran Networks’ minority shareholders under the Domination and Profit and Loss Transfer Agreement between us and Adtran Networks (the “DPLTA”), and to make payments to Adtran Networks in order to absorb its annual net loss pursuant to the DPLTA; (ii) the risk of fluctuations in revenue due to lengthy sales and approval processes required by major and other service providers for new products, as well as shifting customer spending patterns; (iii) risks and uncertainties related to our inventory practices and ability to match customer demand; (iv) risks and uncertainties relating to our level of indebtedness and our ability to generate cash; (v) risks and uncertainties relating to ongoing material weaknesses in our internal control over financial reporting; (vi) risks posed by changes in general economic conditions and monetary, fiscal and trade policies, including tariffs; (vii) risks and uncertainties relating to our international operations, including potential exposure to ongoing military conflicts (including the conflicts in Iran, Ukraine, and Israel and the surrounding areas); (viii) risks posed by potential breaches of information systems and cyber-attacks; (ix) the risk that we may not be able to effectively compete, including through product improvements and development; and (x) the other risks set forth in our public filings made with the Securities and Exchange Commission (the “SEC”), including our most recent Annual Report on Form 10-K for the year ended December 31, 2025, our Forms 10-Q for the quarterly periods ended March 31, 2026, our Form 10-Q for the quarterly period ended June 30, 2026 and our Form 10-Q for the quarterly period ended September 30, 2026 to be filed with the SEC
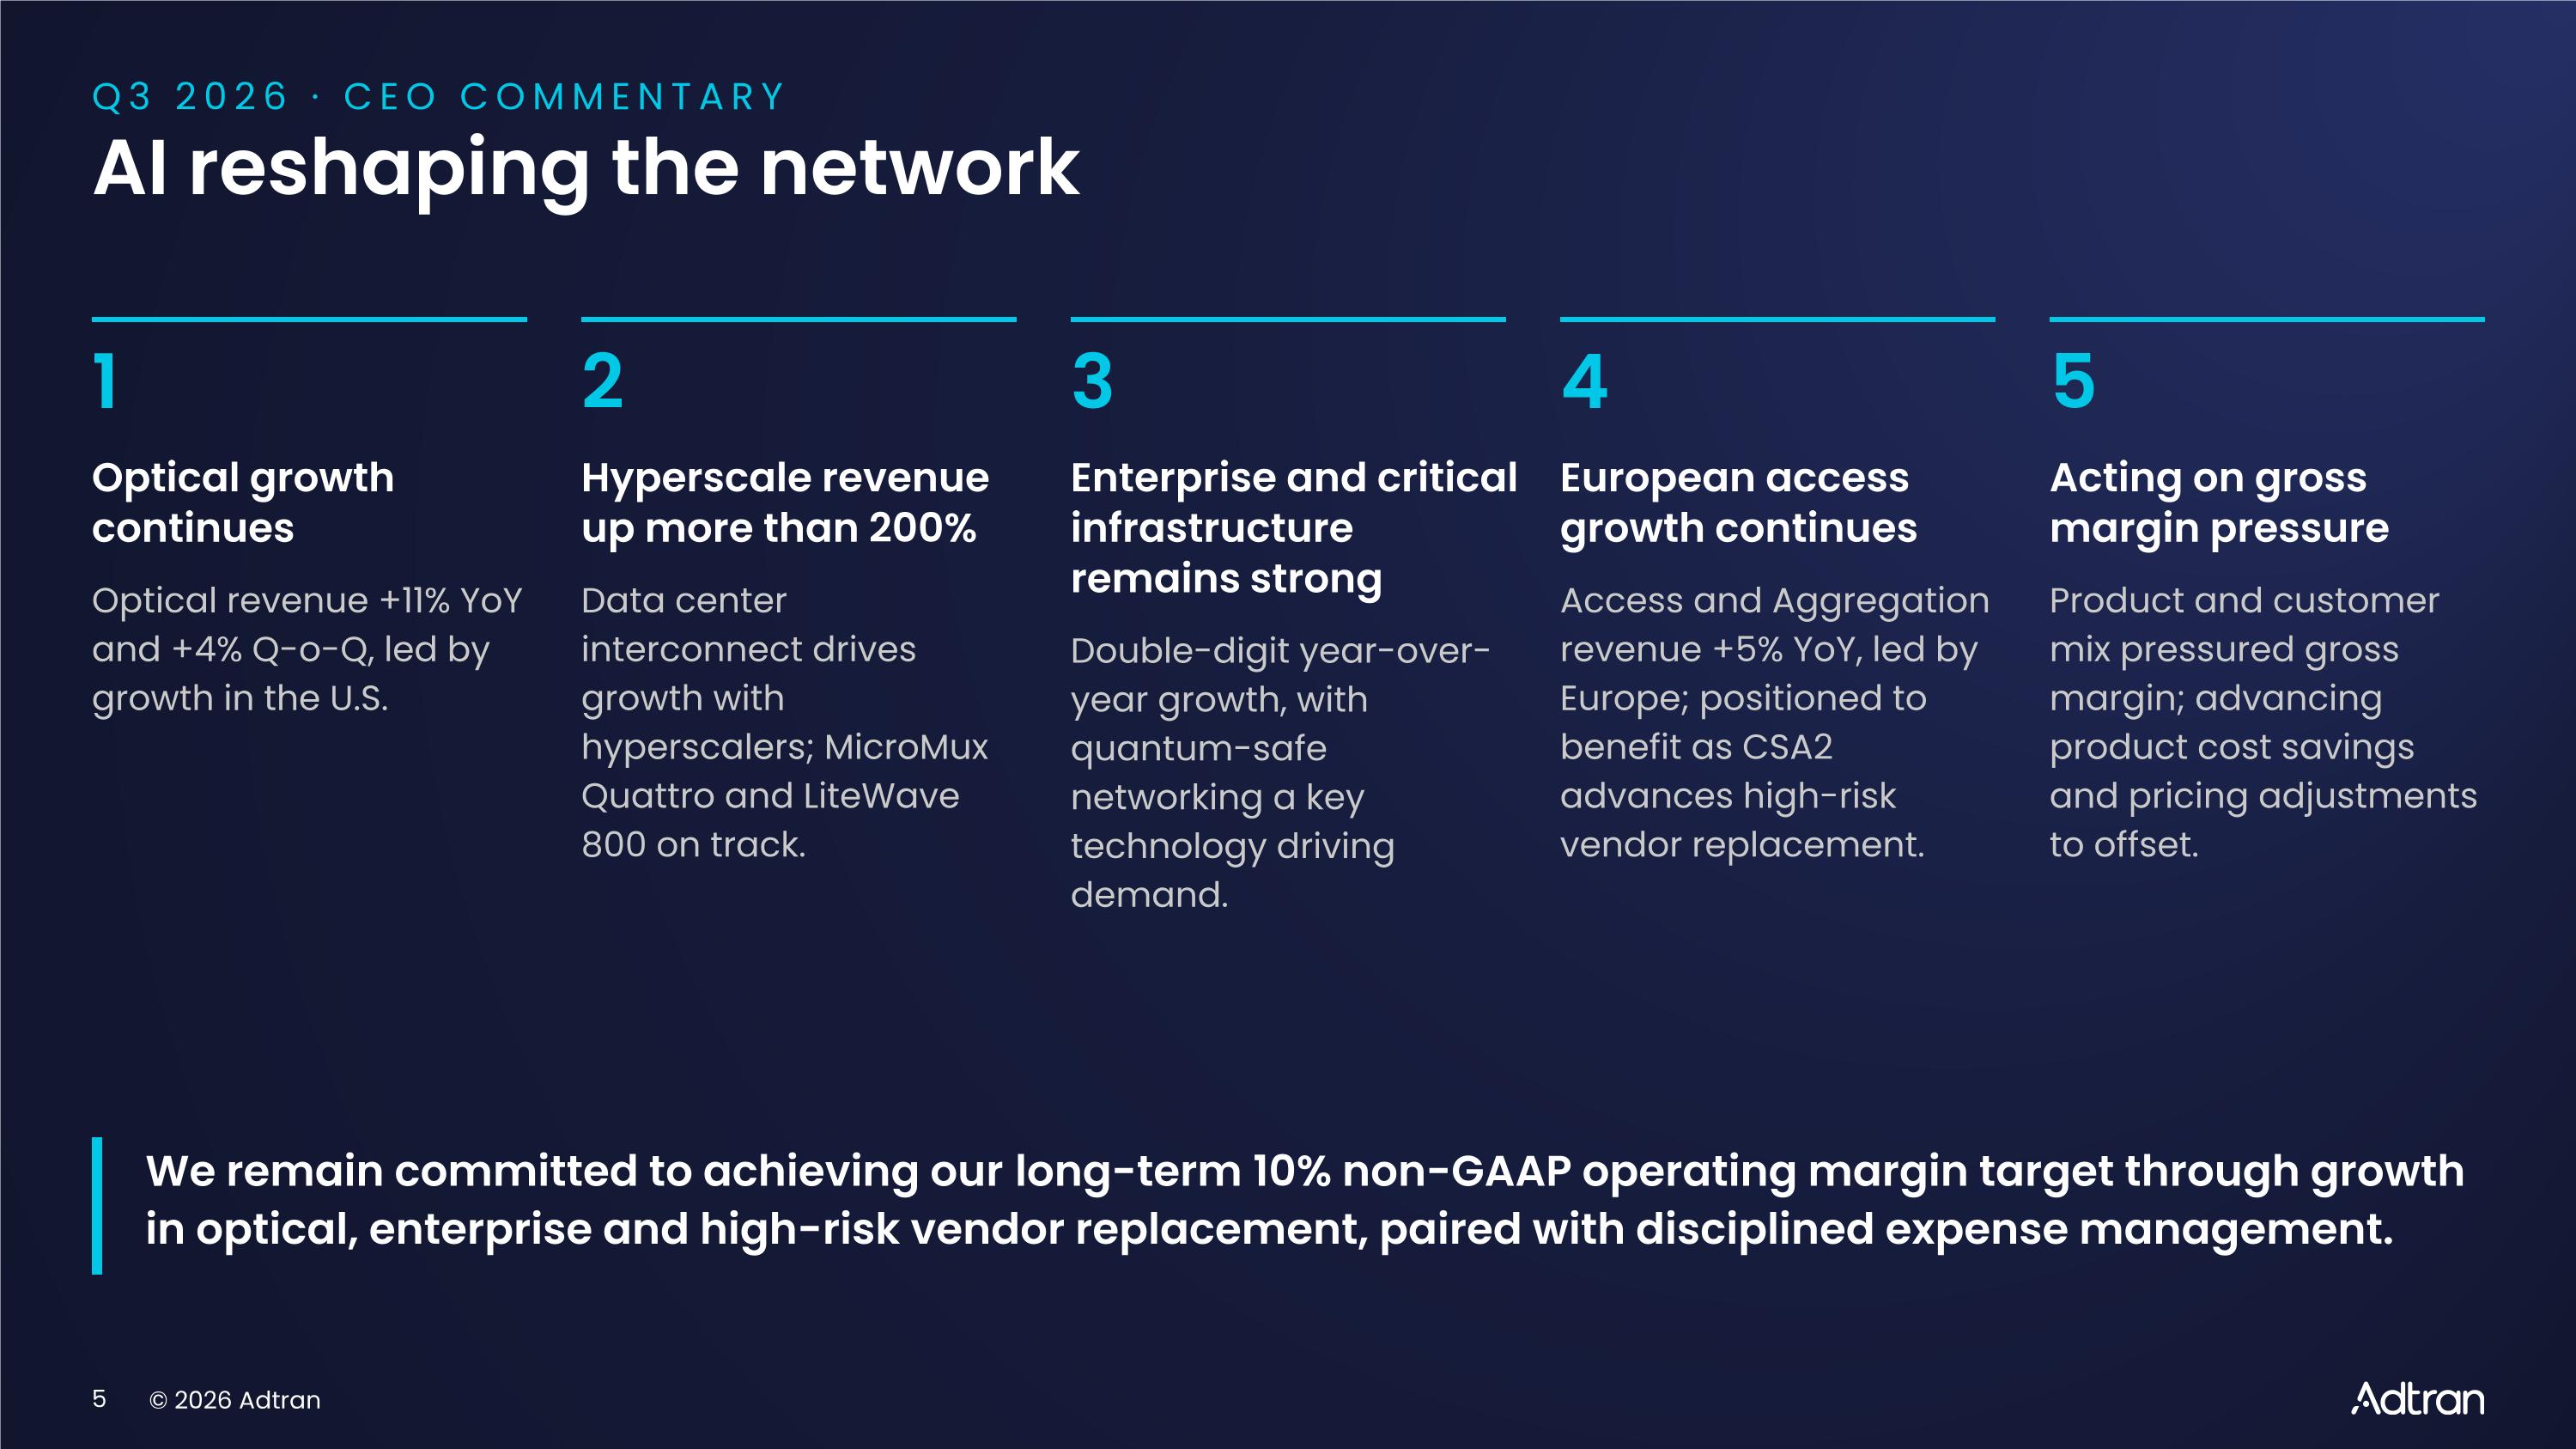
Q3 2026 · CEO COMMENTARY AI reshaping the network 1 Optical growth continues Optical revenue +11% YoY and +4% Q-o-Q, led by growth in the U.S. 2 Hyperscale revenue up more than 200% Data center interconnect drives growth with hyperscalers; MicroMux Quattro and LiteWave 800 on track. 3 Enterprise and critical infrastructure remains strong Double-digit year-over-year growth, with quantum-safe networking a key technology driving demand. 4 European access growth continues Access and Aggregation revenue +5% YoY, led by Europe; positioned to benefit as CSA2 advances high-risk vendor replacement. 5 Acting on gross margin pressure Product and customer mix pressured gross margin; advancing product cost savings and pricing adjustments to offset. We remain committed to achieving our long-term 10% non-GAAP operating margin target through growth in optical, enterprise and high-risk vendor replacement, paired with disciplined expense management.
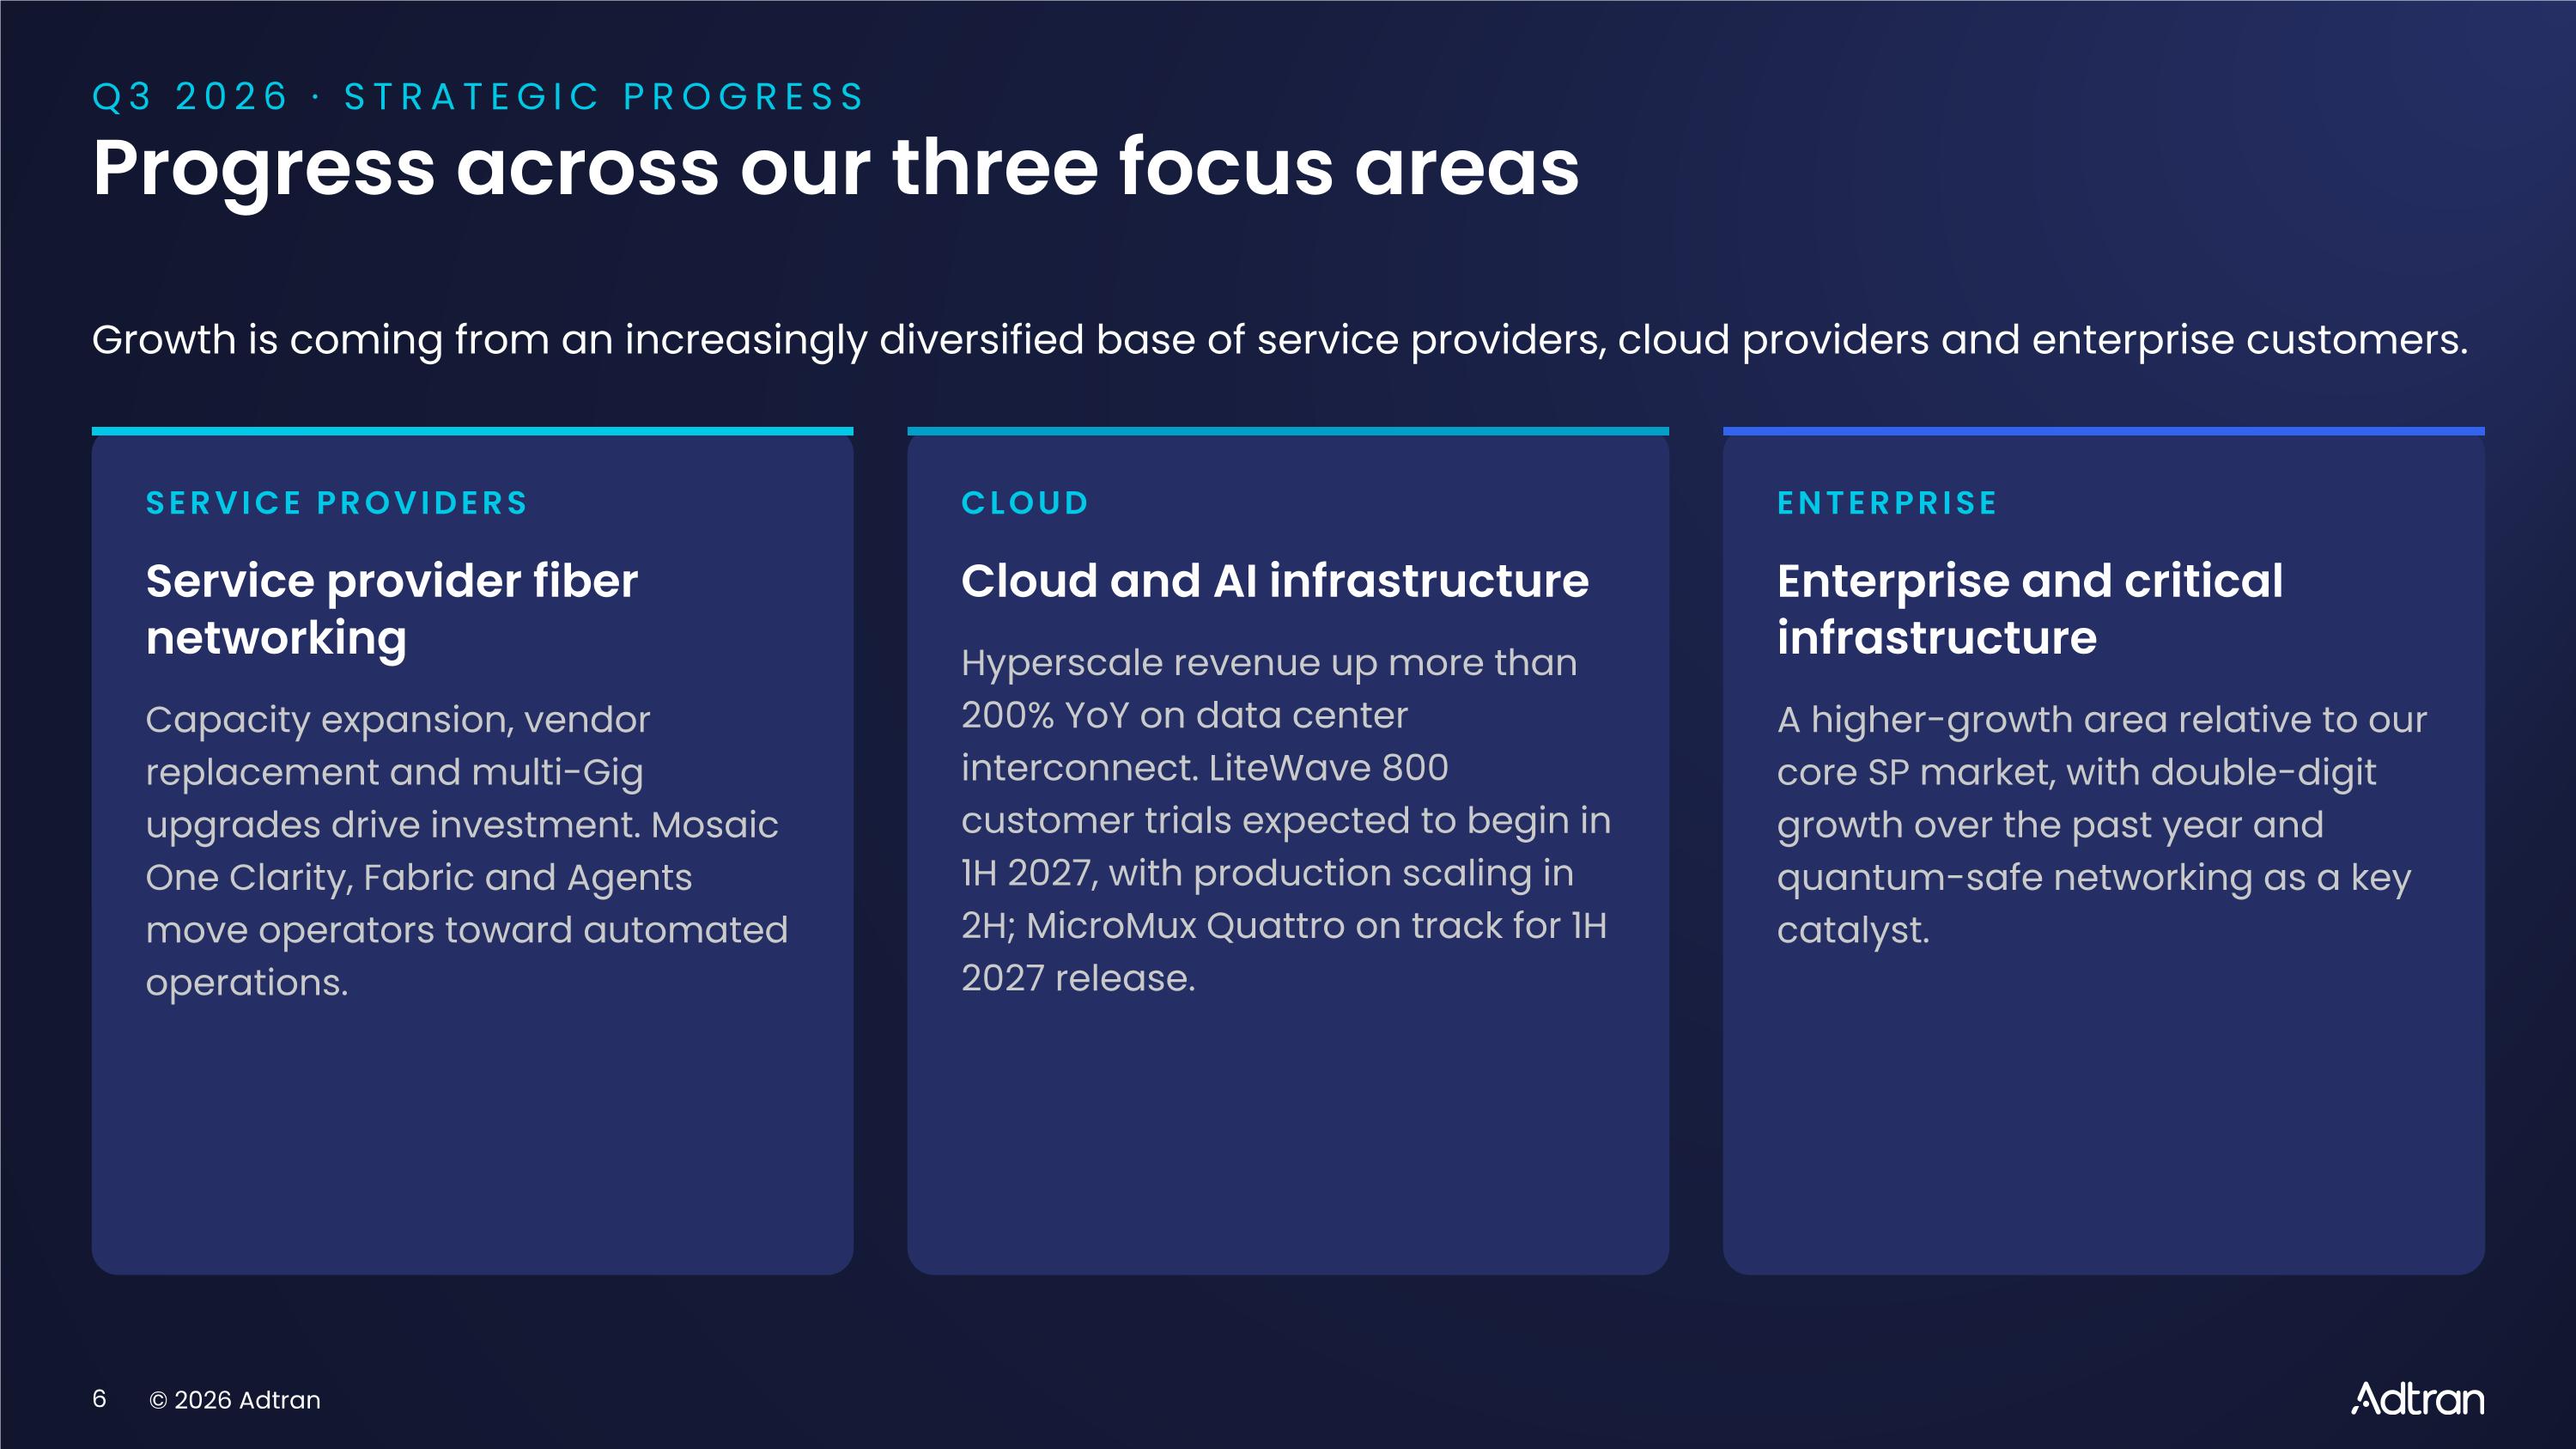
Q3 2026 · STRATEGIC PROGRESS Progress across our three focus areas Growth is coming from an increasingly diversified base of service providers, cloud providers and enterprise customers. SERVICE PROVIDERS Service provider fiber networking Capacity expansion, vendor replacement and multi-Gig upgrades drive investment. Mosaic One Clarity, Fabric and Agents move operators toward automated operations. CLOUD Cloud and AI infrastructure Hyperscale revenue up more than 200% YoY on data center interconnect. LiteWave 800 customer trials expected to begin in 1H 2027, with production scaling in 2H; MicroMux Quattro on track for 1H 2027 release. ENTERPRISE Enterprise and critical infrastructure A higher-growth area relative to our core SP market, with double-digit growth over the past year and quantum-safe networking as a key catalyst.
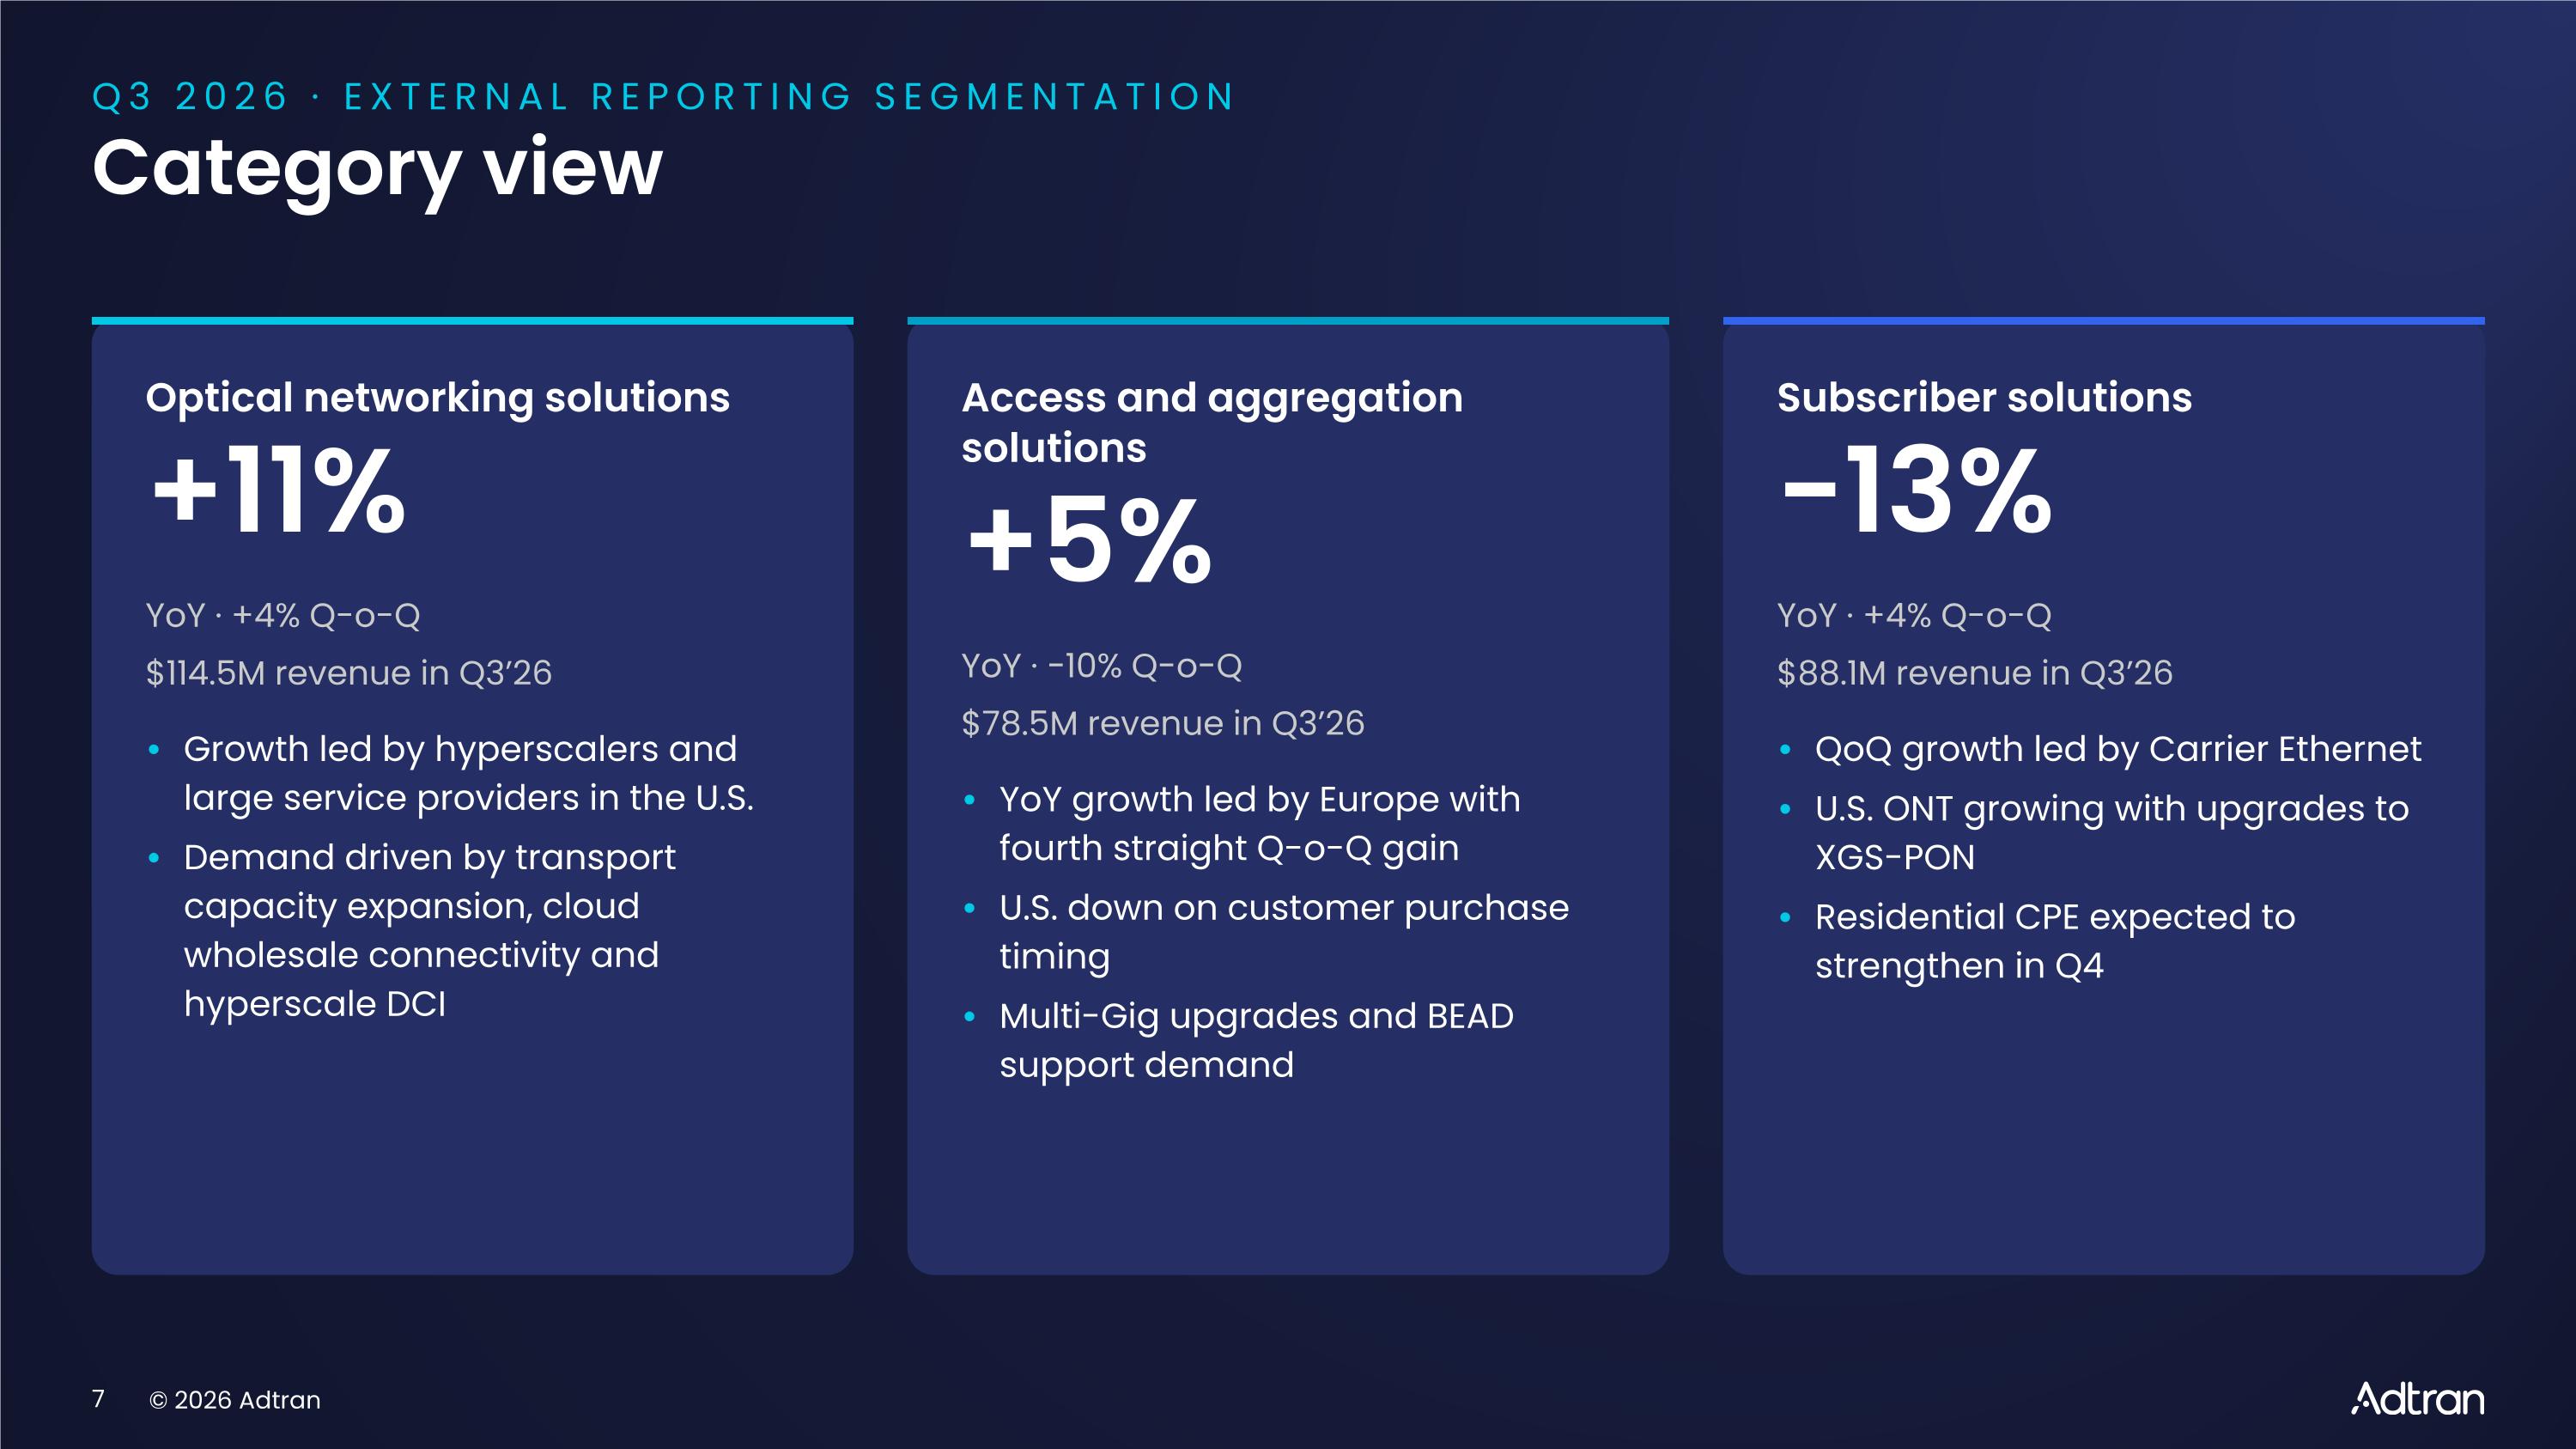
Q3 2026 · EXTERNAL REPORTING SEGMENTATION Category view Optical networking solutions +11% YoY · +4% Q-o-Q $114.5M revenue in Q3’26 • Growth led by hyperscalers and large service providers in the U.S. • Demand driven by transport capacity expansion, cloud wholesale connectivity and hyperscale DCI Access and aggregation solutions +5% YoY · −10% Q-o-Q $78.5M revenue in Q3’26 • YoY growth led by Europe with fourth straight Q-o-Q gain • U.S. down on customer purchase timing • Multi-Gig upgrades and BEAD support demand Subscriber solutions −13% YoY · +4% Q-o-Q $88.1M revenue in Q3’26 • QoQ growth led by Carrier Ethernet • U.S. ONT growing with upgrades to XGS-PON • Residential CPE expected to strengthen in Q4
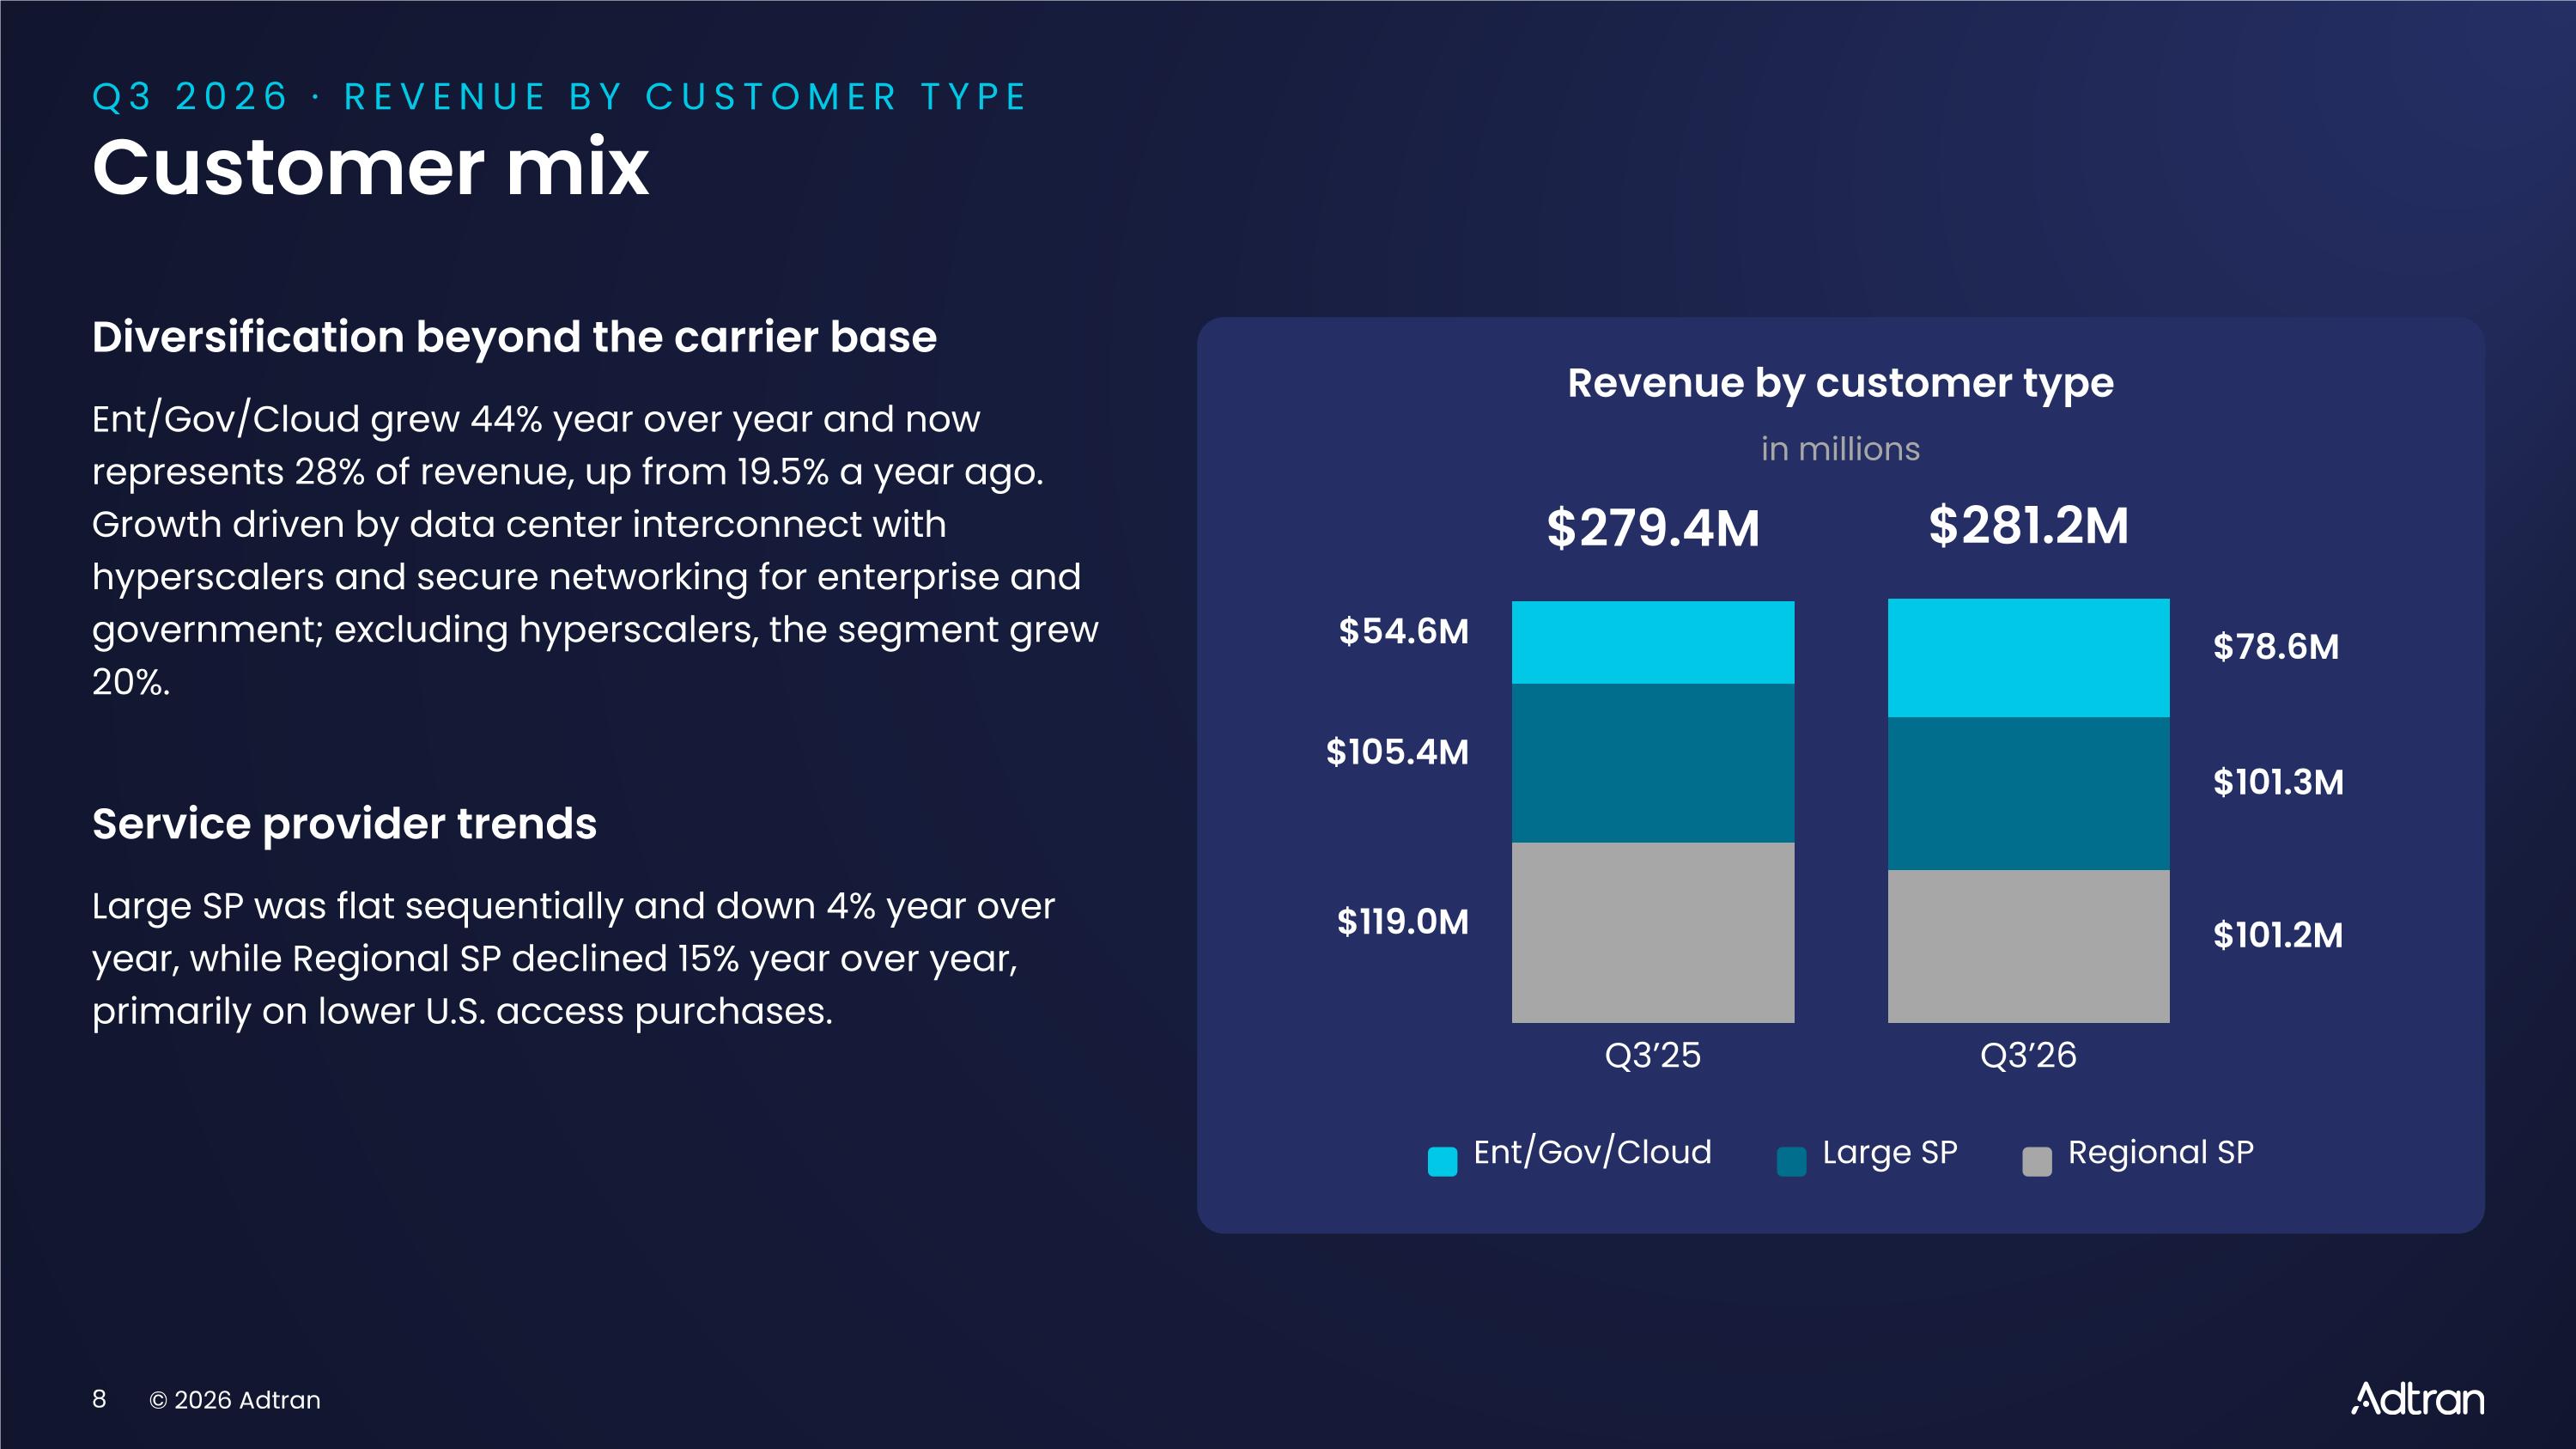
Q3 2026 · REVENUE BY CUSTOMER TYPE Customer mix Diversification beyond the carrier base Ent/Gov/Cloud grew 44% year over year and now represents 28% of revenue, up from 19.5% a year ago. Growth driven by data center interconnect with hyperscalers and secure networking for enterprise and government; excluding hyperscalers, the segment grew 20%. Service provider trends Large SP was flat sequentially and down 4% year over year, while Regional SP declined 15% year over year, primarily on lower U.S. access purchases. Revenue by customer type in millions $54.6M $105.4M $119.0M $279.4M Q3’25 $281.2M Q3’26 $78.6M $101.3M $101.2M Ent/Gov/Cloud Large SP Regional SP
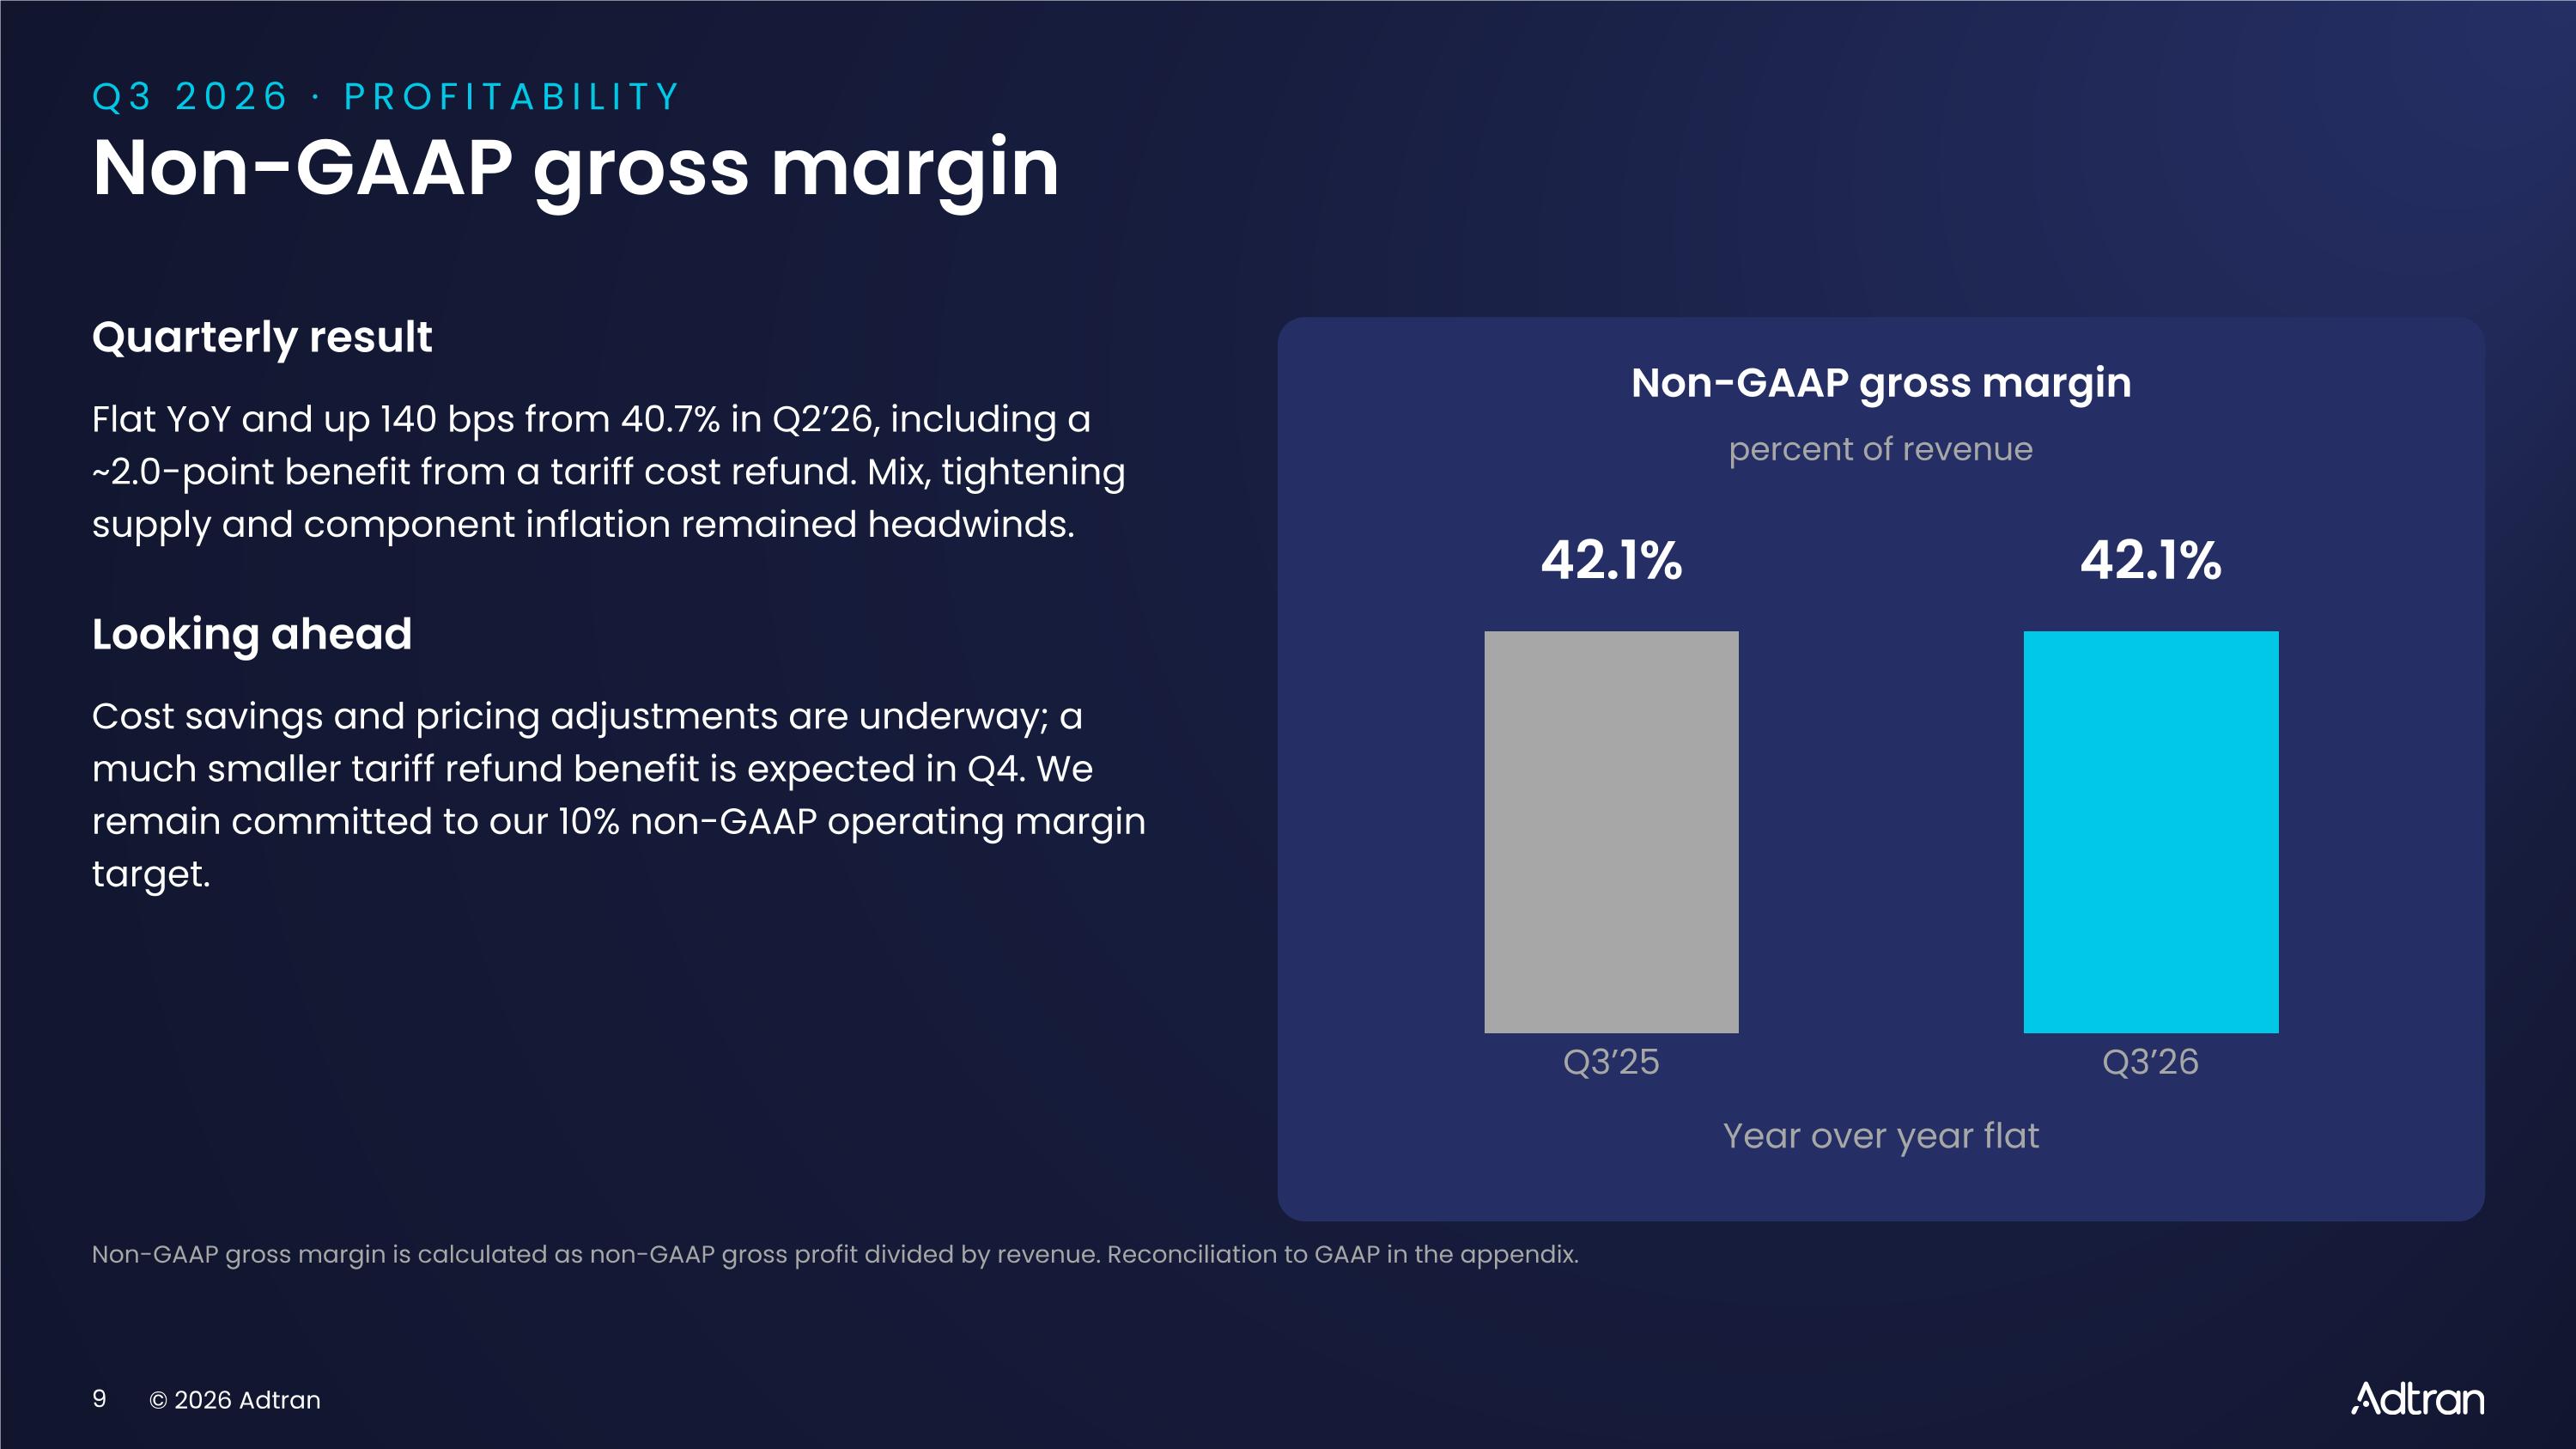
Q3 2026 · PROFITABILITY Non-GAAP gross margin Quarterly result Flat YoY and up 140 bps from 40.7% in Q2’26, including a ~2.0-point benefit from a tariff cost refund. Mix, tightening supply and component inflation remained headwinds. Looking ahead Cost savings and pricing adjustments are underway; a much smaller tariff refund benefit is expected in Q4. We remain committed to our 10% non-GAAP operating margin target. Non-GAAP gross margin percent of revenue 42.1% Q3’25 42.1% Q3’26 Year over year flat Non-GAAP gross margin is calculated as non-GAAP gross profit divided by revenue. Reconciliation to GAAP in the appendix.
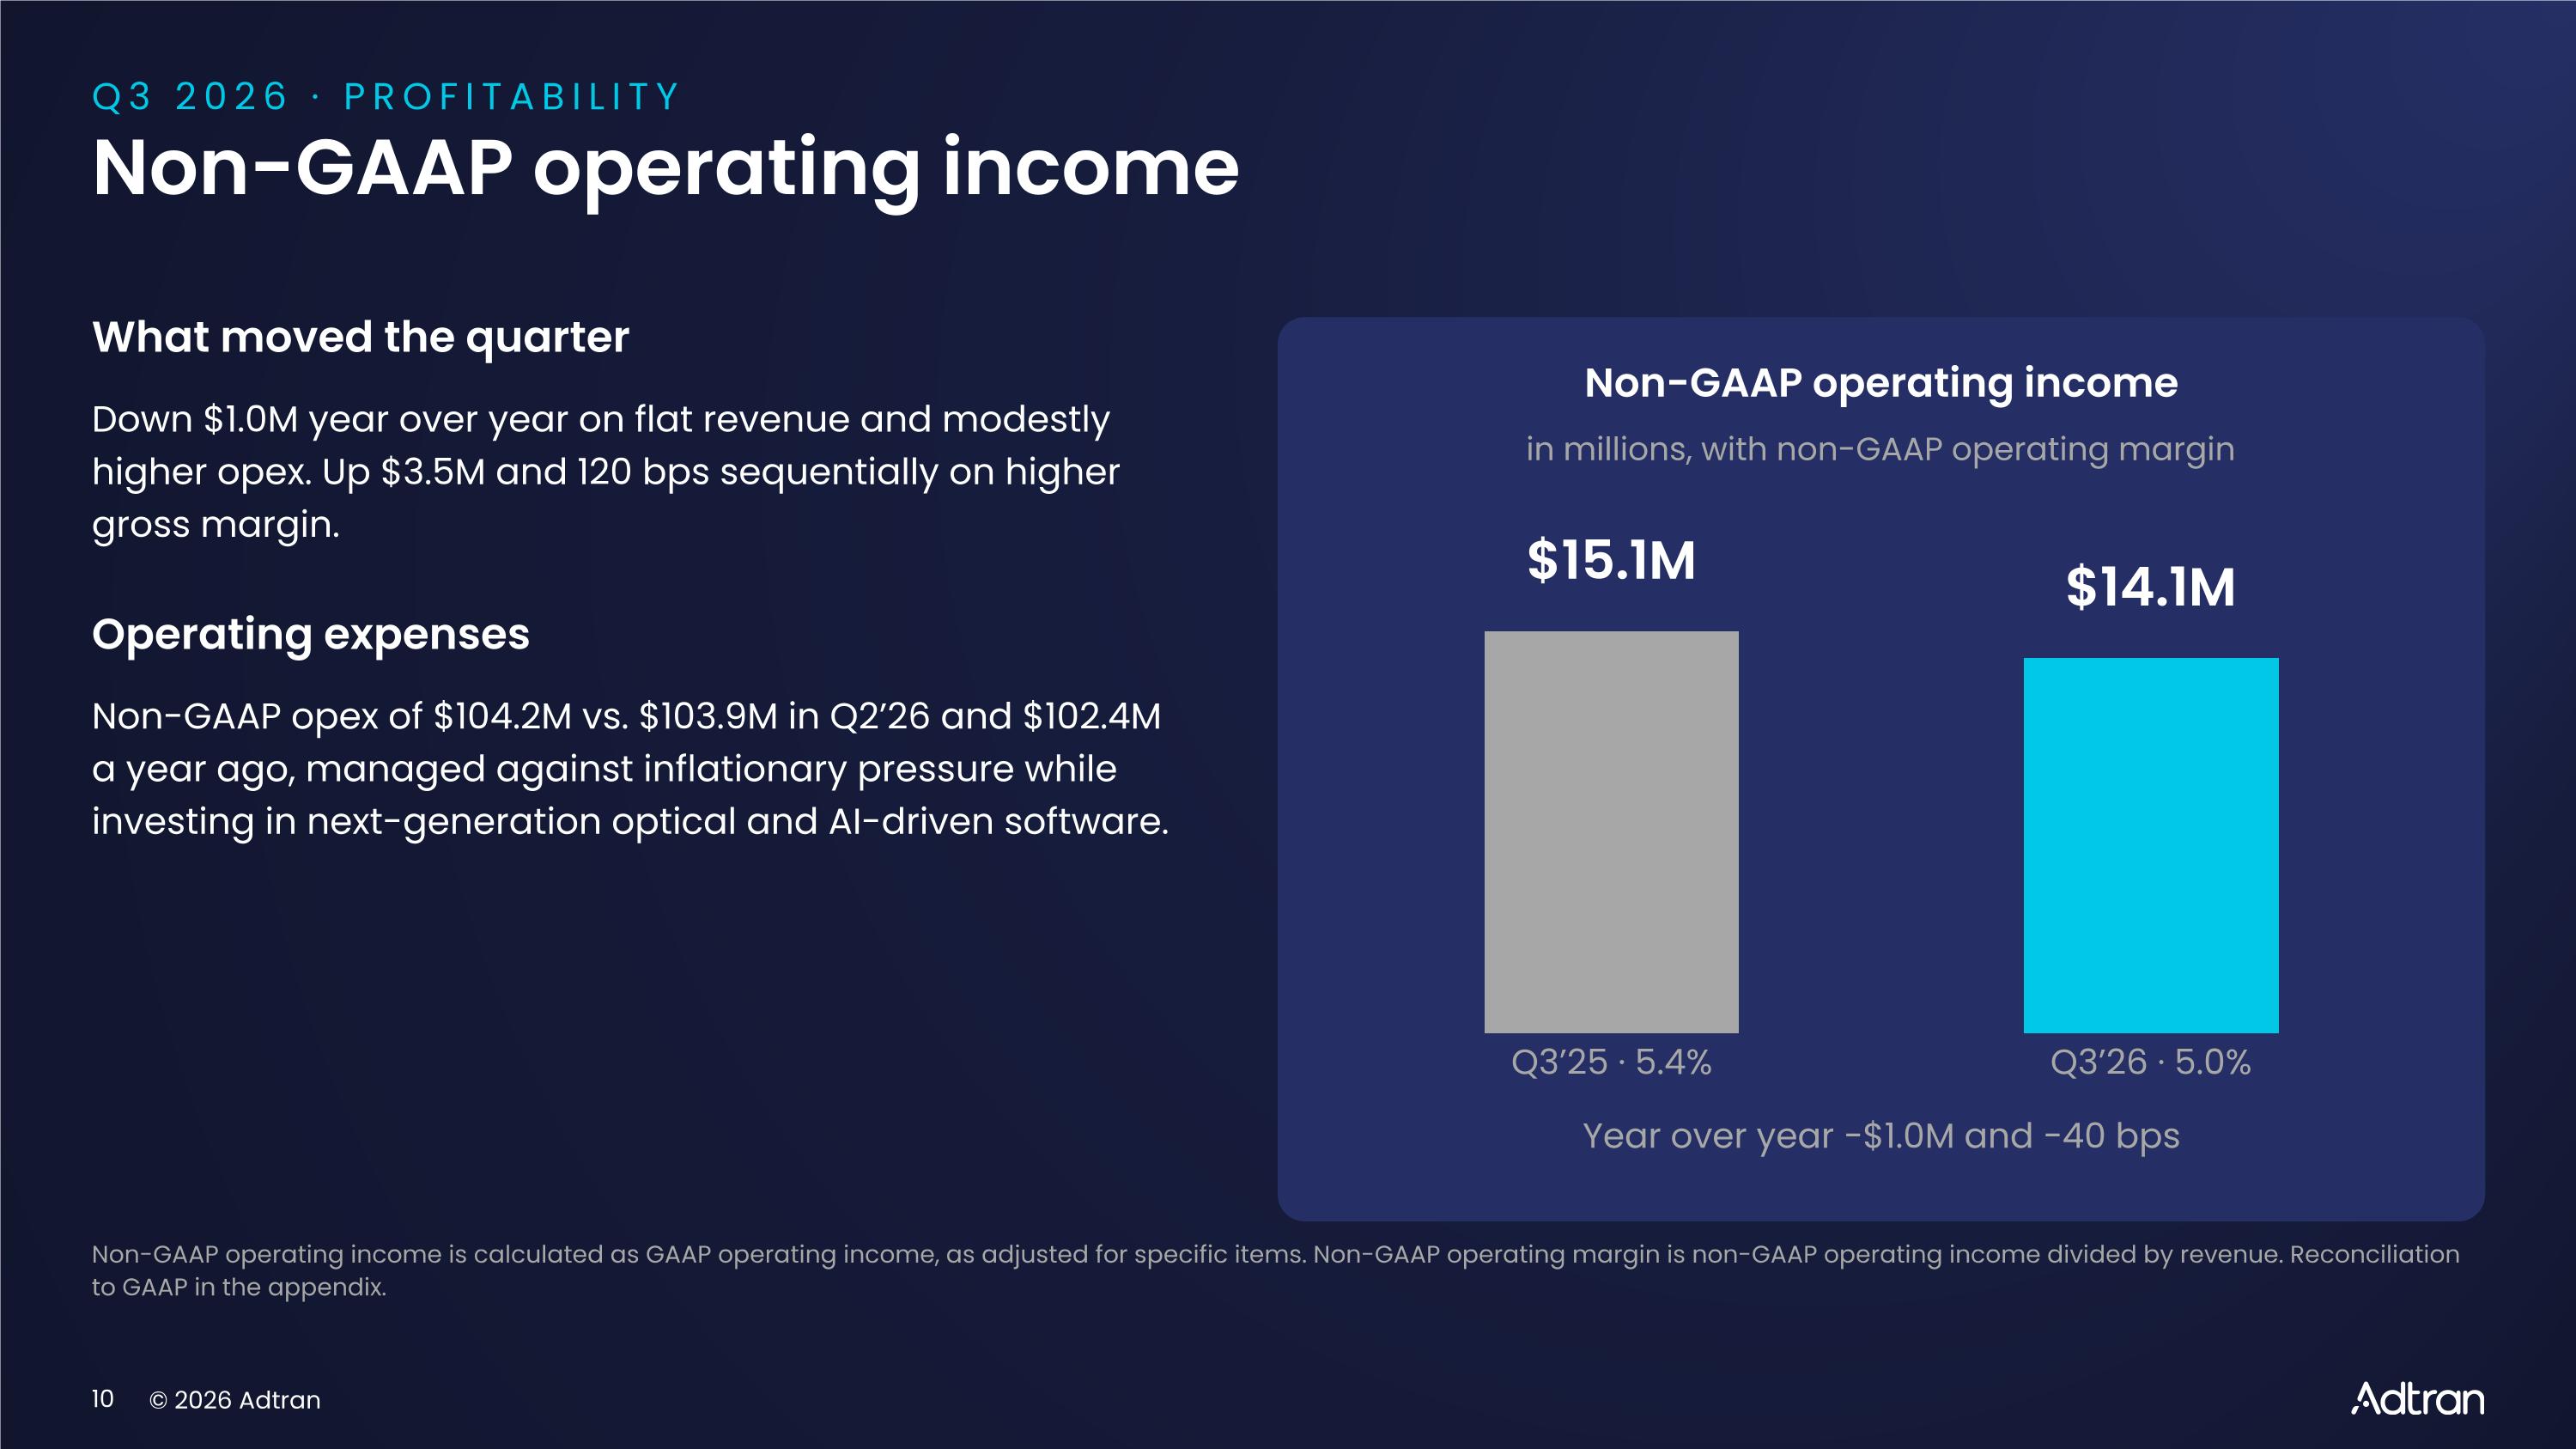
Q3 2026 · PROFITABILITY Non-GAAP operating income What moved the quarter Down $1.0M year over year on flat revenue and modestly higher opex. Up $3.5M and 120 bps sequentially on higher gross margin. Operating expenses Non-GAAP opex of $104.2M vs. $103.9M in Q2’26 and $102.4M a year ago, managed against inflationary pressure while investing in next-generation optical and AI-driven software. Non-GAAP operating income in millions, with non-GAAP operating margin $15.1M Q3’25 · 5.4% $14.1M Q3’26 · 5.0% Year over year −$1.0M and −40 bps Non-GAAP operating income is calculated as GAAP operating income, as adjusted for specific items. Non-GAAP operating margin is non-GAAP operating income divided by revenue. Reconciliation to GAAP in the appendix.
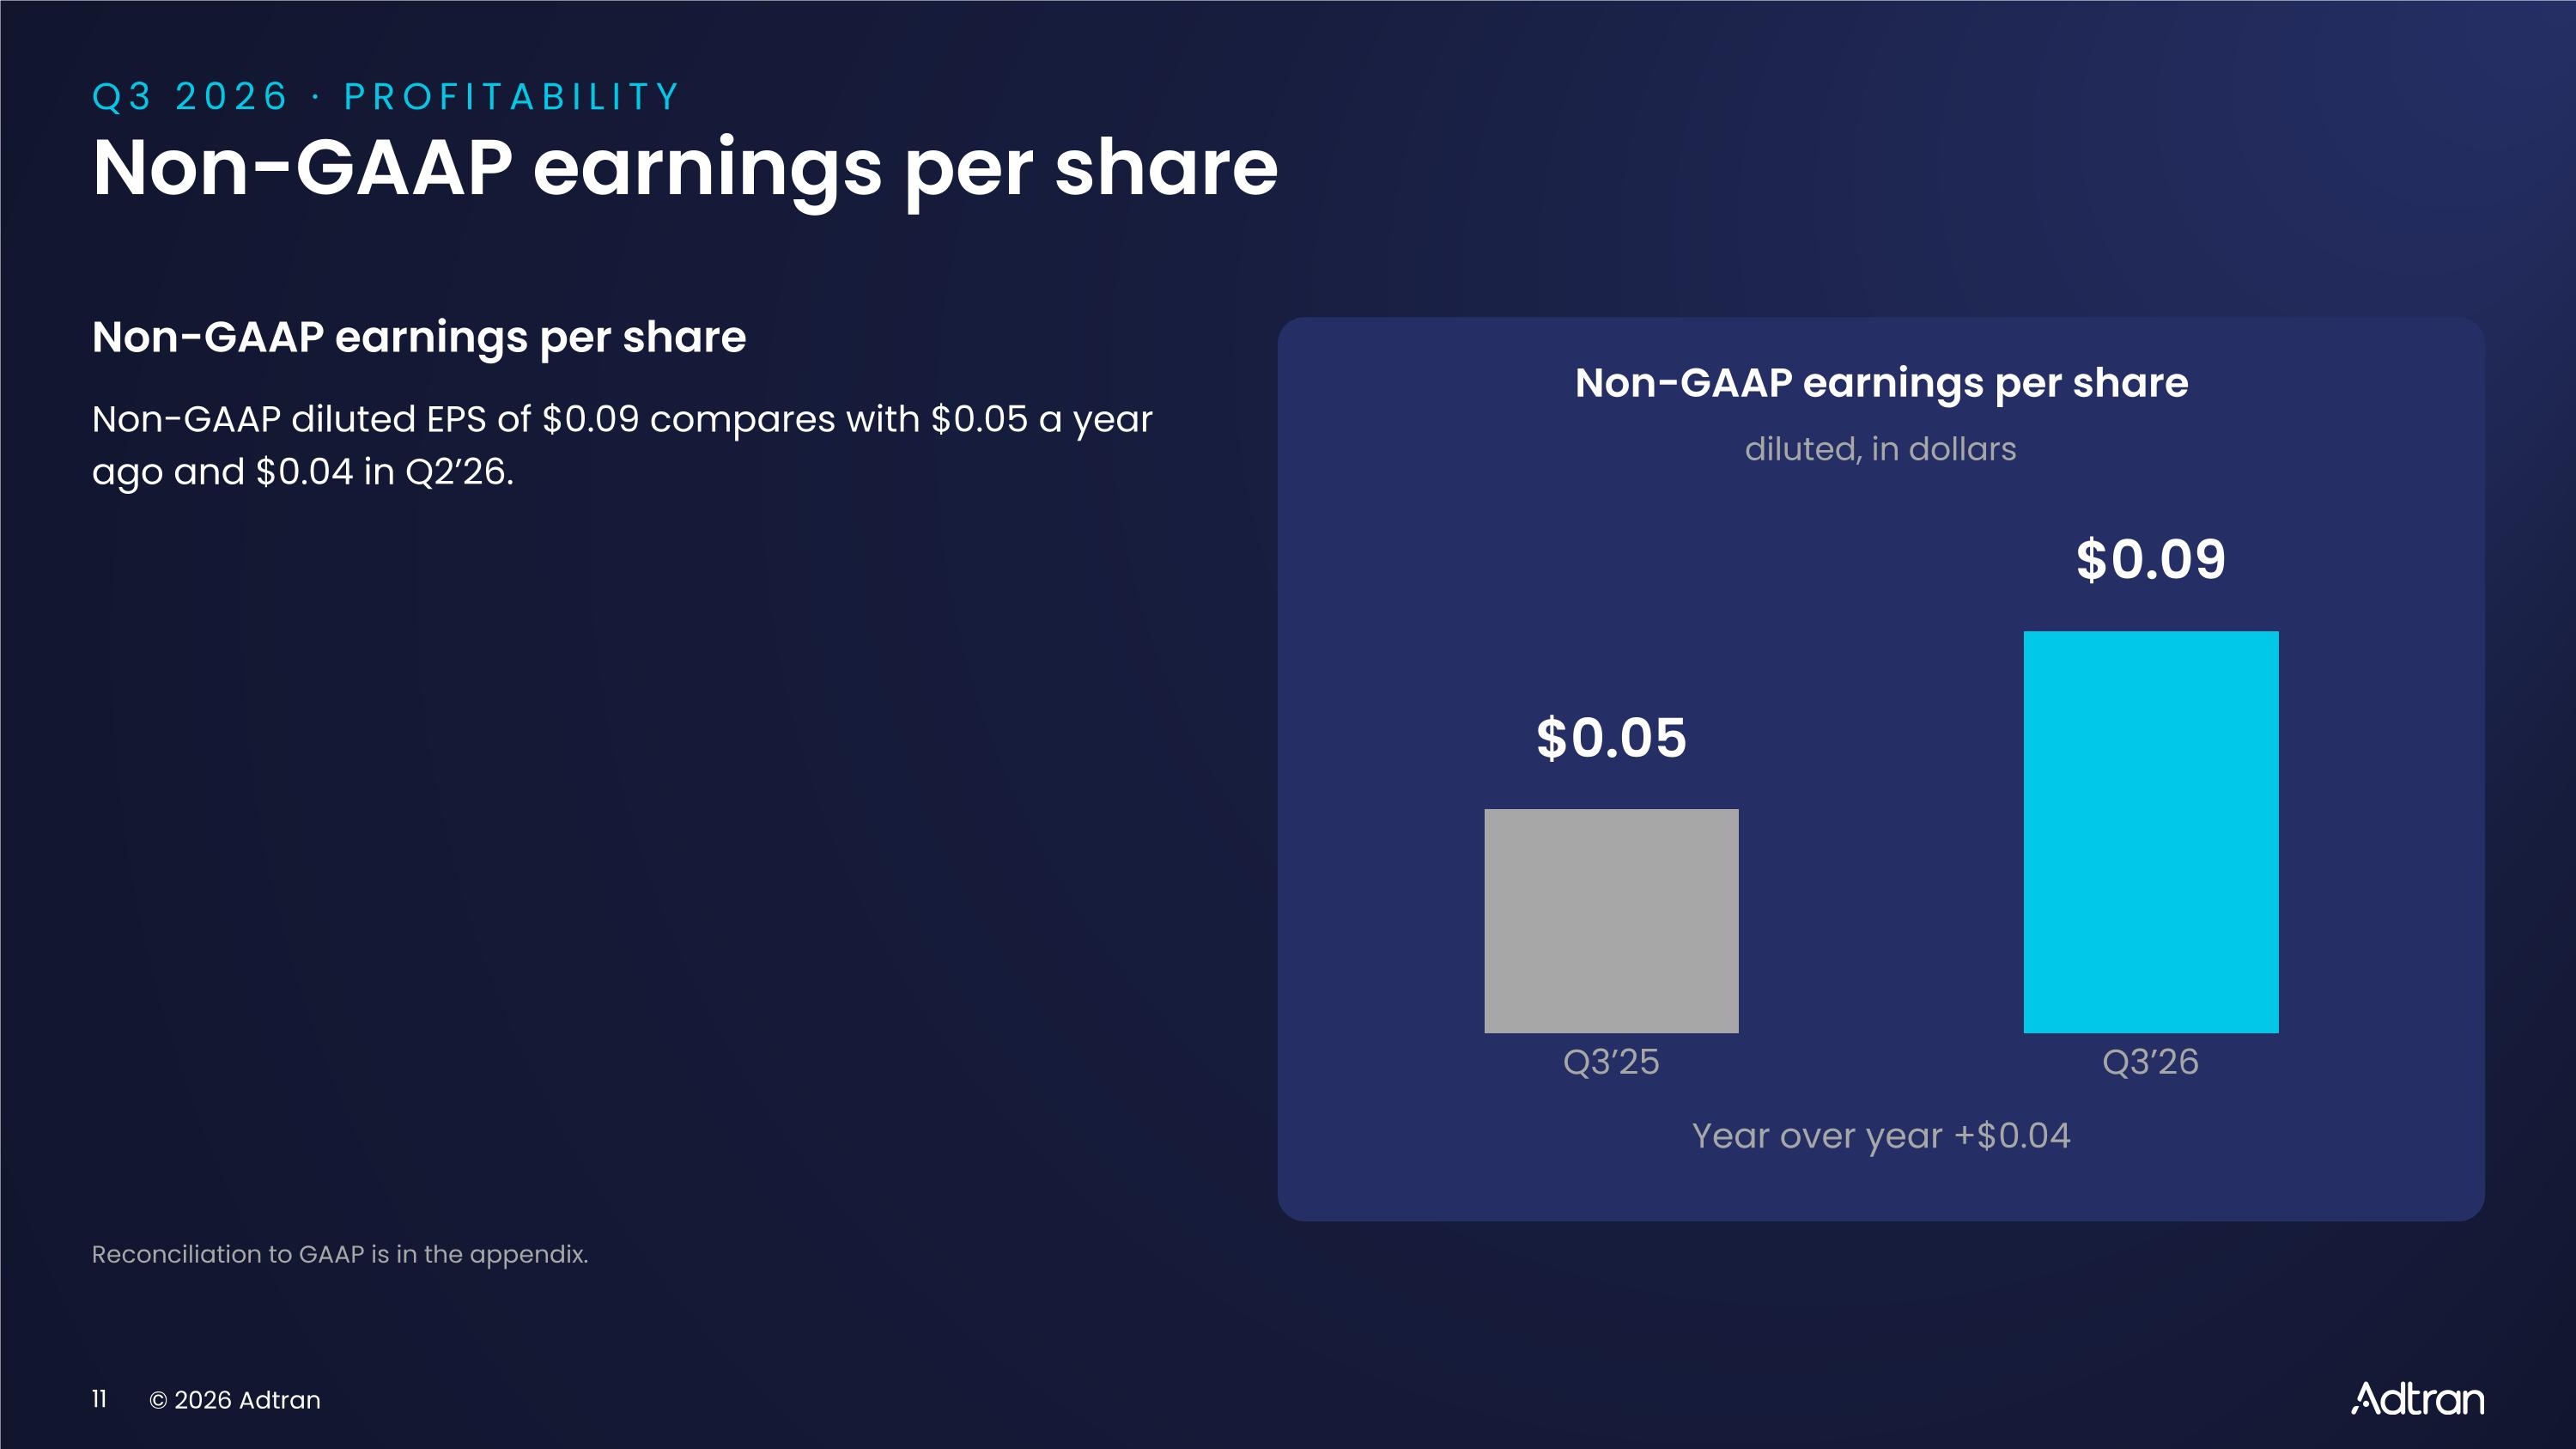
Q3 2026 · PROFITABILITY Non-GAAP earnings per share Non-GAAP earnings per share Non-GAAP diluted EPS of $0.09 compares with $0.05 a year ago and $0.04 in Q2’26. Non-GAAP earnings per share diluted, in dollars $0.05 Q3’25 $0.09 Q3’26 Year over year +$0.04 Reconciliation to GAAP is in the appendix.
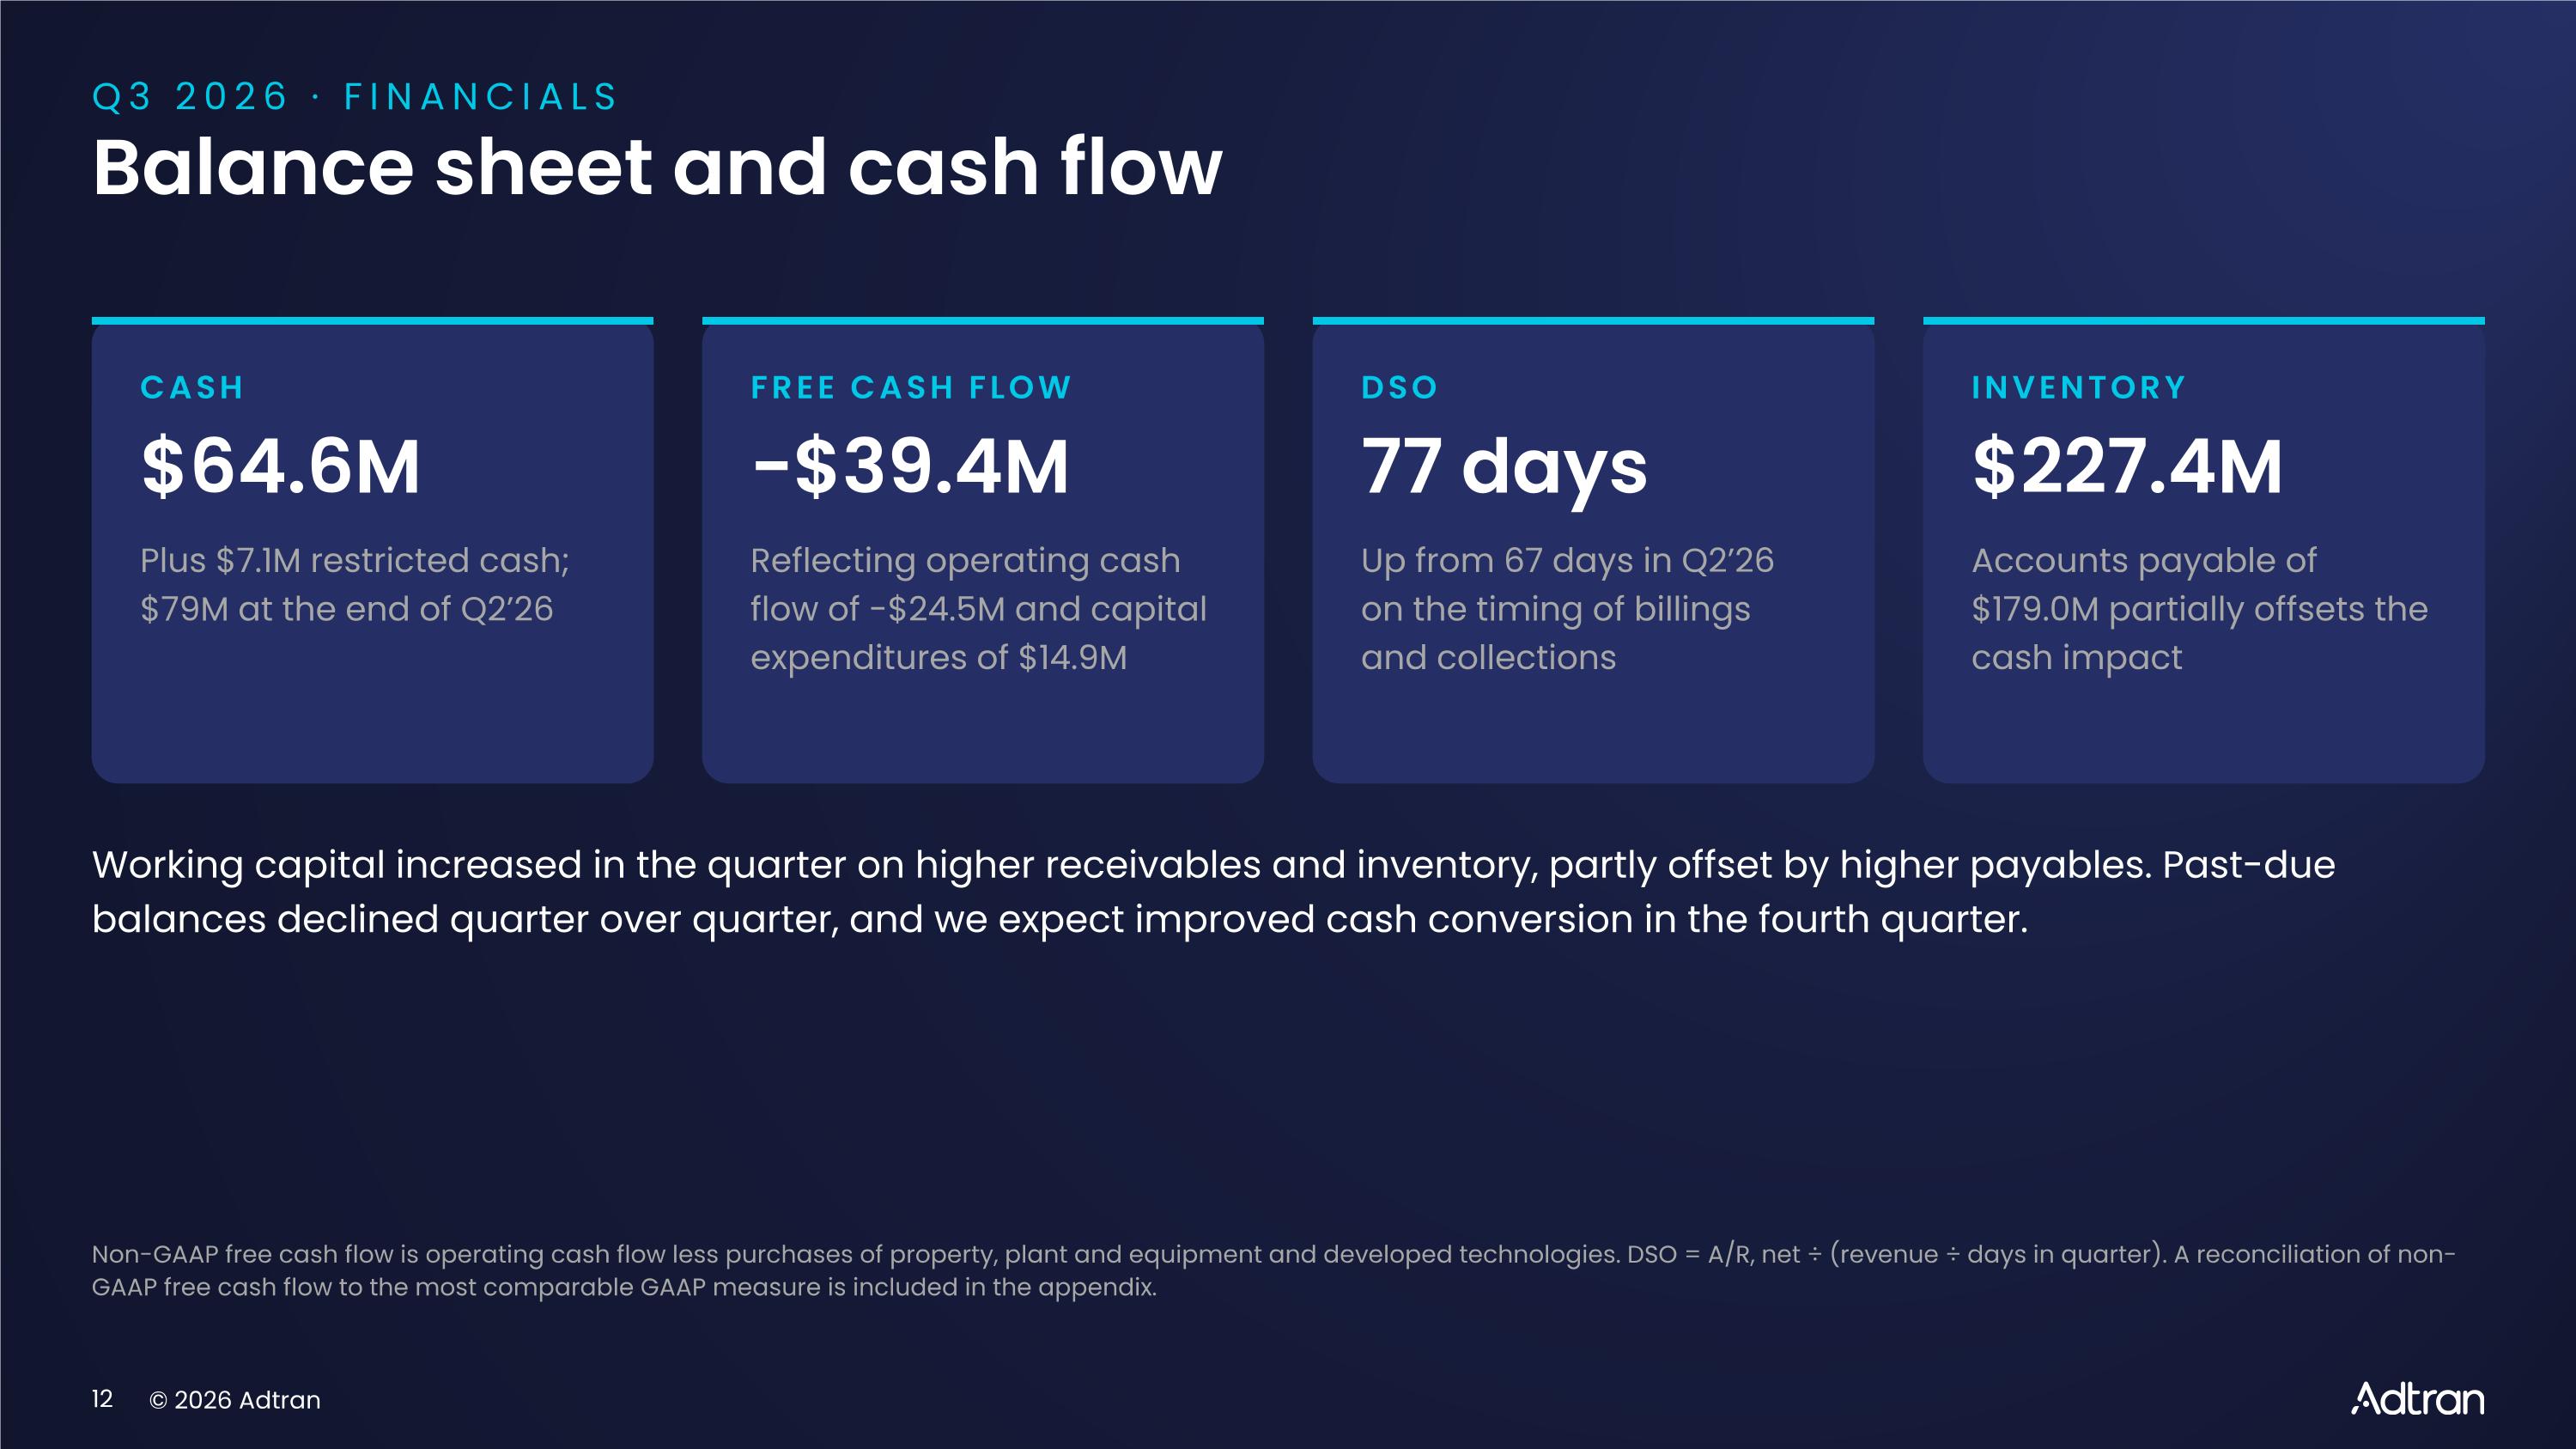
Q3 2026 · FINANCIALS Balance sheet and cash flow CASH $64.6M Plus $7.1M restricted cash; $79M at the end of Q2’26 FREE CASH FLOW −$39.4M Reflecting operating cash flow of -$24.5M and capital expenditures of $14.9M DSO 77 days Up from 67 days in Q2’26 on the timing of billings and collections INVENTORY $227.4M Accounts payable of $179.0M partially offsets the cash impact Working capital increased in the quarter on higher receivables and inventory, partly offset by higher payables. Past-due balances declined quarter over quarter, and we expect improved cash conversion in the fourth quarter. Non-GAAP free cash flow is operating cash flow less purchases of property, plant and equipment and developed technologies. DSO = A/R, net ÷ (revenue ÷ days in quarter). A reconciliation of non-GAAP free cash flow to the most comparable GAAP measure is included in the appendix.
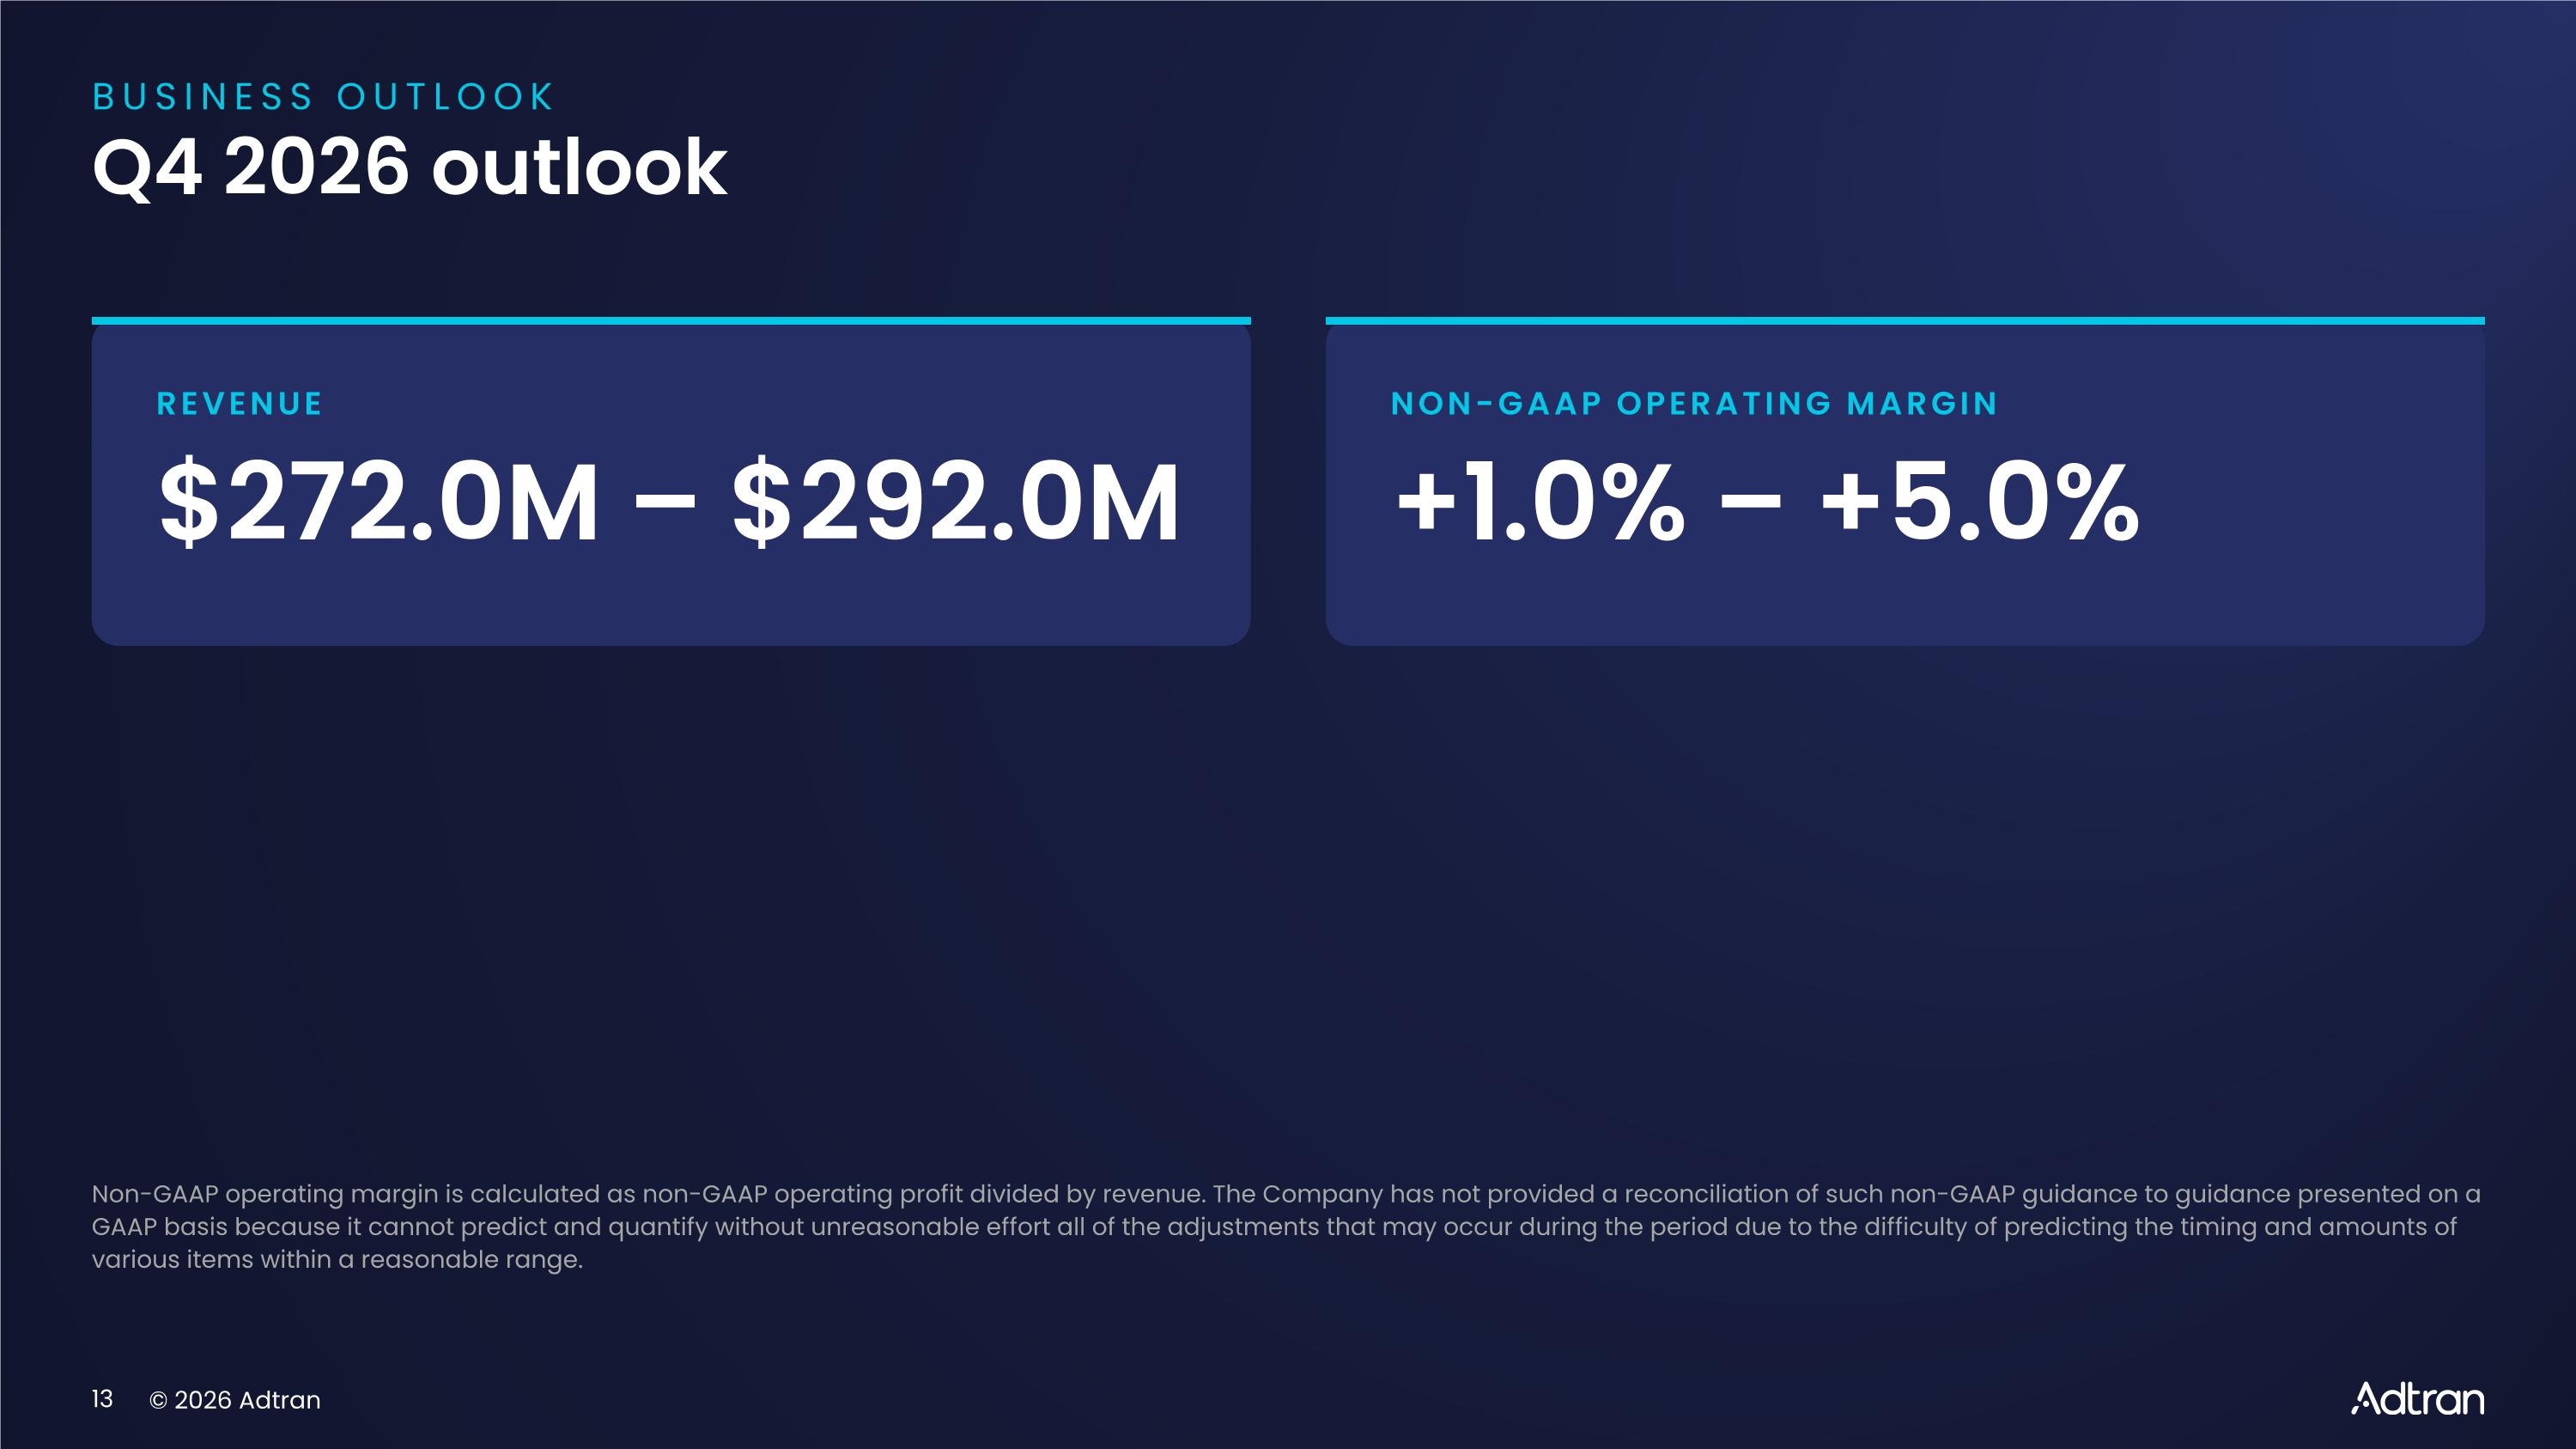
BUSINESS OUTLOOK Q4 2026 outlook REVENUE $272.0M – $292.0M NON-GAAP OPERATING MARGIN +1.0% – +5.0% Non-GAAP operating margin is calculated as non-GAAP operating profit divided by revenue. The Company has not provided a reconciliation of such non-GAAP guidance to guidance presented on a GAAP basis because it cannot predict and quantify without unreasonable effort all of the adjustments that may occur during the period due to the difficulty of predicting the timing and amounts of various items within a reasonable range.

Business focus areas STRATEGY Where we are investing for growth
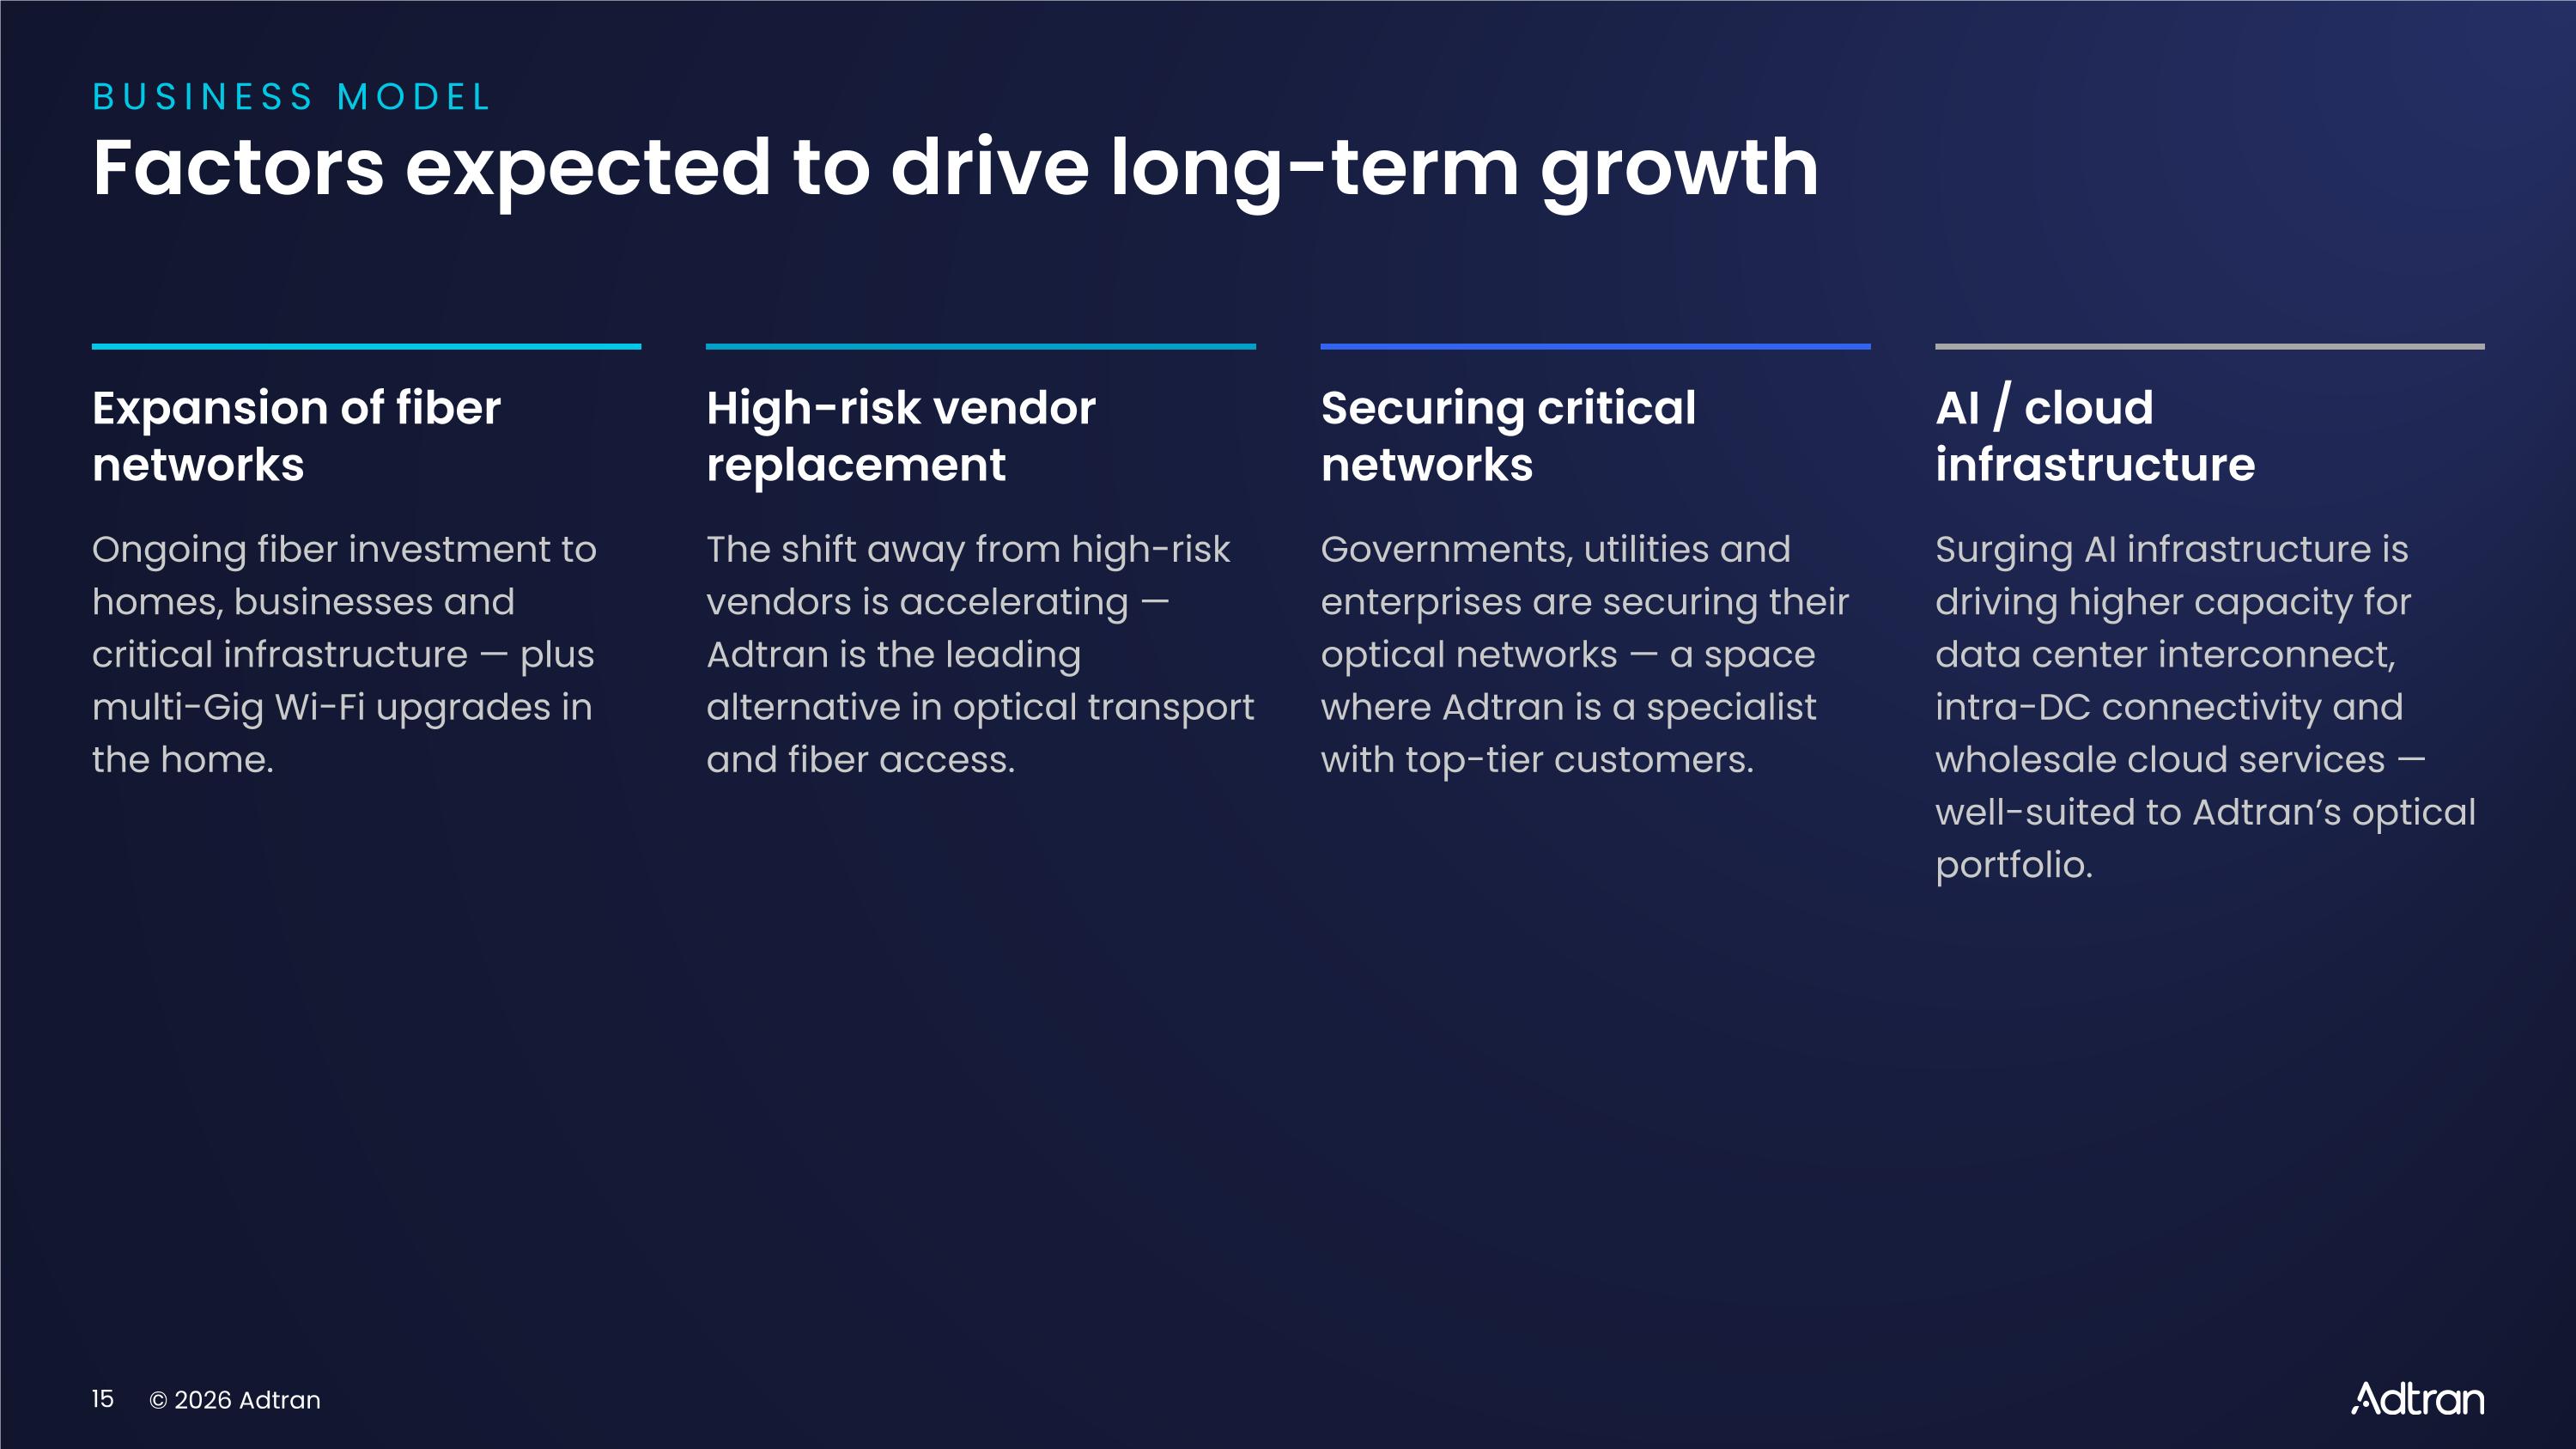
BUSINESS MODEL Factors expected to drive long-term growth Expansion of fiber networks Ongoing fiber investment to homes, businesses and critical infrastructure — plus multi-Gig Wi-Fi upgrades in the home. High-risk vendor replacement The shift away from high-risk vendors is accelerating — Adtran is the leading alternative in optical transport and fiber access. Securing critical networks Governments, utilities and enterprises are securing their optical networks — a space where Adtran is a specialist with top-tier customers. AI / cloud infrastructure Surging AI infrastructure is driving higher capacity for data center interconnect, intra-DC connectivity and wholesale cloud services — well-suited to Adtran’s optical portfolio.
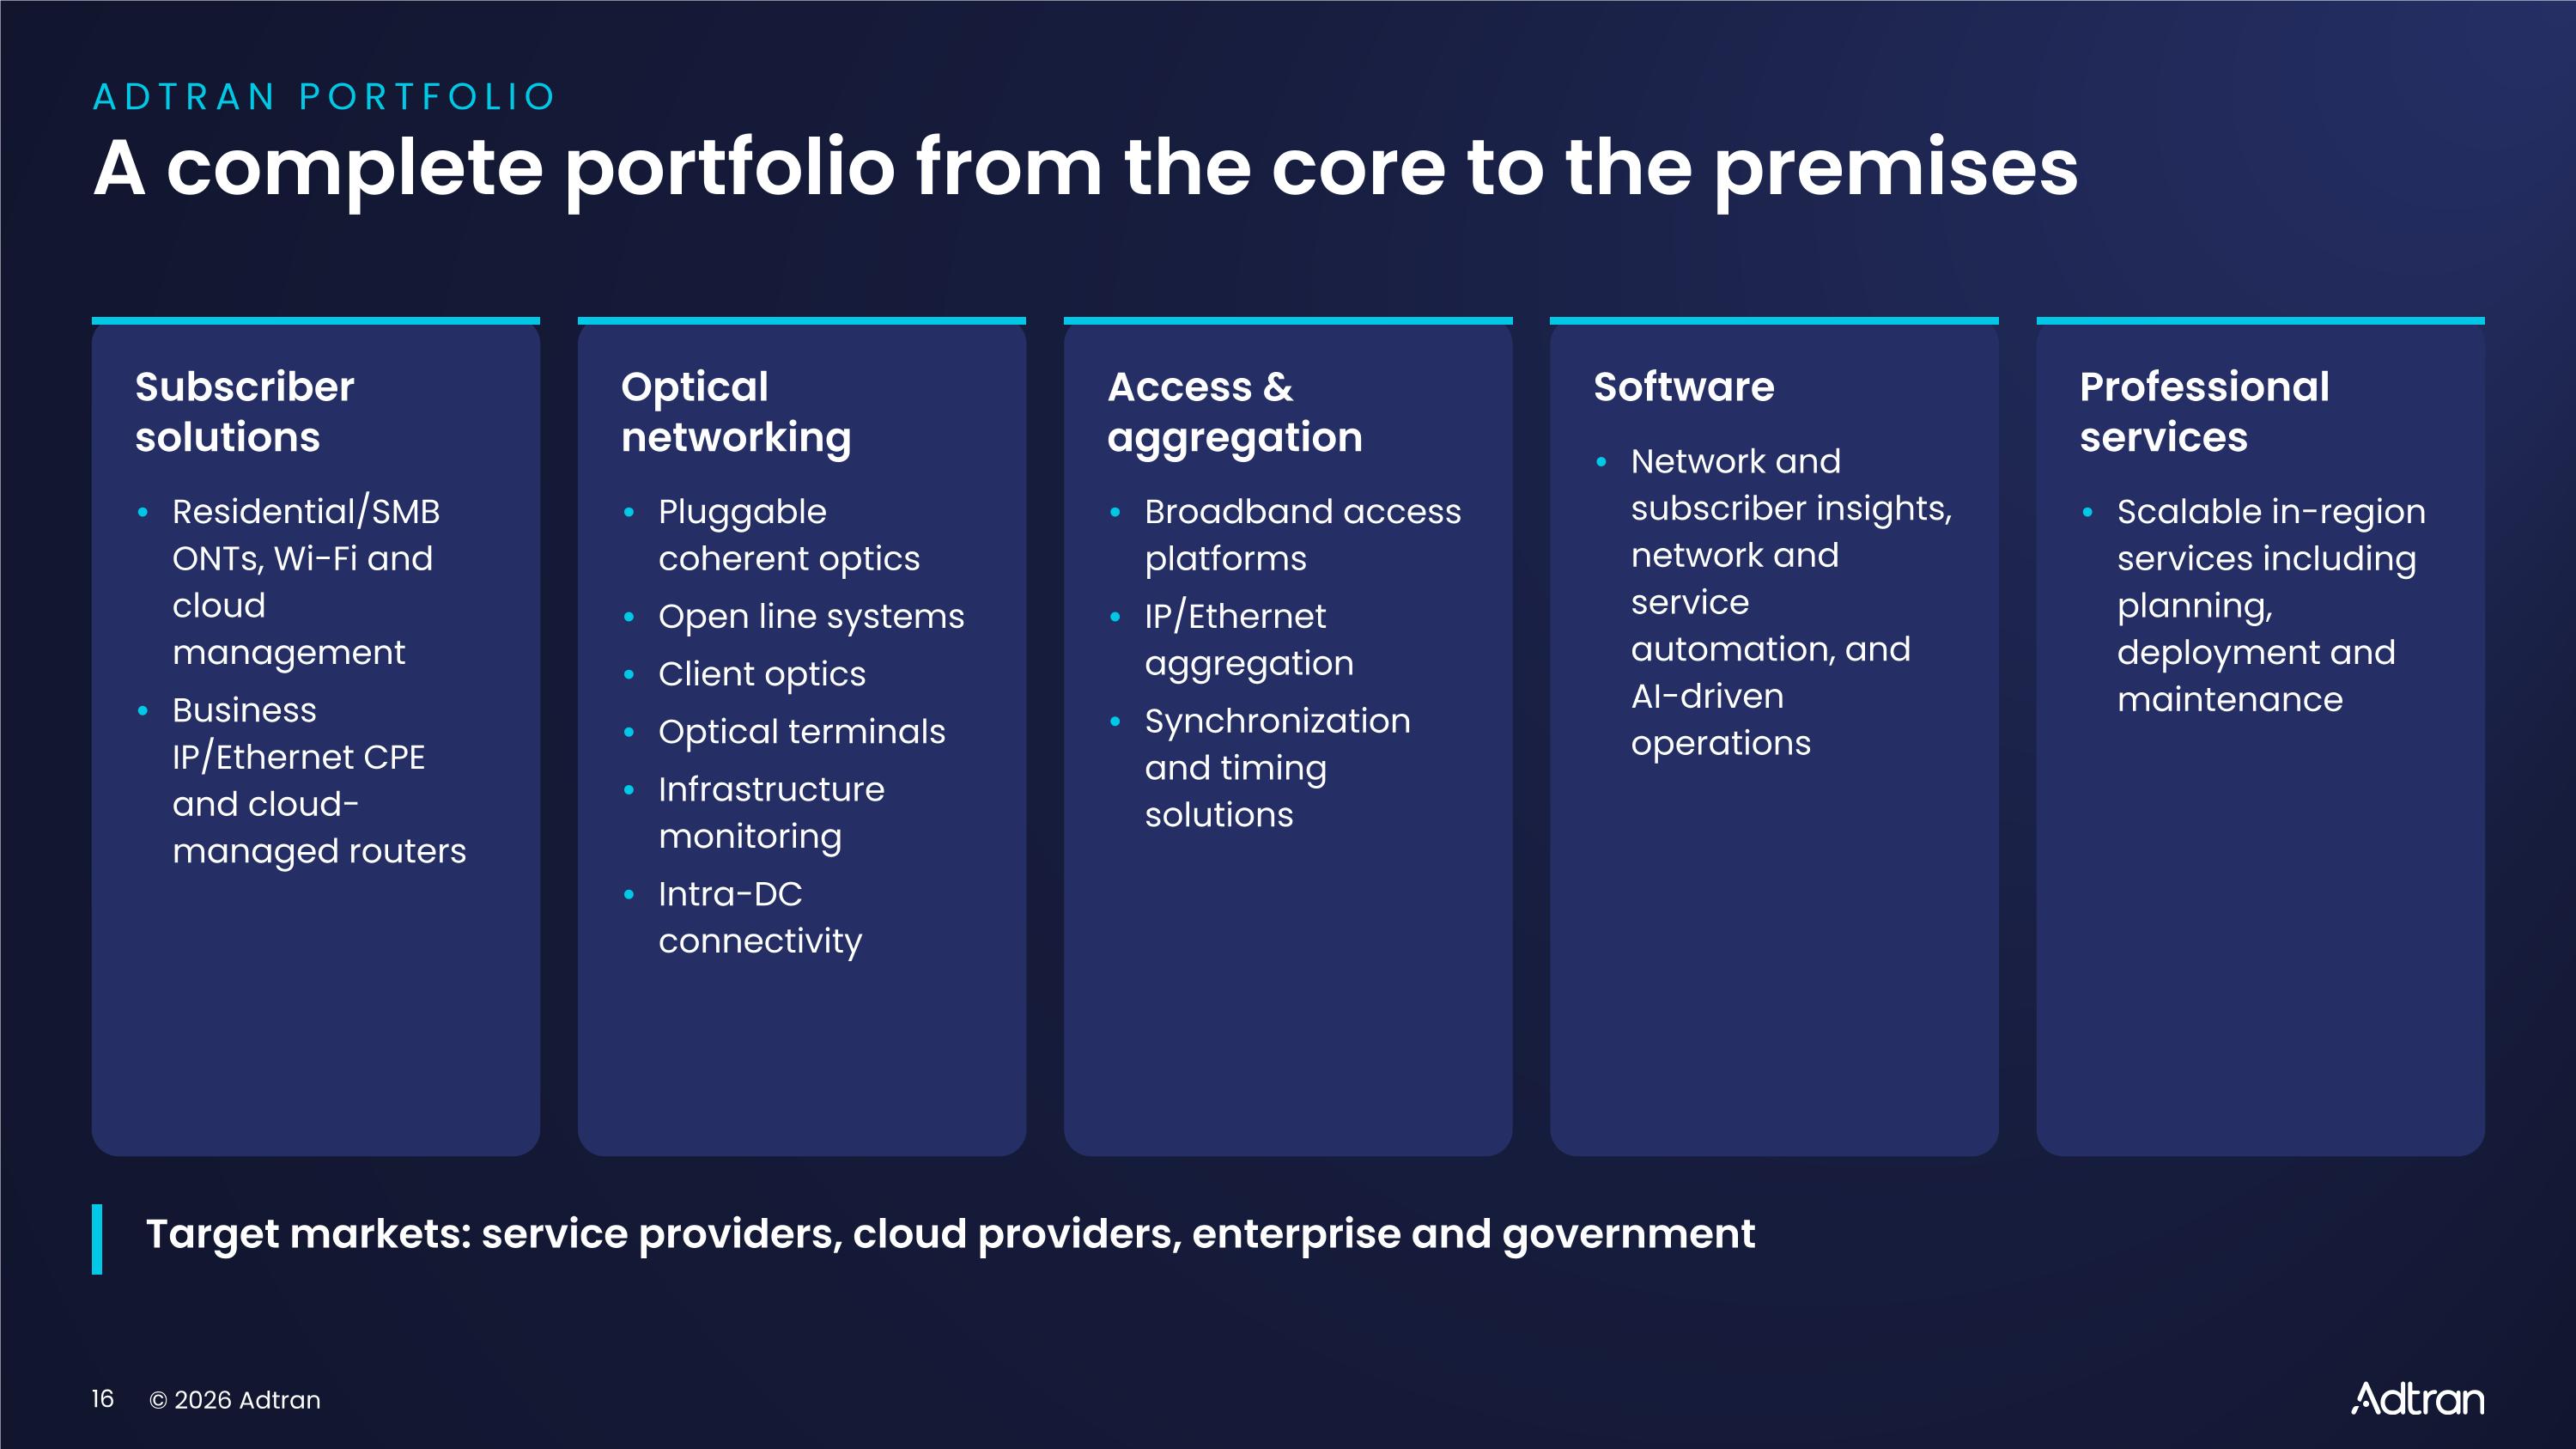
ADTRAN PORTFOLIO A complete portfolio from the core to the premises Subscriber solutions • Residential/SMB ONTs, Wi-Fi and cloud management • Business IP/Ethernet CPE and cloud-managed routers Optical networking • Pluggable coherent optics • Open line systems • Client optics • Optical terminals • Infrastructure monitoring • Intra-DC connectivity Access & aggregation • Broadband access platforms • IP/Ethernet aggregation • Synchronization and timing solutions Software • Network and subscriber insights, network and service automation, and AI-driven operations Professional services • Scalable in-region services including planning, deployment and maintenance Target markets: service providers, cloud providers, enterprise and government
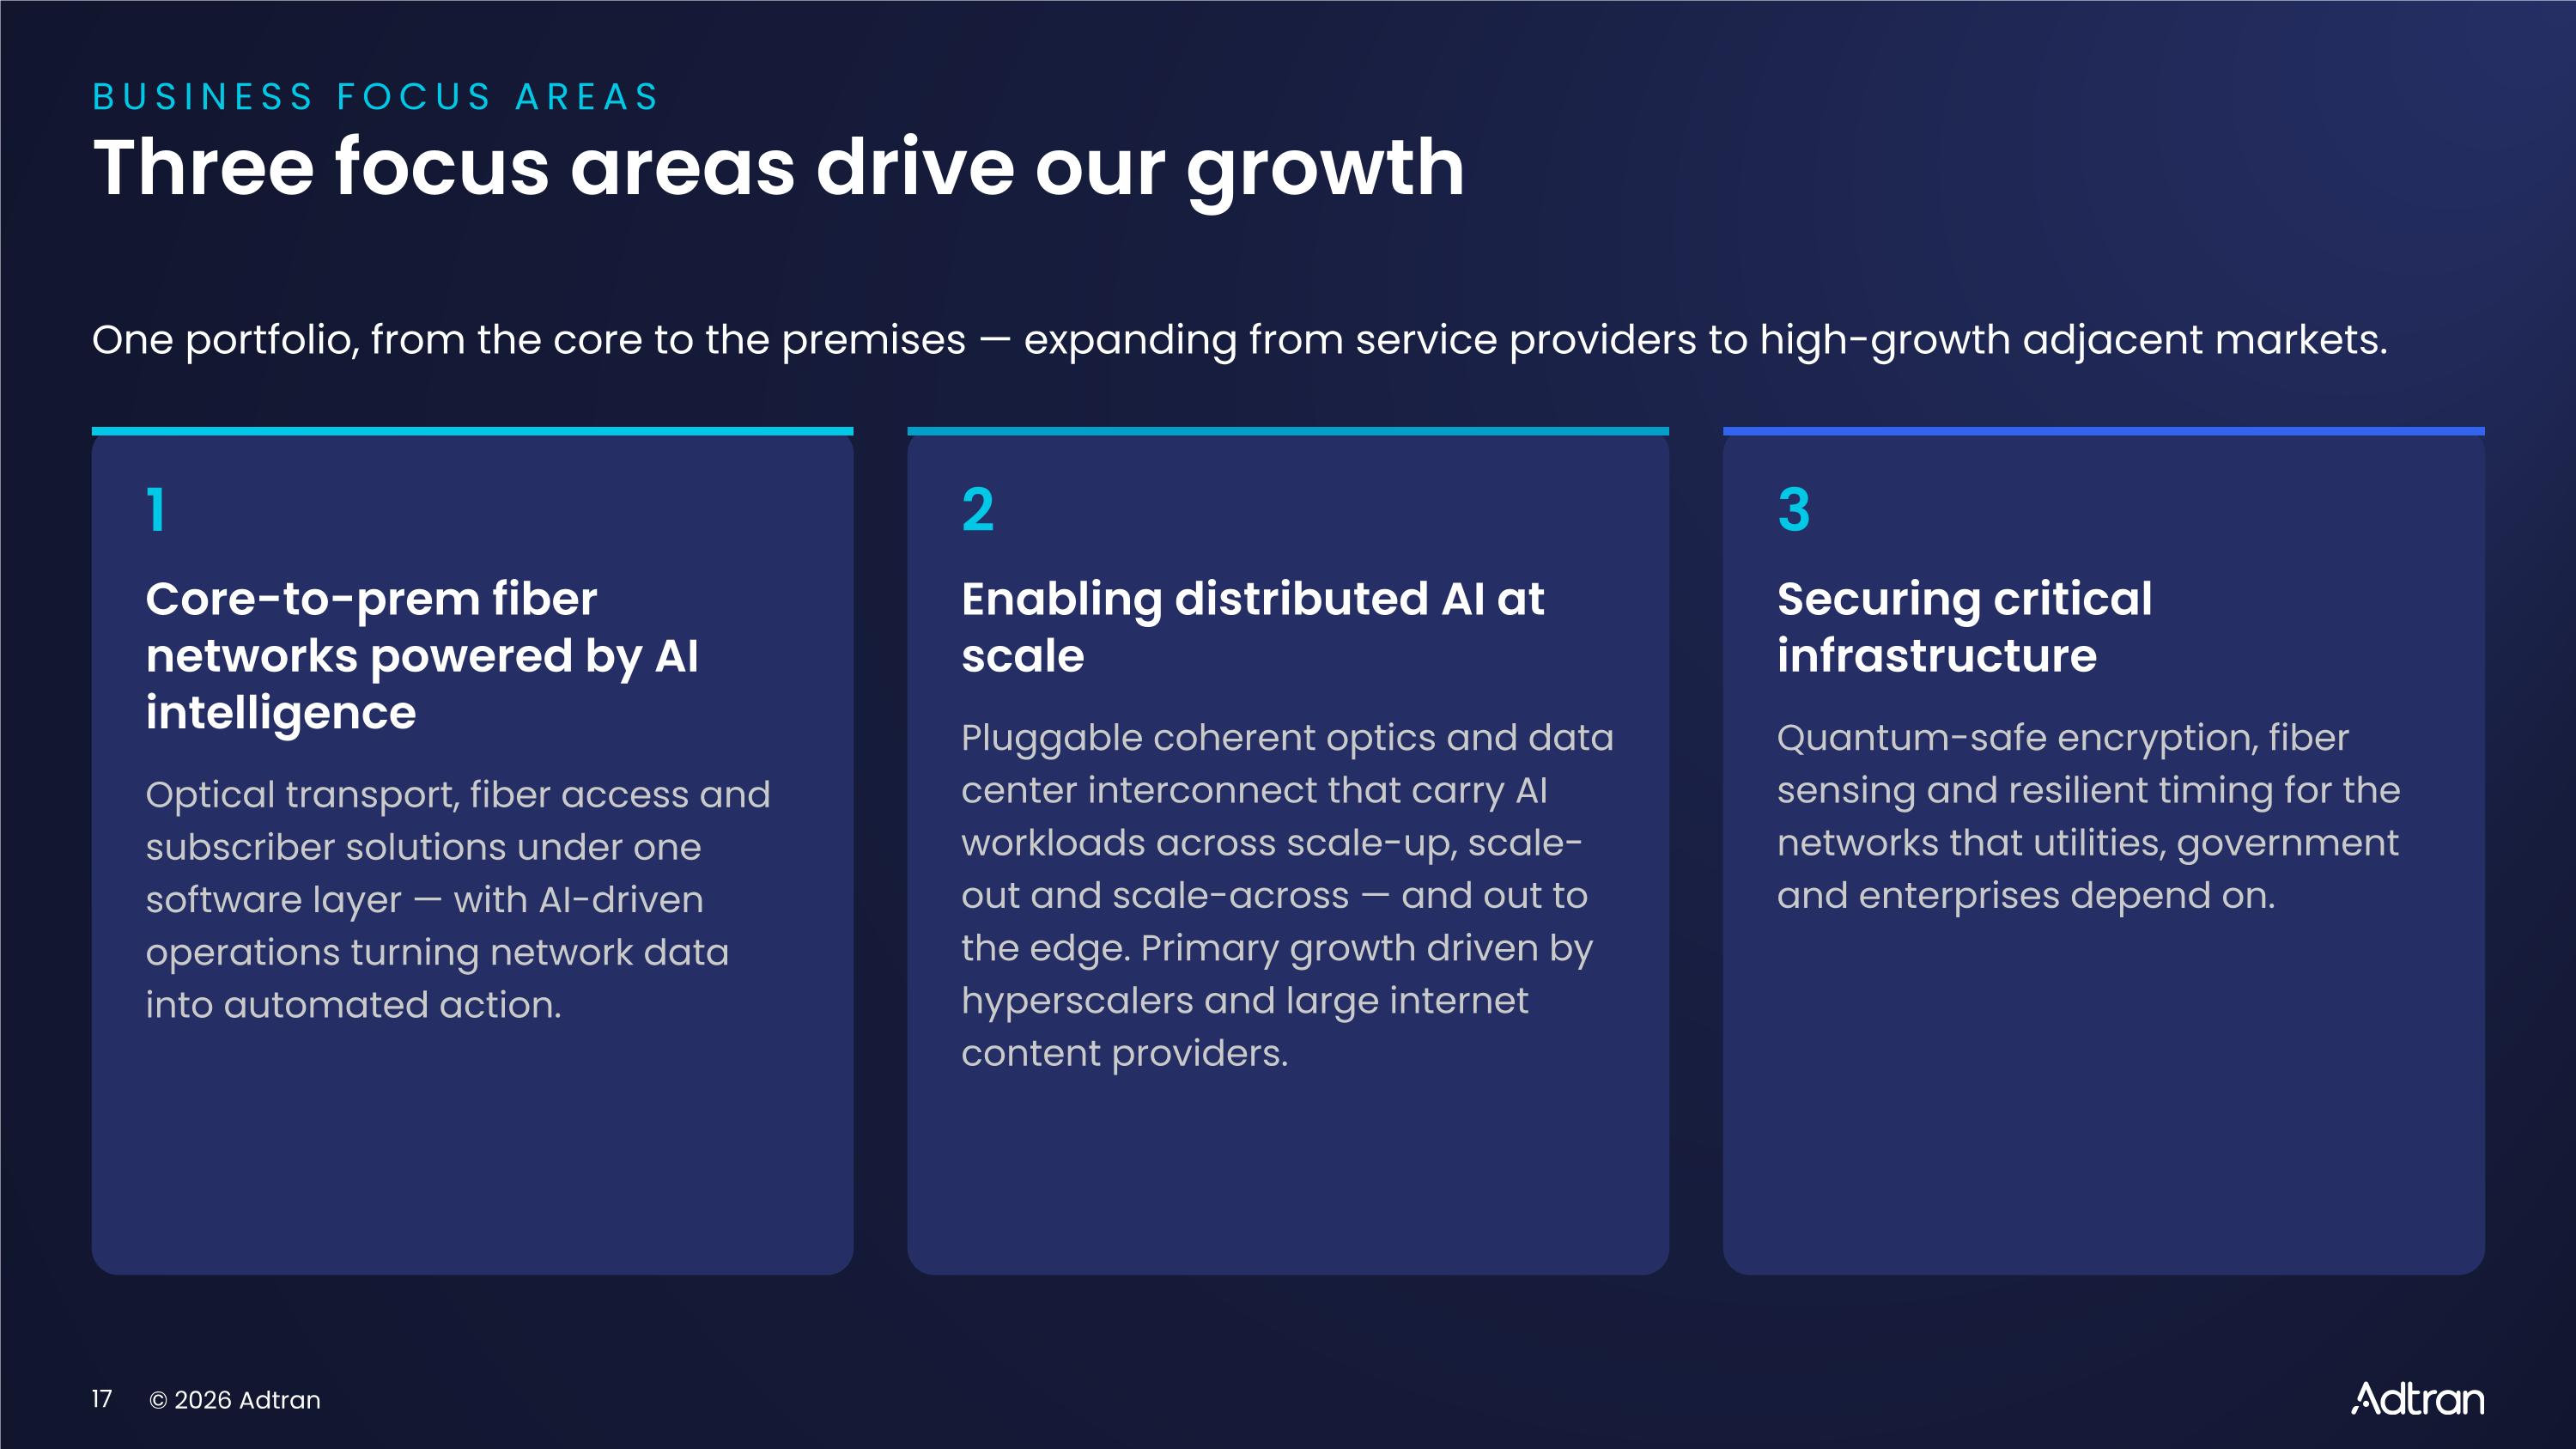
BUSINESS FOCUS AREAS Three focus areas drive our growth One portfolio, from the core to the premises — expanding from service providers to high-growth adjacent markets. 1 Core-to-prem fiber networks powered by AI intelligence Optical transport, fiber access and subscriber solutions under one software layer — with AI-driven operations turning network data into automated action. 2 Enabling distributed AI at scale Pluggable coherent optics and data center interconnect that carry AI workloads across scale-up, scale-out and scale-across — and out to the edge. Primary growth driven by hyperscalers and large internet content providers. 3 Securing critical infrastructure Quantum-safe encryption, fiber sensing and resilient timing for the networks that utilities, government and enterprises depend on.
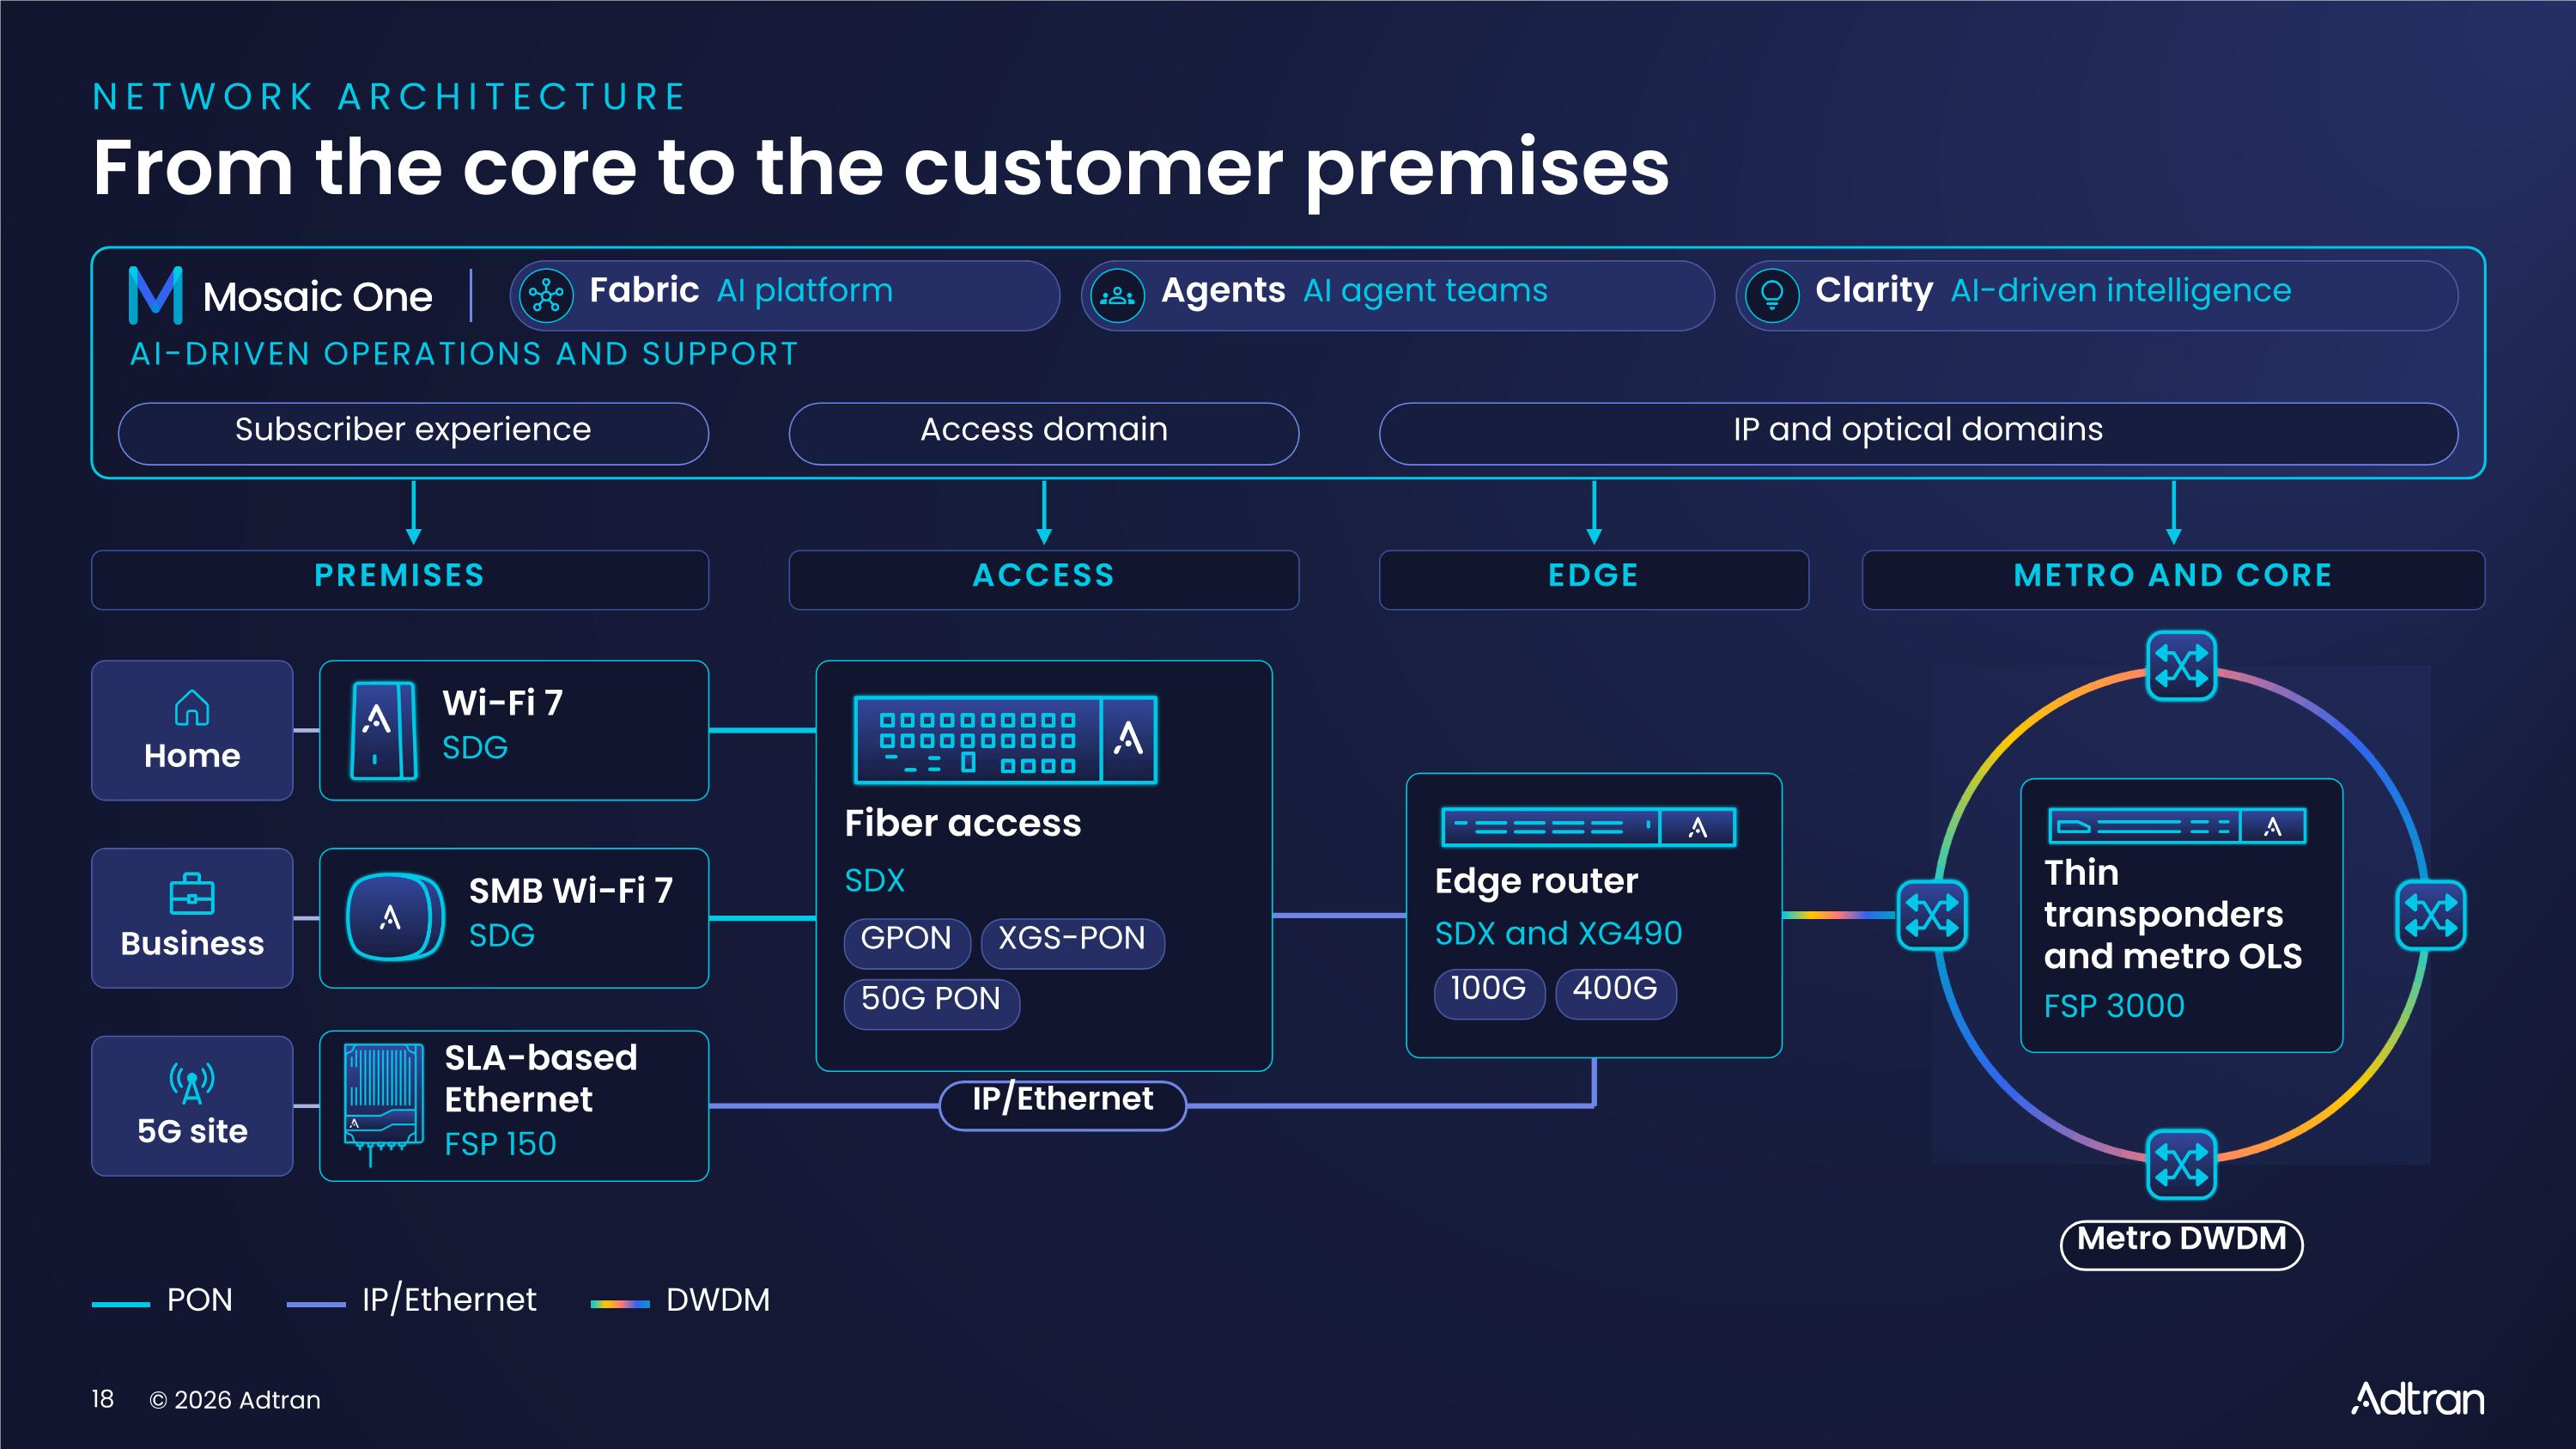
NETWORK ARCHITECTURE From the core to the customer premises Fabric AI platform Agents AI agent teams Clarity AI-driven intelligence AI-DRIVEN OPERATIONS AND SUPPORT Subscriber experience Access domain IP and optical domains PREMISES ACCESS EDGE METRO AND CORE Home Business 5G site Wi-Fi 7 SDG SMB Wi-Fi 7 SDG SLA-based Ethernet FSP 150 Fiber access SDX GPON XGS-PON 50G PON IP/Ethernet Edge router SDX and XG490 100G 400G Thin transponders and metro OLS FSP 3000 Metro DWDM PON IP/Ethernet DWDM
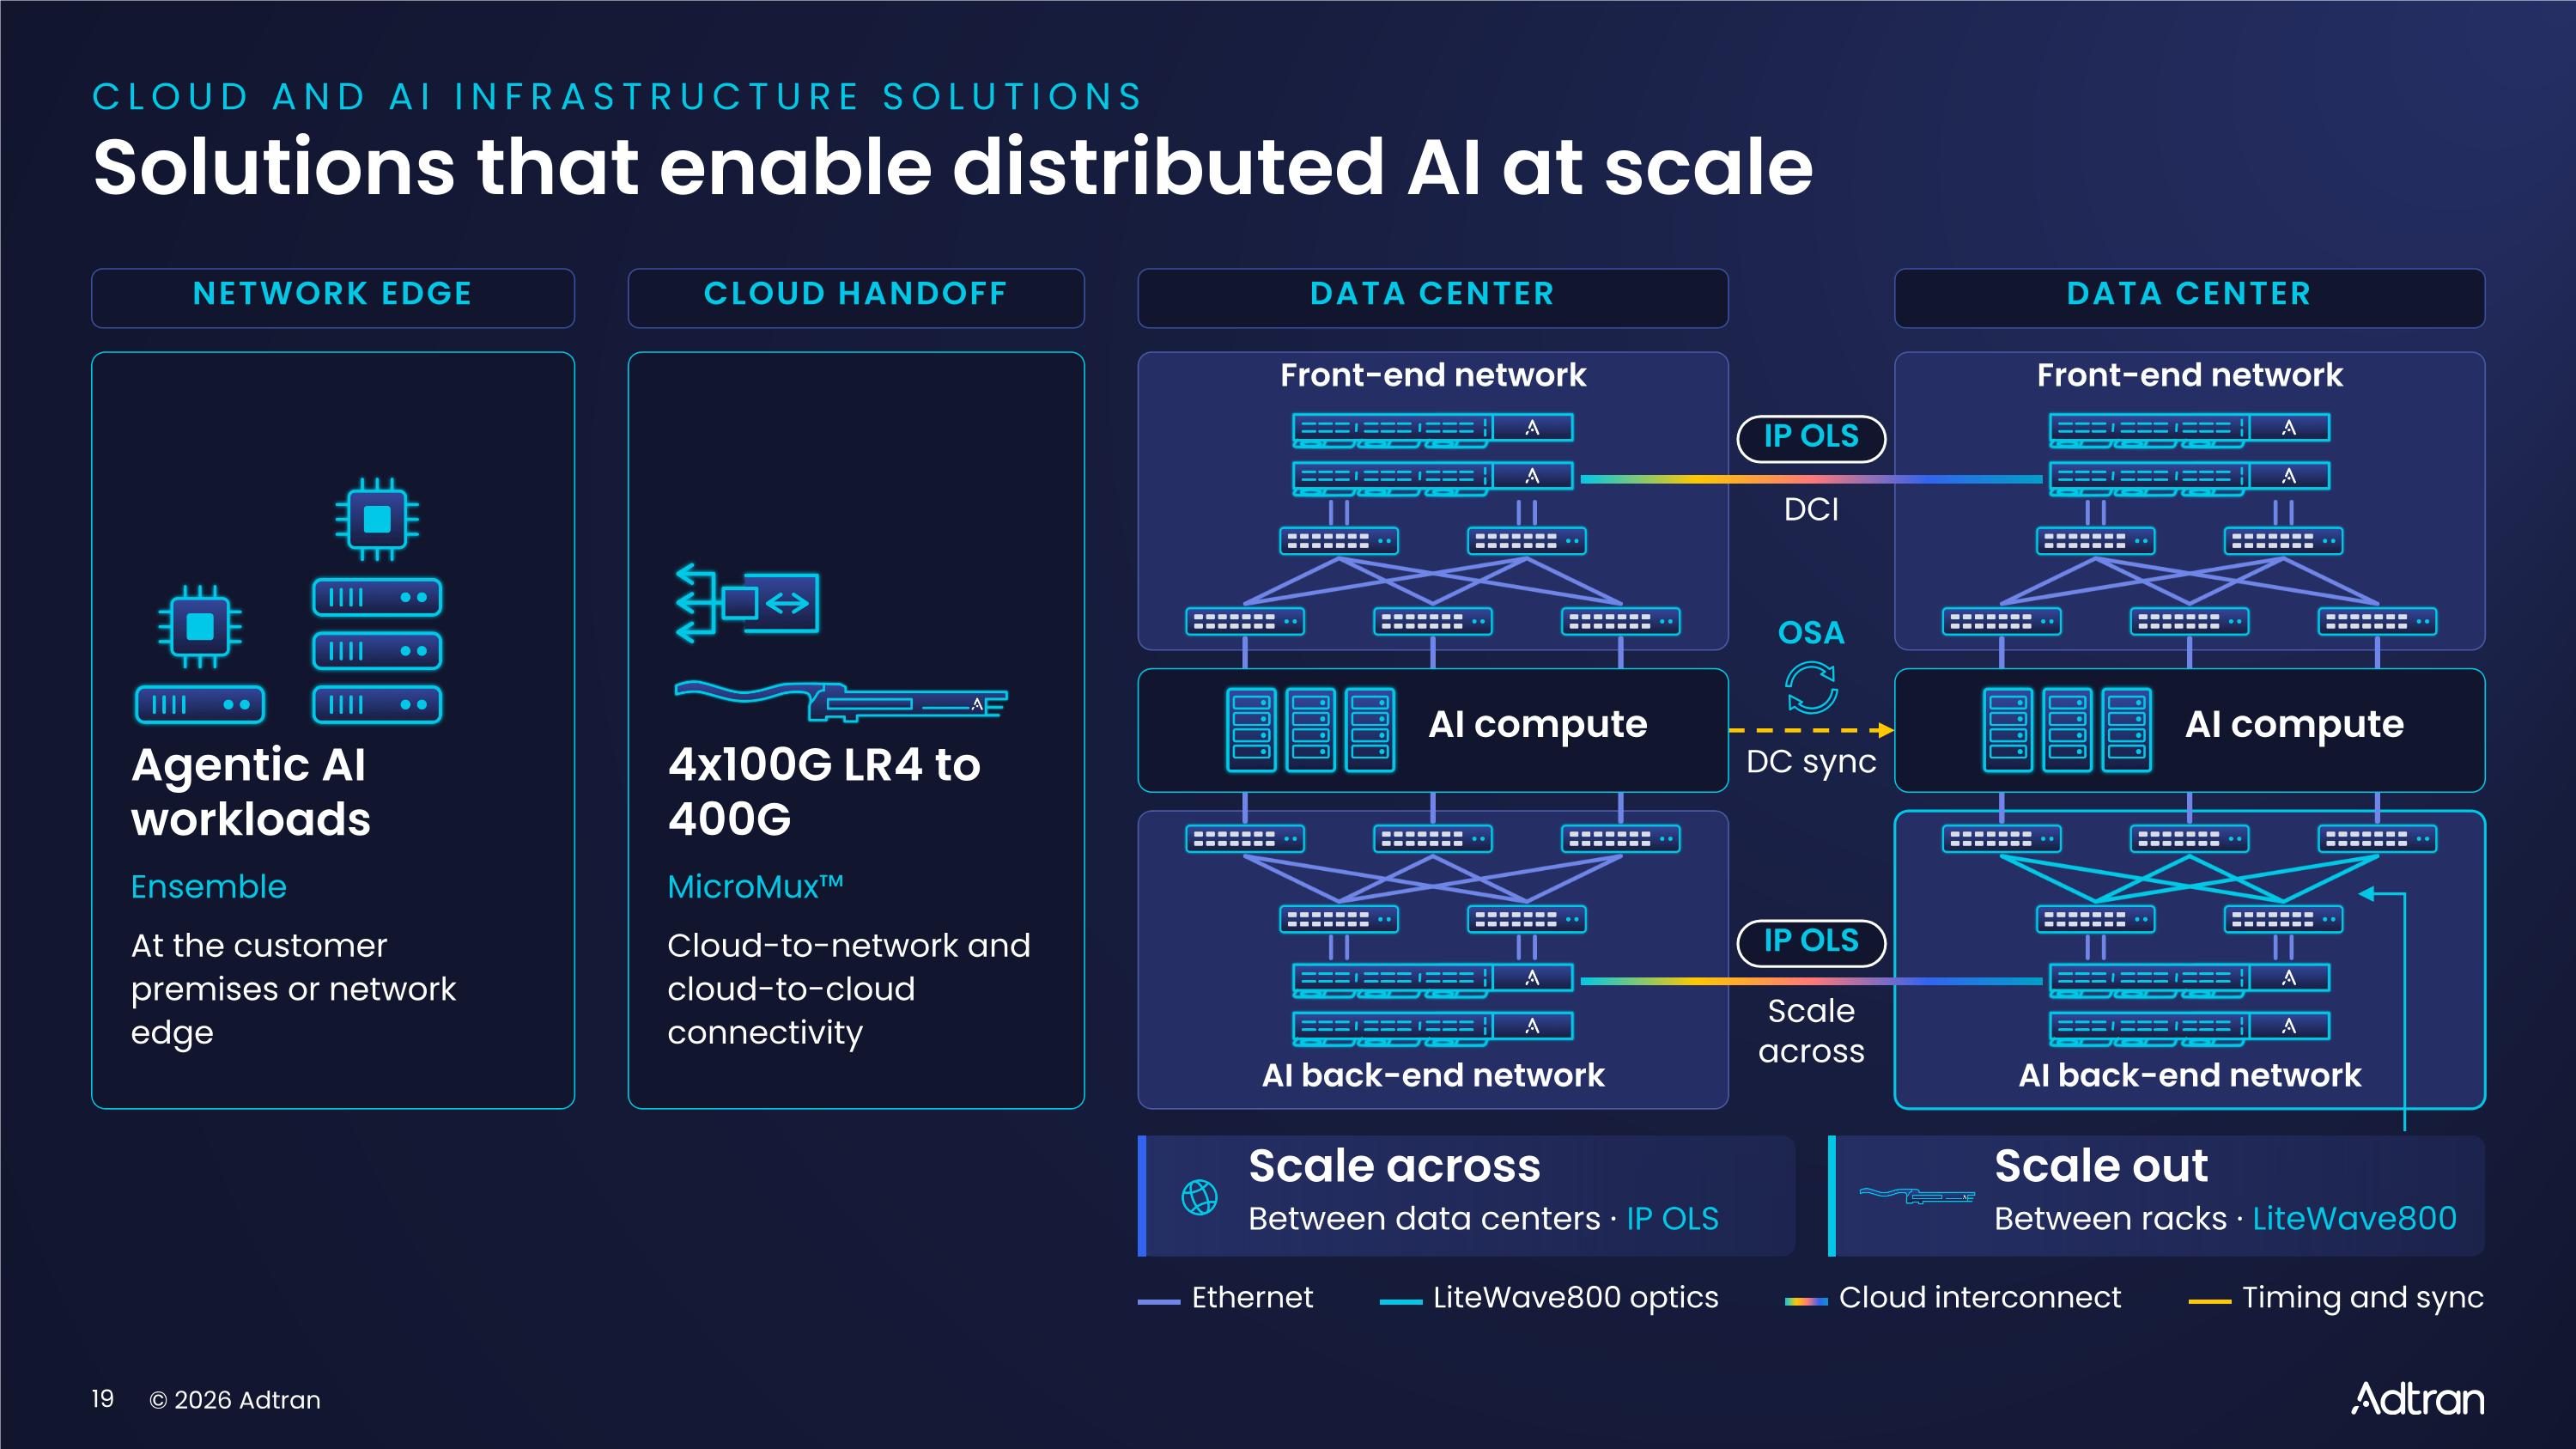
CLOUD AND AI INFRASTRUCTURE SOLUTIONS Solutions that enable distributed AI at scale NETWORK EDGE CLOUD HANDOFF DATA CENTER DATA CENTER Agentic AI workloads Ensemble At the customer premises or network edge 4x100G LR4 to 400G MicroMux™ Cloud-to-network and cloud-to-cloud connectivity Front-end network AI back-end network AI compute Front-end network AI back-end network AI compute IP OLS DCI OSA DC sync IP OLS Scale across Between data centers · IP OLS Scale across Scale out Between racks · LiteWave800 Ethernet LiteWave800 optics Cloud interconnect Timing and sync
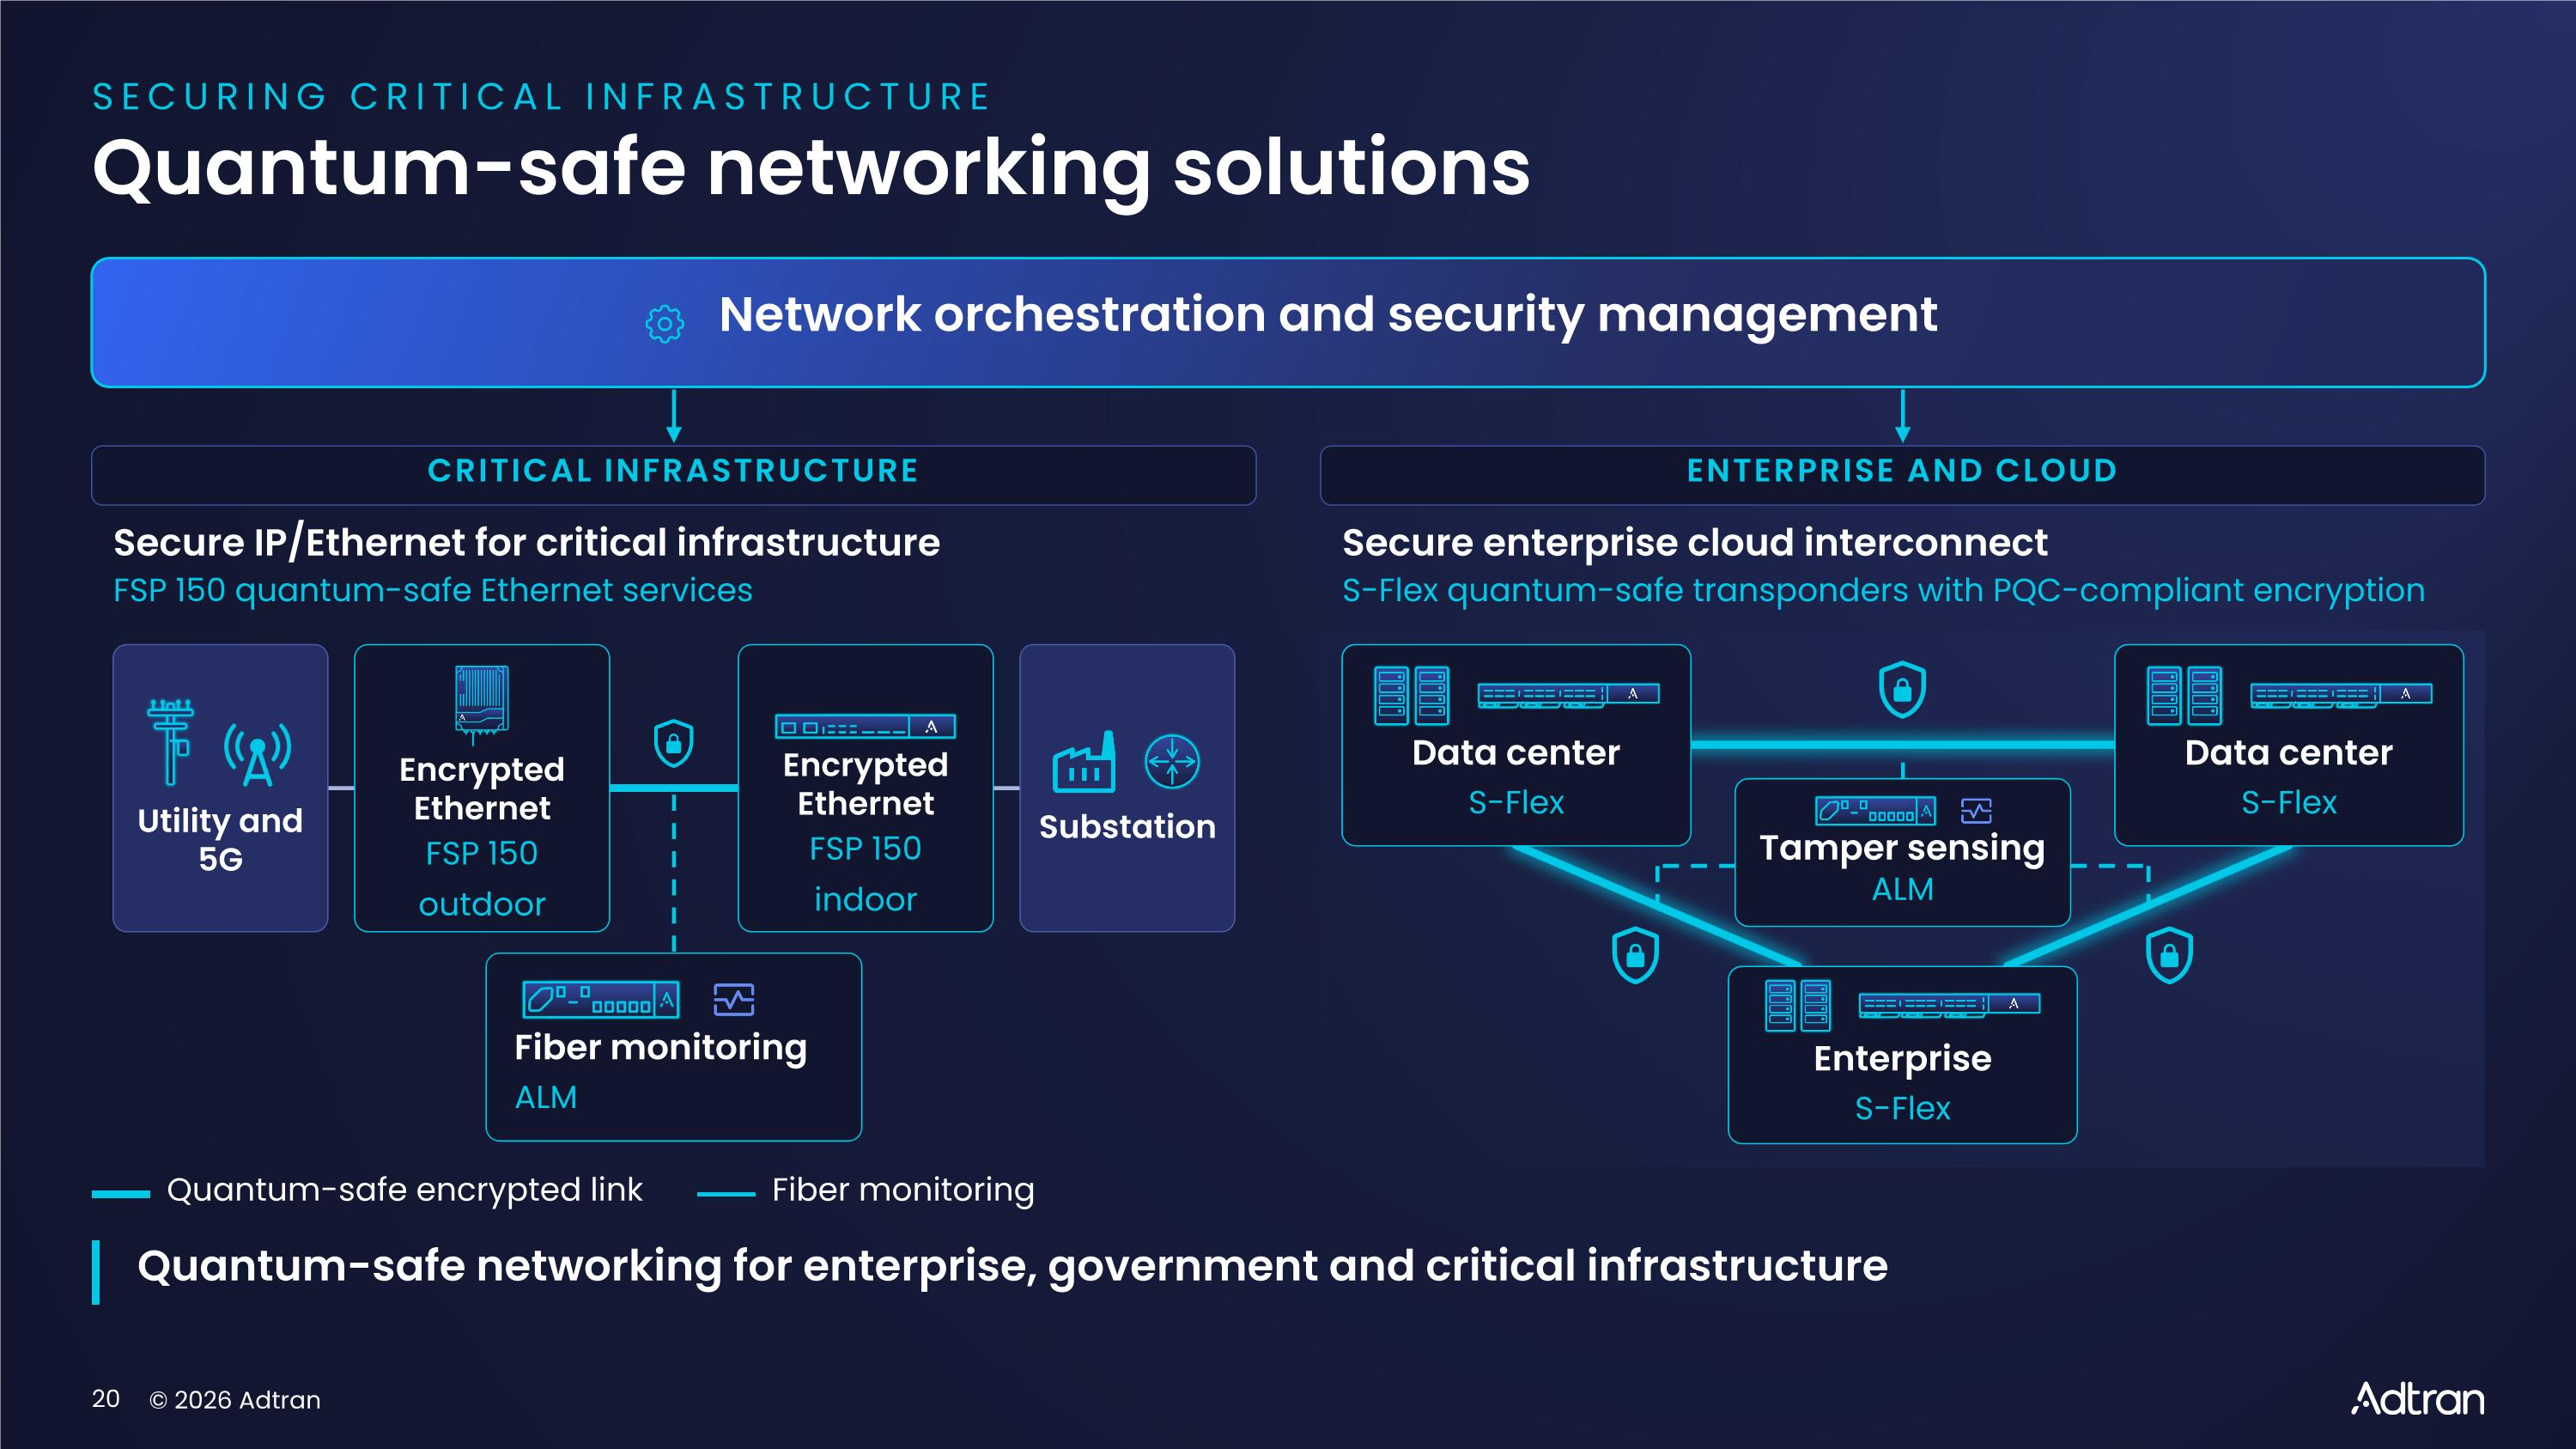
SECURING CRITICAL INFRASTRUCTURE Quantum-safe networking solutions Network orchestration and security management CRITICAL INFRASTRUCTURE ENTERPRISE AND CLOUD Secure IP/Ethernet for critical infrastructure FSP 150 quantum-safe Ethernet services Secure enterprise cloud interconnect S-Flex quantum-safe transponders with PQC-compliant encryption Data center S-Flex Data center S-Flex Tamper sensing ALM Enterprise S-Flex Utility and 5G Encrypted Ethernet FSP 150 outdoor Encrypted Ethernet FSP 150 indoor Substation Fiber monitoring ALM Quantum-safe encrypted link Fiber monitoring Quantum-safe networking for enterprise, government and critical infrastructure

Appendix REFERENCE Non-GAAP reconciliations
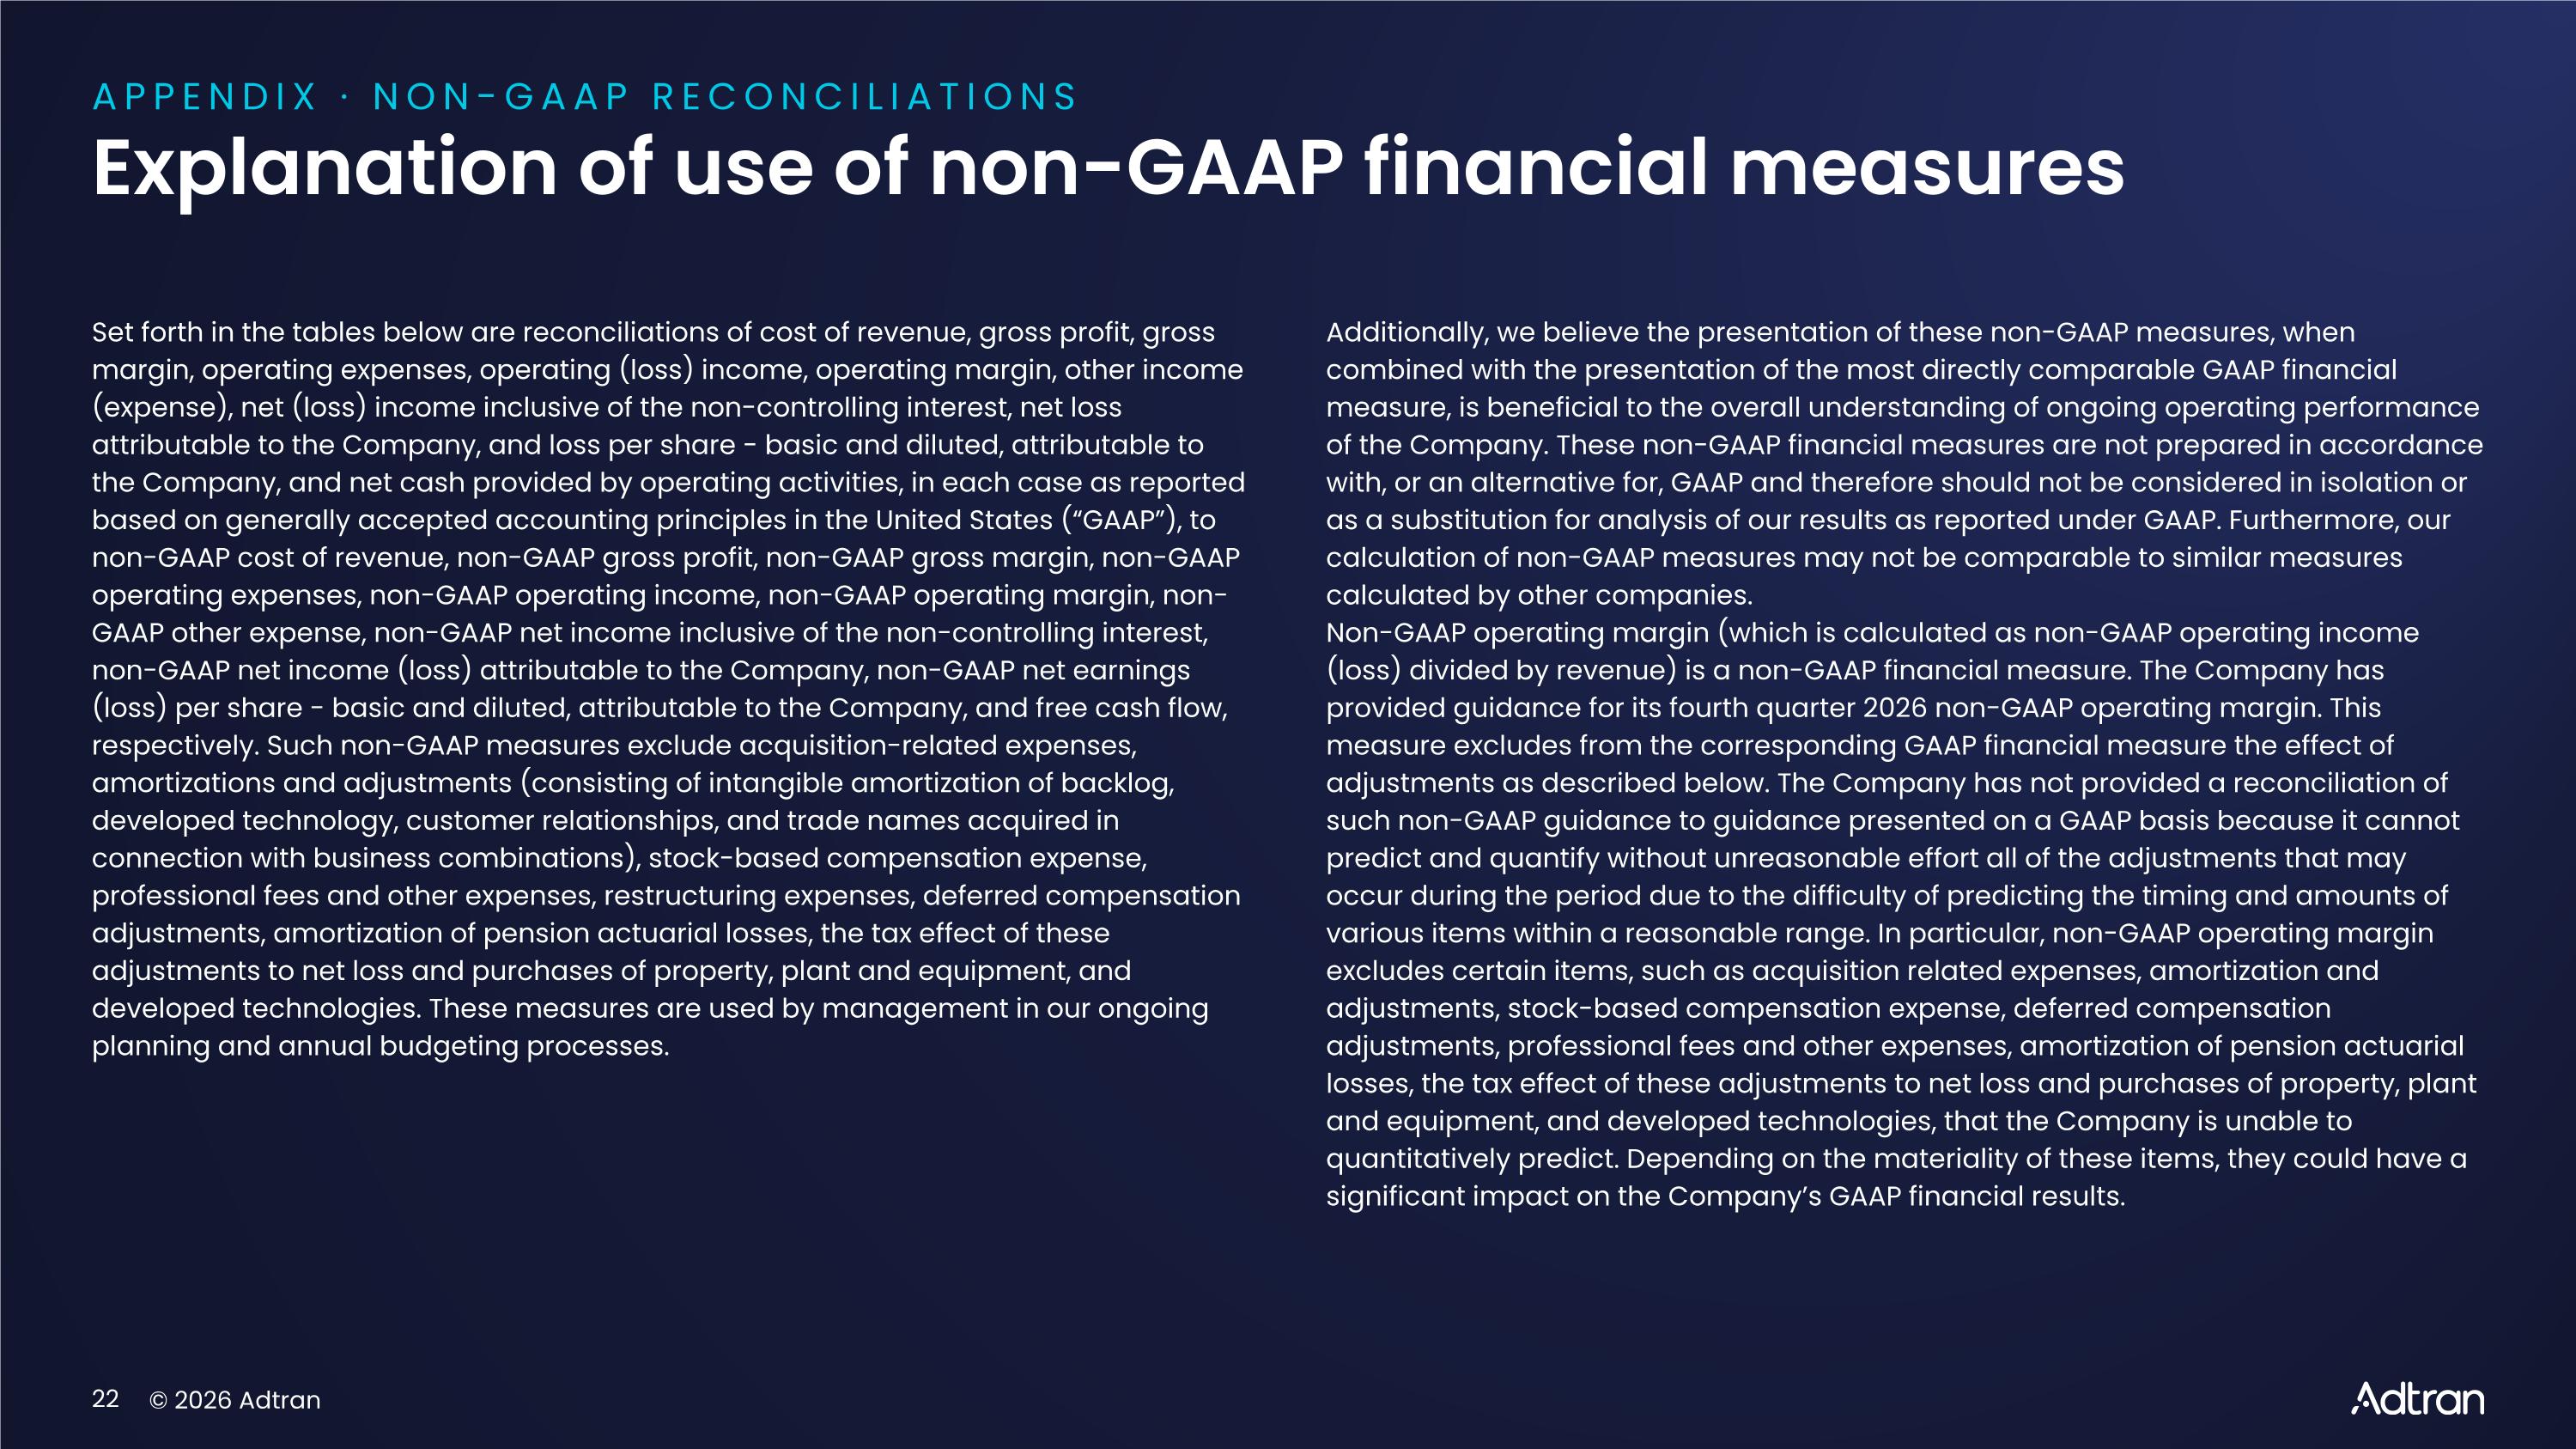
APPENDIX · NON-GAAP RECONCILIATIONS Explanation of use of non-GAAP financial measures Set forth in the tables below are reconciliations of cost of revenue, gross profit, gross margin, operating expenses, operating (loss) income, operating margin, other income (expense), net (loss) income inclusive of the non-controlling interest, net loss attributable to the Company, and loss per share - basic and diluted, attributable to the Company, and net cash provided by operating activities, in each case as reported based on generally accepted accounting principles in the United States (“GAAP”), to non-GAAP cost of revenue, non-GAAP gross profit, non-GAAP gross margin, non-GAAP operating expenses, non-GAAP operating income, non-GAAP operating margin, non-GAAP other expense, non-GAAP net income inclusive of the non-controlling interest, non-GAAP net income (loss) attributable to the Company, non-GAAP net earnings (loss) per share - basic and diluted, attributable to the Company, and free cash flow, respectively. Such non-GAAP measures exclude acquisition-related expenses, amortizations and adjustments (consisting of intangible amortization of backlog, developed technology, customer relationships, and trade names acquired in connection with business combinations), stock-based compensation expense, professional fees and other expenses, restructuring expenses, deferred compensation adjustments, amortization of pension actuarial losses, the tax effect of these adjustments to net loss and purchases of property, plant and equipment, and developed technologies. These measures are used by management in our ongoing planning and annual budgeting processes. Additionally, we believe the presentation of these non-GAAP measures, when combined with the presentation of the most directly comparable GAAP financial measure, is beneficial to the overall understanding of ongoing operating performance of the Company. These non-GAAP financial measures are not prepared in accordance with, or an alternative for, GAAP and therefore should not be considered in isolation or as a substitution for analysis of our results as reported under GAAP. Furthermore, our calculation of non-GAAP measures may not be comparable to similar measures calculated by other companies. Non-GAAP operating margin (which is calculated as non-GAAP operating income (loss) divided by revenue) is a non-GAAP financial measure. The Company has provided guidance for its fourth quarter 2026 non-GAAP operating margin. This measure excludes from the corresponding GAAP financial measure the effect of adjustments as described below. The Company has not provided a reconciliation of such non-GAAP guidance to guidance presented on a GAAP basis because it cannot predict and quantify without unreasonable effort all of the adjustments that may occur during the period due to the difficulty of predicting the timing and amounts of various items within a reasonable range. In particular, non-GAAP operating margin excludes certain items, such as acquisition related expenses, amortization and adjustments, stock-based compensation expense, deferred compensation adjustments, professional fees and other expenses, amortization of pension actuarial losses, the tax effect of these adjustments to net loss and purchases of property, plant and equipment, and developed technologies, that the Company is unable to quantitatively predict. Depending on the materiality of these items, they could have a significant impact on the Company’s GAAP financial results.
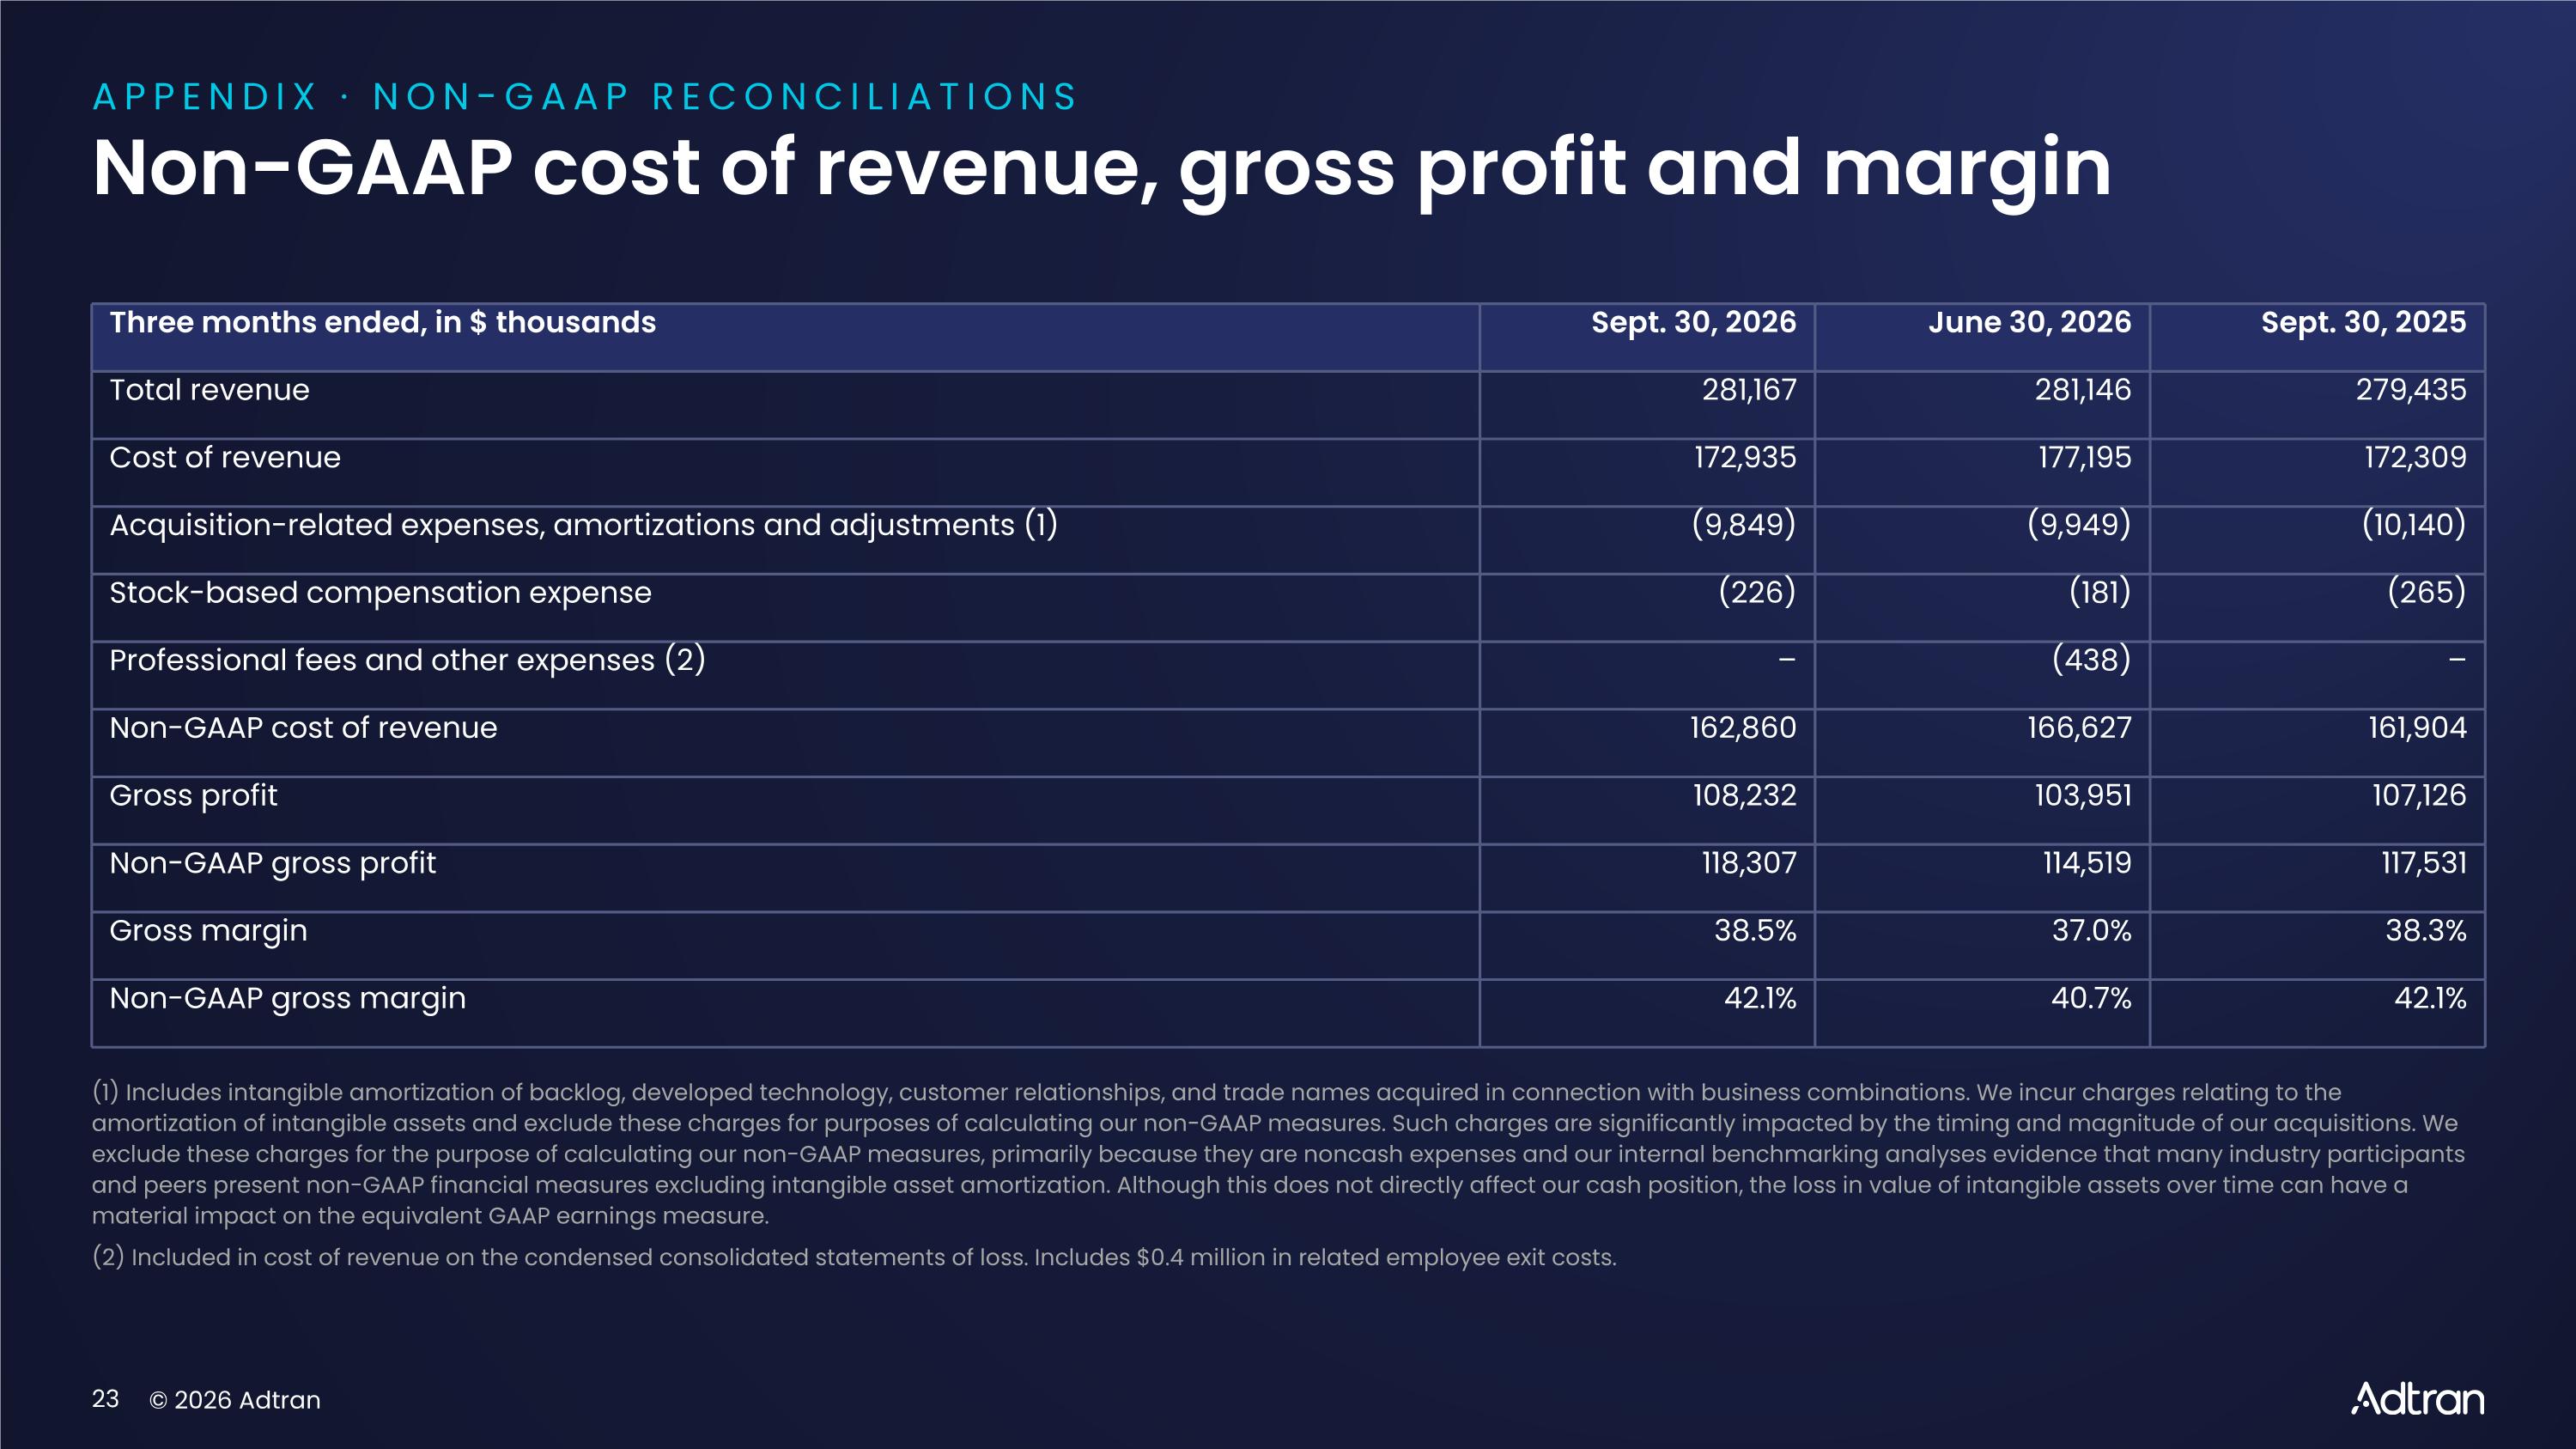
APPENDIX · NON-GAAP RECONCILIATIONS Non-GAAP cost of revenue, gross profit and margin Three months ended, in $ thousands Sept. 30, 2026 June 30, 2026 Sept. 30, 2025 Total revenue 281,167 281,146 279,435 Cost of revenue 172,935 177,195 172,309 Acquisition-related expenses, amortizations and adjustments (1) (9,849) (9,949) (10,140) Stock-based compensation expense (226) (181) (265) Professional fees and other expenses (2) – (438) – Non-GAAP cost of revenue 162,860 166,627 161,904 Gross profit 108,232 103,951 107,126 Non-GAAP gross profit 118,307 114,519 117,531 Gross margin 38.5% 37.0% 38.3% Non-GAAP gross margin 42.1% 40.7% 42.1% (1) Includes intangible amortization of backlog, developed technology, customer relationships, and trade names acquired in connection with business combinations. We incur charges relating to the amortization of intangible assets and exclude these charges for purposes of calculating our non-GAAP measures. Such charges are significantly impacted by the timing and magnitude of our acquisitions. We exclude these charges for the purpose of calculating our non-GAAP measures, primarily because they are noncash expenses and our internal benchmarking analyses evidence that many industry participants and peers present non-GAAP financial measures excluding intangible asset amortization. Although this does not directly affect our cash position, the loss in value of intangible assets over time can have a material impact on the equivalent GAAP earnings measure. (2) Included in cost of revenue on the condensed consolidated statements of loss. Includes $0.4 million in related employee exit costs.
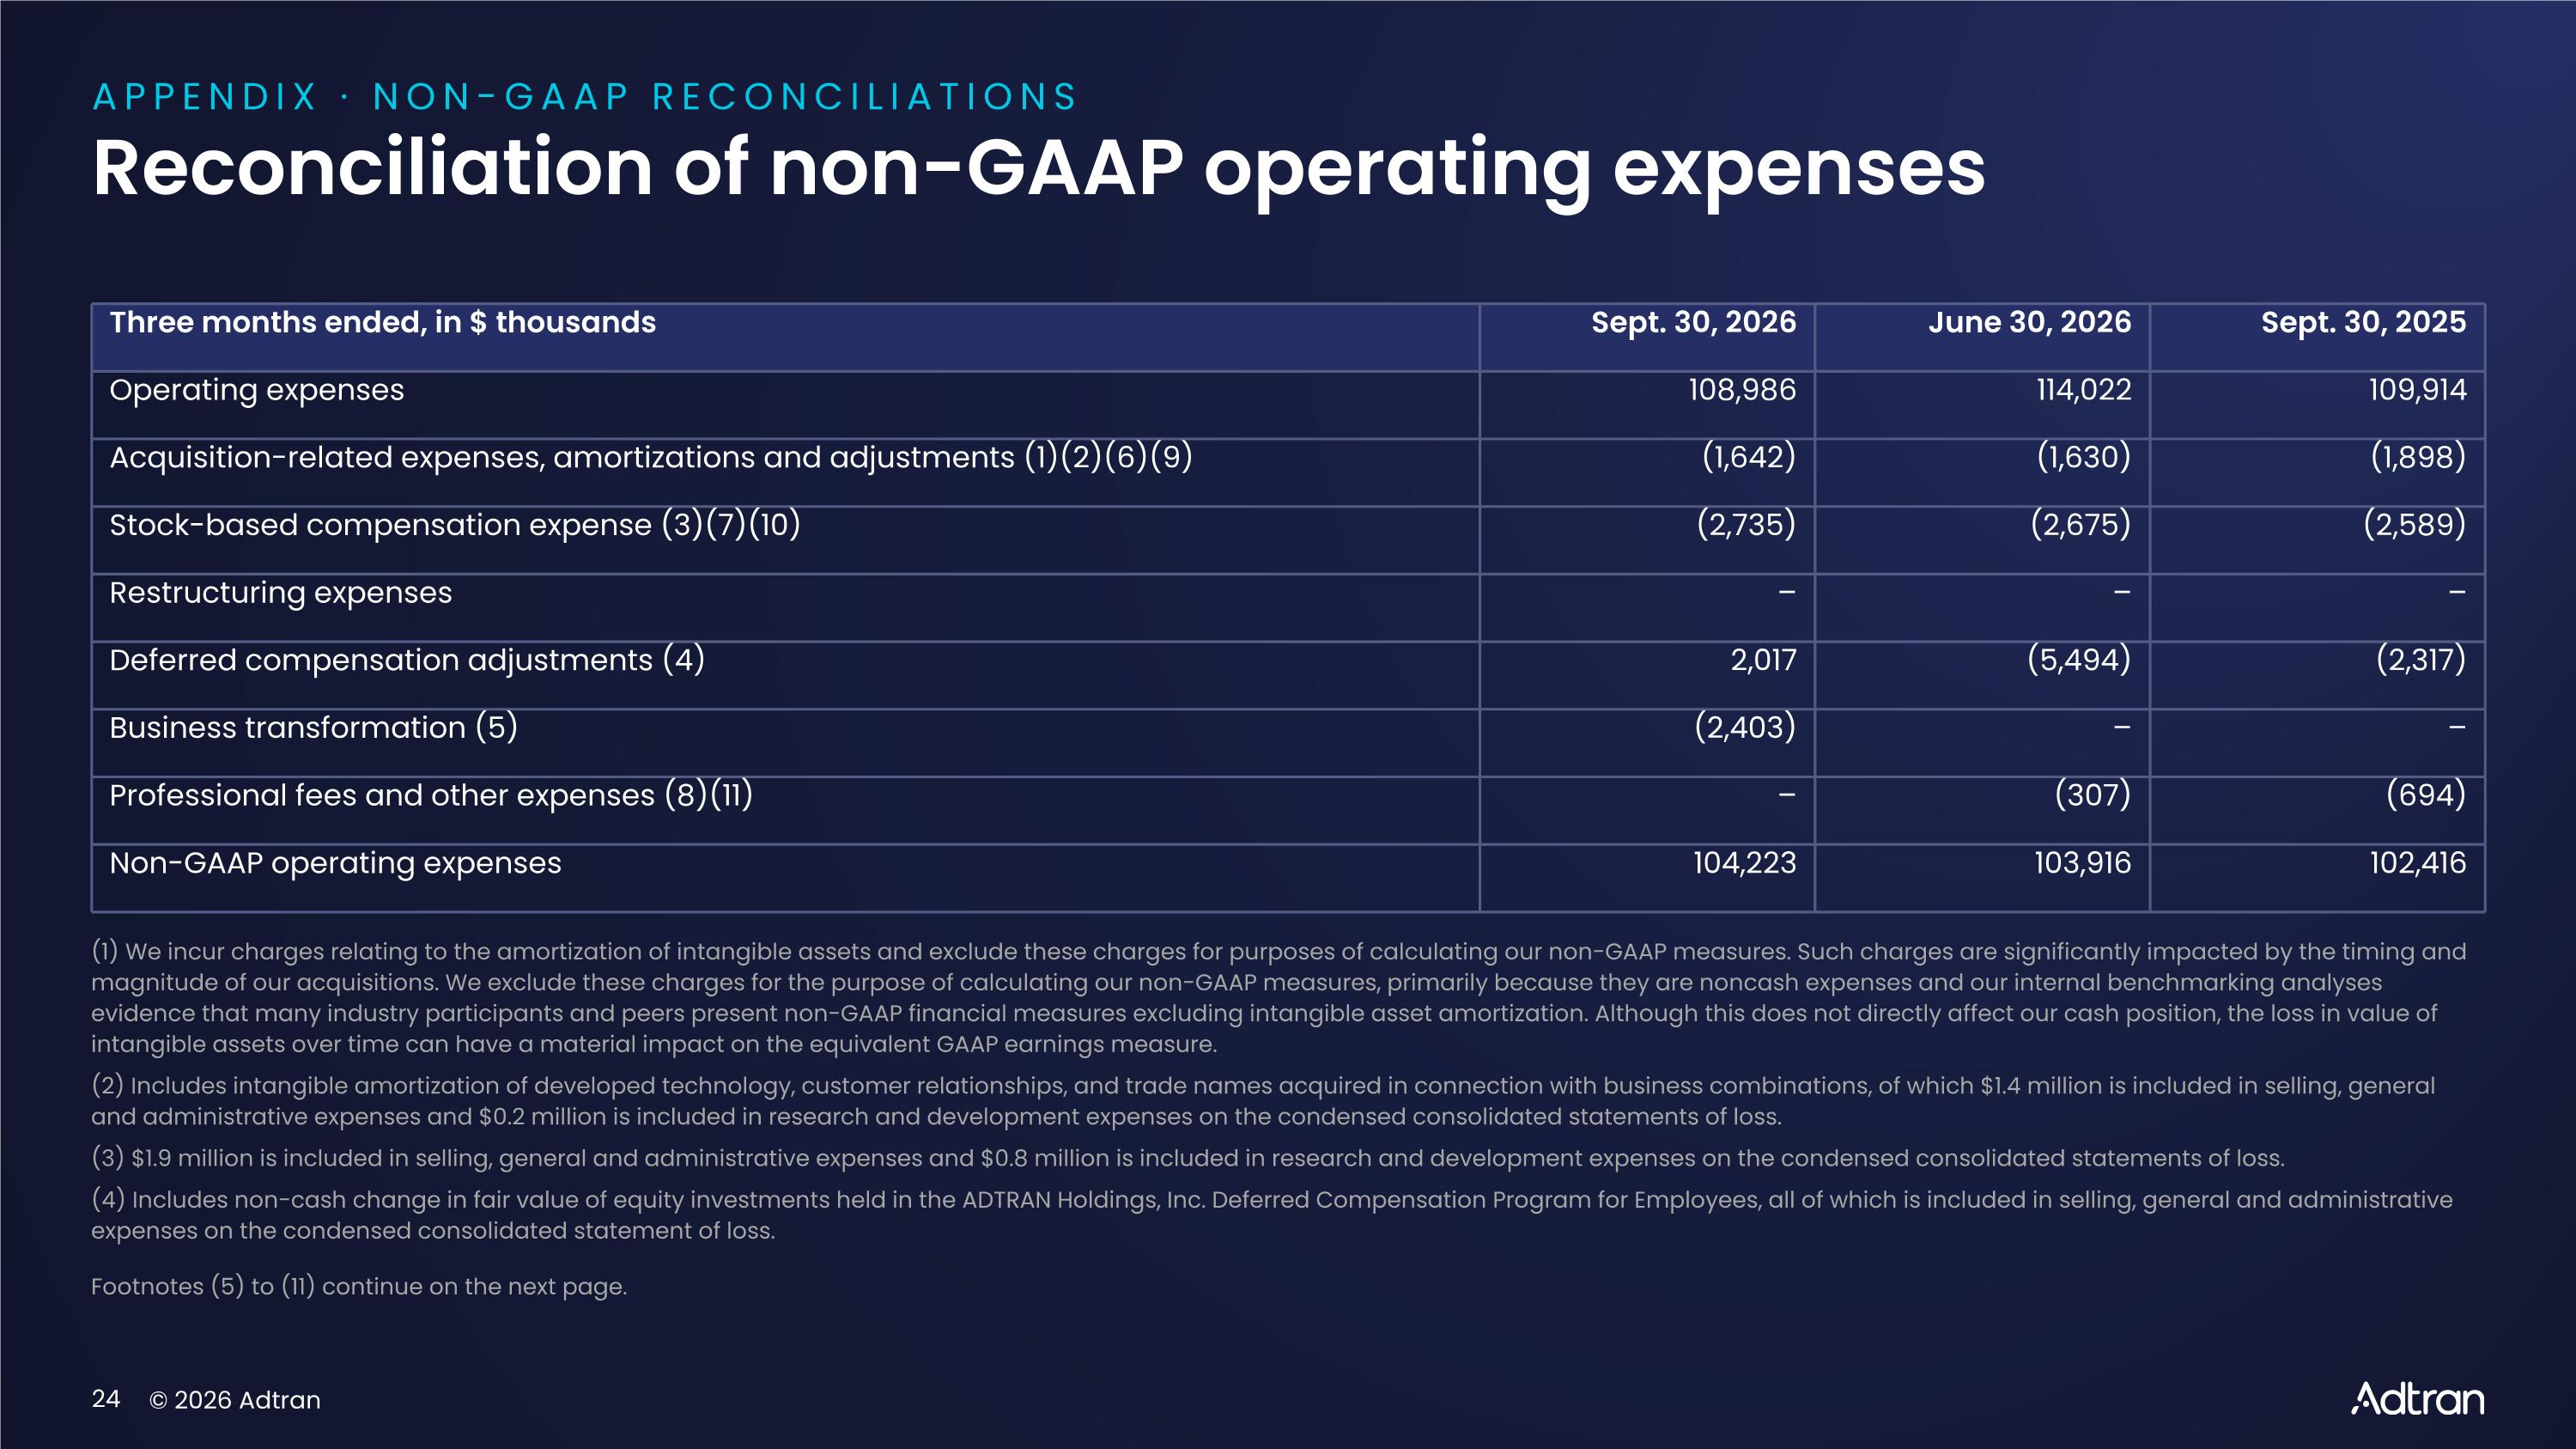
APPENDIX · NON-GAAP RECONCILIATIONS Reconciliation of non-GAAP operating expenses Three months ended, in $ thousands Sept. 30, 2026 June 30, 2026 Sept. 30, 2025 Operating expenses 108,986 114,022 109,914 Acquisition-related expenses, amortizations and adjustments (1)(2)(6)(9) (1,642) (1,630) (1,898) Stock-based compensation expense (3)(7)(10) (2,735) (2,675) (2,589) Restructuring expenses – – – Deferred compensation adjustments (4) 2,017 (5,494) (2,317) Business transformation (5) (2,403) – – Professional fees and other expenses (8)(11) – (307) (694) Non-GAAP operating expenses 104,223 103,916 102,416 (1) We incur charges relating to the amortization of intangible assets and exclude these charges for purposes of calculating our non-GAAP measures. Such charges are significantly impacted by the timing and magnitude of our acquisitions. We exclude these charges for the purpose of calculating our non-GAAP measures, primarily because they are noncash expenses and our internal benchmarking analyses evidence that many industry participants and peers present non-GAAP financial measures excluding intangible asset amortization. Although this does not directly affect our cash position, the loss in value of intangible assets over time can have a material impact on the equivalent GAAP earnings measure. (2) Includes intangible amortization of developed technology, customer relationships, and trade names acquired in connection with business combinations, of which $1.4 million is included in selling, general and administrative expenses and $0.2 million is included in research and development expenses on the condensed consolidated statements of loss. (3) $1.9 million is included in selling, general and administrative expenses and $0.8 million is included in research and development expenses on the condensed consolidated statements of loss. (4) Includes non-cash change in fair value of equity investments held in the ADTRAN Holdings, Inc. Deferred Compensation Program for Employees, all of which is included in selling, general and administrative expenses on the condensed consolidated statement of loss. Footnotes (5) to (11) continue on the next page.
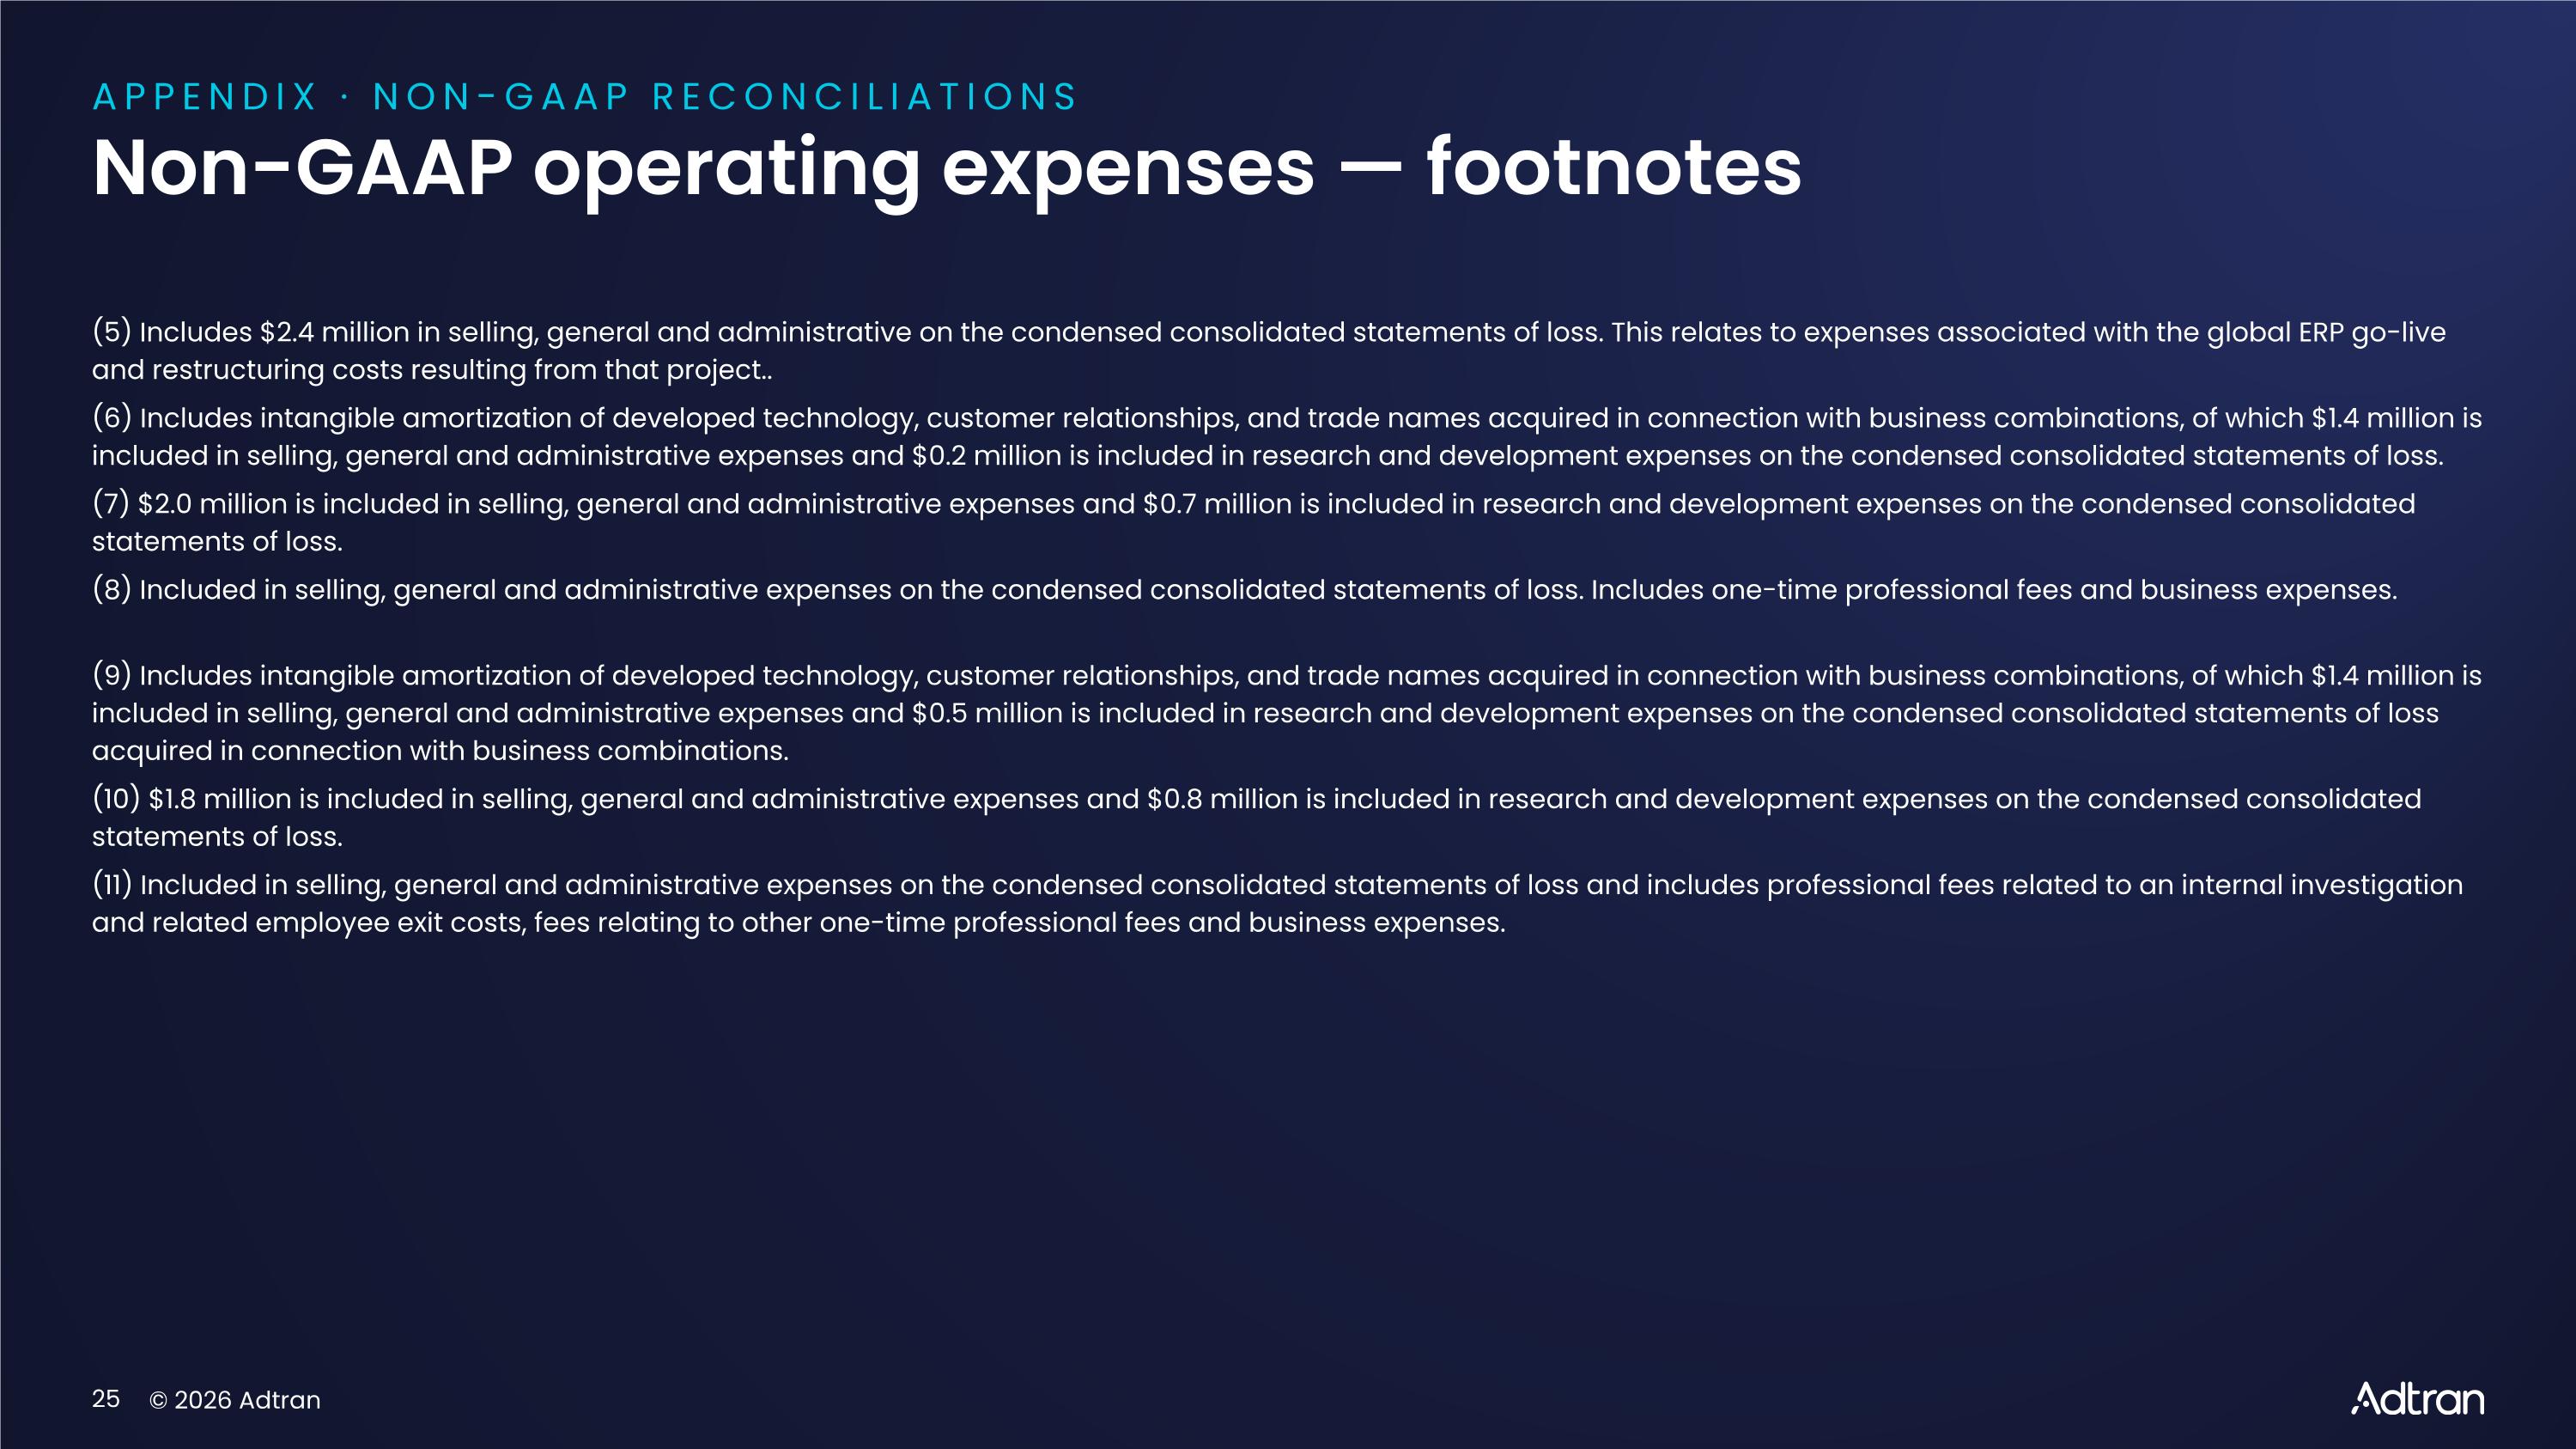
APPENDIX · NON-GAAP RECONCILIATIONS Non-GAAP operating expenses — footnotes (5) Includes $2.4 million in selling, general and administrative on the condensed consolidated statements of loss. This relates to expenses associated with the global ERP go-live and restructuring costs resulting from that project.. (6) Includes intangible amortization of developed technology, customer relationships, and trade names acquired in connection with business combinations, of which $1.4 million is included in selling, general and administrative expenses and $0.2 million is included in research and development expenses on the condensed consolidated statements of loss. (7) $2.0 million is included in selling, general and administrative expenses and $0.7 million is included in research and development expenses on the condensed consolidated statements of loss. (8) Included in selling, general and administrative expenses on the condensed consolidated statements of loss. Includes one-time professional fees and business expenses. (9) Includes intangible amortization of developed technology, customer relationships, and trade names acquired in connection with business combinations, of which $1.4 million is included in selling, general and administrative expenses and $0.5 million is included in research and development expenses on the condensed consolidated statements of loss acquired in connection with business combinations. (10) $1.8 million is included in selling, general and administrative expenses and $0.8 million is included in research and development expenses on the condensed consolidated statements of loss. (11) Included in selling, general and administrative expenses on the condensed consolidated statements of loss and includes professional fees related to an internal investigation and related employee exit costs, fees relating to other one-time professional fees and business expenses.
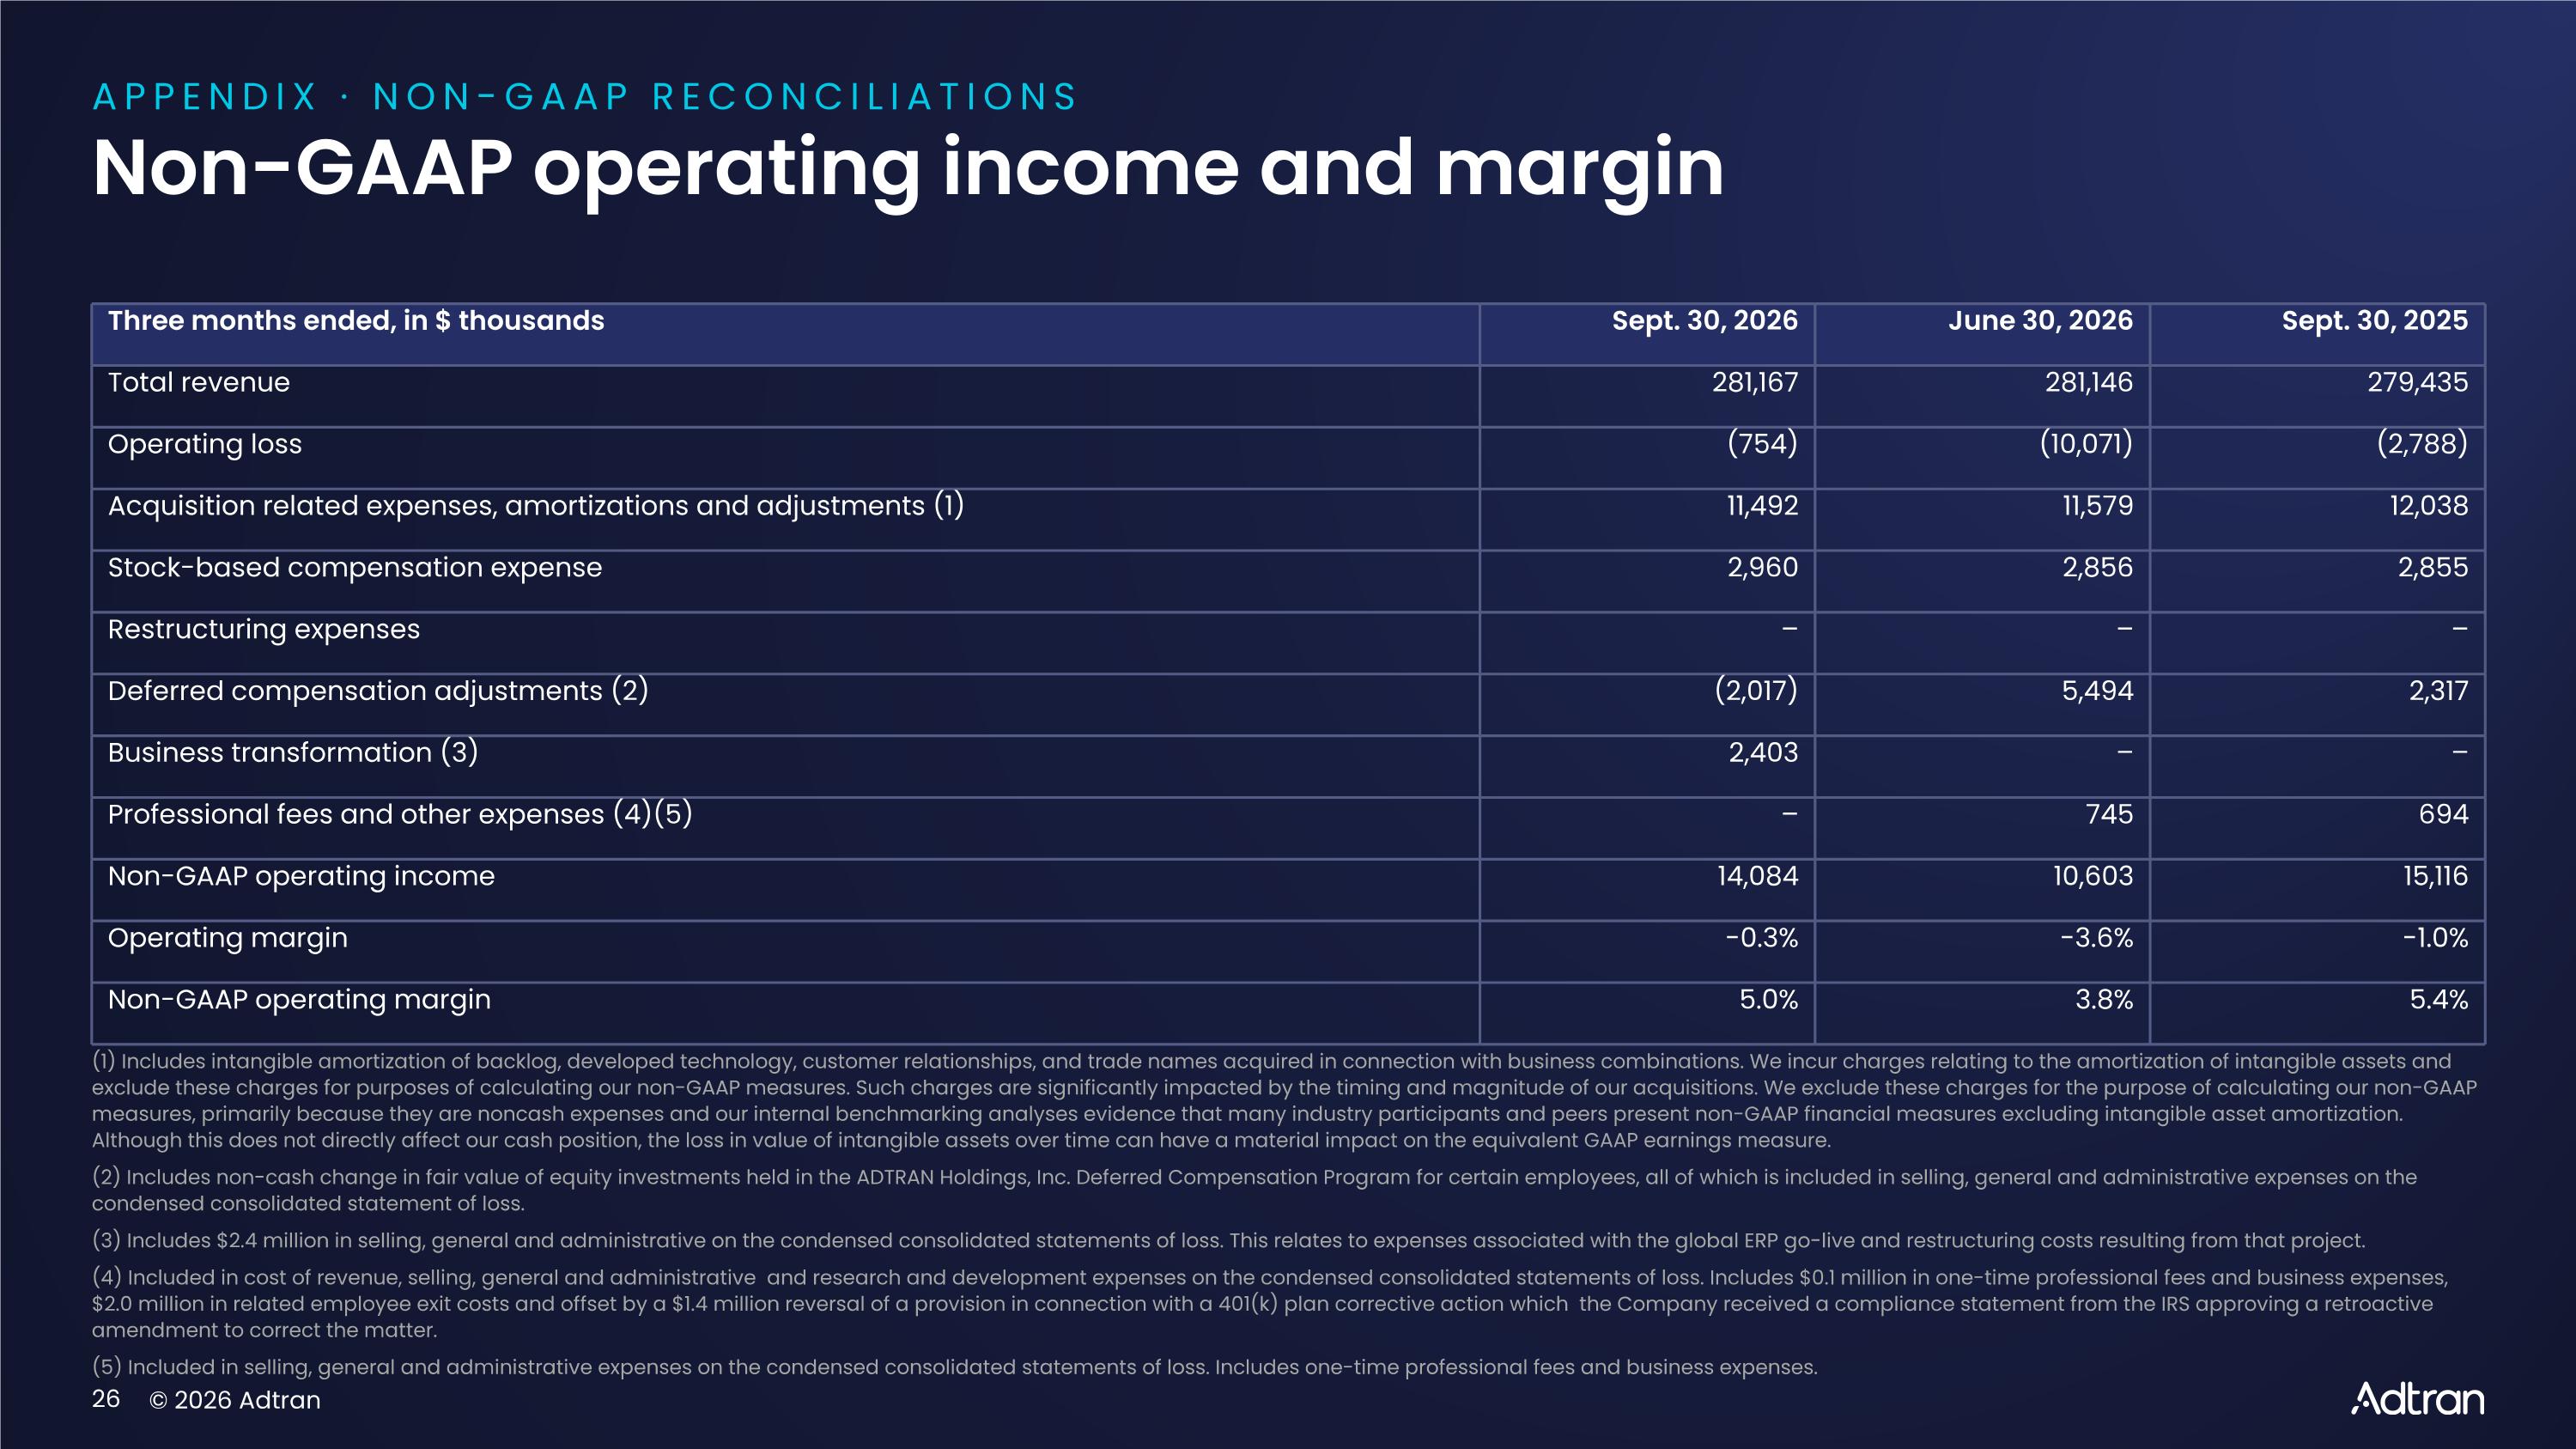
APPENDIX · NON-GAAP RECONCILIATIONS Non-GAAP operating income and margin Three months ended, in $ thousands Sept. 30, 2026 June 30, 2026 Sept. 30, 2025 Total revenue 281,167 281,146 279,435 Operating loss (754) (10,071) (2,788) Acquisition related expenses, amortizations and adjustments (1) 11,492 11,579 12,038 Stock-based compensation expense 2,960 2,856 2,855 Restructuring expenses – – – Deferred compensation adjustments (2) (2,017) 5,494 2,317 Business transformation (3) 2,403 – – Professional fees and other expenses (4)(5) – 745 694 Non-GAAP operating income 14,084 10,603 15,116 Operating margin -0.3% -3.6% -1.0% Non-GAAP operating margin 5.0% 3.8% 5.4% (1) Includes intangible amortization of backlog, developed technology, customer relationships, and trade names acquired in connection with business combinations. We incur charges relating to the amortization of intangible assets and exclude these charges for purposes of calculating our non-GAAP measures. Such charges are significantly impacted by the timing and magnitude of our acquisitions. We exclude these charges for the purpose of calculating our non-GAAP measures, primarily because they are noncash expenses and our internal benchmarking analyses evidence that many industry participants and peers present non-GAAP financial measures excluding intangible asset amortization. Although this does not directly affect our cash position, the loss in value of intangible assets over time can have a material impact on the equivalent GAAP earnings measure. (2) Includes non-cash change in fair value of equity investments held in the ADTRAN Holdings, Inc. Deferred Compensation Program for certain employees, all of which is included in selling, general and administrative expenses on the condensed consolidated statement of loss. (3) Includes $2.4 million in selling, general and administrative on the condensed consolidated statements of loss. This relates to expenses associated with the global ERP go-live and restructuring costs resulting from that project. (4) Included in cost of revenue, selling, general and administrative and research and development expenses on the condensed consolidated statements of loss. Includes $0.1 million in one-time professional fees and business expenses, $2.0 million in related employee exit costs and offset by a $1.4 million reversal of a provision in connection with a 401(k) plan corrective action which the Company received a compliance statement from the IRS approving a retroactive amendment to correct the matter. (5) Included in selling, general and administrative expenses on the condensed consolidated statements of loss. Includes one-time professional fees and business expenses.
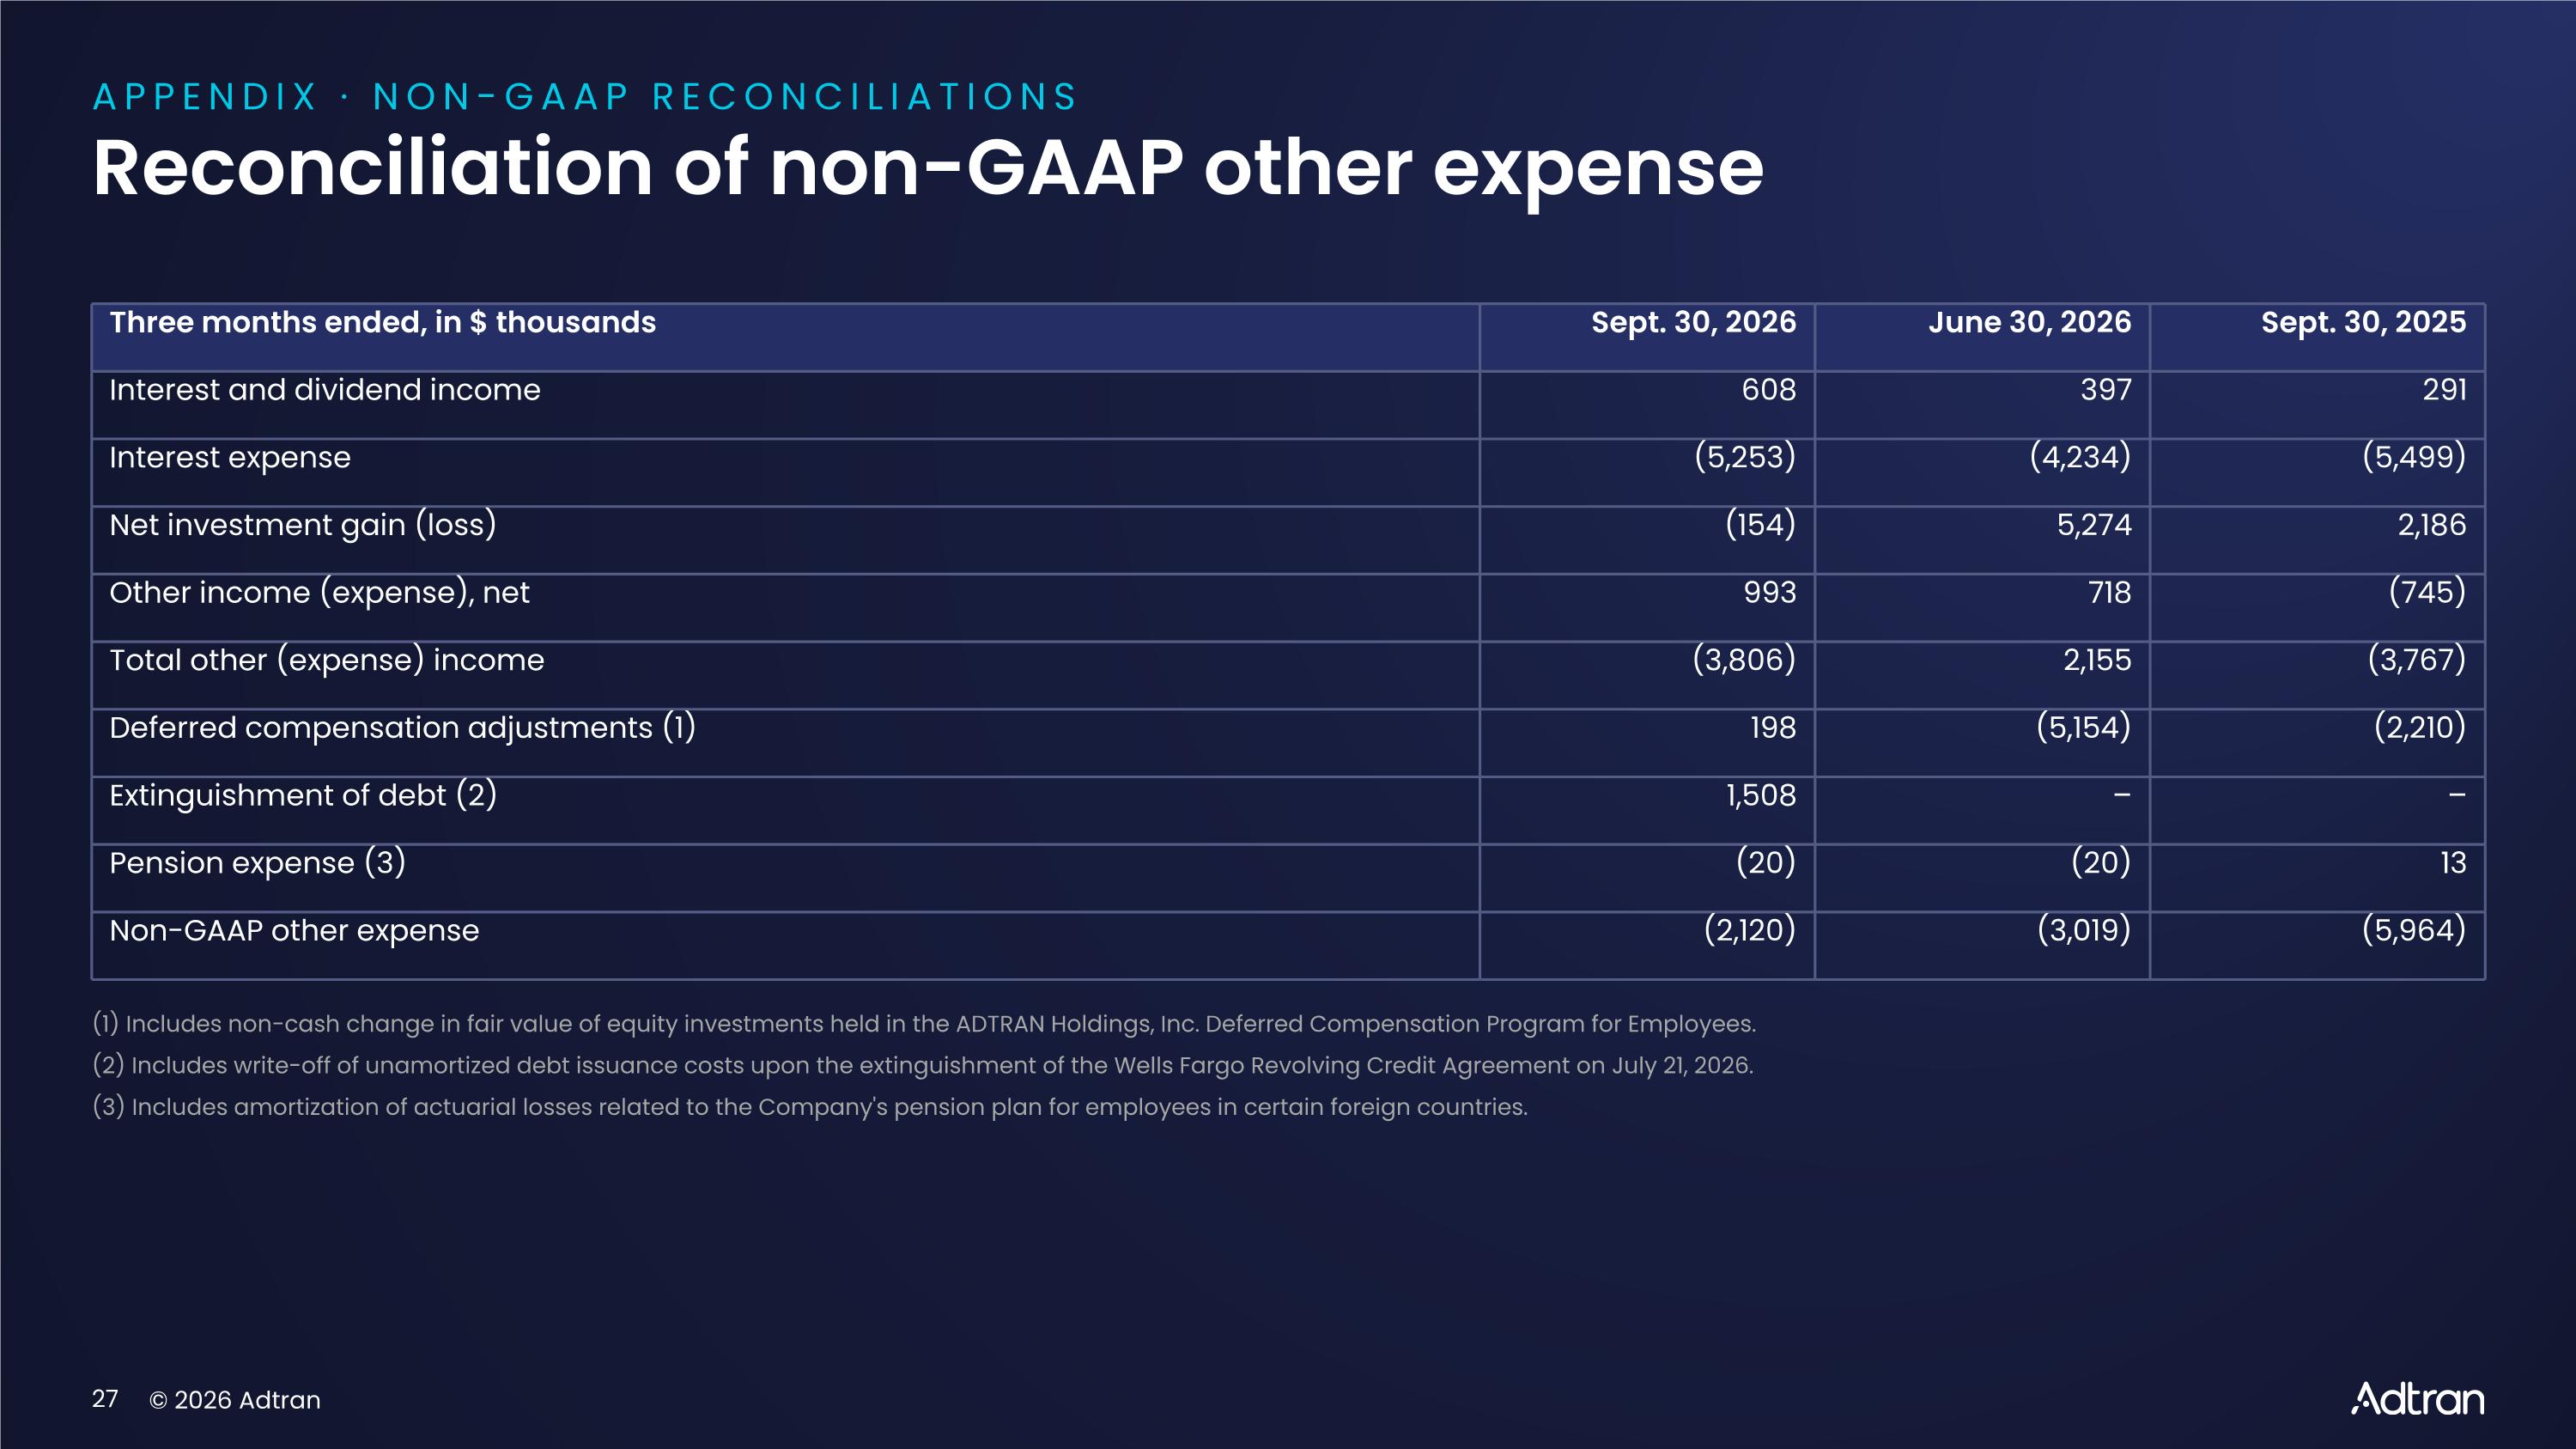
APPENDIX · NON-GAAP RECONCILIATIONS Reconciliation of non-GAAP other expense Three months ended, in $ thousands Sept. 30, 2026 June 30, 2026 Sept. 30, 2025 Interest and dividend income 608 397 291 Interest expense (5,253) (4,234) (5,499) Net investment gain (loss) (154) 5,274 2,186 Other income (expense), net 993 718 (745) Total other (expense) income (3,806) 2,155 (3,767) Deferred compensation adjustments (1) 198 (5,154) (2,210) Extinguishment of debt (2) 1,508 – – Pension expense (3) (20) (20) 13 Non-GAAP other expense (2,120) (3,019) (5,964) (1) Includes non-cash change in fair value of equity investments held in the ADTRAN Holdings, Inc. Deferred Compensation Program for Employees. (2) Includes write-off of unamortized debt issuance costs upon the extinguishment of the Wells Fargo Revolving Credit Agreement on July 21, 2026. (3) Includes amortization of actuarial losses related to the Company's pension plan for employees in certain foreign countries.
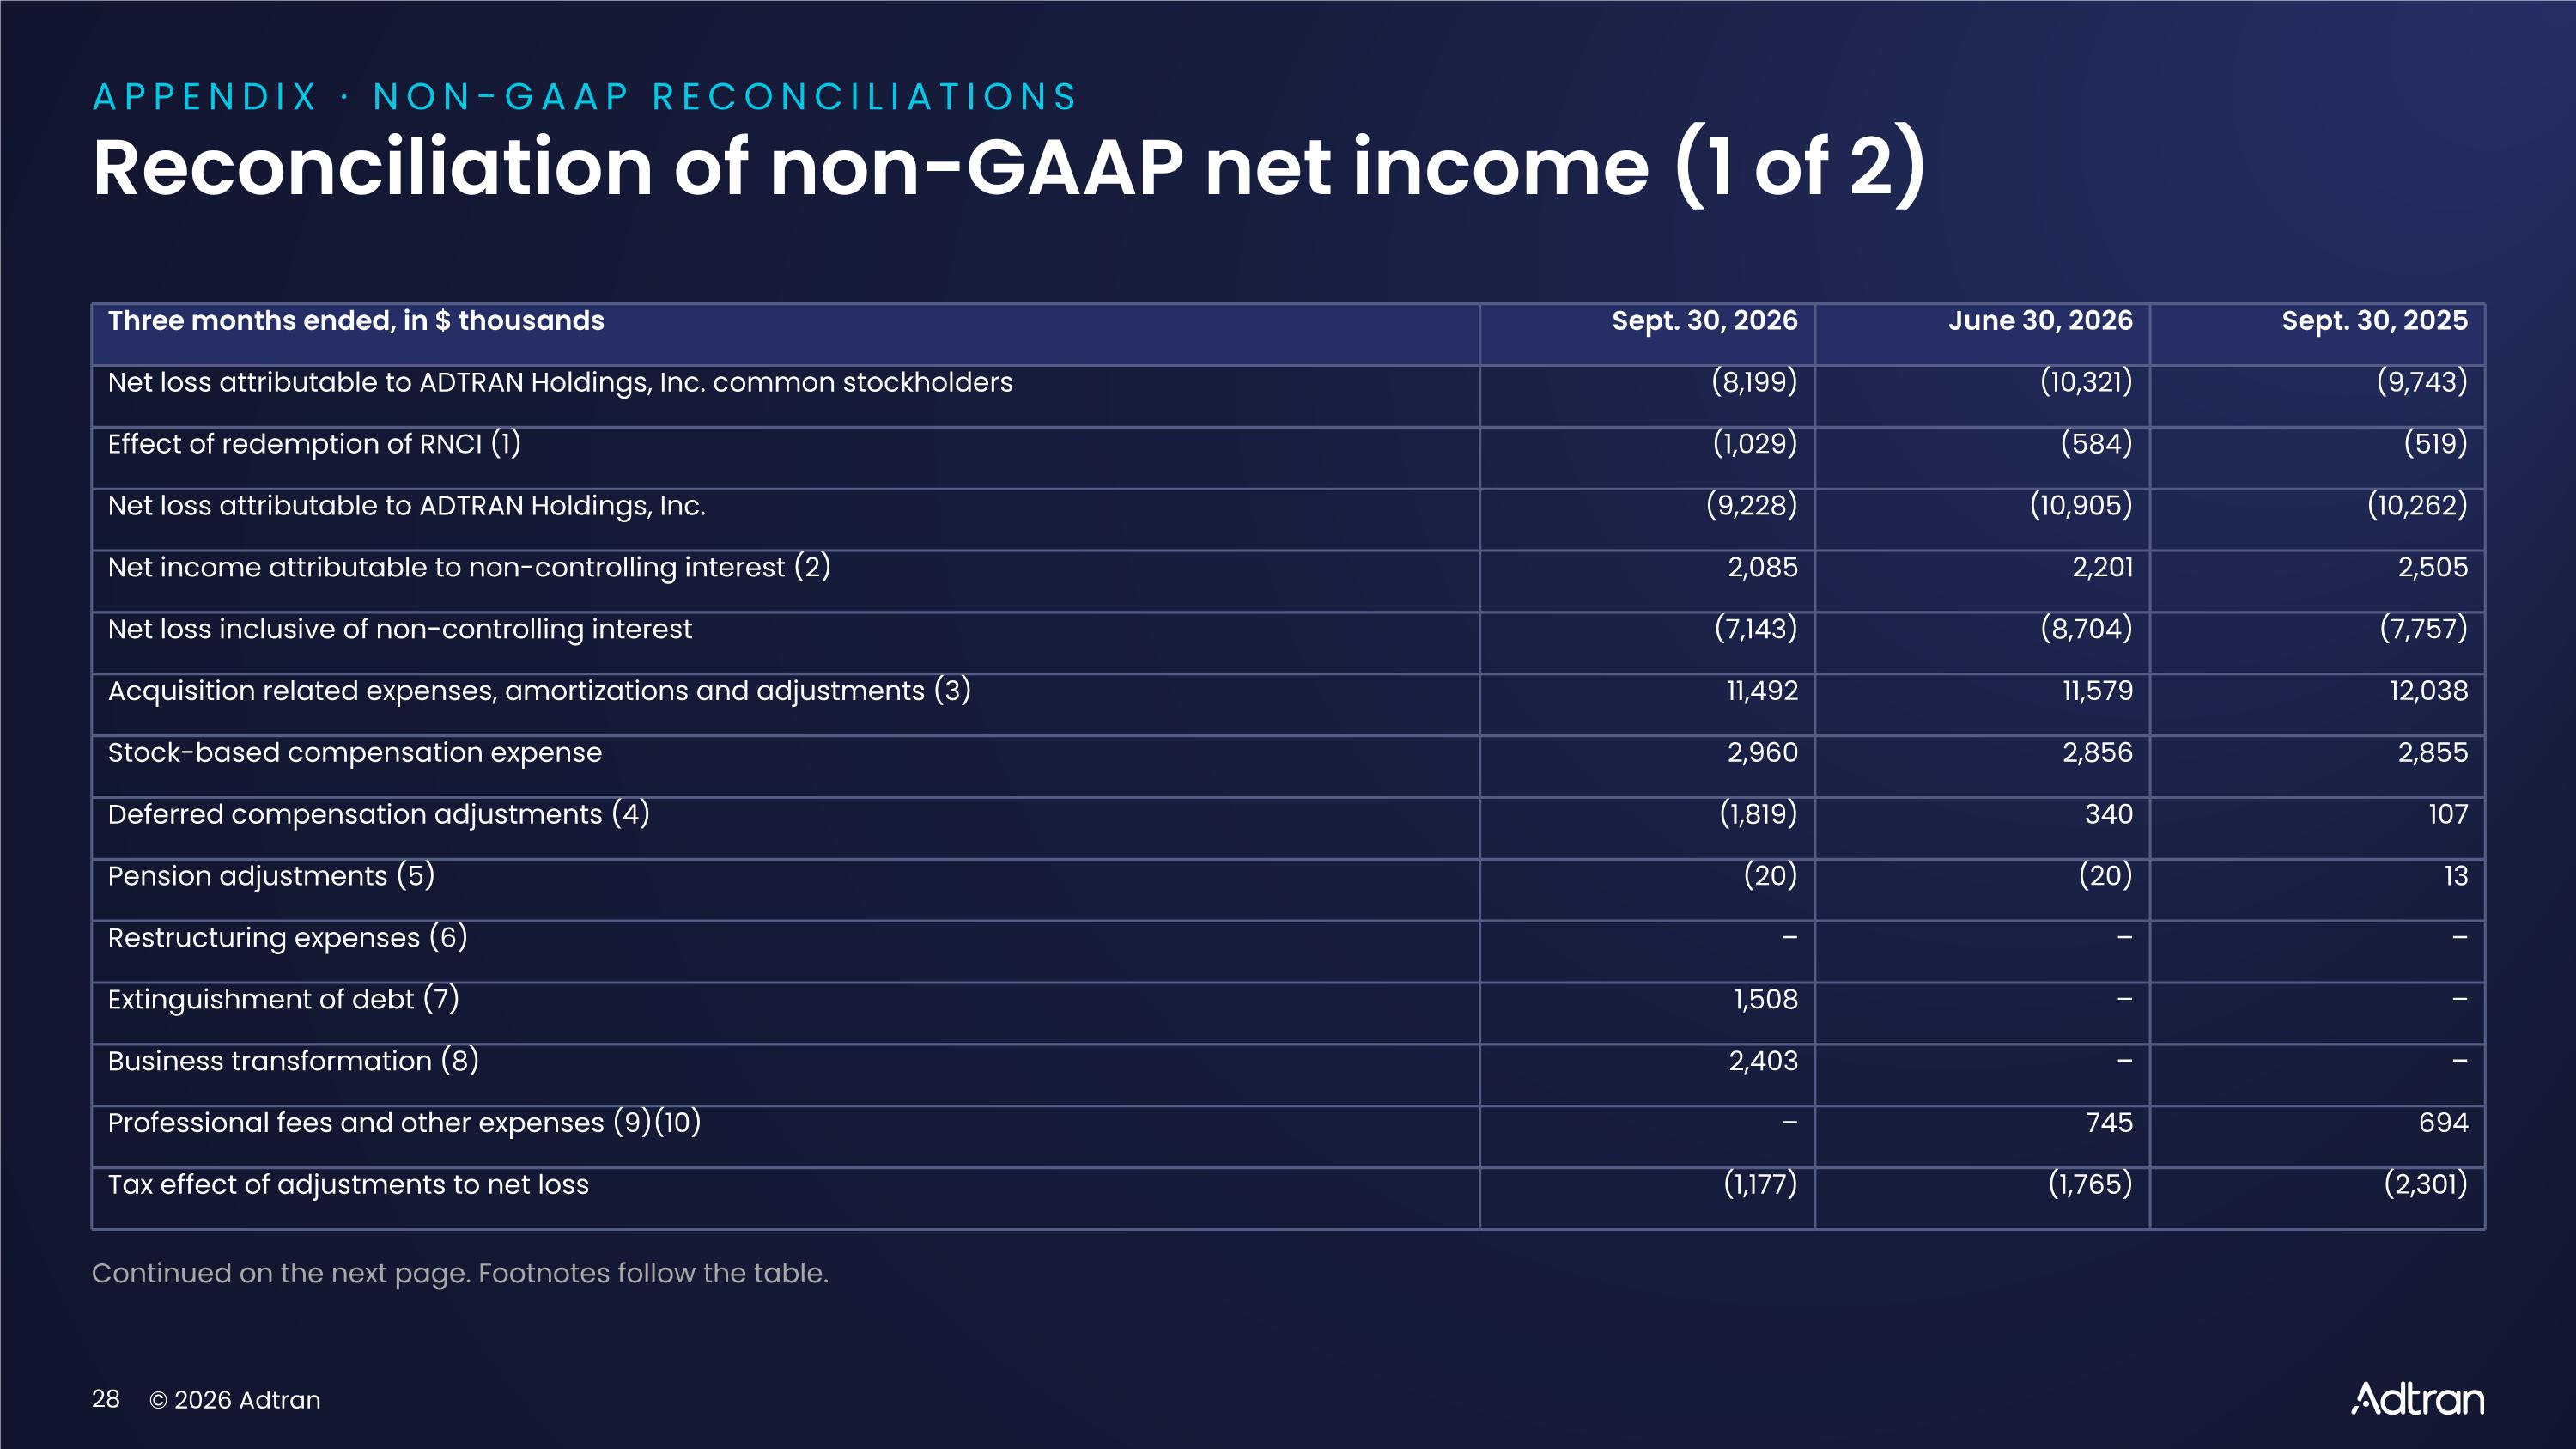
APPENDIX · NON-GAAP RECONCILIATIONS Reconciliation of non-GAAP net income (1 of 2) Three months ended, in $ thousands Sept. 30, 2026 June 30, 2026 Sept. 30, 2025 Net loss attributable to ADTRAN Holdings, Inc. common stockholders (8,199) (10,321) (9,743) Effect of redemption of RNCI (1) (1,029) (584) (519) Net loss attributable to ADTRAN Holdings, Inc. (9,228) (10,905) (10,262) Net income attributable to non-controlling interest (2) 2,085 2,201 2,505 Net loss inclusive of non-controlling interest (7,143) (8,704) (7,757) Acquisition related expenses, amortizations and adjustments (3) 11,492 11,579 12,038 Stock-based compensation expense 2,960 2,856 2,855 Deferred compensation adjustments (4) (1,819) 340 107 Pension adjustments (5) (20) (20) 13 Restructuring expenses (6) – – – Extinguishment of debt (7) 1,508 – – Business transformation (8) 2,403 – – Professional fees and other expenses (9)(10) – 745 694 Tax effect of adjustments to net loss (1,177) (1,765) (2,301) Continued on the next page. Footnotes follow the table.
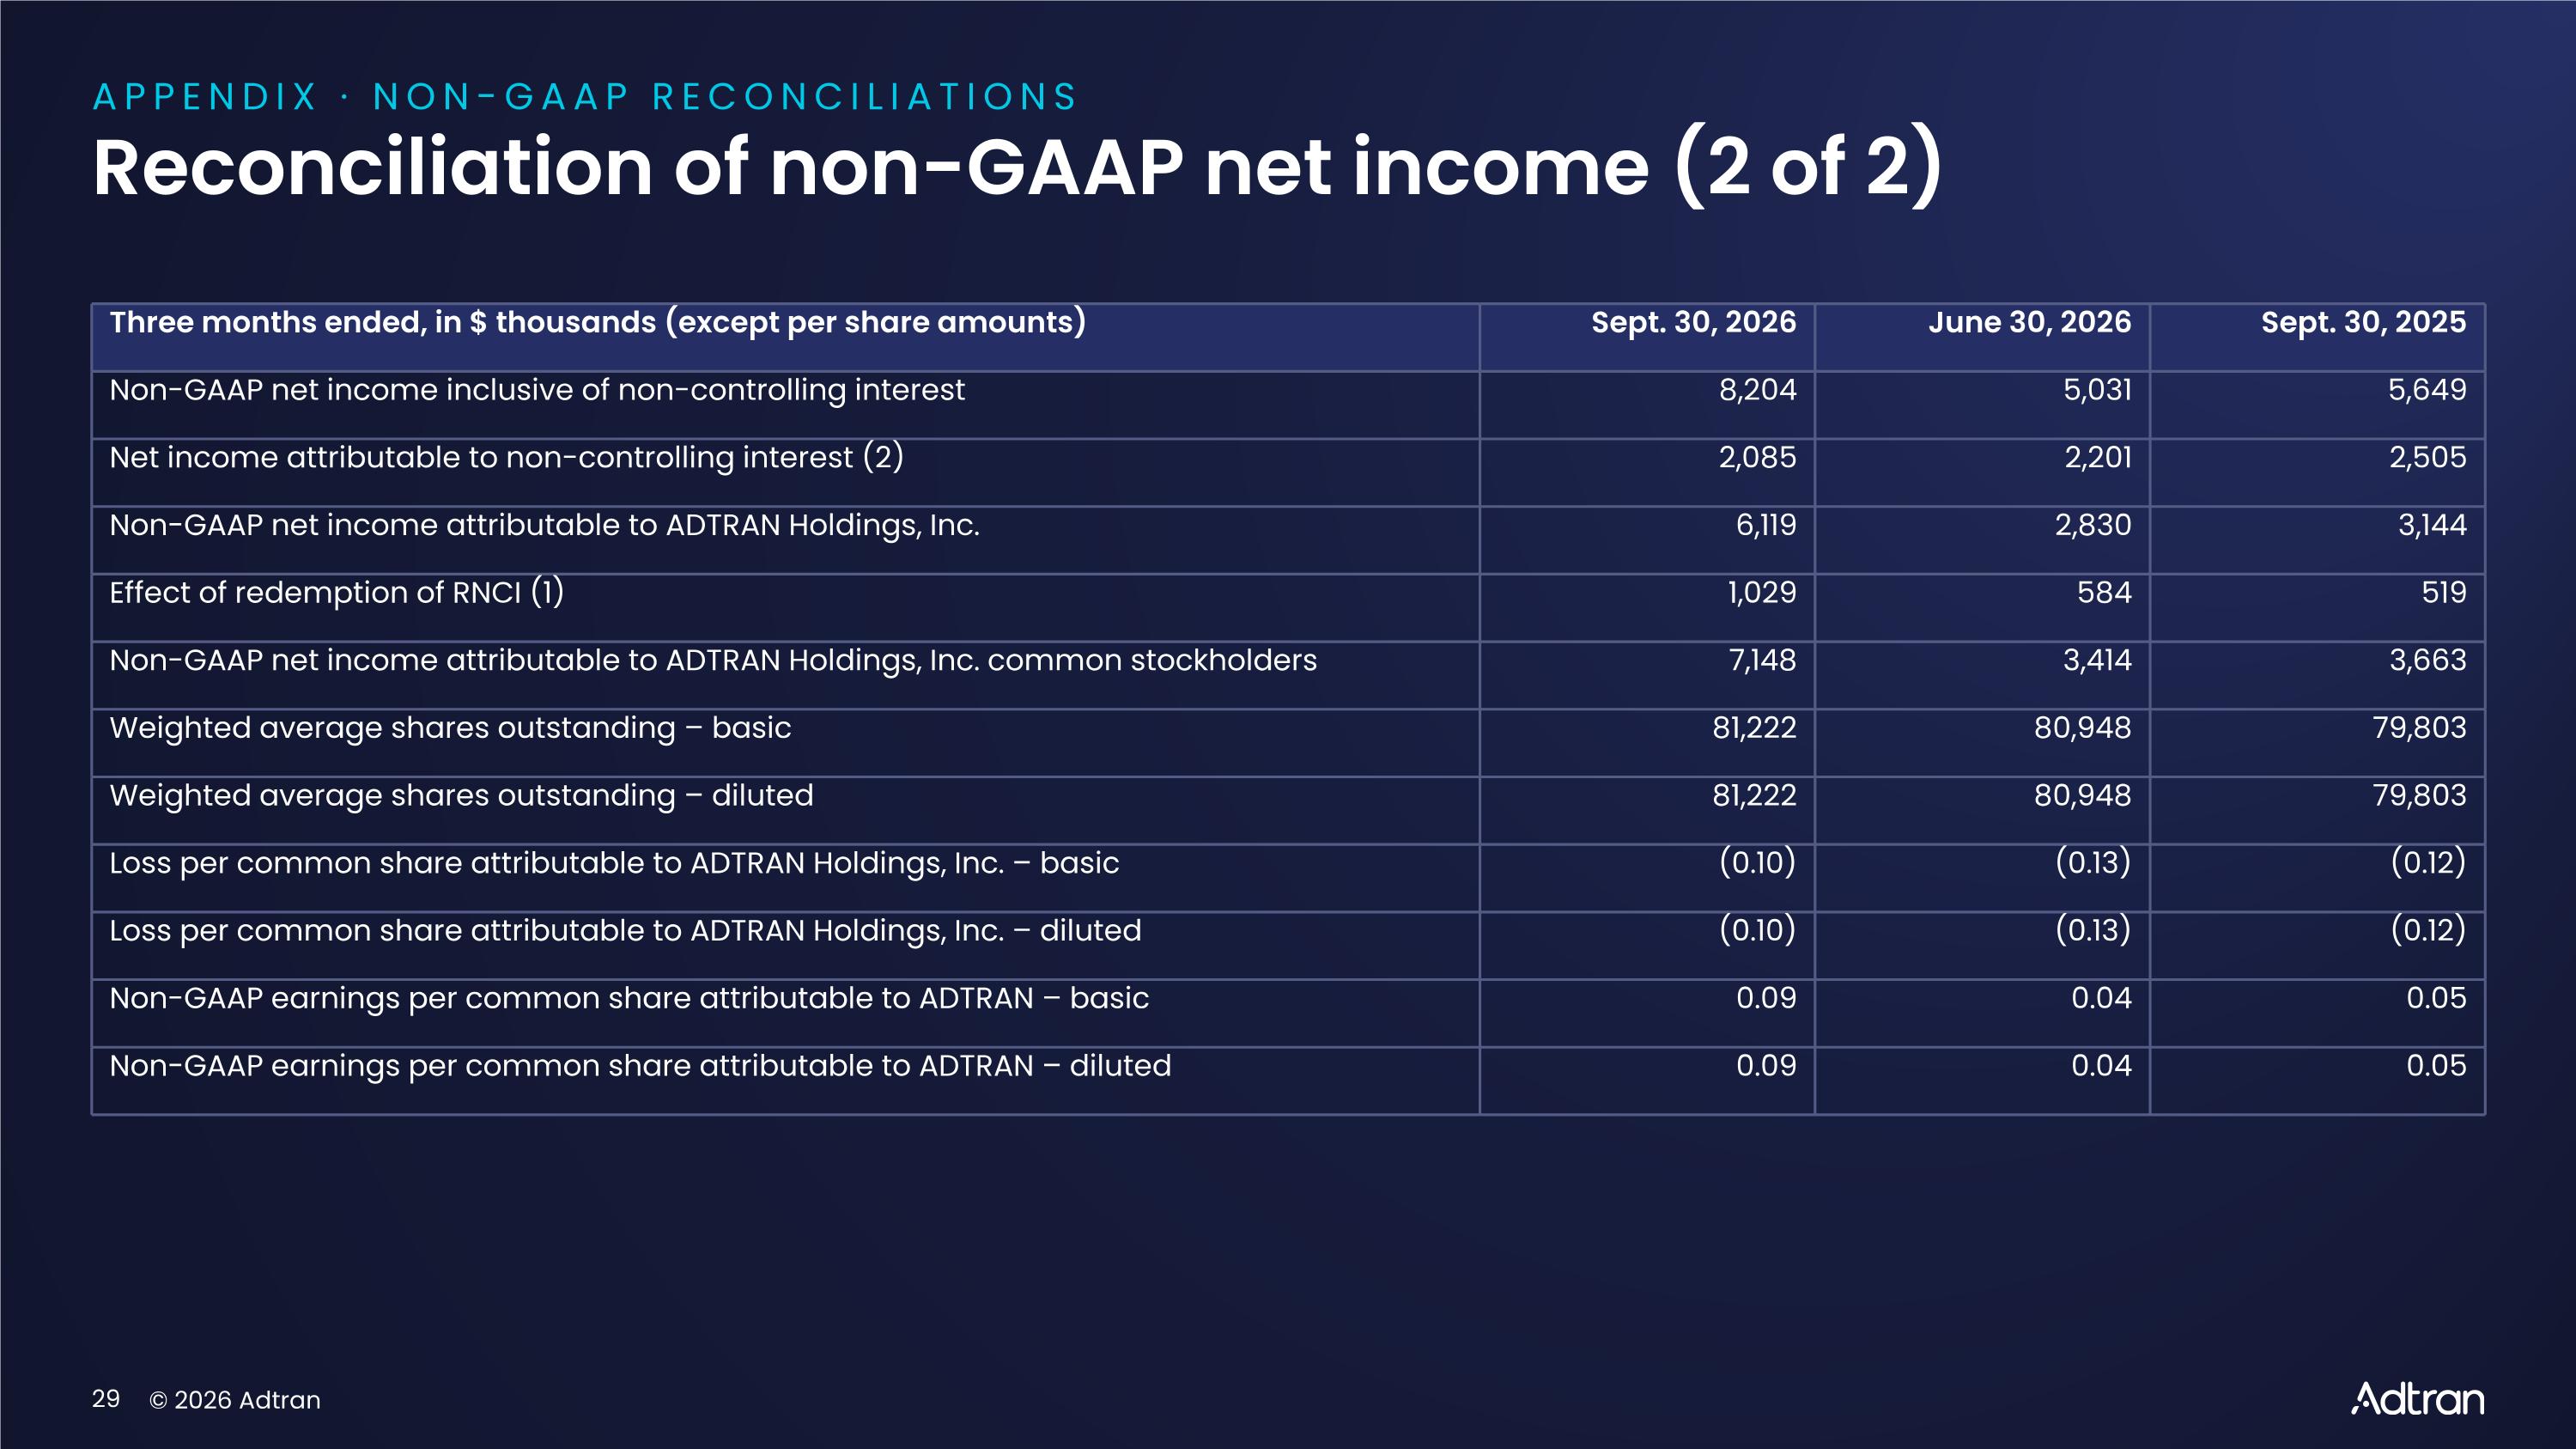
APPENDIX · NON-GAAP RECONCILIATIONS Reconciliation of non-GAAP net income (2 of 2) Three months ended, in $ thousands (except per share amounts) Sept. 30, 2026 June 30, 2026 Sept. 30, 2025 Non-GAAP net income inclusive of non-controlling interest 8,204 5,031 5,649 Net income attributable to non-controlling interest (2) 2,085 2,201 2,505 Non-GAAP net income attributable to ADTRAN Holdings, Inc. 6,119 2,830 3,144 Effect of redemption of RNCI (1) 1,029 584 519 Non-GAAP net income attributable to ADTRAN Holdings, Inc. common stockholders 7,148 3,414 3,663 Weighted average shares outstanding – basic 81,222 80,948 79,803 Weighted average shares outstanding – diluted 81,222 80,948 79,803 Loss per common share attributable to ADTRAN Holdings, Inc. – basic (0.10) (0.13) (0.12) Loss per common share attributable to ADTRAN Holdings, Inc. – diluted (0.10) (0.13) (0.12) Non-GAAP earnings per common share attributable to ADTRAN – basic 0.09 0.04 0.05 Non-GAAP earnings per common share attributable to ADTRAN – diluted 0.09 0.04 0.05
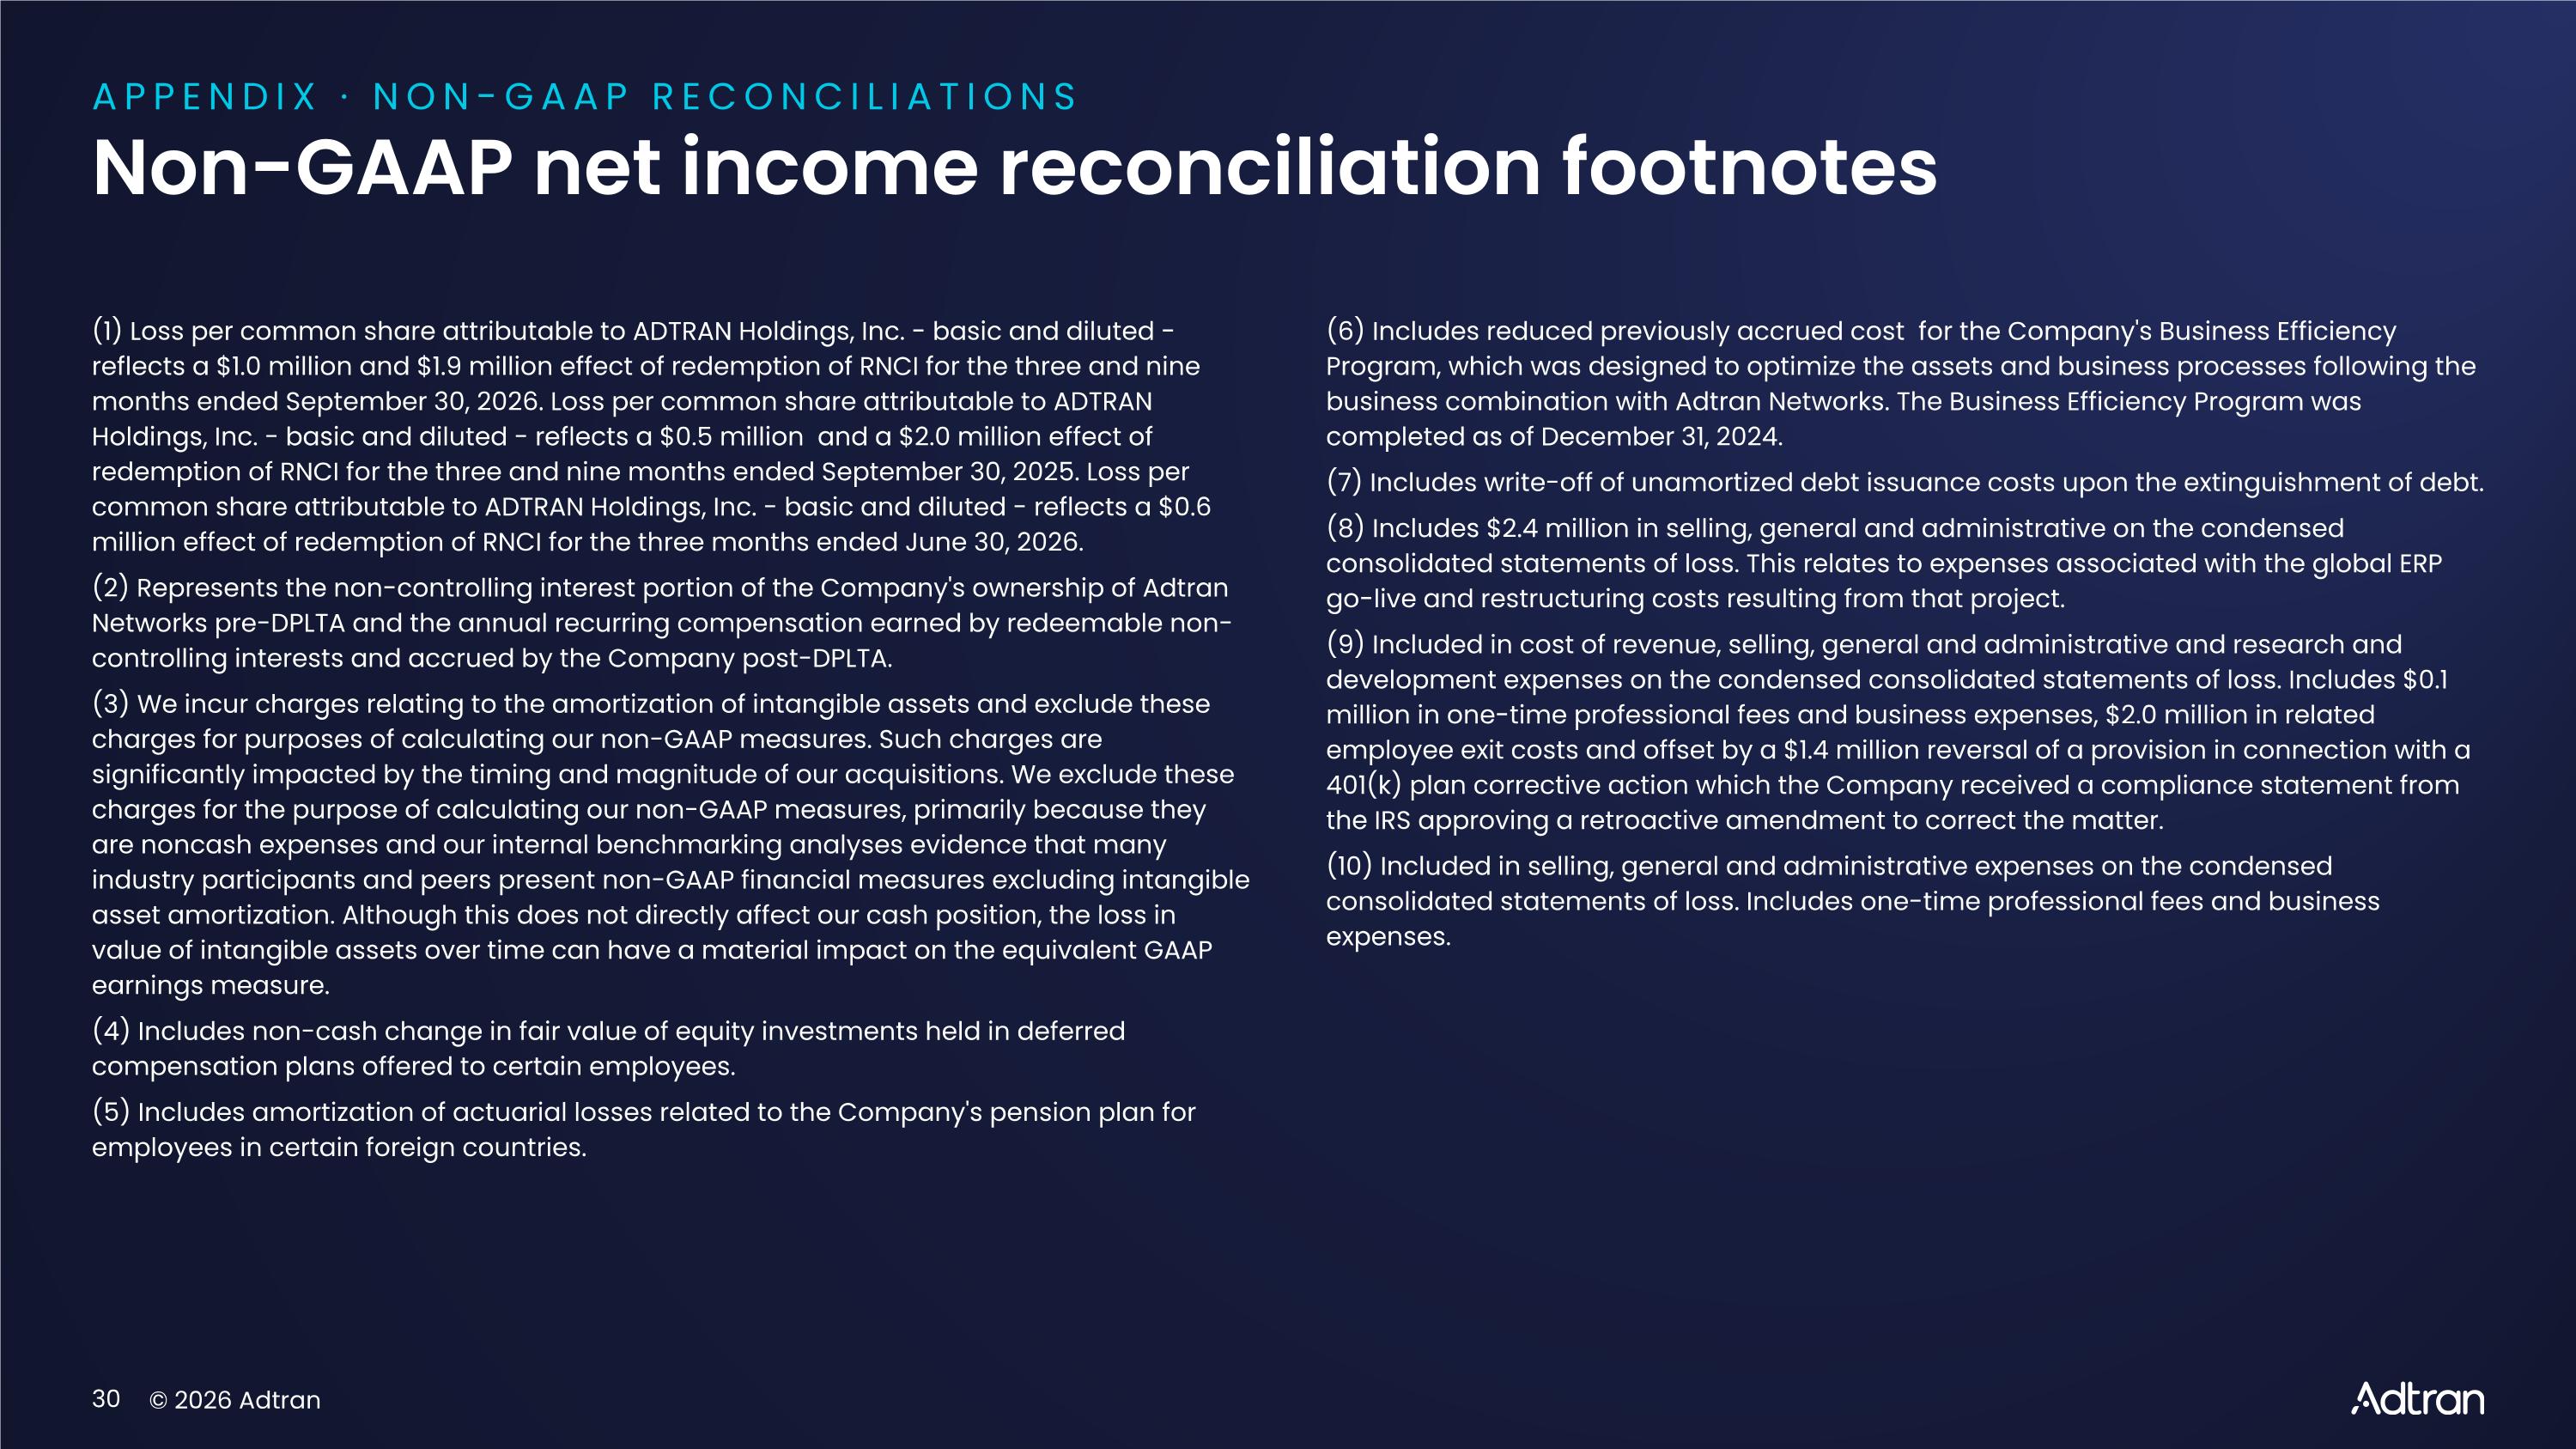
APPENDIX · NON-GAAP RECONCILIATIONS Non-GAAP net income reconciliation footnotes (1) Loss per common share attributable to ADTRAN Holdings, Inc. - basic and diluted - reflects a $1.0 million and $1.9 million effect of redemption of RNCI for the three and nine months ended September 30, 2026. Loss per common share attributable to ADTRAN Holdings, Inc. - basic and diluted - reflects a $0.5 million and a $2.0 million effect of redemption of RNCI for the three and nine months ended September 30, 2025. Loss per common share attributable to ADTRAN Holdings, Inc. - basic and diluted - reflects a $0.6 million effect of redemption of RNCI for the three months ended June 30, 2026. (2) Represents the non-controlling interest portion of the Company's ownership of Adtran Networks pre-DPLTA and the annual recurring compensation earned by redeemable non-controlling interests and accrued by the Company post-DPLTA. (3) We incur charges relating to the amortization of intangible assets and exclude these charges for purposes of calculating our non-GAAP measures. Such charges are significantly impacted by the timing and magnitude of our acquisitions. We exclude these charges for the purpose of calculating our non-GAAP measures, primarily because they are noncash expenses and our internal benchmarking analyses evidence that many industry participants and peers present non-GAAP financial measures excluding intangible asset amortization. Although this does not directly affect our cash position, the loss in value of intangible assets over time can have a material impact on the equivalent GAAP earnings measure. (4) Includes non-cash change in fair value of equity investments held in deferred compensation plans offered to certain employees. (5) Includes amortization of actuarial losses related to the Company's pension plan for employees in certain foreign countries. (6) Includes reduced previously accrued cost for the Company's Business Efficiency Program, which was designed to optimize the assets and business processes following the business combination with Adtran Networks. The Business Efficiency Program was completed as of December 31, 2024. (7) Includes write-off of unamortized debt issuance costs upon the extinguishment of debt. (8) Includes $2.4 million in selling, general and administrative on the condensed consolidated statements of loss. This relates to expenses associated with the global ERP go-live and restructuring costs resulting from that project. (9) Included in cost of revenue, selling, general and administrative and research and development expenses on the condensed consolidated statements of loss. Includes $0.1 million in one-time professional fees and business expenses, $2.0 million in related employee exit costs and offset by a $1.4 million reversal of a provision in connection with a 401(k) plan corrective action which the Company received a compliance statement from the IRS approving a retroactive amendment to correct the matter. (10) Included in selling, general and administrative expenses on the condensed consolidated statements of loss. Includes one-time professional fees and business expenses.
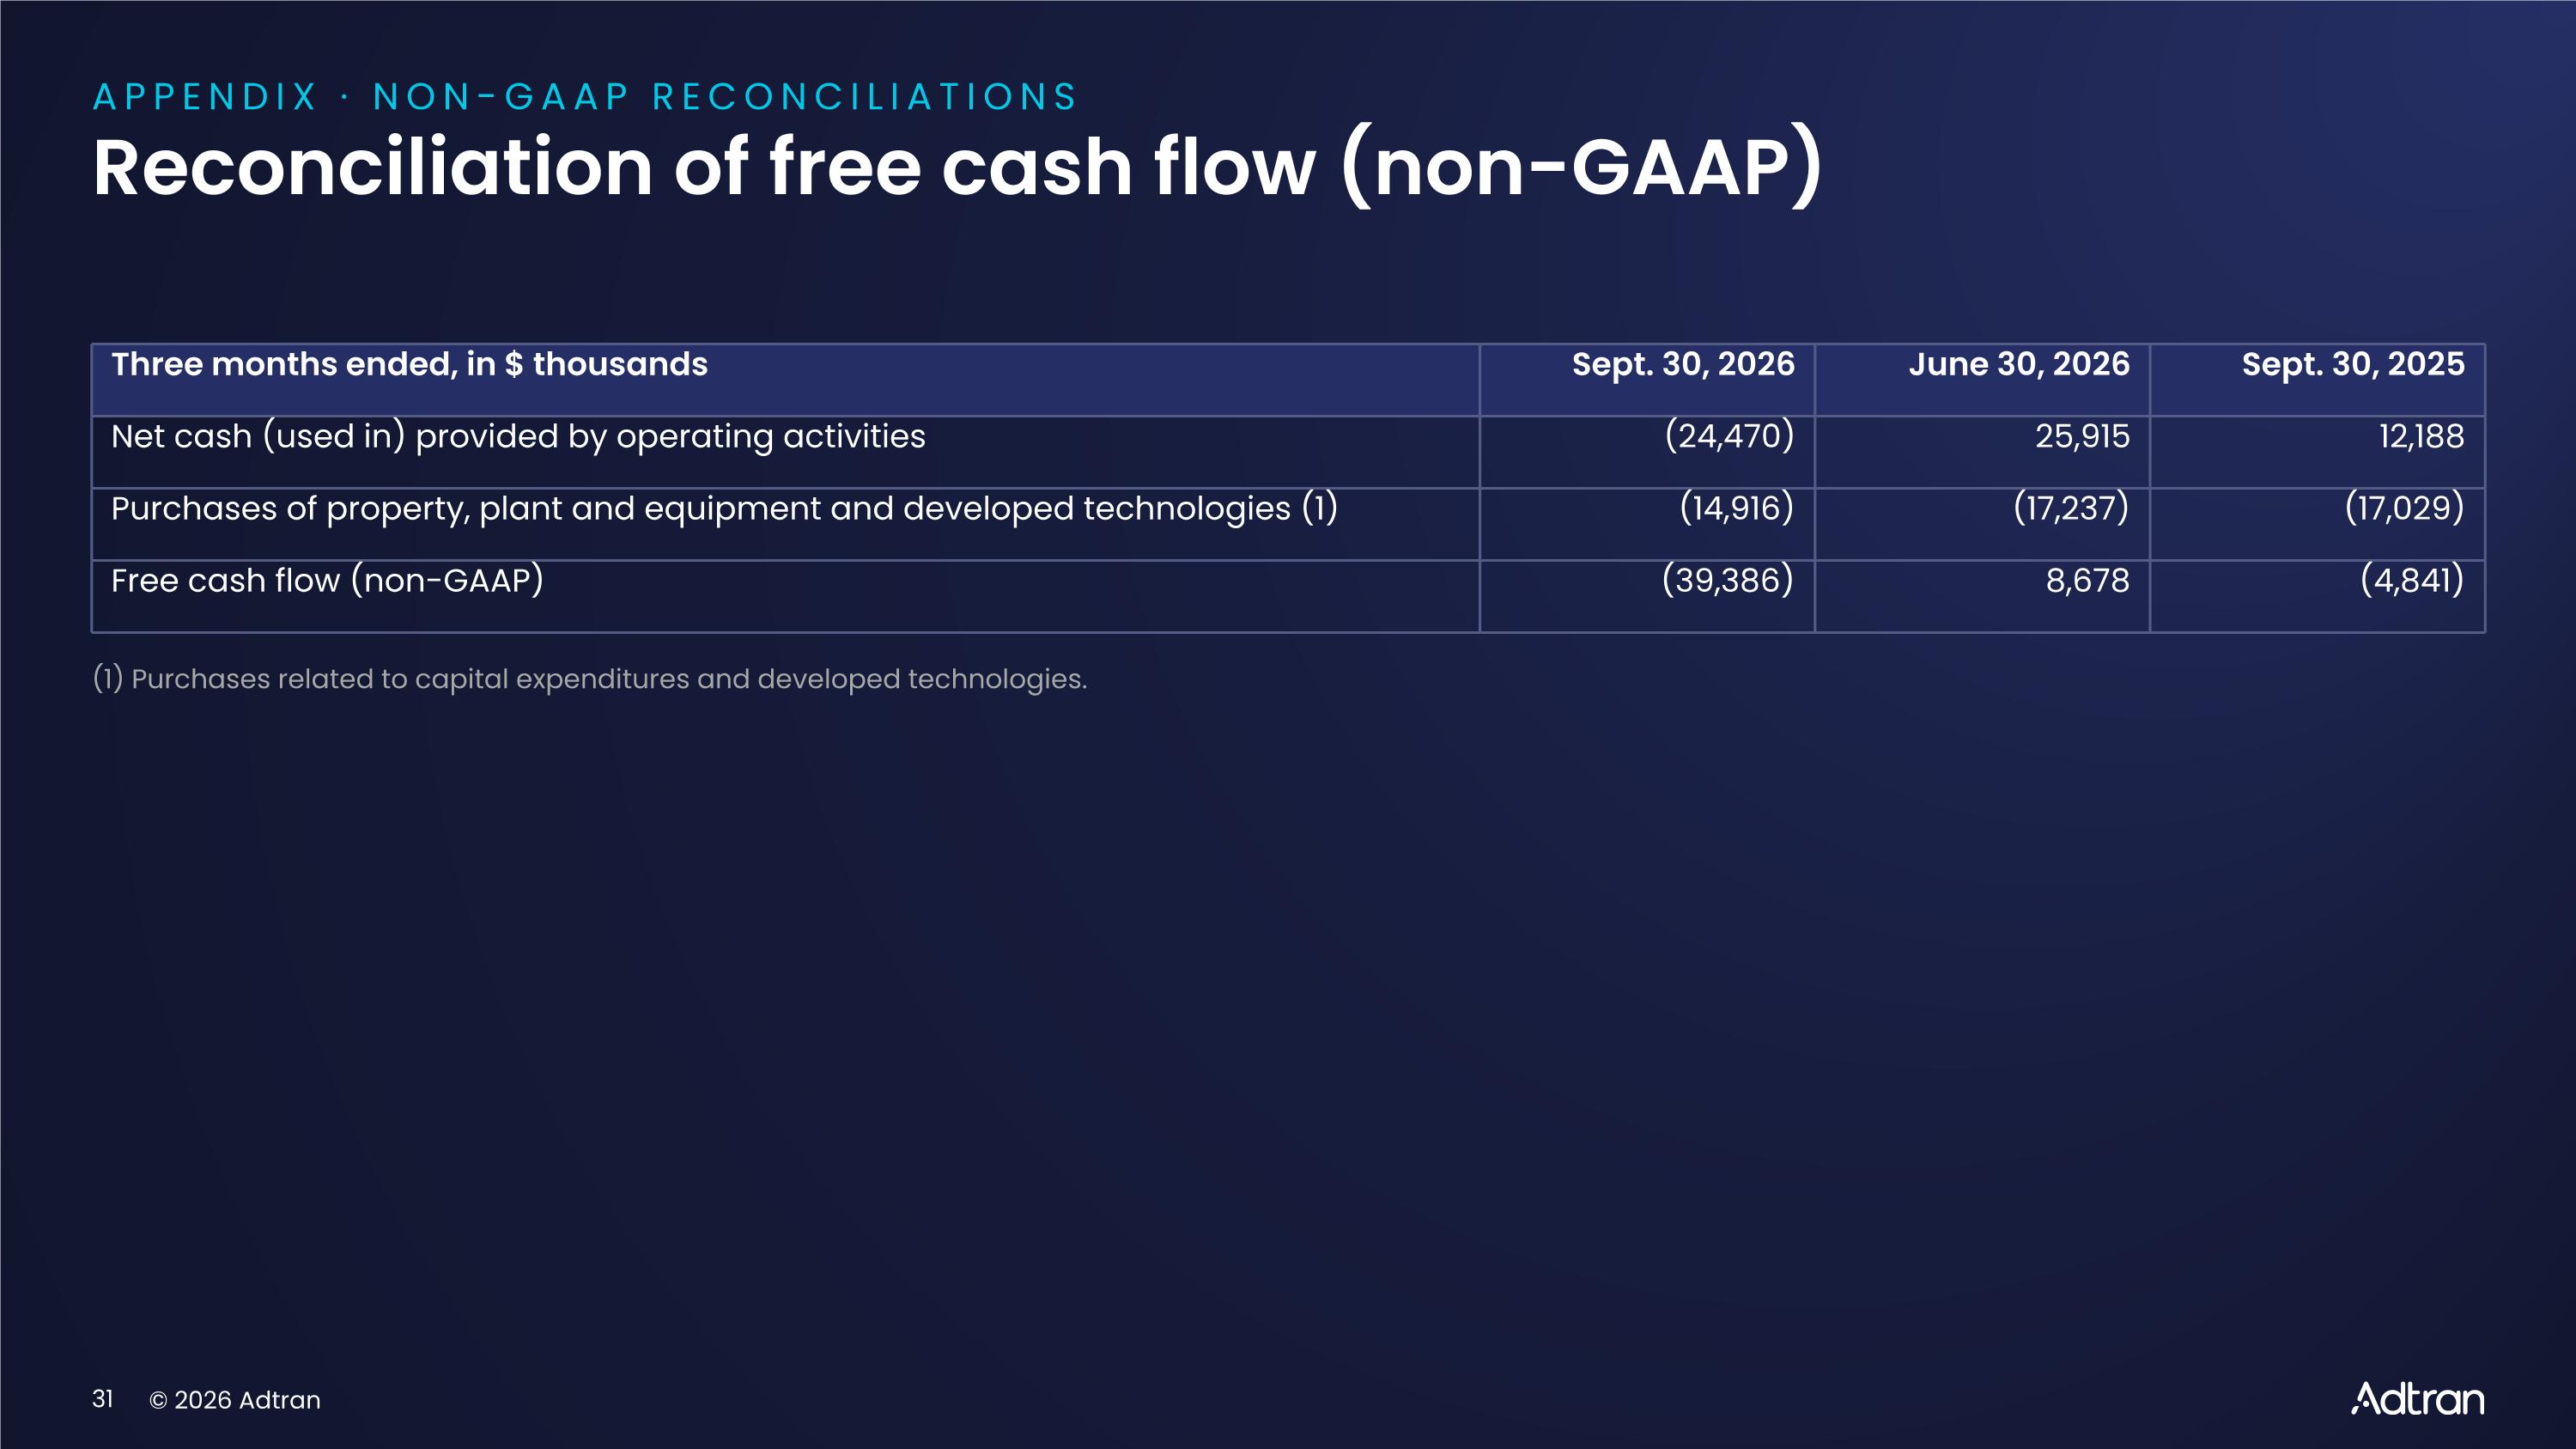
APPENDIX · NON-GAAP RECONCILIATIONS Reconciliation of free cash flow (non-GAAP) Three months ended, in $ thousands Sept. 30, 2026 June 30, 2026 Sept. 30, 2025 Net cash (used in) provided by operating activities (24,470) 25,915 12,188 Purchases of property, plant and equipment and developed technologies (1) (14,916) (17,237) (17,029) Free cash flow (non-GAAP) (39,386) 8,678 (4,841) (1) Purchases related to capital expenditures and developed technologies.