Stevanato Group Q3 2026 Financial Results November 3, 2026 Exhibit 99.1
Safe Harbor Statement Forward-Looking Statements This presentation contains certain forward-looking statements within the meaning of the Private Securities Litigation Reform Act of 1995 that reflect the current views of Stevanato Group S.p.A. (“we”, “our”, “us”, “Stevanato Group” or the “Company”) and which involve known and unknown risks, uncertainties and assumptions because they relate to events and depend on circumstances that will occur in the future whether or not within the control of the Company. These forward-looking statements include, or may include words such as "strong," "continued," "meeting," "meet," "will continue," "deliver," "expanding," "on track," "remains," "confidence," "meaningful," "increasing," "growing," "continue," "expect," "anticipate," "driven," "robust," and other similar terminology. Forward-looking statements contained in this presentation include, but are not limited to, statements about: our future financial performance, including our revenue, operating expenses and our ability to maintain profitability and operational and commercial capabilities; our expectations regarding the development of our industry and the competitive environment in which we operate; the expansion of our plants and sites, and our expectations related to our capacity expansion; the global supply chain and our committed orders; customer demand and customers’ ability to destock higher inventories accumulated during the COVID-19 pandemic; the success of the Company's initiatives to optimize the industrial footprint, harmonize processes and enhance supply chain and logistics strategies; our geographical and industrial footprint; and our goals, strategies, and investment plans. These statements are neither promises nor guarantees but involve known and unknown risks, uncertainties and other important factors and circumstances that may cause Stevanato Group’s actual results, performance or achievements to be materially different from its expectations expressed or implied by the forward-looking statements, including conditions of the U.S. capital markets, negative global economic conditions, inflation, the impact of the conflict between Russia and Ukraine, the evolving events in Israel and Gaza, the Iran regional conflict (including U.S. participation), supply chain and logistical challenges and other negative developments affecting Stevanato Group’s business or unfavorable legislative or regulatory developments. The following are some of the factors that could cause our actual results to differ materially from those expressed in or underlying our forward-looking statements: (i) our product offerings are highly complex, and, if our products do not satisfy applicable quality criteria, specifications and performance standards, we could experience lost sales, delayed or reduced market acceptance of our products, increased costs and damage to our reputation; (ii) we must develop new products and enhance existing products, adapt to significant technological and innovative changes and respond to introductions of new products by competitors to remain competitive; (iii) if we fail to maintain and enhance our brand and reputation, our business, results of operations and prospects may be materially and adversely affected; (iv) we are highly dependent on our management and employees. Competition for our employees is intense, and we may not be able to attract and retain the highly skilled employees that we need to support our business and our intended future growth; (v) our business, financial condition and results of operations depend upon maintaining our relationships with suppliers and service providers; (vi) our business, financial condition and results of operations depend upon the availability and price of high-quality materials and energy supply and our ability to contain production costs; (vii) significant interruptions in our operations could harm our business, financial condition and results of operations; (viii) as a consequence of the COVID-19 pandemic, sales of vials to and for vaccination programs globally increased resulting in a revenue growth acceleration. The demand for such products may shrink, as the need for COVID-19 related solutions continue to decline; (ix) our manufacturing facilities are subject to operating hazards which may lead to production curtailments or shutdowns and have an adverse effect on our business, results of operations, financial condition or cash flows; (x) our business, financial condition and results of operations may be impacted by our ability to successfully expand capacity to meet customer demand ; (xi) the loss of a significant number of customers or a reduction in orders from a significant number of customers, including through destocking initiatives or lack of transparency of our products held by customers, could reduce our sales and harm our financial performance; (xii) we may face significant competition in implementing our strategies for revenue growth in light of actions taken by our competitors; (xiii) our global operations are subject to international market risks that may have a material effect on our liquidity, financial condition, results of operations and cash flows; (xiv) we are required to comply with a wide variety of laws and regulations and are subject to regulation by various federal, state and foreign agencies; (xv) given the relevance of our activities in the healthcare sector, investments by non-Italian entities in the Company, as well as certain asset disposals by the Company, may be subject to the prior authorization of the Italian Government (so called “golden powers”); (xvi) if relations between China and the U.S. deteriorate (including in connection with the current trade policy of the U.S. government), our business in the U.S. and China could be materially and adversely affected; (xvii) the U.S. government recently imposed tariffs on certain product manufactured in several jurisdictions, including China and the European Union, and has made announcements regarding the potential imposition of tariffs on other jurisdictions. Such tariffs as well as other trade policies that the U.S. government may implement in the future and the restrictive trade measures that other countries may adopt in response thereto, could adversely affect our business by making it more difficult or costly to trade goods between different jurisdictions; (xviii) cyber security risks and the failure to maintain the confidentiality, integrity and availability of our computer hardware, software and internet applications and related tools and functions, could result in damage to our reputation, data integrity and/or subject us to costs, fines or lawsuits under data privacy or other laws or contractual requirements; (xix) our trade secrets may be misappropriated or disclosed, and confidentiality agreements with directors, employees and third parties may not adequately prevent disclosure of trade secrets and protect other proprietary information; (xx) if we are unable to obtain and maintain patent protection for our technology, products and potential products, or if the scope of the patent protection obtained is not sufficiently broad, we may not be able to compete effectively in our markets; (xxi) we depend in part on proprietary technology licensed from others, and if we lose our existing licenses or are unable to acquire or license additional proprietary rights from third parties, we may not be able to continue developing our potential products; and (xxii) we are obligated to maintain proper and effective internal control over financial reporting. Our internal controls were not effective for the year ended December 31, 2025, and in the future may not be determined to be effective, which may adversely affect investor confidence in us and, as a result, the value of our ordinary shares; and any other risk described under the headings “Risk Factors”, “Operating and Financial Review and Prospects” and “Business” in our most recent Annual Report on Form 20-F filed with the U.S. Securities and Exchange Commission. This list is not exhaustive. We therefore caution you against relying on these forward-looking statements and we qualify all of our forward-looking statements by these cautionary statements. These forward-looking statements speak only as at their dates. The Company undertakes no obligation to update any forward-looking statement or statements to reflect events or circumstances after the date on which such statement is made or to reflect the occurrence of unanticipated events. New factors emerge from time to time, and it is not possible to predict all of these factors. Further, the Company cannot assess the impact of each such factor on our business or the extent to which any factor, or combination of factors, may cause actual results to be materially different from those contained in any forward-looking statements. For a description of certain additional factors that could cause the Company’s future results to differ from those expressed in any such forward-looking statements, refer to the risk factors discussed in our most recent Annual Report on Form 20-F filed with the U.S. Securities and Exchange Commission. Non-GAAP Financial Information This presentation contains non-GAAP financial measures. Please refer to the tables included in this presentation for a reconciliation of non-GAAP financial measures. Management monitors and evaluates its operating and financial performance using several non-GAAP financial measures, including Constant Currency Revenue, Organic Revenue and Change in Organic Revenue, EBITDA, Adjusted EBITDA, Adjusted EBITDA Margin, Adjusted Operating Profit, Adjusted Operating Profit Margin, Adjusted Income Taxes, Adjusted Net Profit, Adjusted Diluted EPS, Capital Employed, Net Cash, Free Cash Flow and CAPEX. The Company believes that these non-GAAP financial measures provide useful and relevant information regarding its performance and improve its ability to assess its financial condition. While similar measures are widely used in the industry in which the Company operates, the financial measures it uses may not be comparable to other similarly titled measures used by other companies, nor are they intended to be substitutes for measures of financial performance or financial position as prepared in accordance with IFRS. Accordingly, you should not place undue reliance on any non-IFRS financial measures contained in this presentation. Q3 2026 Financial Results

Stevanato Group Q3 2026 Financial Results Earnings Call Marco Dal Lago CFO Lisa Miles CCO & IR Franco Stevanato Chairman & CEO Q3 2026 Financial Results
Franco Stevanato Chairman & CEO Q3 2026 Financial Results
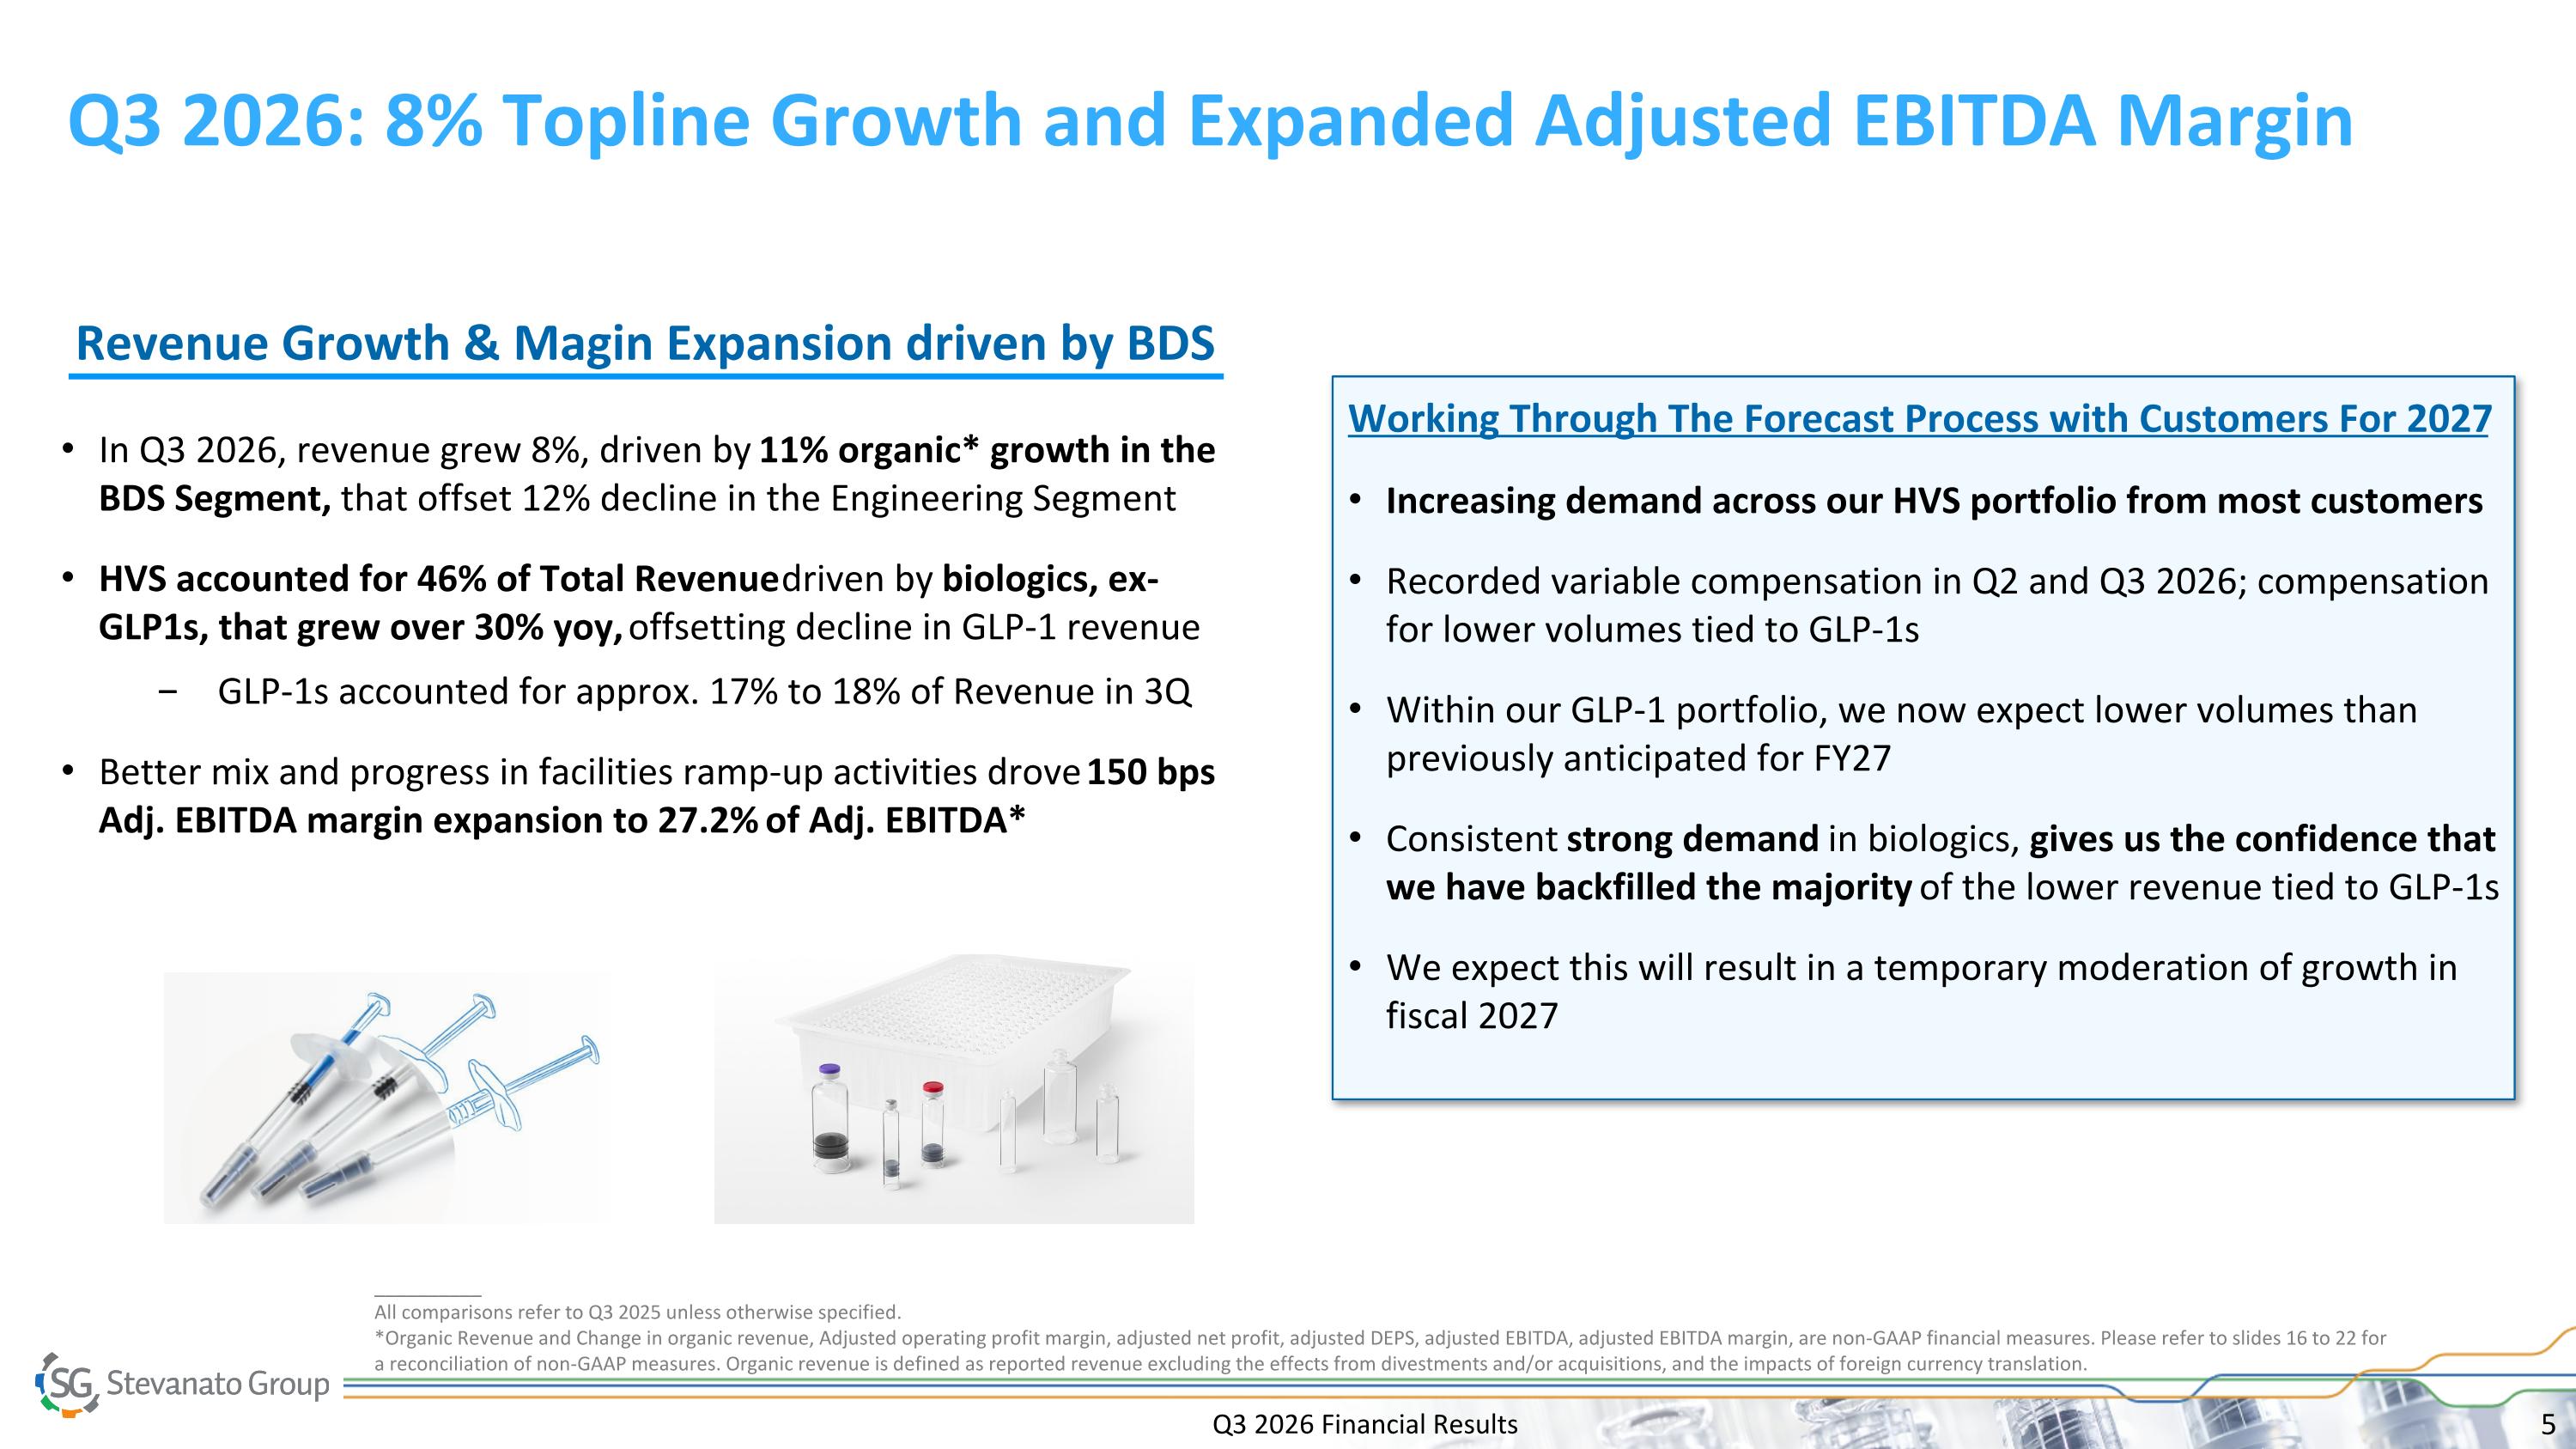
Q3 2026: 8% Topline Growth and Expanded Adjusted EBITDA Margin Revenue Growth & Magin Expansion driven by BDS In Q3 2026, revenue grew 8%, driven by 11% organic* growth in the BDS Segment, that offset 12% decline in the Engineering Segment HVS accounted for 46% of Total Revenue driven by biologics, ex-GLP1s, that grew over 30% yoy, offsetting decline in GLP-1 revenue GLP-1s accounted for approx. 17% to 18% of Revenue in 3Q Better mix and progress in facilities ramp-up activities drove 150 bps Adj. EBITDA margin expansion to 27.2% of Adj. EBITDA* __________ All comparisons refer to Q3 2025 unless otherwise specified. *Organic Revenue and Change in organic revenue, Adjusted operating profit margin, adjusted net profit, adjusted DEPS, adjusted EBITDA, adjusted EBITDA margin, are non-GAAP financial measures. Please refer to slides 16 to 22 for a reconciliation of non-GAAP measures. Organic revenue is defined as reported revenue excluding the effects from divestments and/or acquisitions, and the impacts of foreign currency translation. Working Through The Forecast Process with Customers For 2027 Increasing demand across our HVS portfolio from most customers Recorded variable compensation in Q2 and Q3 2026; compensation for lower volumes tied to GLP-1s Within our GLP-1 portfolio, we now expect lower volumes than previously anticipated for FY27 Consistent strong demand in biologics, gives us the confidence that we have backfilled the majority of the lower revenue tied to GLP-1s We expect this will result in a temporary moderation of growth in fiscal 2027 Q3 2026 Financial Results
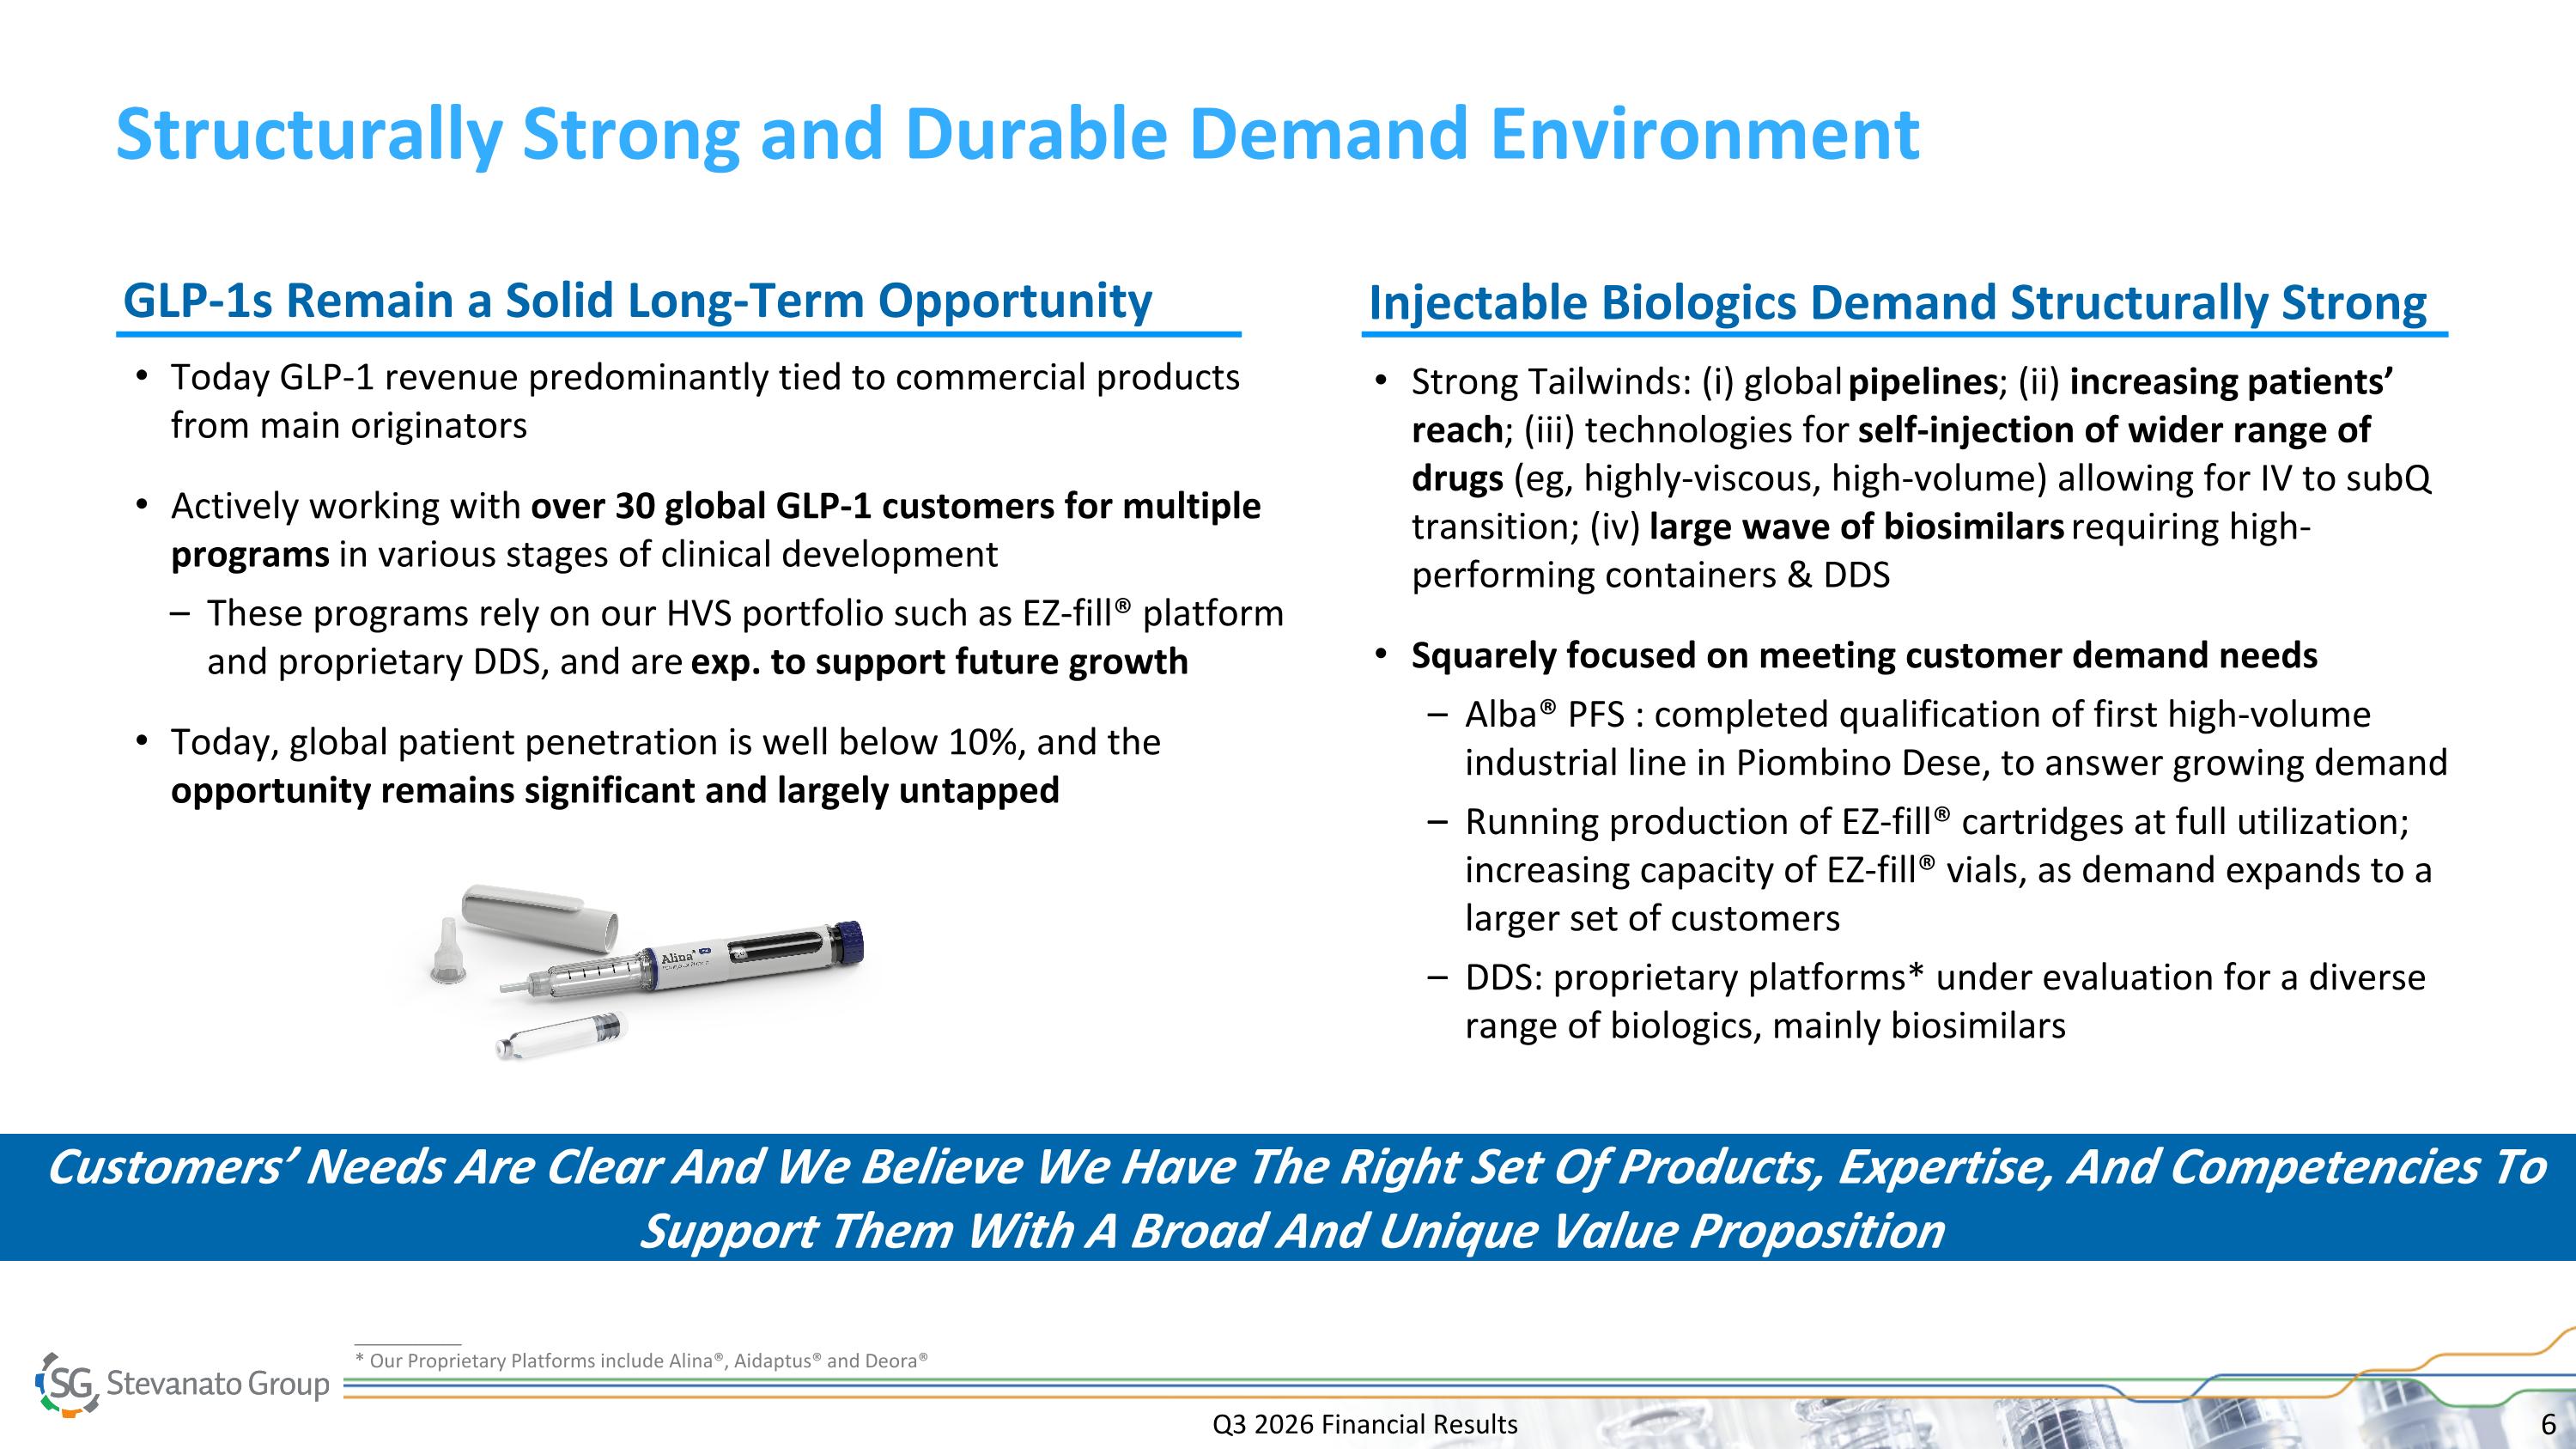
__________ * Our Proprietary Platforms include Alina®, Aidaptus® and Deora® Structurally Strong and Durable Demand Environment Today GLP-1 revenue predominantly tied to commercial products from main originators Actively working with over 30 global GLP-1 customers for multiple programs in various stages of clinical development These programs rely on our HVS portfolio such as EZ-fill® platform and proprietary DDS, and are exp. to support future growth Today, global patient penetration is well below 10%, and the opportunity remains significant and largely untapped GLP-1s Remain a Solid Long-Term Opportunity Injectable Biologics Demand Structurally Strong Q3 2026 Financial Results Strong Tailwinds: (i) global pipelines; (ii) increasing patients’ reach; (iii) technologies for self-injection of wider range of drugs (eg, highly-viscous, high-volume) allowing for IV to subQ transition; (iv) large wave of biosimilars requiring high-performing containers & DDS Squarely focused on meeting customer demand needs Alba® PFS : completed qualification of first high-volume industrial line in Piombino Dese, to answer growing demand Running production of EZ-fill® cartridges at full utilization; increasing capacity of EZ-fill® vials, as demand expands to a larger set of customers DDS: proprietary platforms* under evaluation for a diverse range of biologics, mainly biosimilars Customers’ Needs Are Clear And We Believe We Have The Right Set Of Products, Expertise, And Competencies To Support Them With A Broad And Unique Value Proposition
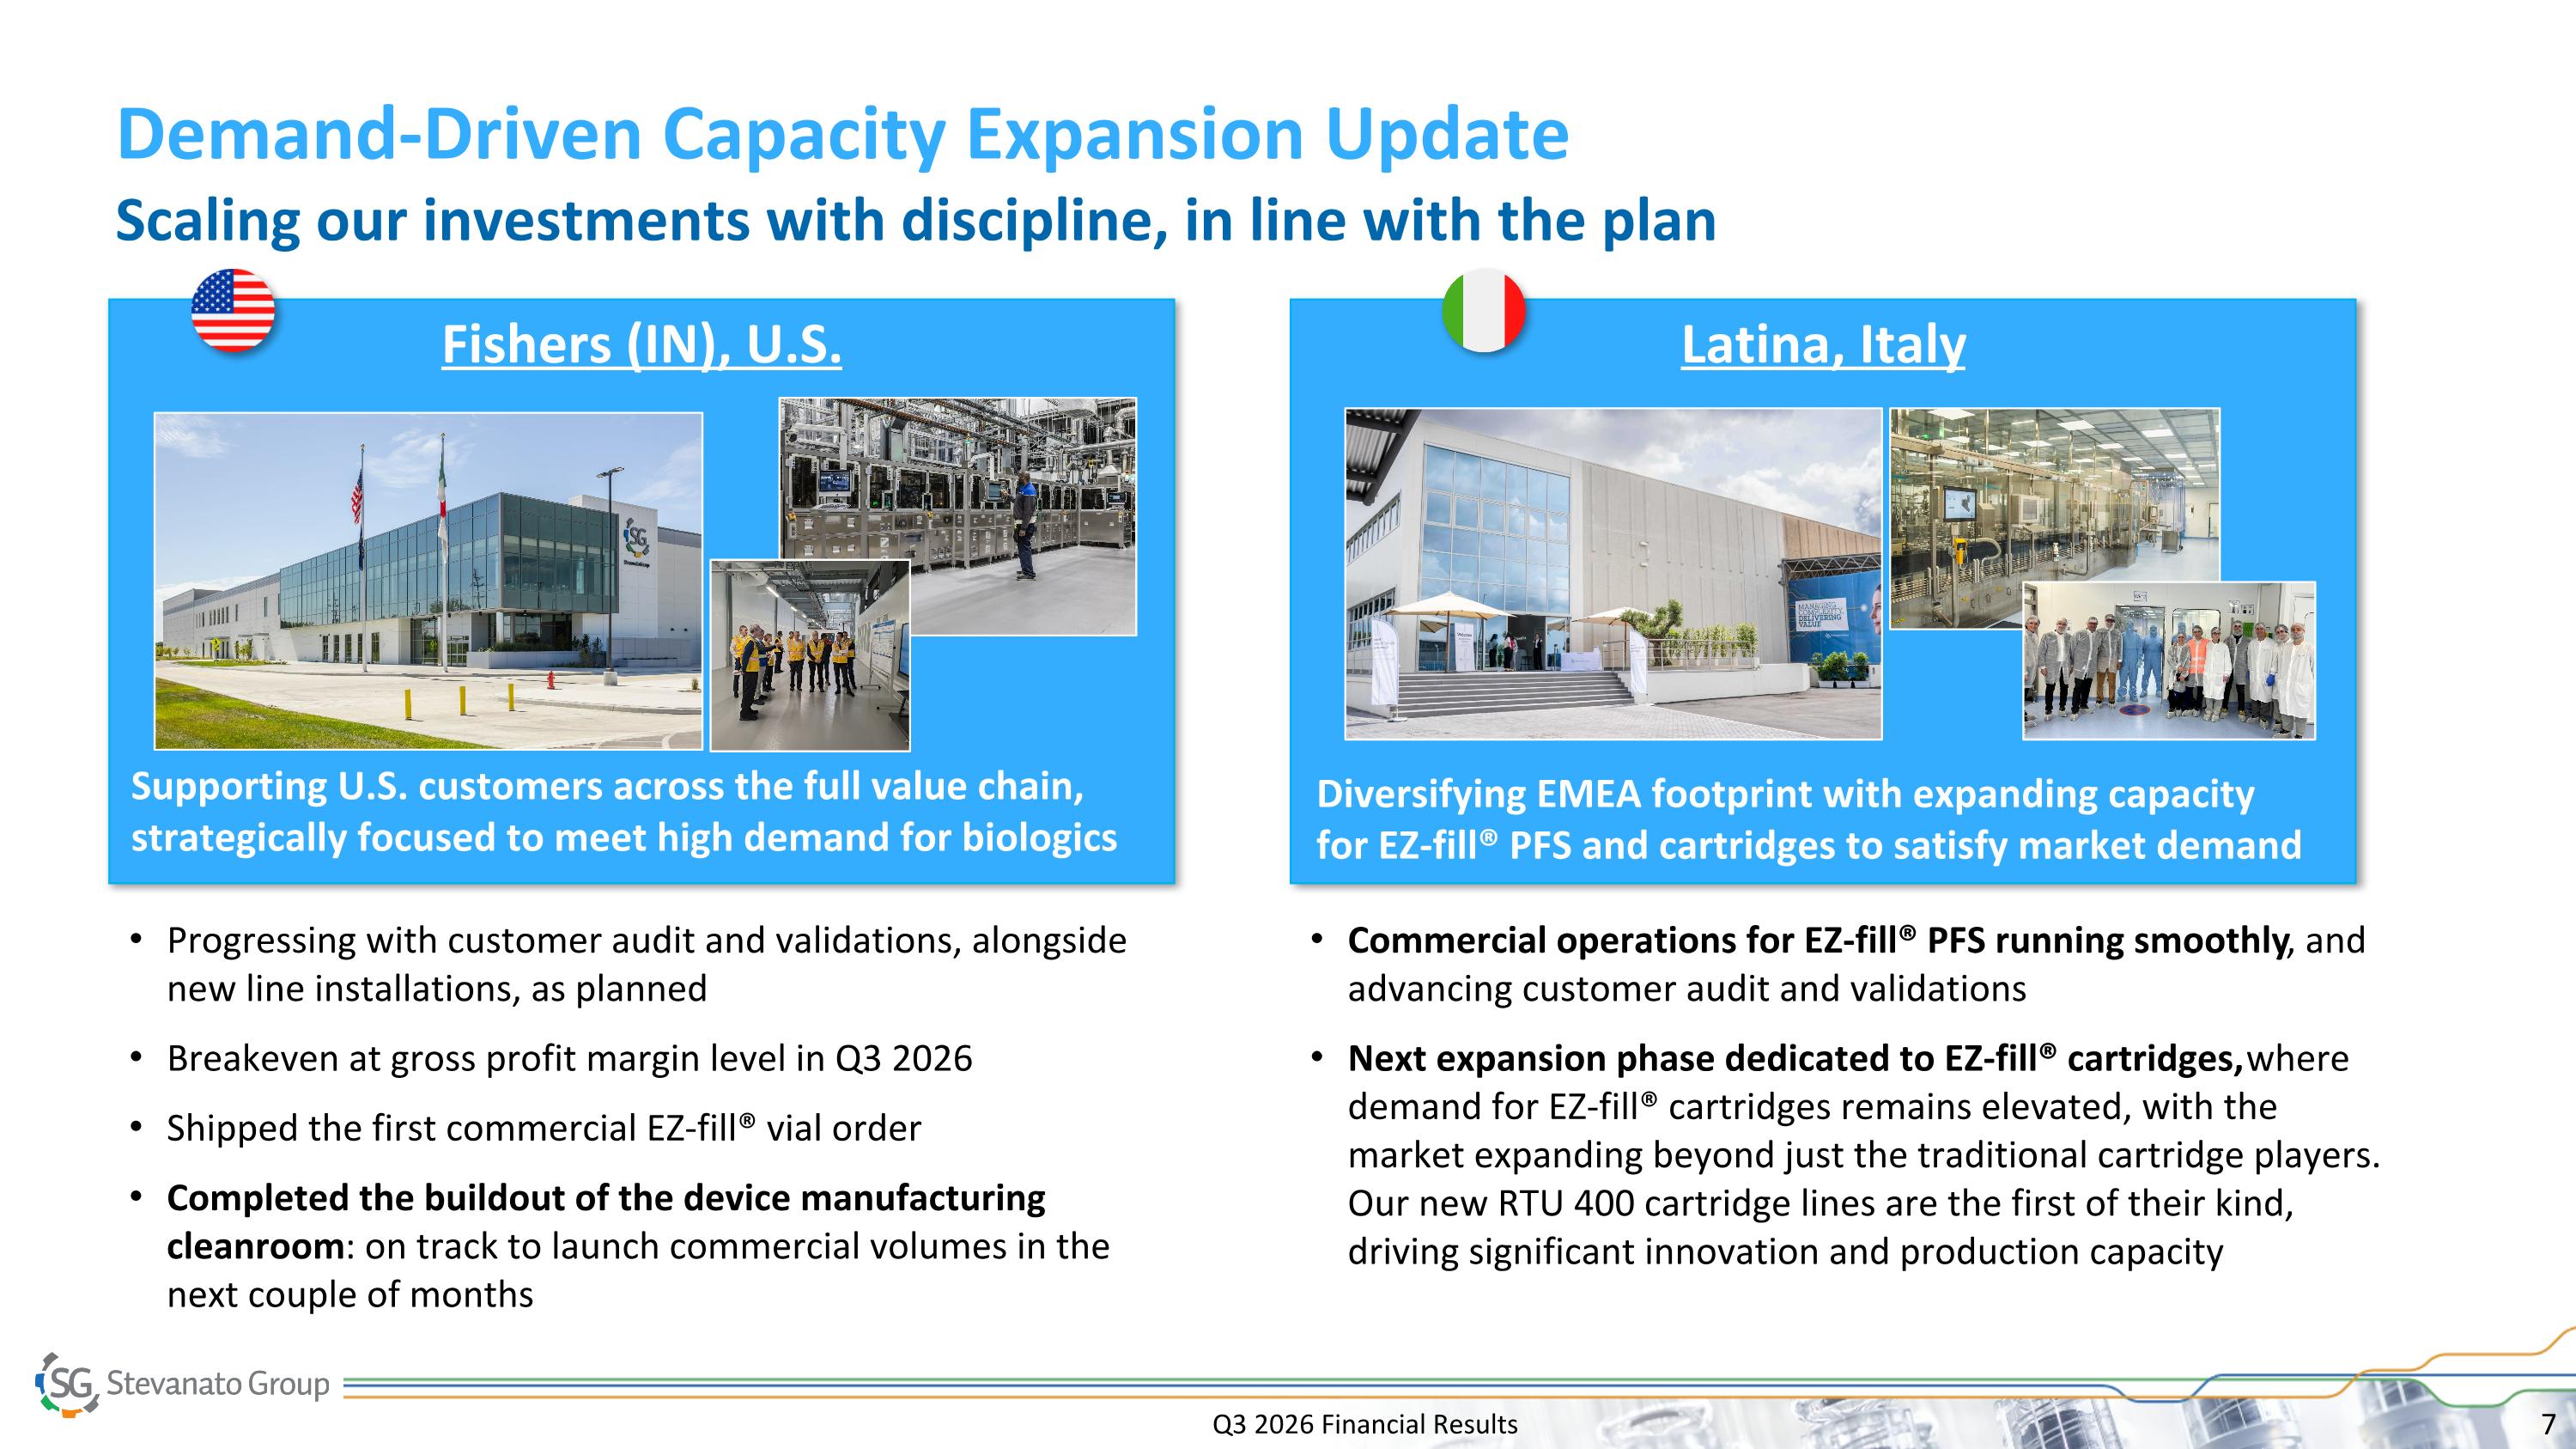
Latina, Italy Commercial operations for EZ-fill® PFS running smoothly, and advancing customer audit and validations Next expansion phase dedicated to EZ-fill® cartridges, where demand for EZ-fill® cartridges remains elevated, with the market expanding beyond just the traditional cartridge players. Our new RTU 400 cartridge lines are the first of their kind, driving significant innovation and production capacity Fishers (IN), U.S. Progressing with customer audit and validations, alongside new line installations, as planned Breakeven at gross profit margin level in Q3 2026 Shipped the first commercial EZ-fill® vial order Completed the buildout of the device manufacturing cleanroom: on track to launch commercial volumes in the next couple of months Supporting U.S. customers across the full value chain, strategically focused to meet high demand for biologics Diversifying EMEA footprint with expanding capacity for EZ-fill® PFS and cartridges to satisfy market demand Demand-Driven Capacity Expansion Update Scaling our investments with discipline, in line with the plan Q3 2026 Financial Results
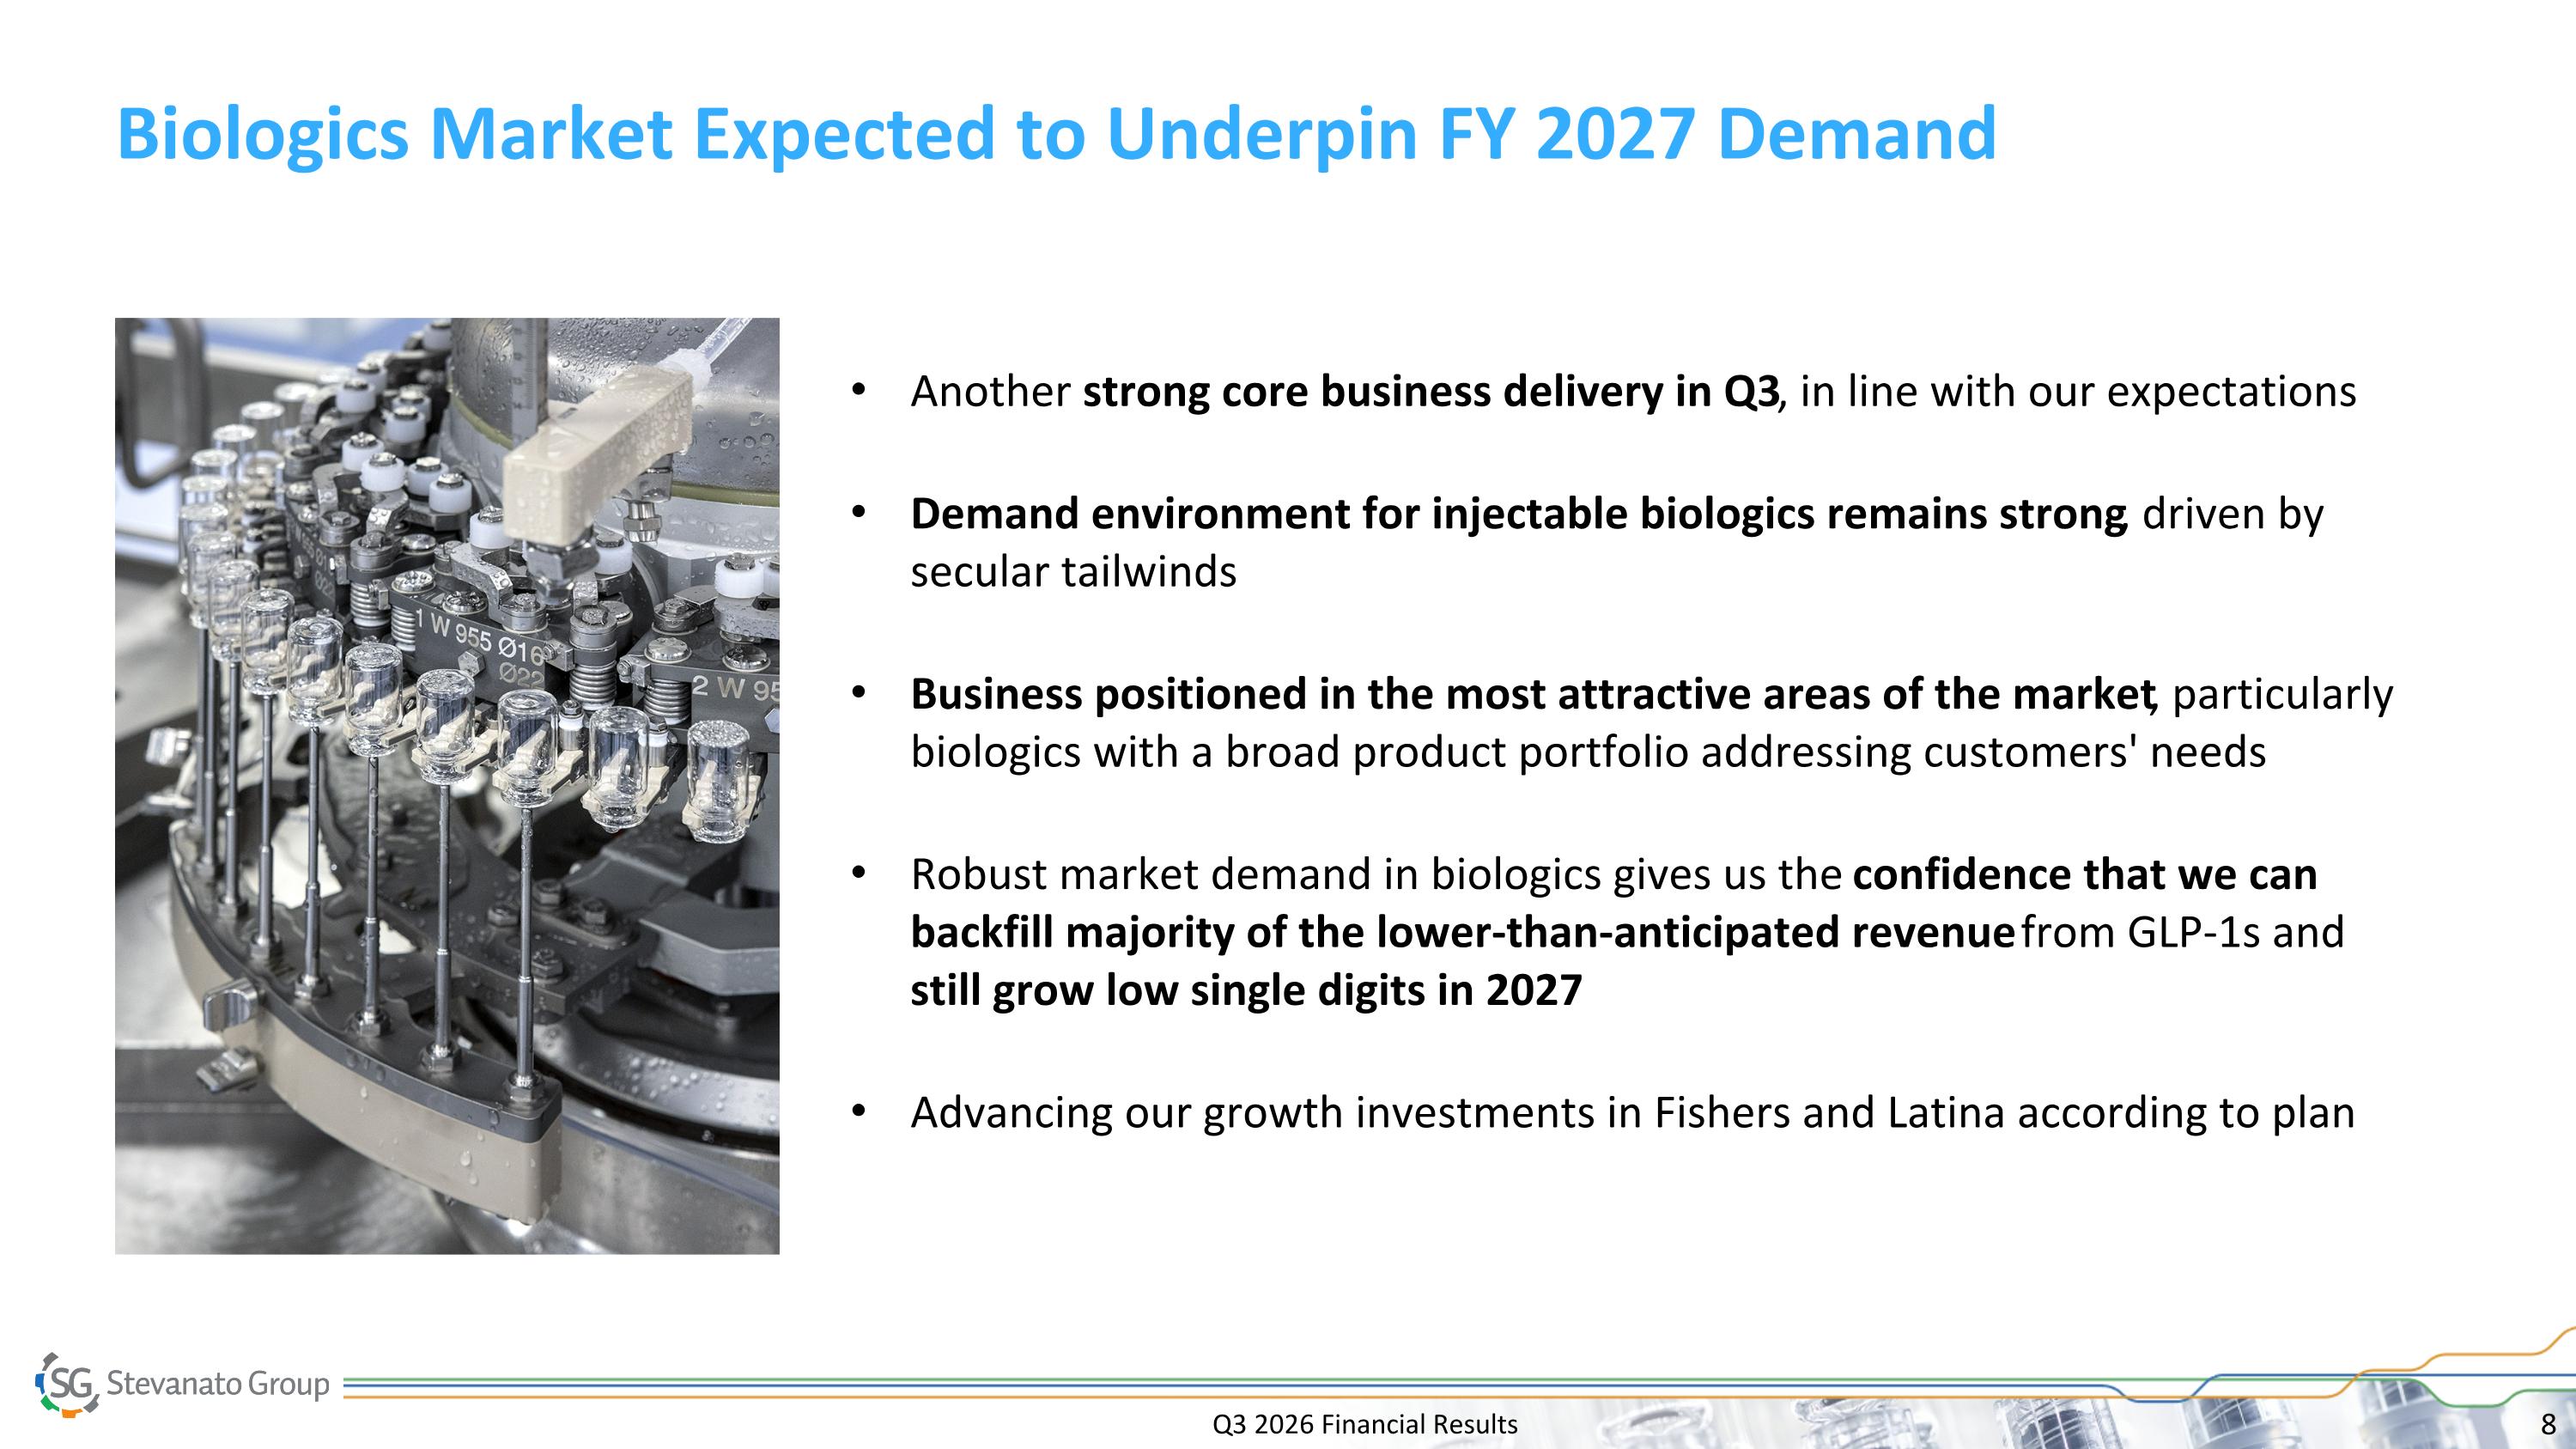
Biologics Market Expected to Underpin FY 2027 Demand Another strong core business delivery in Q3, in line with our expectations Demand environment for injectable biologics remains strong, driven by secular tailwinds Business positioned in the most attractive areas of the market, particularly biologics with a broad product portfolio addressing customers' needs Robust market demand in biologics gives us the confidence that we can backfill majority of the lower-than-anticipated revenue from GLP-1s and still grow low single digits in 2027 Advancing our growth investments in Fishers and Latina according to plan Q3 2026 Financial Results
Marco Dal Lago Chief Financial Officer Q3 2026 Financial Results
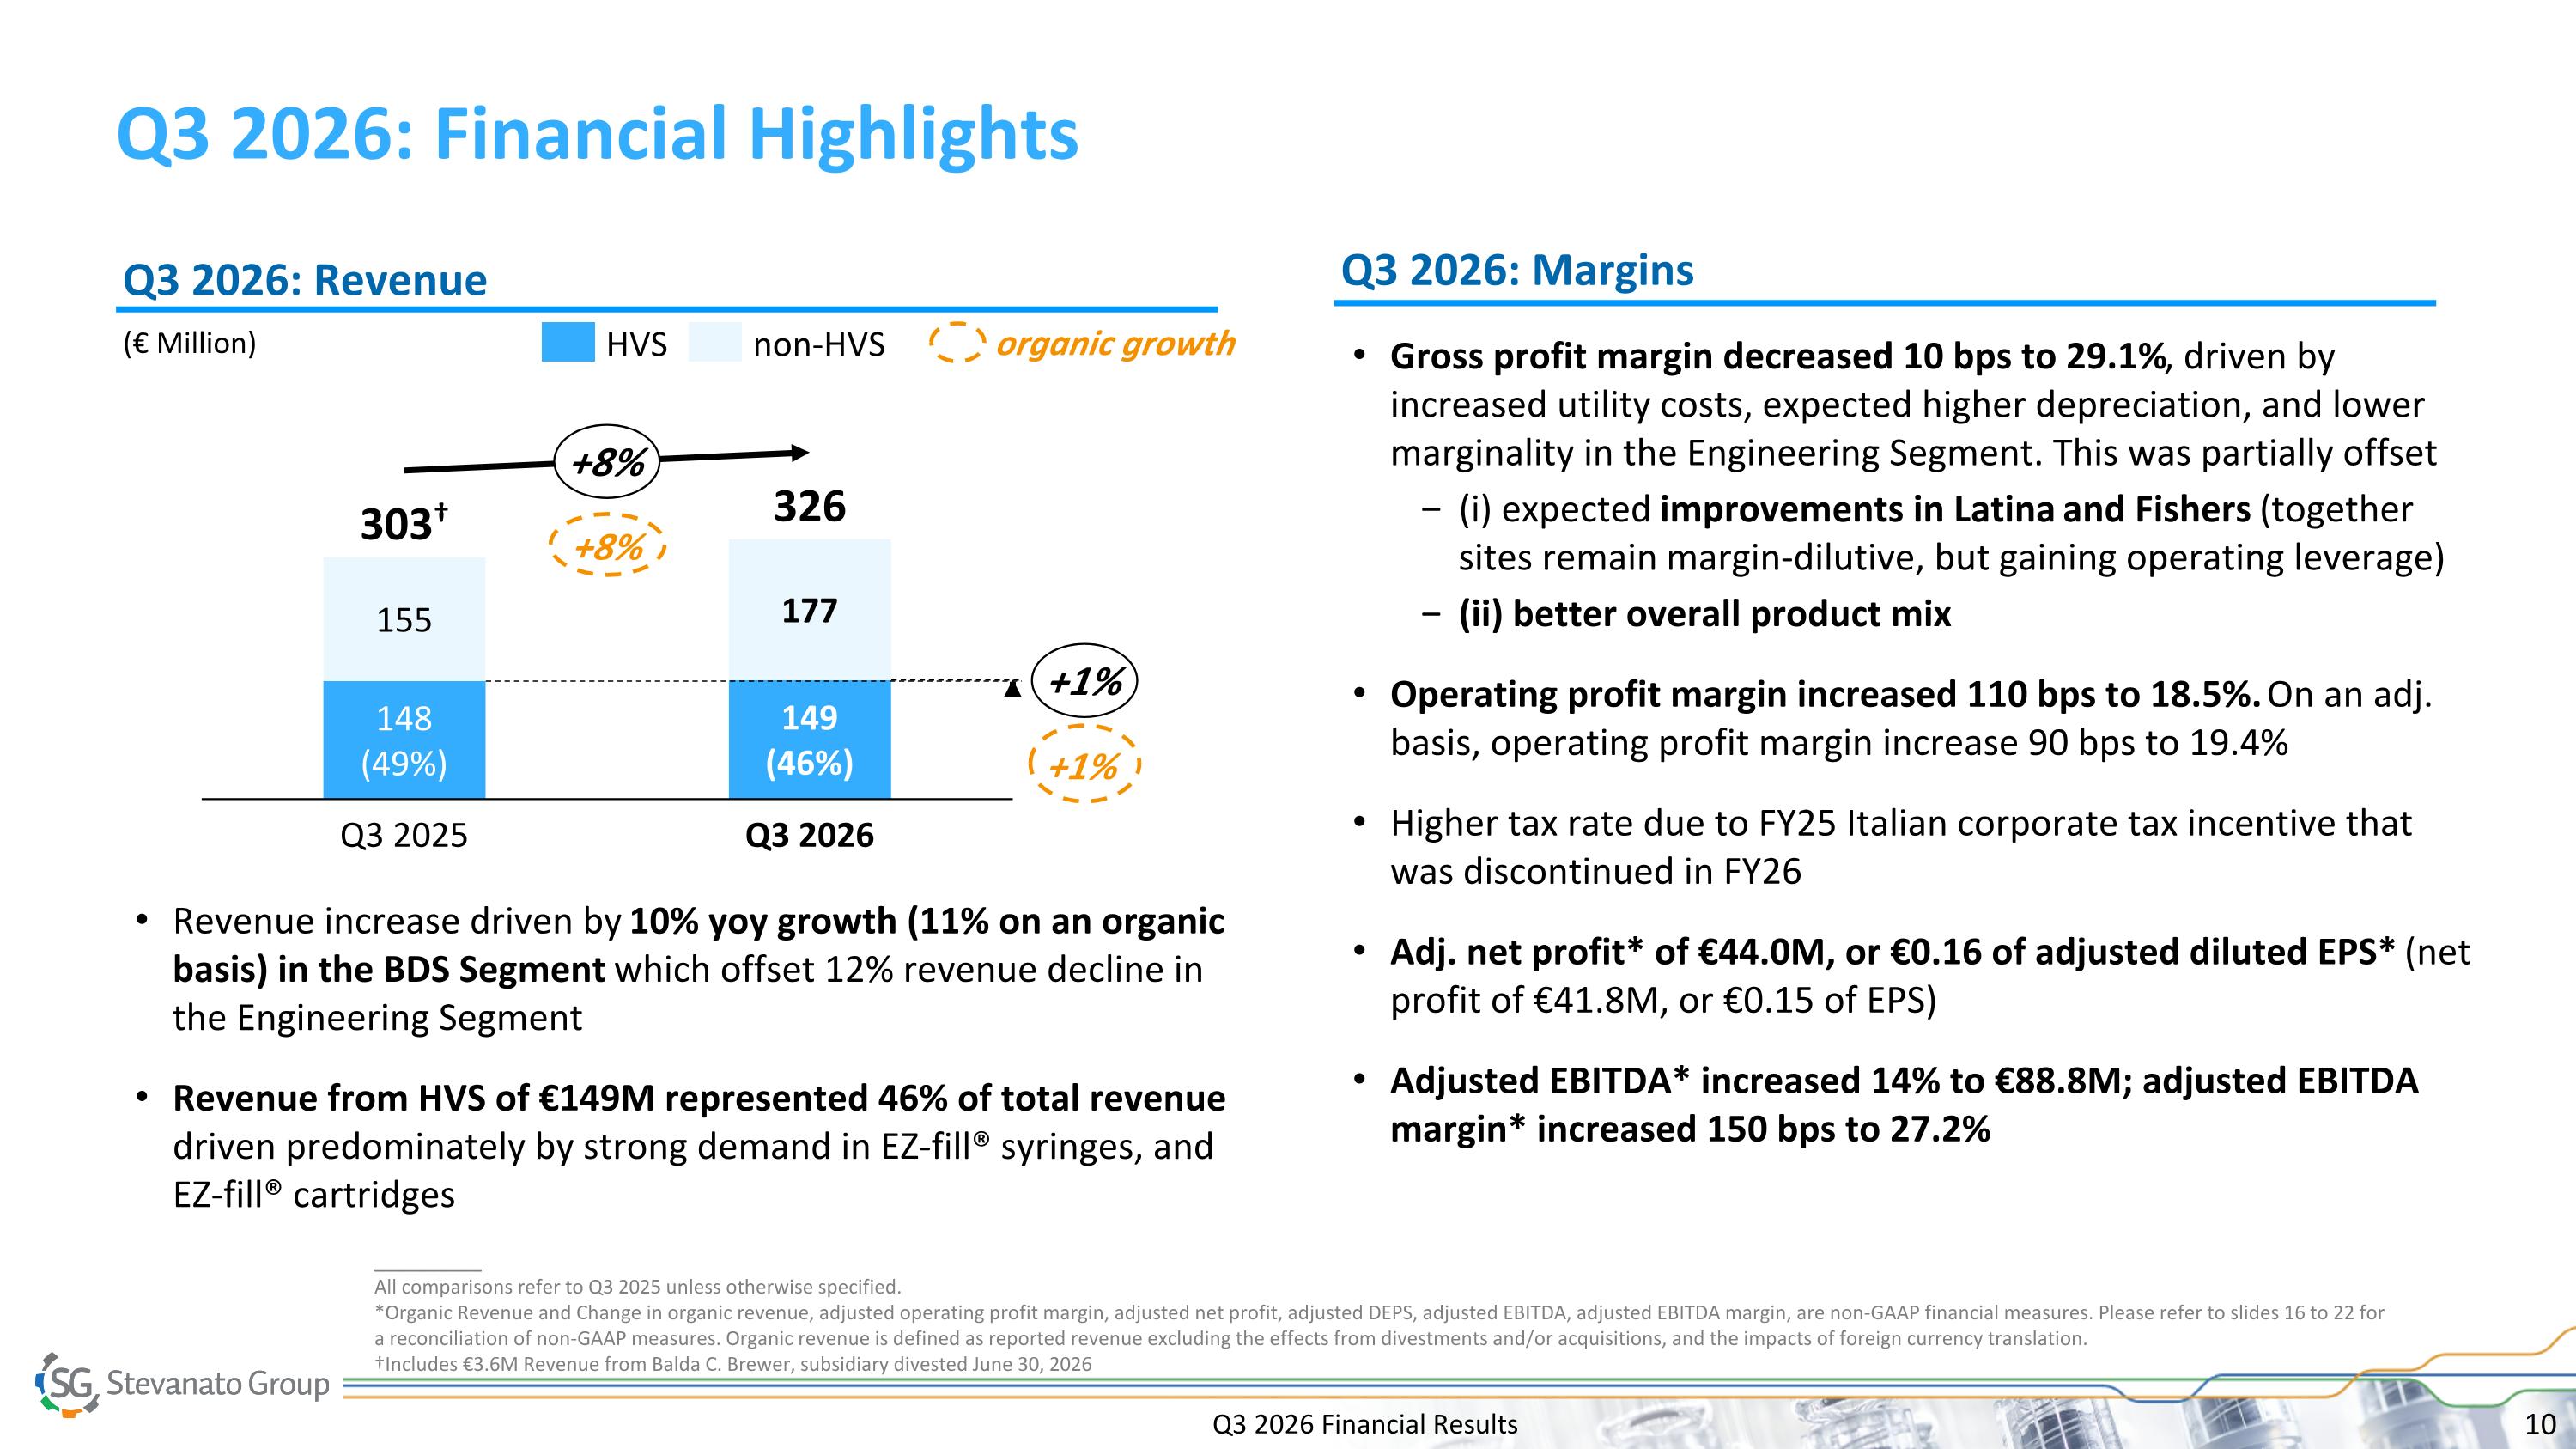
Q3 2026: Financial Highlights __________ All comparisons refer to Q3 2025 unless otherwise specified. *Organic Revenue and Change in organic revenue, adjusted operating profit margin, adjusted net profit, adjusted DEPS, adjusted EBITDA, adjusted EBITDA margin, are non-GAAP financial measures. Please refer to slides 16 to 22 for a reconciliation of non-GAAP measures. Organic revenue is defined as reported revenue excluding the effects from divestments and/or acquisitions, and the impacts of foreign currency translation. †Includes €3.6M Revenue from Balda C. Brewer, subsidiary divested June 30, 2026 (€ Million) Q3 2026: Revenue Q3 2026: Margins 155 148 (49%) Q3 2025 177 149 (46%) Q3 2026 303† 326 +1% +8% Gross profit margin decreased 10 bps to 29.1%, driven by increased utility costs, expected higher depreciation, and lower marginality in the Engineering Segment. This was partially offset (i) expected improvements in Latina and Fishers (together sites remain margin-dilutive, but gaining operating leverage) (ii) better overall product mix Operating profit margin increased 110 bps to 18.5%. On an adj. basis, operating profit margin increase 90 bps to 19.4% Higher tax rate due to FY25 Italian corporate tax incentive that was discontinued in FY26 Adj. net profit* of €44.0M, or €0.16 of adjusted diluted EPS* (net profit of €41.8M, or €0.15 of EPS) Adjusted EBITDA* increased 14% to €88.8M; adjusted EBITDA margin* increased 150 bps to 27.2% Revenue increase driven by 10% yoy growth (11% on an organic basis) in the BDS Segment which offset 12% revenue decline in the Engineering Segment Revenue from HVS of €149M represented 46% of total revenue driven predominately by strong demand in EZ-fill® syringes, and EZ-fill® cartridges organic growth +8% +1% Q3 2026 Financial Results HVS non-HVS
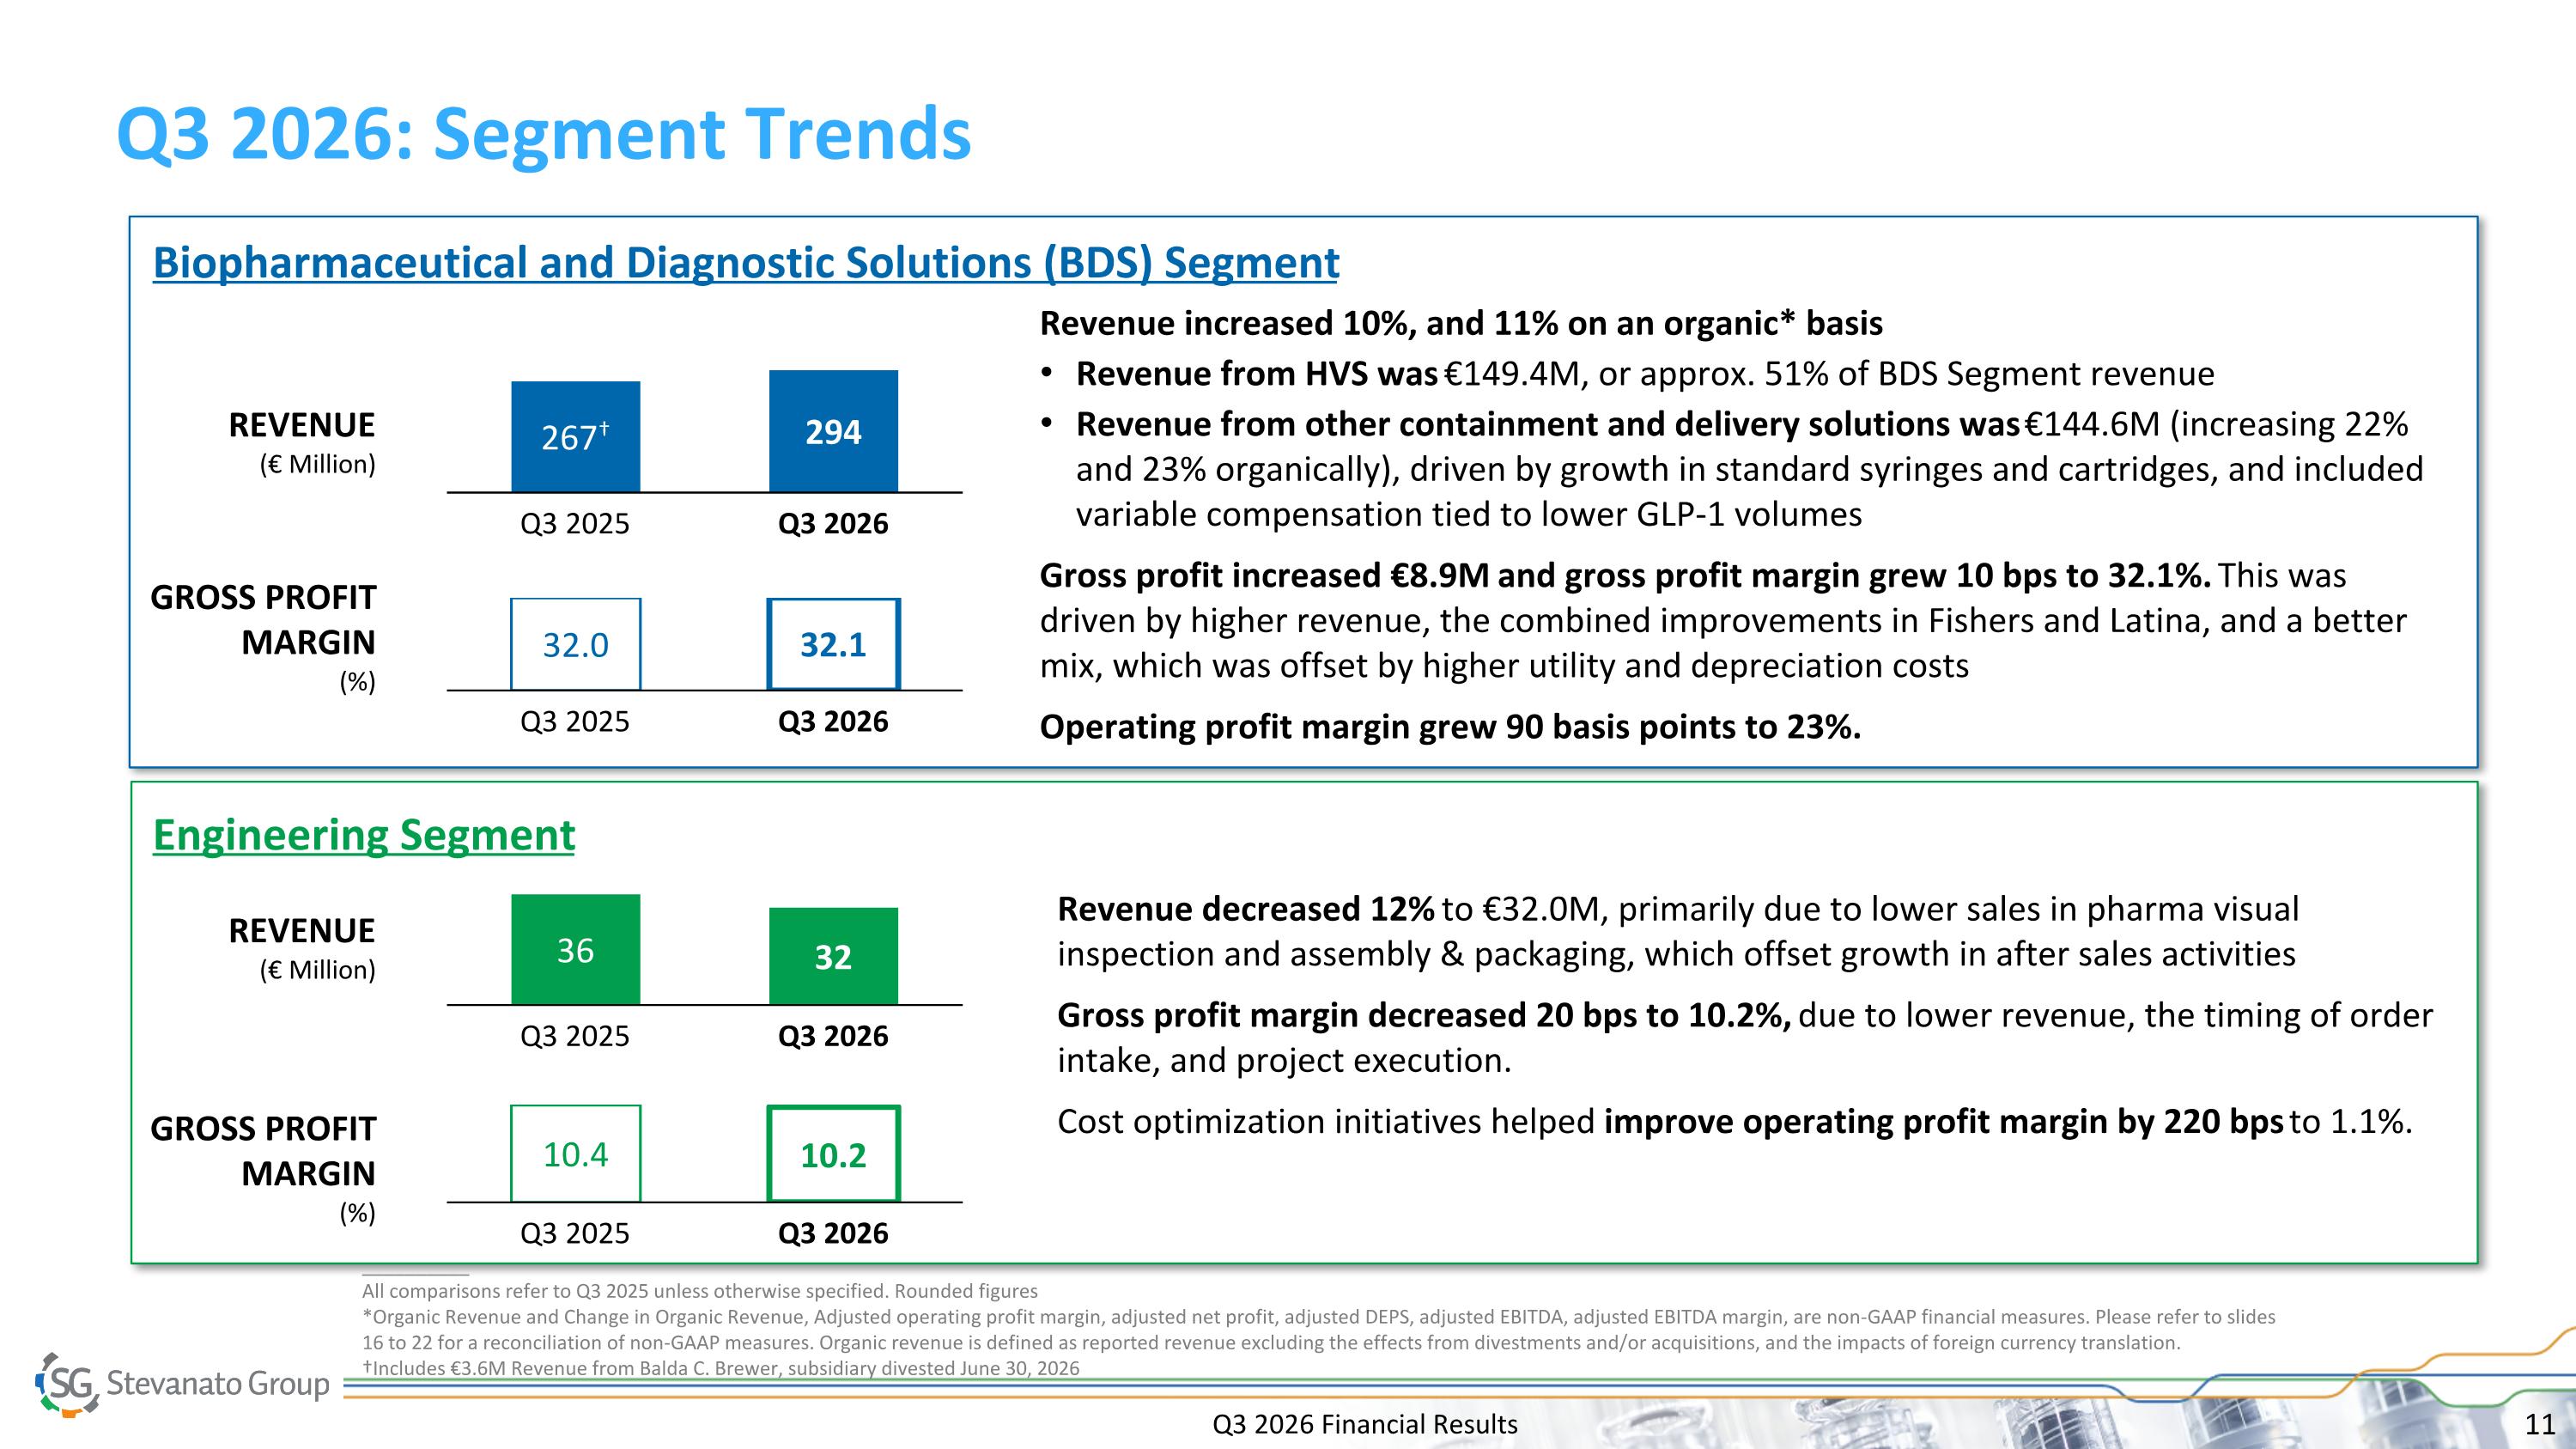
Q3 2026: Segment Trends 267† Q3 2025 294 Q3 2026 Revenue increased 10%, and 11% on an organic* basis Revenue from HVS was €149.4M, or approx. 51% of BDS Segment revenue Revenue from other containment and delivery solutions was €144.6M (increasing 22% and 23% organically), driven by growth in standard syringes and cartridges, and included variable compensation tied to lower GLP-1 volumes Gross profit increased €8.9M and gross profit margin grew 10 bps to 32.1%. This was driven by higher revenue, the combined improvements in Fishers and Latina, and a better mix, which was offset by higher utility and depreciation costs Operating profit margin grew 90 basis points to 23%. Biopharmaceutical and Diagnostic Solutions (BDS) Segment REVENUE (€ Million) GROSS PROFIT MARGIN (%) Engineering Segment 32.0 Q3 2025 32.1 Q3 2026 36 Q3 2025 32 Q3 2026 Revenue decreased 12% to €32.0M, primarily due to lower sales in pharma visual inspection and assembly & packaging, which offset growth in after sales activities Gross profit margin decreased 20 bps to 10.2%, due to lower revenue, the timing of order intake, and project execution. Cost optimization initiatives helped improve operating profit margin by 220 bps to 1.1%. REVENUE (€ Million) GROSS PROFIT MARGIN (%) 10.4 Q3 2025 10.2 Q3 2026 __________ All comparisons refer to Q3 2025 unless otherwise specified. Rounded figures *Organic Revenue and Change in Organic Revenue, Adjusted operating profit margin, adjusted net profit, adjusted DEPS, adjusted EBITDA, adjusted EBITDA margin, are non-GAAP financial measures. Please refer to slides 16 to 22 for a reconciliation of non-GAAP measures. Organic revenue is defined as reported revenue excluding the effects from divestments and/or acquisitions, and the impacts of foreign currency translation. †Includes €3.6M Revenue from Balda C. Brewer, subsidiary divested June 30, 2026 Q3 2026 Financial Results
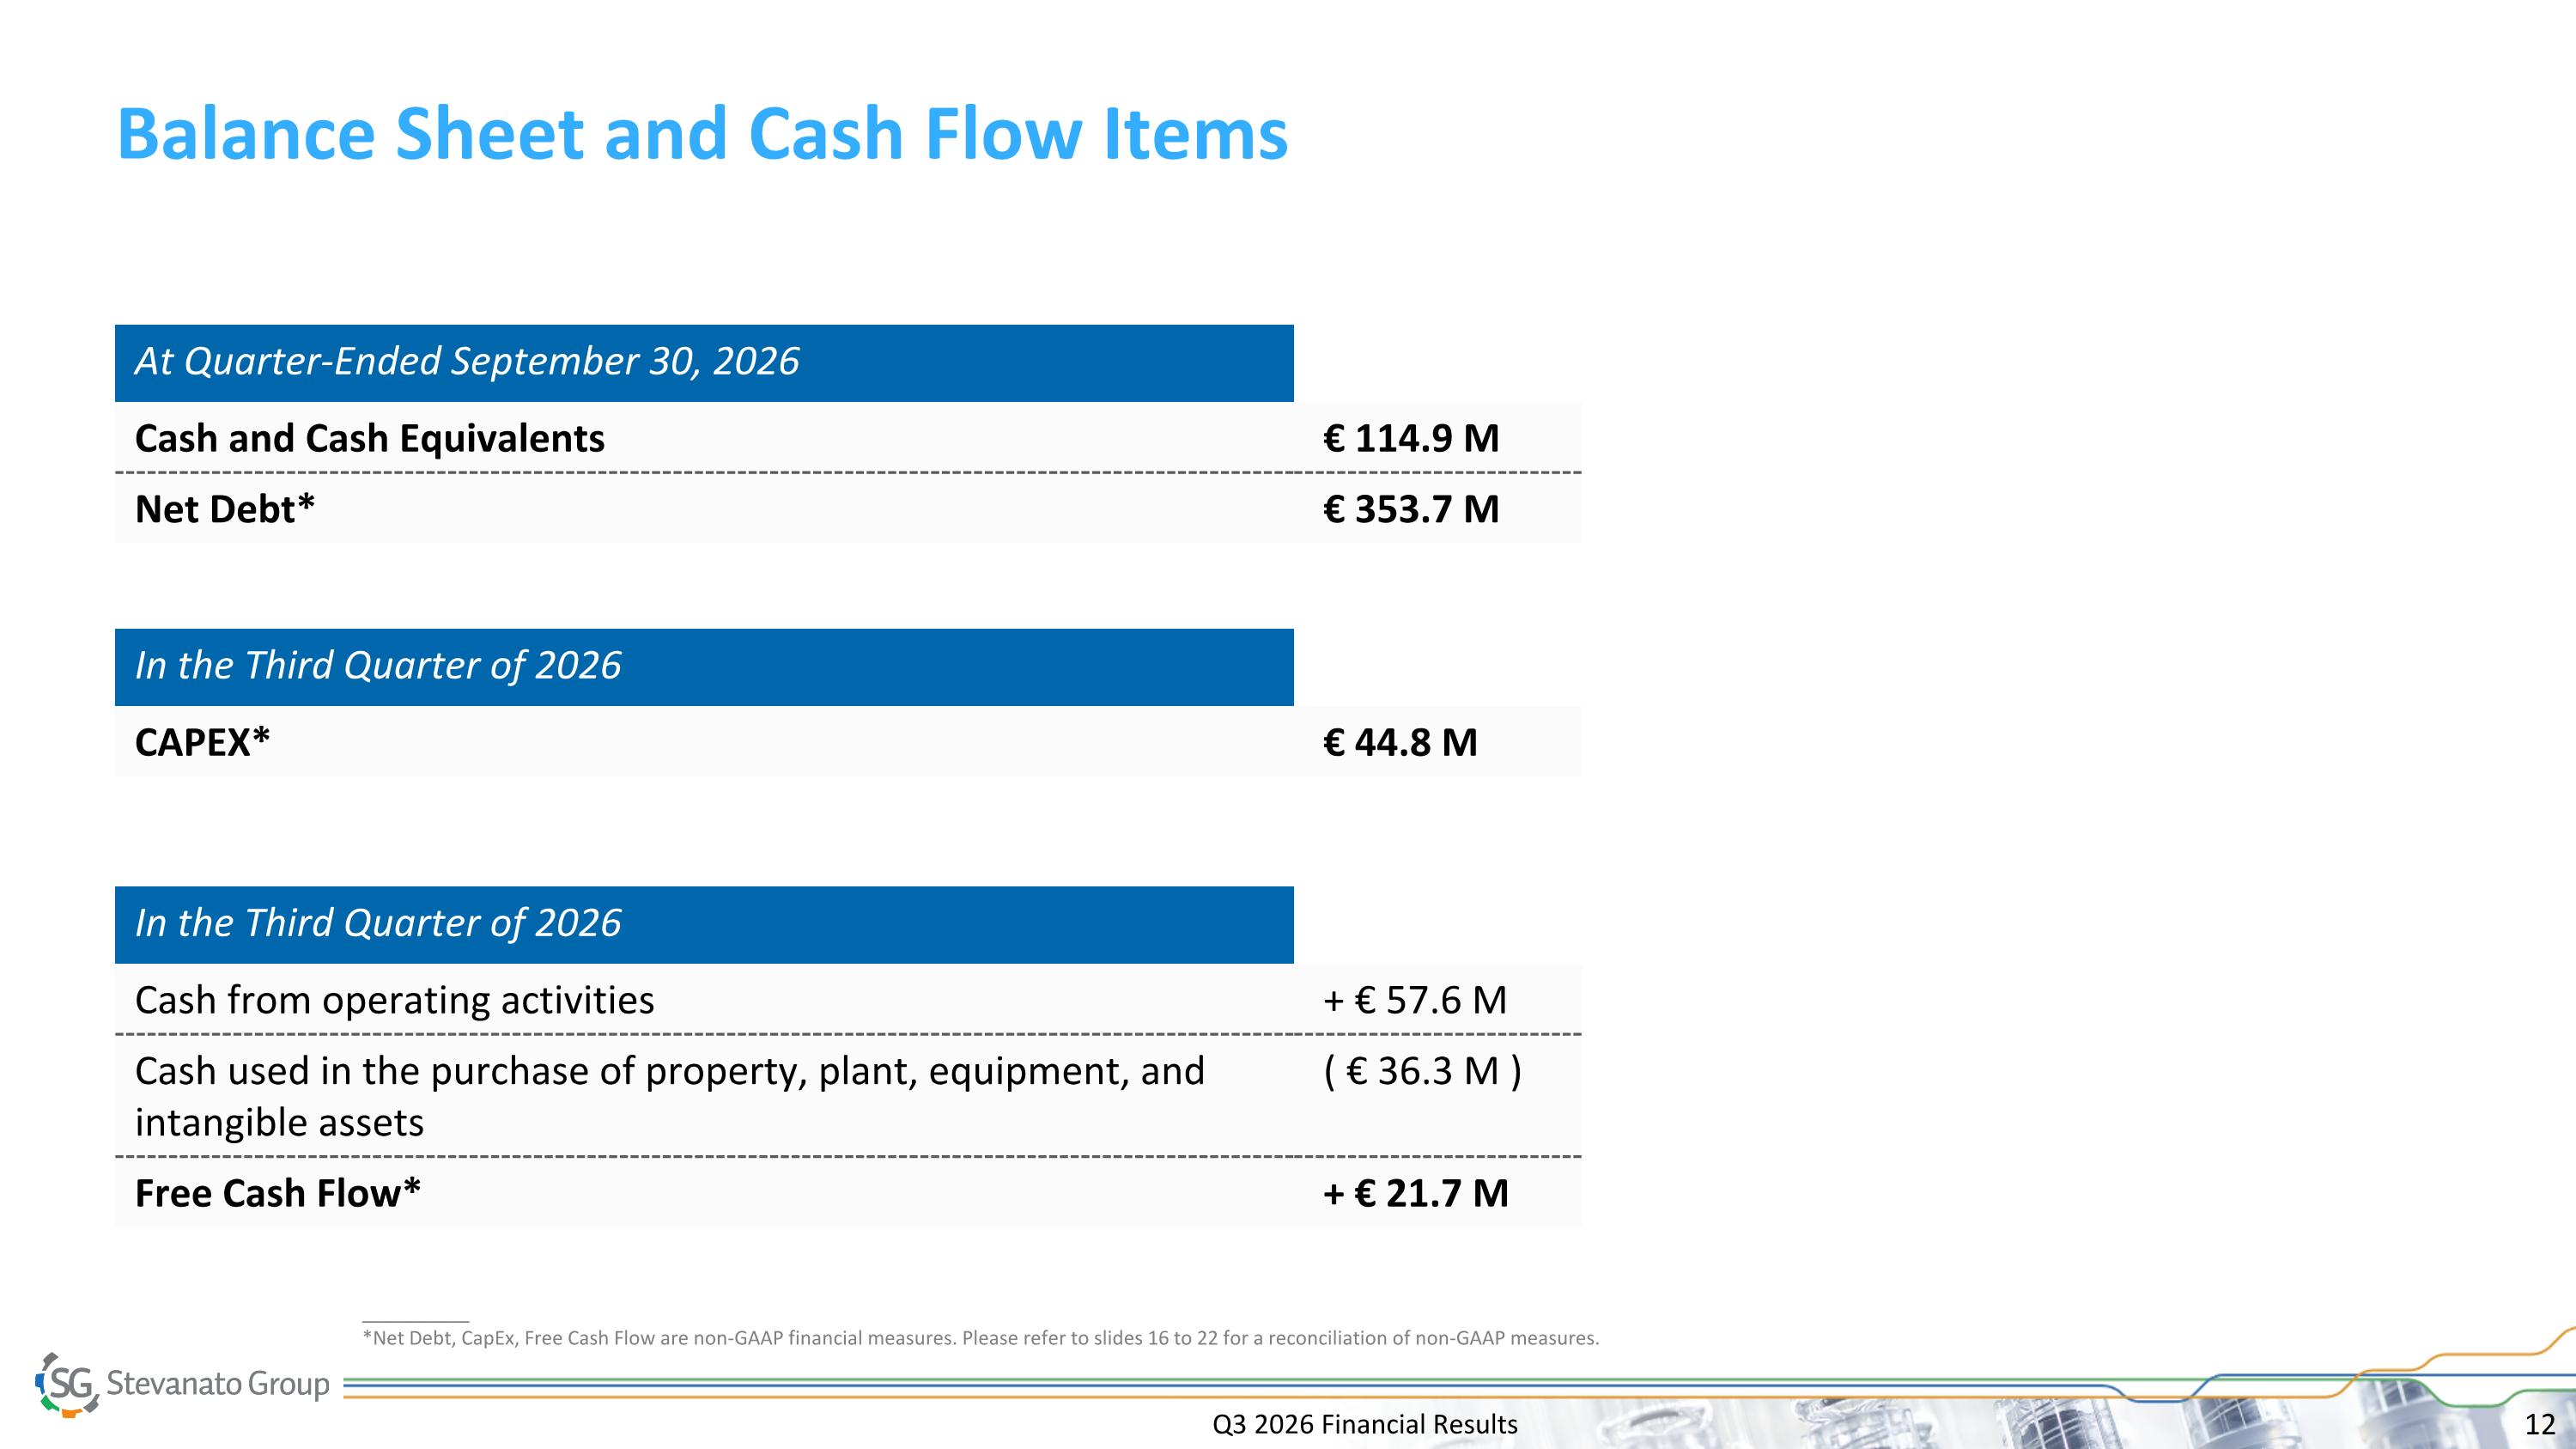
Balance Sheet and Cash Flow Items __________ *Net Debt, CapEx, Free Cash Flow are non-GAAP financial measures. Please refer to slides 16 to 22 for a reconciliation of non-GAAP measures. In the Third Quarter of 2026 Cash from operating activities + € 57.6 M Cash used in the purchase of property, plant, equipment, and intangible assets ( € 36.3 M ) Free Cash Flow* + € 21.7 M In the Third Quarter of 2026 CAPEX* € 44.8 M At Quarter-Ended September 30, 2026 Cash and Cash Equivalents € 114.9 M Net Debt* € 353.7 M Q3 2026 Financial Results
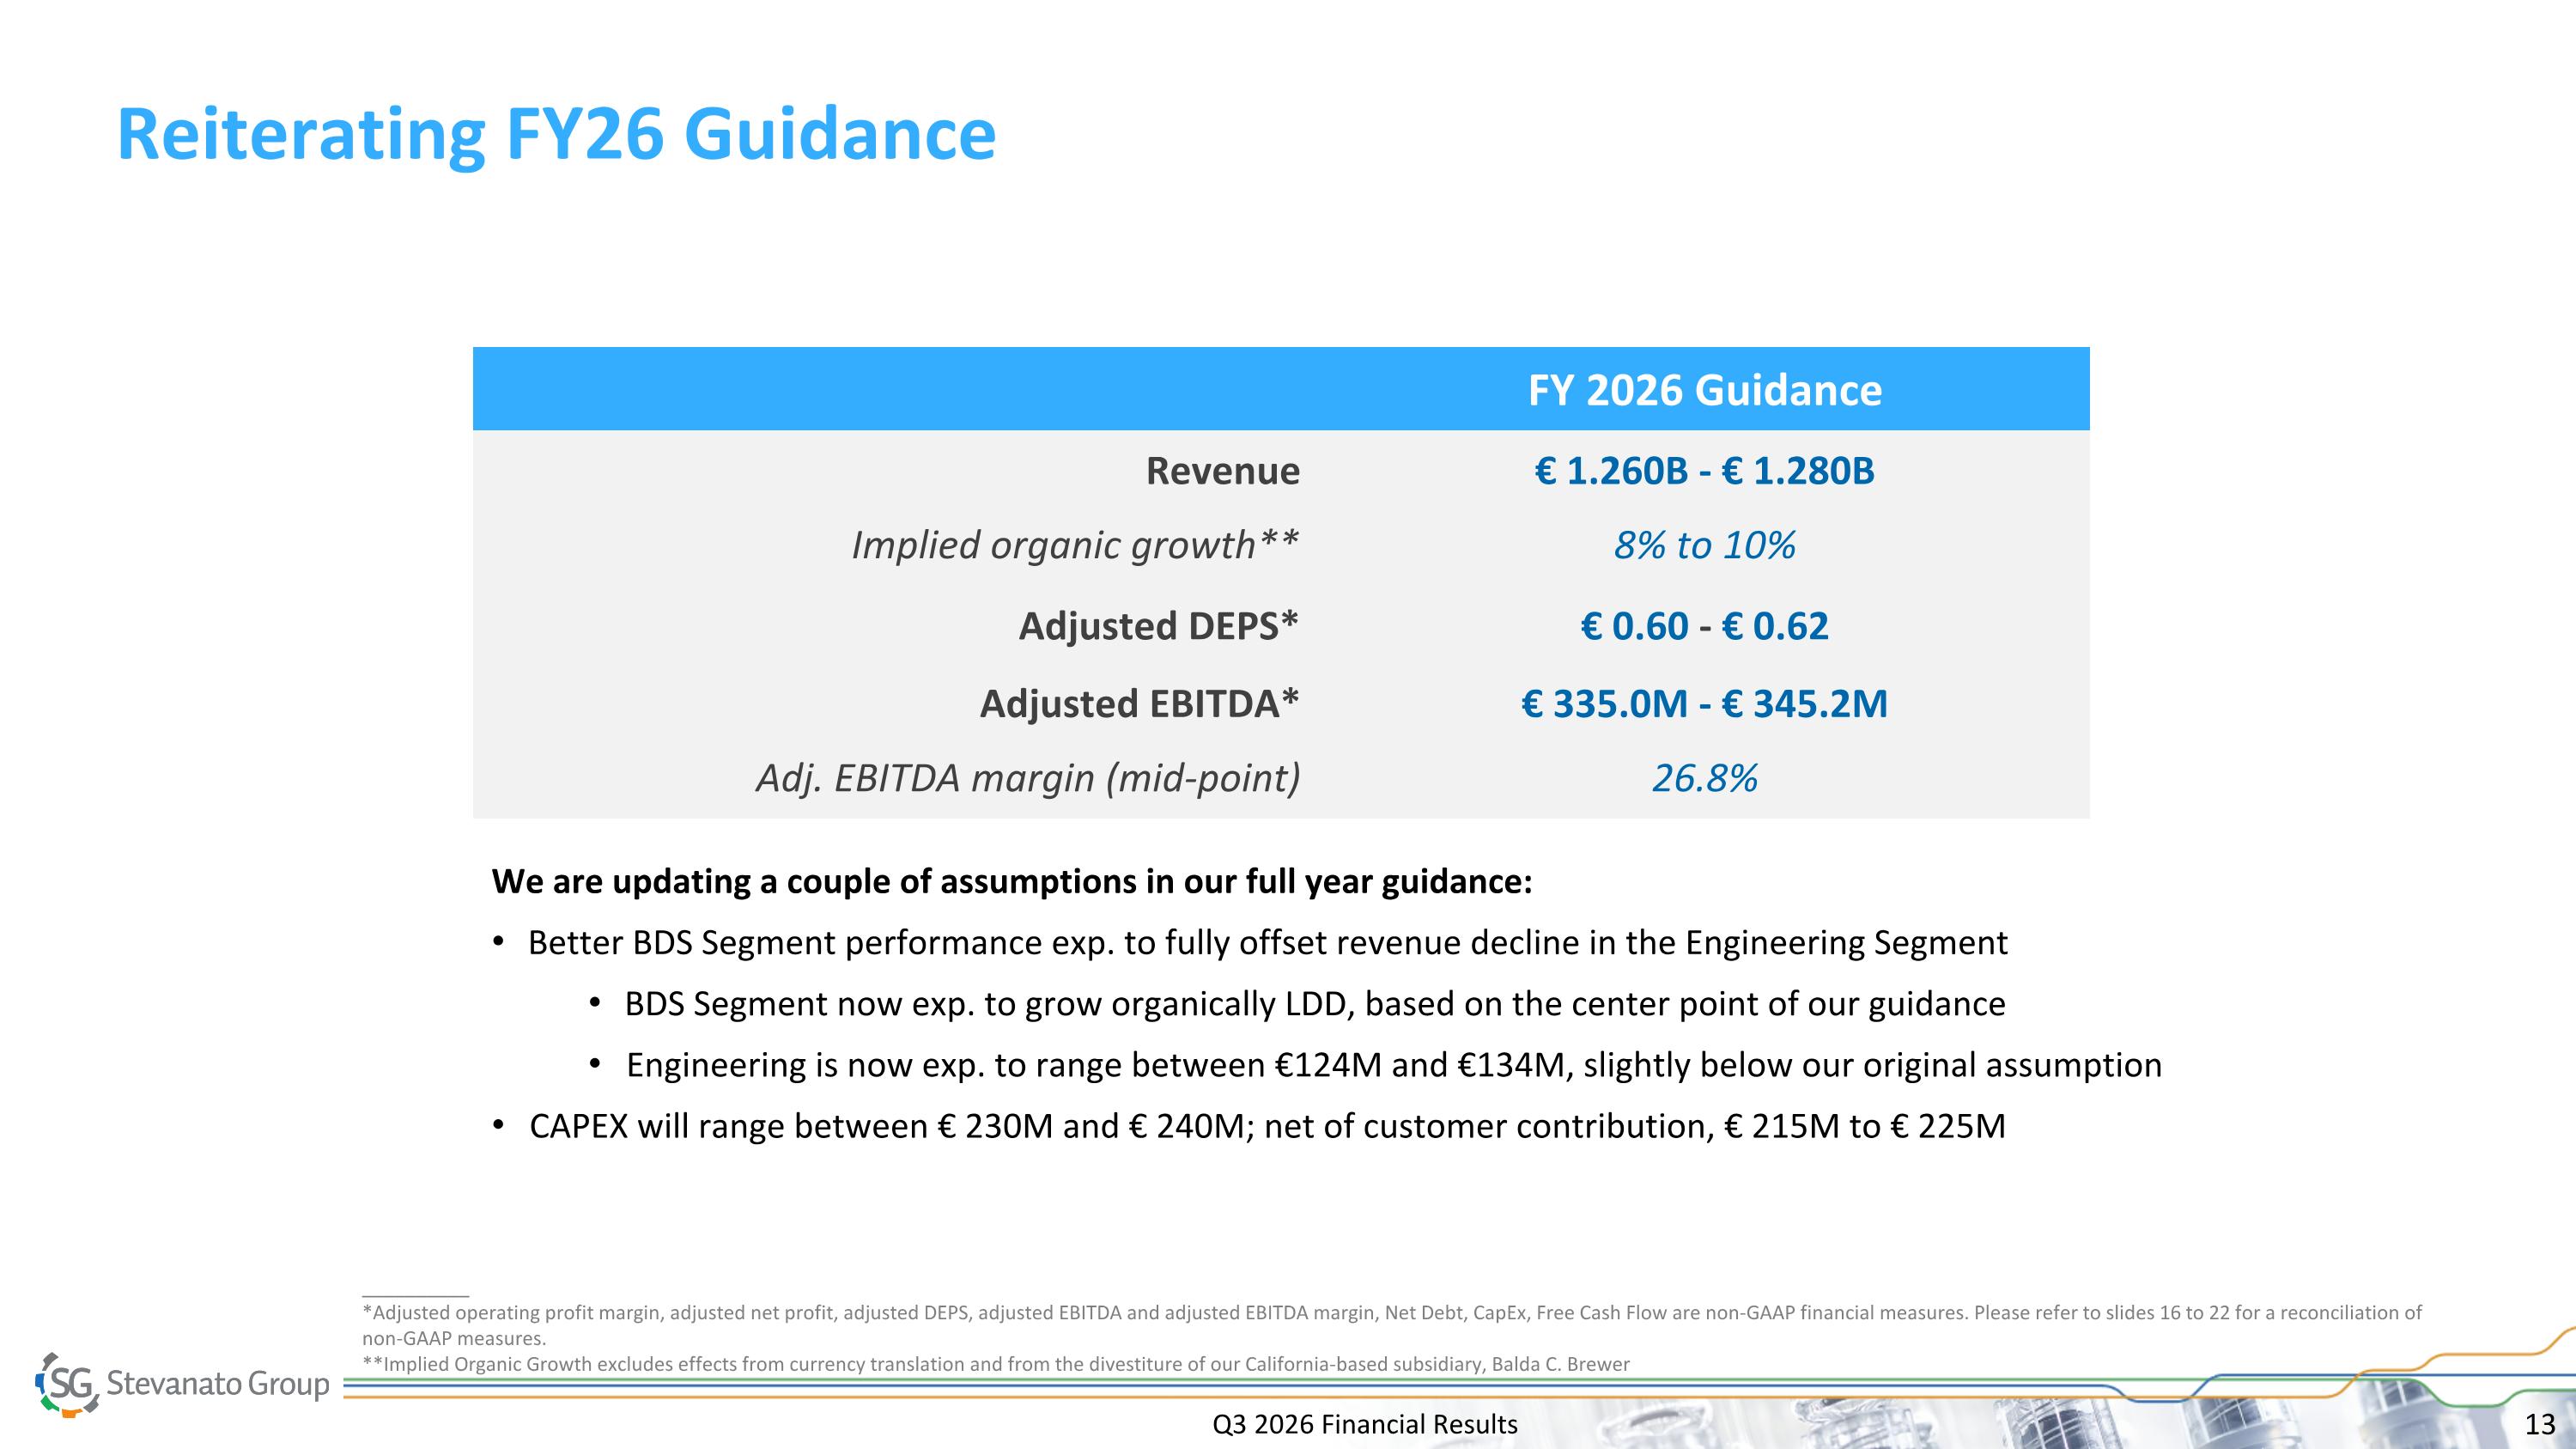
Reiterating FY26 Guidance __________ *Adjusted operating profit margin, adjusted net profit, adjusted DEPS, adjusted EBITDA and adjusted EBITDA margin, Net Debt, CapEx, Free Cash Flow are non-GAAP financial measures. Please refer to slides 16 to 22 for a reconciliation of non-GAAP measures. **Implied Organic Growth excludes effects from currency translation and from the divestiture of our California-based subsidiary, Balda C. Brewer FY 2026 Guidance Revenue € 1.260B - € 1.280B Implied organic growth** 8% to 10% Adjusted DEPS* € 0.60 - € 0.62 Adjusted EBITDA* € 335.0M - € 345.2M Adj. EBITDA margin (mid-point) 26.8% Q3 2026 Financial Results We are updating a couple of assumptions in our full year guidance: Better BDS Segment performance exp. to fully offset revenue decline in the Engineering Segment BDS Segment now exp. to grow organically LDD, based on the center point of our guidance Engineering is now exp. to range between €124M and €134M, slightly below our original assumption CAPEX will range between € 230M and € 240M; net of customer contribution, € 215M to € 225M
Solid Performance in Q3 2026; On Track to Achieve FY26 Objectives In the short term, the adjustment in GLP revenue is exp. to temporarily moderate growth in 2027. We believe we can backfill in 2027 with growing biologics demand. Based on what we know today, believe we can grow LSD in 2027 Exp. main KPIs will continue to move in the right direction, including growth in HVS, expanding margins, and positive FCF Without this temporary headwind, we believe we were positioned to grow in line with our long-range plan of HSD to LDD in 2027 Over the medium to long-term, GLP-1s exp. to continue to drive favorable demand with (i) new assets coming to market, (ii) ongoing expansion of indications, and (iii) upcoming patent cliffs and new biosimilar launches Beyond 2027, we would expect to return to more normalized growth, underpinned by the strength of the broader biologics market More than 9,000 injectable assets in the global pipeline in advanced stages undergoing clinical evaluation or registration Our strategy is unchanged and firmly anchored in the higher-valued subsets of the market. The business is positioned as a leader in Biologics, and we are progressing against our objectives Q3 2026 Financial Results

Upcoming Conferences and Marketing Activities Jefferies Healthcare Conference in London – November 18, 2026 KeyBanc Investor Trip to Latina facility – November 20, 2026 Citi Global Healthcare Conference in Miami – December 2, 2026 CJS Securities Annual “New Ideas for the New Year” (virtual) – January 7, 2027 caterina.tripepi@stevanatogroup.com lisa.miles@stevanatogroup.com giacomo.guiducci@stevanatogroup.com Investor Relations Contacts Media Relations Contacts
This presentation contains non-GAAP financial measures. Please refer to the tables included in this presentation for a reconciliation of non-GAAP measures. Management monitors and evaluates our operating and financial performance using several non-GAAP financial measures, including Constant Currency Revenue, Organic Revenue and Change in Organic Revenue, EBITDA, Adjusted EBITDA, Adjusted EBITDA Margin, Adjusted Operating Profit, Adjusted Operating Profit Margin, Adjusted Income Taxes, Adjusted Net Profit, Adjusted Diluted EPS, Capital Employed, Net Cash, Free Cash Flow, and CapEx. We believe that these non-GAAP financial measures provide useful and relevant information regarding our performance and improve our ability to assess our financial condition. While similar measures are widely used in the industry in which we operate, the financial measures we use may not be comparable to other similarly titled measures used by other companies, nor are they intended to be substitutes for measures of financial performance or financial position as prepared in accordance with IFRS. Reconciliation of Non-GAAP Financial Measures Q3 2026 Financial Results
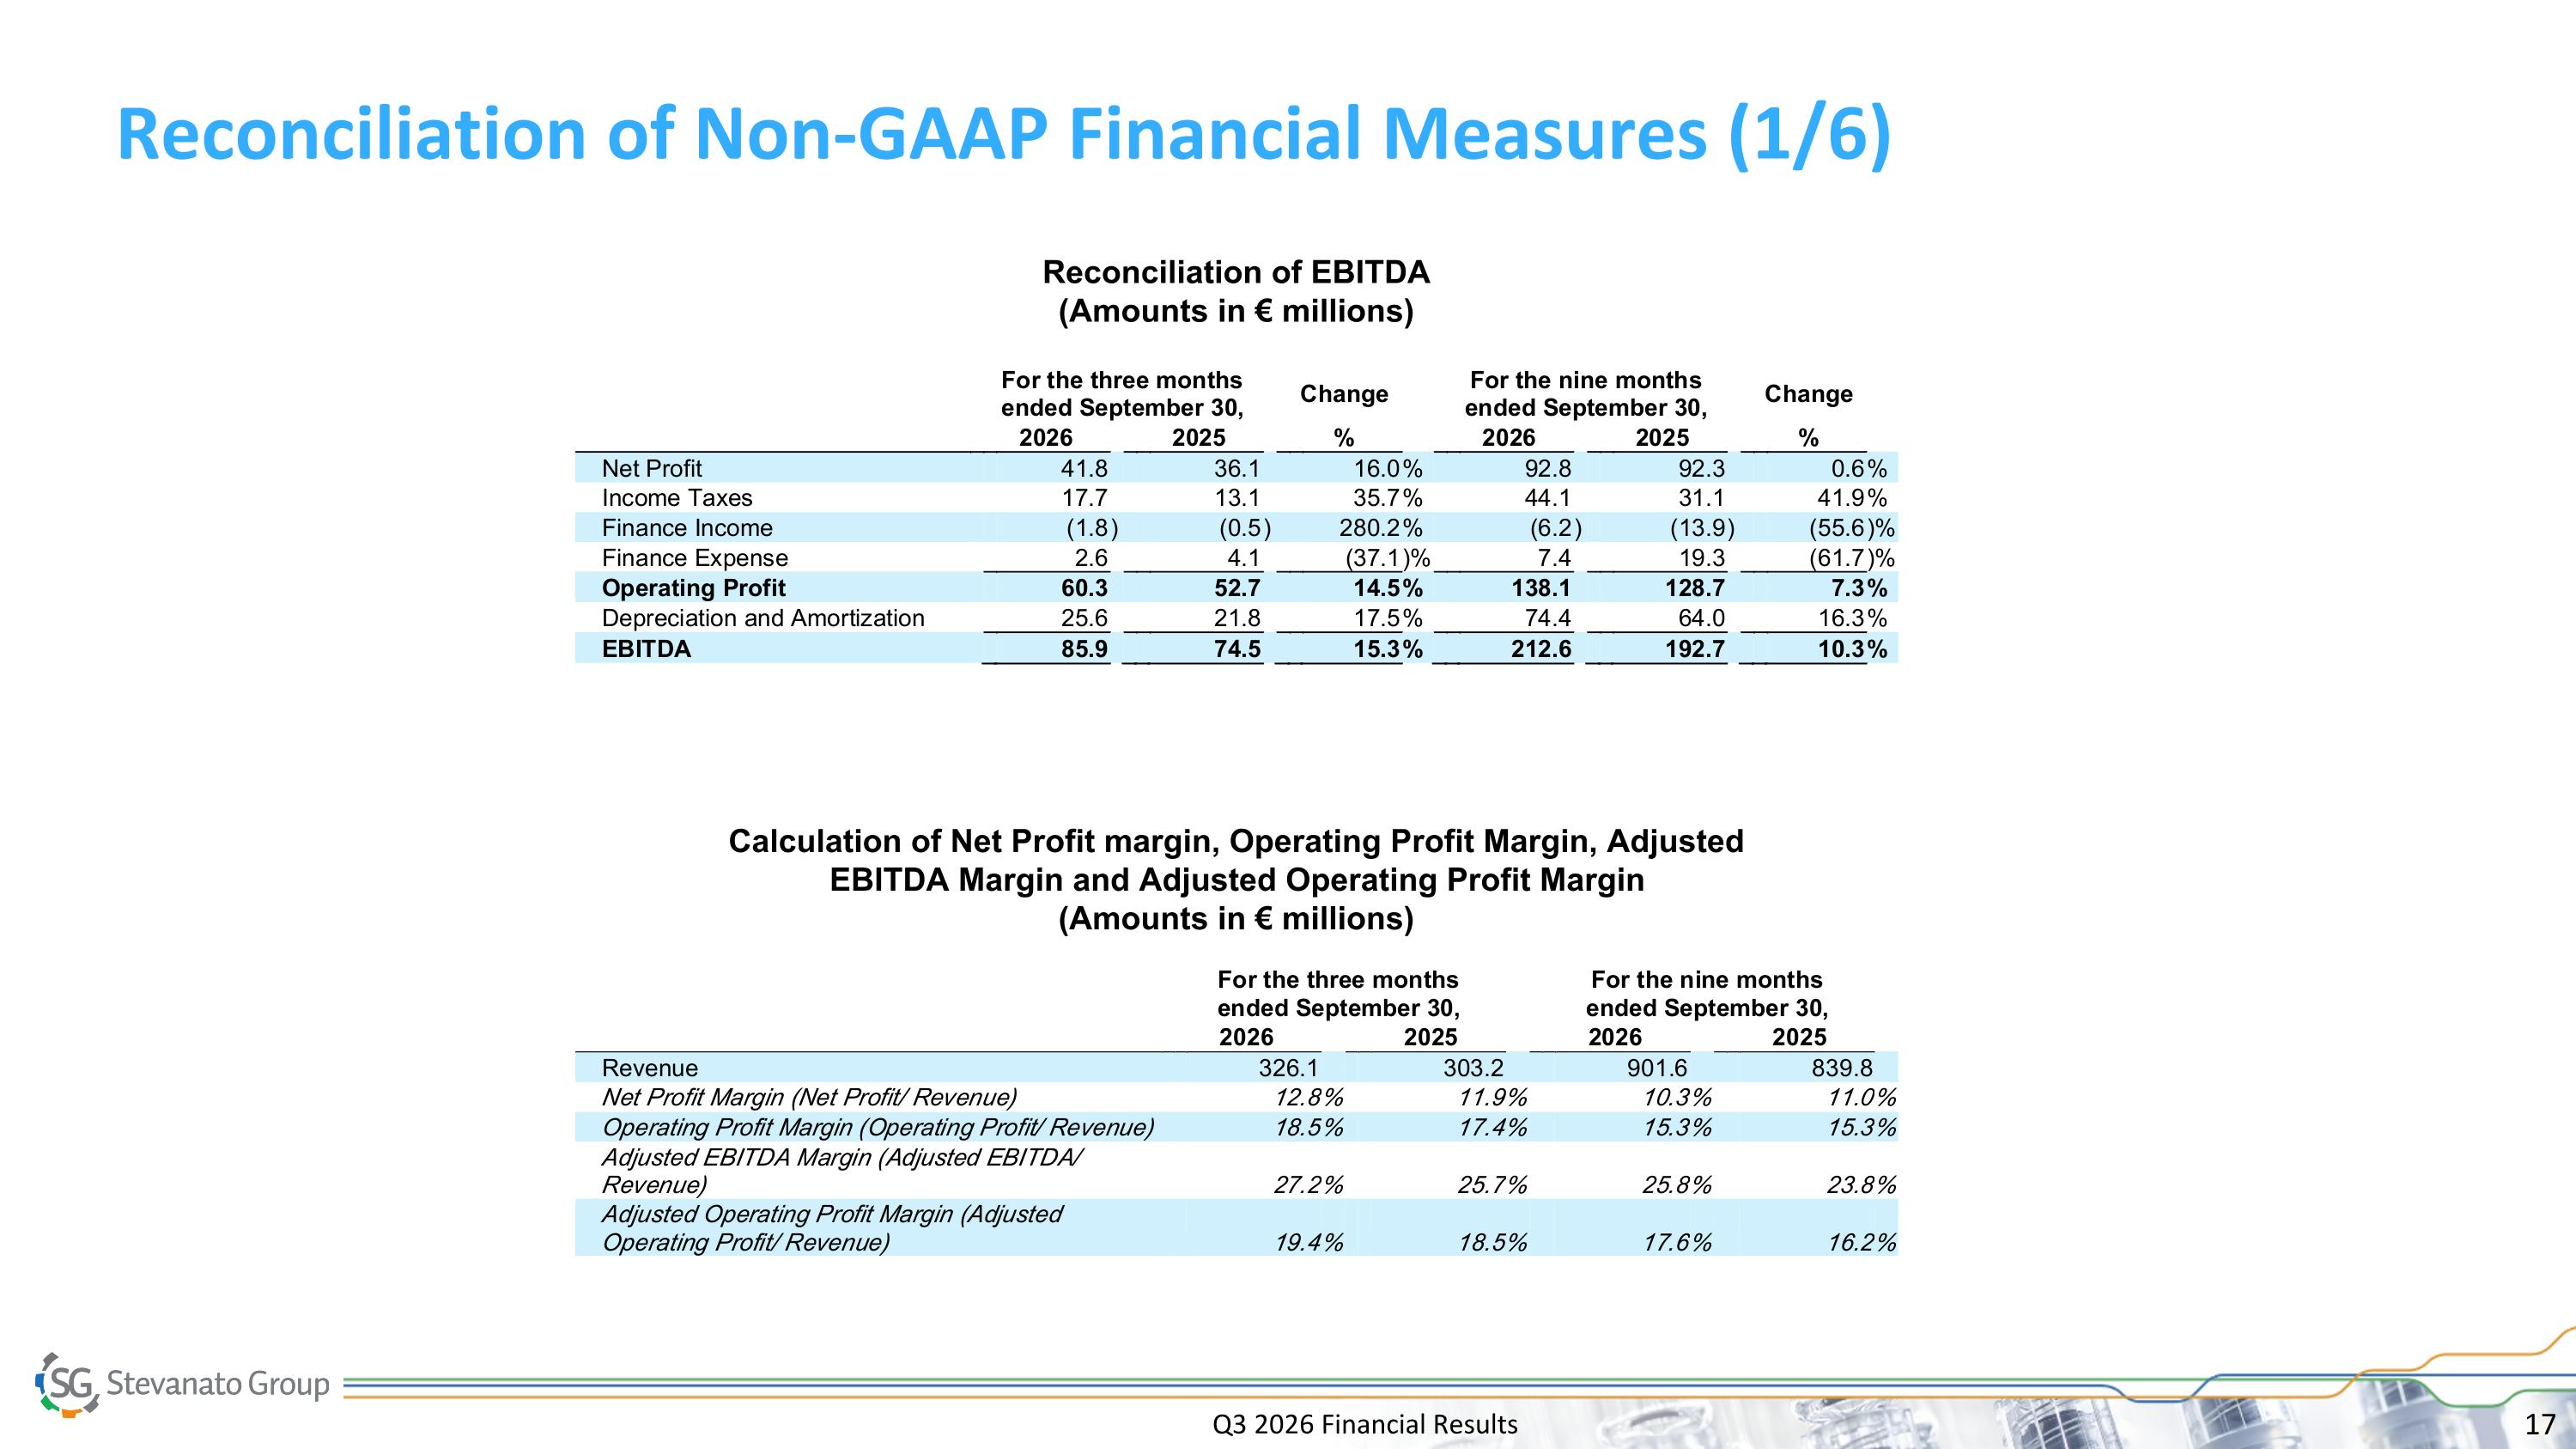
Reconciliation of Non-GAAP Financial Measures (1/6) Reconciliation of EBITDA (Amounts in € millions) Calculation of Net Profit margin, Operating Profit Margin, Adjusted EBITDA Margin and Adjusted Operating Profit Margin (Amounts in € millions) Q3 2026 Financial Results
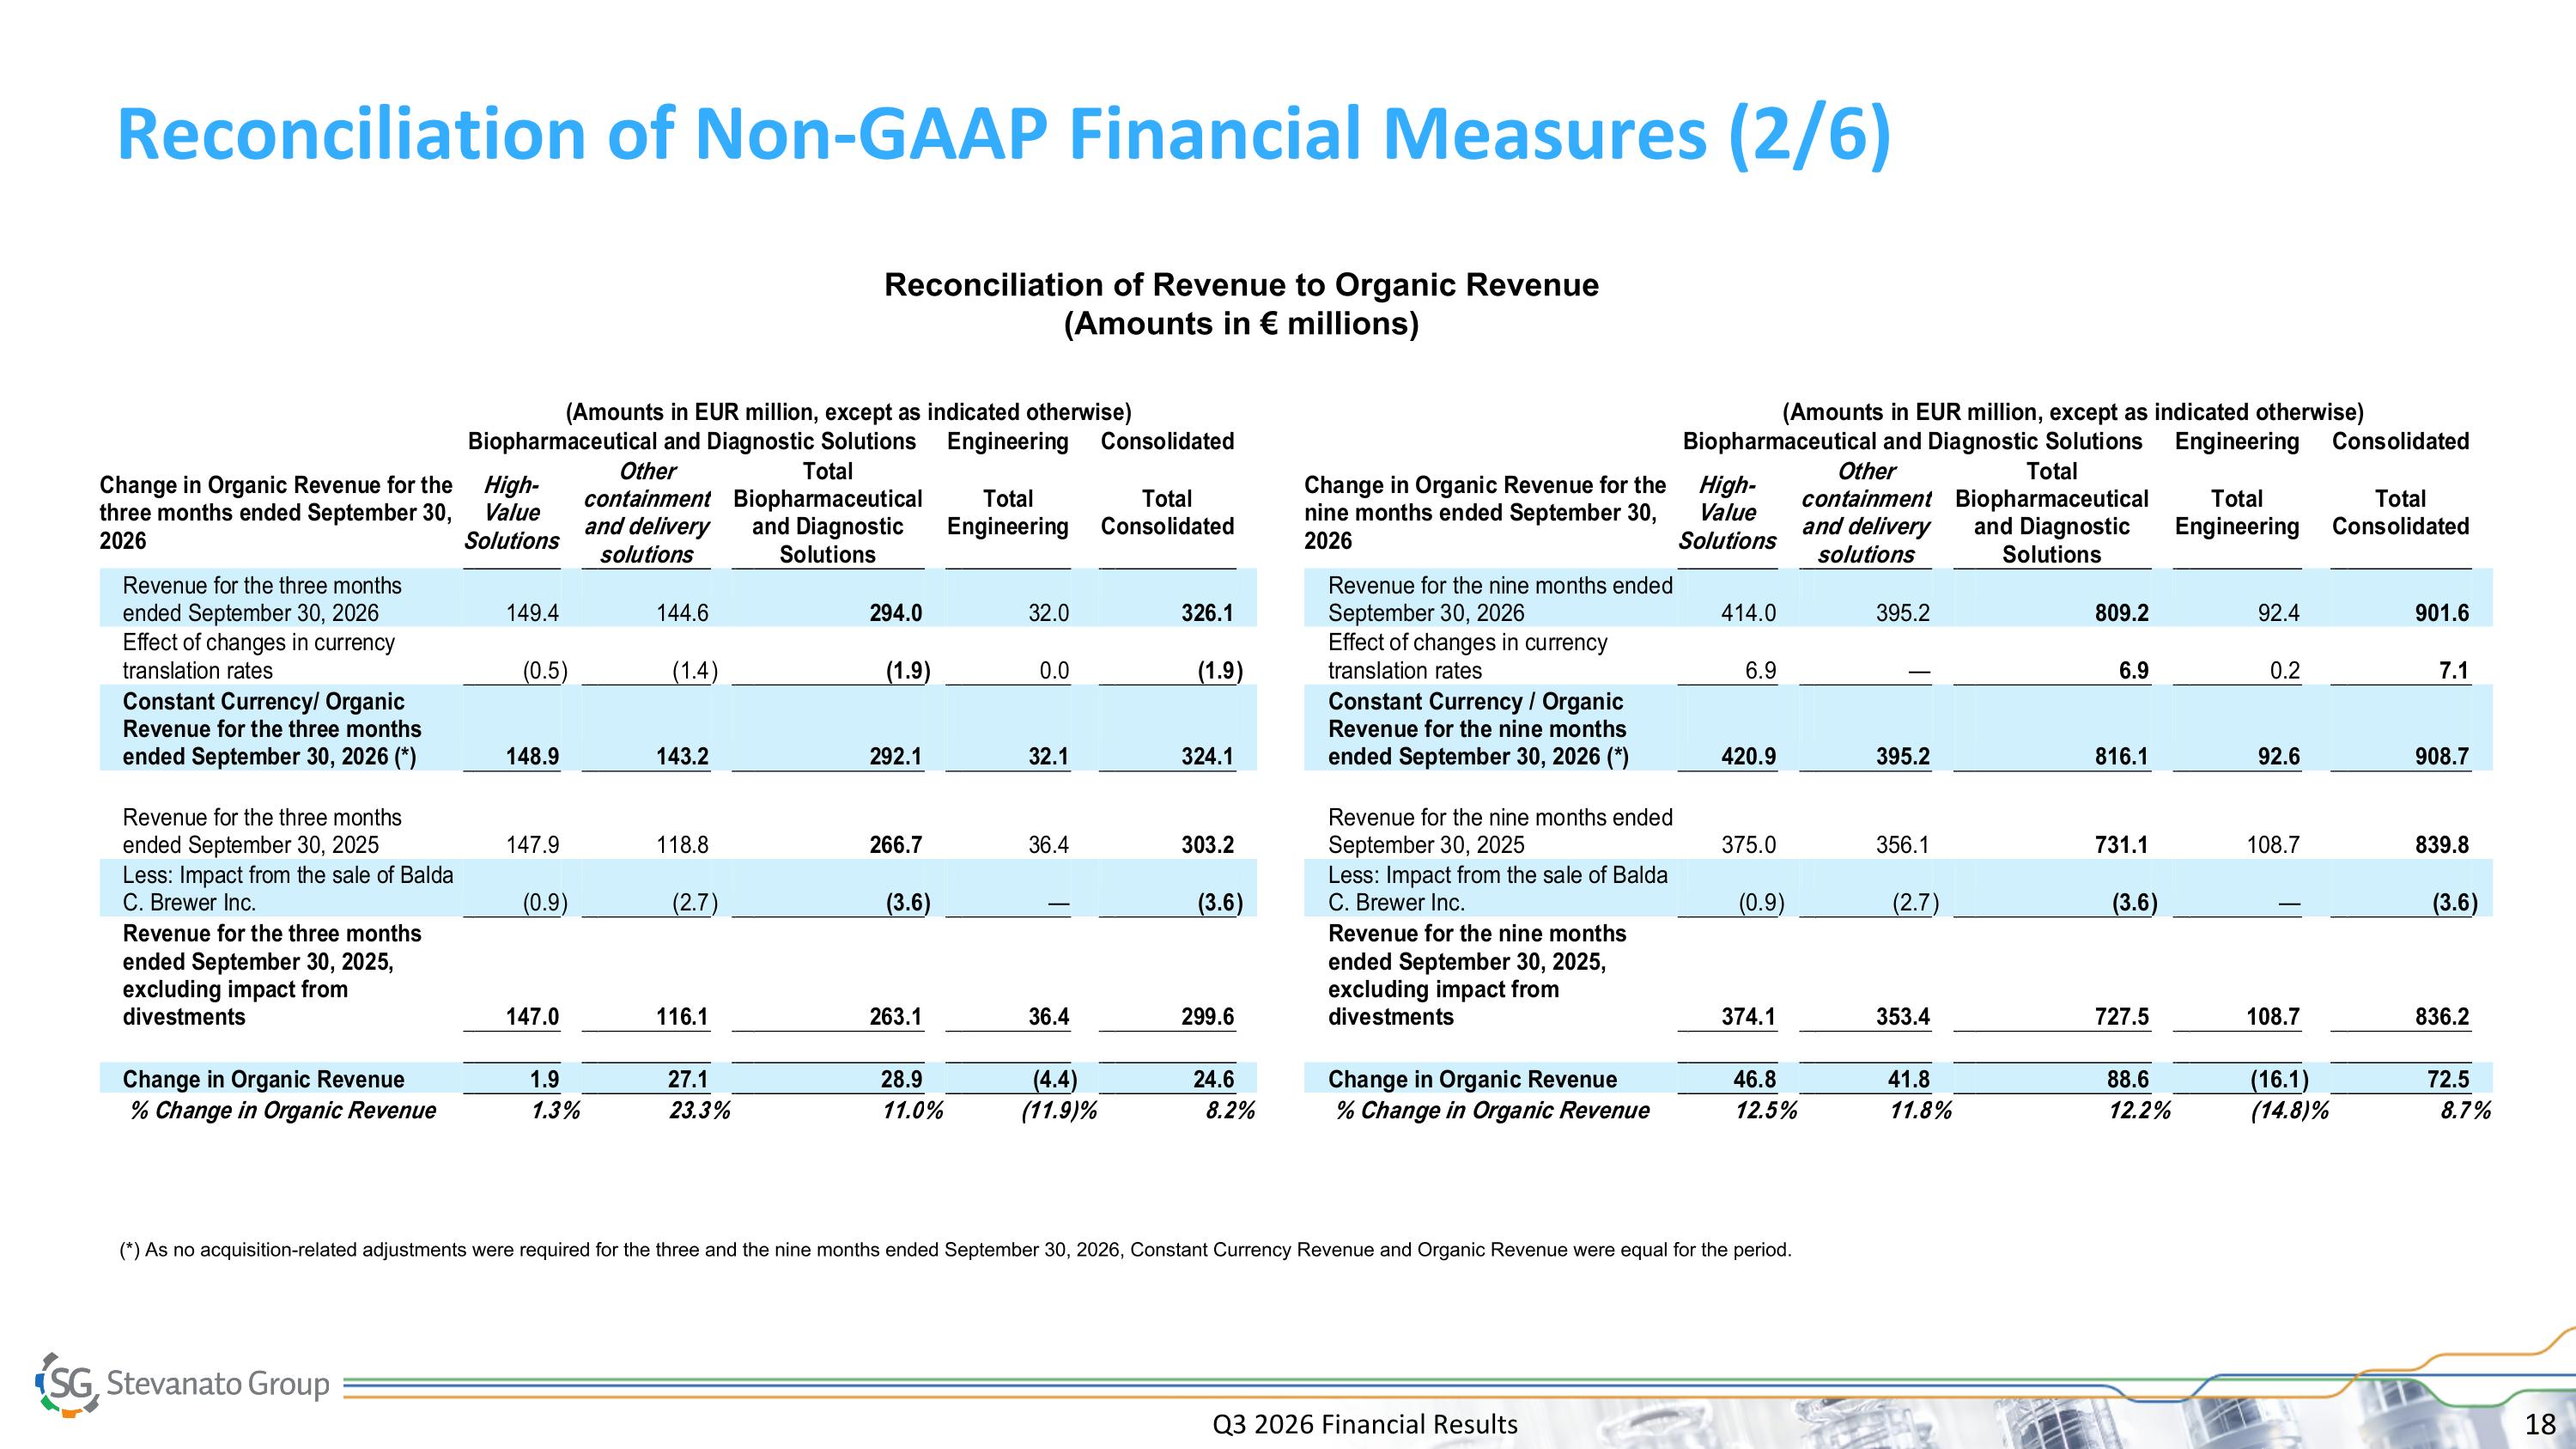
Q3 2026 Financial Results Reconciliation of Non-GAAP Financial Measures (2/6) Reconciliation of Revenue to Organic Revenue (Amounts in € millions) (*) As no acquisition-related adjustments were required for the three and the nine months ended September 30, 2026, Constant Currency Revenue and Organic Revenue were equal for the period.
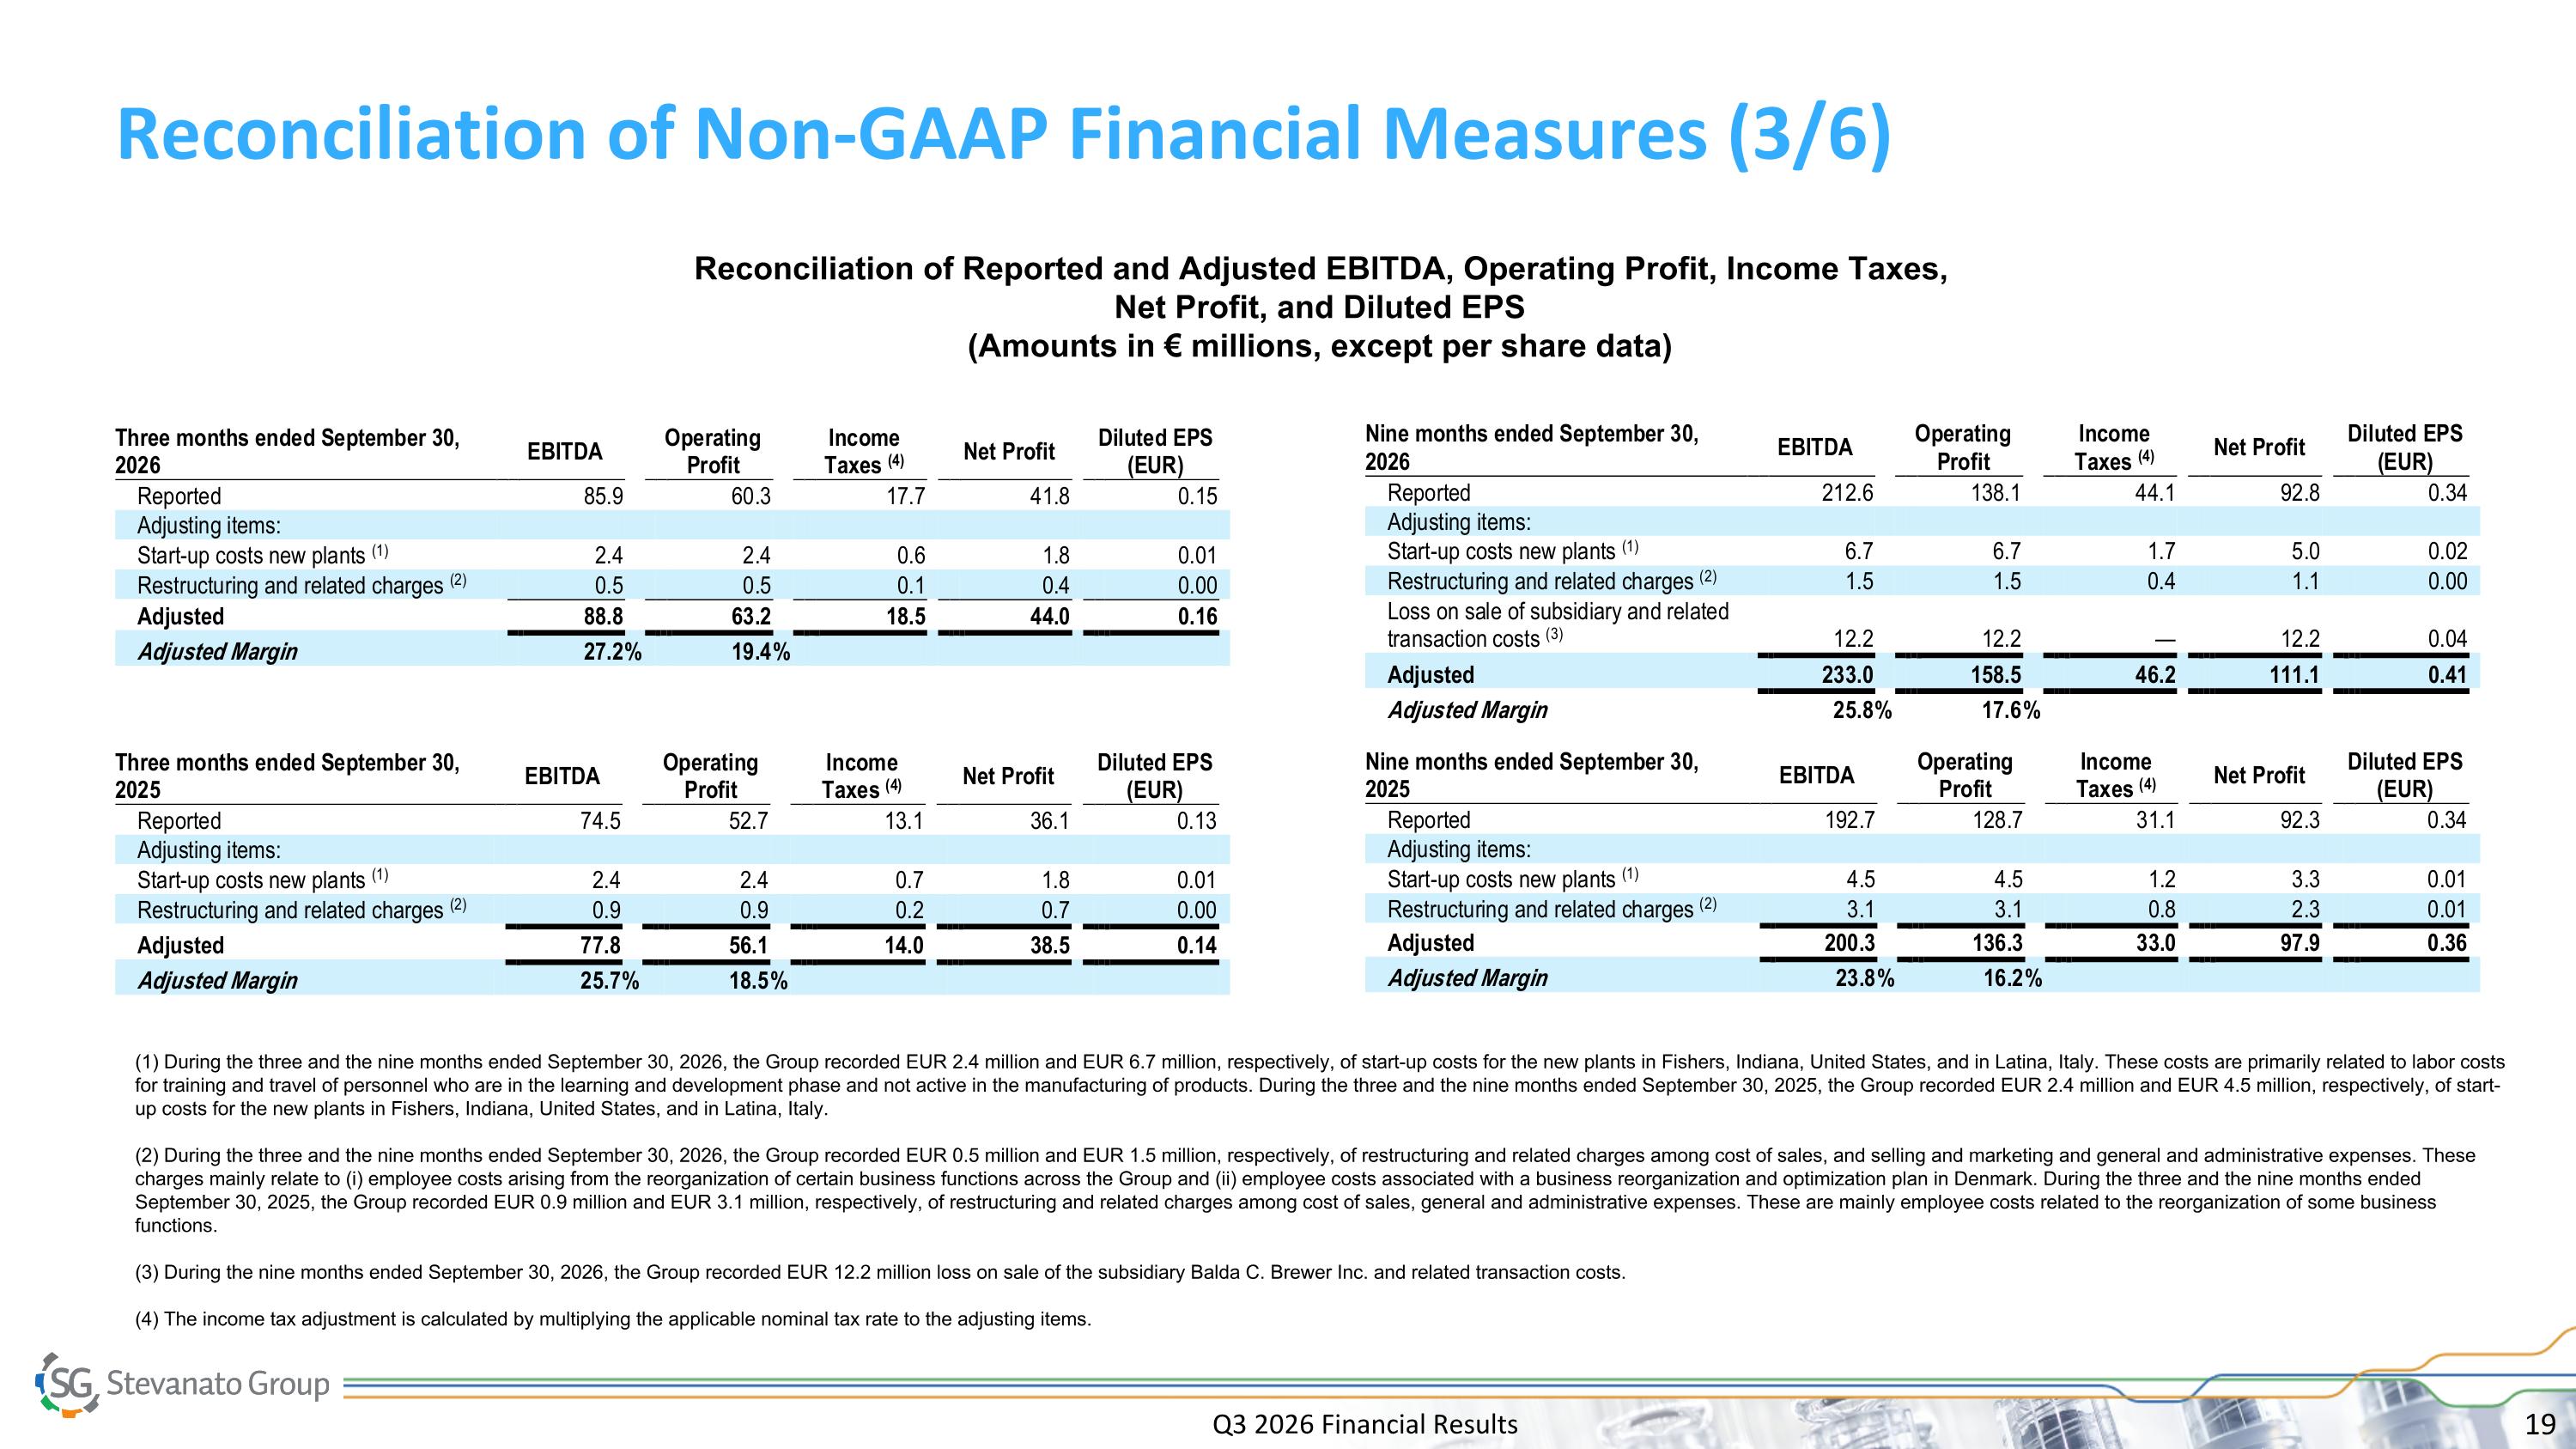
Reconciliation of Non-GAAP Financial Measures (3/6) Reconciliation of Reported and Adjusted EBITDA, Operating Profit, Income Taxes, Net Profit, and Diluted EPS (Amounts in € millions, except per share data) (1) During the three and the nine months ended September 30, 2026, the Group recorded EUR 2.4 million and EUR 6.7 million, respectively, of start-up costs for the new plants in Fishers, Indiana, United States, and in Latina, Italy. These costs are primarily related to labor costs for training and travel of personnel who are in the learning and development phase and not active in the manufacturing of products. During the three and the nine months ended September 30, 2025, the Group recorded EUR 2.4 million and EUR 4.5 million, respectively, of start-up costs for the new plants in Fishers, Indiana, United States, and in Latina, Italy. (2) During the three and the nine months ended September 30, 2026, the Group recorded EUR 0.5 million and EUR 1.5 million, respectively, of restructuring and related charges among cost of sales, and selling and marketing and general and administrative expenses. These charges mainly relate to (i) employee costs arising from the reorganization of certain business functions across the Group and (ii) employee costs associated with a business reorganization and optimization plan in Denmark. During the three and the nine months ended September 30, 2025, the Group recorded EUR 0.9 million and EUR 3.1 million, respectively, of restructuring and related charges among cost of sales, general and administrative expenses. These are mainly employee costs related to the reorganization of some business functions. (3) During the nine months ended September 30, 2026, the Group recorded EUR 12.2 million loss on sale of the subsidiary Balda C. Brewer Inc. and related transaction costs. (4) The income tax adjustment is calculated by multiplying the applicable nominal tax rate to the adjusting items. Q3 2026 Financial Results
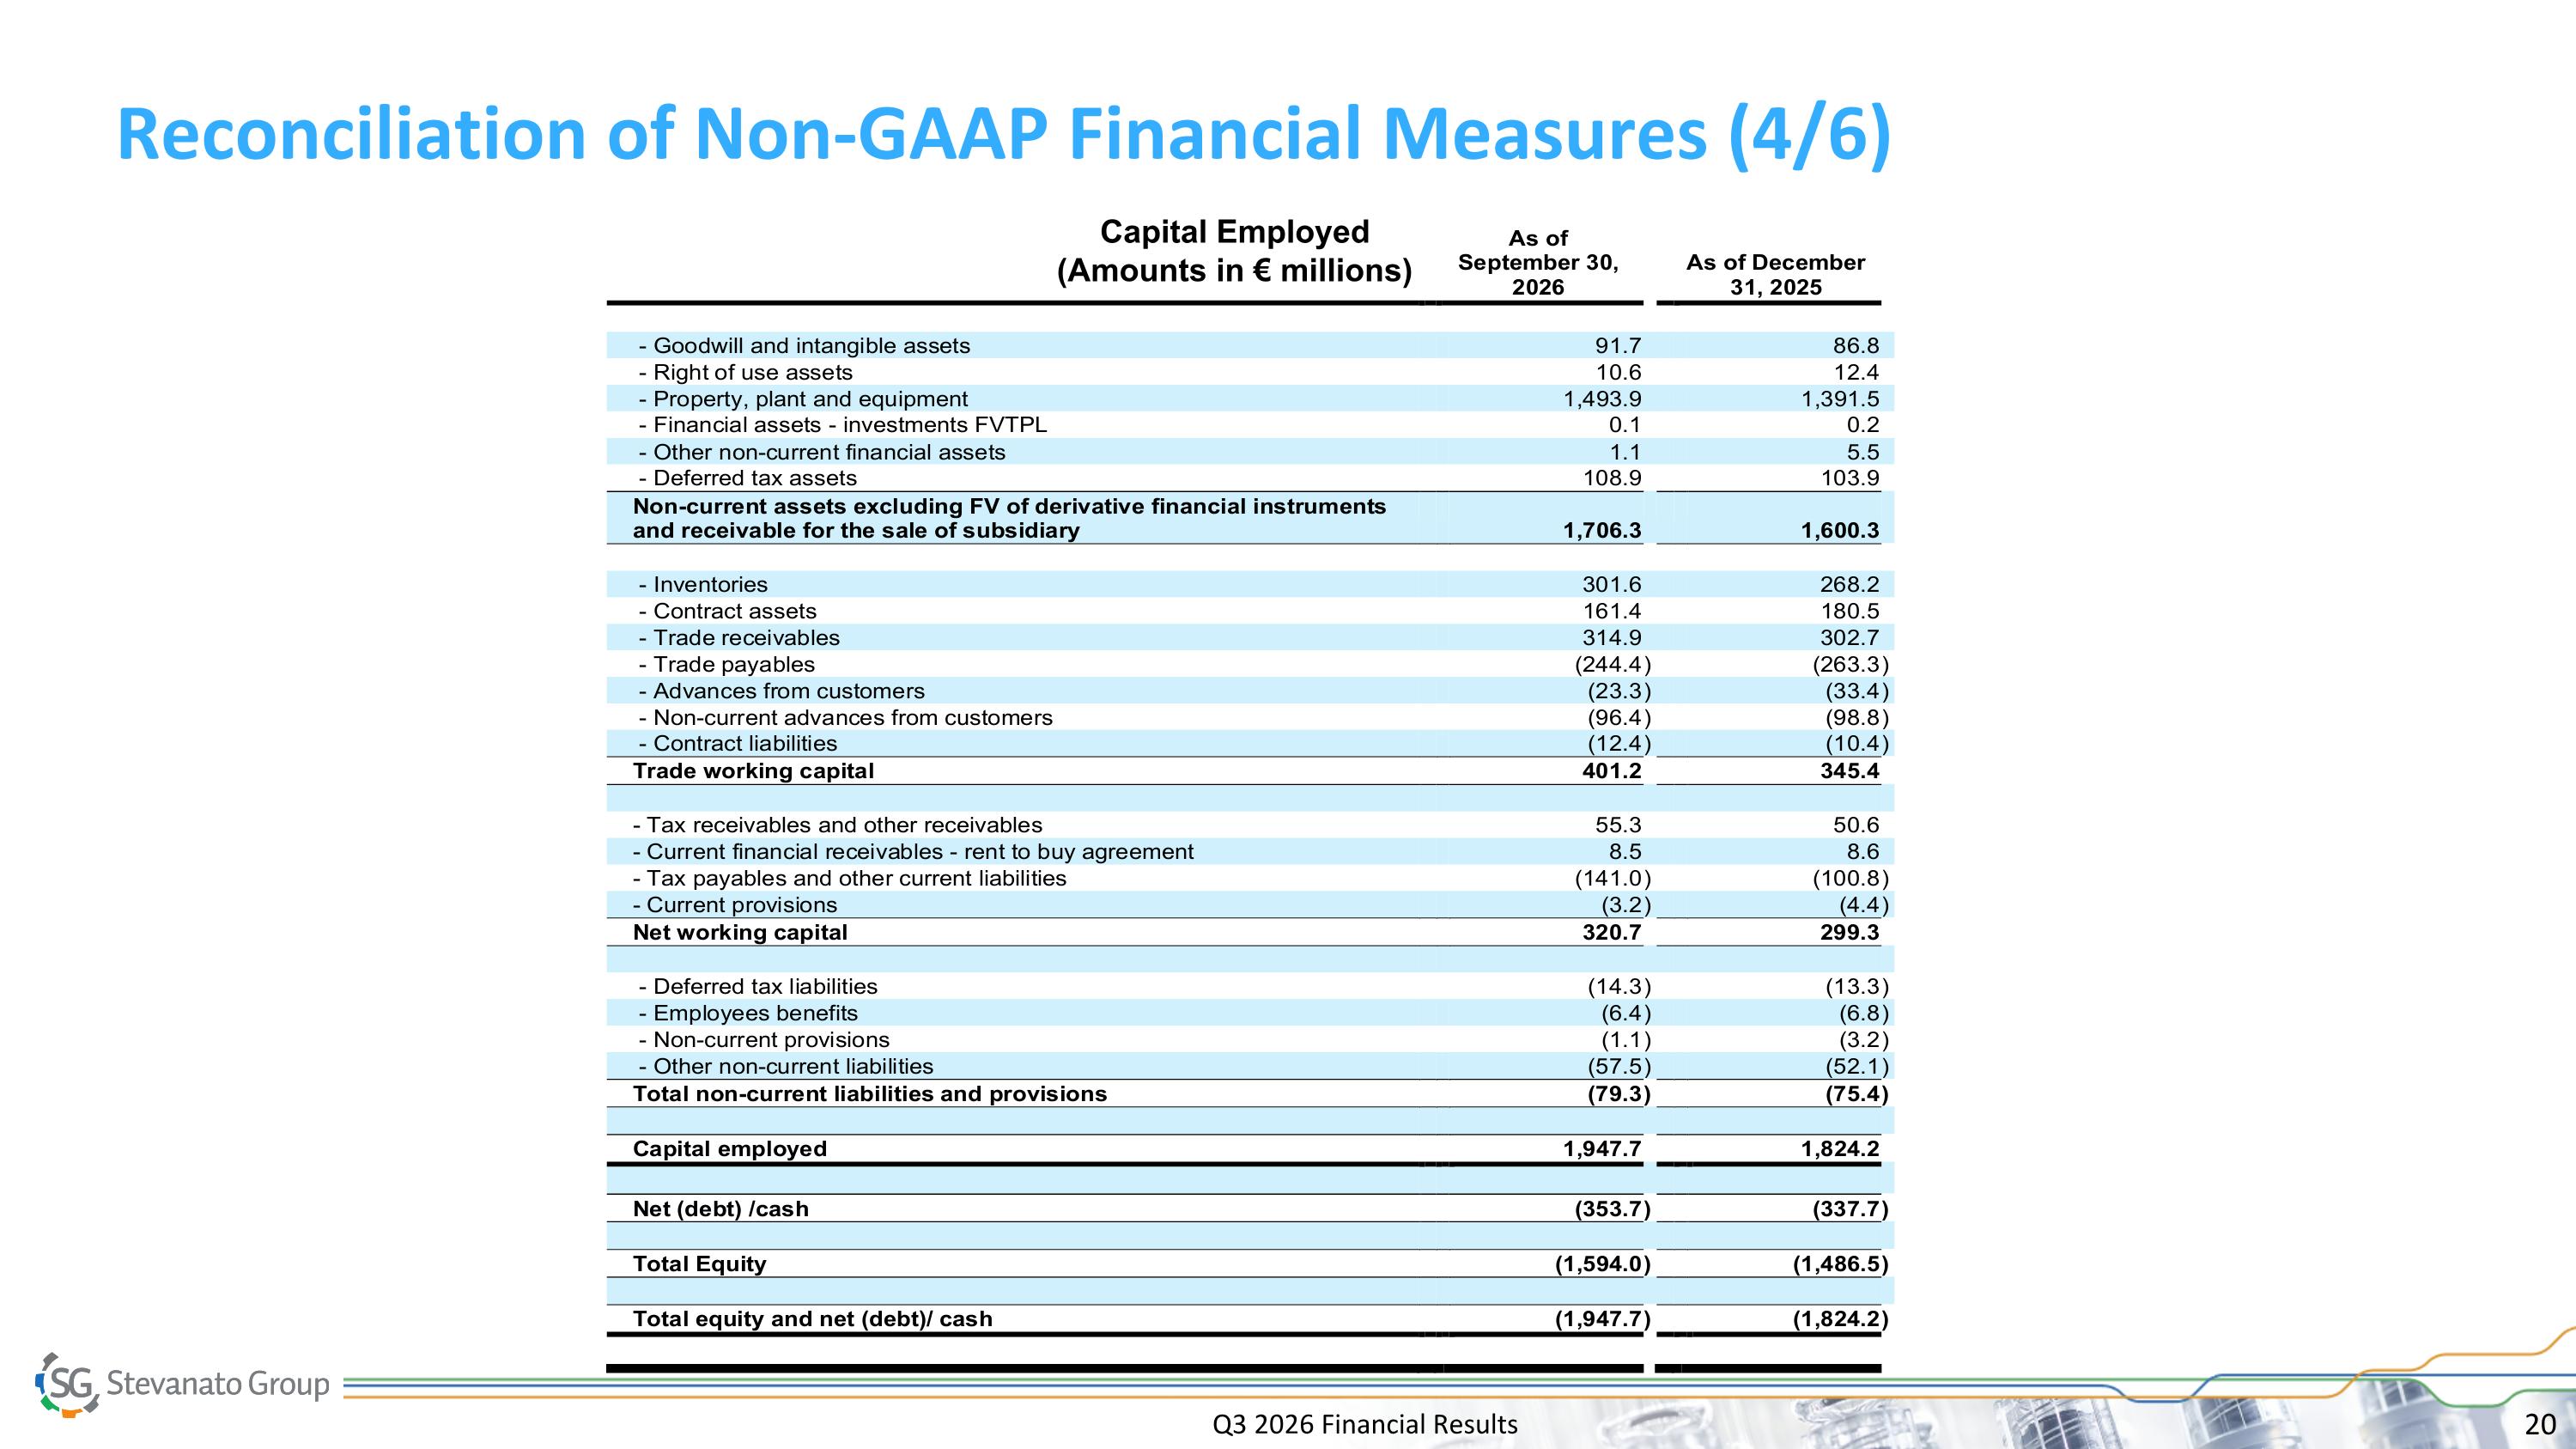
Reconciliation of Non-GAAP Financial Measures (4/6) Capital Employed (Amounts in € millions) Q3 2026 Financial Results
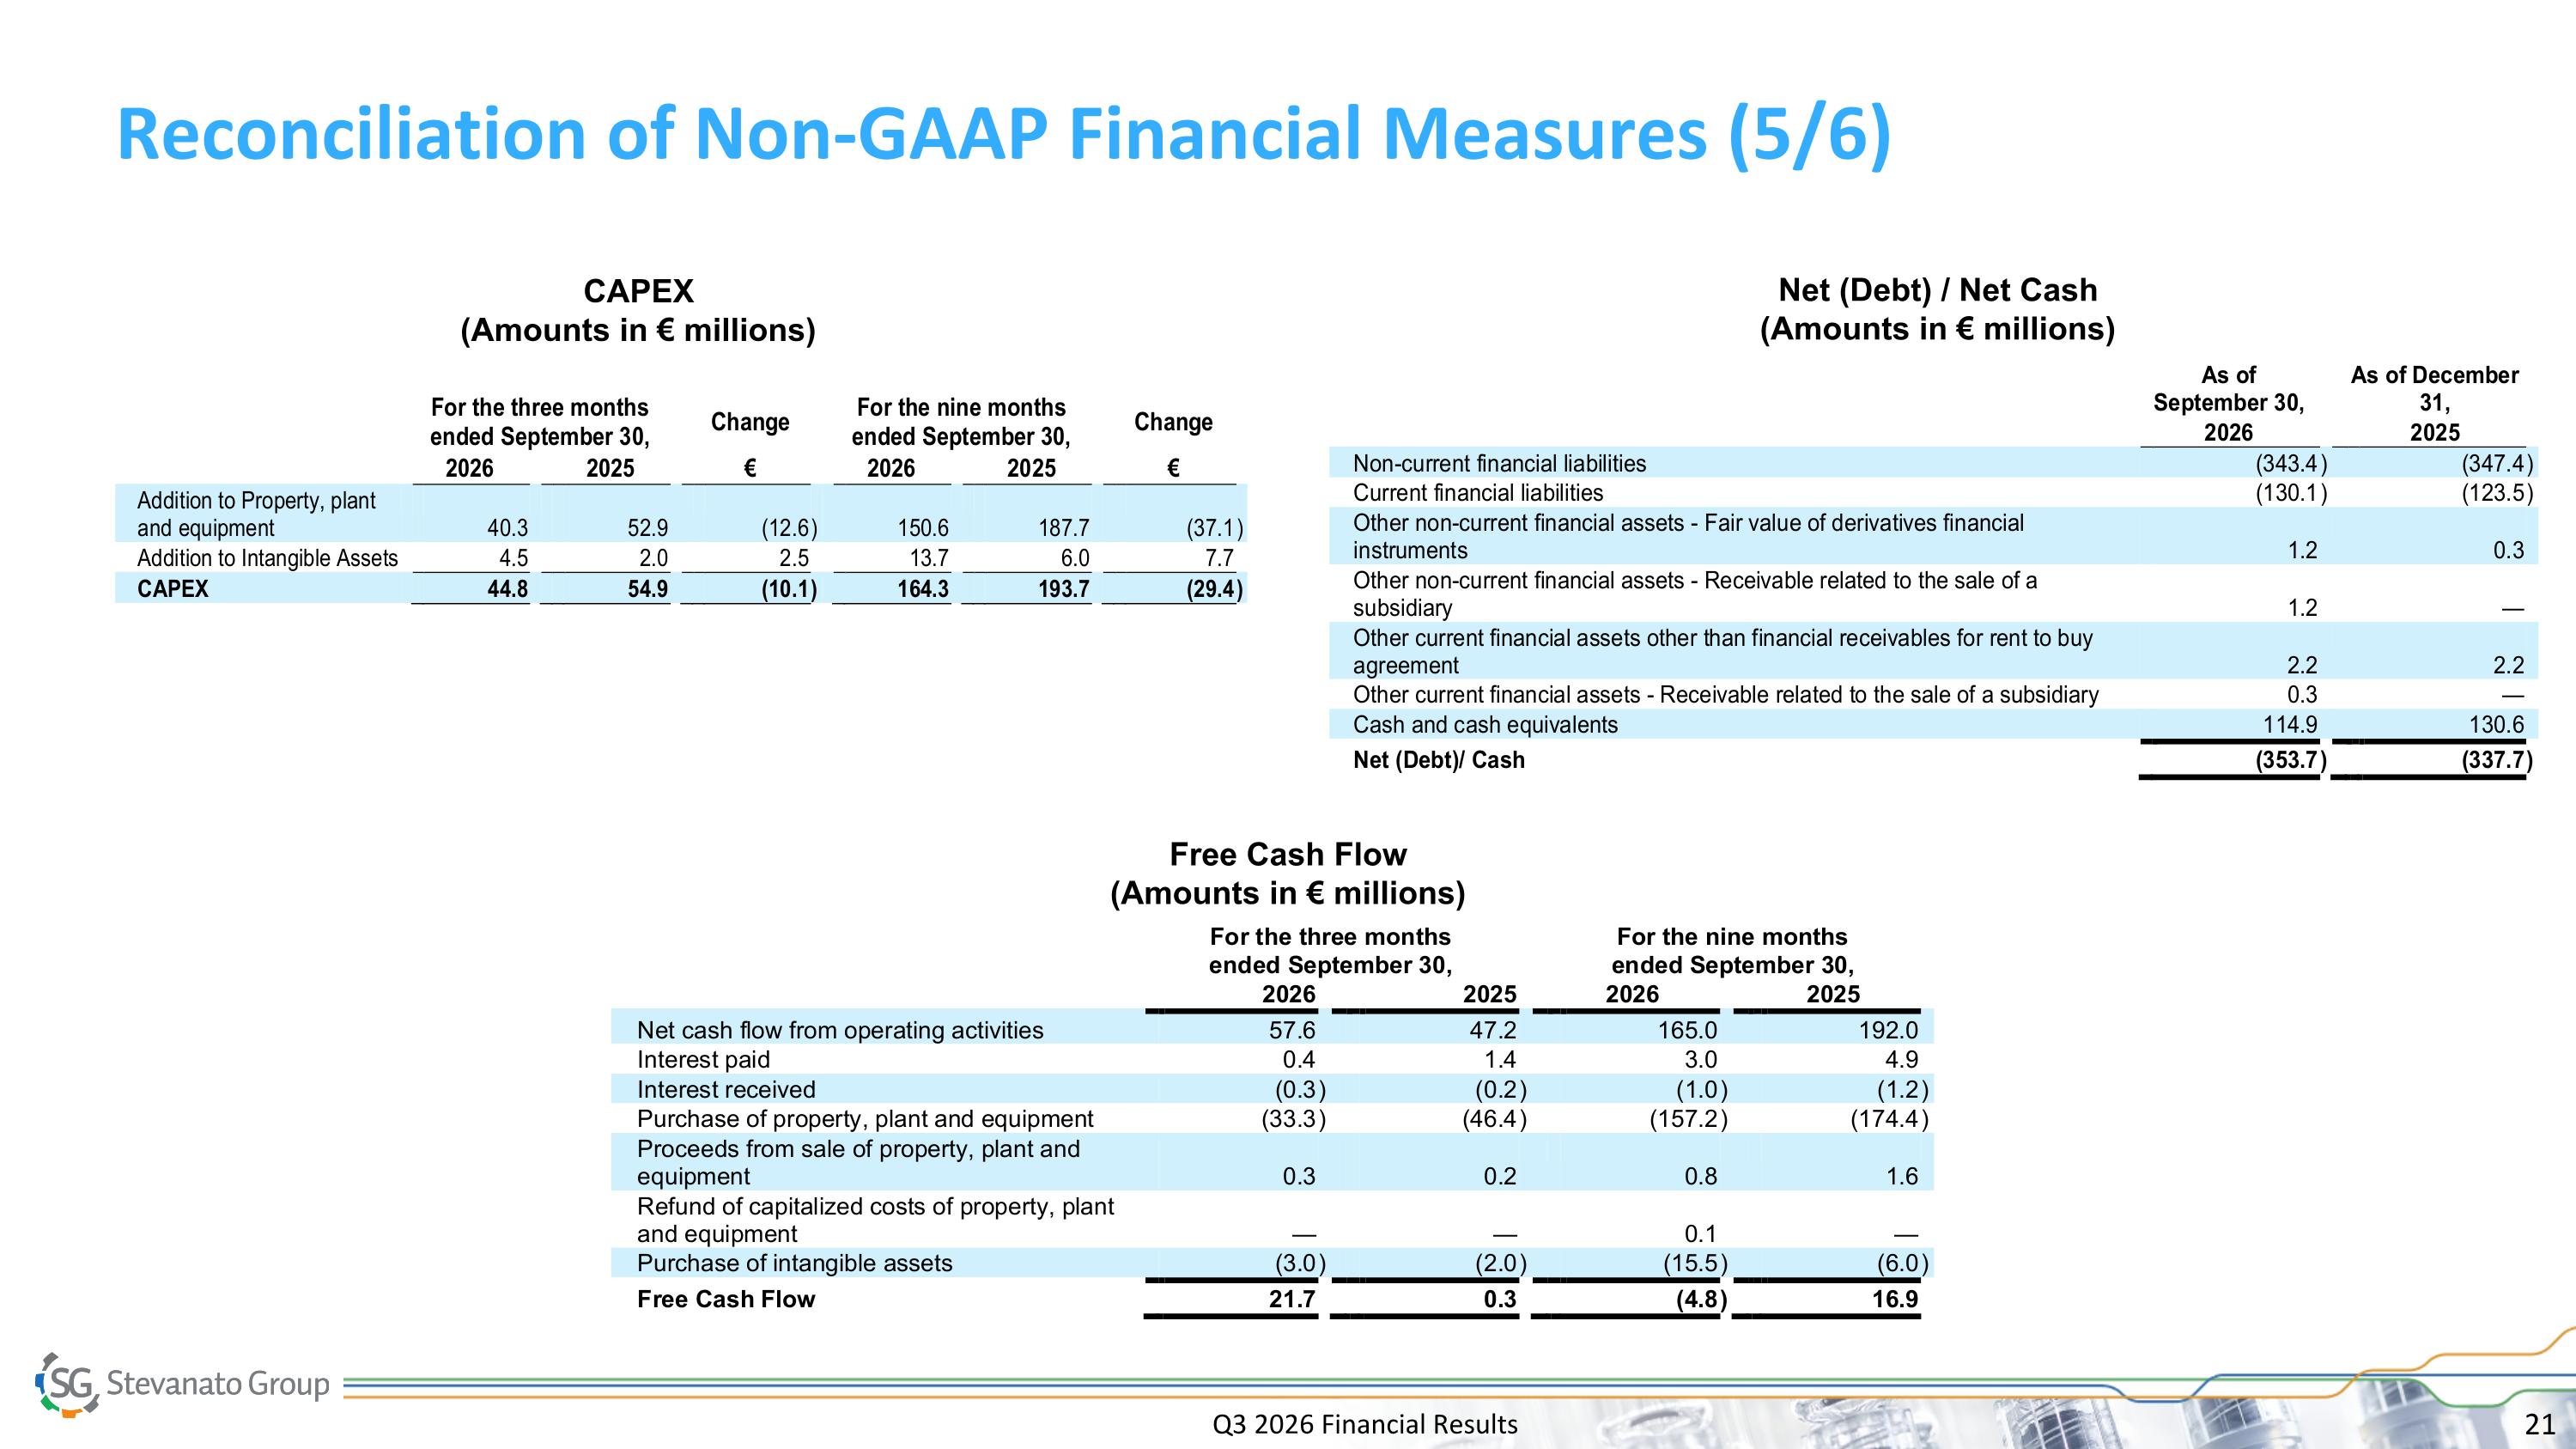
Reconciliation of Non-GAAP Financial Measures (5/6) Net (Debt) / Net Cash (Amounts in € millions) Free Cash Flow (Amounts in € millions) CAPEX (Amounts in € millions) Q3 2026 Financial Results
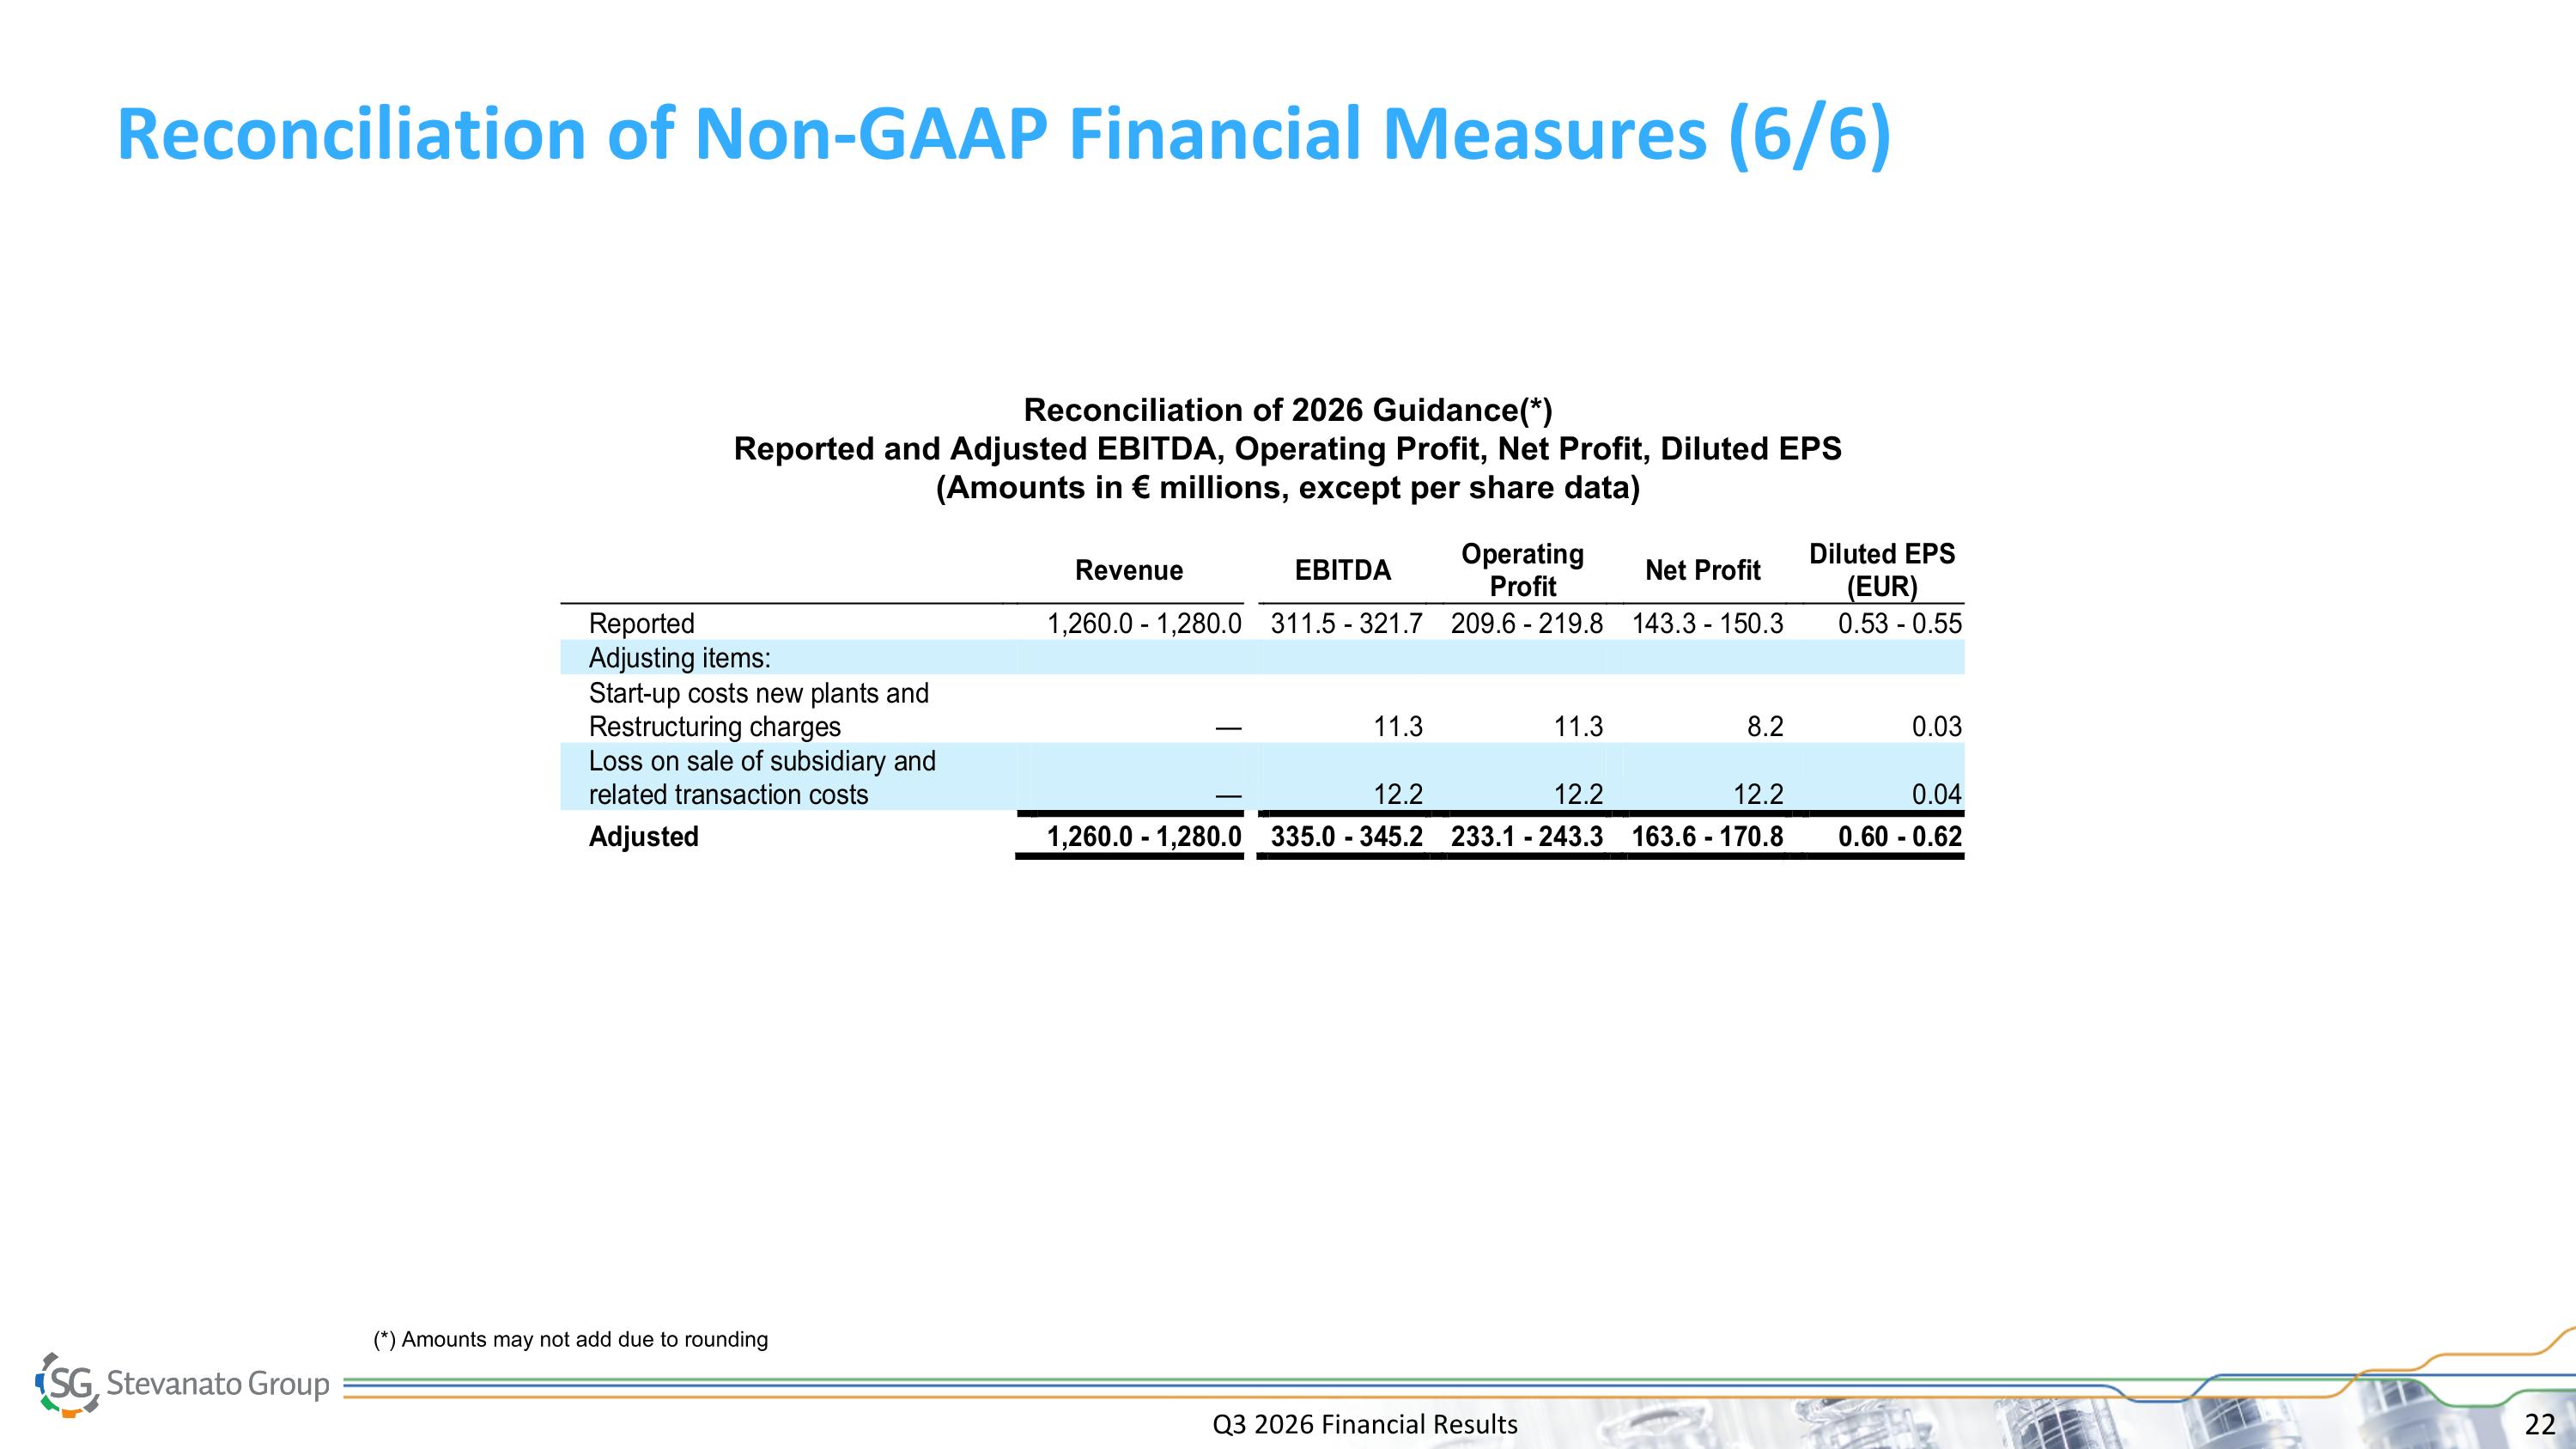
Reconciliation of Non-GAAP Financial Measures (6/6) Reconciliation of 2026 Guidance(*) Reported and Adjusted EBITDA, Operating Profit, Net Profit, Diluted EPS (Amounts in € millions, except per share data) (*) Amounts may not add due to rounding Q3 2026 Financial Results