
Exhibit 99.2 Cleansing Materials OCTOBER 2026 SUBJECT TO EXPRESS NON-DISCLOSURE AGREEMENT | SUBJECT TO FRE 408 & EQUIVALENTS
SUBJECT TO EXPRESS NON-DISCLOSURE AGREEMENT 0 SUBJECT TO FRE 408 & EQUIVALENTS 74 151 #004A97 Disclaimer This documen t (along with any related oral commentary and supplemental materials or updates, th is “Presen tation”) has been pr epared by Mercer International Inc. (“Mercer” or the “Company”) solely to provide each recipient h ereof with 98 certain information, in summary form only, relating to the Company and the Company’s proposed transaction(s). This Presentation is provided as of the date hereof, and Mercer undertakes no obligation to update or revise the financial 168 information set forth in this Presentation as a result of new information, future events or otherwise, except as otherwise required by law. The delivery of this Presentation should not create an y implication that there has been no change in 220 the business and affairs of the Company since such date. #62A8DC This Presentatio n contains information that is p roprietary or confidential in nature. By accepting this Presentation, each re cipient agrees to treat this Presentation and the information con tained herein in a confidential manner, to use this Presentation and such information only in conn ection with any prop osed transaction, and that this Presentation and such information shall not be divulged to any person or en tity or reproduced, disseminated, disclosed by the recipient, directly or indirectly, in whole or in part, in each case, other than to the extent permitted pursuant to the terms of the applicable confid entiality agreement or other non-disclosure agreement between the recipient and the Company entered 1 into in connection herewith. 95 Receipt of this Presentation does not create, nor is it intended to create, a contract or commitment between the Company and the recipient or any other party with respect to consummation o f any transaction. This P resentation may not be 0 relied upon by any party as the basis for any such contract or commitment. #015F00 Certain statements herein constitute “forward-looking statements” within the meaning of the Private Securities Litigatio n Reform Act of 1995, as amended, including, with out limitation financial projections and other estimates (collectively, the “Projections”) with respect to the anticipated performance of Mercer, that do not directly or exclusively relate to historica l facts. These forward-looking statements and Projections reflect Mercer’s intentions, plans, expectations, assumptions 0 and beliefs about future events and are subject to risks (including regu latory risks), u ncertainties and other factors, many of which are outside o f Mercer’s control. The risks described above are not exhaustive and additional factors could 37 adversely affect our business and financial performance, including the risk factors discussed u nder the section captioned “Ri sk Factors” in the Company's most recent Annu al R eport on Form 10-K and Company's Quarterly Reports on Form 10-Q, and as may be updated in Company's o ther filings with the U.S. Securities and Exchange Commission (the SEC ). These fo rwa rd-looking statements are generally identified by the use of words such as “may,” “will,” “seeks,” “anticipates,” 61 “believe,” “estimates,” “expects,” “plans,” “intends,” “should” or similar expressions. The Projections have been prepared in good faith based upon assumptions that Mercer believes to be reasonable as of the date on the cover of this #00253D Presentation, it being understood that the Projections are as to future events and are not to be viewed as facts, that the Pr ojections are subject to significant uncertainties and contingencies, many of which are beyond the Company’s control, that no assurance can be given that any particular Pro jections will be realized and that actual results during the period o r periods covered by any such Projections may differ significantly from the projected results an d such differences may be material. In addition, such forward-looking statements, estimates and Projections were not prepared with a view to public dis closure or compliance with published guidelines of the SEC, the guidelines established by the American Institute 145 of Certified Public Accountants or U.S. generally accepted accoun ting principles (“U.S. GAAP”) or any other applicable accoun ting principles. 26 Important factors that could cause actual results to differ materially from the expectations expressed or implied in the forward-looking statements include known and unknown risks. Accordingly, there can be no assurance that such forward - 57 looking statements and estimates will be realized. Because actual resu lts could differ materially from our intentions, p lans, expectations, assumptions and beliefs about the future, all forward-looking statements contained herein with #911A39 caution. Mercer does not undertake any obligation to update or revise any forward-looking statements, whether as a result of new information, future events or otherwise. Additionally, this Presentation contains certain non -U.S. GAAP financial measures. Because not all comp anies calculate non -U.S. GAAP fin ancial information identically (or at all), the presentations herein may not be comp arable to other 255 similarly titled measures used by other companies. The no n-U.S. GAAP financial information presented herein should b e considered in addition to, not as a substitute for, or superior to, finan cial measures calculated in accordance with U.S. GAAP . They are no t measurements of the Company’s financial performance under U.S. G AAP and should not be considered as altern atives to any performance measures derived in accordance with U.S. GAAP. The n on-U.S. GAAP financial 192 information has limitations as analytical tools, and you sh ould not consider it in isolation or as a substitute for analysis of the Company’s operating results as reported under U.S. GAAP. The Company compensates for these limitations by 0 relyin g primarily on the Company’s U .S. GAAP results and using the non-U.S. GAAP financial information on ly for supplemental pur poses. #FFC000 Mercer does not guarantee the accuracy or completeness of information which is contained in this Presentation (including info rmation which is stated to have been obtained from or is based upon trade and statistical services or other third- party sources). Any data on p ast performance, modeling or back-testing contained herein is no indication as to future performanc e. No representation, guarantee or warranty (express or implied) is made as to the reasonableness of the assumptions made with in or the accuracy or completeness of any modeling or back testin g. All opinions and estimates are given as of the date hereof and are subject to change. The information in this Presentation is not intended to predict 119 actual results and no assu rances are given with respect thereto. Nothing herein shall be deemed to constitute investment, legal, tax, financial, accou nting or other advice. 119 This Presentatio n is for discussion and settlement purposes only and is subject to the provisions of Rule 408 of the Federal Rules of Evidence and other applicable statutes, rules, and doctrines protecting the use or disclosure of confidential 119 information and information exchanged in the context of settlement discussions. #777777 THIS DOCUMENT IS NOT AN OFFER TO SELL OR A SOLICITATION OF AN OFFER TO BUY ANY BUSINESS, SECURITY, OPTION, COMMOD ITY, FUTU RE, LOAN OR CU RRENCY. IT IS NOT A COMMITMENT TO UNDERWRITE ANY SECURITY, TO LOAN ANY FUNDS OR TO MAKE ANY INVESTMENT. 192 NO ACTION HAS BEEN MADE OR WILL BE TAKEN THAT WOULD PERMIT A PUBLIC OFFERING OF ANY SECU RITIES IN ANY JUR ISDICTION IN WHICH ACTION FOR THAT PURPOSE IS R EQUIRED. NO OFFERS, SALES, R ESALES OR DELIVER Y OF ANY 192 SECURITIES OR DISTRIBUTION OF ANY OFFERING MATERIAL RELATING TO ANY SECURITIES MAY BE MADE IN OR FROM ANY JURISDICTION EXCEPT IN CIRCUMSTANCES WHICH WILL RESULT IN COMPLIANCE WITH ANY APPLICABLE LAWS AND 192 REGULATIONS AND WHICH WILL NOT IMPOSE ANY OBLIGATION ON MERCER OR ANY OF ITS RESPECTIVE AFFILIATES. #C0C0C0 THIS DOCUMENT IS NOT INTENDED TO PROVIDE THE SOLE BASIS FOR ANY INVESTMENT DECISION IN CONNECTION WITH ANY PR OPOSED INVESTMEN T IN OR TRANSACTION INVOLVING THE COMPANY’S SECUR ITIES AND IS NOT A RECOMMENDATION WITH RESPECT TO ANY TR ANSACTION. RECIPIENTS SHOULD MAKE THEIR OWN. INDEPENDENT BUSINESS DECISION BASED ON ALL OTHER INFORMATION, ADVICE AND THEIR OWN JUDGEMENT. THE INFORMATION CONTAINED HER EI N IS NOT INTENDED TO BE D ISTRIBUTED TO ANY PROSPECTIVE OR ACTUAL INVESTORS AND , ACCORDINGLY, MAY NOT BE SHOWN OR GIVEN TO ANY PERSON OTHER THAN THE RECIPIENT, AND IS NOT TO BE FORWARDED TO ANY OTHER P ERSON (INCLUDING ANY R ETAIL INVESTOR OR CUSTOMER), COPIED OR OTHERWISE REPRODUCED OR D ISTRIBUTED TO ANY SUCH PERSON IN ANY MANNER WHATSOEVER. Mercer and its respective affiliates, officers, directors, employees, legal counsel, professional advisors and agents do not accept responsibility, obligation or liability for the accuracy or completeness (or lack thereof) o f this Presentation or its contents including the Projections (except to the extent that such liability cannot be excluded by law). 2
Contents COMPANY & SITUATION OVERVIEW 4 01 LIQUIDITY OVERVIEW 13 02 FINANCIAL FORECAST 15 03 APPENDIX 21 04 Mill Detail 22 Mercer Mass Timber Overview 30 Financial Forecast Detail 36 Capital Structure (September 30, 2026) 51 German RCF Waiver Term Sheet 53 Simplified Legal Entity Chart 55 3
01 Company & Situation Overview
SUBJECT TO EXPRESS NON-DISCLOSURE AGREEMENT 0 SUBJECT TO FRE 408 & EQUIVALENTS 74 151 #004A97 Executive Summary 98 Mercer is in the process of evaluating transaction alternatives in light of macroeconomic headwinds and the Company’s recent and projected 168 financial performance 220 #62A8DC Macroeconomic & Industry Outlook 1 · Following cycle lows in 2025, the 2026 macroeconomic environment for both pulp and wood products remains challenged by sluggish global growth 95 · Northern Bleached Softwood Kraft (“NBSK”) markets remain challenging with some stabilization occurring in North America and Europe, but weak demand for 0 #015F00 market pulp in China · While the broader NBSK market manages through this period with both capacity closures and outages, producers continue to face a perfect storm of increased 0 wood and energy costs with sluggish demand growth in global markets 37 61 – Sawmills in Canada and Europe are contending with tariff impacts while European sawmills are also experiencing higher log costs as Russian sanctions, #00253D driven by its invasion of Ukraine, limited wood supply across the region. Sawmill closures and curtailments have had a knock-on effect in driving up woodchip prices globally for pulp mills. In addition, high energy prices in Germany have also impacted the price of wood chips, as they are a raw material 145 for the growing biofuel (wood pellets) industry 26 57 – More recently, the ongoing conflict in the Middle East has impacted global energy and transportation costs #911A39 · Foreign currency volatility is also impacting Mercer’s earnings and cash flows as the Company incurs most of its costs in either Euros or Canadian dollars and sells 255 most of its products in U.S. dollars 192 - A strengthening U.S. dollar relative to the Euro and Canadian dollar benefits the Company as the costs incurred in those currencies are reduced 0 #FFC000 - Based on 2025 operating costs, a $0.01 change in the USD/Euro exchange rate results in an ~$11 million change in operating costs and a $0.01 change in the USD/CAD exchange rate yields a ~$9 million change in operating costs 119 119 Incremental Liquidity Need & Near-Term Maturities 119 · Due to recent financial performance as well as the Company’s projected liquidity forecast, Mercer will need a holistic liquidity solution to fund operations and #777777 address its upcoming maturities under the Canadian ABL (January 2027) and German RCF (September 2027) 192 (1) · The Company is forecasting a peak liquidity need of ~$428 million , of which ~$414 million is used to repay the existing credit facilities, ~$54 million is used to 192 fund the Company’s projected operating cash flow need and ~$40 million is used to fund illustrative transaction fees, partially offset by ~$80 million of projected 192 cash on hand #C0C0C0 - The peak liquidity need is based on the unlevered free cash flow under the Company’s financial forecast and assumes a full take-out of the existing Canadian ABL and German RCF on December 31, 2026 - The peak liquidity does not include (i) any further interest payments to existing Senior Notes and (ii) any interest associated with any new financing to fund the peak liquidity need Note: Reflects preliminary results for Q3 2026 which are subject to change (1) Does not reflect impact of unscheduled downtime and unforeseen additional costs at Rosenthal in Q4 2026, currently estimated at $15 million and subject to confirmation 5
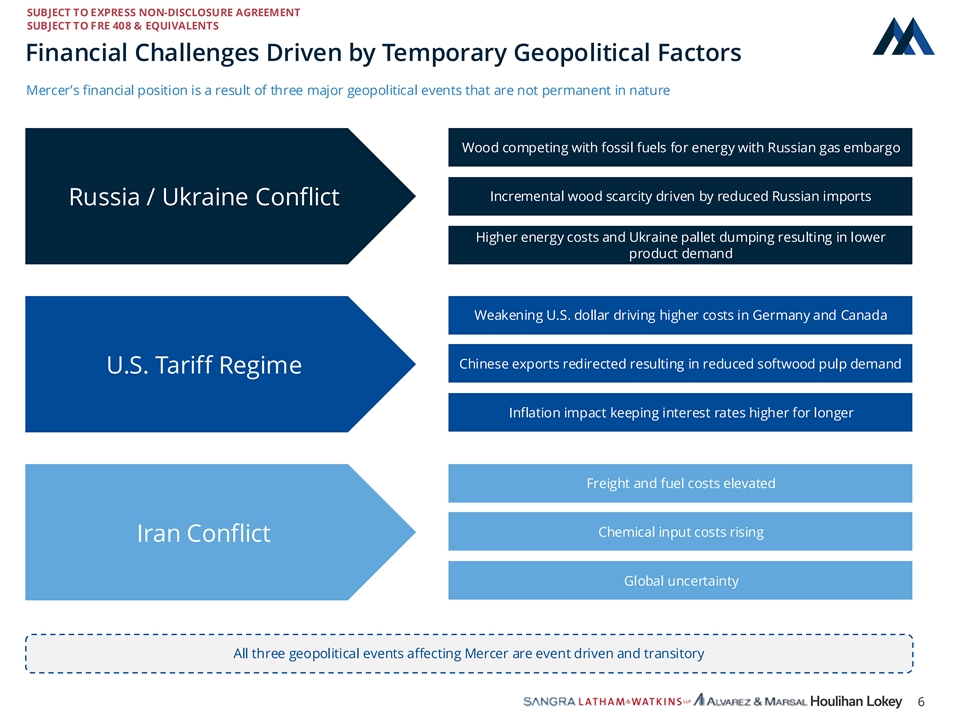
SUBJECT TO EXPRESS NON-DISCLOSURE AGREEMENT 0 SUBJECT TO FRE 408 & EQUIVALENTS 74 151 #004A97 Financial Challenges Driven by Temporary Geopolitical Factors 98 Mercer’s financial position is a result of three major geopolitical events that are not permanent in nature 168 220 #62A8DC Wood competing with fossil fuels for energy with Russian gas embargo 1 95 0 Incremental wood scarcity driven by reduced Russian imports Russia / Ukraine Conflict #015F00 0 Higher energy costs and Ukraine pallet dumping resulting in lower 37 product demand 61 #00253D 145 Weakening U.S. dollar driving higher costs in Germany and Canada 26 57 #911A39 Chinese exports redirected resulting in reduced softwood pulp demand U.S. Tariff Regime 255 192 Inflation impact keeping interest rates higher for longer 0 #FFC000 119 119 Freight and fuel costs elevated 119 #777777 Chemical input costs rising 192 Iran Conflict 192 192 #C0C0C0 Global uncertainty All three geopolitical events affecting Mercer are event driven and transitory 6
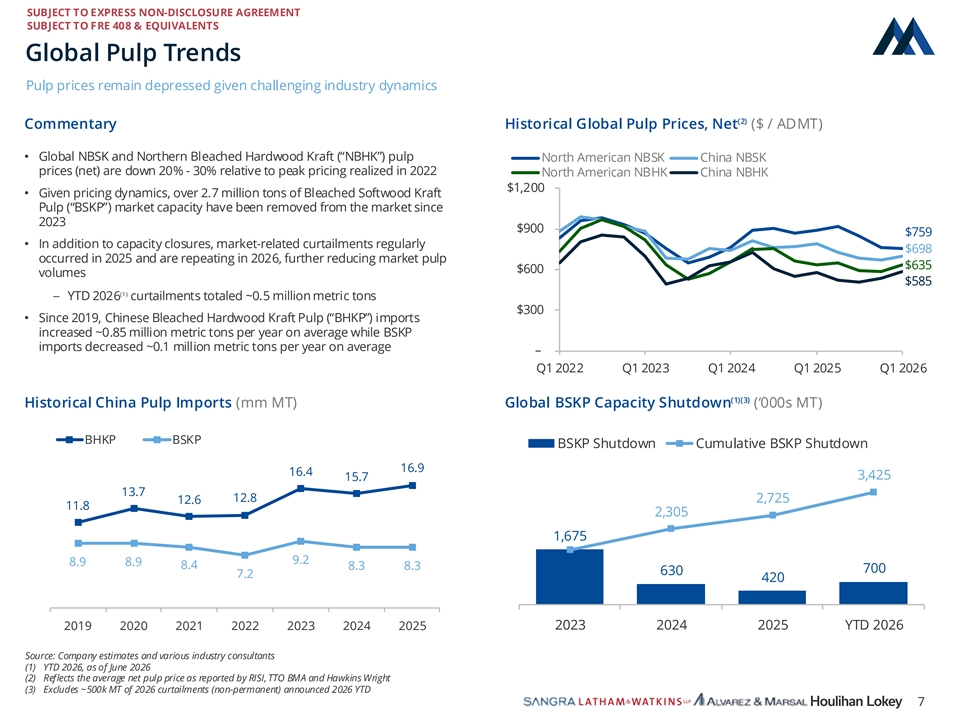
SUBJECT TO EXPRESS NON-DISCLOSURE AGREEMENT 0 SUBJECT TO FRE 408 & EQUIVALENTS 74 151 #004A97 Global Pulp Trends 98 Pulp prices remain depressed given challenging industry dynamics 168 220 (2) Commentary Historical Global Pulp Prices, Net ($ / ADMT) #62A8DC • Global NBSK and Northern Bleached Hardwood Kraft (“NBHK”) pulp North American NBSK China NBSK 1 prices (net) are down 20% - 30% relative to peak pricing realized in 2022 North American NBHK China NBHK 95 $1,200 0 • Given pricing dynamics, over 2.7 million tons of Bleached Softwood Kraft #015F00 Pulp (“BSKP”) market capacity have been removed from the market since 2023 $900 $759 0 • In addition to capacity closures, market-related curtailments regularly $698 37 occurred in 2025 and are repeating in 2026, further reducing market pulp 61 $635 $600 volumes #00253D $585 (1) – YTD 2026 curtailments totaled ~0.5 million metric tons 145 $300 • Since 2019, Chinese Bleached Hardwood Kraft Pulp (“BHKP”) imports 26 increased ~0.85 million metric tons per year on average while BSKP 57 imports decreased ~0.1 million metric tons per year on average – #911A39 Q1 2022 Q1 2023 Q1 2024 Q1 2025 Q1 2026 255 (1)(3) 192 Historical China Pulp Imports (mm MT) Global BSKP Capacity Shutdown (‘000s MT) 0 #FFC000 BSKP Shutdown Cumulative BSKP Shutdown 119 119 3,425 119 2,725 #777777 2,305 192 1,675 192 192 700 630 #C0C0C0 420 2023 2024 2025 YTD 2026 Source: Company estimates and various industry consultants (1) YTD 2026, as of June 2026 (2) Reflects the average net pulp price as reported by RISI, TTO BMA and Hawkins Wright (3) Excludes ~500k MT of 2026 curtailments (non-permanent) announced 2026 YTD 7
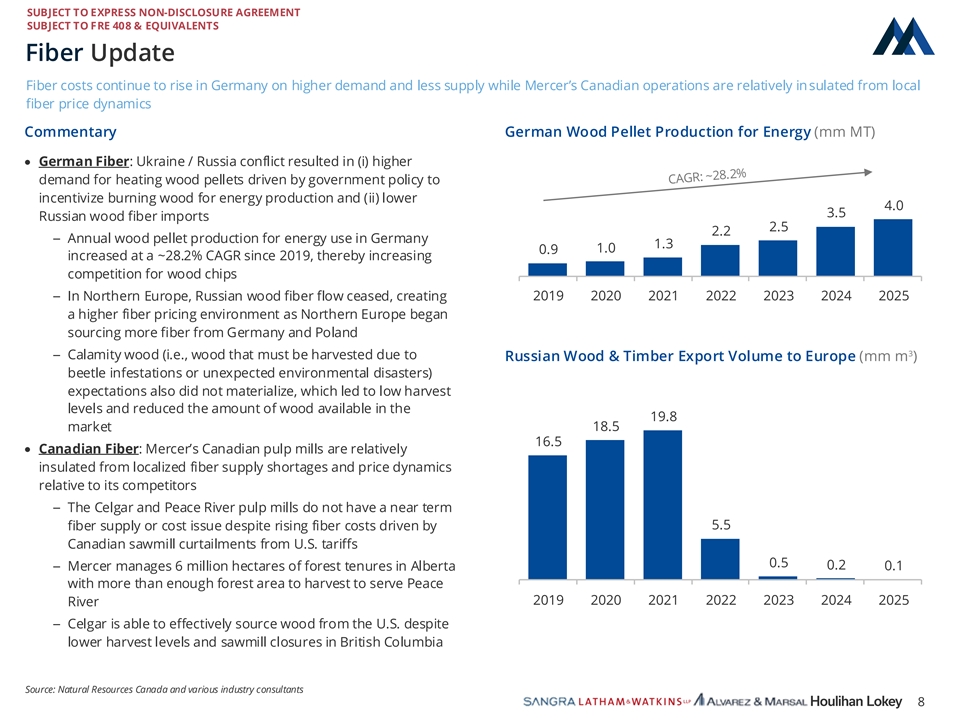
SUBJECT TO EXPRESS NON-DISCLOSURE AGREEMENT 0 SUBJECT TO FRE 408 & EQUIVALENTS 74 151 #004A97 Fiber Update 98 Fiber costs continue to rise in Germany on higher demand and less supply while Mercer’s Canadian operations are relatively insulated from local 168 fiber price dynamics 220 #62A8DC Commentary German Wood Pellet Production for Energy (mm MT) 1 · German Fiber: Ukraine / Russia conflict resulted in (i) higher 95 demand for heating wood pellets driven by government policy to 0 incentivize burning wood for energy production and (ii) lower #015F00 4.0 3.5 Russian wood fiber imports 2.5 2.2 0 – Annual wood pellet production for energy use in Germany 1.3 1.0 37 0.9 increased at a ~28.2% CAGR since 2019, thereby increasing 61 competition for wood chips #00253D 2019 2020 2021 2022 2023 2024 2025 – In Northern Europe, Russian wood fiber flow ceased, creating 145 a higher fiber pricing environment as Northern Europe began 26 sourcing more fiber from Germany and Poland 57 3 #911A39 – Calamity wood (i.e., wood that must be harvested due to Russian Wood & Timber Export Volume to Europe (mm m ) beetle infestations or unexpected environmental disasters) 255 expectations also did not materialize, which led to low harvest 192 levels and reduced the amount of wood available in the 0 19.8 18.5 market #FFC000 16.5 · Canadian Fiber: Mercer’s Canadian pulp mills are relatively 119 insulated from localized fiber supply shortages and price dynamics 119 relative to its competitors 119 #777777 – The Celgar and Peace River pulp mills do not have a near term 5.5 fiber supply or cost issue despite rising fiber costs driven by 192 Canadian sawmill curtailments from U.S. tariffs 192 192 0.5 0.2 – Mercer manages 6 million hectares of forest tenures in Alberta 0.1 #C0C0C0 with more than enough forest area to harvest to serve Peace 2019 2020 2021 2022 2023 2024 2025 River – Celgar is able to effectively source wood from the U.S. despite lower harvest levels and sawmill closures in British Columbia Source: Natural Resources Canada and various industry consultants 8
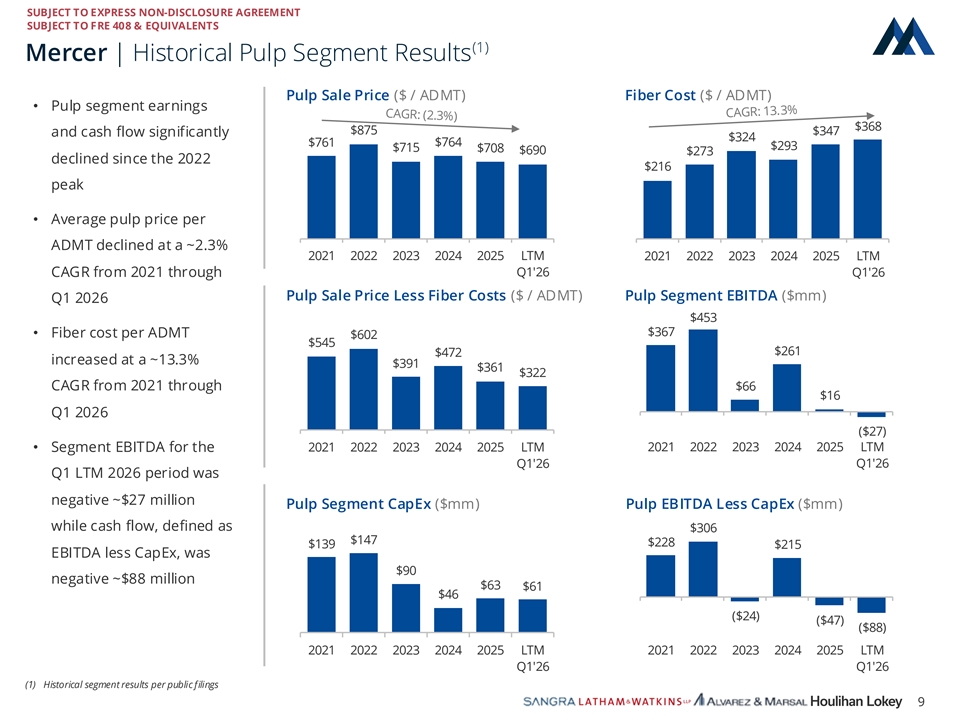
SUBJECT TO EXPRESS NON-DISCLOSURE AGREEMENT 0 SUBJECT TO FRE 408 & EQUIVALENTS 74 151 (1) #004A97 Mercer | Historical Pulp Segment Results 98 Pulp Sale Price ($ / ADMT) Fiber Cost ($ / ADMT) 168 • Pulp segment earnings 220 $368 #62A8DC $875 $347 and cash flow significantly $324 $761 $764 $293 $715 $708 $690 $273 declined since the 2022 1 $216 95 peak 0 #015F00 • Average pulp price per 0 ADMT declined at a ~2.3% 37 2021 2022 2023 2024 2025 LTM 2021 2022 2023 2024 2025 LTM 61 CAGR from 2021 through Q1'26 Q1'26 #00253D Pulp Sale Price Less Fiber Costs ($ / ADMT) Pulp Segment EBITDA ($mm) Q1 2026 145 $453 26 $367 • Fiber cost per ADMT $602 57 $545 $261 $472 #911A39 increased at a ~13.3% $391 $361 $322 255 CAGR from 2021 through $66 $16 192 Q1 2026 0 #FFC000 ($27) • Segment EBITDA for the 2021 2022 2023 2024 2025 LTM 2021 2022 2023 2024 2025 LTM 119 Q1'26 Q1'26 119 Q1 LTM 2026 period was 119 negative ~$27 million #777777 Pulp Segment CapEx ($mm) Pulp EBITDA Less CapEx ($mm) while cash flow, defined as $306 192 $147 $228 $139 $215 192 EBITDA less CapEx, was 192 $90 #C0C0C0 negative ~$88 million $63 $61 $46 ($24) ($47) ($88) 2021 2022 2023 2024 2025 LTM 2021 2022 2023 2024 2025 LTM Q1'26 Q1'26 (1) Historical segment results per public filings 9
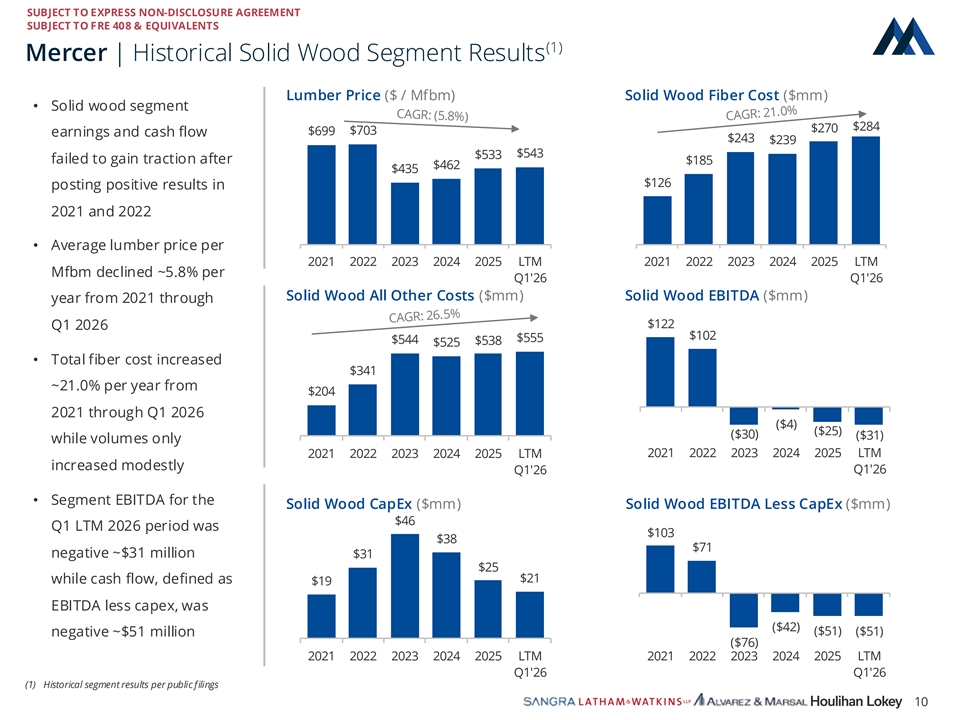
SUBJECT TO EXPRESS NON-DISCLOSURE AGREEMENT 0 SUBJECT TO FRE 408 & EQUIVALENTS 74 151 (1) #004A97 Mercer | Historical Solid Wood Segment Results 98 Lumber Price ($ / Mfbm) Solid Wood Fiber Cost ($mm) 168 • Solid wood segment 220 $284 $270 #62A8DC $703 $699 earnings and cash flow $243 $239 $543 $533 failed to gain traction after 1 $185 $462 $435 95 $126 posting positive results in 0 #015F00 2021 and 2022 0 • Average lumber price per 37 2021 2022 2023 2024 2025 LTM 2021 2022 2023 2024 2025 LTM 61 Mfbm declined ~5.8% per Q1'26 Q1'26 #00253D Solid Wood All Other Costs ($mm) Solid Wood EBITDA ($mm) year from 2021 through 145 $122 26 Q1 2026 $102 $555 57 $544 $538 $525 #911A39 • Total fiber cost increased $341 255 ~21.0% per year from $204 192 2021 through Q1 2026 0 ($4) #FFC000 ($25) ($30) ($31) while volumes only 2021 2022 2023 2024 2025 LTM 2021 2022 2023 2024 2025 LTM 119 increased modestly Q1'26 Q1'26 119 119 • Segment EBITDA for the #777777 Solid Wood CapEx ($mm) Solid Wood EBITDA Less CapEx ($mm) $46 Q1 LTM 2026 period was $103 192 $38 $71 192 negative ~$31 million $31 192 $25 #C0C0C0 $21 while cash flow, defined as $19 EBITDA less capex, was ($42) ($51) ($51) negative ~$51 million ($76) 2021 2022 2023 2024 2025 LTM 2021 2022 2023 2024 2025 LTM Q1'26 Q1'26 (1) Historical segment results per public filings 10
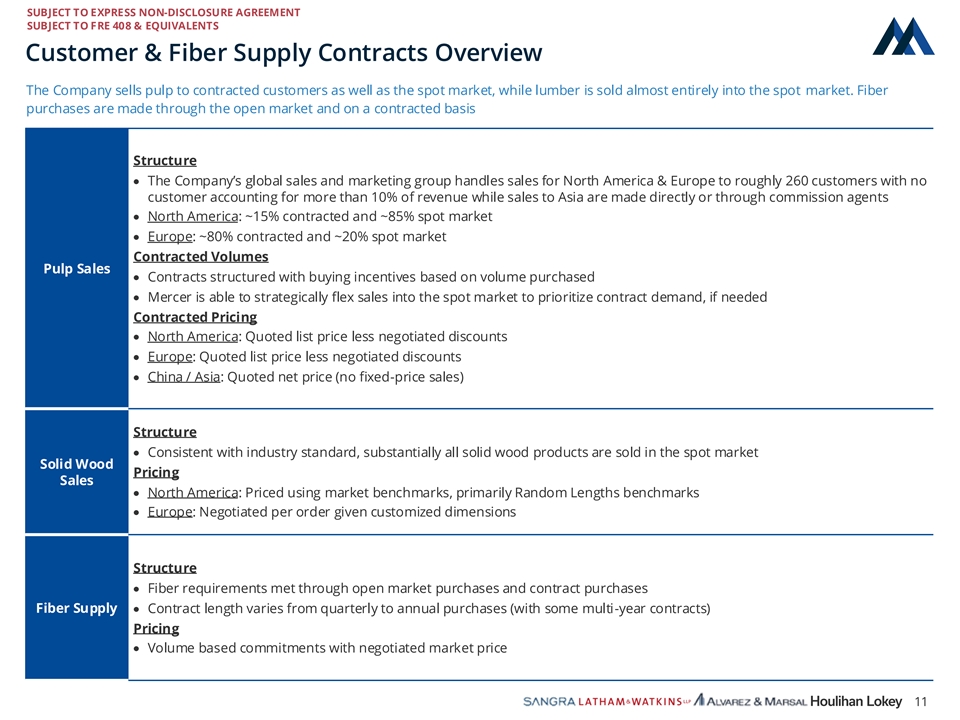
SUBJECT TO EXPRESS NON-DISCLOSURE AGREEMENT 0 SUBJECT TO FRE 408 & EQUIVALENTS 74 151 #004A97 Customer & Fiber Supply Contracts Overview 98 The Company sells pulp to contracted customers as well as the spot market, while lumber is sold almost entirely into the spot market. Fiber 168 purchases are made through the open market and on a contracted basis 220 #62A8DC 1 Structure 95 · The Company’s global sales and marketing group handles sales for North America & Europe to roughly 260 customers with no 0 customer accounting for more than 10% of revenue while sales to Asia are made directly or through commission agents #015F00 · North America: ~15% contracted and ~85% spot market 0 · Europe: ~80% contracted and ~20% spot market 37 Contracted Volumes 61 Pulp Sales · Contracts structured with buying incentives based on volume purchased #00253D · Mercer is able to strategically flex sales into the spot market to prioritize contract demand, if needed 145 Contracted Pricing 26 · North America: Quoted list price less negotiated discounts 57 #911A39 · Europe: Quoted list price less negotiated discounts · China / Asia: Quoted net price (no fixed-price sales) 255 192 0 #FFC000 Structure · Consistent with industry standard, substantially all solid wood products are sold in the spot market 119 Solid Wood Pricing 119 Sales 119 · North America: Priced using market benchmarks, primarily Random Lengths benchmarks #777777 · Europe: Negotiated per order given customized dimensions 192 192 192 Structure #C0C0C0 · Fiber requirements met through open market purchases and contract purchases Fiber Supply · Contract length varies from quarterly to annual purchases (with some multi-year contracts) Pricing · Volume based commitments with negotiated market price 11
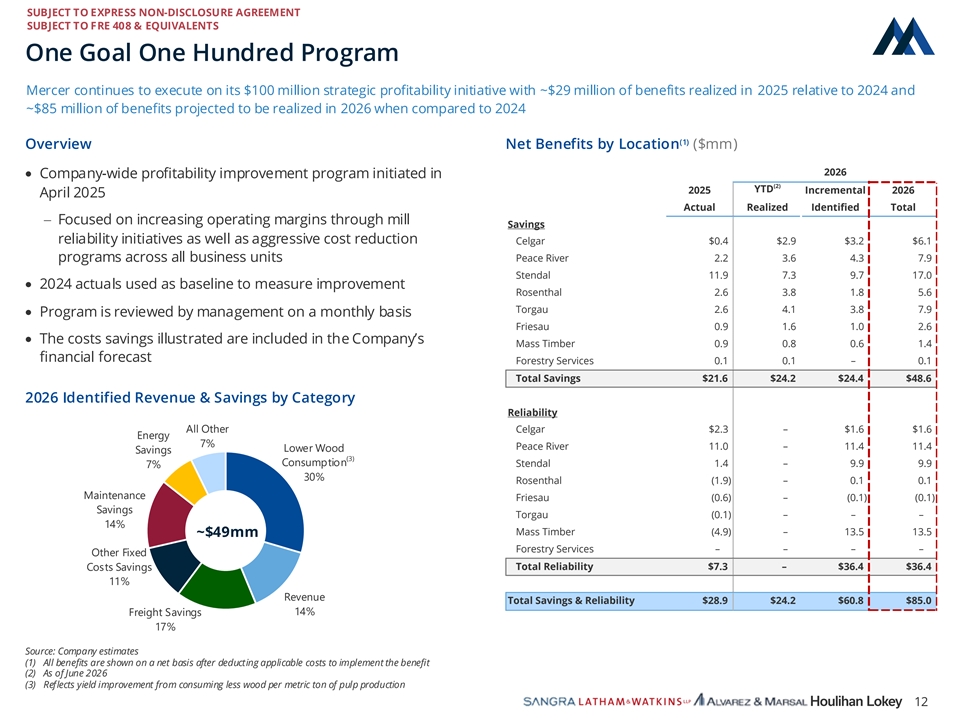
SUBJECT TO EXPRESS NON-DISCLOSURE AGREEMENT 0 SUBJECT TO FRE 408 & EQUIVALENTS 74 151 #004A97 One Goal One Hundred Program 98 Mercer continues to execute on its $100 million strategic profitability initiative with ~$29 million of benefits realized in 2025 relative to 2024 and 168 ~$85 million of benefits projected to be realized in 2026 when compared to 2024 220 #62A8DC (1) Overview Net Benefits by Location ($mm) 1 2026 · Company-wide profitability improvement program initiated in 95 (2) YTD 2025 Incremental 2026 0 April 2025 #015F00 Actual Realized Identified Total - Focused on increasing operating margins through mill Savings 0 reliability initiatives as well as aggressive cost reduction Celgar $0.4 $2.9 $3.2 $6.1 37 Peace River 2.2 3.6 4.3 7.9 programs across all business units 61 Stendal 11.9 7.3 9.7 17.0 #00253D · 2024 actuals used as baseline to measure improvement Rosenthal 2.6 3.8 1.8 5.6 Torgau 2.6 4.1 3.8 7.9 145 · Program is reviewed by management on a monthly basis 26 Friesau 0.9 1.6 1.0 2.6 57 · The costs savings illustrated are included in the Company’s Mass Timber 0.9 0.8 0.6 1.4 #911A39 financial forecast Forestry Services 0.1 0.1 – 0.1 Total Savings $21.6 $24.2 $24.4 $48.6 255 2026 Identified Revenue & Savings by Category 192 Reliability 0 #FFC000 Celgar $2.3 – $1.6 $1.6 Peace River 11.0 – 11.4 11.4 (3) 119 Stendal 1.4 – 9.9 9.9 119 Rosenthal (1.9) – 0.1 0.1 119 Friesau (0.6) – (0.1) (0.1) #777777 Torgau (0.1) – – – Mass Timber (4.9) – 13.5 13.5 ~$49mm 192 Forestry Services – – – – 192 192 Total Reliability $7.3 – $36.4 $36.4 #C0C0C0 Total Savings & Reliability $28.9 $24.2 $60.8 $85.0 Source: Company estimates (1) All benefits are shown on a net basis after deducting applicable costs to implement the benefit (2) As of June 2026 (3) Reflects yield improvement from consuming less wood per metric ton of pulp production 12
02 Liquidity Overview
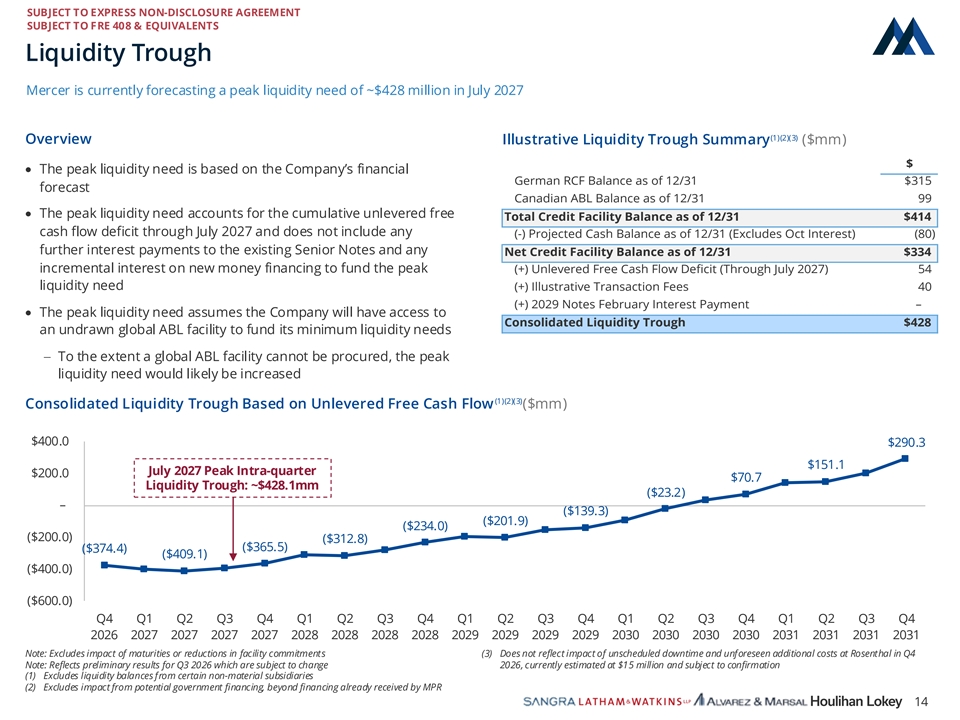
SUBJECT TO EXPRESS NON-DISCLOSURE AGREEMENT 0 SUBJECT TO FRE 408 & EQUIVALENTS 74 151 #004A97 Liquidity Trough 98 Mercer is currently forecasting a peak liquidity need of ~$428 million in July 2027 168 220 #62A8DC (1)(2)(3) Overview Illustrative Liquidity Trough Summary ($mm) 1 $ · The peak liquidity need is based on the Company’s financial 95 German RCF Balance as of 12/31 $315 forecast 0 Canadian ABL Balance as of 12/31 99 #015F00 · The peak liquidity need accounts for the cumulative unlevered free Total Credit Facility Balance as of 12/31 $414 cash flow deficit through July 2027 and does not include any (-) Projected Cash Balance as of 12/31 (Excludes Oct Interest) (80) 0 37 further interest payments to the existing Senior Notes and any Net Credit Facility Balance as of 12/31 $334 61 incremental interest on new money financing to fund the peak (+) Unlevered Free Cash Flow Deficit (Through July 2027) 54 #00253D liquidity need (+) Illustrative Transaction Fees 40 (+) 2029 Notes February Interest Payment – 145 · The peak liquidity need assumes the Company will have access to Consolidated Liquidity Trough $428 26 an undrawn global ABL facility to fund its minimum liquidity needs 57 #911A39 - To the extent a global ABL facility cannot be procured, the peak liquidity need would likely be increased 255 192 (1)(2)(3) Consolidated Liquidity Trough Based on Unlevered Free Cash Flow ($mm) 0 #FFC000 $400.0 $290.3 119 $151.1 July 2027 Peak Intra-quarter $200.0 119 $70.7 Liquidity Trough: ~$428.1mm 119 ($23.2) #777777 – ($139.3) ($201.9) ($234.0) 192 ($200.0) ($312.8) ($365.5) 192 ($374.4) ($409.1) 192 ($400.0) #C0C0C0 ($600.0) Q4 Q1 Q2 Q3 Q4 Q1 Q2 Q3 Q4 Q1 Q2 Q3 Q4 Q1 Q2 Q3 Q4 Q1 Q2 Q3 Q4 2026 2027 2027 2027 2027 2028 2028 2028 2028 2029 2029 2029 2029 2030 2030 2030 2030 2031 2031 2031 2031 Note: Excludes impact of maturities or reductions in facility commitments (3) Does not reflect impact of unscheduled downtime and unforeseen additional costs at Rosenthal in Q4 Note: Reflects preliminary results for Q3 2026 which are subject to change 2026, currently estimated at $15 million and subject to confirmation (1) Excludes liquidity balances from certain non-material subsidiaries (2) Excludes impact from potential government financing, beyond financing already received by MPR 14

03 Financial Forecast
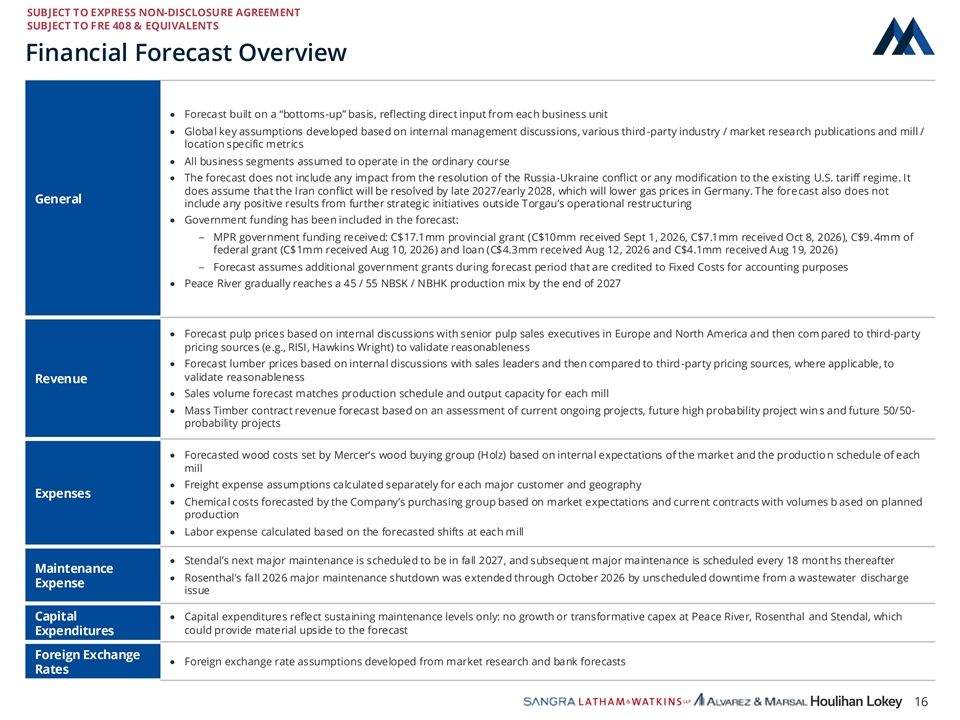
SUBJECT TO EXPRESS NON-DISCLOSURE AGREEMENT 0 SUBJECT TO FRE 408 & EQUIVALENTS 74 151 #004A97 Financial Forecast Overview 98 168 · Forecast built on a “bottoms-up” basis, reflecting direct input from each business unit 220 #62A8DC · Global key assumptions developed based on internal management discussions, various third -party industry / market research publications and mill / location specific metrics 1 · All business segments assumed to operate in the ordinary course 95 · The forecast does not include any impact from the resolution of the Russia-Ukraine conflict or any modification to the existing U.S. tariff regime. It 0 does assume that the Iran conflict will be resolved by late 2027/early 2028, which will lower gas prices in Germany. The forecast also does not General include any positive results from further strategic initiatives outside Torgau’s operational restructuring #015F00 · Government funding has been included in the forecast: 0 – MPR government funding received: C$17.1mm provincial grant (C$10mm received Sept 1, 2026, C$7.1mm received Oct 8, 2026), C$9.4mm of federal grant (C$1mm received Aug 10, 2026) and loan (C$4.3mm received Aug 12, 2026 and C$4.1mm received Aug 19, 2026) 37 61 – Forecast assumes additional government grants during forecast period that are credited to Fixed Costs for accounting purposes #00253D · Peace River gradually reaches a 45 / 55 NBSK / NBHK production mix by the end of 2027 145 26 · Forecast pulp prices based on internal discussions with senior pulp sales executives in Europe and North America and then com pared to third-party 57 pricing sources (e.g., RISI, Hawkins Wright) to validate reasonableness #911A39 · Forecast lumber prices based on internal discussions with sales leaders and then compared to third-party pricing sources, where applicable, to validate reasonableness Revenue 255 · Sales volume forecast matches production schedule and output capacity for each mill 192 · Mass Timber contract revenue forecast based on an assessment of current ongoing projects, future high probability project win s and future 50/50- 0 probability projects #FFC000 · Forecasted wood costs set by Mercer’s wood buying group (Holz) based on internal expectations of the market and the productio n schedule of each 119 mill 119 · Freight expense assumptions calculated separately for each major customer and geography 119 Expenses · Chemical costs forecasted by the Company’s purchasing group based on market expectations and current contracts with volumes b ased on planned #777777 production · Labor expense calculated based on the forecasted shifts at each mill 192 192 · Stendal’s next major maintenance is scheduled to be in fall 2027, and subsequent major maintenance is scheduled every 18 months thereafter 192 Maintenance · Rosenthal's fall 2026 major maintenance shutdown was extended through October 2026 by unscheduled downtime from a wastewater discharge #C0C0C0 Expense issue · Capital expenditures reflect sustaining maintenance levels only: no growth or transformative capex at Peace River, Rosenthal and Stendal, which Capital Expenditures could provide material upside to the forecast Foreign Exchange · Foreign exchange rate assumptions developed from market research and bank forecasts Rates 16
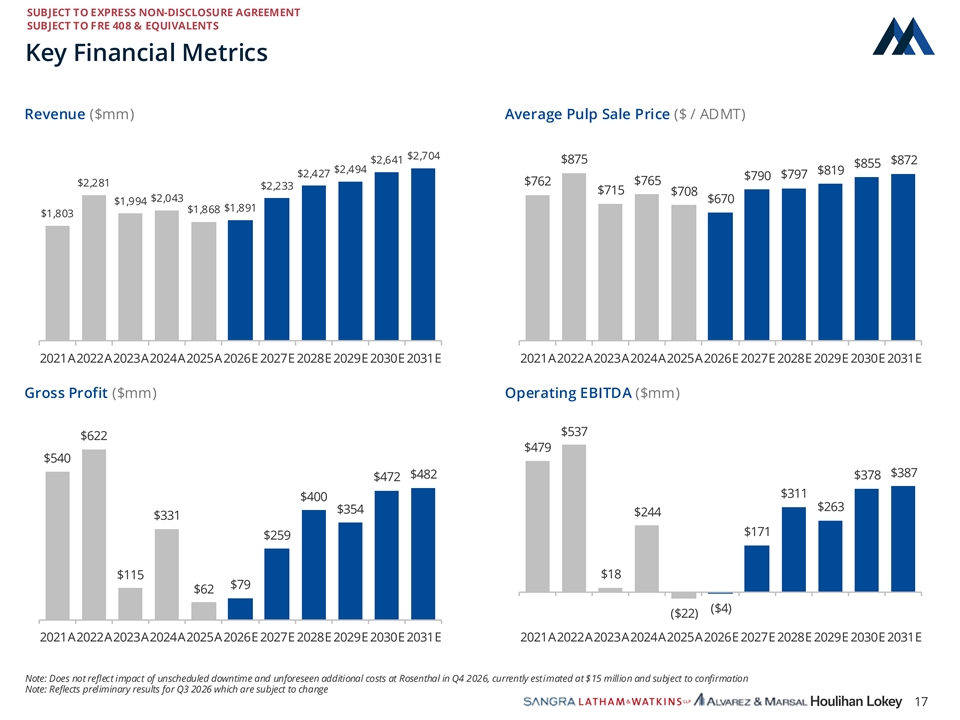
SUBJECT TO EXPRESS NON-DISCLOSURE AGREEMENT 0 SUBJECT TO FRE 408 & EQUIVALENTS 74 151 #004A97 Key Financial Metrics 98 168 220 Revenue ($mm) Average Pulp Sale Price ($ / ADMT) #62A8DC $2,704 $2,641 $875 $872 1 $855 $2,494 $819 $2,427 $797 95 $790 $762 $765 $2,281 $2,233 0 $715 $708 $2,043 $670 $1,994 #015F00 $1,891 $1,868 $1,803 0 37 61 #00253D 145 26 57 #911A39 2021A2022A2023A2024A2025A2026E 2027E 2028E 2029E 2030E 2031E 2021A2022A2023A2024A2025A2026E 2027E 2028E 2029E 2030E 2031E 255 Gross Profit ($mm) Operating EBITDA ($mm) 192 0 #FFC000 $537 $622 $479 $540 119 $387 119 $482 $378 $472 119 $311 $400 #777777 $263 $354 $244 $331 $171 192 $259 192 192 $18 $115 #C0C0C0 $79 $62 ($4) ($22) 2021A2022A2023A2024A2025A2026E 2027E 2028E 2029E 2030E 2031E 2021A2022A2023A2024A2025A2026E 2027E 2028E 2029E 2030E 2031E Note: Does not reflect impact of unscheduled downtime and unforeseen additional costs at Rosenthal in Q4 2026, currently estimated at $15 million and subject to confirmation Note: Reflects preliminary results for Q3 2026 which are subject to change 17
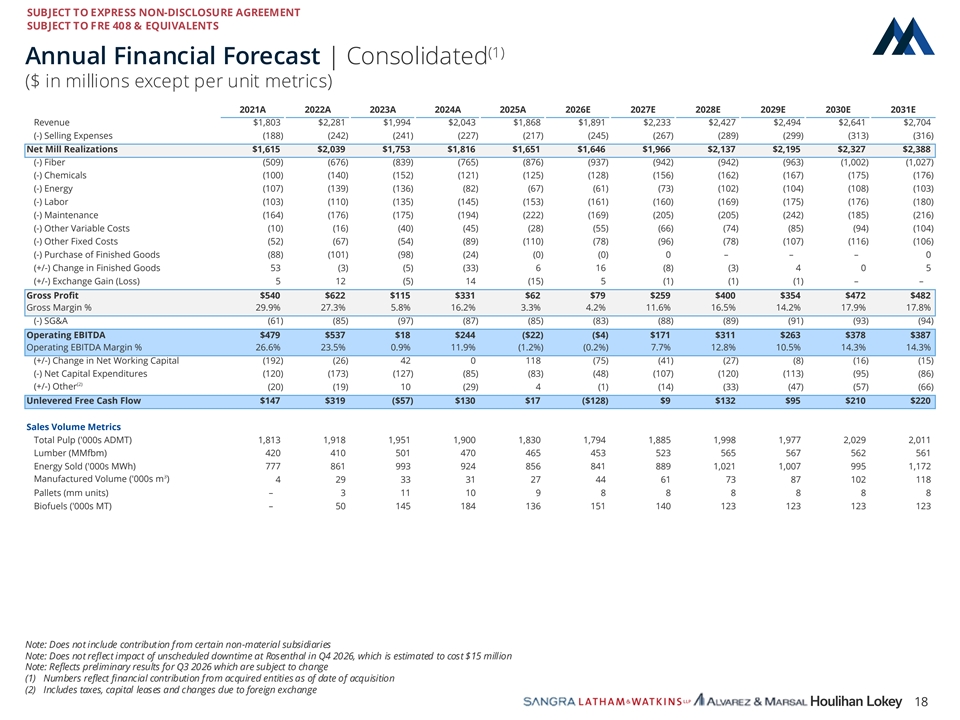
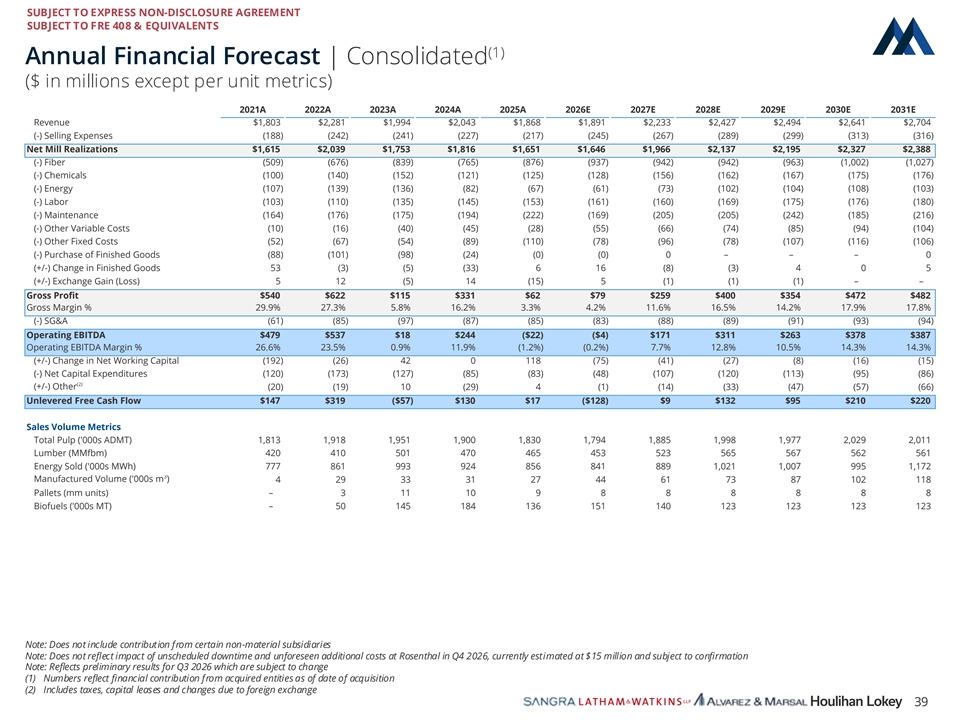
SUBJECT TO EXPRESS NON-DISCLOSURE AGREEMENT 0 SUBJECT TO FRE 408 & EQUIVALENTS 74 151 (1) #004A97 Annual Financial Forecast | Consolidated ($ in millions except per unit metrics) 98 168 2021A 2022A 2023A 2024A 2025A 2026E 2027E 2028E 2029E 2030E 2031E 220 Revenue $1,803 $2,281 $1,994 $2,043 $1,868 $1,891 $2,233 $2,427 $2,494 $2,641 $2,704 #62A8DC (-) Selling Expenses (188) (242) (241) (227) (217) (245) (267) (289) (299) (313) (316) Net Mill Realizations $1,615 $2,039 $1,753 $1,816 $1,651 $1,646 $1,966 $2,137 $2,195 $2,327 $2,388 1 (-) Fiber (509) (676) (839) (765) (876) (937) (942) (942) (963) (1,002) (1,027) (-) Chemicals (100) (140) (152) (121) (125) (128) (156) (162) (167) (175) (176) 95 (-) Energy (107) (139) (136) (82) (67) (61) (73) (102) (104) (108) (103) 0 (-) Labor (103) (110) (135) (145) (153) (161) (160) (169) (175) (176) (180) #015F00 (-) Maintenance (164) (176) (175) (194) (222) (169) (205) (205) (242) (185) (216) (-) Other Variable Costs (10) (16) (40) (45) (28) (55) (66) (74) (85) (94) (104) 0 (-) Other Fixed Costs (52) (67) (54) (89) (110) (78) (96) (78) (107) (116) (106) 37 (-) Purchase of Finished Goods (88) (101) (98) (24) (0) (0) 0 – – – 0 61 (+/-) Change in Finished Goods 53 (3) (5) (33) 6 16 (8) (3) 4 0 5 #00253D (+/-) Exchange Gain (Loss) 5 12 (5) 14 (15) 5 (1) (1) (1) – – Gross Profit $540 $622 $115 $331 $62 $79 $259 $400 $354 $472 $482 Gross Margin % 29.9% 27.3% 5.8% 16.2% 3.3% 4.2% 11.6% 16.5% 14.2% 17.9% 17.8% 145 (-) SG&A (61) (85) (97) (87) (85) (83) (88) (89) (91) (93) (94) 26 Operating EBITDA $479 $537 $18 $244 ($22) ($4) $171 $311 $263 $378 $387 57 Operating EBITDA Margin % 26.6% 23.5% 0.9% 11.9% (1.2%) (0.2%) 7.7% 12.8% 10.5% 14.3% 14.3% #911A39 (+/-) Change in Net Working Capital (192) (26) 42 0 118 (75) (41) (27) (8) (16) (15) (-) Net Capital Expenditures (120) (173) (127) (85) (83) (48) (107) (120) (113) (95) (86) (2) 255 (+/-) Other (20) (19) 10 (29) 4 (1) (14) (33) (47) (57) (66) 192 Unlevered Free Cash Flow $147 $319 ($57) $130 $17 ($128) $9 $132 $95 $210 $220 0 Sales Volume Metrics #FFC000 Total Pulp ('000s ADMT) 1,813 1,918 1,951 1,900 1,830 1,794 1,885 1,998 1,977 2,029 2,011 Lumber (MMfbm) 420 410 501 470 465 453 523 565 567 562 561 119 Energy Sold ('000s MWh) 777 861 993 924 856 841 889 1,021 1,007 995 1,172 119 3 Manufactured Volume ('000s m ) 4 29 33 31 27 44 61 73 87 102 118 119 Pallets (mm units) – 3 11 10 9 8 8 8 8 8 8 #777777 Biofuels ('000s MT) – 50 145 184 136 151 140 123 123 123 123 192 192 192 #C0C0C0 Note: Does not include contribution from certain non-material subsidiaries Note: Does not reflect impact of unscheduled downtime at Rosenthal in Q4 2026, which is estimated to cost $15 million Note: Reflects preliminary results for Q3 2026 which are subject to change (1) Numbers reflect financial contribution from acquired entities as of date of acquisition (2) Includes taxes, capital leases and changes due to foreign exchange 18
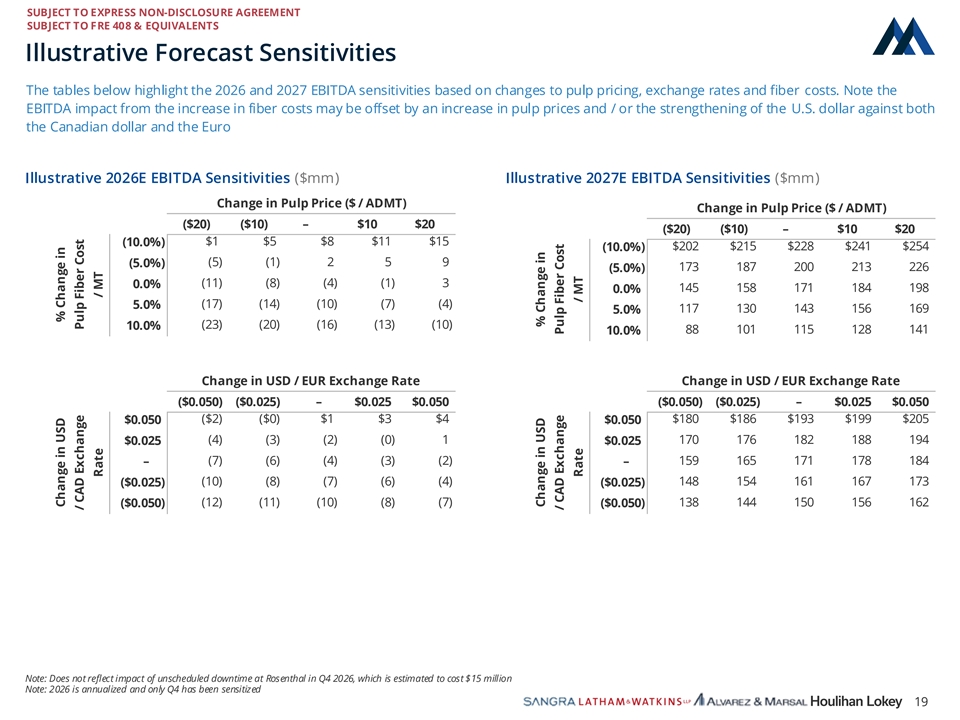
SUBJECT TO EXPRESS NON-DISCLOSURE AGREEMENT 0 SUBJECT TO FRE 408 & EQUIVALENTS 74 151 #004A97 Illustrative Forecast Sensitivities 98 The tables below highlight the 2026 and 2027 EBITDA sensitivities based on changes to pulp pricing, exchange rates and fiber costs. Note the 168 EBITDA impact from the increase in fiber costs may be offset by an increase in pulp prices and / or the strengthening of the U.S. dollar against both 220 the Canadian dollar and the Euro #62A8DC 1 95 Illustrative 2026E EBITDA Sensitivities ($mm) Illustrative 2027E EBITDA Sensitivities ($mm) 0 Change in Pulp Price ($ / ADMT) Change in Pulp Price ($ / ADMT) #015F00 Change in Pulp Price ($ / ADMT) ($20) ($10) – $10 $20 ($20) ($10) – $10 $20 0 $1 $5 $8 $11 $15 (10.0%) $202 $215 $228 $241 $254 (10.0%) 37 (5) (1) 2 5 9 (5.0%) 61 (5.0%) 173 187 200 213 226 #00253D 0.0% (11) (8) (4) (1) 3 145 158 171 184 198 0.0% (17) (14) (10) (7) (4) 5.0% 5.0% 117 130 143 156 169 145 26 (23) (20) (16) (13) (10) 10.0% 88 101 115 128 141 10.0% 57 #911A39 Change in USD / EUR Exchange Rate CC hh aa nn ge ge in in U U SD SD / / E U EU RR E x Ex ch ch aa nn ge ge R R aa te te 255 192 ($0.050) ($0.025) – $0.025 $0.050 ($0.050) ($0.025) – $0.025 $0.050 0 ($2) ($0) $1 $3 $4 $180 $186 $193 $199 $205 $0.050 $0.050 #FFC000 (4) (3) (2) (0) 1 170 176 182 188 194 $0.025 $0.025 119 – (7) (6) (4) (3) (2) – 159 165 171 178 184 119 (10) (8) (7) (6) (4) 148 154 161 167 173 ($0.025) ($0.025) 119 (12) (11) (10) (8) (7) 138 144 150 156 162 #777777 ($0.050) ($0.050) 192 192 192 #C0C0C0 Note: Does not reflect impact of unscheduled downtime at Rosenthal in Q4 2026, which is estimated to cost $15 million Note: 2026 is annualized and only Q4 has been sensitized 19 Change in USD % Change in / CAD Exchange Pulp Fiber Cost Rate / MT Change in USD % Change in / CAD Exchange Pulp Fiber Cost Rate / MT
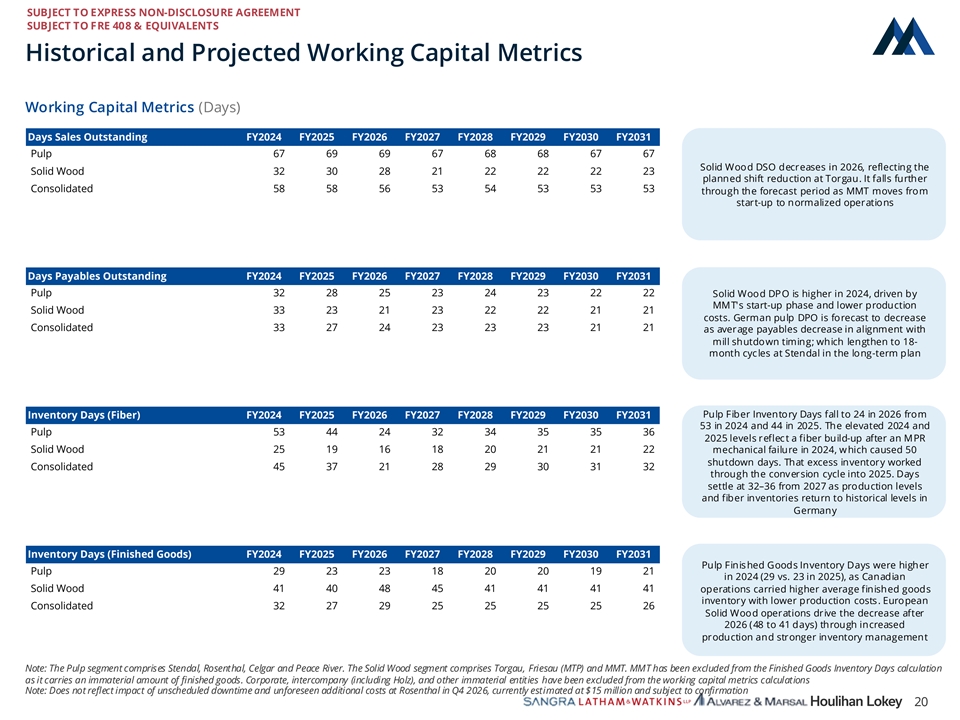
SUBJECT TO EXPRESS NON-DISCLOSURE AGREEMENT 0 SUBJECT TO FRE 408 & EQUIVALENTS 74 151 #004A97 Historical and Projected Working Capital Metrics 98 168 Working Capital Metrics (Days) 220 #62A8DC Days Sales Outstanding FY2024 FY2025 FY2026 FY2027 FY2028 FY2029 FY2030 FY2031 Pulp 67 69 69 67 68 68 67 67 1 Solid Wood DSO decreases in 2026, reflecting the Solid Wood 32 30 28 21 22 22 22 23 95 planned shift reduction at Torgau. It falls further Consolidated 58 58 56 53 54 53 53 53 0 through the forecast period as MMT moves from start-up to normalized operations #015F00 0 37 61 Days Payables Outstanding FY2024 FY2025 FY2026 FY2027 FY2028 FY2029 FY2030 FY2031 #00253D Pulp 32 28 25 23 24 23 22 22 Solid Wood DPO is higher in 2024, driven by MMT's start-up phase and lower production 145 Solid Wood 33 23 21 23 22 22 21 21 costs. German pulp DPO is forecast to decrease 26 Consolidated 33 27 24 23 23 23 21 21 as average payables decrease in alignment with 57 mill shutdown timing; which lengthen to 18- month cycles at Stendal in the long-term plan #911A39 255 192 Pulp Fiber Inventory Days fall to 24 in 2026 from 0 Inventory Days (Fiber) FY2024 FY2025 FY2026 FY2027 FY2028 FY2029 FY2030 FY2031 53 in 2024 and 44 in 2025. The elevated 2024 and #FFC000 Pulp 53 44 24 32 34 35 35 36 2025 levels reflect a fiber build-up after an MPR Solid Wood 25 19 16 18 20 21 21 22 mechanical failure in 2024, which caused 50 119 shutdown days. That excess inventory worked Consolidated 45 37 21 28 29 30 31 32 through the conversion cycle into 2025. Days 119 settle at 32–36 from 2027 as production levels 119 and fiber inventories return to historical levels in #777777 Germany 192 192 Inventory Days (Finished Goods) FY2024 FY2025 FY2026 FY2027 FY2028 FY2029 FY2030 FY2031 192 Pulp Finished Goods Inventory Days were higher Pulp 29 23 23 18 20 20 19 21 in 2024 (29 vs. 23 in 2025), as Canadian #C0C0C0 Solid Wood 41 40 48 45 41 41 41 41 operations carried higher average finished goods inventory with lower production costs. European Consolidated 32 27 29 25 25 25 25 26 Solid Wood operations drive the decrease after 2026 (48 to 41 days) through increased production and stronger inventory management Note: The Pulp segment comprises Stendal, Rosenthal, Celgar and Peace River. The Solid Wood segment comprises Torgau, Friesau (MTP) and MMT. MMT has been excluded from the Finished Goods Inventory Days calculation as it carries an immaterial amount of finished goods. Corporate, intercompany (including Holz), and other immaterial entities have been excluded from the working capital metrics calculations Note: Does not reflect impact of unscheduled downtime and unforeseen additional costs at Rosenthal in Q4 2026, currently estimated at $15 million and subject to confirmation 20

04 Appendix

04 Appendix Mill Detail
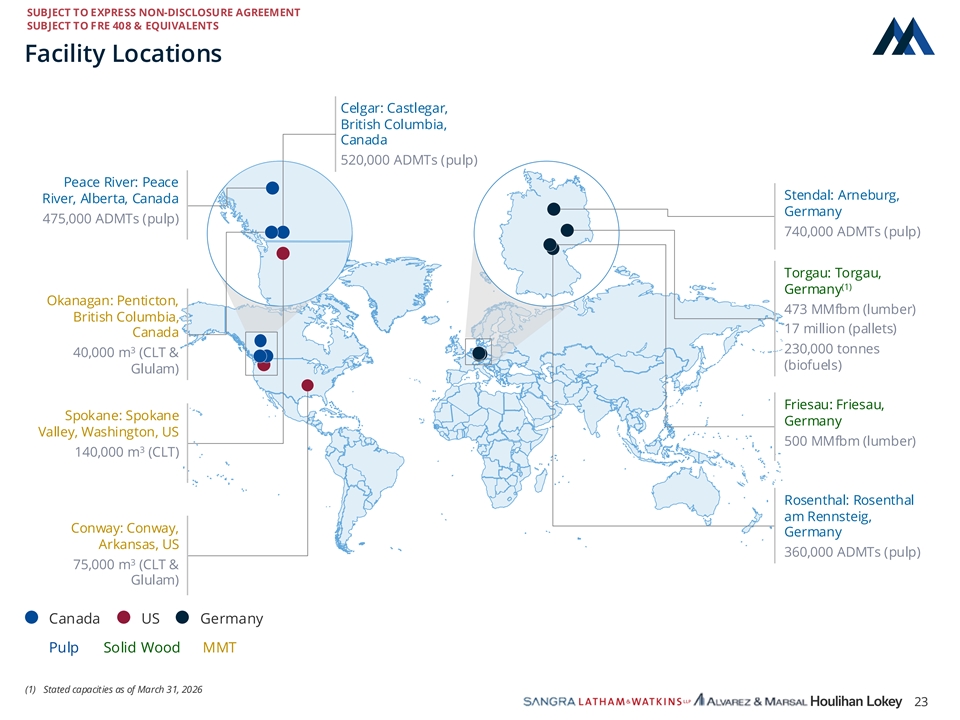
SUBJECT TO EXPRESS NON-DISCLOSURE AGREEMENT 0 SUBJECT TO FRE 408 & EQUIVALENTS 74 151 #004A97 Facility Locations 98 168 Celgar: Castlegar, 220 British Columbia, #62A8DC Canada 1 520,000 ADMTs (pulp) 95 Peace River: Peace 0 Stendal: Arneburg, River, Alberta, Canada #015F00 Germany 475,000 ADMTs (pulp) 740,000 ADMTs (pulp) 0 37 61 Torgau: Torgau, #00253D (1) Germany Okanagan: Penticton, 145 473 MMfbm (lumber) British Columbia, 26 17 million (pallets) Canada 57 3 230,000 tonnes 40,000 m (CLT & #911A39 (biofuels) Glulam) 255 192 Friesau: Friesau, 0 Spokane: Spokane Germany #FFC000 Valley, Washington, US 500 MMfbm (lumber) 3 140,000 m (CLT) 119 119 119 Rosenthal: Rosenthal #777777 am Rennsteig, Conway: Conway, Germany 192 Arkansas, US 192 360,000 ADMTs (pulp) 3 192 75,000 m (CLT & #C0C0C0 Glulam) Canada US Germany Pulp Solid Wood MMT (1) Stated capacities as of March 31, 2026 23
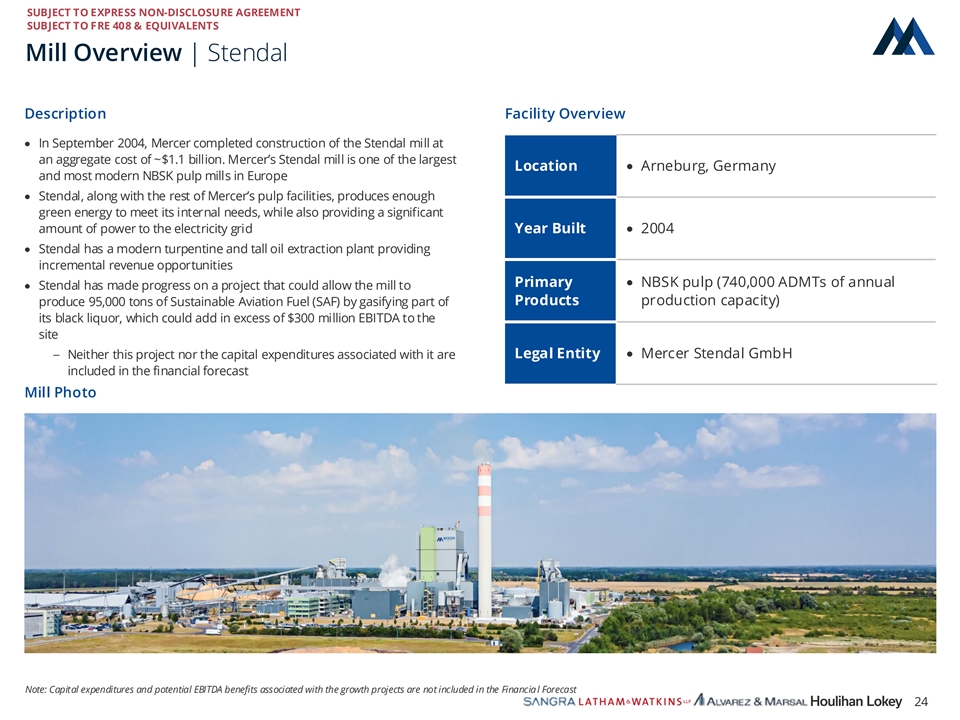
SUBJECT TO EXPRESS NON-DISCLOSURE AGREEMENT 0 SUBJECT TO FRE 408 & EQUIVALENTS 74 151 #004A97 Mill Overview | Stendal 98 168 Description Facility Overview 220 #62A8DC · In September 2004, Mercer completed construction of the Stendal mill at an aggregate cost of ~$1.1 billion. Mercer’s Stendal mill is one of the largest 1 Location · Arneburg, Germany 95 and most modern NBSK pulp mills in Europe 0 · Stendal, along with the rest of Mercer’s pulp facilities, produces enough #015F00 green energy to meet its internal needs, while also providing a significant amount of power to the electricity grid Year Built · 2004 0 · Stendal has a modern turpentine and tall oil extraction plant providing 37 61 incremental revenue opportunities #00253D Primary · NBSK pulp (740,000 ADMTs of annual · Stendal has made progress on a project that could allow the mill to Products production capacity) produce 95,000 tons of Sustainable Aviation Fuel (SAF) by gasifying part of 145 its black liquor, which could add in excess of $300 million EBITDA to the 26 site 57 #911A39 – Neither this project nor the capital expenditures associated with it are Legal Entity · Mercer Stendal GmbH included in the financial forecast 255 Mill Photo 192 0 #FFC000 119 119 119 #777777 192 192 192 #C0C0C0 Note: Capital expenditures and potential EBITDA benefits associated with the growth projects are not included in the Financial Forecast 24
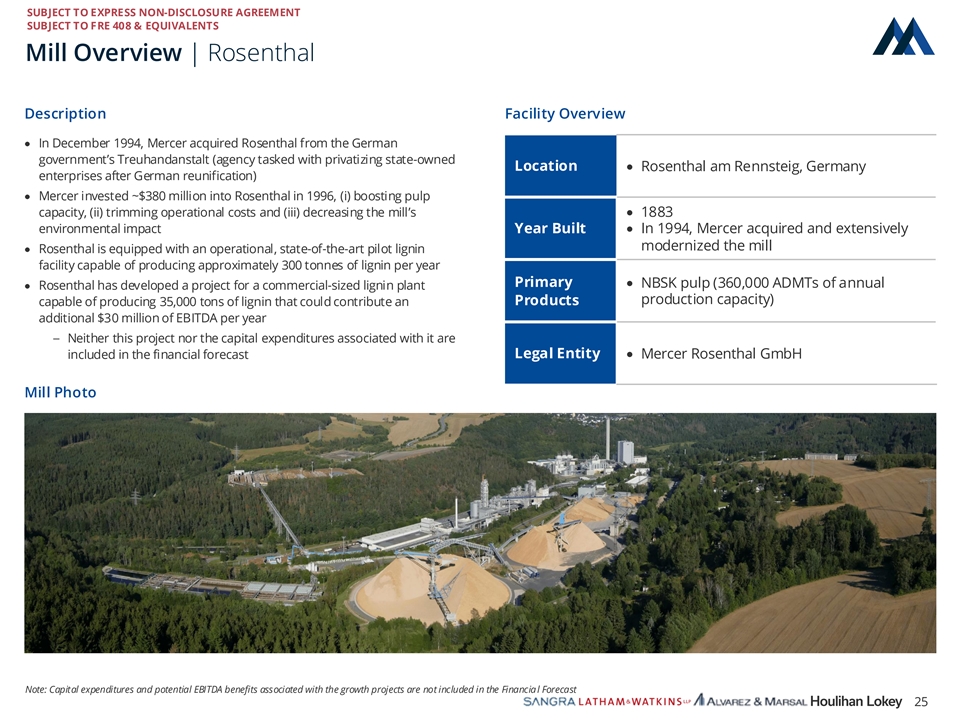
SUBJECT TO EXPRESS NON-DISCLOSURE AGREEMENT 0 SUBJECT TO FRE 408 & EQUIVALENTS 74 151 #004A97 Mill Overview | Rosenthal 98 168 Description Facility Overview 220 #62A8DC · In December 1994, Mercer acquired Rosenthal from the German government’s Treuhandanstalt (agency tasked with privatizing state-owned 1 Location · Rosenthal am Rennsteig, Germany 95 enterprises after German reunification) 0 · Mercer invested ~$380 million into Rosenthal in 1996, (i) boosting pulp #015F00 capacity, (ii) trimming operational costs and (iii) decreasing the mill’s · 1883 environmental impact Year Built · In 1994, Mercer acquired and extensively 0 modernized the mill · Rosenthal is equipped with an operational, state-of-the-art pilot lignin 37 61 facility capable of producing approximately 300 tonnes of lignin per year #00253D Primary · NBSK pulp (360,000 ADMTs of annual · Rosenthal has developed a project for a commercial-sized lignin plant production capacity) Products capable of producing 35,000 tons of lignin that could contribute an 145 additional $30 million of EBITDA per year 26 – Neither this project nor the capital expenditures associated with it are 57 #911A39 included in the financial forecast Legal Entity · Mercer Rosenthal GmbH 255 Mill Photo 192 0 #FFC000 119 119 119 #777777 192 192 192 #C0C0C0 Note: Capital expenditures and potential EBITDA benefits associated with the growth projects are not included in the Financial Forecast 25
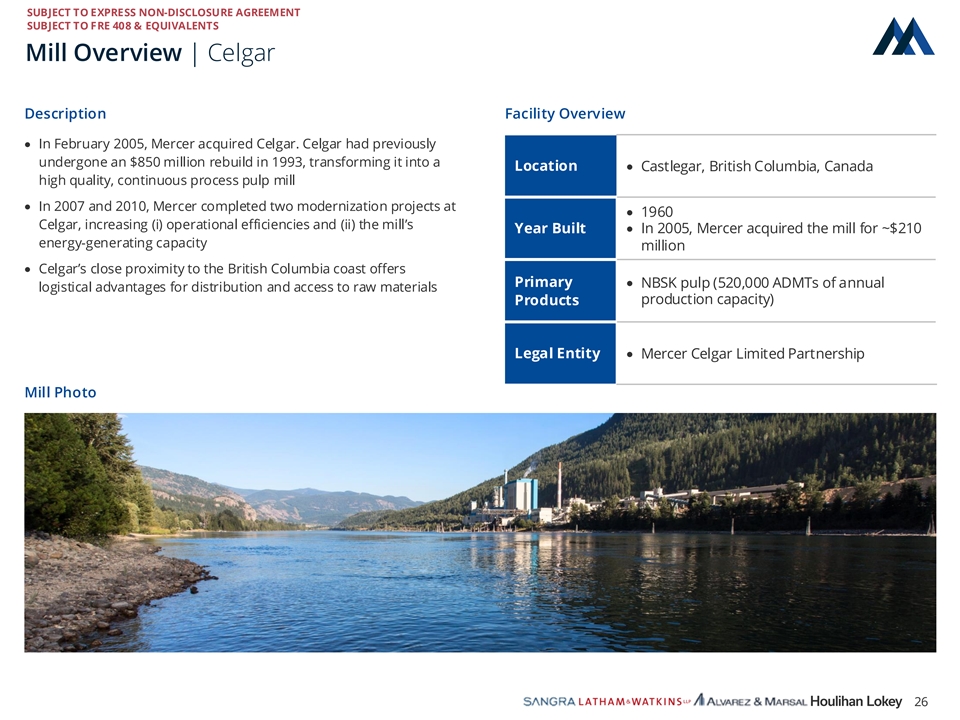
SUBJECT TO EXPRESS NON-DISCLOSURE AGREEMENT 0 SUBJECT TO FRE 408 & EQUIVALENTS 74 151 #004A97 Mill Overview | Celgar 98 168 Description Facility Overview 220 #62A8DC · In February 2005, Mercer acquired Celgar. Celgar had previously 1 undergone an $850 million rebuild in 1993, transforming it into a Location · Castlegar, British Columbia, Canada 95 high quality, continuous process pulp mill 0 #015F00 · In 2007 and 2010, Mercer completed two modernization projects at · 1960 Celgar, increasing (i) operational efficiencies and (ii) the mill’s Year Built · In 2005, Mercer acquired the mill for ~$210 0 energy-generating capacity million 37 61 · Celgar’s close proximity to the British Columbia coast offers #00253D Primary · NBSK pulp (520,000 ADMTs of annual logistical advantages for distribution and access to raw materials production capacity) Products 145 26 57 #911A39 Legal Entity · Mercer Celgar Limited Partnership 255 Mill Photo 192 0 #FFC000 119 119 119 #777777 192 192 192 #C0C0C0 26
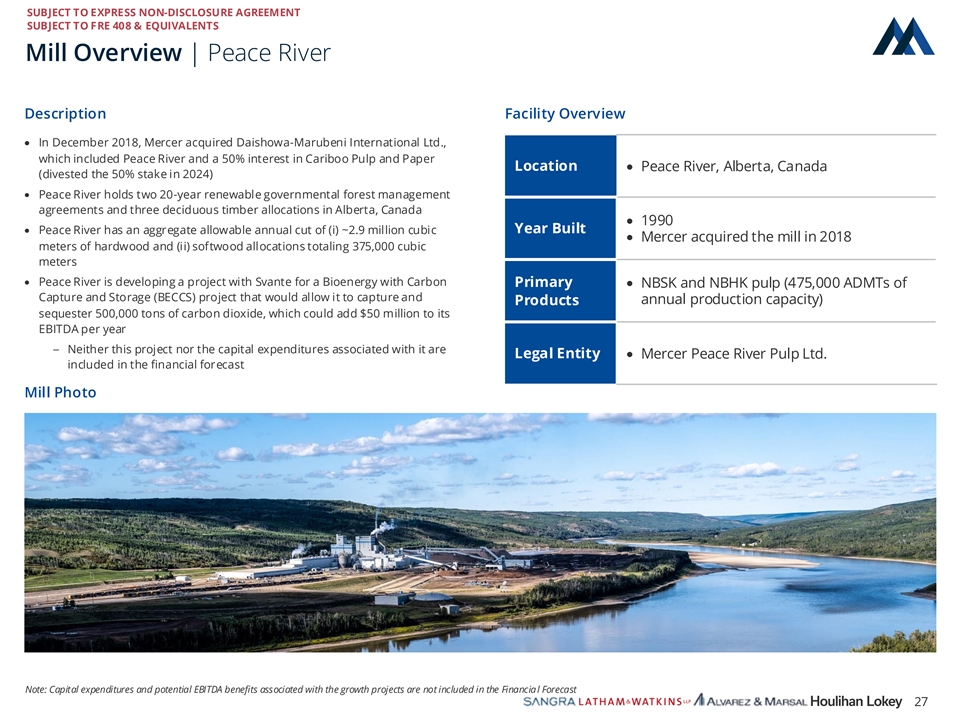
SUBJECT TO EXPRESS NON-DISCLOSURE AGREEMENT 0 SUBJECT TO FRE 408 & EQUIVALENTS 74 151 #004A97 Mill Overview | Peace River 98 168 Description Facility Overview 220 #62A8DC · In December 2018, Mercer acquired Daishowa-Marubeni International Ltd., which included Peace River and a 50% interest in Cariboo Pulp and Paper 1 Location · Peace River, Alberta, Canada (divested the 50% stake in 2024) 95 0 · Peace River holds two 20-year renewable governmental forest management #015F00 agreements and three deciduous timber allocations in Alberta, Canada · 1990 Year Built · Peace River has an aggregate allowable annual cut of (i) ~2.9 million cubic 0 · Mercer acquired the mill in 2018 meters of hardwood and (ii) softwood allocations totaling 375,000 cubic 37 meters 61 #00253D · Peace River is developing a project with Svante for a Bioenergy with Carbon Primary · NBSK and NBHK pulp (475,000 ADMTs of Capture and Storage (BECCS) project that would allow it to capture and annual production capacity) Products 145 sequester 500,000 tons of carbon dioxide, which could add $50 million to its 26 EBITDA per year 57 – Neither this project nor the capital expenditures associated with it are #911A39 Legal Entity · Mercer Peace River Pulp Ltd. included in the financial forecast 255 Mill Photo 192 0 #FFC000 119 119 119 #777777 192 192 192 #C0C0C0 Note: Capital expenditures and potential EBITDA benefits associated with the growth projects are not included in the Financial Forecast 27
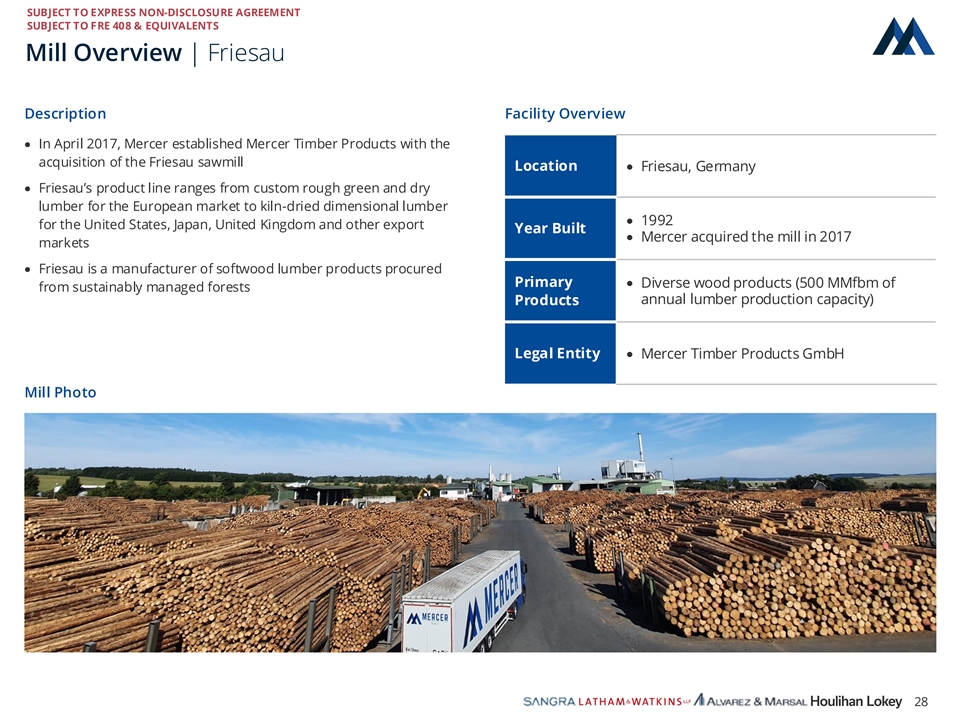
SUBJECT TO EXPRESS NON-DISCLOSURE AGREEMENT 0 SUBJECT TO FRE 408 & EQUIVALENTS 74 151 #004A97 Mill Overview | Friesau 98 168 Description Facility Overview 220 #62A8DC · In April 2017, Mercer established Mercer Timber Products with the 1 acquisition of the Friesau sawmill Location · Friesau, Germany 95 · Friesau’s product line ranges from custom rough green and dry 0 #015F00 lumber for the European market to kiln-dried dimensional lumber · 1992 for the United States, Japan, United Kingdom and other export Year Built 0 · Mercer acquired the mill in 2017 markets 37 61 · Friesau is a manufacturer of softwood lumber products procured #00253D Primary · Diverse wood products (500 MMfbm of from sustainably managed forests annual lumber production capacity) Products 145 26 57 #911A39 Legal Entity · Mercer Timber Products GmbH 255 Mill Photo 192 0 #FFC000 119 119 119 #777777 192 192 192 #C0C0C0 28
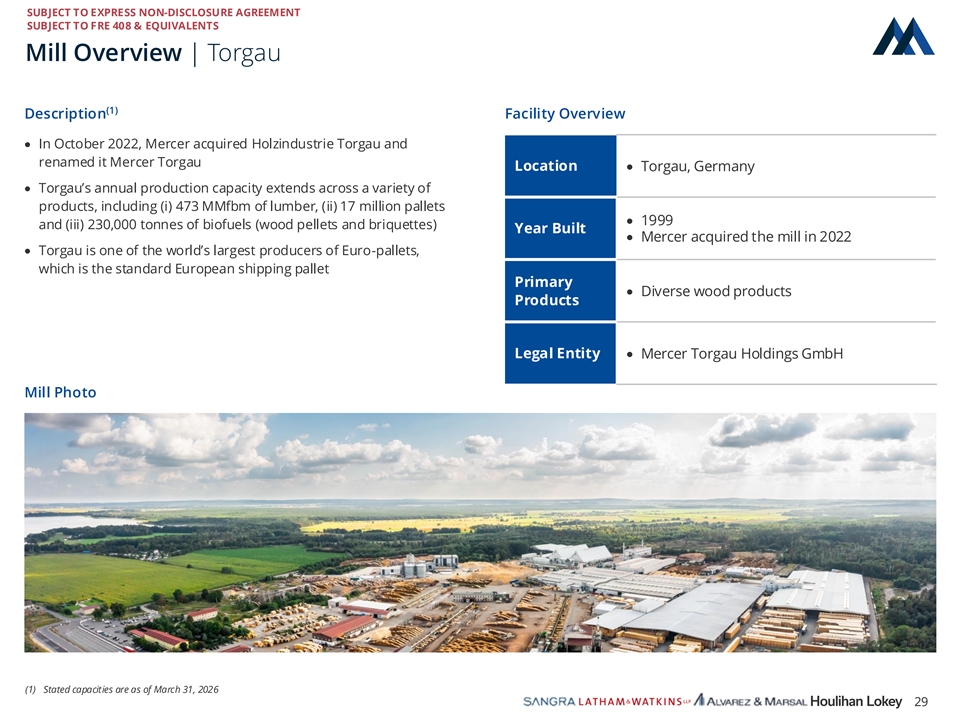
SUBJECT TO EXPRESS NON-DISCLOSURE AGREEMENT 0 SUBJECT TO FRE 408 & EQUIVALENTS 74 151 #004A97 Mill Overview | Torgau 98 168 (1) Description Facility Overview 220 #62A8DC · In October 2022, Mercer acquired Holzindustrie Torgau and 1 renamed it Mercer Torgau Location · Torgau, Germany 95 · Torgau’s annual production capacity extends across a variety of 0 #015F00 products, including (i) 473 MMfbm of lumber, (ii) 17 million pallets · 1999 and (iii) 230,000 tonnes of biofuels (wood pellets and briquettes) Year Built 0 · Mercer acquired the mill in 2022 37 · Torgau is one of the world’s largest producers of Euro-pallets, 61 which is the standard European shipping pallet #00253D Primary · Diverse wood products Products 145 26 57 #911A39 Legal Entity · Mercer Torgau Holdings GmbH 255 Mill Photo 192 0 #FFC000 119 119 119 #777777 192 192 192 #C0C0C0 (1) Stated capacities are as of March 31, 2026 29
04 Appendix Mercer Mass Timber Overview
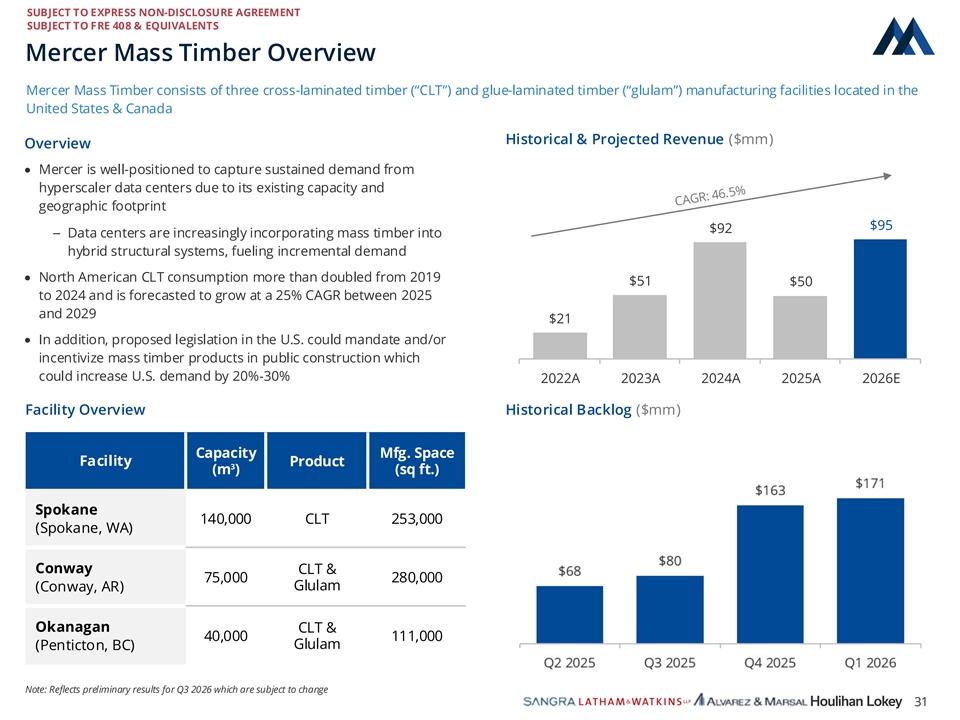
SUBJECT TO EXPRESS NON-DISCLOSURE AGREEMENT 0 SUBJECT TO FRE 408 & EQUIVALENTS 74 151 #004A97 Mercer Mass Timber Overview 98 Mercer Mass Timber consists of three cross-laminated timber (“CLT”) and glue-laminated timber (“glulam”) manufacturing facilities located in the 168 United States & Canada 220 #62A8DC Historical & Projected Revenue ($mm) Overview 1 · Mercer is well-positioned to capture sustained demand from 95 hyperscaler data centers due to its existing capacity and 0 #015F00 geographic footprint $95 $92 – Data centers are increasingly incorporating mass timber into 0 37 hybrid structural systems, fueling incremental demand 61 · North American CLT consumption more than doubled from 2019 #00253D $51 $50 to 2024 and is forecasted to grow at a 25% CAGR between 2025 145 and 2029 $21 26 57 · In addition, proposed legislation in the U.S. could mandate and/or #911A39 incentivize mass timber products in public construction which could increase U.S. demand by 20%-30% 2022A 2023A 2024A 2025A 2026E 255 192 Facility Overview Historical Backlog ($mm) 0 #FFC000 Capacity Mfg. Space 119 Facility Product 3 (m ) (sq ft.) 119 119 #777777 Spokane 140,000 CLT 253,000 (Spokane, WA) 192 192 192 Conway CLT & #C0C0C0 75,000 280,000 Glulam (Conway, AR) Okanagan CLT & 40,000 111,000 Glulam (Penticton, BC) Note: Reflects preliminary results for Q3 2026 which are subject to change 31
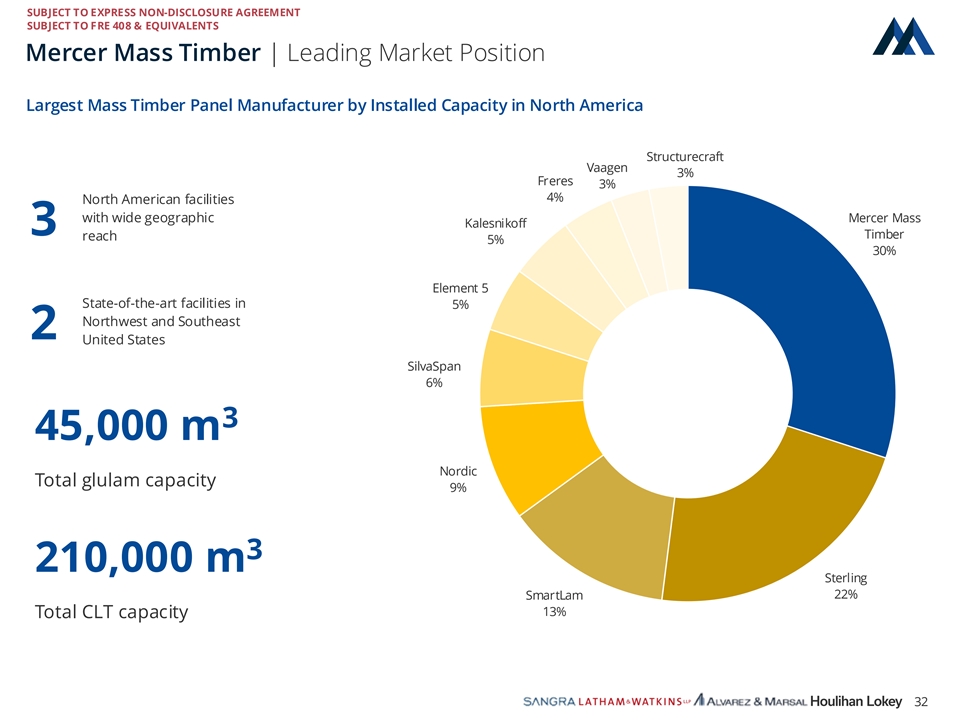
SUBJECT TO EXPRESS NON-DISCLOSURE AGREEMENT 0 SUBJECT TO FRE 408 & EQUIVALENTS 74 151 #004A97 Mercer Mass Timber | Leading Market Position 98 168 Largest Mass Timber Panel Manufacturer by Installed Capacity in North America 220 #62A8DC Structurecraft 1 Vaagen 3% 95 Freres 3% 0 4% North American facilities #015F00 with wide geographic Mercer Mass Kalesnikoff 3 Timber 0 reach 5% 37 30% 61 #00253D Element 5 State-of-the-art facilities in 5% 145 Northwest and Southeast 26 2 57 United States #911A39 SilvaSpan 6% 255 192 0 3 #FFC000 45,000 m 119 Nordic 119 Total glulam capacity 9% 119 #777777 192 192 3 192 210,000 m #C0C0C0 Sterling 22% SmartLam 13% Total CLT capacity 32
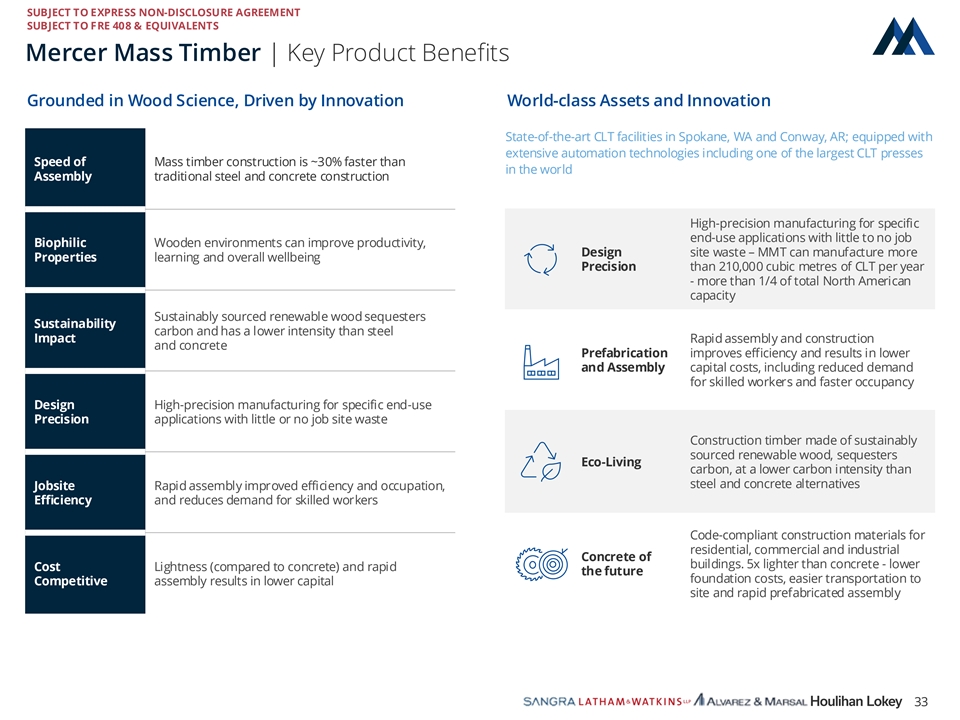
SUBJECT TO EXPRESS NON-DISCLOSURE AGREEMENT 0 SUBJECT TO FRE 408 & EQUIVALENTS 74 151 #004A97 Mercer Mass Timber | Key Product Benefits 98 168 Grounded in Wood Science, Driven by Innovation World-class Assets and Innovation 220 #62A8DC State-of-the-art CLT facilities in Spokane, WA and Conway, AR; equipped with extensive automation technologies including one of the largest CLT presses 1 Speed of Mass timber construction is ~30% faster than in the world 95 Assembly traditional steel and concrete construction 0 #015F00 High-precision manufacturing for specific 0 end-use applications with little to no job Biophilic Wooden environments can improve productivity, 37 Design site waste – MMT can manufacture more Properties learning and overall wellbeing 61 Precision than 210,000 cubic metres of CLT per year #00253D - more than 1/4 of total North American capacity 145 Sustainably sourced renewable wood sequesters Sustainability 26 carbon and has a lower intensity than steel Impact Rapid assembly and construction 57 and concrete Prefabrication improves efficiency and results in lower #911A39 and Assembly capital costs, including reduced demand for skilled workers and faster occupancy 255 192 Design High-precision manufacturing for specific end-use 0 Precision applications with little or no job site waste #FFC000 Construction timber made of sustainably sourced renewable wood, sequesters 119 Eco-Living carbon, at a lower carbon intensity than 119 steel and concrete alternatives Jobsite Rapid assembly improved efficiency and occupation, 119 Efficiency and reduces demand for skilled workers #777777 192 Code-compliant construction materials for 192 residential, commercial and industrial Concrete of 192 buildings. 5x lighter than concrete - lower Cost Lightness (compared to concrete) and rapid the future #C0C0C0 foundation costs, easier transportation to Competitive assembly results in lower capital site and rapid prefabricated assembly 33
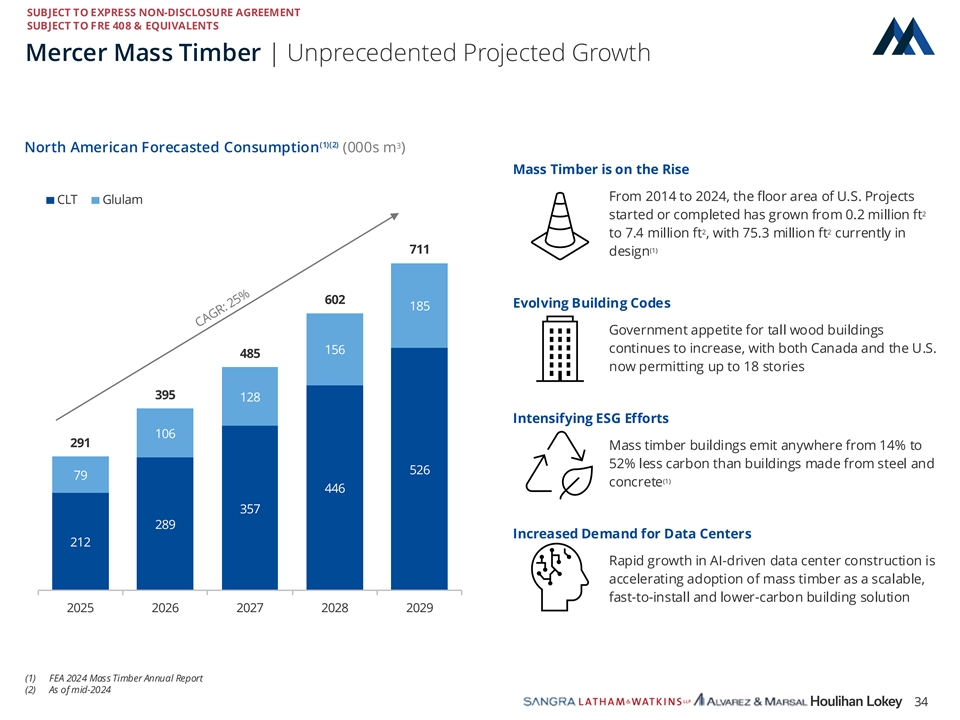
SUBJECT TO EXPRESS NON-DISCLOSURE AGREEMENT 0 SUBJECT TO FRE 408 & EQUIVALENTS 74 151 #004A97 Mercer Mass Timber | Unprecedented Projected Growth 98 168 220 #62A8DC (1)(2) 3 North American Forecasted Consumption (000s m ) 1 Mass Timber is on the Rise 95 0 From 2014 to 2024, the floor area of U.S. Projects CLT Glulam #015F00 2 started or completed has grown from 0.2 million ft 2 2 to 7.4 million ft , with 75.3 million ft currently in 0 711 (1) 37 design 61 #00253D 602 Evolving Building Codes 185 145 26 Government appetite for tall wood buildings 57 continues to increase, with both Canada and the U.S. 156 #911A39 485 now permitting up to 18 stories 255 395 128 192 0 Intensifying ESG Efforts #FFC000 106 291 Mass timber buildings emit anywhere from 14% to 119 52% less carbon than buildings made from steel and 526 119 79 (1) concrete 119 446 #777777 357 289 192 Increased Demand for Data Centers 212 192 Rapid growth in AI-driven data center construction is 192 #C0C0C0 accelerating adoption of mass timber as a scalable, fast-to-install and lower-carbon building solution 2025 2026 2027 2028 2029 (1) FEA 2024 Mass Timber Annual Report (2) As of mid-2024 34
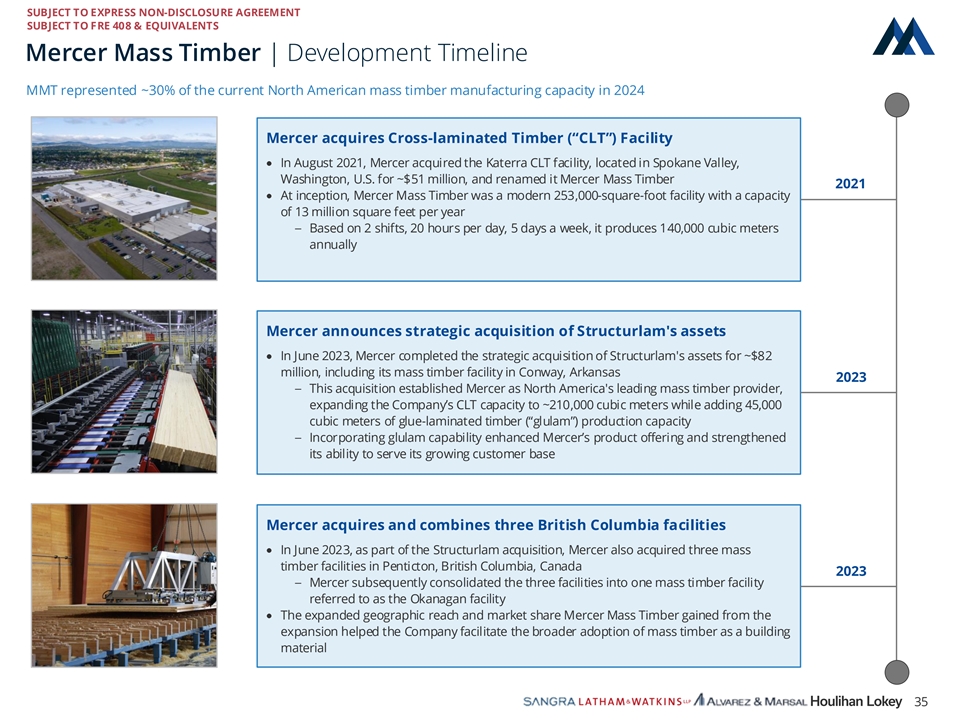
SUBJECT TO EXPRESS NON-DISCLOSURE AGREEMENT 0 SUBJECT TO FRE 408 & EQUIVALENTS 74 151 #004A97 Mercer Mass Timber | Development Timeline 98 MMT represented ~30% of the current North American mass timber manufacturing capacity in 2024 168 220 #62A8DC Mercer acquires Cross-laminated Timber (“CLT”) Facility 1 · In August 2021, Mercer acquired the Katerra CLT facility, located in Spokane Valley, 95 Washington, U.S. for ~$51 million, and renamed it Mercer Mass Timber 2021 0 · At inception, Mercer Mass Timber was a modern 253,000-square-foot facility with a capacity #015F00 of 13 million square feet per year – Based on 2 shifts, 20 hours per day, 5 days a week, it produces 140,000 cubic meters 0 annually 37 61 #00253D 145 26 Mercer announces strategic acquisition of Structurlam's assets 57 #911A39 · In June 2023, Mercer completed the strategic acquisition of Structurlam's assets for ~$82 million, including its mass timber facility in Conway, Arkansas 2023 255 – This acquisition established Mercer as North America's leading mass timber provider, 192 expanding the Company’s CLT capacity to ~210,000 cubic meters while adding 45,000 0 cubic meters of glue-laminated timber (“glulam”) production capacity #FFC000 – Incorporating glulam capability enhanced Mercer’s product offering and strengthened its ability to serve its growing customer base 119 119 119 #777777 Mercer acquires and combines three British Columbia facilities 192 192 · In June 2023, as part of the Structurlam acquisition, Mercer also acquired three mass 192 timber facilities in Penticton, British Columbia, Canada 2023 #C0C0C0 – Mercer subsequently consolidated the three facilities into one mass timber facility referred to as the Okanagan facility · The expanded geographic reach and market share Mercer Mass Timber gained from the expansion helped the Company facilitate the broader adoption of mass timber as a building material 35
04 Appendix Financial Forecast Detail
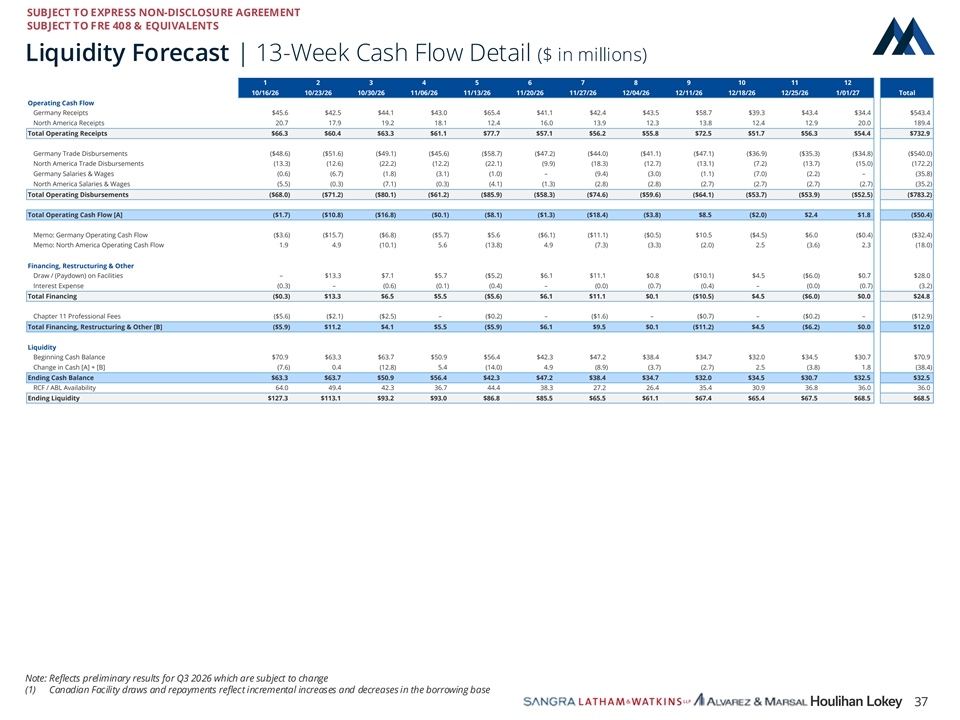
SUBJECT TO EXPRESS NON-DISCLOSURE AGREEMENT 0 SUBJECT TO FRE 408 & EQUIVALENTS 74 151 #004A97 Liquidity Forecast | 13-Week Cash Flow Detail ($ in millions) 1 2 3 4 5 6 7 8 9 10 11 12 98 10/16/26 10/23/26 10/30/26 11/06/26 11/13/26 11/20/26 11/27/26 12/04/26 12/11/26 12/18/26 12/25/26 1/01/27 Total 168 Operating Cash Flow Germany Receipts $45.6 $42.5 $44.1 $43.0 $65.4 $41.1 $42.4 $43.5 $58.7 $39.3 $43.4 $34.4 $543.4 220 North America Receipts 20.7 17.9 19.2 18.1 12.4 16.0 13.9 12.3 13.8 12.4 12.9 20.0 189.4 #62A8DC Total Operating Receipts $66.3 $60.4 $63.3 $61.1 $77.7 $57.1 $56.2 $55.8 $72.5 $51.7 $56.3 $54.4 $732.9 Germany Trade Disbursements ($48.6) ($51.6) ($49.1) ($45.6) ($58.7) ($47.2) ($44.0) ($41.1) ($47.1) ($36.9) ($35.3) ($34.8) ($540.0) 1 North America Trade Disbursements (13.3) (12.6) (22.2) (12.2) (22.1) (9.9) (18.3) (12.7) (13.1) (7.2) (13.7) (15.0) (172.2) Germany Salaries & Wages (0.6) (6.7) (1.8) (3.1) (1.0) – (9.4) (3.0) (1.1) (7.0) (2.2) – (35.8) 95 North America Salaries & Wages (5.5) (0.3) (7.1) (0.3) (4.1) (1.3) (2.8) (2.8) (2.7) (2.7) (2.7) (2.7) (35.2) 0 Total Operating Disbursements ($68.0) ($71.2) ($80.1) ($61.2) ($85.9) ($58.3) ($74.6) ($59.6) ($64.1) ($53.7) ($53.9) ($52.5) ($783.2) #015F00 Total Operating Cash Flow [A] ($1.7) ($10.8) ($16.8) ($0.1) ($8.1) ($1.3) ($18.4) ($3.8) $8.5 ($2.0) $2.4 $1.8 ($50.4) Memo: Germany Operating Cash Flow ($3.6) ($15.7) ($6.8) ($5.7) $5.6 ($6.1) ($11.1) ($0.5) $10.5 ($4.5) $6.0 ($0.4) ($32.4) 0 Memo: North America Operating Cash Flow 1.9 4.9 (10.1) 5.6 (13.8) 4.9 (7.3) (3.3) (2.0) 2.5 (3.6) 2.3 (18.0) 37 Financing, Restructuring & Other 61 Draw / (Paydown) on Facilities – $13.3 $7.1 $5.7 ($5.2) $6.1 $11.1 $0.8 ($10.1) $4.5 ($6.0) $0.7 $28.0 #00253D Interest Expense (0.3) – (0.6) (0.1) (0.4) – (0.0) (0.7) (0.4) – (0.0) (0.7) (3.2) Total Financing ($0.3) $13.3 $6.5 $5.5 ($5.6) $6.1 $11.1 $0.1 ($10.5) $4.5 ($6.0) $0.0 $24.8 145 Chapter 11 Professional Fees ($5.6) ($2.1) ($2.5) – ($0.2) – ($1.6) – ($0.7) – ($0.2) – ($12.9) 26 Total Financing, Restructuring & Other [B] ($5.9) $11.2 $4.1 $5.5 ($5.9) $6.1 $9.5 $0.1 ($11.2) $4.5 ($6.2) $0.0 $12.0 57 Liquidity #911A39 Beginning Cash Balance $70.9 $63.3 $63.7 $50.9 $56.4 $42.3 $47.2 $38.4 $34.7 $32.0 $34.5 $30.7 $70.9 Change in Cash [A] + [B] (7.6) 0.4 (12.8) 5.4 (14.0) 4.9 (8.9) (3.7) (2.7) 2.5 (3.8) 1.8 (38.4) Ending Cash Balance $63.3 $63.7 $50.9 $56.4 $42.3 $47.2 $38.4 $34.7 $32.0 $34.5 $30.7 $32.5 $32.5 255 RCF / ABL Availability 64.0 49.4 42.3 36.7 44.4 38.3 27.2 26.4 35.4 30.9 36.8 36.0 36.0 Ending Liquidity $127.3 $113.1 $93.2 $93.0 $86.8 $85.5 $65.5 $61.1 $67.4 $65.4 $67.5 $68.5 $68.5 192 0 #FFC000 119 119 119 #777777 192 192 192 #C0C0C0 Note: Reflects preliminary results for Q3 2026 which are subject to change (1) Canadian Facility draws and repayments reflect incremental increases and decreases in the borrowing base 37
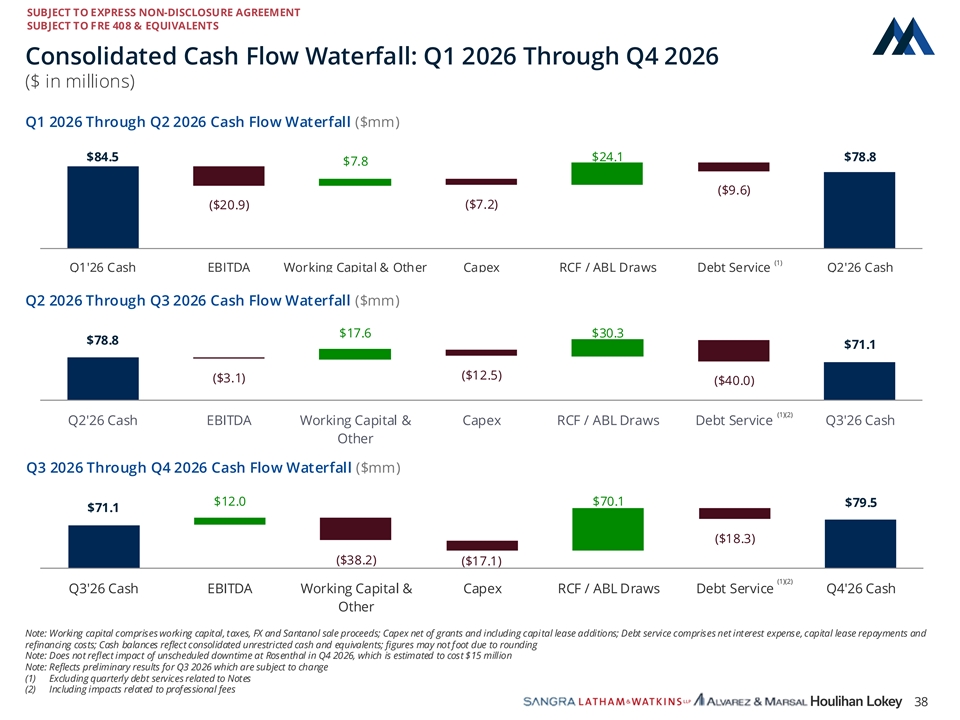
SUBJECT TO EXPRESS NON-DISCLOSURE AGREEMENT 0 SUBJECT TO FRE 408 & EQUIVALENTS 74 151 #004A97 Consolidated Cash Flow Waterfall: Q1 2026 Through Q4 2026 ($ in millions) 98 168 220 Q1 2026 Through Q2 2026 Cash Flow Waterfall ($mm) #62A8DC $84.5 $24.1 $78.8 1 $7.8 95 0 ($9.6) #015F00 ($20.9) ($7.2) 0 37 (1) 61 Q1'26 Cash EBITDA Working Capital & Other Capex RCF / ABL Draws Debt Service Q2'26 Cash #00253D Q2 2026 Through Q3 2026 Cash Flow Waterfall ($mm) 145 26 $17.6 $30.3 57 $78.8 $71.1 #911A39 ($12.5) ($3.1) ($40.0) 255 192 (1)(2) 0 Q2'26 Cash EBITDA Working Capital & Capex RCF / ABL Draws Debt Service Q3'26 Cash #FFC000 Other 119 Q3 2026 Through Q4 2026 Cash Flow Waterfall ($mm) 119 119 $12.0 $70.1 $79.5 #777777 $71.1 192 ($18.3) 192 ($38.2) ($17.1) 192 #C0C0C0 (1)(2) Q3'26 Cash EBITDA Working Capital & Capex RCF / ABL Draws Debt Service Q4'26 Cash Other Note: Working capital comprises working capital, taxes, FX and Santanol sale proceeds; Capex net of grants and including capital lease additions; Debt service comprises net interest expense, capital lease repayments and refinancing costs; Cash balances reflect consolidated unrestricted cash and equivalents; figures may not foot due to rounding Note: Does not reflect impact of unscheduled downtime at Rosenthal in Q4 2026, which is estimated to cost $15 million Note: Reflects preliminary results for Q3 2026 which are subject to change (1) Excluding quarterly debt services related to Notes (2) Including impacts related to professional fees 38
SUBJECT TO EXPRESS NON-DISCLOSURE AGREEMENT 0 SUBJECT TO FRE 408 & EQUIVALENTS 74 151 (1) #004A97 Annual Financial Forecast | Consolidated ($ in millions except per unit metrics) 98 168 2021A 2022A 2023A 2024A 2025A 2026E 2027E 2028E 2029E 2030E 2031E 220 Revenue $1,803 $2,281 $1,994 $2,043 $1,868 $1,891 $2,233 $2,427 $2,494 $2,641 $2,704 #62A8DC (-) Selling Expenses (188) (242) (241) (227) (217) (245) (267) (289) (299) (313) (316) Net Mill Realizations $1,615 $2,039 $1,753 $1,816 $1,651 $1,646 $1,966 $2,137 $2,195 $2,327 $2,388 1 (-) Fiber (509) (676) (839) (765) (876) (937) (942) (942) (963) (1,002) (1,027) (-) Chemicals (100) (140) (152) (121) (125) (128) (156) (162) (167) (175) (176) 95 (-) Energy (107) (139) (136) (82) (67) (61) (73) (102) (104) (108) (103) 0 (-) Labor (103) (110) (135) (145) (153) (161) (160) (169) (175) (176) (180) #015F00 (-) Maintenance (164) (176) (175) (194) (222) (169) (205) (205) (242) (185) (216) (-) Other Variable Costs (10) (16) (40) (45) (28) (55) (66) (74) (85) (94) (104) 0 (-) Other Fixed Costs (52) (67) (54) (89) (110) (78) (96) (78) (107) (116) (106) 37 (-) Purchase of Finished Goods (88) (101) (98) (24) (0) (0) 0 – – – 0 61 (+/-) Change in Finished Goods 53 (3) (5) (33) 6 16 (8) (3) 4 0 5 #00253D (+/-) Exchange Gain (Loss) 5 12 (5) 14 (15) 5 (1) (1) (1) – – Gross Profit $540 $622 $115 $331 $62 $79 $259 $400 $354 $472 $482 Gross Margin % 29.9% 27.3% 5.8% 16.2% 3.3% 4.2% 11.6% 16.5% 14.2% 17.9% 17.8% 145 (-) SG&A (61) (85) (97) (87) (85) (83) (88) (89) (91) (93) (94) 26 Operating EBITDA $479 $537 $18 $244 ($22) ($4) $171 $311 $263 $378 $387 57 Operating EBITDA Margin % 26.6% 23.5% 0.9% 11.9% (1.2%) (0.2%) 7.7% 12.8% 10.5% 14.3% 14.3% #911A39 (+/-) Change in Net Working Capital (192) (26) 42 0 118 (75) (41) (27) (8) (16) (15) (-) Net Capital Expenditures (120) (173) (127) (85) (83) (48) (107) (120) (113) (95) (86) (2) 255 (+/-) Other (20) (19) 10 (29) 4 (1) (14) (33) (47) (57) (66) 192 Unlevered Free Cash Flow $147 $319 ($57) $130 $17 ($128) $9 $132 $95 $210 $220 0 Sales Volume Metrics #FFC000 Total Pulp ('000s ADMT) 1,813 1,918 1,951 1,900 1,830 1,794 1,885 1,998 1,977 2,029 2,011 Lumber (MMfbm) 420 410 501 470 465 453 523 565 567 562 561 119 Energy Sold ('000s MWh) 777 861 993 924 856 841 889 1,021 1,007 995 1,172 119 3 Manufactured Volume ('000s m ) 4 29 33 31 27 44 61 73 87 102 118 119 Pallets (mm units) – 3 11 10 9 8 8 8 8 8 8 #777777 Biofuels ('000s MT) – 50 145 184 136 151 140 123 123 123 123 192 192 192 #C0C0C0 Note: Does not include contribution from certain non-material subsidiaries Note: Does not reflect impact of unscheduled downtime and unforeseen additional costs at Rosenthal in Q4 2026, currently estimated at $15 million and subject to confirmation Note: Reflects preliminary results for Q3 2026 which are subject to change (1) Numbers reflect financial contribution from acquired entities as of date of acquisition (2) Includes taxes, capital leases and changes due to foreign exchange 39
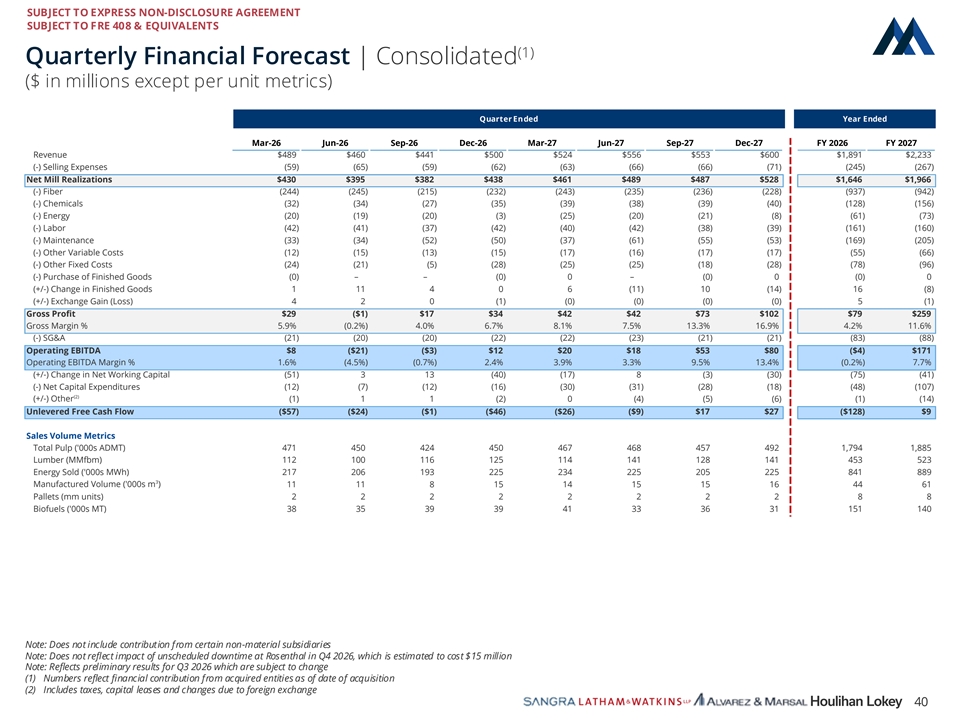
SUBJECT TO EXPRESS NON-DISCLOSURE AGREEMENT 0 SUBJECT TO FRE 408 & EQUIVALENTS 74 151 (1) #004A97 Quarterly Financial Forecast | Consolidated ($ in millions except per unit metrics) 98 168 220 Quarter Ended Year Ended #62A8DC Mar-26 Jun-26 Sep-26 Dec-26 Mar-27 Jun-27 Sep-27 Dec-27 FY 2026 FY 2027 Revenue $489 $460 $441 $500 $524 $556 $553 $600 $1,891 $2,233 1 (-) Selling Expenses (59) (65) (59) (62) (63) (66) (66) (71) (245) (267) 95 Net Mill Realizations $430 $395 $382 $438 $461 $489 $487 $528 $1,646 $1,966 0 (-) Fiber (244) (245) (215) (232) (243) (235) (236) (228) (937) (942) (-) Chemicals (32) (34) (27) (35) (39) (38) (39) (40) (128) (156) #015F00 (-) Energy (20) (19) (20) (3) (25) (20) (21) (8) (61) (73) (-) Labor (42) (41) (37) (42) (40) (42) (38) (39) (161) (160) 0 (-) Maintenance (33) (34) (52) (50) (37) (61) (55) (53) (169) (205) 37 (-) Other Variable Costs (12) (15) (13) (15) (17) (16) (17) (17) (55) (66) (-) Other Fixed Costs (24) (21) (5) (28) (25) (25) (18) (28) (78) (96) 61 (-) Purchase of Finished Goods (0) – – (0) 0 – (0) 0 (0) 0 #00253D (+/-) Change in Finished Goods 1 11 4 0 6 (11) 10 (14) 16 (8) (+/-) Exchange Gain (Loss) 4 2 0 (1) (0) (0) (0) (0) 5 (1) 145 Gross Profit $29 ($1) $17 $34 $42 $42 $73 $102 $79 $259 26 Gross Margin % 5.9% (0.2%) 4.0% 6.7% 8.1% 7.5% 13.3% 16.9% 4.2% 11.6% (-) SG&A (21) (20) (20) (22) (22) (23) (21) (21) (83) (88) 57 Operating EBITDA $8 ($21) ($3) $12 $20 $18 $53 $80 ($4) $171 #911A39 Operating EBITDA Margin % 1.6% (4.5%) (0.7%) 2.4% 3.9% 3.3% 9.5% 13.4% (0.2%) 7.7% (+/-) Change in Net Working Capital (51) 3 13 (40) (17) 8 (3) (30) (75) (41) 255 (-) Net Capital Expenditures (12) (7) (12) (16) (30) (31) (28) (18) (48) (107) (2) (+/-) Other (1) 1 1 (2) 0 (4) (5) (6) (1) (14) 192 Unlevered Free Cash Flow ($57) ($24) ($1) ($46) ($26) ($9) $17 $27 ($128) $9 0 #FFC000 Sales Volume Metrics Total Pulp ('000s ADMT) 471 450 424 450 467 468 457 492 1,794 1,885 Lumber (MMfbm) 112 100 116 125 114 141 128 141 453 523 119 Energy Sold ('000s MWh) 217 206 193 225 234 225 205 225 841 889 119 3 Manufactured Volume ('000s m ) 11 11 8 15 14 15 15 16 44 61 119 Pallets (mm units) 2 2 2 2 2 2 2 2 8 8 #777777 Biofuels ('000s MT) 38 35 39 39 41 33 36 31 151 140 192 192 192 #C0C0C0 Note: Does not include contribution from certain non-material subsidiaries Note: Does not reflect impact of unscheduled downtime at Rosenthal in Q4 2026, which is estimated to cost $15 million Note: Reflects preliminary results for Q3 2026 which are subject to change (1) Numbers reflect financial contribution from acquired entities as of date of acquisition (2) Includes taxes, capital leases and changes due to foreign exchange 40
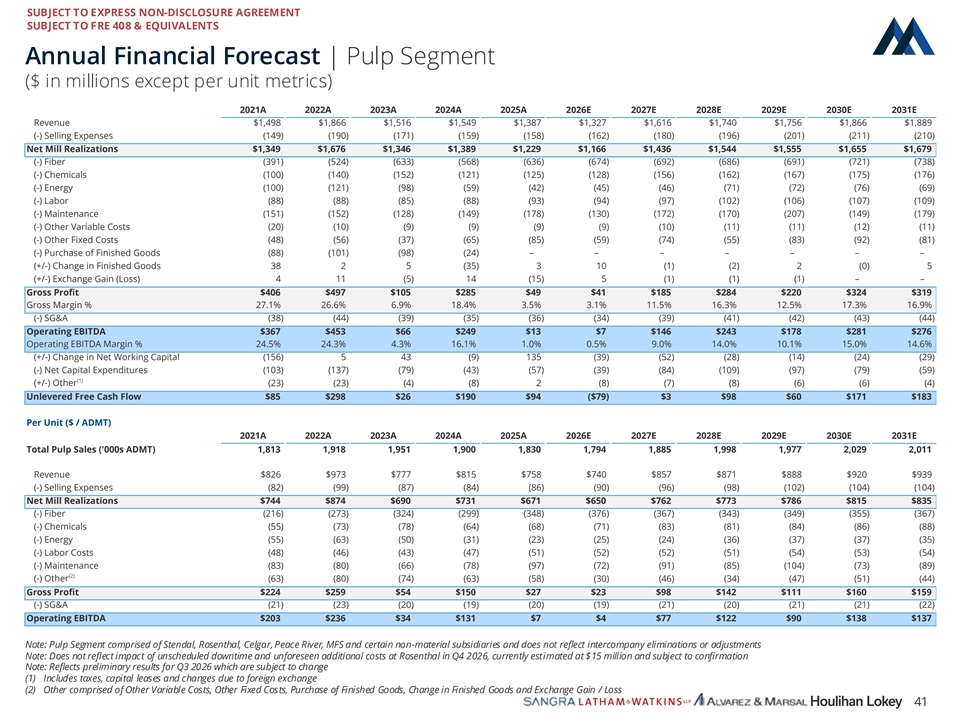
SUBJECT TO EXPRESS NON-DISCLOSURE AGREEMENT 0 SUBJECT TO FRE 408 & EQUIVALENTS 74 151 #004A97 Annual Financial Forecast | Pulp Segment ($ in millions except per unit metrics) 98 168 2021A 2022A 2023A 2024A 2025A 2026E 2027E 2028E 2029E 2030E 2031E 220 Revenue $1,498 $1,866 $1,516 $1,549 $1,387 $1,327 $1,616 $1,740 $1,756 $1,866 $1,889 #62A8DC (-) Selling Expenses (149) (190) (171) (159) (158) (162) (180) (196) (201) (211) (210) Net Mill Realizations $1,349 $1,676 $1,346 $1,389 $1,229 $1,166 $1,436 $1,544 $1,555 $1,655 $1,679 1 (-) Fiber (391) (524) (633) (568) (636) (674) (692) (686) (691) (721) (738) (-) Chemicals (100) (140) (152) (121) (125) (128) (156) (162) (167) (175) (176) 95 (-) Energy (100) (121) (98) (59) (42) (45) (46) (71) (72) (76) (69) 0 (-) Labor (88) (88) (85) (88) (93) (94) (97) (102) (106) (107) (109) #015F00 (-) Maintenance (151) (152) (128) (149) (178) (130) (172) (170) (207) (149) (179) (-) Other Variable Costs (20) (10) (9) (9) (9) (9) (10) (11) (11) (12) (11) 0 (-) Other Fixed Costs (48) (56) (37) (65) (85) (59) (74) (55) (83) (92) (81) 37 (-) Purchase of Finished Goods (88) (101) (98) (24) – – – – – – – 61 (+/-) Change in Finished Goods 38 2 5 (35) 3 10 (1) (2) 2 (0) 5 (+/-) Exchange Gain (Loss) 4 11 (5) 14 (15) 5 (1) (1) (1) – – #00253D Gross Profit $406 $497 $105 $285 $49 $41 $185 $284 $220 $324 $319 Gross Margin % 27.1% 26.6% 6.9% 18.4% 3.5% 3.1% 11.5% 16.3% 12.5% 17.3% 16.9% 145 (-) SG&A (38) (44) (39) (35) (36) (34) (39) (41) (42) (43) (44) 26 Operating EBITDA $367 $453 $66 $249 $13 $7 $146 $243 $178 $281 $276 57 Operating EBITDA Margin % 24.5% 24.3% 4.3% 16.1% 1.0% 0.5% 9.0% 14.0% 10.1% 15.0% 14.6% #911A39 (+/-) Change in Net Working Capital (156) 5 43 (9) 135 (39) (52) (28) (14) (24) (29) (-) Net Capital Expenditures (103) (137) (79) (43) (57) (39) (84) (109) (97) (79) (59) (1) (+/-) Other (23) (23) (4) (8) 2 (8) (7) (8) (6) (6) (4) 255 Unlevered Free Cash Flow $85 $298 $26 $190 $94 ($79) $3 $98 $60 $171 $183 192 0 Per Unit ($ / ADMT) #FFC000 2021A 2022A 2023A 2024A 2025A 2026E 2027E 2028E 2029E 2030E 2031E Total Pulp Sales ('000s ADMT) 1,813 1,918 1,951 1,900 1,830 1,794 1,885 1,998 1,977 2,029 2,011 119 Revenue $826 $973 $777 $815 $758 $740 $857 $871 $888 $920 $939 119 (-) Selling Expenses (82) (99) (87) (84) (86) (90) (96) (98) (102) (104) (104) 119 Net Mill Realizations $744 $874 $690 $731 $671 $650 $762 $773 $786 $815 $835 #777777 (-) Fiber (216) (273) (324) (299) (348) (376) (367) (343) (349) (355) (367) (-) Chemicals (55) (73) (78) (64) (68) (71) (83) (81) (84) (86) (88) 192 (-) Energy (55) (63) (50) (31) (23) (25) (24) (36) (37) (37) (35) 192 (-) Labor Costs (48) (46) (43) (47) (51) (52) (52) (51) (54) (53) (54) 192 (-) Maintenance (83) (80) (66) (78) (97) (72) (91) (85) (104) (73) (89) (2) (-) Other #C0C0C0 (63) (80) (74) (63) (58) (30) (46) (34) (47) (51) (44) Gross Profit $224 $259 $54 $150 $27 $23 $98 $142 $111 $160 $159 (-) SG&A (21) (23) (20) (19) (20) (19) (21) (20) (21) (21) (22) Operating EBITDA $203 $236 $34 $131 $7 $4 $77 $122 $90 $138 $137 Note: Pulp Segment comprised of Stendal, Rosenthal, Celgar, Peace River, MFS and certain non-material subsidiaries and does not reflect intercompany eliminations or adjustments Note: Does not reflect impact of unscheduled downtime and unforeseen additional costs at Rosenthal in Q4 2026, currently estimated at $15 million and subject to confirmation Note: Reflects preliminary results for Q3 2026 which are subject to change (1) Includes taxes, capital leases and changes due to foreign exchange (2) Other comprised of Other Variable Costs, Other Fixed Costs, Purchase of Finished Goods, Change in Finished Goods and Exchange Gain / Loss 41
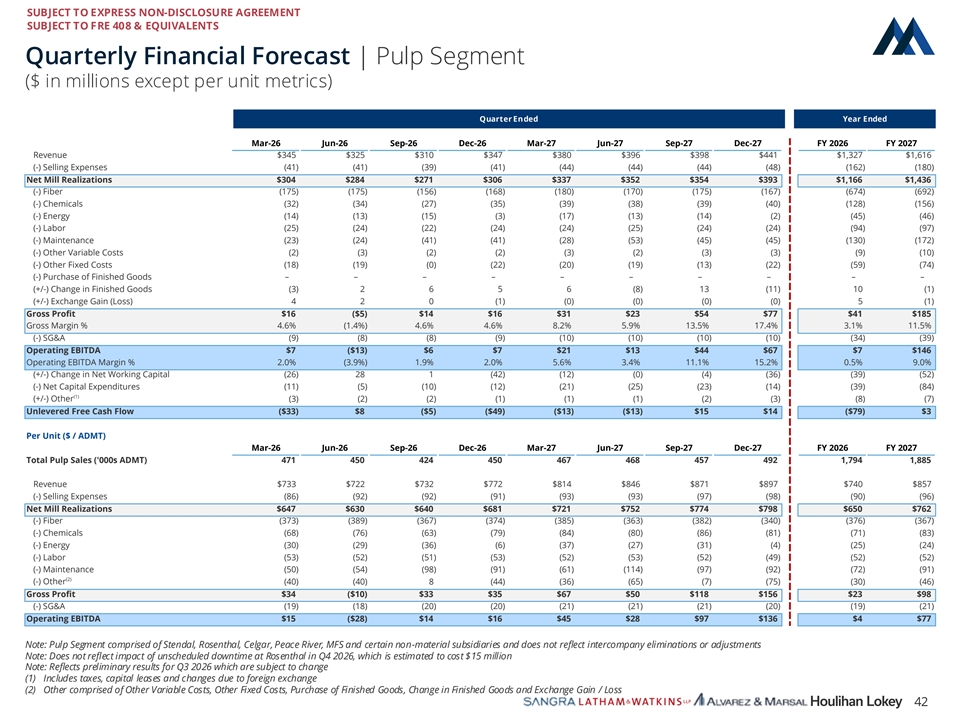
SUBJECT TO EXPRESS NON-DISCLOSURE AGREEMENT 0 SUBJECT TO FRE 408 & EQUIVALENTS 74 151 #004A97 Quarterly Financial Forecast | Pulp Segment ($ in millions except per unit metrics) 98 168 220 Quarter Ended Year Ended #62A8DC Mar-26 Jun-26 Sep-26 Dec-26 Mar-27 Jun-27 Sep-27 Dec-27 FY 2026 FY 2027 Revenue $345 $325 $310 $347 $380 $396 $398 $441 $1,327 $1,616 1 (-) Selling Expenses (41) (41) (39) (41) (44) (44) (44) (48) (162) (180) 95 Net Mill Realizations $304 $284 $271 $306 $337 $352 $354 $393 $1,166 $1,436 0 (-) Fiber (175) (175) (156) (168) (180) (170) (175) (167) (674) (692) (-) Chemicals (32) (34) (27) (35) (39) (38) (39) (40) (128) (156) #015F00 (-) Energy (14) (13) (15) (3) (17) (13) (14) (2) (45) (46) (-) Labor (25) (24) (22) (24) (24) (25) (24) (24) (94) (97) 0 (-) Maintenance (23) (24) (41) (41) (28) (53) (45) (45) (130) (172) 37 (-) Other Variable Costs (2) (3) (2) (2) (3) (2) (3) (3) (9) (10) (-) Other Fixed Costs (18) (19) (0) (22) (20) (19) (13) (22) (59) (74) 61 (-) Purchase of Finished Goods – – – – – – – – – – #00253D (+/-) Change in Finished Goods (3) 2 6 5 6 (8) 13 (11) 10 (1) (+/-) Exchange Gain (Loss) 4 2 0 (1) (0) (0) (0) (0) 5 (1) 145 Gross Profit $16 ($5) $14 $16 $31 $23 $54 $77 $41 $185 26 Gross Margin % 4.6% (1.4%) 4.6% 4.6% 8.2% 5.9% 13.5% 17.4% 3.1% 11.5% (-) SG&A (9) (8) (8) (9) (10) (10) (10) (10) (34) (39) 57 Operating EBITDA $7 ($13) $6 $7 $21 $13 $44 $67 $7 $146 #911A39 Operating EBITDA Margin % 2.0% (3.9%) 1.9% 2.0% 5.6% 3.4% 11.1% 15.2% 0.5% 9.0% (+/-) Change in Net Working Capital (26) 28 1 (42) (12) (0) (4) (36) (39) (52) 255 (-) Net Capital Expenditures (11) (5) (10) (12) (21) (25) (23) (14) (39) (84) (1) (+/-) Other (3) (2) (2) (1) (1) (1) (2) (3) (8) (7) 192 Unlevered Free Cash Flow ($33) $8 ($5) ($49) ($13) ($13) $15 $14 ($79) $3 0 #FFC000 Per Unit ($ / ADMT) Mar-26 Jun-26 Sep-26 Dec-26 Mar-27 Jun-27 Sep-27 Dec-27 FY 2026 FY 2027 119 Total Pulp Sales ('000s ADMT) 471 450 424 450 467 468 457 492 1,794 1,885 119 Revenue $733 $722 $732 $772 $814 $846 $871 $897 $740 $857 119 (-) Selling Expenses (86) (92) (92) (91) (93) (93) (97) (98) (90) (96) #777777 Net Mill Realizations $647 $630 $640 $681 $721 $752 $774 $798 $650 $762 (-) Fiber (373) (389) (367) (374) (385) (363) (382) (340) (376) (367) (-) Chemicals (68) (76) (63) (79) (84) (80) (86) (81) (71) (83) 192 (-) Energy (30) (29) (36) (6) (37) (27) (31) (4) (25) (24) 192 (-) Labor (53) (52) (51) (53) (52) (53) (52) (49) (52) (52) 192 (-) Maintenance (50) (54) (98) (91) (61) (114) (97) (92) (72) (91) (2) #C0C0C0 (-) Other (40) (40) 8 (44) (36) (65) (7) (75) (30) (46) Gross Profit $34 ($10) $33 $35 $67 $50 $118 $156 $23 $98 (-) SG&A (19) (18) (20) (20) (21) (21) (21) (20) (19) (21) Operating EBITDA $15 ($28) $14 $16 $45 $28 $97 $136 $4 $77 Note: Pulp Segment comprised of Stendal, Rosenthal, Celgar, Peace River, MFS and certain non-material subsidiaries and does not reflect intercompany eliminations or adjustments Note: Does not reflect impact of unscheduled downtime at Rosenthal in Q4 2026, which is estimated to cost $15 million Note: Reflects preliminary results for Q3 2026 which are subject to change (1) Includes taxes, capital leases and changes due to foreign exchange (2) Other comprised of Other Variable Costs, Other Fixed Costs, Purchase of Finished Goods, Change in Finished Goods and Exchange Gain / Loss 42
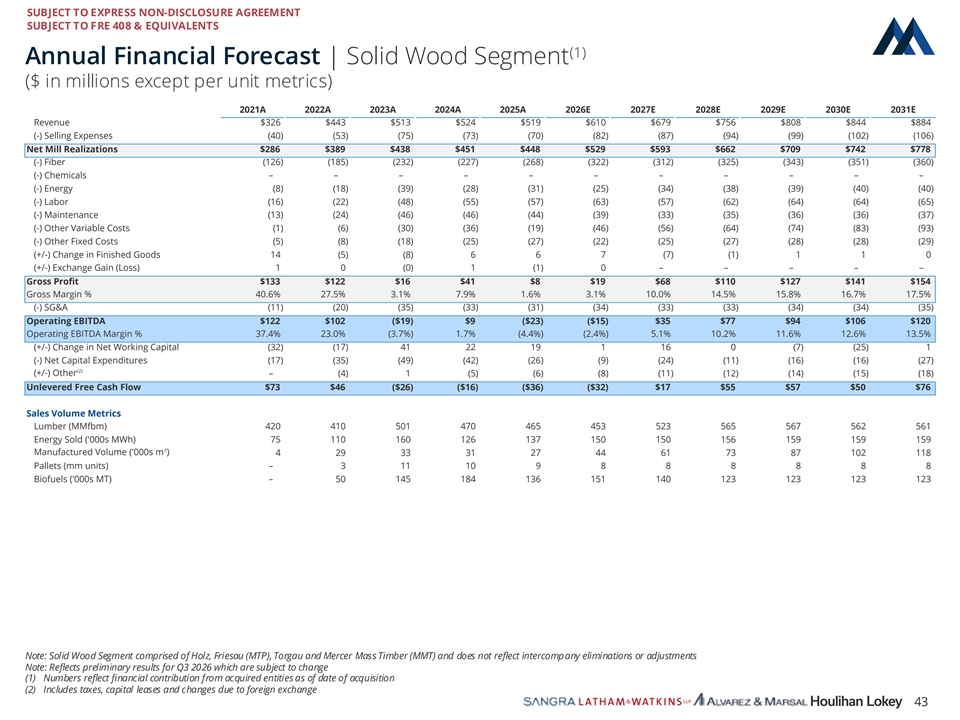
SUBJECT TO EXPRESS NON-DISCLOSURE AGREEMENT 0 SUBJECT TO FRE 408 & EQUIVALENTS 74 151 (1) #004A97 Annual Financial Forecast | Solid Wood Segment ($ in millions except per unit metrics) 98 168 2021A 2022A 2023A 2024A 2025A 2026E 2027E 2028E 2029E 2030E 2031E 220 Revenue $326 $443 $513 $524 $519 $610 $679 $756 $808 $844 $884 #62A8DC (-) Selling Expenses (40) (53) (75) (73) (70) (82) (87) (94) (99) (102) (106) Net Mill Realizations $286 $389 $438 $451 $448 $529 $593 $662 $709 $742 $778 1 (-) Fiber (126) (185) (232) (227) (268) (322) (312) (325) (343) (351) (360) (-) Chemicals – – – – – – – – – – – 95 (-) Energy (8) (18) (39) (28) (31) (25) (34) (38) (39) (40) (40) 0 (-) Labor (16) (22) (48) (55) (57) (63) (57) (62) (64) (64) (65) #015F00 (-) Maintenance (13) (24) (46) (46) (44) (39) (33) (35) (36) (36) (37) (-) Other Variable Costs (1) (6) (30) (36) (19) (46) (56) (64) (74) (83) (93) 0 (-) Other Fixed Costs (5) (8) (18) (25) (27) (22) (25) (27) (28) (28) (29) 37 (+/-) Change in Finished Goods 14 (5) (8) 6 6 7 (7) (1) 1 1 0 61 (+/-) Exchange Gain (Loss) 1 0 (0) 1 (1) 0 – – – – – #00253D Gross Profit $133 $122 $16 $41 $8 $19 $68 $110 $127 $141 $154 Gross Margin % 40.6% 27.5% 3.1% 7.9% 1.6% 3.1% 10.0% 14.5% 15.8% 16.7% 17.5% (-) SG&A (11) (20) (35) (33) (31) (34) (33) (33) (34) (34) (35) 145 Operating EBITDA $122 $102 ($19) $9 ($23) ($15) $35 $77 $94 $106 $120 26 Operating EBITDA Margin % 37.4% 23.0% (3.7%) 1.7% (4.4%) (2.4%) 5.1% 10.2% 11.6% 12.6% 13.5% 57 (+/-) Change in Net Working Capital (32) (17) 41 22 19 1 16 0 (7) (25) 1 #911A39 (-) Net Capital Expenditures (17) (35) (49) (42) (26) (9) (24) (11) (16) (16) (27) (2) (+/-) Other – (4) 1 (5) (6) (8) (11) (12) (14) (15) (18) 255 Unlevered Free Cash Flow $73 $46 ($26) ($16) ($36) ($32) $17 $55 $57 $50 $76 192 Sales Volume Metrics 0 Lumber (MMfbm) 420 410 501 470 465 453 523 565 567 562 561 #FFC000 Energy Sold ('000s MWh) 75 110 160 126 137 150 150 156 159 159 159 3 Manufactured Volume ('000s m ) 4 29 33 31 27 44 61 73 87 102 118 119 Pallets (mm units) – 3 11 10 9 8 8 8 8 8 8 119 Biofuels ('000s MT) – 50 145 184 136 151 140 123 123 123 123 119 #777777 192 192 192 #C0C0C0 Note: Solid Wood Segment comprised of Holz, Friesau (MTP), Torgau and Mercer Mass Timber (MMT) and does not reflect intercompany eliminations or adjustments Note: Reflects preliminary results for Q3 2026 which are subject to change (1) Numbers reflect financial contribution from acquired entities as of date of acquisition (2) Includes taxes, capital leases and changes due to foreign exchange 43
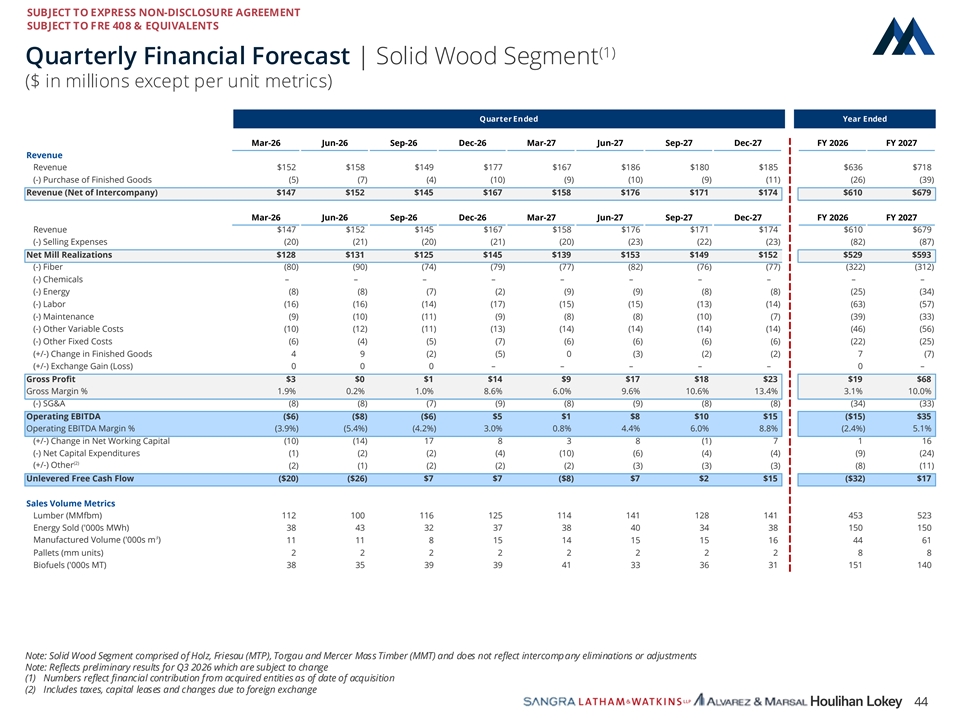
SUBJECT TO EXPRESS NON-DISCLOSURE AGREEMENT 0 SUBJECT TO FRE 408 & EQUIVALENTS 74 151 (1) #004A97 Quarterly Financial Forecast | Solid Wood Segment ($ in millions except per unit metrics) 98 168 220 Quarter Ended Year Ended #62A8DC Mar-26 Jun-26 Sep-26 Dec-26 Mar-27 Jun-27 Sep-27 Dec-27 FY 2026 FY 2027 Revenue 1 Revenue $152 $158 $149 $177 $167 $186 $180 $185 $636 $718 95 (-) Purchase of Finished Goods (5) (7) (4) (10) (9) (10) (9) (11) (26) (39) 0 Revenue (Net of Intercompany) $147 $152 $145 $167 $158 $176 $171 $174 $610 $679 #015F00 Mar-26 Jun-26 Sep-26 Dec-26 Mar-27 Jun-27 Sep-27 Dec-27 FY 2026 FY 2027 Revenue $147 $152 $145 $167 $158 $176 $171 $174 $610 $679 0 (-) Selling Expenses (20) (21) (20) (21) (20) (23) (22) (23) (82) (87) 37 Net Mill Realizations $128 $131 $125 $145 $139 $153 $149 $152 $529 $593 61 (-) Fiber (80) (90) (74) (79) (77) (82) (76) (77) (322) (312) (-) Chemicals – – – – – – – – – – #00253D (-) Energy (8) (8) (7) (2) (9) (9) (8) (8) (25) (34) (-) Labor (16) (16) (14) (17) (15) (15) (13) (14) (63) (57) 145 (-) Maintenance (9) (10) (11) (9) (8) (8) (10) (7) (39) (33) 26 (-) Other Variable Costs (10) (12) (11) (13) (14) (14) (14) (14) (46) (56) 57 (-) Other Fixed Costs (6) (4) (5) (7) (6) (6) (6) (6) (22) (25) (+/-) Change in Finished Goods 4 9 (2) (5) 0 (3) (2) (2) 7 (7) #911A39 (+/-) Exchange Gain (Loss) 0 0 0 – – – – – 0 – Gross Profit $3 $0 $1 $14 $9 $17 $18 $23 $19 $68 255 Gross Margin % 1.9% 0.2% 1.0% 8.6% 6.0% 9.6% 10.6% 13.4% 3.1% 10.0% 192 (-) SG&A (8) (8) (7) (9) (8) (9) (8) (8) (34) (33) 0 Operating EBITDA ($6) ($8) ($6) $5 $1 $8 $10 $15 ($15) $35 Operating EBITDA Margin % (3.9%) (5.4%) (4.2%) 3.0% 0.8% 4.4% 6.0% 8.8% (2.4%) 5.1% #FFC000 (+/-) Change in Net Working Capital (10) (14) 17 8 3 8 (1) 7 1 16 (-) Net Capital Expenditures (1) (2) (2) (4) (10) (6) (4) (4) (9) (24) 119 (2) (+/-) Other (2) (1) (2) (2) (2) (3) (3) (3) (8) (11) 119 Unlevered Free Cash Flow ($20) ($26) $7 $7 ($8) $7 $2 $15 ($32) $17 119 Sales Volume Metrics #777777 Lumber (MMfbm) 112 100 116 125 114 141 128 141 453 523 Energy Sold ('000s MWh) 38 43 32 37 38 40 34 38 150 150 192 3 Manufactured Volume ('000s m ) 11 11 8 15 14 15 15 16 44 61 192 Pallets (mm units) 2 2 2 2 2 2 2 2 8 8 192 Biofuels ('000s MT) 38 35 39 39 41 33 36 31 151 140 #C0C0C0 Note: Solid Wood Segment comprised of Holz, Friesau (MTP), Torgau and Mercer Mass Timber (MMT) and does not reflect intercompany eliminations or adjustments Note: Reflects preliminary results for Q3 2026 which are subject to change (1) Numbers reflect financial contribution from acquired entities as of date of acquisition (2) Includes taxes, capital leases and changes due to foreign exchange 44
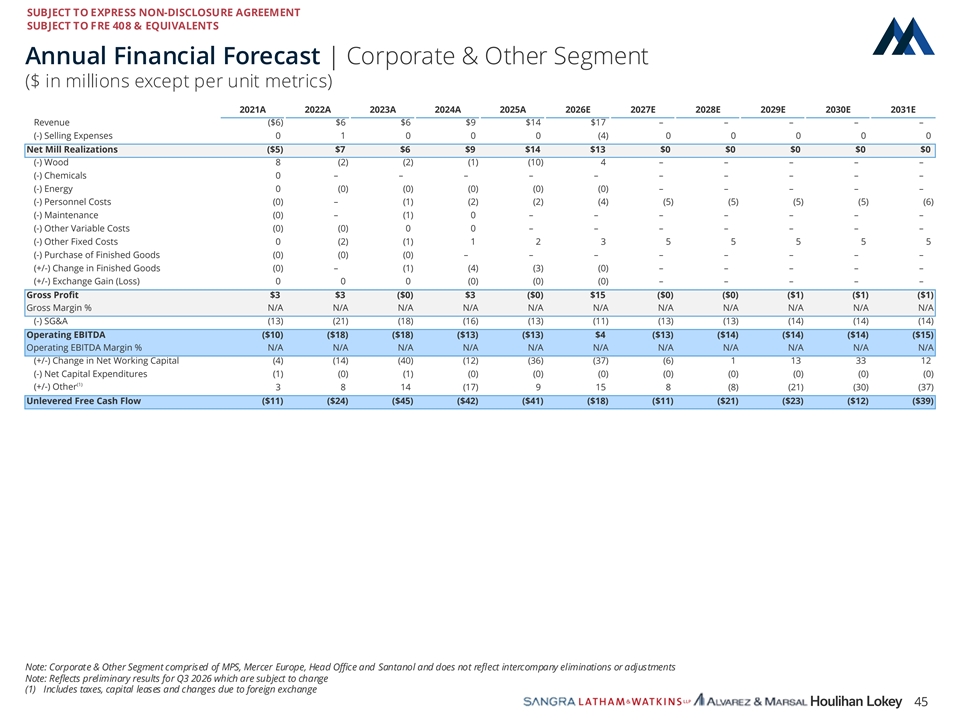
SUBJECT TO EXPRESS NON-DISCLOSURE AGREEMENT 0 SUBJECT TO FRE 408 & EQUIVALENTS 74 151 #004A97 Annual Financial Forecast | Corporate & Other Segment ($ in millions except per unit metrics) 98 168 2021A 2022A 2023A 2024A 2025A 2026E 2027E 2028E 2029E 2030E 2031E 220 Revenue ($6) $6 $6 $9 $14 $17 – – – – – #62A8DC (-) Selling Expenses 0 1 0 0 0 (4) 0 0 0 0 0 Net Mill Realizations ($5) $7 $6 $9 $14 $13 $0 $0 $0 $0 $0 1 (-) Wood 8 (2) (2) (1) (10) 4 – – – – – (-) Chemicals 0 – – – – – – – – – – 95 (-) Energy 0 (0) (0) (0) (0) (0) – – – – – 0 (-) Personnel Costs (0) – (1) (2) (2) (4) (5) (5) (5) (5) (6) #015F00 (-) Maintenance (0) – (1) 0 – – – – – – – (-) Other Variable Costs (0) (0) 0 0 – – – – – – – 0 (-) Other Fixed Costs 0 (2) (1) 1 2 3 5 5 5 5 5 37 (-) Purchase of Finished Goods (0) (0) (0) – – – – – – – – 61 (+/-) Change in Finished Goods (0) – (1) (4) (3) (0) – – – – – #00253D (+/-) Exchange Gain (Loss) 0 0 0 (0) (0) (0) – – – – – Gross Profit $3 $3 ($0) $3 ($0) $15 ($0) ($0) ($1) ($1) ($1) Gross Margin % N/A N/A N/A N/A N/A N/A N/A N/A N/A N/A N/A 145 (-) SG&A (13) (21) (18) (16) (13) (11) (13) (13) (14) (14) (14) 26 Operating EBITDA ($10) ($18) ($18) ($13) ($13) $4 ($13) ($14) ($14) ($14) ($15) 57 Operating EBITDA Margin % N/A N/A N/A N/A N/A N/A N/A N/A N/A N/A N/A #911A39 (+/-) Change in Net Working Capital (4) (14) (40) (12) (36) (37) (6) 1 13 33 12 (-) Net Capital Expenditures (1) (0) (1) (0) (0) (0) (0) (0) (0) (0) (0) (1) 255 (+/-) Other 3 8 14 (17) 9 15 8 (8) (21) (30) (37) 192 Unlevered Free Cash Flow ($11) ($24) ($45) ($42) ($41) ($18) ($11) ($21) ($23) ($12) ($39) 0 #FFC000 119 119 119 #777777 192 192 192 #C0C0C0 Note: Corporate & Other Segment comprised of MPS, Mercer Europe, Head Office and Santanol and does not reflect intercompany eliminations or adjustments Note: Reflects preliminary results for Q3 2026 which are subject to change (1) Includes taxes, capital leases and changes due to foreign exchange 45
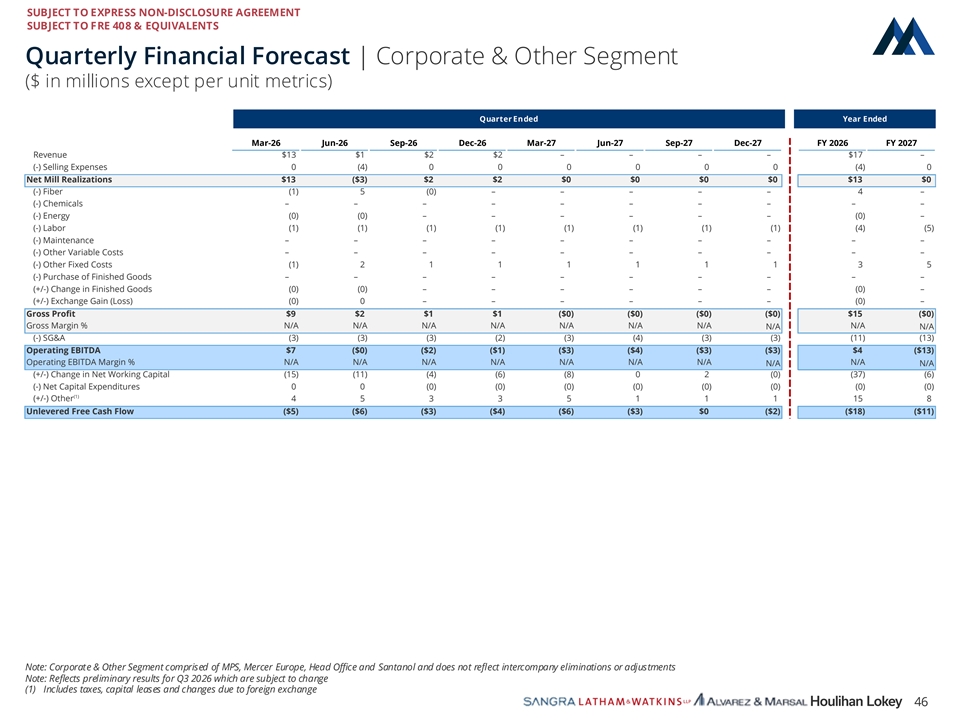
SUBJECT TO EXPRESS NON-DISCLOSURE AGREEMENT 0 SUBJECT TO FRE 408 & EQUIVALENTS 74 151 #004A97 Quarterly Financial Forecast | Corporate & Other Segment ($ in millions except per unit metrics) 98 168 220 Quarter Ended Year Ended #62A8DC Mar-26 Jun-26 Sep-26 Dec-26 Mar-27 Jun-27 Sep-27 Dec-27 FY 2026 FY 2027 Revenue $13 $1 $2 $2 – – – – $17 – 1 (-) Selling Expenses 0 (4) 0 0 0 0 0 0 (4) 0 95 Net Mill Realizations $13 ($3) $2 $2 $0 $0 $0 $0 $13 $0 0 (-) Fiber (1) 5 (0) – – – – – 4 – (-) Chemicals – – – – – – – – – – #015F00 (-) Energy (0) (0) – – – – – – (0) – (-) Labor (1) (1) (1) (1) (1) (1) (1) (1) (4) (5) 0 (-) Maintenance – – – – – – – – – – 37 (-) Other Variable Costs – – – – – – – – – – (-) Other Fixed Costs (1) 2 1 1 1 1 1 1 3 5 61 (-) Purchase of Finished Goods – – – – – – – – – – #00253D (+/-) Change in Finished Goods (0) (0) – – – – – – (0) – (+/-) Exchange Gain (Loss) (0) 0 – – – – – – (0) – 145 Gross Profit $9 $2 $1 $1 ($0) ($0) ($0) ($0) $15 ($0) 26 Gross Margin % N/A N/A N/A N/A N/A N/A N/A N/A N/A N/A (-) SG&A (3) (3) (3) (2) (3) (4) (3) (3) (11) (13) 57 Operating EBITDA $7 ($0) ($2) ($1) ($3) ($4) ($3) ($3) $4 ($13) #911A39 Operating EBITDA Margin % N/A N/A N/A N/A N/A N/A N/A N/A N/A N/A (+/-) Change in Net Working Capital (15) (11) (4) (6) (8) 0 2 (0) (37) (6) 255 (-) Net Capital Expenditures 0 0 (0) (0) (0) (0) (0) (0) (0) (0) (1) (+/-) Other 4 5 3 3 5 1 1 1 15 8 192 Unlevered Free Cash Flow ($5) ($6) ($3) ($4) ($6) ($3) $0 ($2) ($18) ($11) 0 #FFC000 119 119 119 #777777 192 192 192 #C0C0C0 Note: Corporate & Other Segment comprised of MPS, Mercer Europe, Head Office and Santanol and does not reflect intercompany eliminations or adjustments Note: Reflects preliminary results for Q3 2026 which are subject to change (1) Includes taxes, capital leases and changes due to foreign exchange 46
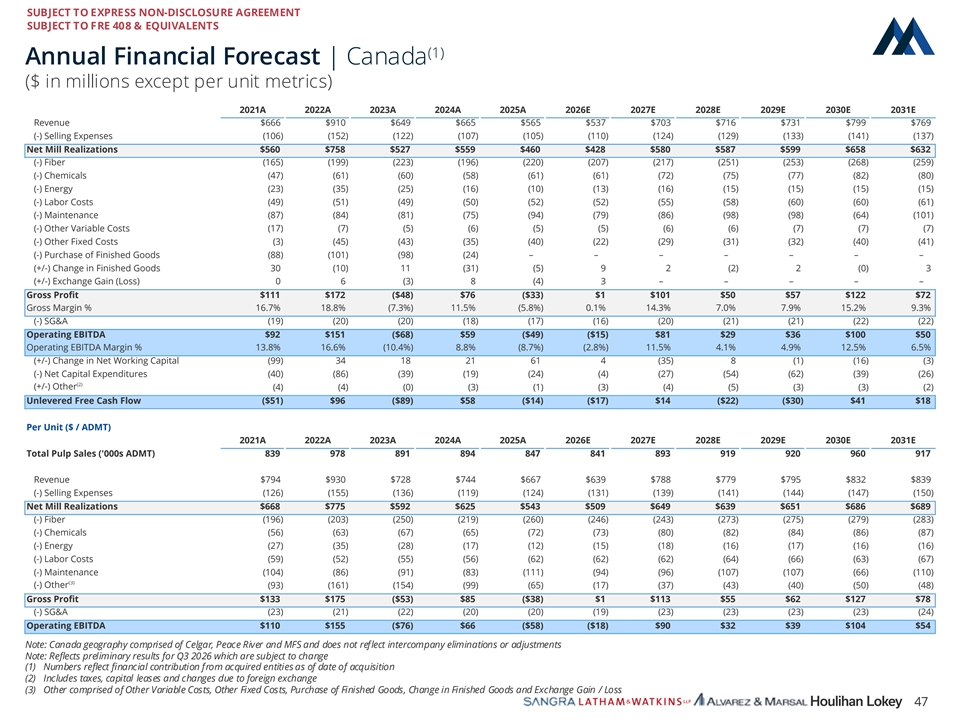
SUBJECT TO EXPRESS NON-DISCLOSURE AGREEMENT 0 SUBJECT TO FRE 408 & EQUIVALENTS 74 151 (1) #004A97 Annual Financial Forecast | Canada ($ in millions except per unit metrics) 98 168 2021A 2022A 2023A 2024A 2025A 2026E 2027E 2028E 2029E 2030E 2031E 220 Revenue $666 $910 $649 $665 $565 $537 $703 $716 $731 $799 $769 #62A8DC (-) Selling Expenses (106) (152) (122) (107) (105) (110) (124) (129) (133) (141) (137) Net Mill Realizations $560 $758 $527 $559 $460 $428 $580 $587 $599 $658 $632 1 (-) Fiber (165) (199) (223) (196) (220) (207) (217) (251) (253) (268) (259) (-) Chemicals (47) (61) (60) (58) (61) (61) (72) (75) (77) (82) (80) 95 (-) Energy (23) (35) (25) (16) (10) (13) (16) (15) (15) (15) (15) 0 (-) Labor Costs (49) (51) (49) (50) (52) (52) (55) (58) (60) (60) (61) #015F00 (-) Maintenance (87) (84) (81) (75) (94) (79) (86) (98) (98) (64) (101) (-) Other Variable Costs (17) (7) (5) (6) (5) (5) (6) (6) (7) (7) (7) 0 (-) Other Fixed Costs (3) (45) (43) (35) (40) (22) (29) (31) (32) (40) (41) 37 (-) Purchase of Finished Goods (88) (101) (98) (24) – – – – – – – 61 (+/-) Change in Finished Goods 30 (10) 11 (31) (5) 9 2 (2) 2 (0) 3 #00253D (+/-) Exchange Gain (Loss) 0 6 (3) 8 (4) 3 – – – – – Gross Profit $111 $172 ($48) $76 ($33) $1 $101 $50 $57 $122 $72 Gross Margin % 16.7% 18.8% (7.3%) 11.5% (5.8%) 0.1% 14.3% 7.0% 7.9% 15.2% 9.3% 145 (-) SG&A (19) (20) (20) (18) (17) (16) (20) (21) (21) (22) (22) 26 Operating EBITDA $92 $151 ($68) $59 ($49) ($15) $81 $29 $36 $100 $50 57 Operating EBITDA Margin % 13.8% 16.6% (10.4%) 8.8% (8.7%) (2.8%) 11.5% 4.1% 4.9% 12.5% 6.5% #911A39 (+/-) Change in Net Working Capital (99) 34 18 21 61 4 (35) 8 (1) (16) (3) (-) Net Capital Expenditures (40) (86) (39) (19) (24) (4) (27) (54) (62) (39) (26) (2) 255 (+/-) Other (4) (4) (0) (3) (1) (3) (4) (5) (3) (3) (2) 192 Unlevered Free Cash Flow ($51) $96 ($89) $58 ($14) ($17) $14 ($22) ($30) $41 $18 0 Per Unit ($ / ADMT) #FFC000 2021A 2022A 2023A 2024A 2025A 2026E 2027E 2028E 2029E 2030E 2031E Total Pulp Sales ('000s ADMT) 839 978 891 894 847 841 893 919 920 960 917 119 119 Revenue $794 $930 $728 $744 $667 $639 $788 $779 $795 $832 $839 119 (-) Selling Expenses (126) (155) (136) (119) (124) (131) (139) (141) (144) (147) (150) #777777 Net Mill Realizations $668 $775 $592 $625 $543 $509 $649 $639 $651 $686 $689 (-) Fiber (196) (203) (250) (219) (260) (246) (243) (273) (275) (279) (283) (-) Chemicals (56) (63) (67) (65) (72) (73) (80) (82) (84) (86) (87) 192 (-) Energy (27) (35) (28) (17) (12) (15) (18) (16) (17) (16) (16) 192 (-) Labor Costs (59) (52) (55) (56) (62) (62) (62) (64) (66) (63) (67) 192 (-) Maintenance (104) (86) (91) (83) (111) (94) (96) (107) (107) (66) (110) #C0C0C0 (3) (-) Other (93) (161) (154) (99) (65) (17) (37) (43) (40) (50) (48) Gross Profit $133 $175 ($53) $85 ($38) $1 $113 $55 $62 $127 $78 (-) SG&A (23) (21) (22) (20) (20) (19) (23) (23) (23) (23) (24) Operating EBITDA $110 $155 ($76) $66 ($58) ($18) $90 $32 $39 $104 $54 Note: Canada geography comprised of Celgar, Peace River and MFS and does not reflect intercompany eliminations or adjustments Note: Reflects preliminary results for Q3 2026 which are subject to change (1) Numbers reflect financial contribution from acquired entities as of date of acquisition (2) Includes taxes, capital leases and changes due to foreign exchange (3) Other comprised of Other Variable Costs, Other Fixed Costs, Purchase of Finished Goods, Change in Finished Goods and Exchange Gain / Loss 47
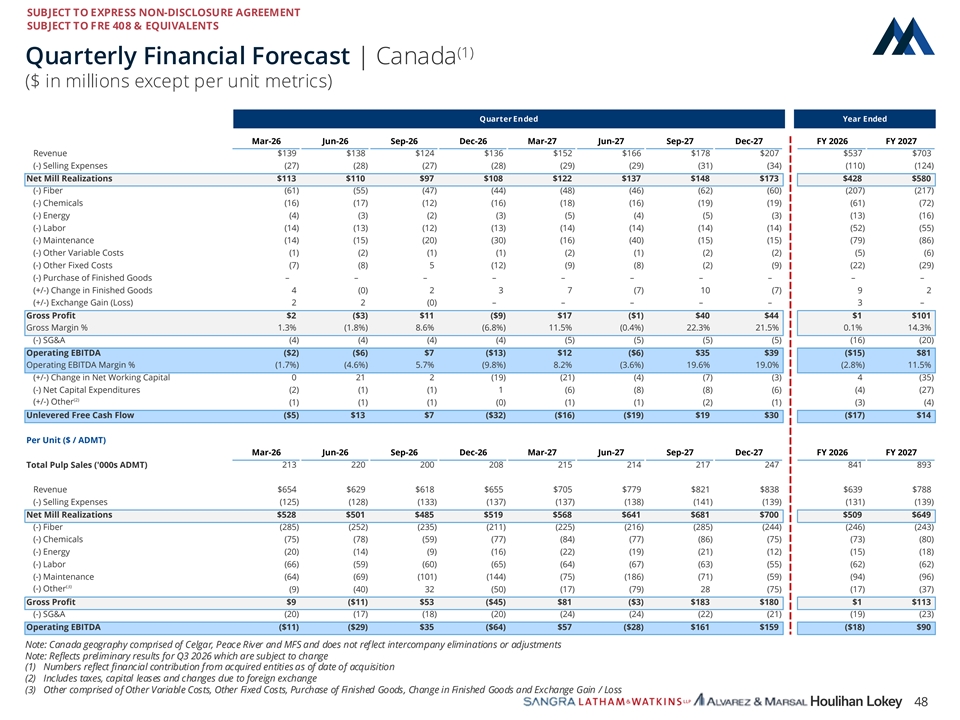
SUBJECT TO EXPRESS NON-DISCLOSURE AGREEMENT 0 SUBJECT TO FRE 408 & EQUIVALENTS 74 151 (1) #004A97 Quarterly Financial Forecast | Canada ($ in millions except per unit metrics) 98 168 220 Quarter Ended Year Ended #62A8DC Mar-26 Jun-26 Sep-26 Dec-26 Mar-27 Jun-27 Sep-27 Dec-27 FY 2026 FY 2027 Revenue $139 $138 $124 $136 $152 $166 $178 $207 $537 $703 1 (-) Selling Expenses (27) (28) (27) (28) (29) (29) (31) (34) (110) (124) 95 Net Mill Realizations $113 $110 $97 $108 $122 $137 $148 $173 $428 $580 (-) Fiber (61) (55) (47) (44) (48) (46) (62) (60) (207) (217) 0 (-) Chemicals (16) (17) (12) (16) (18) (16) (19) (19) (61) (72) #015F00 (-) Energy (4) (3) (2) (3) (5) (4) (5) (3) (13) (16) (-) Labor (14) (13) (12) (13) (14) (14) (14) (14) (52) (55) 0 (-) Maintenance (14) (15) (20) (30) (16) (40) (15) (15) (79) (86) 37 (-) Other Variable Costs (1) (2) (1) (1) (2) (1) (2) (2) (5) (6) (-) Other Fixed Costs (7) (8) 5 (12) (9) (8) (2) (9) (22) (29) 61 (-) Purchase of Finished Goods – – – – – – – – – – #00253D (+/-) Change in Finished Goods 4 (0) 2 3 7 (7) 10 (7) 9 2 (+/-) Exchange Gain (Loss) 2 2 (0) – – – – – 3 – 145 Gross Profit $2 ($3) $11 ($9) $17 ($1) $40 $44 $1 $101 26 Gross Margin % 1.3% (1.8%) 8.6% (6.8%) 11.5% (0.4%) 22.3% 21.5% 0.1% 14.3% (-) SG&A (4) (4) (4) (4) (5) (5) (5) (5) (16) (20) 57 Operating EBITDA ($2) ($6) $7 ($13) $12 ($6) $35 $39 ($15) $81 #911A39 Operating EBITDA Margin % (1.7%) (4.6%) 5.7% (9.8%) 8.2% (3.6%) 19.6% 19.0% (2.8%) 11.5% (+/-) Change in Net Working Capital 0 21 2 (19) (21) (4) (7) (3) 4 (35) 255 (-) Net Capital Expenditures (2) (1) (1) 1 (6) (8) (8) (6) (4) (27) (2) 192 (+/-) Other (1) (1) (1) (0) (1) (1) (2) (1) (3) (4) 0 Unlevered Free Cash Flow ($5) $13 $7 ($32) ($16) ($19) $19 $30 ($17) $14 #FFC000 Per Unit ($ / ADMT) Mar-26 Jun-26 Sep-26 Dec-26 Mar-27 Jun-27 Sep-27 Dec-27 FY 2026 FY 2027 119 Total Pulp Sales ('000s ADMT) 213 220 200 208 215 214 217 247 841 893 119 119 Revenue $654 $629 $618 $655 $705 $779 $821 $838 $639 $788 (-) Selling Expenses (125) (128) (133) (137) (137) (138) (141) (139) (131) (139) #777777 Net Mill Realizations $528 $501 $485 $519 $568 $641 $681 $700 $509 $649 (-) Fiber (285) (252) (235) (211) (225) (216) (285) (244) (246) (243) 192 (-) Chemicals (75) (78) (59) (77) (84) (77) (86) (75) (73) (80) 192 (-) Energy (20) (14) (9) (16) (22) (19) (21) (12) (15) (18) 192 (-) Labor (66) (59) (60) (65) (64) (67) (63) (55) (62) (62) (-) Maintenance (64) (69) (101) (144) (75) (186) (71) (59) (94) (96) #C0C0C0 (3) (-) Other (9) (40) 32 (50) (17) (79) 28 (75) (17) (37) Gross Profit $9 ($11) $53 ($45) $81 ($3) $183 $180 $1 $113 (-) SG&A (20) (17) (18) (20) (24) (24) (22) (21) (19) (23) Operating EBITDA ($11) ($29) $35 ($64) $57 ($28) $161 $159 ($18) $90 Note: Canada geography comprised of Celgar, Peace River and MFS and does not reflect intercompany eliminations or adjustments Note: Reflects preliminary results for Q3 2026 which are subject to change (1) Numbers reflect financial contribution from acquired entities as of date of acquisition (2) Includes taxes, capital leases and changes due to foreign exchange (3) Other comprised of Other Variable Costs, Other Fixed Costs, Purchase of Finished Goods, Change in Finished Goods and Exchange Gain / Loss 48
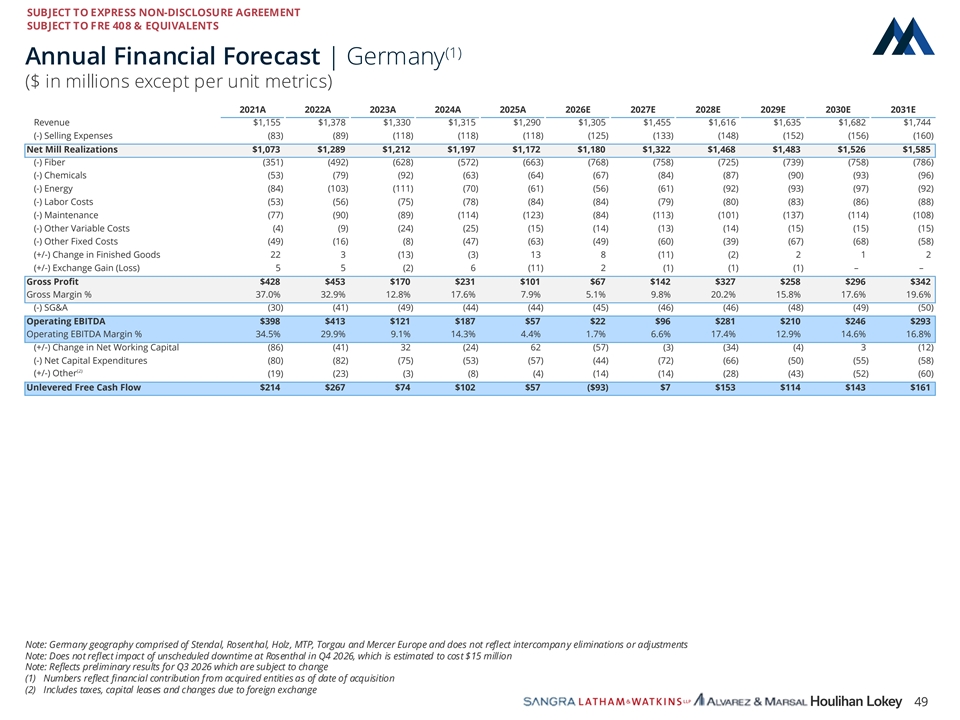
SUBJECT TO EXPRESS NON-DISCLOSURE AGREEMENT 0 SUBJECT TO FRE 408 & EQUIVALENTS 74 151 (1) #004A97 Annual Financial Forecast | Germany ($ in millions except per unit metrics) 98 168 2021A 2022A 2023A 2024A 2025A 2026E 2027E 2028E 2029E 2030E 2031E 220 Revenue $1,155 $1,378 $1,330 $1,315 $1,290 $1,305 $1,455 $1,616 $1,635 $1,682 $1,744 #62A8DC (-) Selling Expenses (83) (89) (118) (118) (118) (125) (133) (148) (152) (156) (160) Net Mill Realizations $1,073 $1,289 $1,212 $1,197 $1,172 $1,180 $1,322 $1,468 $1,483 $1,526 $1,585 1 (-) Fiber (351) (492) (628) (572) (663) (768) (758) (725) (739) (758) (786) (-) Chemicals (53) (79) (92) (63) (64) (67) (84) (87) (90) (93) (96) 95 (-) Energy (84) (103) (111) (70) (61) (56) (61) (92) (93) (97) (92) 0 (-) Labor Costs (53) (56) (75) (78) (84) (84) (79) (80) (83) (86) (88) #015F00 (-) Maintenance (77) (90) (89) (114) (123) (84) (113) (101) (137) (114) (108) (-) Other Variable Costs (4) (9) (24) (25) (15) (14) (13) (14) (15) (15) (15) 0 (-) Other Fixed Costs (49) (16) (8) (47) (63) (49) (60) (39) (67) (68) (58) 37 (+/-) Change in Finished Goods 22 3 (13) (3) 13 8 (11) (2) 2 1 2 61 (+/-) Exchange Gain (Loss) 5 5 (2) 6 (11) 2 (1) (1) (1) – – #00253D Gross Profit $428 $453 $170 $231 $101 $67 $142 $327 $258 $296 $342 Gross Margin % 37.0% 32.9% 12.8% 17.6% 7.9% 5.1% 9.8% 20.2% 15.8% 17.6% 19.6% (-) SG&A (30) (41) (49) (44) (44) (45) (46) (46) (48) (49) (50) 145 Operating EBITDA $398 $413 $121 $187 $57 $22 $96 $281 $210 $246 $293 26 Operating EBITDA Margin % 34.5% 29.9% 9.1% 14.3% 4.4% 1.7% 6.6% 17.4% 12.9% 14.6% 16.8% 57 (+/-) Change in Net Working Capital (86) (41) 32 (24) 62 (57) (3) (34) (4) 3 (12) #911A39 (-) Net Capital Expenditures (80) (82) (75) (53) (57) (44) (72) (66) (50) (55) (58) (2) (+/-) Other (19) (23) (3) (8) (4) (14) (14) (28) (43) (52) (60) 255 Unlevered Free Cash Flow $214 $267 $74 $102 $57 ($93) $7 $153 $114 $143 $161 192 0 #FFC000 119 119 119 #777777 192 192 192 #C0C0C0 Note: Germany geography comprised of Stendal, Rosenthal, Holz, MTP, Torgau and Mercer Europe and does not reflect intercompany eliminations or adjustments Note: Does not reflect impact of unscheduled downtime at Rosenthal in Q4 2026, which is estimated to cost $15 million Note: Reflects preliminary results for Q3 2026 which are subject to change (1) Numbers reflect financial contribution from acquired entities as of date of acquisition (2) Includes taxes, capital leases and changes due to foreign exchange 49
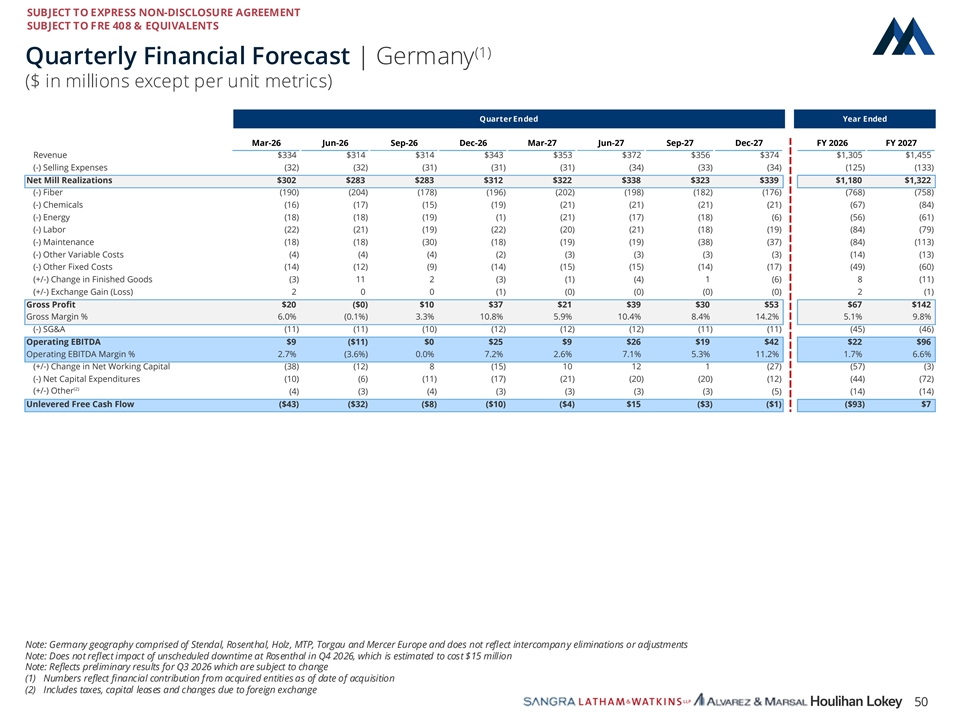
SUBJECT TO EXPRESS NON-DISCLOSURE AGREEMENT 0 SUBJECT TO FRE 408 & EQUIVALENTS 74 151 (1) #004A97 Quarterly Financial Forecast | Germany ($ in millions except per unit metrics) 98 168 220 Quarter Ended Year Ended #62A8DC Mar-26 Jun-26 Sep-26 Dec-26 Mar-27 Jun-27 Sep-27 Dec-27 FY 2026 FY 2027 Revenue $334 $314 $314 $343 $353 $372 $356 $374 $1,305 $1,455 1 (-) Selling Expenses (32) (32) (31) (31) (31) (34) (33) (34) (125) (133) 95 Net Mill Realizations $302 $283 $283 $312 $322 $338 $323 $339 $1,180 $1,322 0 (-) Fiber (190) (204) (178) (196) (202) (198) (182) (176) (768) (758) (-) Chemicals (16) (17) (15) (19) (21) (21) (21) (21) (67) (84) #015F00 (-) Energy (18) (18) (19) (1) (21) (17) (18) (6) (56) (61) (-) Labor (22) (21) (19) (22) (20) (21) (18) (19) (84) (79) 0 (-) Maintenance (18) (18) (30) (18) (19) (19) (38) (37) (84) (113) 37 (-) Other Variable Costs (4) (4) (4) (2) (3) (3) (3) (3) (14) (13) 61 (-) Other Fixed Costs (14) (12) (9) (14) (15) (15) (14) (17) (49) (60) (+/-) Change in Finished Goods (3) 11 2 (3) (1) (4) 1 (6) 8 (11) #00253D (+/-) Exchange Gain (Loss) 2 0 0 (1) (0) (0) (0) (0) 2 (1) Gross Profit $20 ($0) $10 $37 $21 $39 $30 $53 $67 $142 145 Gross Margin % 6.0% (0.1%) 3.3% 10.8% 5.9% 10.4% 8.4% 14.2% 5.1% 9.8% 26 (-) SG&A (11) (11) (10) (12) (12) (12) (11) (11) (45) (46) 57 Operating EBITDA $9 ($11) $0 $25 $9 $26 $19 $42 $22 $96 Operating EBITDA Margin % 2.7% (3.6%) 0.0% 7.2% 2.6% 7.1% 5.3% 11.2% 1.7% 6.6% #911A39 (+/-) Change in Net Working Capital (38) (12) 8 (15) 10 12 1 (27) (57) (3) (-) Net Capital Expenditures (10) (6) (11) (17) (21) (20) (20) (12) (44) (72) 255 (2) (+/-) Other (4) (3) (4) (3) (3) (3) (3) (5) (14) (14) 192 Unlevered Free Cash Flow ($43) ($32) ($8) ($10) ($4) $15 ($3) ($1) ($93) $7 0 #FFC000 119 119 119 #777777 192 192 192 #C0C0C0 Note: Germany geography comprised of Stendal, Rosenthal, Holz, MTP, Torgau and Mercer Europe and does not reflect intercompany eliminations or adjustments Note: Does not reflect impact of unscheduled downtime at Rosenthal in Q4 2026, which is estimated to cost $15 million Note: Reflects preliminary results for Q3 2026 which are subject to change (1) Numbers reflect financial contribution from acquired entities as of date of acquisition (2) Includes taxes, capital leases and changes due to foreign exchange 50
04 Appendix Capital Structure (September 30, 2026)
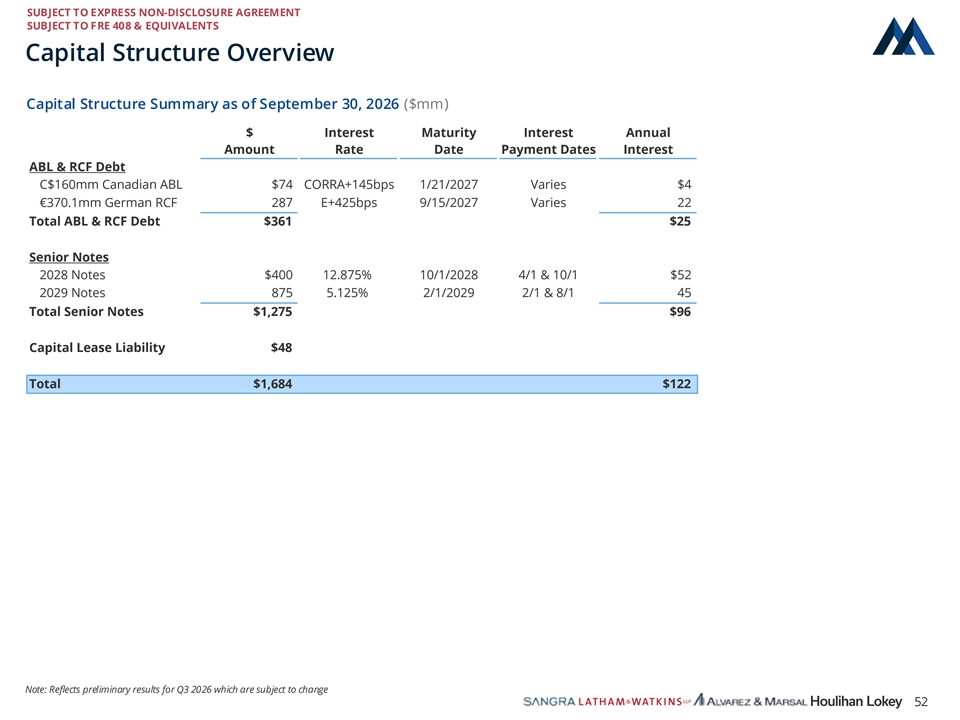
SUBJECT TO EXPRESS NON-DISCLOSURE AGREEMENT 0 SUBJECT TO FRE 408 & EQUIVALENTS 74 151 #004A97 Capital Structure Overview 98 168 Capital Structure Summary as of September 30, 2026 ($mm) 220 #62A8DC $ Interest Maturity Interest Annual Amount Rate Date Payment Dates Interest 1 ABL & RCF Debt 95 C$160mm Canadian ABL $74 CORRA+145bps 1/21/2027 Varies $4 0 €370.1mm German RCF 287 E+425bps 9/15/2027 Varies 22 #015F00 Total ABL & RCF Debt $361 $25 0 37 Senior Notes 61 2028 Notes $400 12.875% 10/1/2028 4/1 & 10/1 $52 #00253D 2029 Notes 875 5.125% 2/1/2029 2/1 & 8/1 45 145 Total Senior Notes $1,275 $96 26 57 Capital Lease Liability $48 #911A39 Total $1,684 $122 255 192 0 #FFC000 119 119 119 #777777 192 192 192 #C0C0C0 Note: Reflects preliminary results for Q3 2026 which are subject to change 52
04 Appendix German RCF Waiver Term Sheet
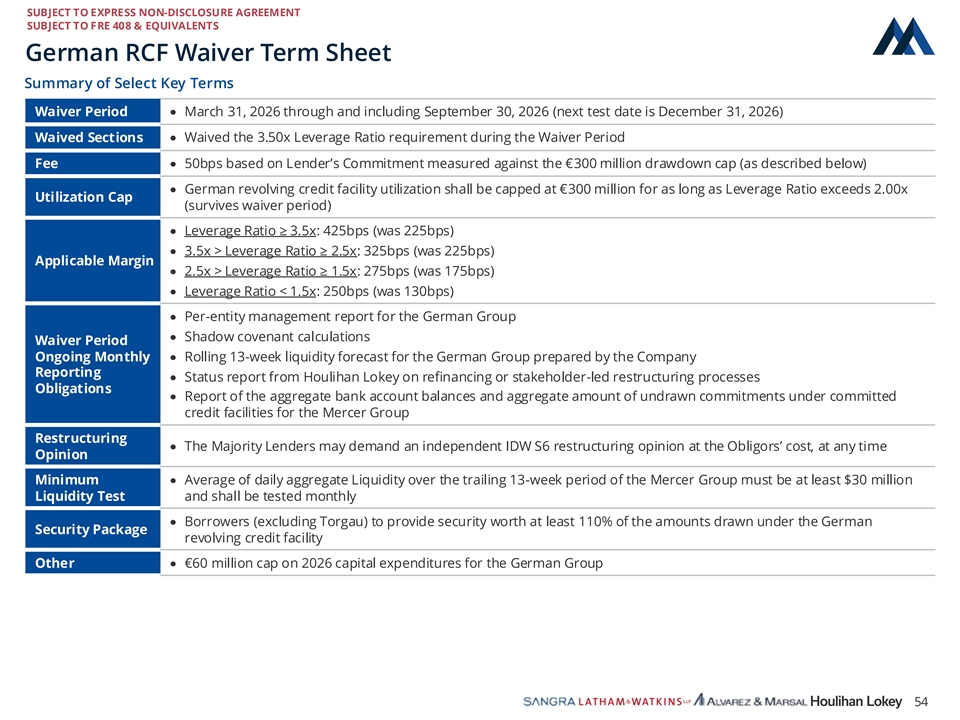
SUBJECT TO EXPRESS NON-DISCLOSURE AGREEMENT 0 SUBJECT TO FRE 408 & EQUIVALENTS 74 151 #004A97 German RCF Waiver Term Sheet Summary of Select Key Terms 98 168 Waiver Period · March 31, 2026 through and including September 30, 2026 (next test date is December 31, 2026) 220 #62A8DC Waived Sections · Waived the 3.50x Leverage Ratio requirement during the Waiver Period 1 Fee · 50bps based on Lender’s Commitment measured against the €300 million drawdown cap (as described below) 95 · German revolving credit facility utilization shall be capped at €300 million for as long as Leverage Ratio exceeds 2.00x 0 Utilization Cap #015F00 (survives waiver period) · Leverage Ratio ≥ 3.5x: 425bps (was 225bps) 0 37 · 3.5x > Leverage Ratio ≥ 2.5x: 325bps (was 225bps) Applicable Margin 61 · 2.5x > Leverage Ratio ≥ 1.5x: 275bps (was 175bps) #00253D · Leverage Ratio < 1.5x: 250bps (was 130bps) 145 · Per-entity management report for the German Group 26 · Shadow covenant calculations 57 Waiver Period #911A39 Ongoing Monthly · Rolling 13-week liquidity forecast for the German Group prepared by the Company Reporting · Status report from Houlihan Lokey on refinancing or stakeholder-led restructuring processes 255 Obligations · Report of the aggregate bank account balances and aggregate amount of undrawn commitments under committed 192 credit facilities for the Mercer Group 0 #FFC000 Restructuring · The Majority Lenders may demand an independent IDW S6 restructuring opinion at the Obligors’ cost, at any time Opinion 119 119 Minimum · Average of daily aggregate Liquidity over the trailing 13-week period of the Mercer Group must be at least $30 million 119 Liquidity Test and shall be tested monthly #777777 · Borrowers (excluding Torgau) to provide security worth at least 110% of the amounts drawn under the German Security Package 192 revolving credit facility 192 192 Other · €60 million cap on 2026 capital expenditures for the German Group #C0C0C0 54
04 Appendix Simplified Legal Entity Chart
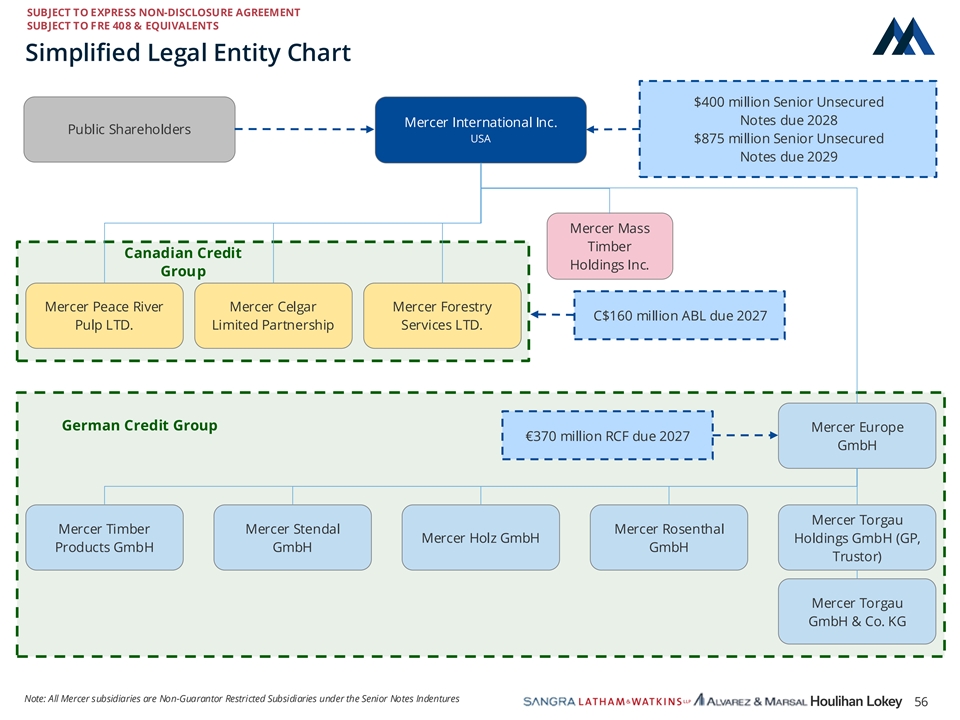
SUBJECT TO EXPRESS NON-DISCLOSURE AGREEMENT 0 SUBJECT TO FRE 408 & EQUIVALENTS 74 151 #004A97 Simplified Legal Entity Chart 98 168 $400 million Senior Unsecured 220 Notes due 2028 Mercer International Inc. #62A8DC Public Shareholders USA $875 million Senior Unsecured Notes due 2029 1 95 0 #015F00 Mercer Mass 0 Timber 37 Canadian Credit 61 Holdings Inc. Group #00253D Mercer Peace River Mercer Celgar Mercer Forestry 145 C$160 million ABL due 2027 26 Pulp LTD. Limited Partnership Services LTD. 57 #911A39 255 192 0 German Credit Group Mercer Europe #FFC000 €370 million RCF due 2027 GmbH 119 119 119 #777777 Mercer Torgau Mercer Timber Mercer Stendal Mercer Rosenthal 192 Mercer Holz GmbH Holdings GmbH (GP, Products GmbH GmbH GmbH 192 Trustor) 192 #C0C0C0 Mercer Torgau GmbH & Co. KG Note: All Mercer subsidiaries are Non-Guarantor Restricted Subsidiaries under the Senior Notes Indentures 56
CORPORATE FINANCE | FINANCIAL RESTRUCTURING | FINANCIAL AND VALUATION ADVISORY | HL.COM