Shareholder Report
|
12 Months Ended |
|
Aug. 31, 2026
USD ($)
Holding
|
Aug. 31, 2025 |
| Shareholder Report [Line Items] |
|
|
|
| Document Type |
|
N-CSR
|
|
| Amendment Flag |
|
false
|
|
| Registrant Name |
|
Vanguard
World Fund
|
|
| Entity Central Index Key |
|
0000052848
|
|
| Entity Investment Company Type |
|
N-1A
|
|
| Document Period End Date |
|
Aug. 31, 2026
|
|
| Shareholder Report Annual or Semi-Annual |
|
Annual Shareholder Report
|
|
| C000209798 |
|
|
|
| Shareholder Report [Line Items] |
|
|
|
| Fund Name |
|
FTSE Social Index Fund
|
|
| Class Name |
|
Admiral™ Shares
|
|
| Trading Symbol |
|
VFTAX
|
|
| Annual or Semi-Annual Statement [Text Block] |
|
This annual shareholder report contains important information about Vanguard FTSE Social Index Fund (the "Fund") for the period of September 1, 2025, to August 31, 2026.
|
|
| Additional Information [Text Block] |
|
You can find additional information about the Fund at https://personal1.vanguard.com/ngf-next-gen-form-webapp/fund-literature. You can also request this information by contacting us at 800-662-7447.
|
|
| Material Fund Change Notice [Text Block] |
|
The report describes changes to the Fund that occurred during the reporting period.
|
|
| Additional Information Phone Number |
|
<span style="white-space: nowrap; box-sizing: border-box; color: rgb(0, 0, 0); display: inline; flex-wrap: nowrap; font-size: 10.6667px; font-weight: 400; grid-area: auto; line-height: 16px; margin: 0px; overflow: visible; text-align: left; text-align-last: auto;"> 800-662-7447</span>
|
|
| Additional Information Website |
|
<span style="white-space: nowrap; box-sizing: border-box; color: rgb(0, 0, 0); display: inline; flex-wrap: nowrap; font-size: 10.6667px; font-weight: 400; grid-area: auto; line-height: 16px; margin: 0px; overflow: visible; text-align: left; text-align-last: auto;"> <span style="box-sizing: border-box; color: rgb(0, 0, 0); display: inline; flex-wrap: nowrap; font-size: 10.6667px; font-weight: 400; grid-area: auto; line-height: 16px; margin: 0px; overflow: visible; text-align: left; text-align-last: auto; white-space-collapse: collapse;"><span style="text-decoration: underline; box-sizing: border-box; color: rgb(0, 0, 0); display: inline; flex-wrap: nowrap; font-size: 10.6667px; font-weight: 400; grid-area: auto; line-height: 16px; margin: 0px; overflow: visible; text-align: left; text-align-last: auto; white-space-collapse: collapse;">https://personal1.vanguard.com/ngf-next-gen-form-webapp/fund-literature</span></span></span>
|
|
| Expenses [Text Block] |
|
What were the Fund costs for the last year?(based on a hypothetical $10,000 investment) Table SummaryShare Class Name | Costs of a $10,000 investment | Costs paid as a percentage of a $10,000 investment |
|---|
Admiral Shares | $13 | 0.12% |
|---|
|
|
| Expenses Paid, Amount |
|
$ 13
|
|
| Expense Ratio, Percent |
|
0.12%
|
|
| Factors Affecting Performance [Text Block] |
|
How did the Fund perform during the reporting period? For the 12 months ended August 31, 2026, the Fund slightly underperformed its benchmark. Global equities posted strong returns, while global bonds struggled. Resilient growth and corporate earnings supported stocks, though shifting U.S. trade policy, persistent inflation, and Middle East tensions that disrupted energy supplies and raised oil prices fueled volatility. Some central banks, including those in the United States and the United Kingdom, lowered rates. However, developed-market government bond yields generally rose amid concerns about borrowing, inflation, and monetary policy. Nine of the benchmark’s 11 industry sectors recorded positive returns for the 12 months. Technology contributed the most to the benchmark’s return, followed by health care and financials. Utilities and consumer discretionary, the two sectors that posted negative returns, detracted slightly.
|
|
| Performance Past Does Not Indicate Future [Text] |
|
Keep in mind that the Fund's past performance does not indicate how the Fund will perform in the future.
|
|
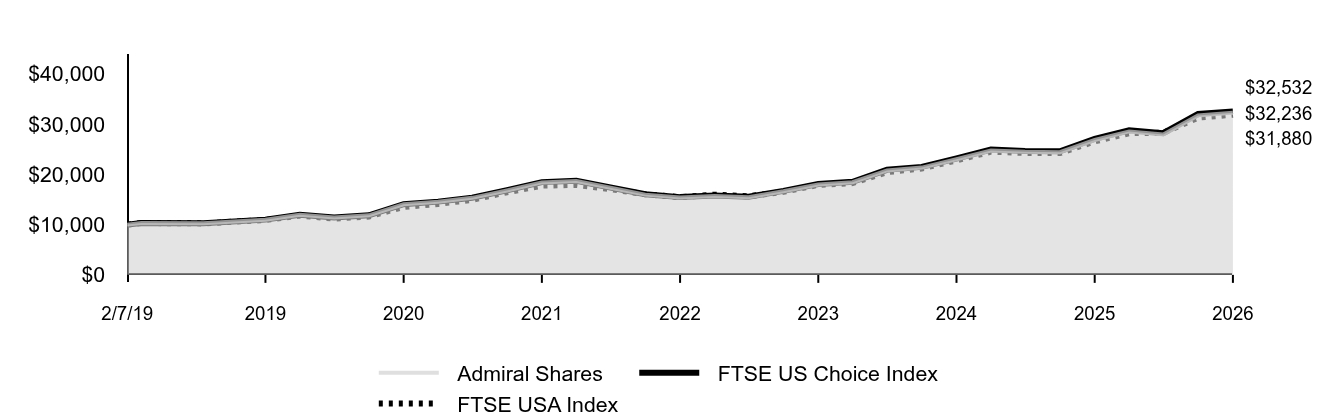
| Line Graph [Table Text Block] |
|
Table Summary | Admiral Shares | FTSE US Choice Index | FTSE USA Index |
|---|
2/7/19 | $10,000 | $10,000 | $10,000 |
|---|
2/28/19 | $10,300 | $10,302 | $10,316 |
|---|
5/31/19 | $10,254 | $10,258 | $10,241 |
|---|
8/31/19 | $10,985 | $10,991 | $10,929 |
|---|
11/30/19 | $11,962 | $11,975 | $11,802 |
|---|
2/29/20 | $11,404 | $11,420 | $11,188 |
|---|
5/31/20 | $11,849 | $11,865 | $11,617 |
|---|
8/31/20 | $14,041 | $14,066 | $13,527 |
|---|
11/30/20 | $14,545 | $14,574 | $14,119 |
|---|
2/28/21 | $15,325 | $15,358 | $14,932 |
|---|
5/31/21 | $16,793 | $16,835 | $16,433 |
|---|
8/31/21 | $18,400 | $18,457 | $17,758 |
|---|
11/30/21 | $18,654 | $18,718 | $17,903 |
|---|
2/28/22 | $17,336 | $17,398 | $17,066 |
|---|
5/31/22 | $15,967 | $16,031 | $16,045 |
|---|
8/31/22 | $15,404 | $15,472 | $15,451 |
|---|
11/30/22 | $15,698 | $15,772 | $15,962 |
|---|
2/28/23 | $15,466 | $15,540 | $15,635 |
|---|
5/31/23 | $16,631 | $16,718 | $16,519 |
|---|
8/31/23 | $17,982 | $18,083 | $17,903 |
|---|
11/30/23 | $18,432 | $18,536 | $18,255 |
|---|
2/29/24 | $20,781 | $20,905 | $20,443 |
|---|
5/31/24 | $21,351 | $21,484 | $21,176 |
|---|
8/31/24 | $23,002 | $23,153 | $22,785 |
|---|
11/30/24 | $24,752 | $24,926 | $24,509 |
|---|
2/28/25 | $24,492 | $24,671 | $24,257 |
|---|
5/31/25 | $24,402 | $24,591 | $24,226 |
|---|
8/31/25 | $26,837 | $27,052 | $26,554 |
|---|
11/30/25 | $28,543 | $28,783 | $28,195 |
|---|
2/28/26 | $27,952 | $28,194 | $28,269 |
|---|
5/31/26 | $31,725 | $32,008 | $31,286 |
|---|
8/31/26 | $32,236 | $32,532 | $31,880 |
|---|
|
|
| Average Annual Return [Table Text Block] |
|
Table Summary | 1 Year | 5 Years | Since Inception 2/7/19 |
|---|
Admiral Shares | 20.12% | 11.87% | 16.74% |
|---|
FTSE US Choice Index | 20.25% | 12.00% | 16.88% |
|---|
FTSE USA Index | 20.06% | 12.42% | 16.57% |
|---|
|
|
| Performance Inception Date |
|
Feb. 07, 2019
|
|
| No Deduction of Taxes [Text Block] |
|
The graph and returns shown do not reflect taxes that a shareholder would pay on fund distributions or on the sale of fund shares.
|
|
| Material Change Date |
|
|
Aug. 31, 2025
|
| Updated Performance Information Location [Text Block] |
|
Updated performance information is available on our website at vanguard.com/performance or by calling Vanguard toll-free at 800-662-7447.
|
|
| AssetsNet |
|
$ 29,233,000,000
|
|
| Holdings Count | Holding |
|
390
|
|
| Advisory Fees Paid, Amount |
|
$ 217,000
|
|
| InvestmentCompanyPortfolioTurnover |
|
7.00%
|
|
| Additional Fund Statistics [Text Block] |
|
Fund Statistics
(as of August 31, 2026)Table SummaryFund Net Assets (in millions) | $29,233 |
|---|
Number of Portfolio Holdings | 390 |
|---|
Portfolio Turnover Rate | 7% |
|---|
Total Investment Advisory Fees (in thousands) | $217 |
|---|
|
|
| Holdings [Text Block] |
|
Portfolio Composition % of Net Assets
(as of August 31, 2026)Table SummaryBasic Materials | 1.4% |
|---|
Consumer Discretionary | 13.8% |
|---|
Consumer Staples | 3.4% |
|---|
Energy | 0.0% |
|---|
Financials | 9.4% |
|---|
Health Care | 9.4% |
|---|
Industrials | 6.3% |
|---|
Real Estate | 2.0% |
|---|
Technology | 51.2% |
|---|
Telecommunications | 2.5% |
|---|
Utilities | 0.3% |
|---|
Other Assets and Liabilities—Net | 0.3% |
|---|
This table reflects the Fund's investments, including short-term investments, derivatives and other assets and liabilities. |
|
| Material Fund Change [Text Block] |
|
How has the Fund changed?During the reporting period, the expense ratio for the Admiral Share class of the Fund was reduced. This is a summary of certain changes to the Fund since August 31, 2025. For more complete information, you may review the Fund’s next prospectus, which we expect to be available by December 31, 2026, at https://personal1.vanguard.com/ngf-next-gen-form-webapp/fund-literature or upon request at 800-662-7447. |
|
| Material Fund Change Expenses [Text Block] |
|
During the reporting period, the expense ratio for the Admiral Share class of the Fund was reduced.
|
|
| Summary of Change Legend [Text Block] |
|
This is a summary of certain changes to the Fund since August 31, 2025. For more complete information, you may review the Fund’s next prospectus, which we expect to be available by December 31, 2026, at https://personal1.vanguard.com/ngf-next-gen-form-webapp/fund-literature or upon request at 800-662-7447.
|
|
| Updated Prospectus Phone Number |
|
800-662-7447
|
|
| Updated Prospectus Web Address |
|
https://personal1.vanguard.com/ngf-next-gen-form-webapp/fund-literature
|
|
| C000012204 |
|
|
|
| Shareholder Report [Line Items] |
|
|
|
| Fund Name |
|
FTSE Social Index Fund
|
|
| Class Name |
|
Institutional Shares
|
|
| Trading Symbol |
|
VFTNX
|
|
| Annual or Semi-Annual Statement [Text Block] |
|
This annual shareholder report contains important information about Vanguard FTSE Social Index Fund (the "Fund") for the period of September 1, 2025, to August 31, 2026.
|
|
| Additional Information [Text Block] |
|
You can find additional information about the Fund at https://personal1.vanguard.com/ngf-next-gen-form-webapp/fund-literature. You can also request this information by contacting us at 800-662-7447.
|
|
| Material Fund Change Notice [Text Block] |
|
The report describes changes to the Fund that occurred during the reporting period.
|
|
| Additional Information Phone Number |
|
<span style="white-space: nowrap; box-sizing: border-box; color: rgb(0, 0, 0); display: inline; flex-wrap: nowrap; font-size: 10.6667px; font-weight: 400; grid-area: auto; line-height: 16px; margin: 0px; overflow: visible; text-align: left; text-align-last: auto;"> 800-662-7447</span>
|
|
| Additional Information Website |
|
<span style="white-space: nowrap; box-sizing: border-box; color: rgb(0, 0, 0); display: inline; flex-wrap: nowrap; font-size: 10.6667px; font-weight: 400; grid-area: auto; line-height: 16px; margin: 0px; overflow: visible; text-align: left; text-align-last: auto;"> <span style="box-sizing: border-box; color: rgb(0, 0, 0); display: inline; flex-wrap: nowrap; font-size: 10.6667px; font-weight: 400; grid-area: auto; line-height: 16px; margin: 0px; overflow: visible; text-align: left; text-align-last: auto; white-space-collapse: collapse;"><span style="text-decoration: underline; box-sizing: border-box; color: rgb(0, 0, 0); display: inline; flex-wrap: nowrap; font-size: 10.6667px; font-weight: 400; grid-area: auto; line-height: 16px; margin: 0px; overflow: visible; text-align: left; text-align-last: auto; white-space-collapse: collapse;">https://personal1.vanguard.com/ngf-next-gen-form-webapp/fund-literature</span></span></span>
|
|
| Expenses [Text Block] |
|
What were the Fund costs for the last year?(based on a hypothetical $10,000 investment) Table SummaryShare Class Name | Costs of a $10,000 investment | Costs paid as a percentage of a $10,000 investment |
|---|
Institutional Shares | $6 | 0.05% |
|---|
|
|
| Expenses Paid, Amount |
|
$ 6
|
|
| Expense Ratio, Percent |
|
0.05%
|
|
| Factors Affecting Performance [Text Block] |
|
How did the Fund perform during the reporting period? For the 12 months ended August 31, 2026, the Fund slightly underperformed its benchmark. Global equities posted strong returns, while global bonds struggled. Resilient growth and corporate earnings supported stocks, though shifting U.S. trade policy, persistent inflation, and Middle East tensions that disrupted energy supplies and raised oil prices fueled volatility. Some central banks, including those in the United States and the United Kingdom, lowered rates. However, developed-market government bond yields generally rose amid concerns about borrowing, inflation, and monetary policy. Nine of the benchmark’s 11 industry sectors recorded positive returns for the 12 months. Technology contributed the most to the benchmark’s return, followed by health care and financials. Utilities and consumer discretionary, the two sectors that posted negative returns, detracted slightly.
|
|
| Performance Past Does Not Indicate Future [Text] |
|
Keep in mind that the Fund's past performance does not indicate how the Fund will perform in the future.
|
|
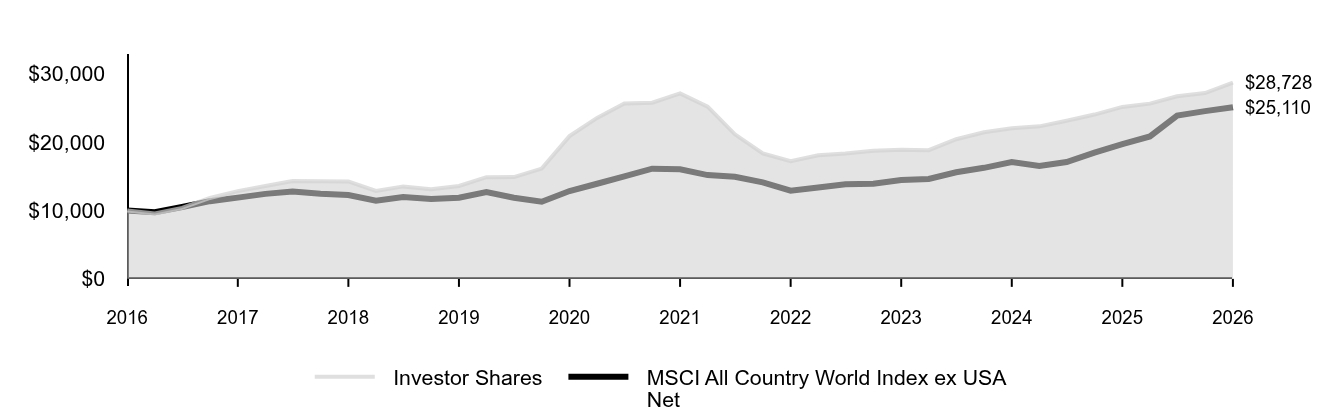
| Line Graph [Table Text Block] |
|
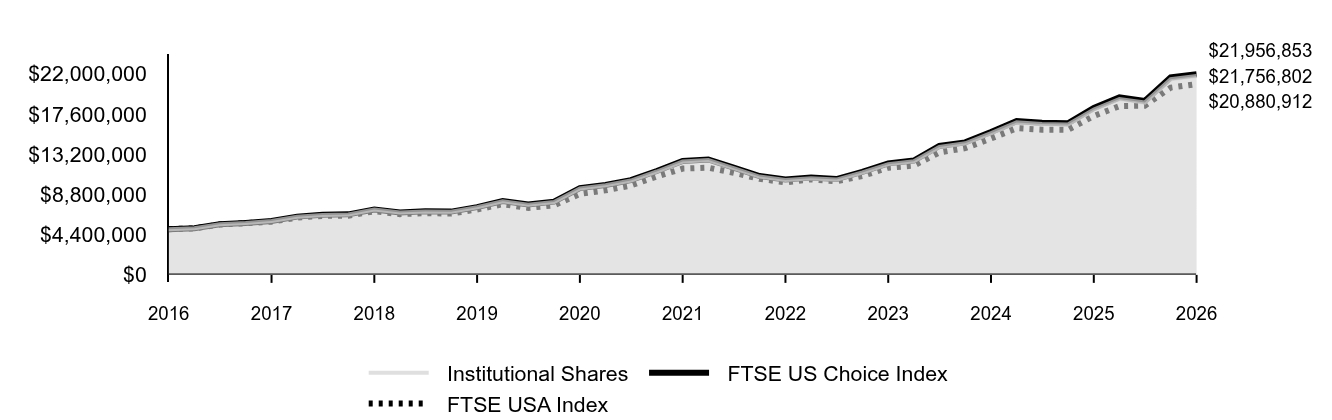 Table Summary | Institutional Shares | FTSE US Choice Index | FTSE USA Index |
|---|
2016 | $5,000,000 | $5,000,000 | $5,000,000 |
|---|
2016 | $5,093,909 | $5,096,565 | $5,092,681 |
|---|
2017 | $5,534,733 | $5,537,630 | $5,506,224 |
|---|
2017 | $5,678,876 | $5,685,108 | $5,650,322 |
|---|
2017 | $5,885,926 | $5,891,216 | $5,825,007 |
|---|
2017 | $6,368,680 | $6,375,687 | $6,264,325 |
|---|
2018 | $6,561,588 | $6,572,650 | $6,456,962 |
|---|
2018 | $6,610,122 | $6,622,595 | $6,473,474 |
|---|
2018 | $7,142,203 | $7,157,341 | $6,966,009 |
|---|
2018 | $6,819,943 | $6,833,324 | $6,648,231 |
|---|
2019 | $6,937,280 | $6,953,358 | $6,756,795 |
|---|
2019 | $6,905,004 | $6,923,608 | $6,707,503 |
|---|
2019 | $7,398,080 | $7,418,115 | $7,158,379 |
|---|
2019 | $8,058,800 | $8,082,110 | $7,729,888 |
|---|
2020 | $7,683,374 | $7,707,717 | $7,328,196 |
|---|
2020 | $7,981,936 | $8,008,232 | $7,608,887 |
|---|
2020 | $9,459,454 | $9,493,755 | $8,859,694 |
|---|
2020 | $9,799,632 | $9,836,523 | $9,247,628 |
|---|
2021 | $10,324,240 | $10,365,720 | $9,780,054 |
|---|
2021 | $11,312,945 | $11,362,573 | $10,763,311 |
|---|
2021 | $12,400,222 | $12,457,058 | $11,630,983 |
|---|
2021 | $12,571,860 | $12,633,456 | $11,725,789 |
|---|
2022 | $11,682,381 | $11,742,285 | $11,177,544 |
|---|
2022 | $10,762,736 | $10,819,642 | $10,509,105 |
|---|
2022 | $10,384,600 | $10,442,797 | $10,120,271 |
|---|
2022 | $10,582,902 | $10,645,152 | $10,454,509 |
|---|
2023 | $10,424,601 | $10,488,751 | $10,240,428 |
|---|
2023 | $11,207,653 | $11,283,490 | $10,819,813 |
|---|
2023 | $12,120,145 | $12,205,106 | $11,726,058 |
|---|
2023 | $12,424,279 | $12,510,581 | $11,956,532 |
|---|
2024 | $14,006,828 | $14,109,737 | $13,389,905 |
|---|
2024 | $14,395,092 | $14,500,328 | $13,870,038 |
|---|
2024 | $15,507,670 | $15,626,654 | $14,923,503 |
|---|
2024 | $16,687,983 | $16,823,400 | $16,052,639 |
|---|
2025 | $16,513,135 | $16,651,274 | $15,888,023 |
|---|
2025 | $16,459,184 | $16,597,034 | $15,867,741 |
|---|
2025 | $18,101,987 | $18,258,636 | $17,392,628 |
|---|
2025 | $19,254,679 | $19,426,399 | $18,467,194 |
|---|
2026 | $18,858,807 | $19,028,813 | $18,515,499 |
|---|
2026 | $21,409,250 | $21,603,642 | $20,491,500 |
|---|
2026 | $21,756,802 | $21,956,853 | $20,880,912 |
|---|
|
|
| Average Annual Return [Table Text Block] |
|
Table Summary | 1 Year | 5 Years | 10 Years |
|---|
Institutional Shares | 20.19% | 11.90% | 15.84% |
|---|
FTSE US Choice Index | 20.25% | 12.00% | 15.95% |
|---|
FTSE USA Index | 20.06% | 12.42% | 15.37% |
|---|
|
|
| No Deduction of Taxes [Text Block] |
|
The graph and returns shown do not reflect taxes that a shareholder would pay on fund distributions or on the sale of fund shares.
|
|
| Material Change Date |
|
|
Aug. 31, 2025
|
| Updated Performance Information Location [Text Block] |
|
Updated performance information is available on our website at vanguard.com/performance or by calling Vanguard toll-free at 800-662-7447.
|
|
| AssetsNet |
|
$ 29,233,000,000
|
|
| Holdings Count | Holding |
|
390
|
|
| Advisory Fees Paid, Amount |
|
$ 217,000
|
|
| InvestmentCompanyPortfolioTurnover |
|
7.00%
|
|
| Additional Fund Statistics [Text Block] |
|
Fund Statistics
(as of August 31, 2026)Table SummaryFund Net Assets (in millions) | $29,233 |
|---|
Number of Portfolio Holdings | 390 |
|---|
Portfolio Turnover Rate | 7% |
|---|
Total Investment Advisory Fees (in thousands) | $217 |
|---|
|
|
| Holdings [Text Block] |
|
Portfolio Composition % of Net Assets
(as of August 31, 2026)Table SummaryBasic Materials | 1.4% |
|---|
Consumer Discretionary | 13.8% |
|---|
Consumer Staples | 3.4% |
|---|
Energy | 0.0% |
|---|
Financials | 9.4% |
|---|
Health Care | 9.4% |
|---|
Industrials | 6.3% |
|---|
Real Estate | 2.0% |
|---|
Technology | 51.2% |
|---|
Telecommunications | 2.5% |
|---|
Utilities | 0.3% |
|---|
Other Assets and Liabilities—Net | 0.3% |
|---|
This table reflects the Fund's investments, including short-term investments, derivatives and other assets and liabilities. |
|
| Material Fund Change [Text Block] |
|
How has the Fund changed?During the reporting period, the expense ratio for the Institutional Share class of the Fund was reduced. This is a summary of certain changes to the Fund since August 31, 2025. For more complete information, you may review the Fund’s next prospectus, which we expect to be available by December 31, 2026, at https://personal1.vanguard.com/ngf-next-gen-form-webapp/fund-literature or upon request at 800-662-7447. |
|
| Material Fund Change Expenses [Text Block] |
|
During the reporting period, the expense ratio for the Institutional Share class of the Fund was reduced.
|
|
| Summary of Change Legend [Text Block] |
|
This is a summary of certain changes to the Fund since August 31, 2025. For more complete information, you may review the Fund’s next prospectus, which we expect to be available by December 31, 2026, at https://personal1.vanguard.com/ngf-next-gen-form-webapp/fund-literature or upon request at 800-662-7447.
|
|
| Updated Prospectus Phone Number |
|
800-662-7447
|
|
| Updated Prospectus Web Address |
|
https://personal1.vanguard.com/ngf-next-gen-form-webapp/fund-literature
|
|
| C000012206 |
|
|
|
| Shareholder Report [Line Items] |
|
|
|
| Fund Name |
|
Materials Index Fund
|
|
| Class Name |
|
ETF Shares
|
|
| Trading Symbol |
|
VAW
|
|
| Security Exchange Name |
|
NYSEArca
|
|
| Annual or Semi-Annual Statement [Text Block] |
|
This annual shareholder report contains important information about Vanguard Materials Index Fund (the "Fund") for the period of September 1, 2025, to August 31, 2026.
|
|
| Additional Information [Text Block] |
|
You can find additional information about the Fund at https://personal1.vanguard.com/ngf-next-gen-form-webapp/fund-literature. You can also request this information by contacting us at 800-662-7447.
|
|
| Additional Information Phone Number |
|
<span style="white-space: nowrap; box-sizing: border-box; color: rgb(0, 0, 0); display: inline; flex-wrap: nowrap; font-size: 10.6667px; font-weight: 400; grid-area: auto; line-height: 16px; margin: 0px; overflow: visible; text-align: left; text-align-last: auto;"> 800-662-7447</span>
|
|
| Additional Information Website |
|
<span style="white-space: nowrap; box-sizing: border-box; color: rgb(0, 0, 0); display: inline; flex-wrap: nowrap; font-size: 10.6667px; font-weight: 400; grid-area: auto; line-height: 16px; margin: 0px; overflow: visible; text-align: left; text-align-last: auto;"> <span style="box-sizing: border-box; color: rgb(0, 0, 0); display: inline; flex-wrap: nowrap; font-size: 10.6667px; font-weight: 400; grid-area: auto; line-height: 16px; margin: 0px; overflow: visible; text-align: left; text-align-last: auto; white-space-collapse: collapse;"><span style="text-decoration: underline; box-sizing: border-box; color: rgb(0, 0, 0); display: inline; flex-wrap: nowrap; font-size: 10.6667px; font-weight: 400; grid-area: auto; line-height: 16px; margin: 0px; overflow: visible; text-align: left; text-align-last: auto; white-space-collapse: collapse;">https://personal1.vanguard.com/ngf-next-gen-form-webapp/fund-literature</span></span></span>
|
|
| Expenses [Text Block] |
|
What were the Fund costs for the last year?(based on a hypothetical $10,000 investment) Table SummaryShare Class Name | Costs of a $10,000 investment | Costs paid as a percentage of a $10,000 investment |
|---|
ETF Shares | $10 | 0.09% |
|---|
|
|
| Expenses Paid, Amount |
|
$ 10
|
|
| Expense Ratio, Percent |
|
0.09%
|
|
| Factors Affecting Performance [Text Block] |
|
How did the Fund perform during the reporting period? For the 12 months ended August 31, 2026, the Fund performed roughly in line with its benchmark. Global equities posted strong returns, while global bonds struggled. Resilient growth and corporate earnings supported stocks, though shifting U.S. trade policy, persistent inflation, and Middle East tensions that disrupted energy supplies and raised oil prices fueled volatility. Some central banks, including those in the United States and the United Kingdom, lowered rates. However, developed-market government bond yields generally rose amid concerns about borrowing, inflation, and monetary policy. Newmont (+71%), Freeport-McMoRan (+72%), and Nucor (+70%) contributed the most to the benchmark’s return. They accounted for about 19% of the index at the end of the reporting period and added about 10 percentage points to its result. CRH public (–15%), Sherwin-Williams (–7%), and International Paper (–20%) detracted the most.
|
|
| Performance Past Does Not Indicate Future [Text] |
|
Keep in mind that the Fund's past performance does not indicate how the Fund will perform in the future.
|
|
| Line Graph [Table Text Block] |
|
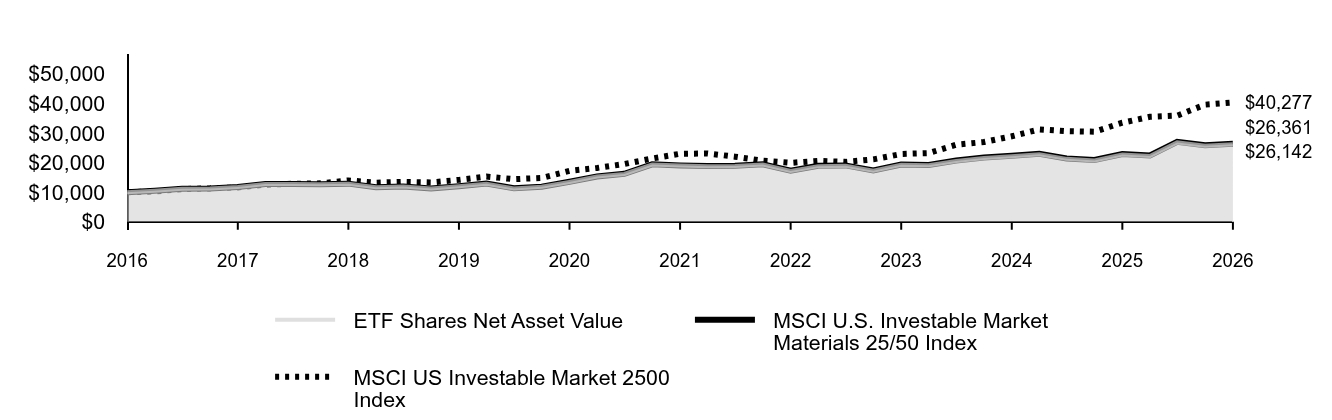 Table Summary | ETF Shares Net Asset Value | MSCI U.S. Investable Market Materials 25/50 Index | MSCI US Investable Market 2500 Index |
|---|
2016 | $10,000 | $10,000 | $10,000 |
|---|
2016 | $10,501 | $10,508 | $10,232 |
|---|
2017 | $11,110 | $11,114 | $11,030 |
|---|
2017 | $11,206 | $11,212 | $11,271 |
|---|
2017 | $11,706 | $11,716 | $11,606 |
|---|
2017 | $12,729 | $12,723 | $12,514 |
|---|
2018 | $12,750 | $12,748 | $12,820 |
|---|
2018 | $12,632 | $12,633 | $12,966 |
|---|
2018 | $12,866 | $12,869 | $13,959 |
|---|
2018 | $11,644 | $11,645 | $13,205 |
|---|
2019 | $11,926 | $11,930 | $13,469 |
|---|
2019 | $11,196 | $11,204 | $13,288 |
|---|
2019 | $12,000 | $12,020 | $14,144 |
|---|
2019 | $12,864 | $12,888 | $15,258 |
|---|
2020 | $11,271 | $11,294 | $14,384 |
|---|
2020 | $11,808 | $11,836 | $14,801 |
|---|
2020 | $13,454 | $13,488 | $17,181 |
|---|
2020 | $15,253 | $15,298 | $18,176 |
|---|
2021 | $16,137 | $16,187 | $19,508 |
|---|
2021 | $19,326 | $19,390 | $21,356 |
|---|
2021 | $18,970 | $19,039 | $22,952 |
|---|
2021 | $18,765 | $18,839 | $23,066 |
|---|
2022 | $18,833 | $18,912 | $21,982 |
|---|
2022 | $19,322 | $19,409 | $20,624 |
|---|
2022 | $17,157 | $17,236 | $19,900 |
|---|
2022 | $18,784 | $18,877 | $20,565 |
|---|
2023 | $18,940 | $19,035 | $20,229 |
|---|
2023 | $17,265 | $17,356 | $21,076 |
|---|
2023 | $19,231 | $19,338 | $22,888 |
|---|
2023 | $19,097 | $19,209 | $23,198 |
|---|
2024 | $20,533 | $20,659 | $26,023 |
|---|
2024 | $21,534 | $21,671 | $26,923 |
|---|
2024 | $22,130 | $22,276 | $28,873 |
|---|
2024 | $22,830 | $22,987 | $31,200 |
|---|
2025 | $21,247 | $21,396 | $30,603 |
|---|
2025 | $20,698 | $20,847 | $30,422 |
|---|
2025 | $22,698 | $22,867 | $33,454 |
|---|
2025 | $22,226 | $22,398 | $35,455 |
|---|
2026 | $26,804 | $27,017 | $35,849 |
|---|
2026 | $25,639 | $25,847 | $39,554 |
|---|
2026 | $26,142 | $26,361 | $40,277 |
|---|
|
|
| Average Annual Return [Table Text Block] |
|
Table Summary | 1 Year | 5 Years | 10 Years |
|---|
ETF Shares Net Asset Value | 15.17% | 6.62% | 10.09% |
|---|
ETF Shares Market Price | 15.14% | 6.63% | 10.09% |
|---|
MSCI U.S. Investable Market Materials 25/50 Index | 15.28% | 6.72% | 10.18% |
|---|
MSCI US Investable Market 2500 Index | 20.40% | 11.90% | 14.95% |
|---|
|
|
| No Deduction of Taxes [Text Block] |
|
The graph and returns shown do not reflect taxes that a shareholder would pay on fund distributions or on the sale of fund shares.
|
|
| Updated Performance Information Location [Text Block] |
|
Updated performance information is available on our website at vanguard.com/performance or by calling Vanguard toll-free at 800-662-7447.
|
|
| AssetsNet |
|
$ 4,542,000,000
|
|
| Holdings Count | Holding |
|
112
|
|
| Advisory Fees Paid, Amount |
|
$ 42,000
|
|
| InvestmentCompanyPortfolioTurnover |
|
8.00%
|
|
| Additional Fund Statistics [Text Block] |
|
Fund Statistics
(as of August 31, 2026)Table SummaryFund Net Assets (in millions) | $4,542 |
|---|
Number of Portfolio Holdings | 112 |
|---|
Portfolio Turnover Rate | 8% |
|---|
Total Investment Advisory Fees (in thousands) | $42 |
|---|
|
|
| Holdings [Text Block] |
|
Portfolio Composition % of Net Assets
(as of August 31, 2026)Table SummaryChemicals | 48.3% |
|---|
Construction Materials | 10.5% |
|---|
Containers & Packaging | 10.0% |
|---|
Metals & Mining | 31.0% |
|---|
Paper & Forest Products | 0.1% |
|---|
Other Assets and Liabilities—Net | 0.1% |
|---|
This table reflects the Fund's investments, including short-term investments, derivatives and other assets and liabilities. |
|
| Material Fund Change [Text Block] |
|
|
|
| Updated Prospectus Phone Number |
|
800-662-7447
|
|
| Updated Prospectus Web Address |
|
https://personal1.vanguard.com/ngf-next-gen-form-webapp/fund-literature
|
|
| C000012205 |
|
|
|
| Shareholder Report [Line Items] |
|
|
|
| Fund Name |
|
Materials Index Fund
|
|
| Class Name |
|
Admiral™ Shares
|
|
| Trading Symbol |
|
VMIAX
|
|
| Annual or Semi-Annual Statement [Text Block] |
|
This annual shareholder report contains important information about Vanguard Materials Index Fund (the "Fund") for the period of September 1, 2025, to August 31, 2026.
|
|
| Additional Information [Text Block] |
|
You can find additional information about the Fund at https://personal1.vanguard.com/ngf-next-gen-form-webapp/fund-literature. You can also request this information by contacting us at 800-662-7447.
|
|
| Additional Information Phone Number |
|
<span style="white-space: nowrap; box-sizing: border-box; color: rgb(0, 0, 0); display: inline; flex-wrap: nowrap; font-size: 10.6667px; font-weight: 400; grid-area: auto; line-height: 16px; margin: 0px; overflow: visible; text-align: left; text-align-last: auto;"> 800-662-7447</span>
|
|
| Additional Information Website |
|
<span style="white-space: nowrap; box-sizing: border-box; color: rgb(0, 0, 0); display: inline; flex-wrap: nowrap; font-size: 10.6667px; font-weight: 400; grid-area: auto; line-height: 16px; margin: 0px; overflow: visible; text-align: left; text-align-last: auto;"> <span style="box-sizing: border-box; color: rgb(0, 0, 0); display: inline; flex-wrap: nowrap; font-size: 10.6667px; font-weight: 400; grid-area: auto; line-height: 16px; margin: 0px; overflow: visible; text-align: left; text-align-last: auto; white-space-collapse: collapse;"><span style="text-decoration: underline; box-sizing: border-box; color: rgb(0, 0, 0); display: inline; flex-wrap: nowrap; font-size: 10.6667px; font-weight: 400; grid-area: auto; line-height: 16px; margin: 0px; overflow: visible; text-align: left; text-align-last: auto; white-space-collapse: collapse;">https://personal1.vanguard.com/ngf-next-gen-form-webapp/fund-literature</span></span></span>
|
|
| Expenses [Text Block] |
|
What were the Fund costs for the last year?(based on a hypothetical $10,000 investment) Table SummaryShare Class Name | Costs of a $10,000 investment | Costs paid as a percentage of a $10,000 investment |
|---|
Admiral Shares | $10 | 0.09% |
|---|
|
|
| Expenses Paid, Amount |
|
$ 10
|
|
| Expense Ratio, Percent |
|
0.09%
|
|
| Factors Affecting Performance [Text Block] |
|
How did the Fund perform during the reporting period? For the 12 months ended August 31, 2026, the Fund performed roughly in line with its benchmark. Global equities posted strong returns, while global bonds struggled. Resilient growth and corporate earnings supported stocks, though shifting U.S. trade policy, persistent inflation, and Middle East tensions that disrupted energy supplies and raised oil prices fueled volatility. Some central banks, including those in the United States and the United Kingdom, lowered rates. However, developed-market government bond yields generally rose amid concerns about borrowing, inflation, and monetary policy. Newmont (+71%), Freeport-McMoRan (+72%), and Nucor (+70%) contributed the most to the benchmark’s return. They accounted for about 19% of the index at the end of the reporting period and added about 10 percentage points to its result. CRH public (–15%), Sherwin-Williams (–7%), and International Paper (–20%) detracted the most.
|
|
| Performance Past Does Not Indicate Future [Text] |
|
Keep in mind that the Fund's past performance does not indicate how the Fund will perform in the future.
|
|
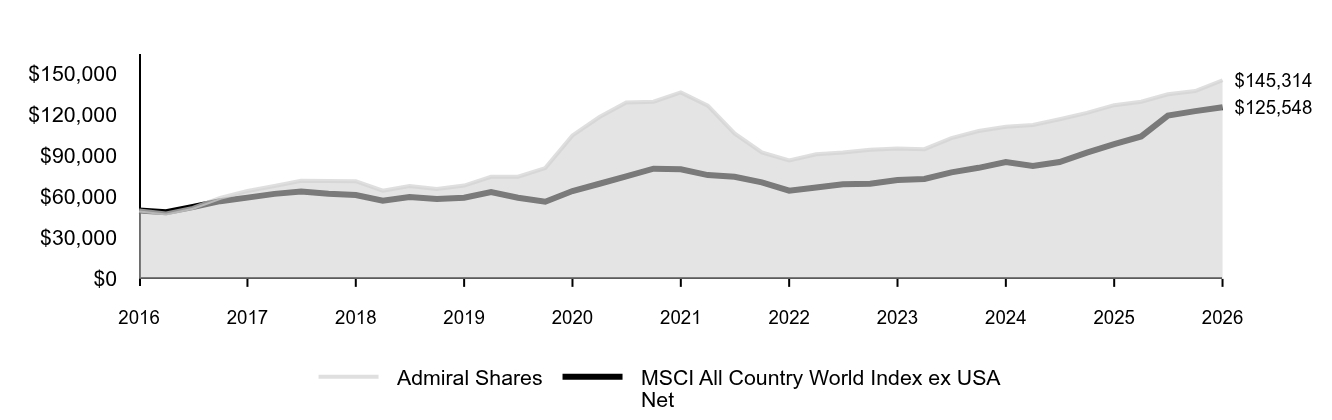
| Line Graph [Table Text Block] |
|
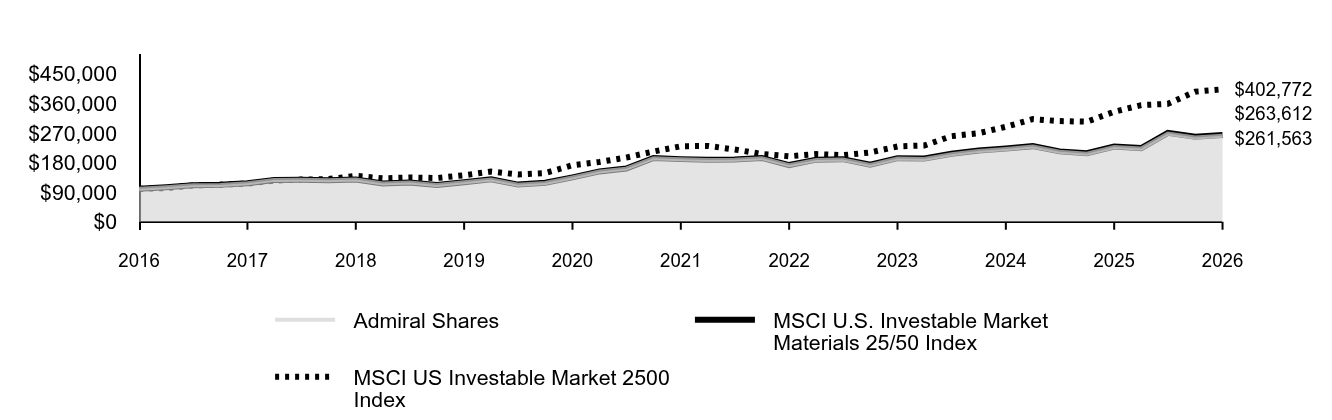 Table Summary | Admiral Shares | MSCI U.S. Investable Market Materials 25/50 Index | MSCI US Investable Market 2500 Index |
|---|
2016 | $100,000 | $100,000 | $100,000 |
|---|
2016 | $105,014 | $105,080 | $102,323 |
|---|
2017 | $111,107 | $111,137 | $110,301 |
|---|
2017 | $112,056 | $112,117 | $112,713 |
|---|
2017 | $117,058 | $117,161 | $116,055 |
|---|
2017 | $127,280 | $127,228 | $125,136 |
|---|
2018 | $127,482 | $127,476 | $128,197 |
|---|
2018 | $126,314 | $126,327 | $129,658 |
|---|
2018 | $128,663 | $128,689 | $139,594 |
|---|
2018 | $116,418 | $116,450 | $132,050 |
|---|
2019 | $119,225 | $119,295 | $134,688 |
|---|
2019 | $111,942 | $112,038 | $132,882 |
|---|
2019 | $119,985 | $120,200 | $141,436 |
|---|
2019 | $128,626 | $128,881 | $152,576 |
|---|
2020 | $112,699 | $112,939 | $143,841 |
|---|
2020 | $118,080 | $118,356 | $148,014 |
|---|
2020 | $134,547 | $134,884 | $171,813 |
|---|
2020 | $152,561 | $152,976 | $181,762 |
|---|
2021 | $161,407 | $161,871 | $195,080 |
|---|
2021 | $193,304 | $193,901 | $213,559 |
|---|
2021 | $189,768 | $190,390 | $229,522 |
|---|
2021 | $187,723 | $188,386 | $230,655 |
|---|
2022 | $188,400 | $189,124 | $219,820 |
|---|
2022 | $193,308 | $194,088 | $206,240 |
|---|
2022 | $171,628 | $172,362 | $199,000 |
|---|
2022 | $187,927 | $188,769 | $205,651 |
|---|
2023 | $189,461 | $190,353 | $202,286 |
|---|
2023 | $172,713 | $173,557 | $210,760 |
|---|
2023 | $192,395 | $193,383 | $228,878 |
|---|
2023 | $191,056 | $192,090 | $231,975 |
|---|
2024 | $205,433 | $206,590 | $260,227 |
|---|
2024 | $215,455 | $216,705 | $269,232 |
|---|
2024 | $221,421 | $222,758 | $288,732 |
|---|
2024 | $228,438 | $229,868 | $312,002 |
|---|
2025 | $212,579 | $213,956 | $306,030 |
|---|
2025 | $207,088 | $208,474 | $304,223 |
|---|
2025 | $227,108 | $228,668 | $334,541 |
|---|
2025 | $222,387 | $223,980 | $354,555 |
|---|
2026 | $268,186 | $270,175 | $358,486 |
|---|
2026 | $256,519 | $258,474 | $395,539 |
|---|
2026 | $261,563 | $263,612 | $402,772 |
|---|
|
|
| Average Annual Return [Table Text Block] |
|
Table Summary | 1 Year | 5 Years | 10 Years |
|---|
Admiral Shares | 15.17% | 6.63% | 10.09% |
|---|
MSCI U.S. Investable Market Materials 25/50 Index | 15.28% | 6.72% | 10.18% |
|---|
MSCI US Investable Market 2500 Index | 20.40% | 11.90% | 14.95% |
|---|
|
|
| No Deduction of Taxes [Text Block] |
|
The graph and returns shown do not reflect taxes that a shareholder would pay on fund distributions or on the sale of fund shares.
|
|
| Updated Performance Information Location [Text Block] |
|
Updated performance information is available on our website at vanguard.com/performance or by calling Vanguard toll-free at 800-662-7447.
|
|
| AssetsNet |
|
$ 4,542,000,000
|
|
| Holdings Count | Holding |
|
112
|
|
| Advisory Fees Paid, Amount |
|
$ 42,000
|
|
| InvestmentCompanyPortfolioTurnover |
|
8.00%
|
|
| Additional Fund Statistics [Text Block] |
|
Fund Statistics
(as of August 31, 2026)Table SummaryFund Net Assets (in millions) | $4,542 |
|---|
Number of Portfolio Holdings | 112 |
|---|
Portfolio Turnover Rate | 8% |
|---|
Total Investment Advisory Fees (in thousands) | $42 |
|---|
|
|
| Holdings [Text Block] |
|
Portfolio Composition % of Net Assets
(as of August 31, 2026)Table SummaryChemicals | 48.3% |
|---|
Construction Materials | 10.5% |
|---|
Containers & Packaging | 10.0% |
|---|
Metals & Mining | 31.0% |
|---|
Paper & Forest Products | 0.1% |
|---|
Other Assets and Liabilities—Net | 0.1% |
|---|
This table reflects the Fund's investments, including short-term investments, derivatives and other assets and liabilities. |
|
| Material Fund Change [Text Block] |
|
|
|
| Updated Prospectus Phone Number |
|
800-662-7447
|
|
| Updated Prospectus Web Address |
|
https://personal1.vanguard.com/ngf-next-gen-form-webapp/fund-literature
|
|
| C000012209 |
|
|
|
| Shareholder Report [Line Items] |
|
|
|
| Fund Name |
|
Communication Services Index Fund
|
|
| Class Name |
|
ETF Shares
|
|
| Trading Symbol |
|
VOX
|
|
| Security Exchange Name |
|
NYSEArca
|
|
| Annual or Semi-Annual Statement [Text Block] |
|
This annual shareholder report contains important information about Vanguard Communication Services Index Fund (the "Fund") for the period of September 1, 2025, to August 31, 2026.
|
|
| Additional Information [Text Block] |
|
You can find additional information about the Fund at https://personal1.vanguard.com/ngf-next-gen-form-webapp/fund-literature. You can also request this information by contacting us at 800-662-7447.
|
|
| Additional Information Phone Number |
|
<span style="white-space: nowrap; box-sizing: border-box; color: rgb(0, 0, 0); display: inline; flex-wrap: nowrap; font-size: 10.6667px; font-weight: 400; grid-area: auto; line-height: 16px; margin: 0px; overflow: visible; text-align: left; text-align-last: auto;"> 800-662-7447</span>
|
|
| Additional Information Website |
|
<span style="white-space: nowrap; box-sizing: border-box; color: rgb(0, 0, 0); display: inline; flex-wrap: nowrap; font-size: 10.6667px; font-weight: 400; grid-area: auto; line-height: 16px; margin: 0px; overflow: visible; text-align: left; text-align-last: auto;"> <span style="box-sizing: border-box; color: rgb(0, 0, 0); display: inline; flex-wrap: nowrap; font-size: 10.6667px; font-weight: 400; grid-area: auto; line-height: 16px; margin: 0px; overflow: visible; text-align: left; text-align-last: auto; white-space-collapse: collapse;"><span style="text-decoration: underline; box-sizing: border-box; color: rgb(0, 0, 0); display: inline; flex-wrap: nowrap; font-size: 10.6667px; font-weight: 400; grid-area: auto; line-height: 16px; margin: 0px; overflow: visible; text-align: left; text-align-last: auto; white-space-collapse: collapse;">https://personal1.vanguard.com/ngf-next-gen-form-webapp/fund-literature</span></span></span>
|
|
| Expenses [Text Block] |
|
What were the Fund costs for the last year?(based on a hypothetical $10,000 investment) Table SummaryShare Class Name | Costs of a $10,000 investment | Costs paid as a percentage of a $10,000 investment |
|---|
ETF Shares | $9 | 0.09% |
|---|
|
|
| Expenses Paid, Amount |
|
$ 9
|
|
| Expense Ratio, Percent |
|
0.09%
|
|
| Factors Affecting Performance [Text Block] |
|
How did the Fund perform during the reporting period? For the 12 months ended August 31, 2026, the Fund performed roughly in line with its benchmark. Global equities posted strong returns, while global bonds struggled. Resilient growth and corporate earnings supported stocks, though shifting U.S. trade policy, persistent inflation, and Middle East tensions that disrupted energy supplies and raised oil prices fueled volatility. Some central banks, including those in the United States and the United Kingdom, lowered rates. However, developed-market government bond yields generally rose amid concerns about borrowing, inflation, and monetary policy. Alphabet (+59%), Warner Bros. Discovery (+145%), and Verizon Communications (+21%) contributed the most to the benchmark’s return. They accounted for about 30% of the index at the end of the reporting period and added about 16 percentage points to its result. Meta Platforms (–22%), Roblox (–67%), and Netflix (–33%) detracted the most.
|
|
| Performance Past Does Not Indicate Future [Text] |
|
Keep in mind that the Fund's past performance does not indicate how the Fund will perform in the future.
|
|
| Line Graph [Table Text Block] |
|
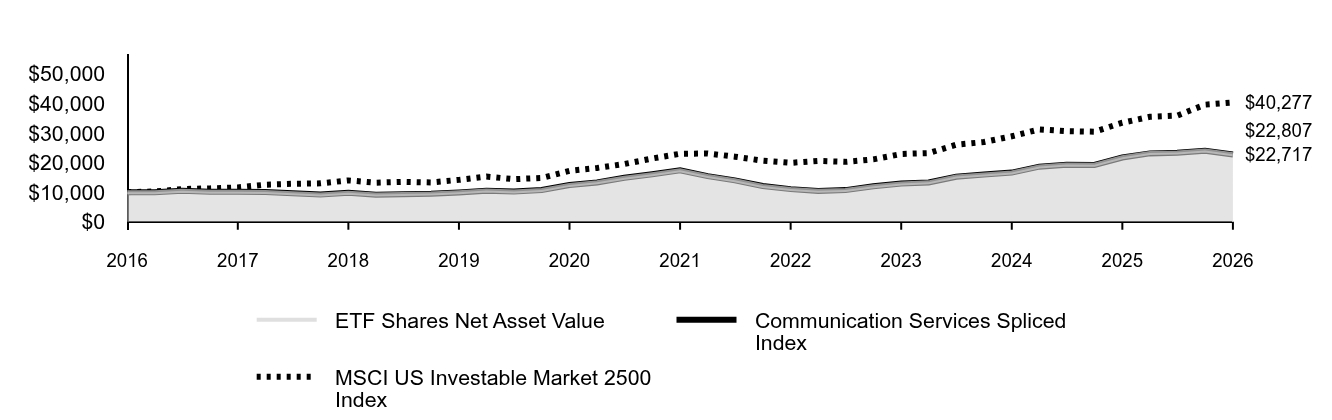 Table Summary | ETF Shares Net Asset Value | Communication Services Spliced Index | MSCI US Investable Market 2500 Index |
|---|
2016 | $10,000 | $10,000 | $10,000 |
|---|
2016 | $9,961 | $9,958 | $10,232 |
|---|
2017 | $10,441 | $10,440 | $11,030 |
|---|
2017 | $10,126 | $10,121 | $11,271 |
|---|
2017 | $10,162 | $10,152 | $11,606 |
|---|
2017 | $10,062 | $10,050 | $12,514 |
|---|
2018 | $9,637 | $9,612 | $12,820 |
|---|
2018 | $9,230 | $9,201 | $12,966 |
|---|
2018 | $9,806 | $9,779 | $13,959 |
|---|
2018 | $9,179 | $9,157 | $13,205 |
|---|
2019 | $9,344 | $9,308 | $13,469 |
|---|
2019 | $9,520 | $9,486 | $13,288 |
|---|
2019 | $9,950 | $9,917 | $14,144 |
|---|
2019 | $10,533 | $10,501 | $15,258 |
|---|
2020 | $10,233 | $10,203 | $14,384 |
|---|
2020 | $10,728 | $10,699 | $14,801 |
|---|
2020 | $12,452 | $12,419 | $17,181 |
|---|
2020 | $13,311 | $13,276 | $18,176 |
|---|
2021 | $14,872 | $14,837 | $19,508 |
|---|
2021 | $16,052 | $16,018 | $21,356 |
|---|
2021 | $17,402 | $17,367 | $22,952 |
|---|
2021 | $15,442 | $15,414 | $23,066 |
|---|
2022 | $14,009 | $13,986 | $21,982 |
|---|
2022 | $12,082 | $12,065 | $20,624 |
|---|
2022 | $11,031 | $11,016 | $19,900 |
|---|
2022 | $10,435 | $10,424 | $20,565 |
|---|
2023 | $10,699 | $10,684 | $20,229 |
|---|
2023 | $11,984 | $11,961 | $21,076 |
|---|
2023 | $12,957 | $12,920 | $22,888 |
|---|
2023 | $13,301 | $13,255 | $23,198 |
|---|
2024 | $15,259 | $15,206 | $26,023 |
|---|
2024 | $15,996 | $15,942 | $26,923 |
|---|
2024 | $16,665 | $16,610 | $28,873 |
|---|
2024 | $18,673 | $18,602 | $31,200 |
|---|
2025 | $19,321 | $19,251 | $30,603 |
|---|
2025 | $19,249 | $19,177 | $30,422 |
|---|
2025 | $21,802 | $21,699 | $33,454 |
|---|
2025 | $23,194 | $23,089 | $35,455 |
|---|
2026 | $23,388 | $23,287 | $35,849 |
|---|
2026 | $24,044 | $23,946 | $39,554 |
|---|
2026 | $22,807 | $22,717 | $40,277 |
|---|
|
|
| Average Annual Return [Table Text Block] |
|
Table Summary | 1 Year | 5 Years | 10 Years |
|---|
ETF Shares Net Asset Value | 4.61% | 5.56% | 8.59% |
|---|
ETF Shares Market Price | 4.61% | 5.56% | 8.61% |
|---|
Communication Services Spliced Index | 4.69% | 5.52% | 8.55% |
|---|
MSCI US Investable Market 2500 Index | 20.40% | 11.90% | 14.95% |
|---|
|
|
| No Deduction of Taxes [Text Block] |
|
The graph and returns shown do not reflect taxes that a shareholder would pay on fund distributions or on the sale of fund shares.
|
|
| Updated Performance Information Location [Text Block] |
|
Updated performance information is available on our website at vanguard.com/performance or by calling Vanguard toll-free at 800-662-7447.
|
|
| AssetsNet |
|
$ 5,934,000,000
|
|
| Holdings Count | Holding |
|
114
|
|
| Advisory Fees Paid, Amount |
|
$ 67,000
|
|
| InvestmentCompanyPortfolioTurnover |
|
28.00%
|
|
| Additional Fund Statistics [Text Block] |
|
Fund Statistics
(as of August 31, 2026)Table SummaryFund Net Assets (in millions) | $5,934 |
|---|
Number of Portfolio Holdings | 114 |
|---|
Portfolio Turnover Rate | 28% |
|---|
Total Investment Advisory Fees (in thousands) | $67 |
|---|
|
|
| Holdings [Text Block] |
|
Portfolio Composition % of Net Assets
(as of August 31, 2026)Table SummaryDiversified Telecommunication Services | 17.3% |
|---|
Entertainment | 22.3% |
|---|
Interactive Media & Services | 46.3% |
|---|
Media | 10.8% |
|---|
Wireless Telecommunication Services | 3.0% |
|---|
Other Assets and Liabilities—Net | 0.3% |
|---|
This table reflects the Fund's investments, including short-term investments, derivatives and other assets and liabilities. |
|
| Material Fund Change [Text Block] |
|
|
|
| Updated Prospectus Phone Number |
|
800-662-7447
|
|
| Updated Prospectus Web Address |
|
https://personal1.vanguard.com/ngf-next-gen-form-webapp/fund-literature
|
|
| C000012208 |
|
|
|
| Shareholder Report [Line Items] |
|
|
|
| Fund Name |
|
Communication Services Index Fund
|
|
| Class Name |
|
Admiral™ Shares
|
|
| Trading Symbol |
|
VTCAX
|
|
| Annual or Semi-Annual Statement [Text Block] |
|
This annual shareholder report contains important information about Vanguard Communication Services Index Fund (the "Fund") for the period of September 1, 2025, to August 31, 2026.
|
|
| Additional Information [Text Block] |
|
You can find additional information about the Fund at https://personal1.vanguard.com/ngf-next-gen-form-webapp/fund-literature. You can also request this information by contacting us at 800-662-7447.
|
|
| Additional Information Phone Number |
|
<span style="white-space: nowrap; box-sizing: border-box; color: rgb(0, 0, 0); display: inline; flex-wrap: nowrap; font-size: 10.6667px; font-weight: 400; grid-area: auto; line-height: 16px; margin: 0px; overflow: visible; text-align: left; text-align-last: auto;"> 800-662-7447</span>
|
|
| Additional Information Website |
|
<span style="white-space: nowrap; box-sizing: border-box; color: rgb(0, 0, 0); display: inline; flex-wrap: nowrap; font-size: 10.6667px; font-weight: 400; grid-area: auto; line-height: 16px; margin: 0px; overflow: visible; text-align: left; text-align-last: auto;"> <span style="box-sizing: border-box; color: rgb(0, 0, 0); display: inline; flex-wrap: nowrap; font-size: 10.6667px; font-weight: 400; grid-area: auto; line-height: 16px; margin: 0px; overflow: visible; text-align: left; text-align-last: auto; white-space-collapse: collapse;"><span style="text-decoration: underline; box-sizing: border-box; color: rgb(0, 0, 0); display: inline; flex-wrap: nowrap; font-size: 10.6667px; font-weight: 400; grid-area: auto; line-height: 16px; margin: 0px; overflow: visible; text-align: left; text-align-last: auto; white-space-collapse: collapse;">https://personal1.vanguard.com/ngf-next-gen-form-webapp/fund-literature</span></span></span>
|
|
| Expenses [Text Block] |
|
What were the Fund costs for the last year?(based on a hypothetical $10,000 investment) Table SummaryShare Class Name | Costs of a $10,000 investment | Costs paid as a percentage of a $10,000 investment |
|---|
Admiral Shares | $9 | 0.09% |
|---|
|
|
| Expenses Paid, Amount |
|
$ 9
|
|
| Expense Ratio, Percent |
|
0.09%
|
|
| Factors Affecting Performance [Text Block] |
|
How did the Fund perform during the reporting period? For the 12 months ended August 31, 2026, the Fund performed roughly in line with its benchmark. Global equities posted strong returns, while global bonds struggled. Resilient growth and corporate earnings supported stocks, though shifting U.S. trade policy, persistent inflation, and Middle East tensions that disrupted energy supplies and raised oil prices fueled volatility. Some central banks, including those in the United States and the United Kingdom, lowered rates. However, developed-market government bond yields generally rose amid concerns about borrowing, inflation, and monetary policy. Alphabet (+59%), Warner Bros. Discovery (+145%), and Verizon Communications (+21%) contributed the most to the benchmark’s return. They accounted for about 30% of the index at the end of the reporting period and added about 16 percentage points to its result. Meta Platforms (–22%), Roblox (–67%), and Netflix (–33%) detracted the most.
|
|
| Performance Past Does Not Indicate Future [Text] |
|
Keep in mind that the Fund's past performance does not indicate how the Fund will perform in the future.
|
|
| Line Graph [Table Text Block] |
|
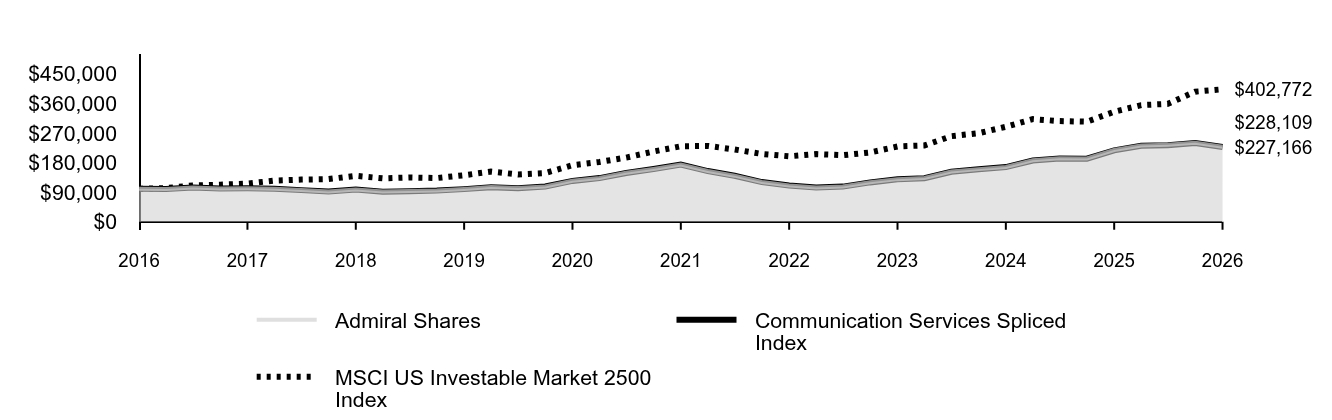 Table Summary | Admiral Shares | Communication Services Spliced Index | MSCI US Investable Market 2500 Index |
|---|
2016 | $100,000 | $100,000 | $100,000 |
|---|
2016 | $99,583 | $99,577 | $102,323 |
|---|
2017 | $104,390 | $104,395 | $110,301 |
|---|
2017 | $101,247 | $101,212 | $112,713 |
|---|
2017 | $101,605 | $101,523 | $116,055 |
|---|
2017 | $100,594 | $100,504 | $125,136 |
|---|
2018 | $96,336 | $96,120 | $128,197 |
|---|
2018 | $92,284 | $92,011 | $129,658 |
|---|
2018 | $98,068 | $97,794 | $139,594 |
|---|
2018 | $91,784 | $91,568 | $132,050 |
|---|
2019 | $93,453 | $93,081 | $134,688 |
|---|
2019 | $95,199 | $94,860 | $132,882 |
|---|
2019 | $99,502 | $99,169 | $141,436 |
|---|
2019 | $105,320 | $105,009 | $152,576 |
|---|
2020 | $102,336 | $102,034 | $143,841 |
|---|
2020 | $107,286 | $106,992 | $148,014 |
|---|
2020 | $124,537 | $124,192 | $171,813 |
|---|
2020 | $133,126 | $132,764 | $181,762 |
|---|
2021 | $148,728 | $148,368 | $195,080 |
|---|
2021 | $160,538 | $160,183 | $213,559 |
|---|
2021 | $174,049 | $173,666 | $229,522 |
|---|
2021 | $154,433 | $154,138 | $230,655 |
|---|
2022 | $140,092 | $139,859 | $219,820 |
|---|
2022 | $120,835 | $120,646 | $206,240 |
|---|
2022 | $110,331 | $110,164 | $199,000 |
|---|
2022 | $104,382 | $104,236 | $205,651 |
|---|
2023 | $107,000 | $106,836 | $202,286 |
|---|
2023 | $119,841 | $119,608 | $210,760 |
|---|
2023 | $129,568 | $129,201 | $228,878 |
|---|
2023 | $133,031 | $132,552 | $231,975 |
|---|
2024 | $152,603 | $152,057 | $260,227 |
|---|
2024 | $159,985 | $159,424 | $269,232 |
|---|
2024 | $166,681 | $166,102 | $288,732 |
|---|
2024 | $186,759 | $186,020 | $312,002 |
|---|
2025 | $193,244 | $192,506 | $306,030 |
|---|
2025 | $192,510 | $191,769 | $304,223 |
|---|
2025 | $218,058 | $216,987 | $334,541 |
|---|
2025 | $231,968 | $230,893 | $354,555 |
|---|
2026 | $233,927 | $232,874 | $358,486 |
|---|
2026 | $240,478 | $239,459 | $395,539 |
|---|
2026 | $228,109 | $227,166 | $402,772 |
|---|
|
|
| Average Annual Return [Table Text Block] |
|
Table Summary | 1 Year | 5 Years | 10 Years |
|---|
Admiral Shares | 4.61% | 5.56% | 8.60% |
|---|
Communication Services Spliced Index | 4.69% | 5.52% | 8.55% |
|---|
MSCI US Investable Market 2500 Index | 20.40% | 11.90% | 14.95% |
|---|
|
|
| No Deduction of Taxes [Text Block] |
|
The graph and returns shown do not reflect taxes that a shareholder would pay on fund distributions or on the sale of fund shares.
|
|
| Updated Performance Information Location [Text Block] |
|
Updated performance information is available on our website at vanguard.com/performance or by calling Vanguard toll-free at 800-662-7447.
|
|
| AssetsNet |
|
$ 5,934,000,000
|
|
| Holdings Count | Holding |
|
114
|
|
| Advisory Fees Paid, Amount |
|
$ 67,000
|
|
| InvestmentCompanyPortfolioTurnover |
|
28.00%
|
|
| Additional Fund Statistics [Text Block] |
|
Fund Statistics
(as of August 31, 2026)Table SummaryFund Net Assets (in millions) | $5,934 |
|---|
Number of Portfolio Holdings | 114 |
|---|
Portfolio Turnover Rate | 28% |
|---|
Total Investment Advisory Fees (in thousands) | $67 |
|---|
|
|
| Holdings [Text Block] |
|
Portfolio Composition % of Net Assets
(as of August 31, 2026)Table SummaryDiversified Telecommunication Services | 17.3% |
|---|
Entertainment | 22.3% |
|---|
Interactive Media & Services | 46.3% |
|---|
Media | 10.8% |
|---|
Wireless Telecommunication Services | 3.0% |
|---|
Other Assets and Liabilities—Net | 0.3% |
|---|
This table reflects the Fund's investments, including short-term investments, derivatives and other assets and liabilities. |
|
| Material Fund Change [Text Block] |
|
|
|
| Updated Prospectus Phone Number |
|
800-662-7447
|
|
| Updated Prospectus Web Address |
|
https://personal1.vanguard.com/ngf-next-gen-form-webapp/fund-literature
|
|
| C000012210 |
|
|
|
| Shareholder Report [Line Items] |
|
|
|
| Fund Name |
|
U.S. Growth Fund
|
|
| Class Name |
|
Investor Shares
|
|
| Trading Symbol |
|
VWUSX
|
|
| Annual or Semi-Annual Statement [Text Block] |
|
This annual shareholder report contains important information about Vanguard U.S. Growth Fund (the "Fund") for the period of September 1, 2025, to August 31, 2026.
|
|
| Additional Information [Text Block] |
|
You can find additional information about the Fund at https://personal1.vanguard.com/ngf-next-gen-form-webapp/fund-literature. You can also request this information by contacting us at 800-662-7447.
|
|
| Additional Information Phone Number |
|
<span style="white-space: nowrap; box-sizing: border-box; color: rgb(0, 0, 0); display: inline; flex-wrap: nowrap; font-size: 10.6667px; font-weight: 400; grid-area: auto; line-height: 16px; margin: 0px; overflow: visible; text-align: left; text-align-last: auto;"> 800-662-7447</span>
|
|
| Additional Information Website |
|
<span style="white-space: nowrap; box-sizing: border-box; color: rgb(0, 0, 0); display: inline; flex-wrap: nowrap; font-size: 10.6667px; font-weight: 400; grid-area: auto; line-height: 16px; margin: 0px; overflow: visible; text-align: left; text-align-last: auto;"> <span style="box-sizing: border-box; color: rgb(0, 0, 0); display: inline; flex-wrap: nowrap; font-size: 10.6667px; font-weight: 400; grid-area: auto; line-height: 16px; margin: 0px; overflow: visible; text-align: left; text-align-last: auto; white-space-collapse: collapse;"><span style="text-decoration: underline; box-sizing: border-box; color: rgb(0, 0, 0); display: inline; flex-wrap: nowrap; font-size: 10.6667px; font-weight: 400; grid-area: auto; line-height: 16px; margin: 0px; overflow: visible; text-align: left; text-align-last: auto; white-space-collapse: collapse;">https://personal1.vanguard.com/ngf-next-gen-form-webapp/fund-literature</span></span></span>
|
|
| Expenses [Text Block] |
|
What were the Fund costs for the last year?(based on a hypothetical $10,000 investment) Table SummaryShare Class Name | Costs of a $10,000 investment | Costs paid as a percentage of a $10,000 investment |
|---|
Investor Shares | $36 | 0.35% |
|---|
|
|
| Expenses Paid, Amount |
|
$ 36
|
|
| Expense Ratio, Percent |
|
0.35%
|
|
| Factors Affecting Performance [Text Block] |
|
How did the Fund perform during the reporting period? For the 12 months ended August 31, 2026, the Fund underperformed its benchmark. Global equities posted strong returns, while global bonds struggled. Resilient growth and corporate earnings supported stocks, though shifting U.S. trade policy, persistent inflation, and Middle East tensions that disrupted energy supplies and raised oil prices fueled volatility. Some central banks, including those in the United States and the United Kingdom, lowered rates. However, developed-market government bond yields generally rose amid concerns about borrowing, inflation, and monetary policy. The Fund lagged its benchmark across all industry sectors. Stock selection in communication services, information technology, and industrials detracted the most from relative performance.
|
|
| Performance Past Does Not Indicate Future [Text] |
|
Keep in mind that the Fund's past performance does not indicate how the Fund will perform in the future.
|
|
| Line Graph [Table Text Block] |
|
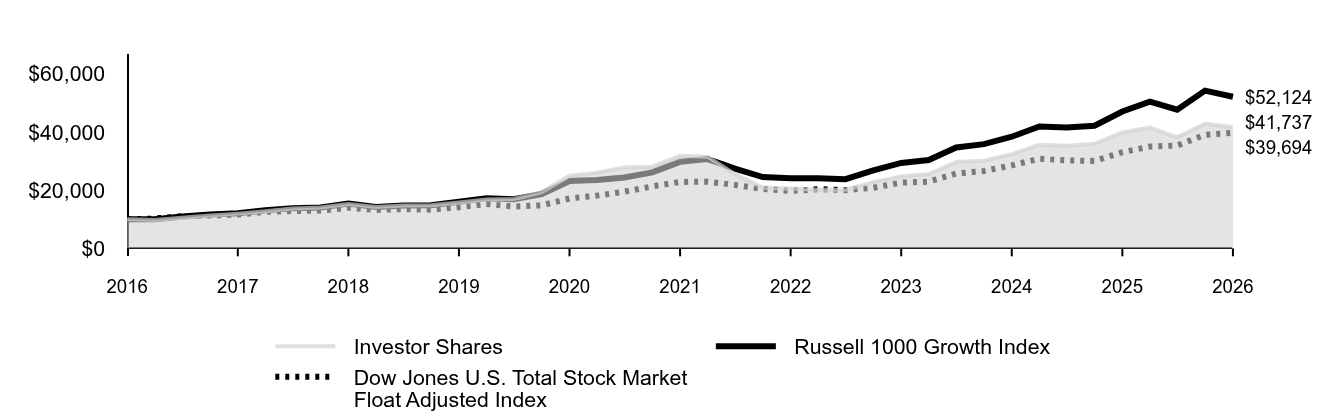 Table Summary | Investor Shares | Russell 1000 Growth Index | Dow Jones U.S. Total Stock Market Float Adjusted Index |
|---|
2016 | $10,000 | $10,000 | $10,000 |
|---|
2016 | $9,749 | $10,014 | $10,233 |
|---|
2017 | $10,475 | $10,915 | $11,028 |
|---|
2017 | $11,268 | $11,587 | $11,265 |
|---|
2017 | $11,924 | $12,082 | $11,605 |
|---|
2017 | $12,764 | $13,099 | $12,514 |
|---|
2018 | $13,649 | $13,765 | $12,818 |
|---|
2018 | $14,028 | $14,024 | $12,965 |
|---|
2018 | $15,219 | $15,371 | $13,956 |
|---|
2018 | $14,207 | $14,224 | $13,202 |
|---|
2019 | $14,759 | $14,677 | $13,458 |
|---|
2019 | $14,767 | $14,780 | $13,279 |
|---|
2019 | $15,783 | $16,028 | $14,127 |
|---|
2019 | $16,806 | $17,213 | $15,231 |
|---|
2020 | $16,946 | $16,894 | $14,369 |
|---|
2020 | $19,337 | $18,660 | $14,780 |
|---|
2020 | $24,939 | $23,135 | $17,123 |
|---|
2020 | $26,024 | $23,478 | $18,115 |
|---|
2021 | $27,781 | $24,371 | $19,470 |
|---|
2021 | $28,048 | $26,110 | $21,279 |
|---|
2021 | $31,802 | $29,734 | $22,828 |
|---|
2021 | $31,511 | $30,686 | $22,913 |
|---|
2022 | $25,495 | $27,429 | $21,794 |
|---|
2022 | $20,866 | $24,478 | $20,429 |
|---|
2022 | $20,568 | $24,068 | $19,693 |
|---|
2022 | $20,148 | $24,046 | $20,334 |
|---|
2023 | $20,142 | $23,770 | $19,999 |
|---|
2023 | $22,770 | $26,814 | $20,821 |
|---|
2023 | $24,720 | $29,347 | $22,598 |
|---|
2023 | $25,544 | $30,338 | $22,901 |
|---|
2024 | $29,719 | $34,688 | $25,719 |
|---|
2024 | $30,113 | $35,825 | $26,584 |
|---|
2024 | $32,387 | $38,373 | $28,511 |
|---|
2024 | $35,611 | $41,880 | $30,815 |
|---|
2025 | $35,279 | $41,538 | $30,221 |
|---|
2025 | $35,949 | $42,137 | $30,045 |
|---|
2025 | $39,831 | $47,036 | $33,038 |
|---|
2025 | $41,485 | $50,404 | $34,985 |
|---|
2026 | $38,194 | $47,678 | $35,334 |
|---|
2026 | $42,809 | $54,212 | $39,010 |
|---|
2026 | $41,737 | $52,124 | $39,694 |
|---|
|
|
| Average Annual Return [Table Text Block] |
|
Table Summary | 1 Year | 5 Years | 10 Years |
|---|
Investor Shares | 4.78% | 5.59% | 15.36% |
|---|
Russell 1000 Growth Index | 10.82% | 11.88% | 17.95% |
|---|
Dow Jones U.S. Total Stock Market Float Adjusted Index | 20.15% | 11.70% | 14.78% |
|---|
|
|
| No Deduction of Taxes [Text Block] |
|
The graph and returns shown do not reflect taxes that a shareholder would pay on fund distributions or on the sale of fund shares.
|
|
| Updated Performance Information Location [Text Block] |
|
Updated performance information is available on our website at vanguard.com/performance or by calling Vanguard toll-free at 800-662-7447.
|
|
| AssetsNet |
|
$ 43,976,000,000
|
|
| Holdings Count | Holding |
|
109
|
|
| Advisory Fees Paid, Amount |
|
$ 56,897,000
|
|
| InvestmentCompanyPortfolioTurnover |
|
58.00%
|
|
| Additional Fund Statistics [Text Block] |
|
Fund Statistics
(as of August 31, 2026)Table SummaryFund Net Assets (in millions) | $43,976 |
|---|
Number of Portfolio Holdings | 109 |
|---|
Portfolio Turnover Rate | 58% |
|---|
Total Investment Advisory Fees (in thousands) | $56,897 |
|---|
|
|
| Holdings [Text Block] |
|
Portfolio Composition % of Net Assets
(as of August 31, 2026)Table SummaryCommunication Services | 16.2% |
|---|
Consumer Discretionary | 9.0% |
|---|
Consumer Staples | 1.2% |
|---|
Financials | 5.6% |
|---|
Health Care | 8.0% |
|---|
Industrials | 6.7% |
|---|
Information Technology | 50.3% |
|---|
Materials | 0.2% |
|---|
Real Estate | 1.0% |
|---|
Utilities | 0.3% |
|---|
Other Assets and Liabilities—Net | 1.5% |
|---|
This table reflects the Fund's investments, including short-term investments, derivatives and other assets and liabilities. |
|
| Material Fund Change [Text Block] |
|
|
|
| Updated Prospectus Phone Number |
|
800-662-7447
|
|
| Updated Prospectus Web Address |
|
https://personal1.vanguard.com/ngf-next-gen-form-webapp/fund-literature
|
|
| C000012211 |
|
|
|
| Shareholder Report [Line Items] |
|
|
|
| Fund Name |
|
U.S. Growth Fund
|
|
| Class Name |
|
Admiral™ Shares
|
|
| Trading Symbol |
|
VWUAX
|
|
| Annual or Semi-Annual Statement [Text Block] |
|
This annual shareholder report contains important information about Vanguard U.S. Growth Fund (the "Fund") for the period of September 1, 2025, to August 31, 2026.
|
|
| Additional Information [Text Block] |
|
You can find additional information about the Fund at https://personal1.vanguard.com/ngf-next-gen-form-webapp/fund-literature. You can also request this information by contacting us at 800-662-7447.
|
|
| Additional Information Phone Number |
|
<span style="white-space: nowrap; box-sizing: border-box; color: rgb(0, 0, 0); display: inline; flex-wrap: nowrap; font-size: 10.6667px; font-weight: 400; grid-area: auto; line-height: 16px; margin: 0px; overflow: visible; text-align: left; text-align-last: auto;"> 800-662-7447</span>
|
|
| Additional Information Website |
|
<span style="white-space: nowrap; box-sizing: border-box; color: rgb(0, 0, 0); display: inline; flex-wrap: nowrap; font-size: 10.6667px; font-weight: 400; grid-area: auto; line-height: 16px; margin: 0px; overflow: visible; text-align: left; text-align-last: auto;"> <span style="box-sizing: border-box; color: rgb(0, 0, 0); display: inline; flex-wrap: nowrap; font-size: 10.6667px; font-weight: 400; grid-area: auto; line-height: 16px; margin: 0px; overflow: visible; text-align: left; text-align-last: auto; white-space-collapse: collapse;"><span style="text-decoration: underline; box-sizing: border-box; color: rgb(0, 0, 0); display: inline; flex-wrap: nowrap; font-size: 10.6667px; font-weight: 400; grid-area: auto; line-height: 16px; margin: 0px; overflow: visible; text-align: left; text-align-last: auto; white-space-collapse: collapse;">https://personal1.vanguard.com/ngf-next-gen-form-webapp/fund-literature</span></span></span>
|
|
| Expenses [Text Block] |
|
What were the Fund costs for the last year?(based on a hypothetical $10,000 investment) Table SummaryShare Class Name | Costs of a $10,000 investment | Costs paid as a percentage of a $10,000 investment |
|---|
Admiral Shares | $26 | 0.25% |
|---|
|
|
| Expenses Paid, Amount |
|
$ 26
|
|
| Expense Ratio, Percent |
|
0.25%
|
|
| Factors Affecting Performance [Text Block] |
|
How did the Fund perform during the reporting period? For the 12 months ended August 31, 2026, the Fund underperformed its benchmark. Global equities posted strong returns, while global bonds struggled. Resilient growth and corporate earnings supported stocks, though shifting U.S. trade policy, persistent inflation, and Middle East tensions that disrupted energy supplies and raised oil prices fueled volatility. Some central banks, including those in the United States and the United Kingdom, lowered rates. However, developed-market government bond yields generally rose amid concerns about borrowing, inflation, and monetary policy. The Fund lagged its benchmark across all industry sectors. Stock selection in communication services, information technology, and industrials detracted the most from relative performance.
|
|
| Performance Past Does Not Indicate Future [Text] |
|
Keep in mind that the Fund's past performance does not indicate how the Fund will perform in the future.
|
|
| Line Graph [Table Text Block] |
|
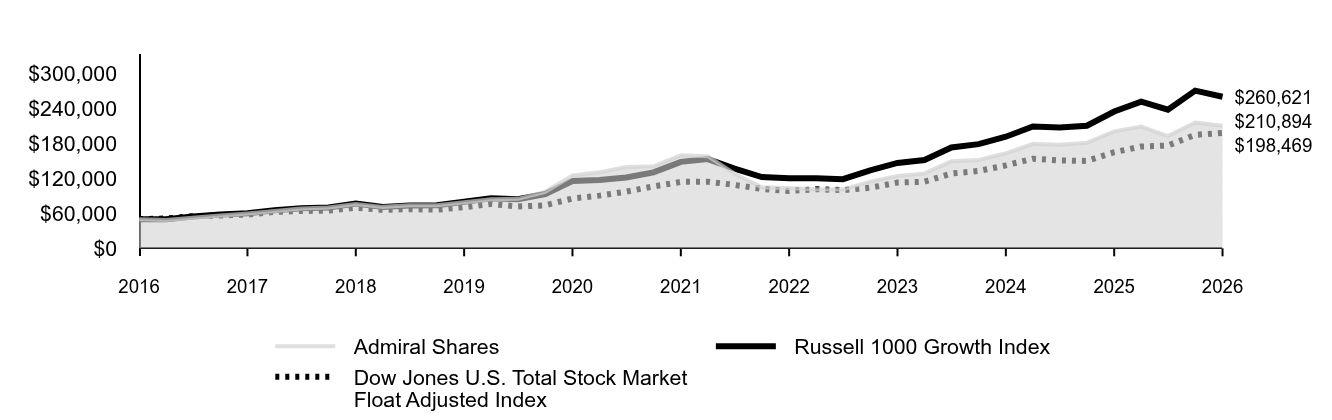 Table Summary | Admiral Shares | Russell 1000 Growth Index | Dow Jones U.S. Total Stock Market Float Adjusted Index |
|---|
2016 | $50,000 | $50,000 | $50,000 |
|---|
2016 | $48,765 | $50,071 | $51,166 |
|---|
2017 | $52,407 | $54,575 | $55,138 |
|---|
2017 | $56,408 | $57,937 | $56,325 |
|---|
2017 | $59,709 | $60,408 | $58,023 |
|---|
2017 | $63,936 | $65,496 | $62,569 |
|---|
2018 | $68,385 | $68,827 | $64,089 |
|---|
2018 | $70,308 | $70,118 | $64,823 |
|---|
2018 | $76,295 | $76,855 | $69,778 |
|---|
2018 | $71,239 | $71,121 | $66,009 |
|---|
2019 | $74,023 | $73,384 | $67,290 |
|---|
2019 | $74,075 | $73,900 | $66,394 |
|---|
2019 | $79,193 | $80,140 | $70,637 |
|---|
2019 | $84,341 | $86,065 | $76,156 |
|---|
2020 | $85,073 | $84,471 | $71,844 |
|---|
2020 | $97,094 | $93,300 | $73,901 |
|---|
2020 | $125,263 | $115,674 | $85,615 |
|---|
2020 | $130,741 | $117,391 | $90,573 |
|---|
2021 | $139,601 | $121,854 | $97,351 |
|---|
2021 | $140,965 | $130,549 | $106,393 |
|---|
2021 | $159,891 | $148,670 | $114,141 |
|---|
2021 | $158,462 | $153,432 | $114,564 |
|---|
2022 | $128,236 | $137,146 | $108,968 |
|---|
2022 | $104,985 | $122,388 | $102,145 |
|---|
2022 | $103,510 | $120,339 | $98,467 |
|---|
2022 | $101,431 | $120,230 | $101,672 |
|---|
2023 | $101,414 | $118,851 | $99,996 |
|---|
2023 | $114,675 | $134,072 | $104,106 |
|---|
2023 | $124,522 | $146,737 | $112,988 |
|---|
2023 | $128,710 | $151,692 | $114,507 |
|---|
2024 | $149,792 | $173,438 | $128,594 |
|---|
2024 | $151,796 | $179,123 | $132,921 |
|---|
2024 | $163,315 | $191,863 | $142,556 |
|---|
2024 | $179,617 | $209,400 | $154,077 |
|---|
2025 | $177,991 | $207,688 | $151,103 |
|---|
2025 | $181,413 | $210,687 | $150,223 |
|---|
2025 | $201,048 | $235,181 | $165,190 |
|---|
2025 | $209,459 | $252,020 | $174,926 |
|---|
2026 | $192,879 | $238,389 | $176,669 |
|---|
2026 | $216,262 | $271,062 | $195,052 |
|---|
2026 | $210,894 | $260,621 | $198,469 |
|---|
|
|
| Average Annual Return [Table Text Block] |
|
Table Summary | 1 Year | 5 Years | 10 Years |
|---|
Admiral Shares | 4.90% | 5.69% | 15.48% |
|---|
Russell 1000 Growth Index | 10.82% | 11.88% | 17.95% |
|---|
Dow Jones U.S. Total Stock Market Float Adjusted Index | 20.15% | 11.70% | 14.78% |
|---|
|
|
| No Deduction of Taxes [Text Block] |
|
The graph and returns shown do not reflect taxes that a shareholder would pay on fund distributions or on the sale of fund shares.
|
|
| Updated Performance Information Location [Text Block] |
|
Updated performance information is available on our website at vanguard.com/performance or by calling Vanguard toll-free at 800-662-7447.
|
|
| AssetsNet |
|
$ 43,976,000,000
|
|
| Holdings Count | Holding |
|
109
|
|
| Advisory Fees Paid, Amount |
|
$ 56,897,000
|
|
| InvestmentCompanyPortfolioTurnover |
|
58.00%
|
|
| Additional Fund Statistics [Text Block] |
|
Fund Statistics
(as of August 31, 2026)Table SummaryFund Net Assets (in millions) | $43,976 |
|---|
Number of Portfolio Holdings | 109 |
|---|
Portfolio Turnover Rate | 58% |
|---|
Total Investment Advisory Fees (in thousands) | $56,897 |
|---|
|
|
| Holdings [Text Block] |
|
Portfolio Composition % of Net Assets
(as of August 31, 2026)Table SummaryCommunication Services | 16.2% |
|---|
Consumer Discretionary | 9.0% |
|---|
Consumer Staples | 1.2% |
|---|
Financials | 5.6% |
|---|
Health Care | 8.0% |
|---|
Industrials | 6.7% |
|---|
Information Technology | 50.3% |
|---|
Materials | 0.2% |
|---|
Real Estate | 1.0% |
|---|
Utilities | 0.3% |
|---|
Other Assets and Liabilities—Net | 1.5% |
|---|
This table reflects the Fund's investments, including short-term investments, derivatives and other assets and liabilities. |
|
| Material Fund Change [Text Block] |
|
|
|
| Updated Prospectus Phone Number |
|
800-662-7447
|
|
| Updated Prospectus Web Address |
|
https://personal1.vanguard.com/ngf-next-gen-form-webapp/fund-literature
|
|
| C000012213 |
|
|
|
| Shareholder Report [Line Items] |
|
|
|
| Fund Name |
|
Utilities Index Fund
|
|
| Class Name |
|
ETF Shares
|
|
| Trading Symbol |
|
VPU
|
|
| Security Exchange Name |
|
NYSEArca
|
|
| Annual or Semi-Annual Statement [Text Block] |
|
This annual shareholder report contains important information about Vanguard Utilities Index Fund (the "Fund") for the period of September 1, 2025, to August 31, 2026.
|
|
| Additional Information [Text Block] |
|
You can find additional information about the Fund at https://personal1.vanguard.com/ngf-next-gen-form-webapp/fund-literature. You can also request this information by contacting us at 800-662-7447.
|
|
| Additional Information Phone Number |
|
<span style="white-space: nowrap; box-sizing: border-box; color: rgb(0, 0, 0); display: inline; flex-wrap: nowrap; font-size: 10.6667px; font-weight: 400; grid-area: auto; line-height: 16px; margin: 0px; overflow: visible; text-align: left; text-align-last: auto;"> 800-662-7447</span>
|
|
| Additional Information Website |
|
<span style="white-space: nowrap; box-sizing: border-box; color: rgb(0, 0, 0); display: inline; flex-wrap: nowrap; font-size: 10.6667px; font-weight: 400; grid-area: auto; line-height: 16px; margin: 0px; overflow: visible; text-align: left; text-align-last: auto;"> <span style="box-sizing: border-box; color: rgb(0, 0, 0); display: inline; flex-wrap: nowrap; font-size: 10.6667px; font-weight: 400; grid-area: auto; line-height: 16px; margin: 0px; overflow: visible; text-align: left; text-align-last: auto; white-space-collapse: collapse;"><span style="text-decoration: underline; box-sizing: border-box; color: rgb(0, 0, 0); display: inline; flex-wrap: nowrap; font-size: 10.6667px; font-weight: 400; grid-area: auto; line-height: 16px; margin: 0px; overflow: visible; text-align: left; text-align-last: auto; white-space-collapse: collapse;">https://personal1.vanguard.com/ngf-next-gen-form-webapp/fund-literature</span></span></span>
|
|
| Expenses [Text Block] |
|
What were the Fund costs for the last year?(based on a hypothetical $10,000 investment) Table SummaryShare Class Name | Costs of a $10,000 investment | Costs paid as a percentage of a $10,000 investment |
|---|
ETF Shares | $9 | 0.09% |
|---|
|
|
| Expenses Paid, Amount |
|
$ 9
|
|
| Expense Ratio, Percent |
|
0.09%
|
|
| Factors Affecting Performance [Text Block] |
|
How did the Fund perform during the reporting period? For the 12 months ended August 31, 2026, the Fund performed roughly in line with its benchmark. Global equities posted strong returns, while global bonds struggled. Resilient growth and corporate earnings supported stocks, though shifting U.S. trade policy, persistent inflation, and Middle East tensions that disrupted energy supplies and raised oil prices fueled volatility. Some central banks, including those in the United States and the United Kingdom, lowered rates. However, developed-market government bond yields generally rose amid concerns about borrowing, inflation, and monetary policy. NextEra Energy (+18%), Entergy (+24%), and Dominion Energy (+15%) contributed the most to the benchmark’s return. They accounted for about 19% of the index at the end of the reporting period and added about 3 percentage points to its result. Vistra (–27%), Constellation Energy (–10%), and NRG Energy (–23%) detracted the most.
|
|
| Performance Past Does Not Indicate Future [Text] |
|
Keep in mind that the Fund's past performance does not indicate how the Fund will perform in the future.
|
|
| Line Graph [Table Text Block] |
|
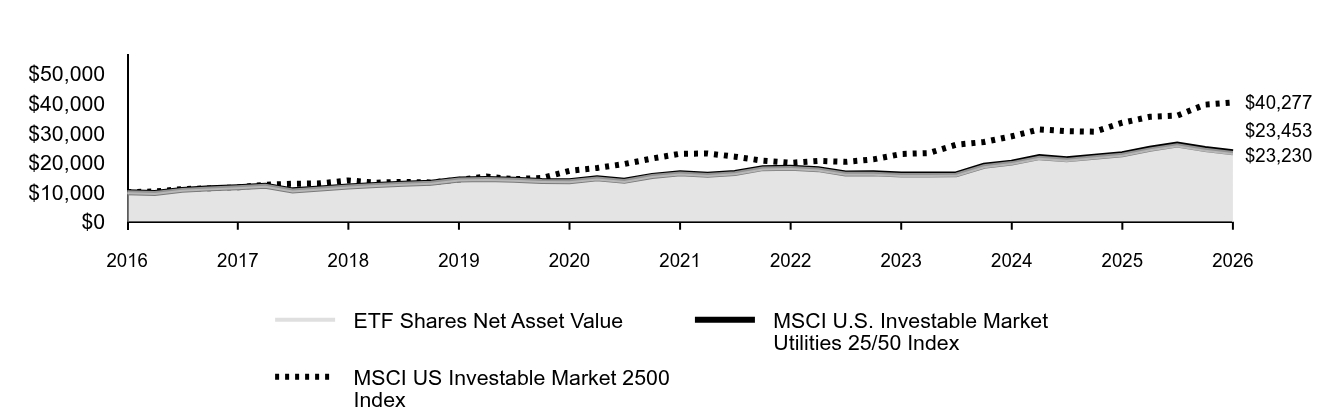 Table Summary | ETF Shares Net Asset Value | MSCI U.S. Investable Market Utilities 25/50 Index | MSCI US Investable Market 2500 Index |
|---|
2016 | $10,000 | $10,000 | $10,000 |
|---|
2016 | $9,676 | $9,678 | $10,232 |
|---|
2017 | $10,766 | $10,767 | $11,030 |
|---|
2017 | $11,272 | $11,275 | $11,271 |
|---|
2017 | $11,627 | $11,632 | $11,606 |
|---|
2017 | $12,119 | $12,125 | $12,514 |
|---|
2018 | $10,592 | $10,600 | $12,820 |
|---|
2018 | $11,254 | $11,266 | $12,966 |
|---|
2018 | $11,866 | $11,880 | $13,959 |
|---|
2018 | $12,422 | $12,440 | $13,205 |
|---|
2019 | $12,826 | $12,845 | $13,469 |
|---|
2019 | $13,185 | $13,208 | $13,288 |
|---|
2019 | $14,259 | $14,287 | $14,144 |
|---|
2019 | $14,410 | $14,443 | $15,258 |
|---|
2020 | $14,186 | $14,224 | $14,384 |
|---|
2020 | $13,736 | $13,775 | $14,801 |
|---|
2020 | $13,678 | $13,720 | $17,181 |
|---|
2020 | $14,615 | $14,665 | $18,176 |
|---|
2021 | $13,788 | $13,839 | $19,508 |
|---|
2021 | $15,418 | $15,478 | $21,356 |
|---|
2021 | $16,303 | $16,373 | $22,952 |
|---|
2021 | $15,823 | $15,897 | $23,066 |
|---|
2022 | $16,420 | $16,502 | $21,982 |
|---|
2022 | $18,014 | $18,110 | $20,624 |
|---|
2022 | $18,125 | $18,229 | $19,900 |
|---|
2022 | $17,660 | $17,767 | $20,565 |
|---|
2023 | $16,239 | $16,340 | $20,229 |
|---|
2023 | $16,254 | $16,363 | $21,076 |
|---|
2023 | $15,813 | $15,923 | $22,888 |
|---|
2023 | $15,818 | $15,929 | $23,198 |
|---|
2024 | $15,888 | $16,005 | $26,023 |
|---|
2024 | $18,749 | $18,894 | $26,923 |
|---|
2024 | $19,815 | $19,972 | $28,873 |
|---|
2024 | $21,647 | $21,823 | $31,200 |
|---|
2025 | $20,904 | $21,079 | $30,603 |
|---|
2025 | $21,755 | $21,938 | $30,422 |
|---|
2025 | $22,608 | $22,804 | $33,454 |
|---|
2025 | $24,458 | $24,676 | $35,455 |
|---|
2026 | $25,819 | $26,055 | $35,849 |
|---|
2026 | $24,336 | $24,564 | $39,554 |
|---|
2026 | $23,230 | $23,453 | $40,277 |
|---|
|
|
| Average Annual Return [Table Text Block] |
|
Table Summary | 1 Year | 5 Years | 10 Years |
|---|
ETF Shares Net Asset Value | 2.75% | 7.34% | 8.79% |
|---|
ETF Shares Market Price | 2.83% | 7.35% | 8.80% |
|---|
MSCI U.S. Investable Market Utilities 25/50 Index | 2.84% | 7.45% | 8.90% |
|---|
MSCI US Investable Market 2500 Index | 20.40% | 11.90% | 14.95% |
|---|
|
|
| No Deduction of Taxes [Text Block] |
|
The graph and returns shown do not reflect taxes that a shareholder would pay on fund distributions or on the sale of fund shares.
|
|
| Updated Performance Information Location [Text Block] |
|
Updated performance information is available on our website at vanguard.com/performance or by calling Vanguard toll-free at 800-662-7447.
|
|
| AssetsNet |
|
$ 10,086,000,000
|
|
| Holdings Count | Holding |
|
73
|
|
| Advisory Fees Paid, Amount |
|
$ 105,000
|
|
| InvestmentCompanyPortfolioTurnover |
|
5.00%
|
|
| Additional Fund Statistics [Text Block] |
|
Fund Statistics
(as of August 31, 2026)Table SummaryFund Net Assets (in millions) | $10,086 |
|---|
Number of Portfolio Holdings | 73 |
|---|
Portfolio Turnover Rate | 5% |
|---|
Total Investment Advisory Fees (in thousands) | $105 |
|---|
|
|
| Holdings [Text Block] |
|
Portfolio Composition % of Net Assets
(as of August 31, 2026)Table SummaryElectric Utilities | 61.3% |
|---|
Gas Utilities | 5.0% |
|---|
Independent Power and Renewable Electricity Producers | 5.5% |
|---|
Multi-Utilities | 24.6% |
|---|
Water Utilities | 3.3% |
|---|
Other Assets and Liabilities—Net | 0.3% |
|---|
This table reflects the Fund's investments, including short-term investments, derivatives and other assets and liabilities. |
|
| Material Fund Change [Text Block] |
|
|
|
| Updated Prospectus Phone Number |
|
800-662-7447
|
|
| Updated Prospectus Web Address |
|
https://personal1.vanguard.com/ngf-next-gen-form-webapp/fund-literature
|
|
| C000012212 |
|
|
|
| Shareholder Report [Line Items] |
|
|
|
| Fund Name |
|
Utilities Index Fund
|
|
| Class Name |
|
Admiral™ Shares
|
|
| Trading Symbol |
|
VUIAX
|
|
| Annual or Semi-Annual Statement [Text Block] |
|
This annual shareholder report contains important information about Vanguard Utilities Index Fund (the "Fund") for the period of September 1, 2025, to August 31, 2026.
|
|
| Additional Information [Text Block] |
|
You can find additional information about the Fund at https://personal1.vanguard.com/ngf-next-gen-form-webapp/fund-literature. You can also request this information by contacting us at 800-662-7447.
|
|
| Additional Information Phone Number |
|
<span style="white-space: nowrap; box-sizing: border-box; color: rgb(0, 0, 0); display: inline; flex-wrap: nowrap; font-size: 10.6667px; font-weight: 400; grid-area: auto; line-height: 16px; margin: 0px; overflow: visible; text-align: left; text-align-last: auto;"> 800-662-7447</span>
|
|
| Additional Information Website |
|
<span style="white-space: nowrap; box-sizing: border-box; color: rgb(0, 0, 0); display: inline; flex-wrap: nowrap; font-size: 10.6667px; font-weight: 400; grid-area: auto; line-height: 16px; margin: 0px; overflow: visible; text-align: left; text-align-last: auto;"> <span style="box-sizing: border-box; color: rgb(0, 0, 0); display: inline; flex-wrap: nowrap; font-size: 10.6667px; font-weight: 400; grid-area: auto; line-height: 16px; margin: 0px; overflow: visible; text-align: left; text-align-last: auto; white-space-collapse: collapse;"><span style="text-decoration: underline; box-sizing: border-box; color: rgb(0, 0, 0); display: inline; flex-wrap: nowrap; font-size: 10.6667px; font-weight: 400; grid-area: auto; line-height: 16px; margin: 0px; overflow: visible; text-align: left; text-align-last: auto; white-space-collapse: collapse;">https://personal1.vanguard.com/ngf-next-gen-form-webapp/fund-literature</span></span></span>
|
|
| Expenses [Text Block] |
|
What were the Fund costs for the last year?(based on a hypothetical $10,000 investment) Table SummaryShare Class Name | Costs of a $10,000 investment | Costs paid as a percentage of a $10,000 investment |
|---|
Admiral Shares | $9 | 0.09% |
|---|
|
|
| Expenses Paid, Amount |
|
$ 9
|
|
| Expense Ratio, Percent |
|
0.09%
|
|
| Factors Affecting Performance [Text Block] |
|
How did the Fund perform during the reporting period? For the 12 months ended August 31, 2026, the Fund performed roughly in line with its benchmark. Global equities posted strong returns, while global bonds struggled. Resilient growth and corporate earnings supported stocks, though shifting U.S. trade policy, persistent inflation, and Middle East tensions that disrupted energy supplies and raised oil prices fueled volatility. Some central banks, including those in the United States and the United Kingdom, lowered rates. However, developed-market government bond yields generally rose amid concerns about borrowing, inflation, and monetary policy. NextEra Energy (+18%), Entergy (+24%), and Dominion Energy (+15%) contributed the most to the benchmark’s return. They accounted for about 19% of the index at the end of the reporting period and added about 3 percentage points to its result. Vistra (–27%), Constellation Energy (–10%), and NRG Energy (–23%) detracted the most.
|
|
| Performance Past Does Not Indicate Future [Text] |
|
Keep in mind that the Fund's past performance does not indicate how the Fund will perform in the future.
|
|
| Line Graph [Table Text Block] |
|
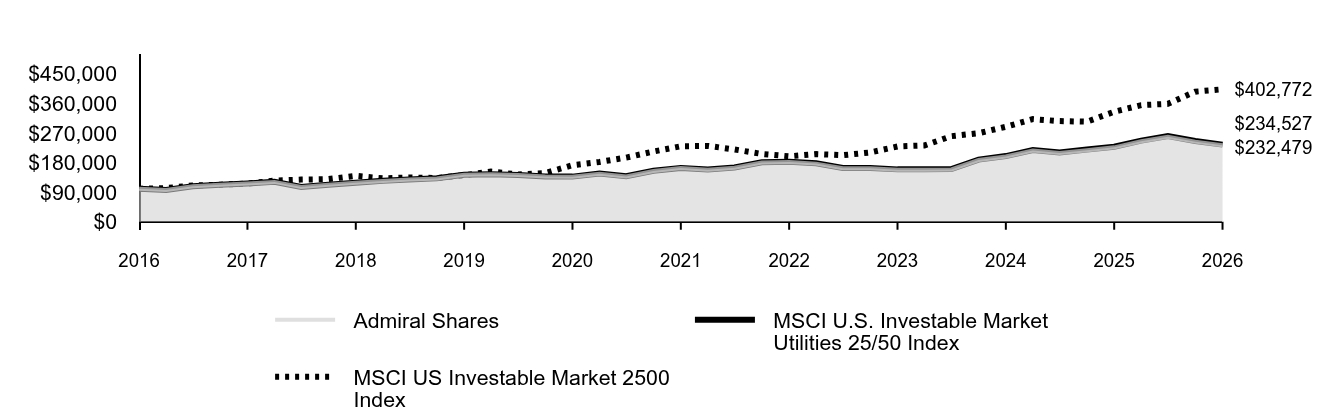 Table Summary | Admiral Shares | MSCI U.S. Investable Market Utilities 25/50 Index | MSCI US Investable Market 2500 Index |
|---|
2016 | $100,000 | $100,000 | $100,000 |
|---|
2016 | $96,748 | $96,780 | $102,323 |
|---|
2017 | $107,630 | $107,668 | $110,301 |
|---|
2017 | $112,686 | $112,748 | $112,713 |
|---|
2017 | $116,241 | $116,323 | $116,055 |
|---|
2017 | $121,138 | $121,248 | $125,136 |
|---|
2018 | $105,894 | $106,003 | $128,197 |
|---|
2018 | $112,516 | $112,656 | $129,658 |
|---|
2018 | $118,615 | $118,798 | $139,594 |
|---|
2018 | $124,182 | $124,399 | $132,050 |
|---|
2019 | $128,215 | $128,449 | $134,688 |
|---|
2019 | $131,819 | $132,080 | $132,882 |
|---|
2019 | $142,562 | $142,872 | $141,436 |
|---|
2019 | $144,076 | $144,427 | $152,576 |
|---|
2020 | $141,858 | $142,238 | $143,841 |
|---|
2020 | $137,355 | $137,749 | $148,014 |
|---|
2020 | $136,783 | $137,204 | $171,813 |
|---|
2020 | $146,167 | $146,648 | $181,762 |
|---|
2021 | $137,914 | $138,392 | $195,080 |
|---|
2021 | $154,212 | $154,783 | $213,559 |
|---|
2021 | $163,073 | $163,728 | $229,522 |
|---|
2021 | $158,310 | $158,970 | $230,655 |
|---|
2022 | $164,287 | $165,016 | $219,820 |
|---|
2022 | $180,252 | $181,101 | $206,240 |
|---|
2022 | $181,365 | $182,287 | $199,000 |
|---|
2022 | $176,738 | $177,668 | $205,651 |
|---|
2023 | $162,498 | $163,398 | $202,286 |
|---|
2023 | $162,689 | $163,629 | $210,760 |
|---|
2023 | $158,286 | $159,231 | $228,878 |
|---|
2023 | $158,294 | $159,285 | $231,975 |
|---|
2024 | $159,011 | $160,055 | $260,227 |
|---|
2024 | $187,651 | $188,937 | $269,232 |
|---|
2024 | $198,309 | $199,719 | $288,732 |
|---|
2024 | $216,629 | $218,226 | $312,002 |
|---|
2025 | $209,205 | $210,790 | $306,030 |
|---|
2025 | $217,729 | $219,384 | $304,223 |
|---|
2025 | $226,258 | $228,042 | $334,541 |
|---|
2025 | $244,776 | $246,764 | $354,555 |
|---|
2026 | $258,398 | $260,552 | $358,486 |
|---|
2026 | $243,571 | $245,642 | $395,539 |
|---|
2026 | $232,479 | $234,527 | $402,772 |
|---|
|
|
| Average Annual Return [Table Text Block] |
|
Table Summary | 1 Year | 5 Years | 10 Years |
|---|
Admiral Shares | 2.75% | 7.35% | 8.80% |
|---|
MSCI U.S. Investable Market Utilities 25/50 Index | 2.84% | 7.45% | 8.90% |
|---|
MSCI US Investable Market 2500 Index | 20.40% | 11.90% | 14.95% |
|---|
|
|
| No Deduction of Taxes [Text Block] |
|
The graph and returns shown do not reflect taxes that a shareholder would pay on fund distributions or on the sale of fund shares.
|
|
| Updated Performance Information Location [Text Block] |
|
Updated performance information is available on our website at vanguard.com/performance or by calling Vanguard toll-free at 800-662-7447.
|
|
| AssetsNet |
|
$ 10,086,000,000
|
|
| Holdings Count | Holding |
|
73
|
|
| Advisory Fees Paid, Amount |
|
$ 105,000
|
|
| InvestmentCompanyPortfolioTurnover |
|
5.00%
|
|
| Additional Fund Statistics [Text Block] |
|
Fund Statistics
(as of August 31, 2026)Table SummaryFund Net Assets (in millions) | $10,086 |
|---|
Number of Portfolio Holdings | 73 |
|---|
Portfolio Turnover Rate | 5% |
|---|
Total Investment Advisory Fees (in thousands) | $105 |
|---|
|
|
| Holdings [Text Block] |
|
Portfolio Composition % of Net Assets
(as of August 31, 2026)Table SummaryElectric Utilities | 61.3% |
|---|
Gas Utilities | 5.0% |
|---|
Independent Power and Renewable Electricity Producers | 5.5% |
|---|
Multi-Utilities | 24.6% |
|---|
Water Utilities | 3.3% |
|---|
Other Assets and Liabilities—Net | 0.3% |
|---|
This table reflects the Fund's investments, including short-term investments, derivatives and other assets and liabilities. |
|
| Material Fund Change [Text Block] |
|
|
|
| Updated Prospectus Phone Number |
|
800-662-7447
|
|
| Updated Prospectus Web Address |
|
https://personal1.vanguard.com/ngf-next-gen-form-webapp/fund-literature
|
|
| C000012215 |
|
|
|
| Shareholder Report [Line Items] |
|
|
|
| Fund Name |
|
Consumer Discretionary Index Fund
|
|
| Class Name |
|
ETF Shares
|
|
| Trading Symbol |
|
VCR
|
|
| Security Exchange Name |
|
NYSEArca
|
|
| Annual or Semi-Annual Statement [Text Block] |
|
This annual shareholder report contains important information about Vanguard Consumer Discretionary Index Fund (the "Fund") for the period of September 1, 2025, to August 31, 2026.
|
|
| Additional Information [Text Block] |
|
You can find additional information about the Fund at https://personal1.vanguard.com/ngf-next-gen-form-webapp/fund-literature. You can also request this information by contacting us at 800-662-7447.
|
|
| Additional Information Phone Number |
|
<span style="white-space: nowrap; box-sizing: border-box; color: rgb(0, 0, 0); display: inline; flex-wrap: nowrap; font-size: 10.6667px; font-weight: 400; grid-area: auto; line-height: 16px; margin: 0px; overflow: visible; text-align: left; text-align-last: auto;"> 800-662-7447</span>
|
|
| Additional Information Website |
|
<span style="white-space: nowrap; box-sizing: border-box; color: rgb(0, 0, 0); display: inline; flex-wrap: nowrap; font-size: 10.6667px; font-weight: 400; grid-area: auto; line-height: 16px; margin: 0px; overflow: visible; text-align: left; text-align-last: auto;"> <span style="box-sizing: border-box; color: rgb(0, 0, 0); display: inline; flex-wrap: nowrap; font-size: 10.6667px; font-weight: 400; grid-area: auto; line-height: 16px; margin: 0px; overflow: visible; text-align: left; text-align-last: auto; white-space-collapse: collapse;"><span style="text-decoration: underline; box-sizing: border-box; color: rgb(0, 0, 0); display: inline; flex-wrap: nowrap; font-size: 10.6667px; font-weight: 400; grid-area: auto; line-height: 16px; margin: 0px; overflow: visible; text-align: left; text-align-last: auto; white-space-collapse: collapse;">https://personal1.vanguard.com/ngf-next-gen-form-webapp/fund-literature</span></span></span>
|
|
| Expenses [Text Block] |
|
What were the Fund costs for the last year?(based on a hypothetical $10,000 investment) Table SummaryShare Class Name | Costs of a $10,000 investment | Costs paid as a percentage of a $10,000 investment |
|---|
ETF Shares | $9 | 0.09% |
|---|
|
|
| Expenses Paid, Amount |
|
$ 9
|
|
| Expense Ratio, Percent |
|
0.09%
|
|
| Factors Affecting Performance [Text Block] |
|
How did the Fund perform during the reporting period? For the 12 months ended August 31, 2026, the Fund performed roughly in line with its benchmark. Global equities posted strong returns, while global bonds struggled. Resilient growth and corporate earnings supported stocks, though shifting U.S. trade policy, persistent inflation, and Middle East tensions that disrupted energy supplies and raised oil prices fueled volatility. Some central banks, including those in the United States and the United Kingdom, lowered rates. However, developed-market government bond yields generally rose amid concerns about borrowing, inflation, and monetary policy. Amazon.com (+13%), Tesla (+10%), and General Motors (+49%) contributed the most to the benchmark’s return. They accounted for about 39% of the index at the end of the reporting period and added about 5 percentage points to its result. Home Depot (–17%), Nike (–48%), and Flutter Entertainment (–67%) detracted the most.
|
|
| Performance Past Does Not Indicate Future [Text] |
|
Keep in mind that the Fund's past performance does not indicate how the Fund will perform in the future.
|
|
| Line Graph [Table Text Block] |
|
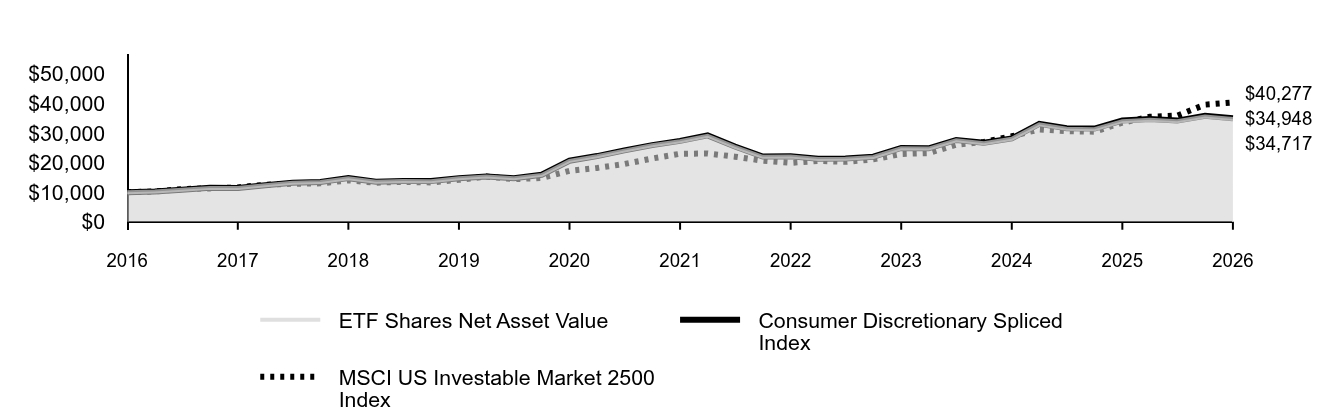 Table Summary | ETF Shares Net Asset Value | Consumer Discretionary Spliced Index | MSCI US Investable Market 2500 Index |
|---|
2016 | $10,000 | $10,000 | $10,000 |
|---|
2016 | $10,242 | $10,243 | $10,232 |
|---|
2017 | $10,843 | $10,845 | $11,030 |
|---|
2017 | $11,441 | $11,445 | $11,271 |
|---|
2017 | $11,381 | $11,386 | $11,606 |
|---|
2017 | $12,325 | $12,333 | $12,514 |
|---|
2018 | $13,156 | $13,165 | $12,820 |
|---|
2018 | $13,392 | $13,405 | $12,966 |
|---|
2018 | $14,707 | $14,727 | $13,959 |
|---|
2018 | $13,527 | $13,546 | $13,205 |
|---|
2019 | $13,771 | $13,791 | $13,469 |
|---|
2019 | $13,708 | $13,732 | $13,288 |
|---|
2019 | $14,687 | $14,715 | $14,144 |
|---|
2019 | $15,245 | $15,276 | $15,258 |
|---|
2020 | $14,663 | $14,696 | $14,384 |
|---|
2020 | $15,821 | $15,862 | $14,801 |
|---|
2020 | $20,559 | $20,617 | $17,181 |
|---|
2020 | $22,120 | $22,183 | $18,176 |
|---|
2021 | $24,037 | $24,105 | $19,508 |
|---|
2021 | $25,815 | $25,896 | $21,356 |
|---|
2021 | $27,218 | $27,310 | $22,952 |
|---|
2021 | $29,063 | $29,167 | $23,066 |
|---|
2022 | $25,304 | $25,399 | $21,982 |
|---|
2022 | $21,929 | $22,017 | $20,624 |
|---|
2022 | $22,016 | $22,107 | $19,900 |
|---|
2022 | $21,165 | $21,258 | $20,565 |
|---|
2023 | $21,304 | $21,399 | $20,229 |
|---|
2023 | $21,888 | $21,988 | $21,076 |
|---|
2023 | $24,823 | $24,940 | $22,888 |
|---|
2023 | $24,705 | $24,825 | $23,198 |
|---|
2024 | $27,490 | $27,631 | $26,023 |
|---|
2024 | $26,538 | $26,678 | $26,923 |
|---|
2024 | $28,022 | $28,175 | $28,873 |
|---|
2024 | $32,891 | $33,078 | $31,200 |
|---|
2025 | $31,407 | $31,592 | $30,603 |
|---|
2025 | $31,280 | $31,474 | $30,422 |
|---|
2025 | $33,972 | $34,189 | $33,454 |
|---|
2025 | $34,467 | $34,692 | $35,455 |
|---|
2026 | $33,945 | $34,173 | $35,849 |
|---|
2026 | $35,550 | $35,795 | $39,554 |
|---|
2026 | $34,717 | $34,948 | $40,277 |
|---|
|
|
| Average Annual Return [Table Text Block] |
|
Table Summary | 1 Year | 5 Years | 10 Years |
|---|
ETF Shares Net Asset Value | 2.19% | 4.99% | 13.25% |
|---|
ETF Shares Market Price | 2.19% | 4.98% | 13.25% |
|---|
Consumer Discretionary Spliced Index | 2.22% | 5.06% | 13.33% |
|---|
MSCI US Investable Market 2500 Index | 20.40% | 11.90% | 14.95% |
|---|
|
|
| No Deduction of Taxes [Text Block] |
|
The graph and returns shown do not reflect taxes that a shareholder would pay on fund distributions or on the sale of fund shares.
|
|
| Updated Performance Information Location [Text Block] |
|
Updated performance information is available on our website at vanguard.com/performance or by calling Vanguard toll-free at 800-662-7447.
|
|
| AssetsNet |
|
$ 6,609,000,000
|
|
| Holdings Count | Holding |
|
279
|
|
| Advisory Fees Paid, Amount |
|
$ 73,000
|
|
| InvestmentCompanyPortfolioTurnover |
|
13.00%
|
|
| Additional Fund Statistics [Text Block] |
|
Fund Statistics
(as of August 31, 2026)Table SummaryFund Net Assets (in millions) | $6,609 |
|---|
Number of Portfolio Holdings | 279 |
|---|
Portfolio Turnover Rate | 13% |
|---|
Total Investment Advisory Fees (in thousands) | $73 |
|---|
|
|
| Holdings [Text Block] |
|
Portfolio Composition % of Net Assets
(as of August 31, 2026)Table SummaryAutomobile Components | 2.5% |
|---|
Automobiles | 18.2% |
|---|
Broadline Retail | 25.3% |
|---|
Distributors | 0.8% |
|---|
Diversified Consumer Services | 2.2% |
|---|
Hotels, Restaurants & Leisure | 21.9% |
|---|
Household Durables | 5.3% |
|---|
Leisure Products | 1.2% |
|---|
Specialty Retail | 19.3% |
|---|
Textiles, Apparel & Luxury Goods | 3.2% |
|---|
Other Assets and Liabilities—Net | 0.1% |
|---|
This table reflects the Fund's investments, including short-term investments, derivatives and other assets and liabilities. |
|
| Material Fund Change [Text Block] |
|
|
|
| Updated Prospectus Phone Number |
|
800-662-7447
|
|
| Updated Prospectus Web Address |
|
https://personal1.vanguard.com/ngf-next-gen-form-webapp/fund-literature
|
|
| C000012214 |
|
|
|
| Shareholder Report [Line Items] |
|
|
|
| Fund Name |
|
Consumer Discretionary Index Fund
|
|
| Class Name |
|
Admiral™ Shares
|
|
| Trading Symbol |
|
VCDAX
|
|
| Annual or Semi-Annual Statement [Text Block] |
|
This annual shareholder report contains important information about Vanguard Consumer Discretionary Index Fund (the "Fund") for the period of September 1, 2025, to August 31, 2026.
|
|
| Additional Information [Text Block] |
|
You can find additional information about the Fund at https://personal1.vanguard.com/ngf-next-gen-form-webapp/fund-literature. You can also request this information by contacting us at 800-662-7447.
|
|
| Additional Information Phone Number |
|
<span style="white-space: nowrap; box-sizing: border-box; color: rgb(0, 0, 0); display: inline; flex-wrap: nowrap; font-size: 10.6667px; font-weight: 400; grid-area: auto; line-height: 16px; margin: 0px; overflow: visible; text-align: left; text-align-last: auto;"> 800-662-7447</span>
|
|
| Additional Information Website |
|
<span style="white-space: nowrap; box-sizing: border-box; color: rgb(0, 0, 0); display: inline; flex-wrap: nowrap; font-size: 10.6667px; font-weight: 400; grid-area: auto; line-height: 16px; margin: 0px; overflow: visible; text-align: left; text-align-last: auto;"> <span style="box-sizing: border-box; color: rgb(0, 0, 0); display: inline; flex-wrap: nowrap; font-size: 10.6667px; font-weight: 400; grid-area: auto; line-height: 16px; margin: 0px; overflow: visible; text-align: left; text-align-last: auto; white-space-collapse: collapse;"><span style="text-decoration: underline; box-sizing: border-box; color: rgb(0, 0, 0); display: inline; flex-wrap: nowrap; font-size: 10.6667px; font-weight: 400; grid-area: auto; line-height: 16px; margin: 0px; overflow: visible; text-align: left; text-align-last: auto; white-space-collapse: collapse;">https://personal1.vanguard.com/ngf-next-gen-form-webapp/fund-literature</span></span></span>
|
|
| Expenses [Text Block] |
|
What were the Fund costs for the last year?(based on a hypothetical $10,000 investment) Table SummaryShare Class Name | Costs of a $10,000 investment | Costs paid as a percentage of a $10,000 investment |
|---|
Admiral Shares | $9 | 0.09% |
|---|
|
|
| Expenses Paid, Amount |
|
$ 9
|
|
| Expense Ratio, Percent |
|
0.09%
|
|
| Factors Affecting Performance [Text Block] |
|
How did the Fund perform during the reporting period? For the 12 months ended August 31, 2026, the Fund performed roughly in line with its benchmark. Global equities posted strong returns, while global bonds struggled. Resilient growth and corporate earnings supported stocks, though shifting U.S. trade policy, persistent inflation, and Middle East tensions that disrupted energy supplies and raised oil prices fueled volatility. Some central banks, including those in the United States and the United Kingdom, lowered rates. However, developed-market government bond yields generally rose amid concerns about borrowing, inflation, and monetary policy. Amazon.com (+13%), Tesla (+10%), and General Motors (+49%) contributed the most to the benchmark’s return. They accounted for about 39% of the index at the end of the reporting period and added about 5 percentage points to its result. Home Depot (–17%), Nike (–48%), and Flutter Entertainment (–67%) detracted the most.
|
|
| Performance Past Does Not Indicate Future [Text] |
|
Keep in mind that the Fund's past performance does not indicate how the Fund will perform in the future.
|
|
| Line Graph [Table Text Block] |
|
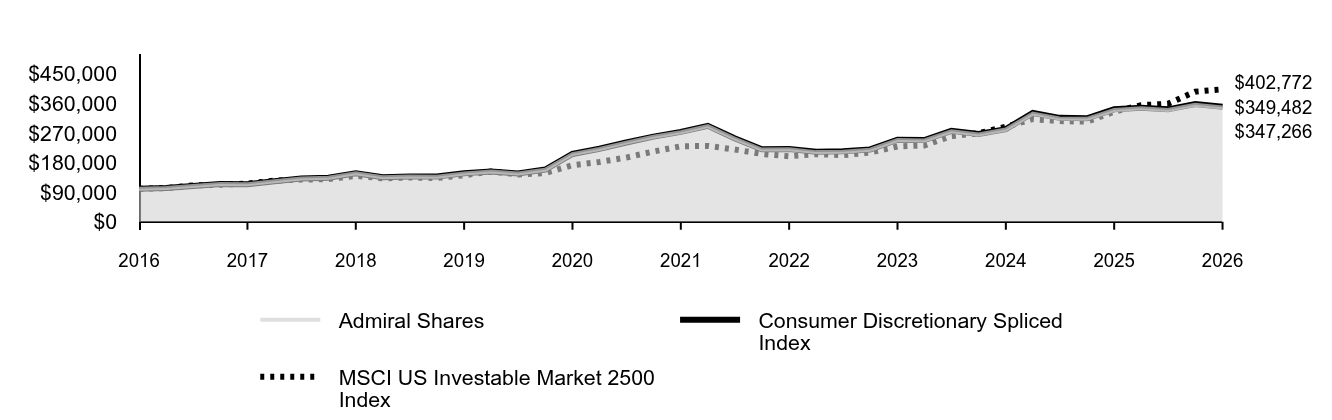 Table Summary | Admiral Shares | Consumer Discretionary Spliced Index | MSCI US Investable Market 2500 Index |
|---|
2016 | $100,000 | $100,000 | $100,000 |
|---|
2016 | $102,426 | $102,428 | $102,323 |
|---|
2017 | $108,437 | $108,445 | $110,301 |
|---|
2017 | $114,411 | $114,448 | $112,713 |
|---|
2017 | $113,813 | $113,864 | $116,055 |
|---|
2017 | $123,274 | $123,329 | $125,136 |
|---|
2018 | $131,568 | $131,653 | $128,197 |
|---|
2018 | $133,935 | $134,046 | $129,658 |
|---|
2018 | $147,086 | $147,275 | $139,594 |
|---|
2018 | $135,275 | $135,456 | $132,050 |
|---|
2019 | $137,712 | $137,911 | $134,688 |
|---|
2019 | $137,091 | $137,323 | $132,882 |
|---|
2019 | $146,882 | $147,148 | $141,436 |
|---|
2019 | $152,465 | $152,762 | $152,576 |
|---|
2020 | $146,645 | $146,961 | $143,841 |
|---|
2020 | $158,244 | $158,623 | $148,014 |
|---|
2020 | $205,642 | $206,170 | $171,813 |
|---|
2020 | $221,242 | $221,830 | $181,762 |
|---|
2021 | $240,414 | $241,048 | $195,080 |
|---|
2021 | $258,197 | $258,959 | $213,559 |
|---|
2021 | $272,242 | $273,105 | $229,522 |
|---|
2021 | $290,689 | $291,668 | $230,655 |
|---|
2022 | $253,080 | $253,987 | $219,820 |
|---|
2022 | $219,315 | $220,166 | $206,240 |
|---|
2022 | $220,206 | $221,071 | $199,000 |
|---|
2022 | $211,712 | $212,578 | $205,651 |
|---|
2023 | $213,092 | $213,989 | $202,286 |
|---|
2023 | $218,934 | $219,885 | $210,760 |
|---|
2023 | $248,274 | $249,403 | $228,878 |
|---|
2023 | $247,105 | $248,255 | $231,975 |
|---|
2024 | $274,979 | $276,310 | $260,227 |
|---|
2024 | $265,451 | $266,780 | $269,232 |
|---|
2024 | $280,306 | $281,749 | $288,732 |
|---|
2024 | $328,991 | $330,778 | $312,002 |
|---|
2025 | $314,161 | $315,915 | $306,030 |
|---|
2025 | $312,884 | $314,736 | $304,223 |
|---|
2025 | $339,813 | $341,885 | $334,541 |
|---|
2025 | $344,763 | $346,922 | $354,555 |
|---|
2026 | $339,542 | $341,729 | $358,486 |
|---|
2026 | $355,598 | $357,949 | $395,539 |
|---|
2026 | $347,266 | $349,482 | $402,772 |
|---|
|
|
| Average Annual Return [Table Text Block] |
|
Table Summary | 1 Year | 5 Years | 10 Years |
|---|
Admiral Shares | 2.19% | 4.99% | 13.26% |
|---|
Consumer Discretionary Spliced Index | 2.22% | 5.06% | 13.33% |
|---|
MSCI US Investable Market 2500 Index | 20.40% | 11.90% | 14.95% |
|---|
|
|
| No Deduction of Taxes [Text Block] |
|
The graph and returns shown do not reflect taxes that a shareholder would pay on fund distributions or on the sale of fund shares.
|
|
| Updated Performance Information Location [Text Block] |
|
Updated performance information is available on our website at vanguard.com/performance or by calling Vanguard toll-free at 800-662-7447.
|
|
| AssetsNet |
|
$ 6,609,000,000
|
|
| Holdings Count | Holding |
|
279
|
|
| Advisory Fees Paid, Amount |
|
$ 73,000
|
|
| InvestmentCompanyPortfolioTurnover |
|
13.00%
|
|
| Additional Fund Statistics [Text Block] |
|
Fund Statistics
(as of August 31, 2026)Table SummaryFund Net Assets (in millions) | $6,609 |
|---|
Number of Portfolio Holdings | 279 |
|---|
Portfolio Turnover Rate | 13% |
|---|
Total Investment Advisory Fees (in thousands) | $73 |
|---|
|
|
| Holdings [Text Block] |
|
Portfolio Composition % of Net Assets
(as of August 31, 2026)Table SummaryAutomobile Components | 2.5% |
|---|
Automobiles | 18.2% |
|---|
Broadline Retail | 25.3% |
|---|
Distributors | 0.8% |
|---|
Diversified Consumer Services | 2.2% |
|---|
Hotels, Restaurants & Leisure | 21.9% |
|---|
Household Durables | 5.3% |
|---|
Leisure Products | 1.2% |
|---|
Specialty Retail | 19.3% |
|---|
Textiles, Apparel & Luxury Goods | 3.2% |
|---|
Other Assets and Liabilities—Net | 0.1% |
|---|
This table reflects the Fund's investments, including short-term investments, derivatives and other assets and liabilities. |
|
| Material Fund Change [Text Block] |
|
|
|
| Updated Prospectus Phone Number |
|
800-662-7447
|
|
| Updated Prospectus Web Address |
|
https://personal1.vanguard.com/ngf-next-gen-form-webapp/fund-literature
|
|
| C000012217 |
|
|
|
| Shareholder Report [Line Items] |
|
|
|
| Fund Name |
|
Consumer Staples Index Fund
|
|
| Class Name |
|
ETF Shares
|
|
| Trading Symbol |
|
VDC
|
|
| Security Exchange Name |
|
NYSEArca
|
|
| Annual or Semi-Annual Statement [Text Block] |
|
This annual shareholder report contains important information about Vanguard Consumer Staples Index Fund (the "Fund") for the period of September 1, 2025, to August 31, 2026.
|
|
| Additional Information [Text Block] |
|
You can find additional information about the Fund at https://personal1.vanguard.com/ngf-next-gen-form-webapp/fund-literature. You can also request this information by contacting us at 800-662-7447.
|
|
| Additional Information Phone Number |
|
<span style="white-space: nowrap; box-sizing: border-box; color: rgb(0, 0, 0); display: inline; flex-wrap: nowrap; font-size: 10.6667px; font-weight: 400; grid-area: auto; line-height: 16px; margin: 0px; overflow: visible; text-align: left; text-align-last: auto;"> 800-662-7447</span>
|
|
| Additional Information Website |
|
<span style="white-space: nowrap; box-sizing: border-box; color: rgb(0, 0, 0); display: inline; flex-wrap: nowrap; font-size: 10.6667px; font-weight: 400; grid-area: auto; line-height: 16px; margin: 0px; overflow: visible; text-align: left; text-align-last: auto;"> <span style="box-sizing: border-box; color: rgb(0, 0, 0); display: inline; flex-wrap: nowrap; font-size: 10.6667px; font-weight: 400; grid-area: auto; line-height: 16px; margin: 0px; overflow: visible; text-align: left; text-align-last: auto; white-space-collapse: collapse;"><span style="text-decoration: underline; box-sizing: border-box; color: rgb(0, 0, 0); display: inline; flex-wrap: nowrap; font-size: 10.6667px; font-weight: 400; grid-area: auto; line-height: 16px; margin: 0px; overflow: visible; text-align: left; text-align-last: auto; white-space-collapse: collapse;">https://personal1.vanguard.com/ngf-next-gen-form-webapp/fund-literature</span></span></span>
|
|
| Expenses [Text Block] |
|
What were the Fund costs for the last year?(based on a hypothetical $10,000 investment) Table SummaryShare Class Name | Costs of a $10,000 investment | Costs paid as a percentage of a $10,000 investment |
|---|
ETF Shares | $9 | 0.09% |
|---|
|
|
| Expenses Paid, Amount |
|
$ 9
|
|
| Expense Ratio, Percent |
|
0.09%
|
|
| Factors Affecting Performance [Text Block] |
|
How did the Fund perform during the reporting period? For the 12 months ended August 31, 2026, the Fund performed roughly in line with its benchmark. Global equities posted strong returns, while global bonds struggled. Resilient growth and corporate earnings supported stocks, though shifting U.S. trade policy, persistent inflation, and Middle East tensions that disrupted energy supplies and raised oil prices fueled volatility. Some central banks, including those in the United States and United Kingdom, lowered rates. However, developed-market government bond yields generally rose amid concerns about borrowing, inflation, and monetary policy. Coca-Cola (+32%), Walmart (+9%), and Target (+74%) contributed the most to the benchmark’s return. They accounted for about 24% of the index at the end of the reporting period and added about 5 percentage points to its result. Procter & Gamble (–5%), Celsius Holdings (–50%), and BellRing Brands (–74%) detracted the most.
|
|
| Performance Past Does Not Indicate Future [Text] |
|
Keep in mind that the Fund's past performance does not indicate how the Fund will perform in the future.
|
|
| Line Graph [Table Text Block] |
|
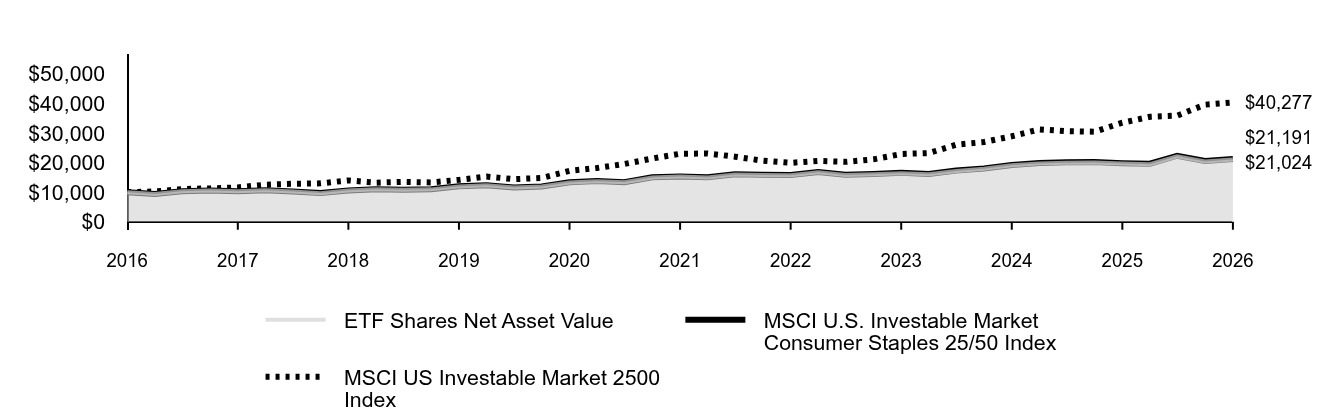 Table Summary | ETF Shares Net Asset Value | MSCI U.S. Investable Market Consumer Staples 25/50 Index | MSCI US Investable Market 2500 Index |
|---|
2016 | $10,000 | $10,000 | $10,000 |
|---|
2016 | $9,396 | $9,396 | $10,232 |
|---|
2017 | $10,267 | $10,269 | $11,030 |
|---|
2017 | $10,586 | $10,592 | $11,271 |
|---|
2017 | $10,283 | $10,290 | $11,606 |
|---|
2017 | $10,634 | $10,644 | $12,514 |
|---|
2018 | $10,220 | $10,231 | $12,820 |
|---|
2018 | $9,668 | $9,680 | $12,966 |
|---|
2018 | $10,550 | $10,566 | $13,959 |
|---|
2018 | $10,998 | $11,017 | $13,205 |
|---|
2019 | $10,768 | $10,789 | $13,469 |
|---|
2019 | $10,937 | $10,962 | $13,288 |
|---|
2019 | $11,947 | $11,976 | $14,144 |
|---|
2019 | $12,287 | $12,320 | $15,258 |
|---|
2020 | $11,531 | $11,565 | $14,384 |
|---|
2020 | $11,877 | $11,916 | $14,801 |
|---|
2020 | $13,262 | $13,308 | $17,181 |
|---|
2020 | $13,709 | $13,761 | $18,176 |
|---|
2021 | $13,317 | $13,370 | $19,508 |
|---|
2021 | $14,933 | $14,998 | $21,356 |
|---|
2021 | $15,253 | $15,324 | $22,952 |
|---|
2021 | $14,961 | $15,035 | $23,066 |
|---|
2022 | $15,945 | $16,028 | $21,982 |
|---|
2022 | $15,828 | $15,913 | $20,624 |
|---|
2022 | $15,684 | $15,772 | $19,900 |
|---|
2022 | $16,704 | $16,802 | $20,565 |
|---|
2023 | $15,774 | $15,866 | $20,229 |
|---|
2023 | $16,056 | $16,151 | $21,076 |
|---|
2023 | $16,413 | $16,511 | $22,888 |
|---|
2023 | $16,010 | $16,110 | $23,198 |
|---|
2024 | $17,177 | $17,288 | $26,023 |
|---|
2024 | $17,907 | $18,024 | $26,923 |
|---|
2024 | $19,070 | $19,198 | $28,873 |
|---|
2024 | $19,719 | $19,854 | $31,200 |
|---|
2025 | $19,926 | $20,067 | $30,603 |
|---|
2025 | $20,015 | $20,161 | $30,422 |
|---|
2025 | $19,640 | $19,779 | $33,454 |
|---|
2025 | $19,463 | $19,605 | $35,455 |
|---|
2026 | $22,133 | $22,300 | $35,849 |
|---|
2026 | $20,393 | $20,551 | $39,554 |
|---|
2026 | $21,024 | $21,191 | $40,277 |
|---|
|
|
| Average Annual Return [Table Text Block] |
|
Table Summary | 1 Year | 5 Years | 10 Years |
|---|
ETF Shares Net Asset Value | 7.05% | 6.63% | 7.71% |
|---|
ETF Shares Market Price | 7.08% | 6.63% | 7.72% |
|---|
MSCI U.S. Investable Market Consumer Staples 25/50 Index | 7.14% | 6.70% | 7.80% |
|---|
MSCI US Investable Market 2500 Index | 20.40% | 11.90% | 14.95% |
|---|
|
|
| No Deduction of Taxes [Text Block] |
|
The graph and returns shown do not reflect taxes that a shareholder would pay on fund distributions or on the sale of fund shares.
|
|
| Updated Performance Information Location [Text Block] |
|
Updated performance information is available on our website at vanguard.com/performance or by calling Vanguard toll-free at 800-662-7447.
|
|
| AssetsNet |
|
$ 9,256,000,000
|
|
| Holdings Count | Holding |
|
106
|
|
| Advisory Fees Paid, Amount |
|
$ 91,000
|
|
| InvestmentCompanyPortfolioTurnover |
|
11.00%
|
|
| Additional Fund Statistics [Text Block] |
|
Fund Statistics
(as of August 31, 2026)Table SummaryFund Net Assets (in millions) | $9,256 |
|---|
Number of Portfolio Holdings | 106 |
|---|
Portfolio Turnover Rate | 11% |
|---|
Total Investment Advisory Fees (in thousands) | $91 |
|---|
|
|
| Holdings [Text Block] |
|
Portfolio Composition % of Net Assets
(as of August 31, 2026)Table SummaryBeverages | 20.8% |
|---|
Consumer Staples Distribution & Retail | 37.7% |
|---|
Food Products | 13.9% |
|---|
Household Products | 15.3% |
|---|
Personal Care Products | 3.5% |
|---|
Tobacco | 8.6% |
|---|
Other Assets and Liabilities—Net | 0.2% |
|---|
This table reflects the Fund's investments, including short-term investments, derivatives and other assets and liabilities. |
|
| Material Fund Change [Text Block] |
|
|
|
| Updated Prospectus Phone Number |
|
800-662-7447
|
|
| Updated Prospectus Web Address |
|
https://personal1.vanguard.com/ngf-next-gen-form-webapp/fund-literature
|
|
| C000012216 |
|
|
|
| Shareholder Report [Line Items] |
|
|
|
| Fund Name |
|
Consumer Staples Index Fund
|
|
| Class Name |
|
Admiral™ Shares
|
|
| Trading Symbol |
|
VCSAX
|
|
| Annual or Semi-Annual Statement [Text Block] |
|
This annual shareholder report contains important information about Vanguard Consumer Staples Index Fund (the "Fund") for the period of September 1, 2025, to August 31, 2026.
|
|
| Additional Information [Text Block] |
|
You can find additional information about the Fund at https://personal1.vanguard.com/ngf-next-gen-form-webapp/fund-literature. You can also request this information by contacting us at 800-662-7447.
|
|
| Additional Information Phone Number |
|
<span style="white-space: nowrap; box-sizing: border-box; color: rgb(0, 0, 0); display: inline; flex-wrap: nowrap; font-size: 10.6667px; font-weight: 400; grid-area: auto; line-height: 16px; margin: 0px; overflow: visible; text-align: left; text-align-last: auto;"> 800-662-7447</span>
|
|
| Additional Information Website |
|
<span style="white-space: nowrap; box-sizing: border-box; color: rgb(0, 0, 0); display: inline; flex-wrap: nowrap; font-size: 10.6667px; font-weight: 400; grid-area: auto; line-height: 16px; margin: 0px; overflow: visible; text-align: left; text-align-last: auto;"> <span style="box-sizing: border-box; color: rgb(0, 0, 0); display: inline; flex-wrap: nowrap; font-size: 10.6667px; font-weight: 400; grid-area: auto; line-height: 16px; margin: 0px; overflow: visible; text-align: left; text-align-last: auto; white-space-collapse: collapse;"><span style="text-decoration: underline; box-sizing: border-box; color: rgb(0, 0, 0); display: inline; flex-wrap: nowrap; font-size: 10.6667px; font-weight: 400; grid-area: auto; line-height: 16px; margin: 0px; overflow: visible; text-align: left; text-align-last: auto; white-space-collapse: collapse;">https://personal1.vanguard.com/ngf-next-gen-form-webapp/fund-literature</span></span></span>
|
|
| Expenses [Text Block] |
|
What were the Fund costs for the last year?(based on a hypothetical $10,000 investment) Table SummaryShare Class Name | Costs of a $10,000 investment | Costs paid as a percentage of a $10,000 investment |
|---|
Admiral Shares | $9 | 0.09% |
|---|
|
|
| Expenses Paid, Amount |
|
$ 9
|
|
| Expense Ratio, Percent |
|
0.09%
|
|
| Factors Affecting Performance [Text Block] |
|
How did the Fund perform during the reporting period? For the 12 months ended August 31, 2026, the Fund performed roughly in line with its benchmark. Global equities posted strong returns, while global bonds struggled. Resilient growth and corporate earnings supported stocks, though shifting U.S. trade policy, persistent inflation, and Middle East tensions that disrupted energy supplies and raised oil prices fueled volatility. Some central banks, including those in the United States and United Kingdom, lowered rates. However, developed-market government bond yields generally rose amid concerns about borrowing, inflation, and monetary policy. Coca-Cola (+32%), Walmart (+9%), and Target (+74%) contributed the most to the benchmark’s return. They accounted for about 24% of the index at the end of the reporting period and added about 5 percentage points to its result. Procter & Gamble (–5%), Celsius Holdings (–50%), and BellRing Brands (–74%) detracted the most.
|
|
| Performance Past Does Not Indicate Future [Text] |
|
Keep in mind that the Fund's past performance does not indicate how the Fund will perform in the future.
|
|
| Line Graph [Table Text Block] |
|
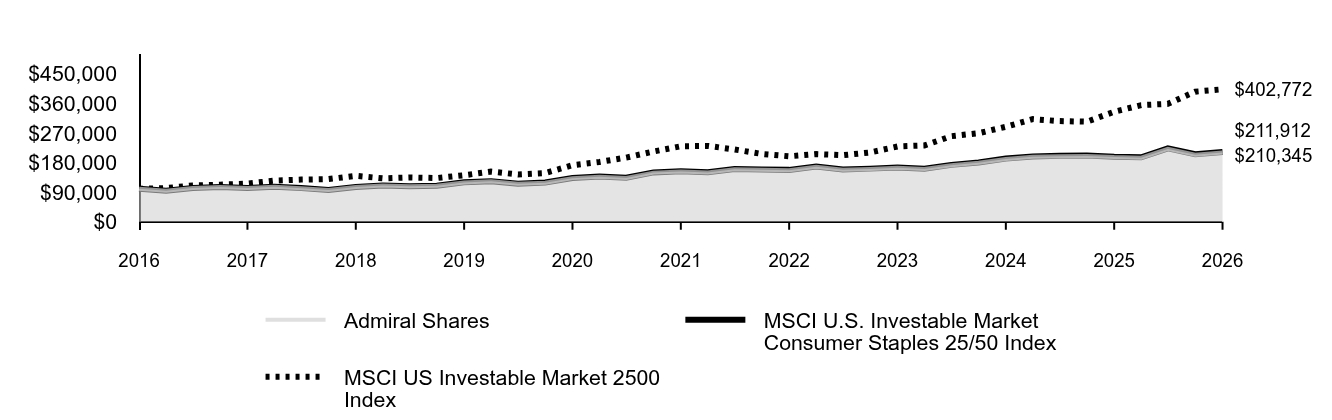 Table Summary | Admiral Shares | MSCI U.S. Investable Market Consumer Staples 25/50 Index | MSCI US Investable Market 2500 Index |
|---|
2016 | $100,000 | $100,000 | $100,000 |
|---|
2016 | $93,948 | $93,963 | $102,323 |
|---|
2017 | $102,655 | $102,694 | $110,301 |
|---|
2017 | $105,846 | $105,915 | $112,713 |
|---|
2017 | $102,813 | $102,900 | $116,055 |
|---|
2017 | $106,314 | $106,436 | $125,136 |
|---|
2018 | $102,176 | $102,311 | $128,197 |
|---|
2018 | $96,659 | $96,801 | $129,658 |
|---|
2018 | $105,479 | $105,658 | $139,594 |
|---|
2018 | $109,954 | $110,165 | $132,050 |
|---|
2019 | $107,658 | $107,886 | $134,688 |
|---|
2019 | $109,362 | $109,617 | $132,882 |
|---|
2019 | $119,448 | $119,760 | $141,436 |
|---|
2019 | $122,856 | $123,202 | $152,576 |
|---|
2020 | $115,297 | $115,648 | $143,841 |
|---|
2020 | $118,775 | $119,158 | $148,014 |
|---|
2020 | $132,621 | $133,081 | $171,813 |
|---|
2020 | $137,094 | $137,610 | $181,762 |
|---|
2021 | $133,177 | $133,705 | $195,080 |
|---|
2021 | $149,352 | $149,977 | $213,559 |
|---|
2021 | $152,567 | $153,239 | $229,522 |
|---|
2021 | $149,647 | $150,348 | $230,655 |
|---|
2022 | $159,489 | $160,275 | $219,820 |
|---|
2022 | $158,332 | $159,128 | $206,240 |
|---|
2022 | $156,916 | $157,715 | $199,000 |
|---|
2022 | $167,130 | $168,016 | $205,651 |
|---|
2023 | $157,808 | $158,656 | $202,286 |
|---|
2023 | $160,636 | $161,505 | $210,760 |
|---|
2023 | $164,218 | $165,115 | $228,878 |
|---|
2023 | $160,182 | $161,100 | $231,975 |
|---|
2024 | $171,873 | $172,878 | $260,227 |
|---|
2024 | $179,170 | $180,236 | $269,232 |
|---|
2024 | $190,805 | $191,981 | $288,732 |
|---|
2024 | $197,306 | $198,541 | $312,002 |
|---|
2025 | $199,367 | $200,671 | $306,030 |
|---|
2025 | $200,267 | $201,610 | $304,223 |
|---|
2025 | $196,503 | $197,795 | $334,541 |
|---|
2025 | $194,725 | $196,047 | $354,555 |
|---|
2026 | $221,454 | $223,001 | $358,486 |
|---|
2026 | $204,050 | $205,511 | $395,539 |
|---|
2026 | $210,345 | $211,912 | $402,772 |
|---|
|
|
| Average Annual Return [Table Text Block] |
|
Table Summary | 1 Year | 5 Years | 10 Years |
|---|
Admiral Shares | 7.04% | 6.63% | 7.72% |
|---|
MSCI U.S. Investable Market Consumer Staples 25/50 Index | 7.14% | 6.70% | 7.80% |
|---|
MSCI US Investable Market 2500 Index | 20.40% | 11.90% | 14.95% |
|---|
|
|
| No Deduction of Taxes [Text Block] |
|
The graph and returns shown do not reflect taxes that a shareholder would pay on fund distributions or on the sale of fund shares.
|
|
| Updated Performance Information Location [Text Block] |
|
Updated performance information is available on our website at vanguard.com/performance or by calling Vanguard toll-free at 800-662-7447.
|
|
| AssetsNet |
|
$ 9,256,000,000
|
|
| Holdings Count | Holding |
|
106
|
|
| Advisory Fees Paid, Amount |
|
$ 91,000
|
|
| InvestmentCompanyPortfolioTurnover |
|
11.00%
|
|
| Additional Fund Statistics [Text Block] |
|
Fund Statistics
(as of August 31, 2026)Table SummaryFund Net Assets (in millions) | $9,256 |
|---|
Number of Portfolio Holdings | 106 |
|---|
Portfolio Turnover Rate | 11% |
|---|
Total Investment Advisory Fees (in thousands) | $91 |
|---|
|
|
| Holdings [Text Block] |
|
Portfolio Composition % of Net Assets
(as of August 31, 2026)Table SummaryBeverages | 20.8% |
|---|
Consumer Staples Distribution & Retail | 37.7% |
|---|
Food Products | 13.9% |
|---|
Household Products | 15.3% |
|---|
Personal Care Products | 3.5% |
|---|
Tobacco | 8.6% |
|---|
Other Assets and Liabilities—Net | 0.2% |
|---|
This table reflects the Fund's investments, including short-term investments, derivatives and other assets and liabilities. |
|
| Material Fund Change [Text Block] |
|
|
|
| Updated Prospectus Phone Number |
|
800-662-7447
|
|
| Updated Prospectus Web Address |
|
https://personal1.vanguard.com/ngf-next-gen-form-webapp/fund-literature
|
|
| C000012219 |
|
|
|
| Shareholder Report [Line Items] |
|
|
|
| Fund Name |
|
Energy Index Fund
|
|
| Class Name |
|
ETF Shares
|
|
| Trading Symbol |
|
VDE
|
|
| Security Exchange Name |
|
NYSEArca
|
|
| Annual or Semi-Annual Statement [Text Block] |
|
This annual shareholder report contains important information about Vanguard Energy Index Fund (the "Fund") for the period of September 1, 2025, to August 31, 2026.
|
|
| Additional Information [Text Block] |
|
You can find additional information about the Fund at https://personal1.vanguard.com/ngf-next-gen-form-webapp/fund-literature. You can also request this information by contacting us at 800-662-7447.
|
|
| Additional Information Phone Number |
|
<span style="white-space: nowrap; box-sizing: border-box; color: rgb(0, 0, 0); display: inline; flex-wrap: nowrap; font-size: 10.6667px; font-weight: 400; grid-area: auto; line-height: 16px; margin: 0px; overflow: visible; text-align: left; text-align-last: auto;"> 800-662-7447</span>
|
|
| Additional Information Website |
|
<span style="white-space: nowrap; box-sizing: border-box; color: rgb(0, 0, 0); display: inline; flex-wrap: nowrap; font-size: 10.6667px; font-weight: 400; grid-area: auto; line-height: 16px; margin: 0px; overflow: visible; text-align: left; text-align-last: auto;"> <span style="box-sizing: border-box; color: rgb(0, 0, 0); display: inline; flex-wrap: nowrap; font-size: 10.6667px; font-weight: 400; grid-area: auto; line-height: 16px; margin: 0px; overflow: visible; text-align: left; text-align-last: auto; white-space-collapse: collapse;"><span style="text-decoration: underline; box-sizing: border-box; color: rgb(0, 0, 0); display: inline; flex-wrap: nowrap; font-size: 10.6667px; font-weight: 400; grid-area: auto; line-height: 16px; margin: 0px; overflow: visible; text-align: left; text-align-last: auto; white-space-collapse: collapse;">https://personal1.vanguard.com/ngf-next-gen-form-webapp/fund-literature</span></span></span>
|
|
| Expenses [Text Block] |
|
What were the Fund costs for the last year?(based on a hypothetical $10,000 investment) Table SummaryShare Class Name | Costs of a $10,000 investment | Costs paid as a percentage of a $10,000 investment |
|---|
ETF Shares | $11 | 0.09% |
|---|
|
|
| Expenses Paid, Amount |
|
$ 11
|
|
| Expense Ratio, Percent |
|
0.09%
|
|
| Factors Affecting Performance [Text Block] |
|
How did the Fund perform during the reporting period? For the 12 months ended August 31, 2026, the Fund performed roughly in line with its benchmark. Global equities posted strong returns, while global bonds struggled. Resilient growth and corporate earnings supported stocks, though shifting U.S. trade policy, persistent inflation, and Middle East tensions that disrupted energy supplies and raised oil prices fueled volatility. Some central banks, including those in the United States and United Kingdom, lowered rates. However, developed-market government bond yields generally rose amid concerns about borrowing, inflation, and monetary policy. ExxonMobil Holdings (+45%), Chevron (+33%), and Valero Energy (+141%) contributed most to the benchmark’s return. They accounted for about 40% of the index at the end of the reporting period and added about 20 percentage points to its result. Sable Offshore (–82%), Civitas Resources (–23%), and NextDecade (–30%) detracted the most.
|
|
| Performance Past Does Not Indicate Future [Text] |
|
Keep in mind that the Fund's past performance does not indicate how the Fund will perform in the future.
|
|
| Line Graph [Table Text Block] |
|
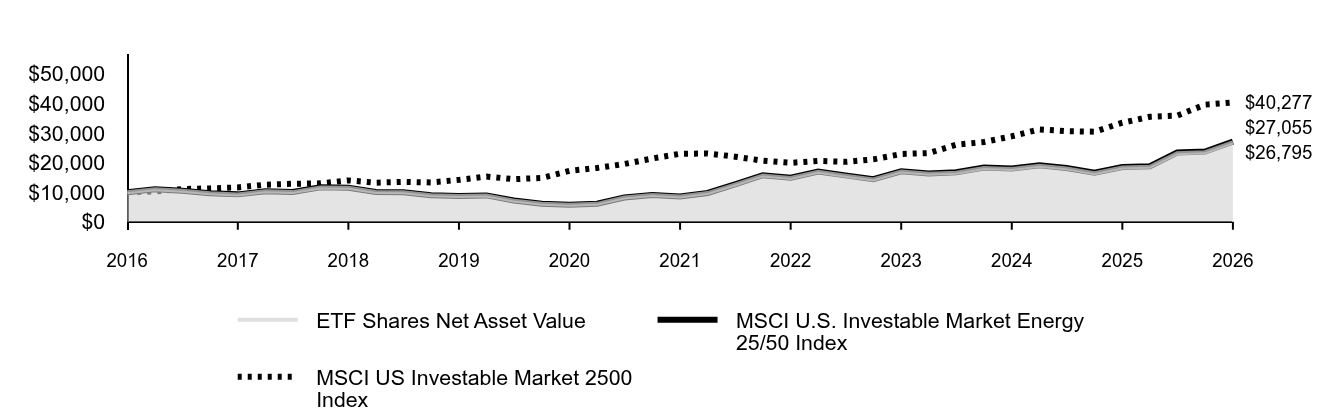 Table Summary | ETF Shares Net Asset Value | MSCI U.S. Investable Market Energy 25/50 Index | MSCI US Investable Market 2500 Index |
|---|
2016 | $10,000 | $10,000 | $10,000 |
|---|
2016 | $10,936 | $10,938 | $10,232 |
|---|
2017 | $10,473 | $10,474 | $11,030 |
|---|
2017 | $9,603 | $9,605 | $11,271 |
|---|
2017 | $9,245 | $9,250 | $11,606 |
|---|
2017 | $10,324 | $10,332 | $12,514 |
|---|
2018 | $10,013 | $10,023 | $12,820 |
|---|
2018 | $11,598 | $11,613 | $12,966 |
|---|
2018 | $11,470 | $11,487 | $13,959 |
|---|
2018 | $10,051 | $10,073 | $13,205 |
|---|
2019 | $9,922 | $9,946 | $13,469 |
|---|
2019 | $8,955 | $8,980 | $13,288 |
|---|
2019 | $8,677 | $8,703 | $14,144 |
|---|
2019 | $8,871 | $8,897 | $15,258 |
|---|
2020 | $7,136 | $7,158 | $14,384 |
|---|
2020 | $6,083 | $6,105 | $14,801 |
|---|
2020 | $5,738 | $5,756 | $17,181 |
|---|
2020 | $6,046 | $6,066 | $18,176 |
|---|
2021 | $8,174 | $8,203 | $19,508 |
|---|
2021 | $9,017 | $9,052 | $21,356 |
|---|
2021 | $8,496 | $8,535 | $22,952 |
|---|
2021 | $9,680 | $9,725 | $23,066 |
|---|
2022 | $12,560 | $12,621 | $21,982 |
|---|
2022 | $15,640 | $15,719 | $20,624 |
|---|
2022 | $14,789 | $14,863 | $19,900 |
|---|
2022 | $16,850 | $16,951 | $20,565 |
|---|
2023 | $15,566 | $15,663 | $20,229 |
|---|
2023 | $14,262 | $14,355 | $21,076 |
|---|
2023 | $16,934 | $17,051 | $22,888 |
|---|
2023 | $16,213 | $16,329 | $23,198 |
|---|
2024 | $16,578 | $16,703 | $26,023 |
|---|
2024 | $18,154 | $18,295 | $26,923 |
|---|
2024 | $17,844 | $17,985 | $28,873 |
|---|
2024 | $18,953 | $19,108 | $31,200 |
|---|
2025 | $18,027 | $18,179 | $30,603 |
|---|
2025 | $16,393 | $16,535 | $30,422 |
|---|
2025 | $18,346 | $18,510 | $33,454 |
|---|
2025 | $18,602 | $18,773 | $35,455 |
|---|
2026 | $23,155 | $23,369 | $35,849 |
|---|
2026 | $23,501 | $23,723 | $39,554 |
|---|
2026 | $26,795 | $27,055 | $40,277 |
|---|
|
|
| Average Annual Return [Table Text Block] |
|
Table Summary | 1 Year | 5 Years | 10 Years |
|---|
ETF Shares Net Asset Value | 46.05% | 25.82% | 10.36% |
|---|
ETF Shares Market Price | 46.09% | 25.84% | 10.36% |
|---|
MSCI U.S. Investable Market Energy 25/50 Index | 46.16% | 25.95% | 10.46% |
|---|
MSCI US Investable Market 2500 Index | 20.40% | 11.90% | 14.95% |
|---|
|
|
| No Deduction of Taxes [Text Block] |
|
The graph and returns shown do not reflect taxes that a shareholder would pay on fund distributions or on the sale of fund shares.
|
|
| Updated Performance Information Location [Text Block] |
|
Updated performance information is available on our website at vanguard.com/performance or by calling Vanguard toll-free at 800-662-7447.
|
|
| AssetsNet |
|
$ 13,243,000,000
|
|
| Holdings Count | Holding |
|
115
|
|
| Advisory Fees Paid, Amount |
|
$ 102,000
|
|
| InvestmentCompanyPortfolioTurnover |
|
8.00%
|
|
| Additional Fund Statistics [Text Block] |
|
Fund Statistics
(as of August 31, 2026)Table SummaryFund Net Assets (in millions) | $13,243 |
|---|
Number of Portfolio Holdings | 115 |
|---|
Portfolio Turnover Rate | 8% |
|---|
Total Investment Advisory Fees (in thousands) | $102 |
|---|
|
|
| Holdings [Text Block] |
|
Portfolio Composition % of Net Assets
(as of August 31, 2026)Table SummaryCoal & Consumable Fuels | 0.8% |
|---|
Integrated Oil & Gas | 37.3% |
|---|
Oil & Gas Drilling | 1.3% |
|---|
Oil & Gas Equipment & Services | 10.8% |
|---|
Oil & Gas Exploration & Production | 21.4% |
|---|
Oil & Gas Refining & Marketing | 13.7% |
|---|
Oil & Gas Storage & Transportation | 14.3% |
|---|
Other Assets and Liabilities—Net | 0.4% |
|---|
This table reflects the Fund's investments, including short-term investments, derivatives and other assets and liabilities. |
|
| Material Fund Change [Text Block] |
|
|
|
| Updated Prospectus Phone Number |
|
800-662-7447
|
|
| Updated Prospectus Web Address |
|
https://personal1.vanguard.com/ngf-next-gen-form-webapp/fund-literature
|
|
| C000012218 |
|
|
|
| Shareholder Report [Line Items] |
|
|
|
| Fund Name |
|
Energy Index Fund
|
|
| Class Name |
|
Admiral™ Shares
|
|
| Trading Symbol |
|
VENAX
|
|
| Annual or Semi-Annual Statement [Text Block] |
|
This annual shareholder report contains important information about Vanguard Energy Index Fund (the "Fund") for the period of September 1, 2025, to August 31, 2026.
|
|
| Additional Information [Text Block] |
|
You can find additional information about the Fund at https://personal1.vanguard.com/ngf-next-gen-form-webapp/fund-literature. You can also request this information by contacting us at 800-662-7447.
|
|
| Additional Information Phone Number |
|
<span style="white-space: nowrap; box-sizing: border-box; color: rgb(0, 0, 0); display: inline; flex-wrap: nowrap; font-size: 10.6667px; font-weight: 400; grid-area: auto; line-height: 16px; margin: 0px; overflow: visible; text-align: left; text-align-last: auto;"> 800-662-7447</span>
|
|
| Additional Information Website |
|
<span style="white-space: nowrap; box-sizing: border-box; color: rgb(0, 0, 0); display: inline; flex-wrap: nowrap; font-size: 10.6667px; font-weight: 400; grid-area: auto; line-height: 16px; margin: 0px; overflow: visible; text-align: left; text-align-last: auto;"> <span style="box-sizing: border-box; color: rgb(0, 0, 0); display: inline; flex-wrap: nowrap; font-size: 10.6667px; font-weight: 400; grid-area: auto; line-height: 16px; margin: 0px; overflow: visible; text-align: left; text-align-last: auto; white-space-collapse: collapse;"><span style="text-decoration: underline; box-sizing: border-box; color: rgb(0, 0, 0); display: inline; flex-wrap: nowrap; font-size: 10.6667px; font-weight: 400; grid-area: auto; line-height: 16px; margin: 0px; overflow: visible; text-align: left; text-align-last: auto; white-space-collapse: collapse;">https://personal1.vanguard.com/ngf-next-gen-form-webapp/fund-literature</span></span></span>
|
|
| Expenses [Text Block] |
|
What were the Fund costs for the last year?(based on a hypothetical $10,000 investment) Table SummaryShare Class Name | Costs of a $10,000 investment | Costs paid as a percentage of a $10,000 investment |
|---|
Admiral Shares | $11 | 0.09% |
|---|
|
|
| Expenses Paid, Amount |
|
$ 11
|
|
| Expense Ratio, Percent |
|
0.09%
|
|
| Factors Affecting Performance [Text Block] |
|
How did the Fund perform during the reporting period? For the 12 months ended August 31, 2026, the Fund performed roughly in line with its benchmark. Global equities posted strong returns, while global bonds struggled. Resilient growth and corporate earnings supported stocks, though shifting U.S. trade policy, persistent inflation, and Middle East tensions that disrupted energy supplies and raised oil prices fueled volatility. Some central banks, including those in the United States and United Kingdom, lowered rates. However, developed-market government bond yields generally rose amid concerns about borrowing, inflation, and monetary policy. ExxonMobil Holdings (+45%), Chevron (+33%), and Valero Energy (+141%) contributed most to the benchmark’s return. They accounted for about 40% of the index at the end of the reporting period and added about 20 percentage points to its result. Sable Offshore (–82%), Civitas Resources (–23%), and NextDecade (–30%) detracted the most.
|
|
| Performance Past Does Not Indicate Future [Text] |
|
Keep in mind that the Fund's past performance does not indicate how the Fund will perform in the future.
|
|
| Line Graph [Table Text Block] |
|
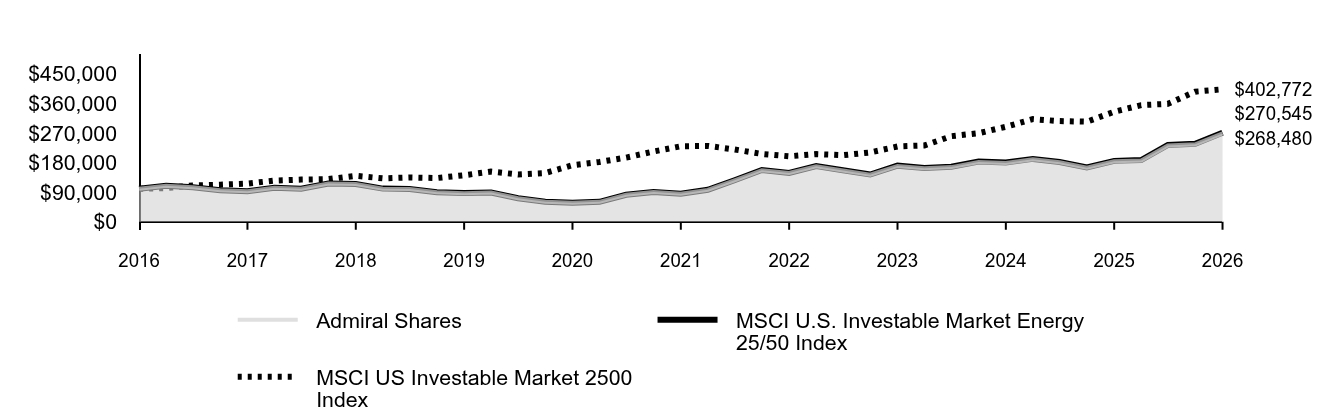 Table Summary | Admiral Shares | MSCI U.S. Investable Market Energy 25/50 Index | MSCI US Investable Market 2500 Index |
|---|
2016 | $100,000 | $100,000 | $100,000 |
|---|
2016 | $109,350 | $109,376 | $102,323 |
|---|
2017 | $104,700 | $104,739 | $110,301 |
|---|
2017 | $95,999 | $96,055 | $112,713 |
|---|
2017 | $92,438 | $92,500 | $116,055 |
|---|
2017 | $103,224 | $103,320 | $125,136 |
|---|
2018 | $100,121 | $100,225 | $128,197 |
|---|
2018 | $115,968 | $116,129 | $129,658 |
|---|
2018 | $114,682 | $114,871 | $139,594 |
|---|
2018 | $100,506 | $100,726 | $132,050 |
|---|
2019 | $99,219 | $99,460 | $134,688 |
|---|
2019 | $89,556 | $89,797 | $132,882 |
|---|
2019 | $86,778 | $87,031 | $141,436 |
|---|
2019 | $88,691 | $88,967 | $152,576 |
|---|
2020 | $71,357 | $71,579 | $143,841 |
|---|
2020 | $60,884 | $61,055 | $148,014 |
|---|
2020 | $57,432 | $57,562 | $171,813 |
|---|
2020 | $60,528 | $60,658 | $181,762 |
|---|
2021 | $81,825 | $82,028 | $195,080 |
|---|
2021 | $90,273 | $90,516 | $213,559 |
|---|
2021 | $85,101 | $85,348 | $229,522 |
|---|
2021 | $96,929 | $97,253 | $230,655 |
|---|
2022 | $125,797 | $126,213 | $219,820 |
|---|
2022 | $156,637 | $157,194 | $206,240 |
|---|
2022 | $148,053 | $148,628 | $199,000 |
|---|
2022 | $168,789 | $169,506 | $205,651 |
|---|
2023 | $155,931 | $156,625 | $202,286 |
|---|
2023 | $142,867 | $143,553 | $210,760 |
|---|
2023 | $169,641 | $170,508 | $228,878 |
|---|
2023 | $162,437 | $163,291 | $231,975 |
|---|
2024 | $166,114 | $167,033 | $260,227 |
|---|
2024 | $181,902 | $182,951 | $269,232 |
|---|
2024 | $178,785 | $179,845 | $288,732 |
|---|
2024 | $189,910 | $191,077 | $312,002 |
|---|
2025 | $180,612 | $181,789 | $306,030 |
|---|
2025 | $164,236 | $165,352 | $304,223 |
|---|
2025 | $183,808 | $185,099 | $334,541 |
|---|
2025 | $186,391 | $187,728 | $354,555 |
|---|
2026 | $231,981 | $233,694 | $358,486 |
|---|
2026 | $235,450 | $237,234 | $395,539 |
|---|
2026 | $268,480 | $270,545 | $402,772 |
|---|
|
|
| Average Annual Return [Table Text Block] |
|
Table Summary | 1 Year | 5 Years | 10 Years |
|---|
Admiral Shares | 46.07% | 25.83% | 10.38% |
|---|
MSCI U.S. Investable Market Energy 25/50 Index | 46.16% | 25.95% | 10.46% |
|---|
MSCI US Investable Market 2500 Index | 20.40% | 11.90% | 14.95% |
|---|
|
|
| No Deduction of Taxes [Text Block] |
|
The graph and returns shown do not reflect taxes that a shareholder would pay on fund distributions or on the sale of fund shares.
|
|
| Updated Performance Information Location [Text Block] |
|
Updated performance information is available on our website at vanguard.com/performance or by calling Vanguard toll-free at 800-662-7447.
|
|
| AssetsNet |
|
$ 13,243,000,000
|
|
| Holdings Count | Holding |
|
115
|
|
| Advisory Fees Paid, Amount |
|
$ 102,000
|
|
| InvestmentCompanyPortfolioTurnover |
|
8.00%
|
|
| Additional Fund Statistics [Text Block] |
|
Fund Statistics
(as of August 31, 2026)Table SummaryFund Net Assets (in millions) | $13,243 |
|---|
Number of Portfolio Holdings | 115 |
|---|
Portfolio Turnover Rate | 8% |
|---|
Total Investment Advisory Fees (in thousands) | $102 |
|---|
|
|
| Holdings [Text Block] |
|
Portfolio Composition % of Net Assets
(as of August 31, 2026)Table SummaryCoal & Consumable Fuels | 0.8% |
|---|
Integrated Oil & Gas | 37.3% |
|---|
Oil & Gas Drilling | 1.3% |
|---|
Oil & Gas Equipment & Services | 10.8% |
|---|
Oil & Gas Exploration & Production | 21.4% |
|---|
Oil & Gas Refining & Marketing | 13.7% |
|---|
Oil & Gas Storage & Transportation | 14.3% |
|---|
Other Assets and Liabilities—Net | 0.4% |
|---|
This table reflects the Fund's investments, including short-term investments, derivatives and other assets and liabilities. |
|
| Material Fund Change [Text Block] |
|
|
|
| Updated Prospectus Phone Number |
|
800-662-7447
|
|
| Updated Prospectus Web Address |
|
https://personal1.vanguard.com/ngf-next-gen-form-webapp/fund-literature
|
|
| C000012221 |
|
|
|
| Shareholder Report [Line Items] |
|
|
|
| Fund Name |
|
Financials Index Fund
|
|
| Class Name |
|
ETF Shares
|
|
| Trading Symbol |
|
VFH
|
|
| Security Exchange Name |
|
NYSEArca
|
|
| Annual or Semi-Annual Statement [Text Block] |
|
This annual shareholder report contains important information about Vanguard Financials Index Fund (the "Fund") for the period of September 1, 2025, to August 31, 2026.
|
|
| Additional Information [Text Block] |
|
You can find additional information about the Fund at https://personal1.vanguard.com/ngf-next-gen-form-webapp/fund-literature. You can also request this information by contacting us at 800-662-7447.
|
|
| Material Fund Change Notice [Text Block] |
|
The report describes changes to the Fund that occurred during the reporting period.
|
|
| Additional Information Phone Number |
|
<span style="white-space: nowrap; box-sizing: border-box; color: rgb(0, 0, 0); display: inline; flex-wrap: nowrap; font-size: 10.6667px; font-weight: 400; grid-area: auto; line-height: 16px; margin: 0px; overflow: visible; text-align: left; text-align-last: auto;"> 800-662-7447</span>
|
|
| Additional Information Website |
|
<span style="white-space: nowrap; box-sizing: border-box; color: rgb(0, 0, 0); display: inline; flex-wrap: nowrap; font-size: 10.6667px; font-weight: 400; grid-area: auto; line-height: 16px; margin: 0px; overflow: visible; text-align: left; text-align-last: auto;"> <span style="box-sizing: border-box; color: rgb(0, 0, 0); display: inline; flex-wrap: nowrap; font-size: 10.6667px; font-weight: 400; grid-area: auto; line-height: 16px; margin: 0px; overflow: visible; text-align: left; text-align-last: auto; white-space-collapse: collapse;"><span style="text-decoration: underline; box-sizing: border-box; color: rgb(0, 0, 0); display: inline; flex-wrap: nowrap; font-size: 10.6667px; font-weight: 400; grid-area: auto; line-height: 16px; margin: 0px; overflow: visible; text-align: left; text-align-last: auto; white-space-collapse: collapse;">https://personal1.vanguard.com/ngf-next-gen-form-webapp/fund-literature</span></span></span>
|
|
| Expenses [Text Block] |
|
What were the Fund costs for the last year?(based on a hypothetical $10,000 investment) Table SummaryShare Class Name | Costs of a $10,000 investment | Costs paid as a percentage of a $10,000 investment |
|---|
ETF Shares | $9 | 0.09% |
|---|
|
|
| Expenses Paid, Amount |
|
$ 9
|
|
| Expense Ratio, Percent |
|
0.09%
|
|
| Factors Affecting Performance [Text Block] |
|
How did the Fund perform during the reporting period? For the 12 months ended August 31, 2026, the Fund performed roughly in line with its benchmark. Global equities posted strong returns, while global bonds struggled. Resilient growth and corporate earnings supported stocks, though shifting U.S. trade policy and persistent inflation fueled volatility, as did Middle East tensions that disrupted energy supplies and raised oil prices. Some central banks, including those in the United States and the United Kingdom, lowered rates. However, developed-market government bond yields generally rose amid concerns about borrowing, inflation, and monetary policy. JPMorgan Chase (+20%), Goldman Sachs Group (+40%), and Bank of America (+25%) contributed the most to the benchmark’s return. They accounted for about 18% of the index at the end of the reporting period and added about 4 percentage points to its result. Fiserv (–61%), S&P Global (–16%), and Coinbase Global (–38%) detracted the most.
|
|
| Performance Past Does Not Indicate Future [Text] |
|
Keep in mind that the Fund's past performance does not indicate how the Fund will perform in the future.
|
|
| Line Graph [Table Text Block] |
|
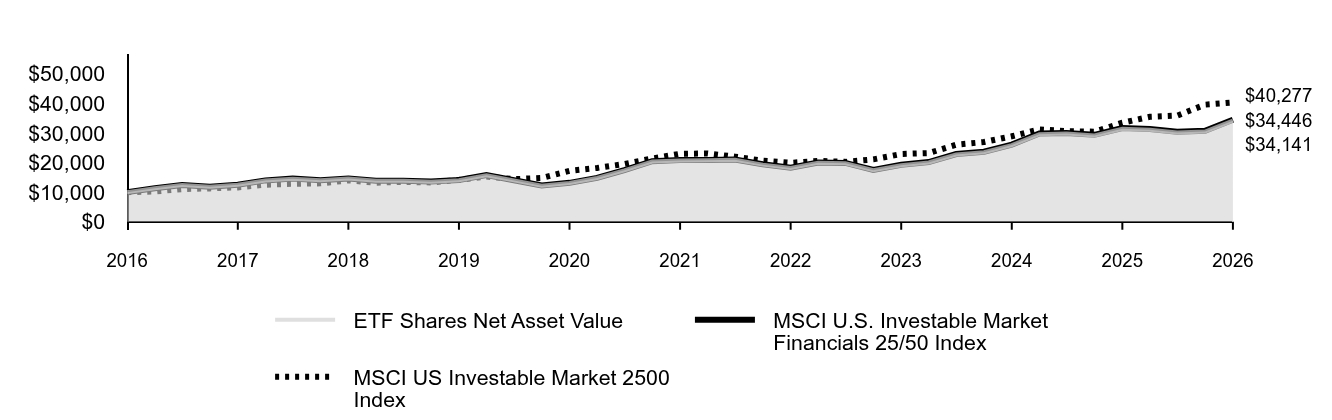 Table Summary | ETF Shares Net Asset Value | MSCI U.S. Investable Market Financials 25/50 Index | MSCI US Investable Market 2500 Index |
|---|
2016 | $10,000 | $10,000 | $10,000 |
|---|
2016 | $11,324 | $11,329 | $10,232 |
|---|
2017 | $12,389 | $12,395 | $11,030 |
|---|
2017 | $11,789 | $11,797 | $11,271 |
|---|
2017 | $12,465 | $12,477 | $11,606 |
|---|
2017 | $13,952 | $13,969 | $12,514 |
|---|
2018 | $14,561 | $14,581 | $12,820 |
|---|
2018 | $14,014 | $14,037 | $12,966 |
|---|
2018 | $14,603 | $14,631 | $13,959 |
|---|
2018 | $13,833 | $13,862 | $13,205 |
|---|
2019 | $13,817 | $13,848 | $13,469 |
|---|
2019 | $13,521 | $13,556 | $13,288 |
|---|
2019 | $14,040 | $14,078 | $14,144 |
|---|
2019 | $15,726 | $15,772 | $15,258 |
|---|
2020 | $13,971 | $14,015 | $14,384 |
|---|
2020 | $12,194 | $12,241 | $14,801 |
|---|
2020 | $13,095 | $13,146 | $17,181 |
|---|
2020 | $14,771 | $14,828 | $18,176 |
|---|
2021 | $17,376 | $17,449 | $19,508 |
|---|
2021 | $20,352 | $20,443 | $21,356 |
|---|
2021 | $20,725 | $20,825 | $22,952 |
|---|
2021 | $20,752 | $20,857 | $23,066 |
|---|
2022 | $20,942 | $21,053 | $21,982 |
|---|
2022 | $19,291 | $19,399 | $20,624 |
|---|
2022 | $18,150 | $18,253 | $19,900 |
|---|
2022 | $19,897 | $20,008 | $20,565 |
|---|
2023 | $19,771 | $19,883 | $20,229 |
|---|
2023 | $17,393 | $17,495 | $21,076 |
|---|
2023 | $19,106 | $19,225 | $22,888 |
|---|
2023 | $20,022 | $20,151 | $23,198 |
|---|
2024 | $22,715 | $22,867 | $26,023 |
|---|
2024 | $23,484 | $23,647 | $26,923 |
|---|
2024 | $25,887 | $26,073 | $28,873 |
|---|
2024 | $29,593 | $29,815 | $31,200 |
|---|
2025 | $29,787 | $30,015 | $30,603 |
|---|
2025 | $29,149 | $29,376 | $30,422 |
|---|
2025 | $31,407 | $31,659 | $33,454 |
|---|
2025 | $31,047 | $31,302 | $35,455 |
|---|
2026 | $30,144 | $30,395 | $35,849 |
|---|
2026 | $30,479 | $30,741 | $39,554 |
|---|
2026 | $34,141 | $34,446 | $40,277 |
|---|
|
|
| Average Annual Return [Table Text Block] |
|
Table Summary | 1 Year | 5 Years | 10 Years |
|---|
ETF Shares Net Asset Value | 8.71% | 10.50% | 13.07% |
|---|
ETF Shares Market Price | 8.74% | 10.51% | 13.07% |
|---|
MSCI U.S. Investable Market Financials 25/50 Index | 8.80% | 10.59% | 13.17% |
|---|
MSCI US Investable Market 2500 Index | 20.40% | 11.90% | 14.95% |
|---|
|
|
| No Deduction of Taxes [Text Block] |
|
The graph and returns shown do not reflect taxes that a shareholder would pay on fund distributions or on the sale of fund shares.
|
|
| Material Change Date |
|
|
Aug. 31, 2025
|
| Updated Performance Information Location [Text Block] |
|
Updated performance information is available on our website at vanguard.com/performance or by calling Vanguard toll-free at 800-662-7447.
|
|
| AssetsNet |
|
$ 14,772,000,000
|
|
| Holdings Count | Holding |
|
432
|
|
| Advisory Fees Paid, Amount |
|
$ 150,000
|
|
| InvestmentCompanyPortfolioTurnover |
|
6.00%
|
|
| Additional Fund Statistics [Text Block] |
|
Fund Statistics
(as of August 31, 2026)Table SummaryFund Net Assets (in millions) | $14,772 |
|---|
Number of Portfolio Holdings | 432 |
|---|
Portfolio Turnover Rate | 6% |
|---|
Total Investment Advisory Fees (in thousands) | $150 |
|---|
|
|
| Holdings [Text Block] |
|
Portfolio Composition % of Net Assets
(as of August 31, 2026)Table SummaryBanks | 30.1% |
|---|
Capital Markets | 25.6% |
|---|
Consumer Finance | 4.6% |
|---|
Financial Services | 21.8% |
|---|
Insurance | 14.2% |
|---|
Mortgage Real Estate Investment Trusts (REITs) | 0.7% |
|---|
Other Assets and Liabilities—Net | 3.0% |
|---|
This table reflects the Fund's investments, including short-term investments, derivatives and other assets and liabilities. |
|
| Material Fund Change [Text Block] |
|
How has the Fund changed?During the reporting period, the Fund's shareholders approved a proposal to reclassify the diversification status of the Fund to nondiversified, as defined under the Investment Company Act of 1940, and to eliminate the Fund's related fundamental policy. The Fund added nondiversification risk as a principal investment risk. This is a summary of certain changes to the Fund since August 31, 2025. For more complete information, you may review the Fund’s next prospectus, which we expect to be available by December 31, 2026, at https://personal1.vanguard.com/ngf-next-gen-form-webapp/fund-literature or upon request at 800-662-7447. |
|
| Material Fund Change Risks Change [Text Block] |
|
During the reporting period, the Fund's shareholders approved a proposal to reclassify the diversification status of the Fund to nondiversified, as defined under the Investment Company Act of 1940, and to eliminate the Fund's related fundamental policy. The Fund added nondiversification risk as a principal investment risk.
|
|
| Summary of Change Legend [Text Block] |
|
This is a summary of certain changes to the Fund since August 31, 2025. For more complete information, you may review the Fund’s next prospectus, which we expect to be available by December 31, 2026, at https://personal1.vanguard.com/ngf-next-gen-form-webapp/fund-literature or upon request at 800-662-7447.
|
|
| Updated Prospectus Phone Number |
|
800-662-7447
|
|
| Updated Prospectus Web Address |
|
https://personal1.vanguard.com/ngf-next-gen-form-webapp/fund-literature
|
|
| C000012220 |
|
|
|
| Shareholder Report [Line Items] |
|
|
|
| Fund Name |
|
Financials Index Fund
|
|
| Class Name |
|
Admiral™ Shares
|
|
| Trading Symbol |
|
VFAIX
|
|
| Annual or Semi-Annual Statement [Text Block] |
|
This annual shareholder report contains important information about Vanguard Financials Index Fund (the "Fund") for the period of September 1, 2025, to August 31, 2026.
|
|
| Additional Information [Text Block] |
|
You can find additional information about the Fund at https://personal1.vanguard.com/ngf-next-gen-form-webapp/fund-literature. You can also request this information by contacting us at 800-662-7447.
|
|
| Material Fund Change Notice [Text Block] |
|
The report describes changes to the Fund that occurred during the reporting period.
|
|
| Additional Information Phone Number |
|
<span style="white-space: nowrap; box-sizing: border-box; color: rgb(0, 0, 0); display: inline; flex-wrap: nowrap; font-size: 10.6667px; font-weight: 400; grid-area: auto; line-height: 16px; margin: 0px; overflow: visible; text-align: left; text-align-last: auto;"> 800-662-7447</span>
|
|
| Additional Information Website |
|
<span style="white-space: nowrap; box-sizing: border-box; color: rgb(0, 0, 0); display: inline; flex-wrap: nowrap; font-size: 10.6667px; font-weight: 400; grid-area: auto; line-height: 16px; margin: 0px; overflow: visible; text-align: left; text-align-last: auto;"> <span style="box-sizing: border-box; color: rgb(0, 0, 0); display: inline; flex-wrap: nowrap; font-size: 10.6667px; font-weight: 400; grid-area: auto; line-height: 16px; margin: 0px; overflow: visible; text-align: left; text-align-last: auto; white-space-collapse: collapse;"><span style="text-decoration: underline; box-sizing: border-box; color: rgb(0, 0, 0); display: inline; flex-wrap: nowrap; font-size: 10.6667px; font-weight: 400; grid-area: auto; line-height: 16px; margin: 0px; overflow: visible; text-align: left; text-align-last: auto; white-space-collapse: collapse;">https://personal1.vanguard.com/ngf-next-gen-form-webapp/fund-literature</span></span></span>
|
|
| Expenses [Text Block] |
|
What were the Fund costs for the last year?(based on a hypothetical $10,000 investment) Table SummaryShare Class Name | Costs of a $10,000 investment | Costs paid as a percentage of a $10,000 investment |
|---|
Admiral Shares | $9 | 0.09% |
|---|
|
|
| Expenses Paid, Amount |
|
$ 9
|
|
| Expense Ratio, Percent |
|
0.09%
|
|
| Factors Affecting Performance [Text Block] |
|
How did the Fund perform during the reporting period? For the 12 months ended August 31, 2026, the Fund performed roughly in line with its benchmark. Global equities posted strong returns, while global bonds struggled. Resilient growth and corporate earnings supported stocks, though shifting U.S. trade policy and persistent inflation fueled volatility, as did Middle East tensions that disrupted energy supplies and raised oil prices. Some central banks, including those in the United States and the United Kingdom, lowered rates. However, developed-market government bond yields generally rose amid concerns about borrowing, inflation, and monetary policy. JPMorgan Chase (+20%), Goldman Sachs Group (+40%), and Bank of America (+25%) contributed the most to the benchmark’s return. They accounted for about 18% of the index at the end of the reporting period and added about 4 percentage points to its result. Fiserv (–61%), S&P Global (–16%), and Coinbase Global (–38%) detracted the most.
|
|
| Performance Past Does Not Indicate Future [Text] |
|
Keep in mind that the Fund's past performance does not indicate how the Fund will perform in the future.
|
|
| Line Graph [Table Text Block] |
|
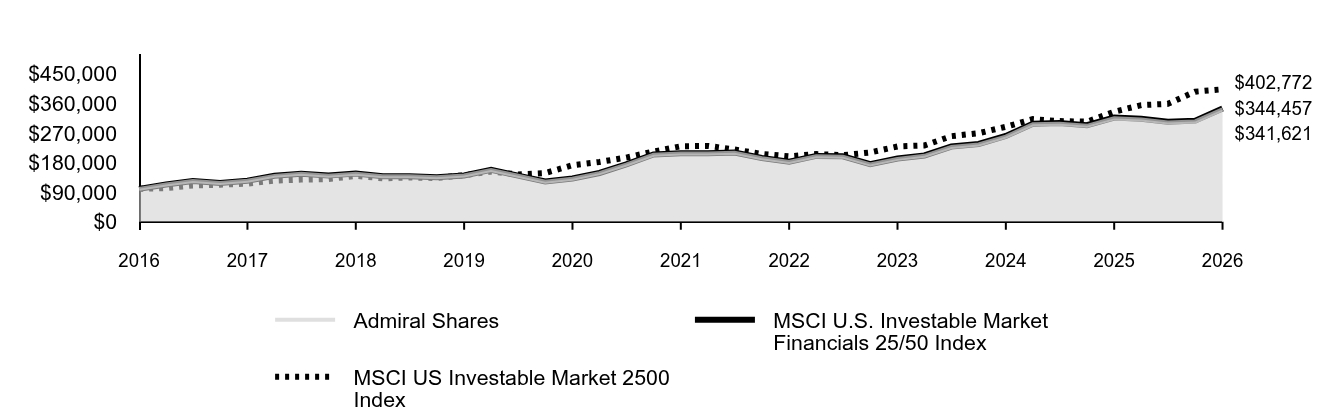 Table Summary | Admiral Shares | MSCI U.S. Investable Market Financials 25/50 Index | MSCI US Investable Market 2500 Index |
|---|
2016 | $100,000 | $100,000 | $100,000 |
|---|
2016 | $113,234 | $113,286 | $102,323 |
|---|
2017 | $123,850 | $123,950 | $110,301 |
|---|
2017 | $117,873 | $117,966 | $112,713 |
|---|
2017 | $124,622 | $124,774 | $116,055 |
|---|
2017 | $139,503 | $139,692 | $125,136 |
|---|
2018 | $145,575 | $145,807 | $128,197 |
|---|
2018 | $140,122 | $140,372 | $129,658 |
|---|
2018 | $146,003 | $146,309 | $139,594 |
|---|
2018 | $138,295 | $138,618 | $132,050 |
|---|
2019 | $138,132 | $138,477 | $134,688 |
|---|
2019 | $135,206 | $135,558 | $132,882 |
|---|
2019 | $140,359 | $140,779 | $141,436 |
|---|
2019 | $157,231 | $157,723 | $152,576 |
|---|
2020 | $139,695 | $140,148 | $143,841 |
|---|
2020 | $121,949 | $122,407 | $148,014 |
|---|
2020 | $130,957 | $131,461 | $171,813 |
|---|
2020 | $147,727 | $148,277 | $181,762 |
|---|
2021 | $173,815 | $174,487 | $195,080 |
|---|
2021 | $203,549 | $204,429 | $213,559 |
|---|
2021 | $207,337 | $208,249 | $229,522 |
|---|
2021 | $207,574 | $208,574 | $230,655 |
|---|
2022 | $209,474 | $210,527 | $219,820 |
|---|
2022 | $193,007 | $193,986 | $206,240 |
|---|
2022 | $181,571 | $182,531 | $199,000 |
|---|
2022 | $199,081 | $200,082 | $205,651 |
|---|
2023 | $197,797 | $198,832 | $202,286 |
|---|
2023 | $174,008 | $174,946 | $210,760 |
|---|
2023 | $191,143 | $192,250 | $228,878 |
|---|
2023 | $200,343 | $201,507 | $231,975 |
|---|
2024 | $227,287 | $228,666 | $260,227 |
|---|
2024 | $234,970 | $236,472 | $269,232 |
|---|
2024 | $259,002 | $260,731 | $288,732 |
|---|
2024 | $296,122 | $298,153 | $312,002 |
|---|
2025 | $298,034 | $300,146 | $306,030 |
|---|
2025 | $291,666 | $293,756 | $304,223 |
|---|
2025 | $314,289 | $316,587 | $334,541 |
|---|
2025 | $310,668 | $313,018 | $354,555 |
|---|
2026 | $301,609 | $303,955 | $358,486 |
|---|
2026 | $304,961 | $307,409 | $395,539 |
|---|
2026 | $341,621 | $344,457 | $402,772 |
|---|
|
|
| Average Annual Return [Table Text Block] |
|
Table Summary | 1 Year | 5 Years | 10 Years |
|---|
Admiral Shares | 8.70% | 10.50% | 13.07% |
|---|
MSCI U.S. Investable Market Financials 25/50 Index | 8.80% | 10.59% | 13.17% |
|---|
MSCI US Investable Market 2500 Index | 20.40% | 11.90% | 14.95% |
|---|
|
|
| No Deduction of Taxes [Text Block] |
|
The graph and returns shown do not reflect taxes that a shareholder would pay on fund distributions or on the sale of fund shares.
|
|
| Material Change Date |
|
|
Aug. 31, 2025
|
| Updated Performance Information Location [Text Block] |
|
Updated performance information is available on our website at vanguard.com/performance or by calling Vanguard toll-free at 800-662-7447.
|
|
| AssetsNet |
|
$ 14,772,000,000
|
|
| Holdings Count | Holding |
|
432
|
|
| Advisory Fees Paid, Amount |
|
$ 150,000
|
|
| InvestmentCompanyPortfolioTurnover |
|
6.00%
|
|
| Additional Fund Statistics [Text Block] |
|
Fund Statistics
(as of August 31, 2026)Table SummaryFund Net Assets (in millions) | $14,772 |
|---|
Number of Portfolio Holdings | 432 |
|---|
Portfolio Turnover Rate | 6% |
|---|
Total Investment Advisory Fees (in thousands) | $150 |
|---|
|
|
| Holdings [Text Block] |
|
Portfolio Composition % of Net Assets
(as of August 31, 2026)Table SummaryBanks | 30.1% |
|---|
Capital Markets | 25.6% |
|---|
Consumer Finance | 4.6% |
|---|
Financial Services | 21.8% |
|---|
Insurance | 14.2% |
|---|
Mortgage Real Estate Investment Trusts (REITs) | 0.7% |
|---|
Other Assets and Liabilities—Net | 3.0% |
|---|
This table reflects the Fund's investments, including short-term investments, derivatives and other assets and liabilities. |
|
| Material Fund Change [Text Block] |
|
How has the Fund changed?During the reporting period, the Fund's shareholders approved a proposal to reclassify the diversification status of the Fund to nondiversified, as defined under the Investment Company Act of 1940, and to eliminate the Fund's related fundamental policy. The Fund added nondiversification risk as a principal investment risk. This is a summary of certain changes to the Fund since August 31, 2025. For more complete information, you may review the Fund’s next prospectus, which we expect to be available by December 31, 2026, at https://personal1.vanguard.com/ngf-next-gen-form-webapp/fund-literature or upon request at 800-662-7447. |
|
| Material Fund Change Risks Change [Text Block] |
|
During the reporting period, the Fund's shareholders approved a proposal to reclassify the diversification status of the Fund to nondiversified, as defined under the Investment Company Act of 1940, and to eliminate the Fund's related fundamental policy. The Fund added nondiversification risk as a principal investment risk.
|
|
| Summary of Change Legend [Text Block] |
|
This is a summary of certain changes to the Fund since August 31, 2025. For more complete information, you may review the Fund’s next prospectus, which we expect to be available by December 31, 2026, at https://personal1.vanguard.com/ngf-next-gen-form-webapp/fund-literature or upon request at 800-662-7447.
|
|
| Updated Prospectus Phone Number |
|
800-662-7447
|
|
| Updated Prospectus Web Address |
|
https://personal1.vanguard.com/ngf-next-gen-form-webapp/fund-literature
|
|
| C000012223 |
|
|
|
| Shareholder Report [Line Items] |
|
|
|
| Fund Name |
|
Health Care Index Fund
|
|
| Class Name |
|
ETF Shares
|
|
| Trading Symbol |
|
VHT
|
|
| Security Exchange Name |
|
NYSEArca
|
|
| Annual or Semi-Annual Statement [Text Block] |
|
This annual shareholder report contains important information about Vanguard Health Care Index Fund (the "Fund") for the period of September 1, 2025, to August 31, 2026.
|
|
| Additional Information [Text Block] |
|
You can find additional information about the Fund at https://personal1.vanguard.com/ngf-next-gen-form-webapp/fund-literature. You can also request this information by contacting us at 800-662-7447.
|
|
| Material Fund Change Notice [Text Block] |
|
The report describes changes to the Fund that occurred during the reporting period.
|
|
| Additional Information Phone Number |
|
<span style="white-space: nowrap; box-sizing: border-box; color: rgb(0, 0, 0); display: inline; flex-wrap: nowrap; font-size: 10.6667px; font-weight: 400; grid-area: auto; line-height: 16px; margin: 0px; overflow: visible; text-align: left; text-align-last: auto;"> 800-662-7447</span>
|
|
| Additional Information Website |
|
<span style="white-space: nowrap; box-sizing: border-box; color: rgb(0, 0, 0); display: inline; flex-wrap: nowrap; font-size: 10.6667px; font-weight: 400; grid-area: auto; line-height: 16px; margin: 0px; overflow: visible; text-align: left; text-align-last: auto;"> <span style="box-sizing: border-box; color: rgb(0, 0, 0); display: inline; flex-wrap: nowrap; font-size: 10.6667px; font-weight: 400; grid-area: auto; line-height: 16px; margin: 0px; overflow: visible; text-align: left; text-align-last: auto; white-space-collapse: collapse;"><span style="text-decoration: underline; box-sizing: border-box; color: rgb(0, 0, 0); display: inline; flex-wrap: nowrap; font-size: 10.6667px; font-weight: 400; grid-area: auto; line-height: 16px; margin: 0px; overflow: visible; text-align: left; text-align-last: auto; white-space-collapse: collapse;">https://personal1.vanguard.com/ngf-next-gen-form-webapp/fund-literature</span></span></span>
|
|
| Expenses [Text Block] |
|
What were the Fund costs for the last year?(based on a hypothetical $10,000 investment) Table SummaryShare Class Name | Costs of a $10,000 investment | Costs paid as a percentage of a $10,000 investment |
|---|
ETF Shares | $10 | 0.09% |
|---|
|
|
| Expenses Paid, Amount |
|
$ 10
|
|
| Expense Ratio, Percent |
|
0.09%
|
|
| Factors Affecting Performance [Text Block] |
|
How did the Fund perform during the reporting period? For the 12 months ended August 31, 2026, the Fund performed roughly in line with its benchmark. Global equities posted strong returns, while global bonds struggled. Resilient growth and corporate earnings supported stocks, though shifting U.S. trade policy, persistent inflation, and Middle East tensions that disrupted energy supplies and raised oil prices fueled volatility. Some central banks, including those in the United States and the United Kingdom, lowered rates. However, developed-market government bond yields generally rose amid concerns about borrowing, inflation, and monetary policy. Eli Lilly (+59%), Johnson & Johnson (+53%), and Merck & Co. (+82%) contributed the most to the benchmark’s return. They accounted for about 27% of the index at the end of the reporting period and added about 13 percentage points to its result. Boston Scientific (–54%), Abbott Laboratories (–15%), and Zoetis (–50%) detracted the most.
|
|
| Performance Past Does Not Indicate Future [Text] |
|
Keep in mind that the Fund's past performance does not indicate how the Fund will perform in the future.
|
|
| Line Graph [Table Text Block] |
|
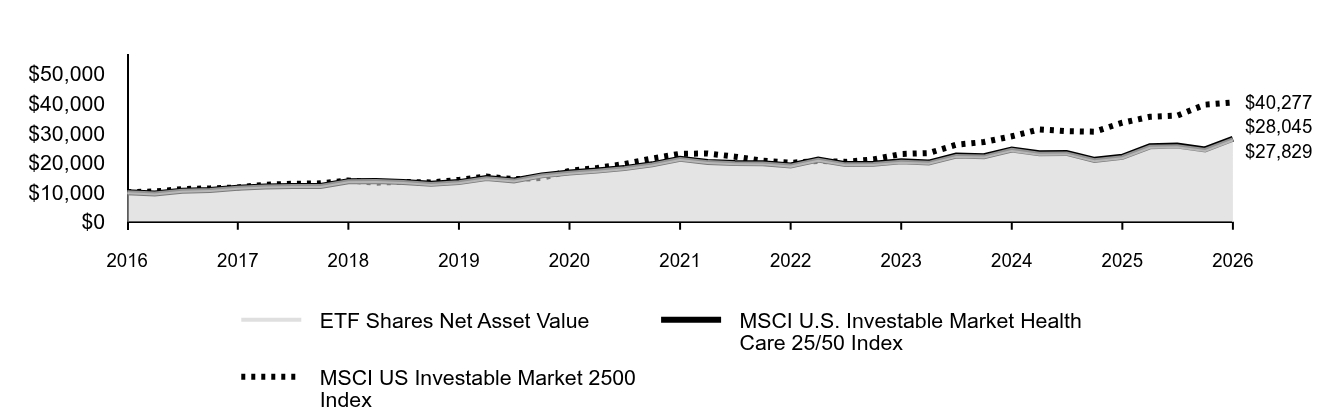 Table Summary | ETF Shares Net Asset Value | MSCI U.S. Investable Market Health Care 25/50 Index | MSCI US Investable Market 2500 Index |
|---|
2016 | $10,000 | $10,000 | $10,000 |
|---|
2016 | $9,534 | $9,536 | $10,232 |
|---|
2017 | $10,479 | $10,483 | $11,030 |
|---|
2017 | $10,685 | $10,690 | $11,271 |
|---|
2017 | $11,506 | $11,515 | $11,606 |
|---|
2017 | $11,886 | $11,897 | $12,514 |
|---|
2018 | $12,092 | $12,105 | $12,820 |
|---|
2018 | $12,087 | $12,102 | $12,966 |
|---|
2018 | $13,664 | $13,682 | $13,959 |
|---|
2018 | $13,738 | $13,759 | $13,205 |
|---|
2019 | $13,434 | $13,458 | $13,469 |
|---|
2019 | $12,778 | $12,801 | $13,288 |
|---|
2019 | $13,360 | $13,387 | $14,144 |
|---|
2019 | $14,722 | $14,751 | $15,258 |
|---|
2020 | $13,902 | $13,933 | $14,384 |
|---|
2020 | $15,630 | $15,664 | $14,801 |
|---|
2020 | $16,574 | $16,612 | $17,181 |
|---|
2020 | $17,266 | $17,309 | $18,176 |
|---|
2021 | $18,072 | $18,120 | $19,508 |
|---|
2021 | $19,333 | $19,391 | $21,356 |
|---|
2021 | $21,213 | $21,282 | $22,952 |
|---|
2021 | $20,142 | $20,211 | $23,066 |
|---|
2022 | $19,784 | $19,857 | $21,982 |
|---|
2022 | $19,717 | $19,792 | $20,624 |
|---|
2022 | $18,964 | $19,042 | $19,900 |
|---|
2022 | $20,906 | $20,998 | $20,565 |
|---|
2023 | $19,388 | $19,475 | $20,229 |
|---|
2023 | $19,522 | $19,614 | $21,076 |
|---|
2023 | $20,304 | $20,405 | $22,888 |
|---|
2023 | $19,899 | $20,003 | $23,198 |
|---|
2024 | $22,233 | $22,353 | $26,023 |
|---|
2024 | $22,003 | $22,129 | $26,923 |
|---|
2024 | $24,273 | $24,417 | $28,873 |
|---|
2024 | $23,008 | $23,149 | $31,200 |
|---|
2025 | $23,093 | $23,242 | $30,603 |
|---|
2025 | $20,775 | $20,914 | $30,422 |
|---|
2025 | $21,813 | $21,964 | $33,454 |
|---|
2025 | $25,298 | $25,478 | $35,455 |
|---|
2026 | $25,537 | $25,725 | $35,849 |
|---|
2026 | $24,253 | $24,436 | $39,554 |
|---|
2026 | $27,829 | $28,045 | $40,277 |
|---|
|
|
| Average Annual Return [Table Text Block] |
|
Table Summary | 1 Year | 5 Years | 10 Years |
|---|
ETF Shares Net Asset Value | 27.58% | 5.58% | 10.78% |
|---|
ETF Shares Market Price | 27.61% | 5.59% | 10.78% |
|---|
MSCI U.S. Investable Market Health Care 25/50 Index | 27.69% | 5.67% | 10.86% |
|---|
MSCI US Investable Market 2500 Index | 20.40% | 11.90% | 14.95% |
|---|
|
|
| No Deduction of Taxes [Text Block] |
|
The graph and returns shown do not reflect taxes that a shareholder would pay on fund distributions or on the sale of fund shares.
|
|
| Material Change Date |
|
|
Aug. 31, 2025
|
| Updated Performance Information Location [Text Block] |
|
Updated performance information is available on our website at vanguard.com/performance or by calling Vanguard toll-free at 800-662-7447.
|
|
| AssetsNet |
|
$ 22,042,000,000
|
|
| Holdings Count | Holding |
|
422
|
|
| Advisory Fees Paid, Amount |
|
$ 202,000
|
|
| InvestmentCompanyPortfolioTurnover |
|
7.00%
|
|
| Additional Fund Statistics [Text Block] |
|
Fund Statistics
(as of August 31, 2026)Table SummaryFund Net Assets (in millions) | $22,042 |
|---|
Number of Portfolio Holdings | 422 |
|---|
Portfolio Turnover Rate | 7% |
|---|
Total Investment Advisory Fees (in thousands) | $202 |
|---|
|
|
| Holdings [Text Block] |
|
Portfolio Composition % of Net Assets
(as of August 31, 2026)Table SummaryBiotechnology | 23.7% |
|---|
Health Care Equipment & Supplies | 15.4% |
|---|
Health Care Providers & Services | 17.1% |
|---|
Health Care Technology | 0.8% |
|---|
Life Sciences Tools & Services | 9.6% |
|---|
Pharmaceuticals | 33.2% |
|---|
Other Assets and Liabilities—Net | 0.2% |
|---|
This table reflects the Fund's investments, including short-term investments, derivatives and other assets and liabilities. |
|
| Material Fund Change [Text Block] |
|
How has the Fund changed?During the reporting period, the Fund's shareholders approved a proposal to reclassify the diversification status of the Fund to nondiversified, as defined under the Investment Company Act of 1940, and to eliminate the Fund's related fundamental policy. The Fund added nondiversification risk as a principal investment risk. This is a summary of certain changes to the Fund since August 31, 2025. For more complete information, you may review the Fund’s next prospectus, which we expect to be available by December 31, 2026, at https://personal1.vanguard.com/ngf-next-gen-form-webapp/fund-literature or upon request at 800-662-7447. |
|
| Material Fund Change Risks Change [Text Block] |
|
During the reporting period, the Fund's shareholders approved a proposal to reclassify the diversification status of the Fund to nondiversified, as defined under the Investment Company Act of 1940, and to eliminate the Fund's related fundamental policy. The Fund added nondiversification risk as a principal investment risk.
|
|
| Summary of Change Legend [Text Block] |
|
This is a summary of certain changes to the Fund since August 31, 2025. For more complete information, you may review the Fund’s next prospectus, which we expect to be available by December 31, 2026, at https://personal1.vanguard.com/ngf-next-gen-form-webapp/fund-literature or upon request at 800-662-7447.
|
|
| Updated Prospectus Phone Number |
|
800-662-7447
|
|
| Updated Prospectus Web Address |
|
https://personal1.vanguard.com/ngf-next-gen-form-webapp/fund-literature
|
|
| C000012222 |
|
|
|
| Shareholder Report [Line Items] |
|
|
|
| Fund Name |
|
Health Care Index Fund
|
|
| Class Name |
|
Admiral™ Shares
|
|
| Trading Symbol |
|
VHCIX
|
|
| Annual or Semi-Annual Statement [Text Block] |
|
This annual shareholder report contains important information about Vanguard Health Care Index Fund (the "Fund") for the period of September 1, 2025, to August 31, 2026.
|
|
| Additional Information [Text Block] |
|
You can find additional information about the Fund at https://personal1.vanguard.com/ngf-next-gen-form-webapp/fund-literature. You can also request this information by contacting us at 800-662-7447.
|
|
| Material Fund Change Notice [Text Block] |
|
The report describes changes to the Fund that occurred during the reporting period.
|
|
| Additional Information Phone Number |
|
<span style="white-space: nowrap; box-sizing: border-box; color: rgb(0, 0, 0); display: inline; flex-wrap: nowrap; font-size: 10.6667px; font-weight: 400; grid-area: auto; line-height: 16px; margin: 0px; overflow: visible; text-align: left; text-align-last: auto;"> 800-662-7447</span>
|
|
| Additional Information Website |
|
<span style="white-space: nowrap; box-sizing: border-box; color: rgb(0, 0, 0); display: inline; flex-wrap: nowrap; font-size: 10.6667px; font-weight: 400; grid-area: auto; line-height: 16px; margin: 0px; overflow: visible; text-align: left; text-align-last: auto;"> <span style="box-sizing: border-box; color: rgb(0, 0, 0); display: inline; flex-wrap: nowrap; font-size: 10.6667px; font-weight: 400; grid-area: auto; line-height: 16px; margin: 0px; overflow: visible; text-align: left; text-align-last: auto; white-space-collapse: collapse;"><span style="text-decoration: underline; box-sizing: border-box; color: rgb(0, 0, 0); display: inline; flex-wrap: nowrap; font-size: 10.6667px; font-weight: 400; grid-area: auto; line-height: 16px; margin: 0px; overflow: visible; text-align: left; text-align-last: auto; white-space-collapse: collapse;">https://personal1.vanguard.com/ngf-next-gen-form-webapp/fund-literature</span></span></span>
|
|
| Expenses [Text Block] |
|
What were the Fund costs for the last year?(based on a hypothetical $10,000 investment) Table SummaryShare Class Name | Costs of a $10,000 investment | Costs paid as a percentage of a $10,000 investment |
|---|
Admiral Shares | $10 | 0.09% |
|---|
|
|
| Expenses Paid, Amount |
|
$ 10
|
|
| Expense Ratio, Percent |
|
0.09%
|
|
| Factors Affecting Performance [Text Block] |
|
How did the Fund perform during the reporting period? For the 12 months ended August 31, 2026, the Fund performed roughly in line with its benchmark. Global equities posted strong returns, while global bonds struggled. Resilient growth and corporate earnings supported stocks, though shifting U.S. trade policy, persistent inflation, and Middle East tensions that disrupted energy supplies and raised oil prices fueled volatility. Some central banks, including those in the United States and the United Kingdom, lowered rates. However, developed-market government bond yields generally rose amid concerns about borrowing, inflation, and monetary policy. Eli Lilly (+59%), Johnson & Johnson (+53%), and Merck & Co. (+82%) contributed the most to the benchmark’s return. They accounted for about 27% of the index at the end of the reporting period and added about 13 percentage points to its result. Boston Scientific (–54%), Abbott Laboratories (–15%), and Zoetis (–50%) detracted the most.
|
|
| Performance Past Does Not Indicate Future [Text] |
|
Keep in mind that the Fund's past performance does not indicate how the Fund will perform in the future.
|
|
| Line Graph [Table Text Block] |
|
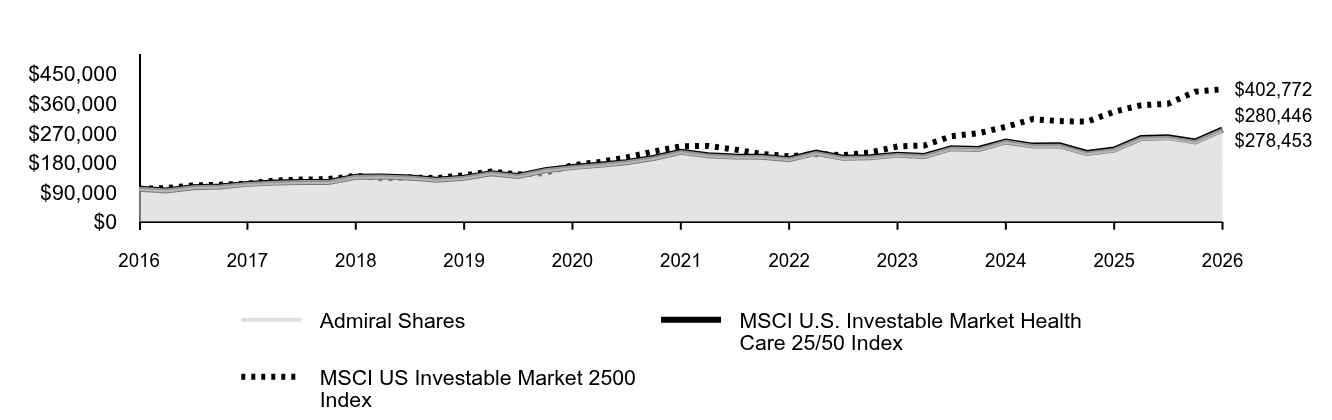 Table Summary | Admiral Shares | MSCI U.S. Investable Market Health Care 25/50 Index | MSCI US Investable Market 2500 Index |
|---|
2016 | $100,000 | $100,000 | $100,000 |
|---|
2016 | $95,346 | $95,362 | $102,323 |
|---|
2017 | $104,792 | $104,827 | $110,301 |
|---|
2017 | $106,859 | $106,904 | $112,713 |
|---|
2017 | $115,074 | $115,153 | $116,055 |
|---|
2017 | $118,872 | $118,973 | $125,136 |
|---|
2018 | $120,915 | $121,051 | $128,197 |
|---|
2018 | $120,869 | $121,020 | $129,658 |
|---|
2018 | $136,638 | $136,821 | $139,594 |
|---|
2018 | $137,389 | $137,593 | $132,050 |
|---|
2019 | $134,350 | $134,583 | $134,688 |
|---|
2019 | $127,782 | $128,008 | $132,882 |
|---|
2019 | $133,622 | $133,867 | $141,436 |
|---|
2019 | $147,219 | $147,512 | $152,576 |
|---|
2020 | $139,027 | $139,328 | $143,841 |
|---|
2020 | $156,333 | $156,638 | $148,014 |
|---|
2020 | $165,770 | $166,123 | $171,813 |
|---|
2020 | $172,701 | $173,094 | $181,762 |
|---|
2021 | $180,757 | $181,198 | $195,080 |
|---|
2021 | $193,391 | $193,910 | $213,559 |
|---|
2021 | $212,196 | $212,815 | $229,522 |
|---|
2021 | $201,488 | $202,106 | $230,655 |
|---|
2022 | $197,921 | $198,571 | $219,820 |
|---|
2022 | $197,238 | $197,924 | $206,240 |
|---|
2022 | $189,717 | $190,421 | $199,000 |
|---|
2022 | $209,170 | $209,981 | $205,651 |
|---|
2023 | $193,985 | $194,749 | $202,286 |
|---|
2023 | $195,317 | $196,144 | $210,760 |
|---|
2023 | $203,156 | $204,046 | $228,878 |
|---|
2023 | $199,109 | $200,030 | $231,975 |
|---|
2024 | $222,465 | $223,534 | $260,227 |
|---|
2024 | $220,177 | $221,286 | $269,232 |
|---|
2024 | $242,881 | $244,171 | $288,732 |
|---|
2024 | $230,203 | $231,494 | $312,002 |
|---|
2025 | $231,074 | $232,418 | $306,030 |
|---|
2025 | $207,880 | $209,135 | $304,223 |
|---|
2025 | $218,269 | $219,637 | $334,541 |
|---|
2025 | $253,124 | $254,779 | $354,555 |
|---|
2026 | $255,518 | $257,246 | $358,486 |
|---|
2026 | $242,676 | $244,357 | $395,539 |
|---|
2026 | $278,453 | $280,446 | $402,772 |
|---|
|
|
| Average Annual Return [Table Text Block] |
|
Table Summary | 1 Year | 5 Years | 10 Years |
|---|
Admiral Shares | 27.57% | 5.59% | 10.78% |
|---|
MSCI U.S. Investable Market Health Care 25/50 Index | 27.69% | 5.67% | 10.86% |
|---|
MSCI US Investable Market 2500 Index | 20.40% | 11.90% | 14.95% |
|---|
|
|
| No Deduction of Taxes [Text Block] |
|
The graph and returns shown do not reflect taxes that a shareholder would pay on fund distributions or on the sale of fund shares.
|
|
| Material Change Date |
|
|
Aug. 31, 2025
|
| Updated Performance Information Location [Text Block] |
|
Updated performance information is available on our website at vanguard.com/performance or by calling Vanguard toll-free at 800-662-7447.
|
|
| AssetsNet |
|
$ 22,042,000,000
|
|
| Holdings Count | Holding |
|
422
|
|
| Advisory Fees Paid, Amount |
|
$ 202,000
|
|
| InvestmentCompanyPortfolioTurnover |
|
7.00%
|
|
| Additional Fund Statistics [Text Block] |
|
Fund Statistics
(as of August 31, 2026)Table SummaryFund Net Assets (in millions) | $22,042 |
|---|
Number of Portfolio Holdings | 422 |
|---|
Portfolio Turnover Rate | 7% |
|---|
Total Investment Advisory Fees (in thousands) | $202 |
|---|
|
|
| Holdings [Text Block] |
|
Portfolio Composition % of Net Assets
(as of August 31, 2026)Table SummaryBiotechnology | 23.7% |
|---|
Health Care Equipment & Supplies | 15.4% |
|---|
Health Care Providers & Services | 17.1% |
|---|
Health Care Technology | 0.8% |
|---|
Life Sciences Tools & Services | 9.6% |
|---|
Pharmaceuticals | 33.2% |
|---|
Other Assets and Liabilities—Net | 0.2% |
|---|
This table reflects the Fund's investments, including short-term investments, derivatives and other assets and liabilities. |
|
| Material Fund Change [Text Block] |
|
How has the Fund changed?During the reporting period, the Fund's shareholders approved a proposal to reclassify the diversification status of the Fund to nondiversified, as defined under the Investment Company Act of 1940, and to eliminate the Fund's related fundamental policy. The Fund added nondiversification risk as a principal investment risk. This is a summary of certain changes to the Fund since August 31, 2025. For more complete information, you may review the Fund’s next prospectus, which we expect to be available by December 31, 2026, at https://personal1.vanguard.com/ngf-next-gen-form-webapp/fund-literature or upon request at 800-662-7447. |
|
| Material Fund Change Risks Change [Text Block] |
|
During the reporting period, the Fund's shareholders approved a proposal to reclassify the diversification status of the Fund to nondiversified, as defined under the Investment Company Act of 1940, and to eliminate the Fund's related fundamental policy. The Fund added nondiversification risk as a principal investment risk.
|
|
| Summary of Change Legend [Text Block] |
|
This is a summary of certain changes to the Fund since August 31, 2025. For more complete information, you may review the Fund’s next prospectus, which we expect to be available by December 31, 2026, at https://personal1.vanguard.com/ngf-next-gen-form-webapp/fund-literature or upon request at 800-662-7447.
|
|
| Updated Prospectus Phone Number |
|
800-662-7447
|
|
| Updated Prospectus Web Address |
|
https://personal1.vanguard.com/ngf-next-gen-form-webapp/fund-literature
|
|
| C000012225 |
|
|
|
| Shareholder Report [Line Items] |
|
|
|
| Fund Name |
|
Industrials Index Fund
|
|
| Class Name |
|
ETF Shares
|
|
| Trading Symbol |
|
VIS
|
|
| Security Exchange Name |
|
NYSEArca
|
|
| Annual or Semi-Annual Statement [Text Block] |
|
This annual shareholder report contains important information about Vanguard Industrials Index Fund (the "Fund") for the period of September 1, 2025, to August 31, 2026.
|
|
| Additional Information [Text Block] |
|
You can find additional information about the Fund at https://personal1.vanguard.com/ngf-next-gen-form-webapp/fund-literature. You can also request this information by contacting us at 800-662-7447.
|
|
| Additional Information Phone Number |
|
<span style="white-space: nowrap; box-sizing: border-box; color: rgb(0, 0, 0); display: inline; flex-wrap: nowrap; font-size: 10.6667px; font-weight: 400; grid-area: auto; line-height: 16px; margin: 0px; overflow: visible; text-align: left; text-align-last: auto;"> 800-662-7447</span>
|
|
| Additional Information Website |
|
<span style="white-space: nowrap; box-sizing: border-box; color: rgb(0, 0, 0); display: inline; flex-wrap: nowrap; font-size: 10.6667px; font-weight: 400; grid-area: auto; line-height: 16px; margin: 0px; overflow: visible; text-align: left; text-align-last: auto;"> <span style="box-sizing: border-box; color: rgb(0, 0, 0); display: inline; flex-wrap: nowrap; font-size: 10.6667px; font-weight: 400; grid-area: auto; line-height: 16px; margin: 0px; overflow: visible; text-align: left; text-align-last: auto; white-space-collapse: collapse;"><span style="text-decoration: underline; box-sizing: border-box; color: rgb(0, 0, 0); display: inline; flex-wrap: nowrap; font-size: 10.6667px; font-weight: 400; grid-area: auto; line-height: 16px; margin: 0px; overflow: visible; text-align: left; text-align-last: auto; white-space-collapse: collapse;">https://personal1.vanguard.com/ngf-next-gen-form-webapp/fund-literature</span></span></span>
|
|
| Expenses [Text Block] |
|
What were the Fund costs for the last year?(based on a hypothetical $10,000 investment) Table SummaryShare Class Name | Costs of a $10,000 investment | Costs paid as a percentage of a $10,000 investment |
|---|
ETF Shares | $10 | 0.09% |
|---|
|
|
| Expenses Paid, Amount |
|
$ 10
|
|
| Expense Ratio, Percent |
|
0.09%
|
|
| Factors Affecting Performance [Text Block] |
|
How did the Fund perform during the reporting period? For the 12 months ended August 31, 2026, the Fund performed roughly in line with its benchmark. Global equities posted strong returns, while global bonds struggled. Resilient growth and corporate earnings supported stocks, though shifting U.S. trade policy, persistent inflation, and Middle East tensions that disrupted energy supplies and raised oil prices fueled volatility. Some central banks, including those in the United States and United Kingdom, lowered rates. However, developed-market government bond yields generally rose amid concerns about borrowing, inflation, and monetary policy. Caterpillar (+92%), GE Vernova (+47%), and RTX (+33%) contributed the most to the benchmark’s return. They accounted for about 13% of the index at the end of the reporting period and added about 6 percentage points to its result. Uber Technologies (–19%), Axon Enterprise (–24%), and Boeing (–11%) detracted the most.
|
|
| Performance Past Does Not Indicate Future [Text] |
|
Keep in mind that the Fund's past performance does not indicate how the Fund will perform in the future.
|
|
| Line Graph [Table Text Block] |
|
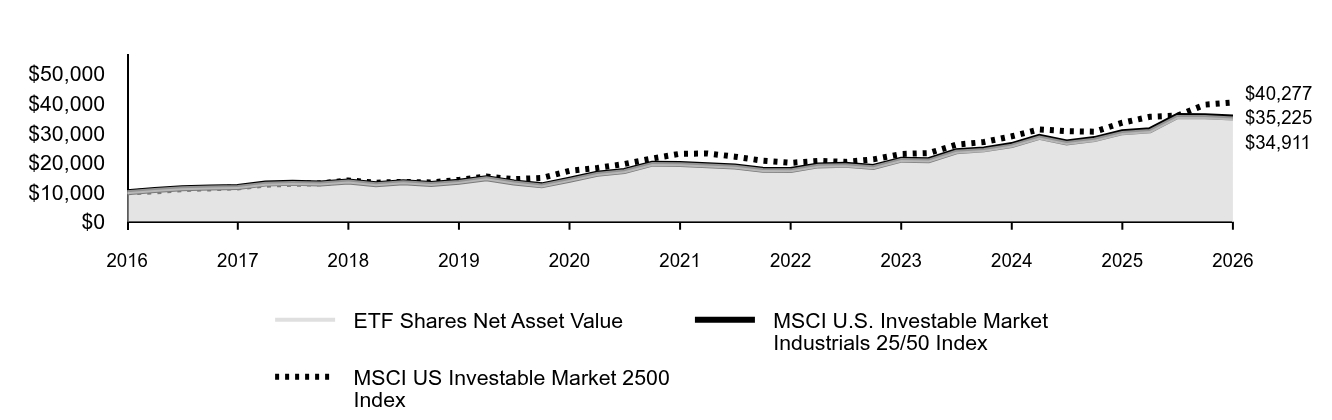 Table Summary | ETF Shares Net Asset Value | MSCI U.S. Investable Market Industrials 25/50 Index | MSCI US Investable Market 2500 Index |
|---|
2016 | $10,000 | $10,000 | $10,000 |
|---|
2016 | $10,716 | $10,716 | $10,232 |
|---|
2017 | $11,321 | $11,322 | $11,030 |
|---|
2017 | $11,545 | $11,548 | $11,271 |
|---|
2017 | $11,755 | $11,758 | $11,606 |
|---|
2017 | $12,871 | $12,881 | $12,514 |
|---|
2018 | $13,127 | $13,140 | $12,820 |
|---|
2018 | $12,933 | $12,950 | $12,966 |
|---|
2018 | $13,566 | $13,587 | $13,959 |
|---|
2018 | $12,681 | $12,702 | $13,205 |
|---|
2019 | $13,345 | $13,371 | $13,469 |
|---|
2019 | $12,733 | $12,761 | $13,288 |
|---|
2019 | $13,467 | $13,499 | $14,144 |
|---|
2019 | $14,662 | $14,703 | $15,258 |
|---|
2020 | $13,237 | $13,277 | $14,384 |
|---|
2020 | $12,262 | $12,306 | $14,801 |
|---|
2020 | $14,134 | $14,188 | $17,181 |
|---|
2020 | $16,135 | $16,200 | $18,176 |
|---|
2021 | $17,086 | $17,160 | $19,508 |
|---|
2021 | $19,521 | $19,611 | $21,356 |
|---|
2021 | $19,421 | $19,515 | $22,952 |
|---|
2021 | $19,015 | $19,111 | $23,066 |
|---|
2022 | $18,579 | $18,677 | $21,982 |
|---|
2022 | $17,488 | $17,585 | $20,624 |
|---|
2022 | $17,358 | $17,458 | $19,900 |
|---|
2022 | $18,921 | $19,037 | $20,565 |
|---|
2023 | $19,114 | $19,231 | $20,229 |
|---|
2023 | $18,416 | $18,533 | $21,076 |
|---|
2023 | $20,828 | $20,965 | $22,888 |
|---|
2023 | $20,654 | $20,794 | $23,198 |
|---|
2024 | $23,635 | $23,803 | $26,023 |
|---|
2024 | $24,274 | $24,451 | $26,923 |
|---|
2024 | $25,719 | $25,911 | $28,873 |
|---|
2024 | $28,470 | $28,687 | $31,200 |
|---|
2025 | $26,588 | $26,796 | $30,603 |
|---|
2025 | $27,715 | $27,937 | $30,422 |
|---|
2025 | $30,006 | $30,252 | $33,454 |
|---|
2025 | $30,644 | $30,902 | $35,455 |
|---|
2026 | $35,385 | $35,690 | $35,849 |
|---|
2026 | $35,357 | $35,670 | $39,554 |
|---|
2026 | $34,911 | $35,225 | $40,277 |
|---|
|
|
| Average Annual Return [Table Text Block] |
|
Table Summary | 1 Year | 5 Years | 10 Years |
|---|
ETF Shares Net Asset Value | 16.35% | 12.44% | 13.32% |
|---|
ETF Shares Market Price | 16.40% | 12.46% | 13.32% |
|---|
MSCI U.S. Investable Market Industrials 25/50 Index | 16.44% | 12.54% | 13.42% |
|---|
MSCI US Investable Market 2500 Index | 20.40% | 11.90% | 14.95% |
|---|
|
|
| No Deduction of Taxes [Text Block] |
|
The graph and returns shown do not reflect taxes that a shareholder would pay on fund distributions or on the sale of fund shares.
|
|
| Updated Performance Information Location [Text Block] |
|
Updated performance information is available on our website at vanguard.com/performance or by calling Vanguard toll-free at 800-662-7447.
|
|
| AssetsNet |
|
$ 8,562,000,000
|
|
| Holdings Count | Holding |
|
399
|
|
| Advisory Fees Paid, Amount |
|
$ 78,000
|
|
| InvestmentCompanyPortfolioTurnover |
|
5.00%
|
|
| Additional Fund Statistics [Text Block] |
|
Fund Statistics
(as of August 31, 2026)Table SummaryFund Net Assets (in millions) | $8,562 |
|---|
Number of Portfolio Holdings | 399 |
|---|
Portfolio Turnover Rate | 5% |
|---|
Total Investment Advisory Fees (in thousands) | $78 |
|---|
|
|
| Holdings [Text Block] |
|
Portfolio Composition % of Net Assets
(as of August 31, 2026)Table SummaryAerospace & Defense | 24.0% |
|---|
Air Freight & Logistics | 2.9% |
|---|
Building Products | 5.7% |
|---|
Commercial Services & Supplies | 5.5% |
|---|
Construction & Engineering | 4.5% |
|---|
Electrical Equipment | 12.6% |
|---|
Ground Transportation | 8.8% |
|---|
Industrial Conglomerates | 2.5% |
|---|
Machinery | 20.3% |
|---|
Marine Transportation | 0.2% |
|---|
Passenger Airlines | 1.8% |
|---|
Professional Services | 6.1% |
|---|
Trading Companies & Distributors | 4.7% |
|---|
Other Assets and Liabilities—Net | 0.4% |
|---|
This table reflects the Fund's investments, including short-term investments, derivatives and other assets and liabilities. |
|
| Material Fund Change [Text Block] |
|
|
|
| Updated Prospectus Phone Number |
|
800-662-7447
|
|
| Updated Prospectus Web Address |
|
https://personal1.vanguard.com/ngf-next-gen-form-webapp/fund-literature
|
|
| C000012224 |
|
|
|
| Shareholder Report [Line Items] |
|
|
|
| Fund Name |
|
Industrials Index Fund
|
|
| Class Name |
|
Admiral™ Shares
|
|
| Trading Symbol |
|
VINAX
|
|
| Annual or Semi-Annual Statement [Text Block] |
|
This annual shareholder report contains important information about Vanguard Industrials Index Fund (the "Fund") for the period of September 1, 2025, to August 31, 2026.
|
|
| Additional Information [Text Block] |
|
You can find additional information about the Fund at https://personal1.vanguard.com/ngf-next-gen-form-webapp/fund-literature. You can also request this information by contacting us at 800-662-7447.
|
|
| Additional Information Phone Number |
|
<span style="white-space: nowrap; box-sizing: border-box; color: rgb(0, 0, 0); display: inline; flex-wrap: nowrap; font-size: 10.6667px; font-weight: 400; grid-area: auto; line-height: 16px; margin: 0px; overflow: visible; text-align: left; text-align-last: auto;"> 800-662-7447</span>
|
|
| Additional Information Website |
|
<span style="white-space: nowrap; box-sizing: border-box; color: rgb(0, 0, 0); display: inline; flex-wrap: nowrap; font-size: 10.6667px; font-weight: 400; grid-area: auto; line-height: 16px; margin: 0px; overflow: visible; text-align: left; text-align-last: auto;"> <span style="box-sizing: border-box; color: rgb(0, 0, 0); display: inline; flex-wrap: nowrap; font-size: 10.6667px; font-weight: 400; grid-area: auto; line-height: 16px; margin: 0px; overflow: visible; text-align: left; text-align-last: auto; white-space-collapse: collapse;"><span style="text-decoration: underline; box-sizing: border-box; color: rgb(0, 0, 0); display: inline; flex-wrap: nowrap; font-size: 10.6667px; font-weight: 400; grid-area: auto; line-height: 16px; margin: 0px; overflow: visible; text-align: left; text-align-last: auto; white-space-collapse: collapse;">https://personal1.vanguard.com/ngf-next-gen-form-webapp/fund-literature</span></span></span>
|
|
| Expenses [Text Block] |
|
What were the Fund costs for the last year?(based on a hypothetical $10,000 investment) Table SummaryShare Class Name | Costs of a $10,000 investment | Costs paid as a percentage of a $10,000 investment |
|---|
Admiral Shares | $10 | 0.09% |
|---|
|
|
| Expenses Paid, Amount |
|
$ 10
|
|
| Expense Ratio, Percent |
|
0.09%
|
|
| Factors Affecting Performance [Text Block] |
|
How did the Fund perform during the reporting period? For the 12 months ended August 31, 2026, the Fund performed roughly in line with its benchmark. Global equities posted strong returns, while global bonds struggled. Resilient growth and corporate earnings supported stocks, though shifting U.S. trade policy, persistent inflation, and Middle East tensions that disrupted energy supplies and raised oil prices fueled volatility. Some central banks, including those in the United States and United Kingdom, lowered rates. However, developed-market government bond yields generally rose amid concerns about borrowing, inflation, and monetary policy. Caterpillar (+92%), GE Vernova (+47%), and RTX (+33%) contributed the most to the benchmark’s return. They accounted for about 13% of the index at the end of the reporting period and added about 6 percentage points to its result. Uber Technologies (–19%), Axon Enterprise (–24%), and Boeing (–11%) detracted the most.
|
|
| Performance Past Does Not Indicate Future [Text] |
|
Keep in mind that the Fund's past performance does not indicate how the Fund will perform in the future.
|
|
| Line Graph [Table Text Block] |
|
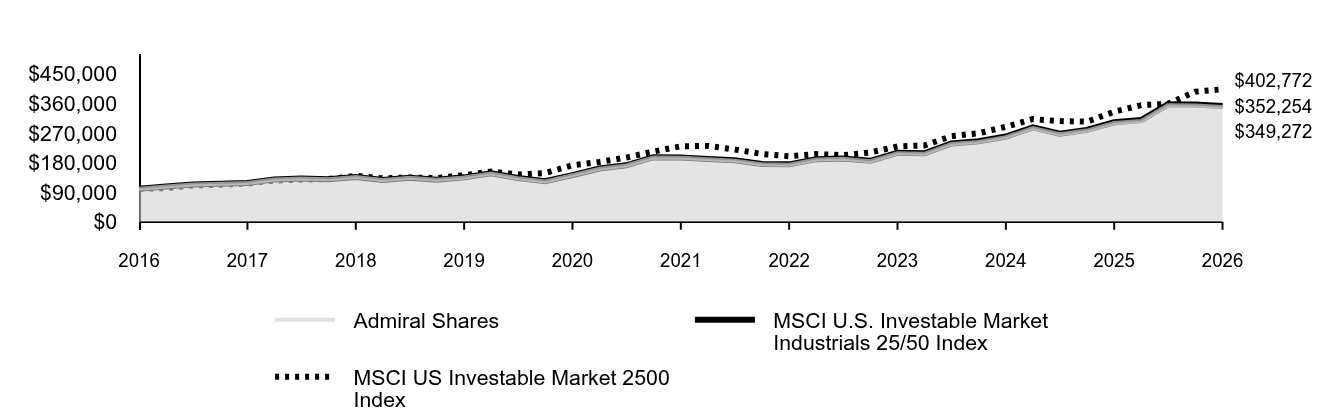 Table Summary | Admiral Shares | MSCI U.S. Investable Market Industrials 25/50 Index | MSCI US Investable Market 2500 Index |
|---|
2016 | $100,000 | $100,000 | $100,000 |
|---|
2016 | $107,155 | $107,162 | $102,323 |
|---|
2017 | $113,192 | $113,224 | $110,301 |
|---|
2017 | $115,447 | $115,484 | $112,713 |
|---|
2017 | $117,549 | $117,584 | $116,055 |
|---|
2017 | $128,709 | $128,814 | $125,136 |
|---|
2018 | $131,267 | $131,402 | $128,197 |
|---|
2018 | $129,330 | $129,495 | $129,658 |
|---|
2018 | $135,663 | $135,871 | $139,594 |
|---|
2018 | $126,800 | $127,018 | $132,050 |
|---|
2019 | $133,430 | $133,705 | $134,688 |
|---|
2019 | $127,330 | $127,614 | $132,882 |
|---|
2019 | $134,650 | $134,994 | $141,436 |
|---|
2019 | $146,620 | $147,026 | $152,576 |
|---|
2020 | $132,367 | $132,768 | $143,841 |
|---|
2020 | $122,639 | $123,058 | $148,014 |
|---|
2020 | $141,361 | $141,878 | $171,813 |
|---|
2020 | $161,389 | $162,000 | $181,762 |
|---|
2021 | $170,915 | $171,598 | $195,080 |
|---|
2021 | $195,268 | $196,110 | $213,559 |
|---|
2021 | $194,273 | $195,148 | $229,522 |
|---|
2021 | $190,200 | $191,108 | $230,655 |
|---|
2022 | $185,854 | $186,770 | $219,820 |
|---|
2022 | $174,928 | $175,846 | $206,240 |
|---|
2022 | $173,640 | $174,582 | $199,000 |
|---|
2022 | $189,309 | $190,369 | $205,651 |
|---|
2023 | $191,209 | $192,314 | $202,286 |
|---|
2023 | $184,213 | $185,333 | $210,760 |
|---|
2023 | $208,354 | $209,648 | $228,878 |
|---|
2023 | $206,617 | $207,945 | $231,975 |
|---|
2024 | $236,464 | $238,031 | $260,227 |
|---|
2024 | $242,852 | $244,507 | $269,232 |
|---|
2024 | $257,298 | $259,113 | $288,732 |
|---|
2024 | $284,828 | $286,870 | $312,002 |
|---|
2025 | $266,003 | $267,957 | $306,030 |
|---|
2025 | $277,271 | $279,372 | $304,223 |
|---|
2025 | $300,180 | $302,522 | $334,541 |
|---|
2025 | $306,563 | $309,016 | $354,555 |
|---|
2026 | $354,004 | $356,899 | $358,486 |
|---|
2026 | $353,712 | $356,699 | $395,539 |
|---|
2026 | $349,272 | $352,254 | $402,772 |
|---|
|
|
| Average Annual Return [Table Text Block] |
|
Table Summary | 1 Year | 5 Years | 10 Years |
|---|
Admiral Shares | 16.35% | 12.45% | 13.32% |
|---|
MSCI U.S. Investable Market Industrials 25/50 Index | 16.44% | 12.54% | 13.42% |
|---|
MSCI US Investable Market 2500 Index | 20.40% | 11.90% | 14.95% |
|---|
|
|
| No Deduction of Taxes [Text Block] |
|
The graph and returns shown do not reflect taxes that a shareholder would pay on fund distributions or on the sale of fund shares.
|
|
| Updated Performance Information Location [Text Block] |
|
Updated performance information is available on our website at vanguard.com/performance or by calling Vanguard toll-free at 800-662-7447.
|
|
| AssetsNet |
|
$ 8,562,000,000
|
|
| Holdings Count | Holding |
|
399
|
|
| Advisory Fees Paid, Amount |
|
$ 78,000
|
|
| InvestmentCompanyPortfolioTurnover |
|
5.00%
|
|
| Additional Fund Statistics [Text Block] |
|
Fund Statistics
(as of August 31, 2026)Table SummaryFund Net Assets (in millions) | $8,562 |
|---|
Number of Portfolio Holdings | 399 |
|---|
Portfolio Turnover Rate | 5% |
|---|
Total Investment Advisory Fees (in thousands) | $78 |
|---|
|
|
| Holdings [Text Block] |
|
Portfolio Composition % of Net Assets
(as of August 31, 2026)Table SummaryAerospace & Defense | 24.0% |
|---|
Air Freight & Logistics | 2.9% |
|---|
Building Products | 5.7% |
|---|
Commercial Services & Supplies | 5.5% |
|---|
Construction & Engineering | 4.5% |
|---|
Electrical Equipment | 12.6% |
|---|
Ground Transportation | 8.8% |
|---|
Industrial Conglomerates | 2.5% |
|---|
Machinery | 20.3% |
|---|
Marine Transportation | 0.2% |
|---|
Passenger Airlines | 1.8% |
|---|
Professional Services | 6.1% |
|---|
Trading Companies & Distributors | 4.7% |
|---|
Other Assets and Liabilities—Net | 0.4% |
|---|
This table reflects the Fund's investments, including short-term investments, derivatives and other assets and liabilities. |
|
| Material Fund Change [Text Block] |
|
|
|
| Updated Prospectus Phone Number |
|
800-662-7447
|
|
| Updated Prospectus Web Address |
|
https://personal1.vanguard.com/ngf-next-gen-form-webapp/fund-literature
|
|
| C000012227 |
|
|
|
| Shareholder Report [Line Items] |
|
|
|
| Fund Name |
|
Information Technology Index Fund
|
|
| Class Name |
|
ETF Shares
|
|
| Trading Symbol |
|
VGT
|
|
| Security Exchange Name |
|
NYSEArca
|
|
| Annual or Semi-Annual Statement [Text Block] |
|
This annual shareholder report contains important information about Vanguard Information Technology Index Fund (the "Fund") for the period of September 1, 2025, to August 31, 2026.
|
|
| Additional Information [Text Block] |
|
You can find additional information about the Fund at https://personal1.vanguard.com/ngf-next-gen-form-webapp/fund-literature. You can also request this information by contacting us at 800-662-7447.
|
|
| Additional Information Phone Number |
|
<span style="white-space: nowrap; box-sizing: border-box; color: rgb(0, 0, 0); display: inline; flex-wrap: nowrap; font-size: 10.6667px; font-weight: 400; grid-area: auto; line-height: 16px; margin: 0px; overflow: visible; text-align: left; text-align-last: auto;"> 800-662-7447</span>
|
|
| Additional Information Website |
|
<span style="white-space: nowrap; box-sizing: border-box; color: rgb(0, 0, 0); display: inline; flex-wrap: nowrap; font-size: 10.6667px; font-weight: 400; grid-area: auto; line-height: 16px; margin: 0px; overflow: visible; text-align: left; text-align-last: auto;"> <span style="box-sizing: border-box; color: rgb(0, 0, 0); display: inline; flex-wrap: nowrap; font-size: 10.6667px; font-weight: 400; grid-area: auto; line-height: 16px; margin: 0px; overflow: visible; text-align: left; text-align-last: auto; white-space-collapse: collapse;"><span style="text-decoration: underline; box-sizing: border-box; color: rgb(0, 0, 0); display: inline; flex-wrap: nowrap; font-size: 10.6667px; font-weight: 400; grid-area: auto; line-height: 16px; margin: 0px; overflow: visible; text-align: left; text-align-last: auto; white-space-collapse: collapse;">https://personal1.vanguard.com/ngf-next-gen-form-webapp/fund-literature</span></span></span>
|
|
| Expenses [Text Block] |
|
What were the Fund costs for the last year?(based on a hypothetical $10,000 investment) Table SummaryShare Class Name | Costs of a $10,000 investment | Costs paid as a percentage of a $10,000 investment |
|---|
ETF Shares | $11 | 0.09% |
|---|
|
|
| Expenses Paid, Amount |
|
$ 11
|
|
| Expense Ratio, Percent |
|
0.09%
|
|
| Factors Affecting Performance [Text Block] |
|
How did the Fund perform during the reporting period? For the 12 months ended August 31, 2026, the Fund performed roughly in line with its benchmark. Global equities posted strong returns, while global bonds struggled. Resilient growth and corporate earnings supported stocks, though shifting U.S. trade policy, persistent inflation, and Middle East tensions that disrupted energy supplies and raised oil prices fueled volatility. Some central banks, including those in the United States and the United Kingdom, lowered rates. However, developed-market government bond yields generally rose amid concerns about borrowing, inflation, and monetary policy. Apple (+37%), Micron Technology (+707%), and NVIDIA (+27%) contributed the most to the benchmark’s return. They accounted for about 38% of the index at the end of the reporting period and added about 15 percentage points to its result. Microsoft (+1%), Oracle (–33%), and Intuit (–46%) detracted the most.
|
|
| Performance Past Does Not Indicate Future [Text] |
|
Keep in mind that the Fund's past performance does not indicate how the Fund will perform in the future.
|
|
| Line Graph [Table Text Block] |
|
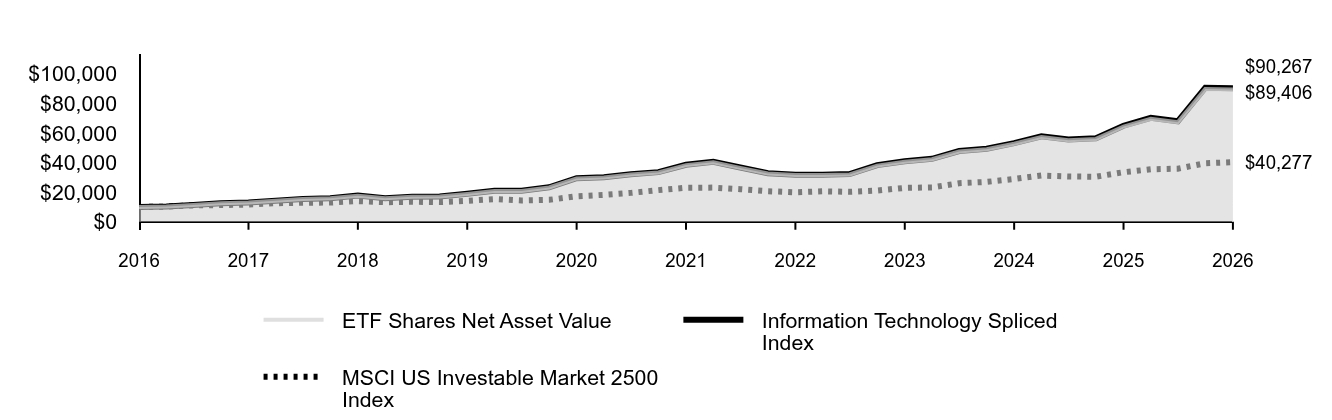 Table Summary | ETF Shares Net Asset Value | Information Technology Spliced Index | MSCI US Investable Market 2500 Index |
|---|
2016 | $10,000 | $10,000 | $10,000 |
|---|
2016 | $10,242 | $10,244 | $10,232 |
|---|
2017 | $11,367 | $11,372 | $11,030 |
|---|
2017 | $12,418 | $12,428 | $11,271 |
|---|
2017 | $12,993 | $13,005 | $11,606 |
|---|
2017 | $14,230 | $14,248 | $12,514 |
|---|
2018 | $15,320 | $15,341 | $12,820 |
|---|
2018 | $15,837 | $15,863 | $12,966 |
|---|
2018 | $17,608 | $17,643 | $13,959 |
|---|
2018 | $15,924 | $15,958 | $13,205 |
|---|
2019 | $16,894 | $16,932 | $13,469 |
|---|
2019 | $17,058 | $17,102 | $13,288 |
|---|
2019 | $18,788 | $18,842 | $14,144 |
|---|
2019 | $20,846 | $20,913 | $15,258 |
|---|
2020 | $20,847 | $20,920 | $14,384 |
|---|
2020 | $23,183 | $23,280 | $14,801 |
|---|
2020 | $29,257 | $29,391 | $17,181 |
|---|
2020 | $29,898 | $30,046 | $18,176 |
|---|
2021 | $31,890 | $32,058 | $19,508 |
|---|
2021 | $33,339 | $33,523 | $21,356 |
|---|
2021 | $38,267 | $38,485 | $22,952 |
|---|
2021 | $40,211 | $40,451 | $23,066 |
|---|
2022 | $36,389 | $36,620 | $21,982 |
|---|
2022 | $32,577 | $32,799 | $20,624 |
|---|
2022 | $31,570 | $31,795 | $19,900 |
|---|
2022 | $31,547 | $31,779 | $20,565 |
|---|
2023 | $31,992 | $32,233 | $20,229 |
|---|
2023 | $37,946 | $38,242 | $21,076 |
|---|
2023 | $40,559 | $40,883 | $22,888 |
|---|
2023 | $42,213 | $42,511 | $23,198 |
|---|
2024 | $47,441 | $47,786 | $26,023 |
|---|
2024 | $48,977 | $49,343 | $26,923 |
|---|
2024 | $52,719 | $53,127 | $28,873 |
|---|
2024 | $57,264 | $57,722 | $31,200 |
|---|
2025 | $55,100 | $55,549 | $30,603 |
|---|
2025 | $55,974 | $56,444 | $30,422 |
|---|
2025 | $64,328 | $64,887 | $33,454 |
|---|
2025 | $69,563 | $70,184 | $35,455 |
|---|
2026 | $67,233 | $67,847 | $35,849 |
|---|
2026 | $89,714 | $90,562 | $39,554 |
|---|
2026 | $89,406 | $90,267 | $40,277 |
|---|
|
|
| Average Annual Return [Table Text Block] |
|
Table Summary | 1 Year | 5 Years | 10 Years |
|---|
ETF Shares Net Asset Value | 38.99% | 18.50% | 24.49% |
|---|
ETF Shares Market Price | 38.91% | 18.50% | 24.49% |
|---|
Information Technology Spliced Index | 39.11% | 18.59% | 24.61% |
|---|
MSCI US Investable Market 2500 Index | 20.40% | 11.90% | 14.95% |
|---|
|
|
| No Deduction of Taxes [Text Block] |
|
The graph and returns shown do not reflect taxes that a shareholder would pay on fund distributions or on the sale of fund shares.
|
|
| Updated Performance Information Location [Text Block] |
|
Updated performance information is available on our website at vanguard.com/performance or by calling Vanguard toll-free at 800-662-7447.
|
|
| AssetsNet |
|
$ 170,247,000,000
|
|
| Holdings Count | Holding |
|
322
|
|
| Advisory Fees Paid, Amount |
|
$ 1,434,000
|
|
| InvestmentCompanyPortfolioTurnover |
|
9.00%
|
|
| Additional Fund Statistics [Text Block] |
|
Fund Statistics
(as of August 31, 2026)Table SummaryFund Net Assets (in millions) | $170,247 |
|---|
Number of Portfolio Holdings | 322 |
|---|
Portfolio Turnover Rate | 9% |
|---|
Total Investment Advisory Fees (in thousands) | $1,434 |
|---|
|
|
| Holdings [Text Block] |
|
Portfolio Composition % of Net Assets
(as of August 31, 2026)Table SummaryCommunications Equipment | 4.0% |
|---|
Electronic Equipment, Instruments & Components | 4.6% |
|---|
IT Services | 3.7% |
|---|
Semiconductors & Semiconductor Equipment | 41.9% |
|---|
Software | 26.0% |
|---|
Technology Hardware, Storage & Peripherals | 19.7% |
|---|
Other Assets and Liabilities—Net | 0.1% |
|---|
This table reflects the Fund's investments, including short-term investments, derivatives and other assets and liabilities. |
|
| Material Fund Change [Text Block] |
|
|
|
| Updated Prospectus Phone Number |
|
800-662-7447
|
|
| Updated Prospectus Web Address |
|
https://personal1.vanguard.com/ngf-next-gen-form-webapp/fund-literature
|
|
| C000012226 |
|
|
|
| Shareholder Report [Line Items] |
|
|
|
| Fund Name |
|
Information Technology Index Fund
|
|
| Class Name |
|
Admiral™ Shares
|
|
| Trading Symbol |
|
VITAX
|
|
| Annual or Semi-Annual Statement [Text Block] |
|
This annual shareholder report contains important information about Vanguard Information Technology Index Fund (the "Fund") for the period of September 1, 2025, to August 31, 2026.
|
|
| Additional Information [Text Block] |
|
You can find additional information about the Fund at https://personal1.vanguard.com/ngf-next-gen-form-webapp/fund-literature. You can also request this information by contacting us at 800-662-7447.
|
|
| Additional Information Phone Number |
|
<span style="white-space: nowrap; box-sizing: border-box; color: rgb(0, 0, 0); display: inline; flex-wrap: nowrap; font-size: 10.6667px; font-weight: 400; grid-area: auto; line-height: 16px; margin: 0px; overflow: visible; text-align: left; text-align-last: auto;"> 800-662-7447</span>
|
|
| Additional Information Website |
|
<span style="white-space: nowrap; box-sizing: border-box; color: rgb(0, 0, 0); display: inline; flex-wrap: nowrap; font-size: 10.6667px; font-weight: 400; grid-area: auto; line-height: 16px; margin: 0px; overflow: visible; text-align: left; text-align-last: auto;"> <span style="box-sizing: border-box; color: rgb(0, 0, 0); display: inline; flex-wrap: nowrap; font-size: 10.6667px; font-weight: 400; grid-area: auto; line-height: 16px; margin: 0px; overflow: visible; text-align: left; text-align-last: auto; white-space-collapse: collapse;"><span style="text-decoration: underline; box-sizing: border-box; color: rgb(0, 0, 0); display: inline; flex-wrap: nowrap; font-size: 10.6667px; font-weight: 400; grid-area: auto; line-height: 16px; margin: 0px; overflow: visible; text-align: left; text-align-last: auto; white-space-collapse: collapse;">https://personal1.vanguard.com/ngf-next-gen-form-webapp/fund-literature</span></span></span>
|
|
| Expenses [Text Block] |
|
What were the Fund costs for the last year?(based on a hypothetical $10,000 investment) Table SummaryShare Class Name | Costs of a $10,000 investment | Costs paid as a percentage of a $10,000 investment |
|---|
Admiral Shares | $11 | 0.09% |
|---|
|
|
| Expenses Paid, Amount |
|
$ 11
|
|
| Expense Ratio, Percent |
|
0.09%
|
|
| Factors Affecting Performance [Text Block] |
|
How did the Fund perform during the reporting period? For the 12 months ended August 31, 2026, the Fund performed roughly in line with its benchmark. Global equities posted strong returns, while global bonds struggled. Resilient growth and corporate earnings supported stocks, though shifting U.S. trade policy, persistent inflation, and Middle East tensions that disrupted energy supplies and raised oil prices fueled volatility. Some central banks, including those in the United States and the United Kingdom, lowered rates. However, developed-market government bond yields generally rose amid concerns about borrowing, inflation, and monetary policy. Apple (+37%), Micron Technology (+707%), and NVIDIA (+27%) contributed the most to the benchmark’s return. They accounted for about 38% of the index at the end of the reporting period and added about 15 percentage points to its result. Microsoft (+1%), Oracle (–33%), and Intuit (–46%) detracted the most.
|
|
| Performance Past Does Not Indicate Future [Text] |
|
Keep in mind that the Fund's past performance does not indicate how the Fund will perform in the future.
|
|
| Line Graph [Table Text Block] |
|
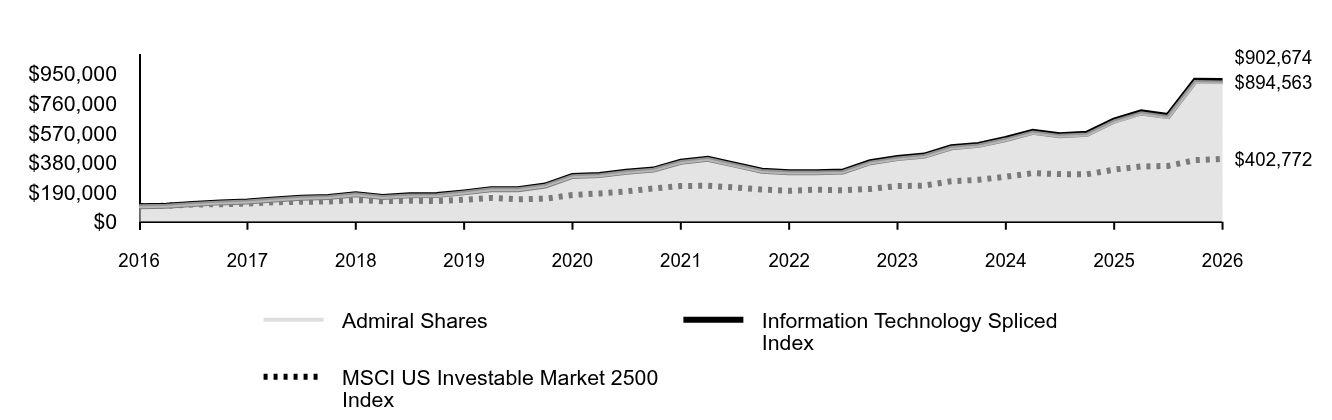 Table Summary | Admiral Shares | Information Technology Spliced Index | MSCI US Investable Market 2500 Index |
|---|
2016 | $100,000 | $100,000 | $100,000 |
|---|
2016 | $102,419 | $102,444 | $102,323 |
|---|
2017 | $113,677 | $113,722 | $110,301 |
|---|
2017 | $124,194 | $124,278 | $112,713 |
|---|
2017 | $129,937 | $130,052 | $116,055 |
|---|
2017 | $142,323 | $142,477 | $125,136 |
|---|
2018 | $153,214 | $153,408 | $128,197 |
|---|
2018 | $158,387 | $158,627 | $129,658 |
|---|
2018 | $176,115 | $176,426 | $139,594 |
|---|
2018 | $159,265 | $159,577 | $132,050 |
|---|
2019 | $168,959 | $169,323 | $134,688 |
|---|
2019 | $170,615 | $171,019 | $132,882 |
|---|
2019 | $187,909 | $188,422 | $141,436 |
|---|
2019 | $208,514 | $209,129 | $152,576 |
|---|
2020 | $208,514 | $209,196 | $143,841 |
|---|
2020 | $231,940 | $232,795 | $148,014 |
|---|
2020 | $292,719 | $293,909 | $171,813 |
|---|
2020 | $299,127 | $300,460 | $181,762 |
|---|
2021 | $319,068 | $320,583 | $195,080 |
|---|
2021 | $333,580 | $335,234 | $213,559 |
|---|
2021 | $382,893 | $384,854 | $229,522 |
|---|
2021 | $402,342 | $404,506 | $230,655 |
|---|
2022 | $364,073 | $366,195 | $219,820 |
|---|
2022 | $325,943 | $327,988 | $206,240 |
|---|
2022 | $315,885 | $317,950 | $199,000 |
|---|
2022 | $315,655 | $317,795 | $205,651 |
|---|
2023 | $320,078 | $322,327 | $202,286 |
|---|
2023 | $379,662 | $382,417 | $210,760 |
|---|
2023 | $405,805 | $408,834 | $228,878 |
|---|
2023 | $422,356 | $425,107 | $231,975 |
|---|
2024 | $474,668 | $477,855 | $260,227 |
|---|
2024 | $490,035 | $493,432 | $269,232 |
|---|
2024 | $527,466 | $531,268 | $288,732 |
|---|
2024 | $572,955 | $577,224 | $312,002 |
|---|
2025 | $551,294 | $555,490 | $306,030 |
|---|
2025 | $560,046 | $564,438 | $304,223 |
|---|
2025 | $643,630 | $648,869 | $334,541 |
|---|
2025 | $696,007 | $701,839 | $354,555 |
|---|
2026 | $672,695 | $678,471 | $358,486 |
|---|
2026 | $897,671 | $905,623 | $395,539 |
|---|
2026 | $894,563 | $902,674 | $402,772 |
|---|
|
|
| Average Annual Return [Table Text Block] |
|
Table Summary | 1 Year | 5 Years | 10 Years |
|---|
Admiral Shares | 38.99% | 18.50% | 24.50% |
|---|
Information Technology Spliced Index | 39.11% | 18.59% | 24.61% |
|---|
MSCI US Investable Market 2500 Index | 20.40% | 11.90% | 14.95% |
|---|
|
|
| No Deduction of Taxes [Text Block] |
|
The graph and returns shown do not reflect taxes that a shareholder would pay on fund distributions or on the sale of fund shares.
|
|
| Updated Performance Information Location [Text Block] |
|
Updated performance information is available on our website at vanguard.com/performance or by calling Vanguard toll-free at 800-662-7447.
|
|
| AssetsNet |
|
$ 170,247,000,000
|
|
| Holdings Count | Holding |
|
322
|
|
| Advisory Fees Paid, Amount |
|
$ 1,434,000
|
|
| InvestmentCompanyPortfolioTurnover |
|
9.00%
|
|
| Additional Fund Statistics [Text Block] |
|
Fund Statistics
(as of August 31, 2026)Table SummaryFund Net Assets (in millions) | $170,247 |
|---|
Number of Portfolio Holdings | 322 |
|---|
Portfolio Turnover Rate | 9% |
|---|
Total Investment Advisory Fees (in thousands) | $1,434 |
|---|
|
|
| Holdings [Text Block] |
|
Portfolio Composition % of Net Assets
(as of August 31, 2026)Table SummaryCommunications Equipment | 4.0% |
|---|
Electronic Equipment, Instruments & Components | 4.6% |
|---|
IT Services | 3.7% |
|---|
Semiconductors & Semiconductor Equipment | 41.9% |
|---|
Software | 26.0% |
|---|
Technology Hardware, Storage & Peripherals | 19.7% |
|---|
Other Assets and Liabilities—Net | 0.1% |
|---|
This table reflects the Fund's investments, including short-term investments, derivatives and other assets and liabilities. |
|
| Material Fund Change [Text Block] |
|
|
|
| Updated Prospectus Phone Number |
|
800-662-7447
|
|
| Updated Prospectus Web Address |
|
https://personal1.vanguard.com/ngf-next-gen-form-webapp/fund-literature
|
|
| C000012228 |
|
|
|
| Shareholder Report [Line Items] |
|
|
|
| Fund Name |
|
International Growth Fund
|
|
| Class Name |
|
Investor Shares
|
|
| Trading Symbol |
|
VWIGX
|
|
| Annual or Semi-Annual Statement [Text Block] |
|
This annual shareholder report contains important information about Vanguard International Growth Fund (the "Fund") for the period of September 1, 2025, to August 31, 2026.
|
|
| Additional Information [Text Block] |
|
You can find additional information about the Fund at https://personal1.vanguard.com/ngf-next-gen-form-webapp/fund-literature. You can also request this information by contacting us at 800-662-7447.
|
|
| Additional Information Phone Number |
|
<span style="white-space: nowrap; box-sizing: border-box; color: rgb(0, 0, 0); display: inline; flex-wrap: nowrap; font-size: 10.6667px; font-weight: 400; grid-area: auto; line-height: 16px; margin: 0px; overflow: visible; text-align: left; text-align-last: auto;"> 800-662-7447</span>
|
|
| Additional Information Website |
|
<span style="white-space: nowrap; box-sizing: border-box; color: rgb(0, 0, 0); display: inline; flex-wrap: nowrap; font-size: 10.6667px; font-weight: 400; grid-area: auto; line-height: 16px; margin: 0px; overflow: visible; text-align: left; text-align-last: auto;"> <span style="box-sizing: border-box; color: rgb(0, 0, 0); display: inline; flex-wrap: nowrap; font-size: 10.6667px; font-weight: 400; grid-area: auto; line-height: 16px; margin: 0px; overflow: visible; text-align: left; text-align-last: auto; white-space-collapse: collapse;"><span style="text-decoration: underline; box-sizing: border-box; color: rgb(0, 0, 0); display: inline; flex-wrap: nowrap; font-size: 10.6667px; font-weight: 400; grid-area: auto; line-height: 16px; margin: 0px; overflow: visible; text-align: left; text-align-last: auto; white-space-collapse: collapse;">https://personal1.vanguard.com/ngf-next-gen-form-webapp/fund-literature</span></span></span>
|
|
| Expenses [Text Block] |
|
What were the Fund costs for the last year?(based on a hypothetical $10,000 investment) Table SummaryShare Class Name | Costs of a $10,000 investment | Costs paid as a percentage of a $10,000 investment |
|---|
Investor Shares | $39 | 0.36% |
|---|
|
|
| Expenses Paid, Amount |
|
$ 39
|
|
| Expense Ratio, Percent |
|
0.36%
|
|
| Factors Affecting Performance [Text Block] |
|
How did the Fund perform during the reporting period? For the 12 months ended August 31, 2026, the Fund underperformed its benchmark. Global equities posted strong returns, while global bonds struggled. Resilient growth and corporate earnings supported stocks, though shifting U.S. trade policy, persistent inflation, and Middle East tensions that disrupted energy supplies and raised oil prices fueled volatility. Some central banks, including those in the United States and the United Kingdom, lowered rates. However, developed-market government bond yields generally rose amid concerns about borrowing, inflation, and monetary policy. From a geographic perspective, the Fund lagged its benchmark across all regions. North America, the Pacific region, and Europe detracted the most. The Fund lagged its benchmark in five of 11 industry sectors. Stock selection in consumer discretionary, financials, and communication services detracted the most from relative performance. Selection in health care and industrials, as well as an overweight allocation to information technology, contributed the most.
|
|
| Performance Past Does Not Indicate Future [Text] |
|
Keep in mind that the Fund's past performance does not indicate how the Fund will perform in the future.
|
|
| Line Graph [Table Text Block] |
|
Table Summary | Investor Shares | MSCI All Country World Index ex USA Net |
|---|
2016 | $10,000 | $10,000 |
|---|
2016 | $9,562 | $9,747 |
|---|
2017 | $10,386 | $10,515 |
|---|
2017 | $11,838 | $11,370 |
|---|
2017 | $12,843 | $11,888 |
|---|
2017 | $13,580 | $12,436 |
|---|
2018 | $14,334 | $12,790 |
|---|
2018 | $14,293 | $12,470 |
|---|
2018 | $14,252 | $12,266 |
|---|
2018 | $12,856 | $11,427 |
|---|
2019 | $13,532 | $11,963 |
|---|
2019 | $13,118 | $11,689 |
|---|
2019 | $13,599 | $11,865 |
|---|
2019 | $14,877 | $12,706 |
|---|
2020 | $14,900 | $11,881 |
|---|
2020 | $16,136 | $11,288 |
|---|
2020 | $20,888 | $12,852 |
|---|
2020 | $23,559 | $13,916 |
|---|
2021 | $25,662 | $14,991 |
|---|
2021 | $25,787 | $16,117 |
|---|
2021 | $27,131 | $16,048 |
|---|
2021 | $25,199 | $15,188 |
|---|
2022 | $21,153 | $14,932 |
|---|
2022 | $18,371 | $14,117 |
|---|
2022 | $17,219 | $12,915 |
|---|
2022 | $18,088 | $13,385 |
|---|
2023 | $18,341 | $13,858 |
|---|
2023 | $18,746 | $13,919 |
|---|
2023 | $18,909 | $14,451 |
|---|
2023 | $18,824 | $14,625 |
|---|
2024 | $20,434 | $15,592 |
|---|
2024 | $21,450 | $16,249 |
|---|
2024 | $22,042 | $17,083 |
|---|
2024 | $22,319 | $16,531 |
|---|
2025 | $23,126 | $17,097 |
|---|
2025 | $24,044 | $18,484 |
|---|
2025 | $25,158 | $19,717 |
|---|
2025 | $25,644 | $20,835 |
|---|
2026 | $26,721 | $23,885 |
|---|
2026 | $27,183 | $24,541 |
|---|
2026 | $28,728 | $25,110 |
|---|
|
|
| Average Annual Return [Table Text Block] |
|
Table Summary | 1 Year | 5 Years | 10 Years |
|---|
Investor Shares | 14.19% | 1.15% | 11.13% |
|---|
MSCI All Country World Index ex USA Net | 27.35% | 9.37% | 9.64% |
|---|
|
|
| No Deduction of Taxes [Text Block] |
|
The graph and returns shown do not reflect taxes that a shareholder would pay on fund distributions or on the sale of fund shares.
|
|
| Updated Performance Information Location [Text Block] |
|
Updated performance information is available on our website at vanguard.com/performance or by calling Vanguard toll-free at 800-662-7447.
|
|
| AssetsNet |
|
$ 44,766,000,000
|
|
| Holdings Count | Holding |
|
131
|
|
| Advisory Fees Paid, Amount |
|
$ 43,804,000
|
|
| InvestmentCompanyPortfolioTurnover |
|
25.00%
|
|
| Additional Fund Statistics [Text Block] |
|
Fund Statistics
(as of August 31, 2026)Table SummaryFund Net Assets (in millions) | $44,766 |
|---|
Number of Portfolio Holdings | 131 |
|---|
Portfolio Turnover Rate | 25% |
|---|
Total Investment Advisory Fees (in thousands) | $43,804 |
|---|
|
|
| Holdings [Text Block] |
|
Portfolio Composition % of Net Assets
(as of August 31, 2026)Table SummaryAsia | 40.1% |
|---|
Europe | 46.5% |
|---|
North America | 9.8% |
|---|
Oceania | 0.5% |
|---|
South America | 1.6% |
|---|
Other Assets and Liabilities—Net | 1.5% |
|---|
This table reflects the Fund's investments, including short-term investments, derivatives and other assets and liabilities. |
|
| Material Fund Change [Text Block] |
|
|
|
| Updated Prospectus Phone Number |
|
800-662-7447
|
|
| Updated Prospectus Web Address |
|
https://personal1.vanguard.com/ngf-next-gen-form-webapp/fund-literature
|
|
| C000012229 |
|
|
|
| Shareholder Report [Line Items] |
|
|
|
| Fund Name |
|
International Growth Fund
|
|
| Class Name |
|
Admiral™ Shares
|
|
| Trading Symbol |
|
VWILX
|
|
| Annual or Semi-Annual Statement [Text Block] |
|
This annual shareholder report contains important information about Vanguard International Growth Fund (the "Fund") for the period of September 1, 2025, to August 31, 2026.
|
|
| Additional Information [Text Block] |
|
You can find additional information about the Fund at https://personal1.vanguard.com/ngf-next-gen-form-webapp/fund-literature. You can also request this information by contacting us at 800-662-7447.
|
|
| Additional Information Phone Number |
|
<span style="white-space: nowrap; box-sizing: border-box; color: rgb(0, 0, 0); display: inline; flex-wrap: nowrap; font-size: 10.6667px; font-weight: 400; grid-area: auto; line-height: 16px; margin: 0px; overflow: visible; text-align: left; text-align-last: auto;"> 800-662-7447</span>
|
|
| Additional Information Website |
|
<span style="white-space: nowrap; box-sizing: border-box; color: rgb(0, 0, 0); display: inline; flex-wrap: nowrap; font-size: 10.6667px; font-weight: 400; grid-area: auto; line-height: 16px; margin: 0px; overflow: visible; text-align: left; text-align-last: auto;"> <span style="box-sizing: border-box; color: rgb(0, 0, 0); display: inline; flex-wrap: nowrap; font-size: 10.6667px; font-weight: 400; grid-area: auto; line-height: 16px; margin: 0px; overflow: visible; text-align: left; text-align-last: auto; white-space-collapse: collapse;"><span style="text-decoration: underline; box-sizing: border-box; color: rgb(0, 0, 0); display: inline; flex-wrap: nowrap; font-size: 10.6667px; font-weight: 400; grid-area: auto; line-height: 16px; margin: 0px; overflow: visible; text-align: left; text-align-last: auto; white-space-collapse: collapse;">https://personal1.vanguard.com/ngf-next-gen-form-webapp/fund-literature</span></span></span>
|
|
| Expenses [Text Block] |
|
What were the Fund costs for the last year?(based on a hypothetical $10,000 investment) Table SummaryShare Class Name | Costs of a $10,000 investment | Costs paid as a percentage of a $10,000 investment |
|---|
Admiral Shares | $26 | 0.24% |
|---|
|
|
| Expenses Paid, Amount |
|
$ 26
|
|
| Expense Ratio, Percent |
|
0.24%
|
|
| Factors Affecting Performance [Text Block] |
|
How did the Fund perform during the reporting period? For the 12 months ended August 31, 2026, the Fund underperformed its benchmark. Global equities posted strong returns, while global bonds struggled. Resilient growth and corporate earnings supported stocks, though shifting U.S. trade policy, persistent inflation, and Middle East tensions that disrupted energy supplies and raised oil prices fueled volatility. Some central banks, including those in the United States and the United Kingdom, lowered rates. However, developed-market government bond yields generally rose amid concerns about borrowing, inflation, and monetary policy. From a geographic perspective, the Fund lagged its benchmark across all regions. North America, the Pacific region, and Europe detracted the most. The Fund lagged its benchmark in five of 11 industry sectors. Stock selection in consumer discretionary, financials, and communication services detracted the most from relative performance. Selection in health care and industrials, as well as an overweight allocation to information technology, contributed the most.
|
|
| Performance Past Does Not Indicate Future [Text] |
|
Keep in mind that the Fund's past performance does not indicate how the Fund will perform in the future.
|
|
| Line Graph [Table Text Block] |
|
Table Summary | Admiral Shares | MSCI All Country World Index ex USA Net |
|---|
2016 | $50,000 | $50,000 |
|---|
2016 | $47,830 | $48,735 |
|---|
2017 | $51,956 | $52,577 |
|---|
2017 | $59,244 | $56,851 |
|---|
2017 | $64,287 | $59,439 |
|---|
2017 | $68,006 | $62,182 |
|---|
2018 | $71,808 | $63,948 |
|---|
2018 | $71,635 | $62,350 |
|---|
2018 | $71,449 | $61,330 |
|---|
2018 | $64,473 | $57,134 |
|---|
2019 | $67,879 | $59,816 |
|---|
2019 | $65,826 | $58,447 |
|---|
2019 | $68,235 | $59,326 |
|---|
2019 | $74,684 | $63,531 |
|---|
2020 | $74,806 | $59,403 |
|---|
2020 | $81,048 | $56,440 |
|---|
2020 | $104,952 | $64,259 |
|---|
2020 | $118,397 | $69,581 |
|---|
2021 | $128,995 | $74,957 |
|---|
2021 | $129,656 | $80,583 |
|---|
2021 | $136,452 | $80,238 |
|---|
2021 | $126,785 | $75,942 |
|---|
2022 | $106,436 | $74,659 |
|---|
2022 | $92,474 | $70,585 |
|---|
2022 | $86,697 | $64,576 |
|---|
2022 | $91,109 | $66,926 |
|---|
2023 | $92,408 | $69,292 |
|---|
2023 | $94,468 | $69,593 |
|---|
2023 | $95,301 | $72,255 |
|---|
2023 | $94,908 | $73,124 |
|---|
2024 | $103,043 | $77,960 |
|---|
2024 | $108,209 | $81,246 |
|---|
2024 | $111,218 | $85,413 |
|---|
2024 | $112,653 | $82,654 |
|---|
2025 | $116,778 | $85,484 |
|---|
2025 | $121,419 | $92,418 |
|---|
2025 | $127,110 | $98,585 |
|---|
2025 | $129,597 | $104,175 |
|---|
2026 | $135,085 | $119,426 |
|---|
2026 | $137,438 | $122,703 |
|---|
2026 | $145,314 | $125,548 |
|---|
|
|
| Average Annual Return [Table Text Block] |
|
Table Summary | 1 Year | 5 Years | 10 Years |
|---|
Admiral Shares | 14.32% | 1.27% | 11.26% |
|---|
MSCI All Country World Index ex USA Net | 27.35% | 9.37% | 9.64% |
|---|
|
|
| No Deduction of Taxes [Text Block] |
|
The graph and returns shown do not reflect taxes that a shareholder would pay on fund distributions or on the sale of fund shares.
|
|
| Updated Performance Information Location [Text Block] |
|
Updated performance information is available on our website at vanguard.com/performance or by calling Vanguard toll-free at 800-662-7447.
|
|
| AssetsNet |
|
$ 44,766,000,000
|
|
| Holdings Count | Holding |
|
131
|
|
| Advisory Fees Paid, Amount |
|
$ 43,804,000
|
|
| InvestmentCompanyPortfolioTurnover |
|
25.00%
|
|
| Additional Fund Statistics [Text Block] |
|
Fund Statistics
(as of August 31, 2026)Table SummaryFund Net Assets (in millions) | $44,766 |
|---|
Number of Portfolio Holdings | 131 |
|---|
Portfolio Turnover Rate | 25% |
|---|
Total Investment Advisory Fees (in thousands) | $43,804 |
|---|
|
|
| Holdings [Text Block] |
|
Portfolio Composition % of Net Assets
(as of August 31, 2026)Table SummaryAsia | 40.1% |
|---|
Europe | 46.5% |
|---|
North America | 9.8% |
|---|
Oceania | 0.5% |
|---|
South America | 1.6% |
|---|
Other Assets and Liabilities—Net | 1.5% |
|---|
This table reflects the Fund's investments, including short-term investments, derivatives and other assets and liabilities. |
|
| Material Fund Change [Text Block] |
|
|
|
| Updated Prospectus Phone Number |
|
800-662-7447
|
|
| Updated Prospectus Web Address |
|
https://personal1.vanguard.com/ngf-next-gen-form-webapp/fund-literature
|
|
| C000055210 |
|
|
|
| Shareholder Report [Line Items] |
|
|
|
| Fund Name |
|
Morningstar Mega Cap Index Fund
|
|
| Class Name |
|
ETF Shares
|
|
| Trading Symbol |
|
MGC
|
|
| Security Exchange Name |
|
NYSEArca
|
|
| Annual or Semi-Annual Statement [Text Block] |
|
This annual shareholder report contains important information about Vanguard Morningstar Mega Cap Index Fund (the "Fund") (formerly known as Vanguard Mega Cap Index Fund) for the period of September 1, 2025, to August 31, 2026.
|
|
| Additional Information [Text Block] |
|
You can find additional information about the Fund at https://personal1.vanguard.com/ngf-next-gen-form-webapp/fund-literature. You can also request this information by contacting us at 800-662-7447.
|
|
| Material Fund Change Notice [Text Block] |
|
The report describes changes to the Fund that occurred during the reporting period.
|
|
| Additional Information Phone Number |
|
<span style="white-space: nowrap; box-sizing: border-box; color: rgb(0, 0, 0); display: inline; flex-wrap: nowrap; font-size: 10.6667px; font-weight: 400; grid-area: auto; line-height: 16px; margin: 0px; overflow: visible; text-align: left; text-align-last: auto;"> 800-662-7447</span>
|
|
| Additional Information Website |
|
<span style="white-space: nowrap; box-sizing: border-box; color: rgb(0, 0, 0); display: inline; flex-wrap: nowrap; font-size: 10.6667px; font-weight: 400; grid-area: auto; line-height: 16px; margin: 0px; overflow: visible; text-align: left; text-align-last: auto;"> <span style="box-sizing: border-box; color: rgb(0, 0, 0); display: inline; flex-wrap: nowrap; font-size: 10.6667px; font-weight: 400; grid-area: auto; line-height: 16px; margin: 0px; overflow: visible; text-align: left; text-align-last: auto; white-space-collapse: collapse;"><span style="text-decoration: underline; box-sizing: border-box; color: rgb(0, 0, 0); display: inline; flex-wrap: nowrap; font-size: 10.6667px; font-weight: 400; grid-area: auto; line-height: 16px; margin: 0px; overflow: visible; text-align: left; text-align-last: auto; white-space-collapse: collapse;">https://personal1.vanguard.com/ngf-next-gen-form-webapp/fund-literature</span></span></span>
|
|
| Expenses [Text Block] |
|
What were the Fund costs for the last year?(based on a hypothetical $10,000 investment) Table SummaryShare Class Name | Costs of a $10,000 investment | Costs paid as a percentage of a $10,000 investment |
|---|
ETF Shares | $7 | 0.06% |
|---|
|
|
| Expenses Paid, Amount |
|
$ 7
|
|
| Expense Ratio, Percent |
|
0.06%
|
|
| Factors Affecting Performance [Text Block] |
|
How did the Fund perform during the reporting period? For the 12 months ended August 31, 2026, the Fund performed roughly in line with its benchmark. Global equities posted strong returns, while global bonds struggled. Resilient growth and corporate earnings supported stocks, though shifting U.S. trade policy, persistent inflation, and Middle East tensions that disrupted energy supplies and raised oil prices fueled volatility. Some central banks, including those in the United States and the United Kingdom, lowered rates. However, developed-market government bond yields generally rose amid concerns about borrowing, inflation, and monetary policy. Each of the benchmark’s 11 industry sectors posted positive returns for the 12 months. Technology, health care, and industrials contributed the most to the benchmark’s return.
|
|
| Performance Past Does Not Indicate Future [Text] |
|
Keep in mind that the Fund's past performance does not indicate how the Fund will perform in the future.
|
|
| Line Graph [Table Text Block] |
|
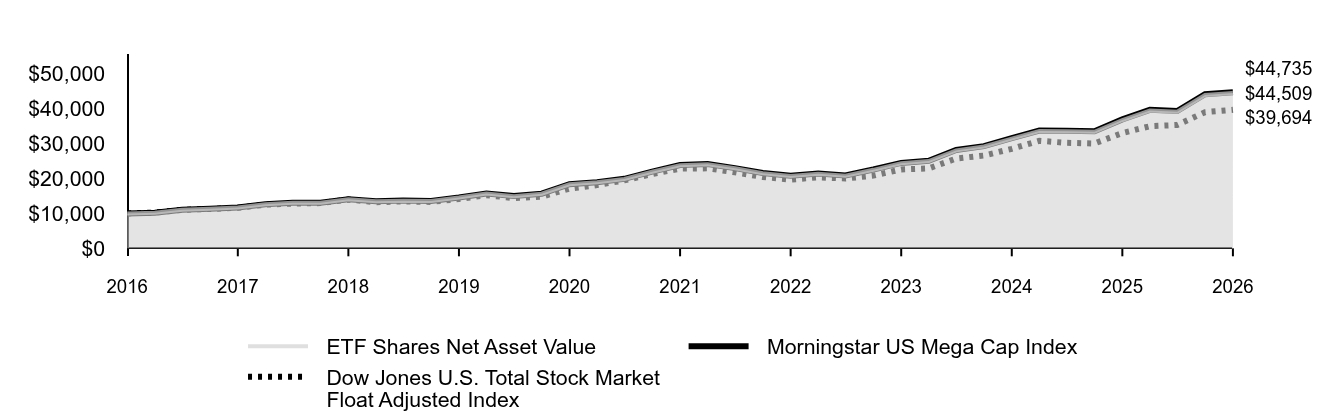 Table Summary | ETF Shares Net Asset Value | Morningstar US Mega Cap Index | Dow Jones U.S. Total Stock Market Float Adjusted Index |
|---|
2016 | $10,000 | $10,000 | $10,000 |
|---|
2016 | $10,184 | $10,185 | $10,233 |
|---|
2017 | $11,032 | $11,036 | $11,028 |
|---|
2017 | $11,331 | $11,336 | $11,265 |
|---|
2017 | $11,701 | $11,708 | $11,605 |
|---|
2017 | $12,604 | $12,612 | $12,514 |
|---|
2018 | $13,032 | $13,041 | $12,818 |
|---|
2018 | $13,023 | $13,033 | $12,965 |
|---|
2018 | $14,070 | $14,083 | $13,956 |
|---|
2018 | $13,500 | $13,511 | $13,202 |
|---|
2019 | $13,661 | $13,673 | $13,458 |
|---|
2019 | $13,578 | $13,590 | $13,279 |
|---|
2019 | $14,530 | $14,544 | $14,127 |
|---|
2019 | $15,707 | $15,725 | $15,231 |
|---|
2020 | $14,937 | $14,957 | $14,369 |
|---|
2020 | $15,629 | $15,654 | $14,780 |
|---|
2020 | $18,327 | $18,361 | $17,123 |
|---|
2020 | $18,907 | $18,944 | $18,115 |
|---|
2021 | $19,869 | $19,910 | $19,470 |
|---|
2021 | $21,923 | $21,971 | $21,279 |
|---|
2021 | $23,814 | $23,872 | $22,828 |
|---|
2021 | $24,113 | $24,175 | $22,913 |
|---|
2022 | $22,923 | $22,983 | $21,794 |
|---|
2022 | $21,497 | $21,557 | $20,429 |
|---|
2022 | $20,697 | $20,759 | $19,693 |
|---|
2022 | $21,342 | $21,412 | $20,334 |
|---|
2023 | $20,805 | $20,876 | $19,999 |
|---|
2023 | $22,487 | $22,569 | $20,821 |
|---|
2023 | $24,379 | $24,470 | $22,598 |
|---|
2023 | $24,996 | $25,082 | $22,901 |
|---|
2024 | $28,059 | $28,161 | $25,719 |
|---|
2024 | $29,166 | $29,279 | $26,584 |
|---|
2024 | $31,436 | $31,562 | $28,511 |
|---|
2024 | $33,589 | $33,728 | $30,815 |
|---|
2025 | $33,515 | $33,660 | $30,221 |
|---|
2025 | $33,405 | $33,555 | $30,045 |
|---|
2025 | $36,766 | $36,938 | $33,038 |
|---|
2025 | $39,479 | $39,670 | $34,985 |
|---|
2026 | $39,157 | $39,353 | $35,334 |
|---|
2026 | $43,946 | $44,172 | $39,010 |
|---|
2026 | $44,509 | $44,735 | $39,694 |
|---|
|
|
| Average Annual Return [Table Text Block] |
|
Table Summary | 1 Year | 5 Years | 10 Years |
|---|
ETF Shares Net Asset Value | 21.06% | 13.32% | 16.10% |
|---|
ETF Shares Market Price | 20.96% | 13.32% | 16.10% |
|---|
Morningstar US Mega Cap Index | 21.11% | 13.38% | 16.16% |
|---|
Dow Jones U.S. Total Stock Market Float Adjusted Index | 20.15% | 11.70% | 14.78% |
|---|
|
|
| No Deduction of Taxes [Text Block] |
|
The graph and returns shown do not reflect taxes that a shareholder would pay on fund distributions or on the sale of fund shares.
|
|
| Material Change Date |
|
|
Aug. 31, 2025
|
| Updated Performance Information Location [Text Block] |
|
Updated performance information is available on our website at vanguard.com/performance or by calling Vanguard toll-free at 800-662-7447.
|
|
| AssetsNet |
|
$ 10,899,000,000
|
|
| Holdings Count | Holding |
|
178
|
|
| Advisory Fees Paid, Amount |
|
$ 107,000
|
|
| InvestmentCompanyPortfolioTurnover |
|
7.00%
|
|
| Additional Fund Statistics [Text Block] |
|
Fund Statistics
(as of August 31, 2026)Table SummaryFund Net Assets (in millions) | $10,899 |
|---|
Number of Portfolio Holdings | 178 |
|---|
Portfolio Turnover Rate | 7% |
|---|
Total Investment Advisory Fees (in thousands) | $107 |
|---|
|
|
| Holdings [Text Block] |
|
Portfolio Composition % of Net Assets
(as of August 31, 2026)Table SummaryBasic Materials | 0.9% |
|---|
Consumer Discretionary | 11.9% |
|---|
Consumer Staples | 3.1% |
|---|
Energy | 2.5% |
|---|
Financials | 9.3% |
|---|
Health Care | 9.0% |
|---|
Industrials | 8.9% |
|---|
Real Estate | 0.9% |
|---|
Technology | 50.1% |
|---|
Telecommunications | 2.3% |
|---|
Utilities | 0.9% |
|---|
Other Assets and Liabilities—Net | 0.2% |
|---|
This table reflects the Fund's investments, including short-term investments, derivatives and other assets and liabilities. |
|
| Material Fund Change [Text Block] |
|
How has the Fund changed?During the reporting period, the expense ratio for the ETF Share class of the Fund was reduced. The Fund's name changed from Vanguard Mega Cap Index Fund to Vanguard Morningstar Mega Cap Index Fund. This is a summary of certain changes to the Fund since August 31, 2025. For more complete information, you may review the Fund’s next prospectus, which we expect to be available by December 31, 2026, at https://personal1.vanguard.com/ngf-next-gen-form-webapp/fund-literature or upon request at 800-662-7447. |
|
| Material Fund Change Name [Text Block] |
|
The Fund's name changed from Vanguard Mega Cap Index Fund to Vanguard Morningstar Mega Cap Index Fund.
|
|
| Material Fund Change Expenses [Text Block] |
|
During the reporting period, the expense ratio for the ETF Share class of the Fund was reduced.
|
|
| Summary of Change Legend [Text Block] |
|
This is a summary of certain changes to the Fund since August 31, 2025. For more complete information, you may review the Fund’s next prospectus, which we expect to be available by December 31, 2026, at https://personal1.vanguard.com/ngf-next-gen-form-webapp/fund-literature or upon request at 800-662-7447.
|
|
| Updated Prospectus Phone Number |
|
800-662-7447
|
|
| Updated Prospectus Web Address |
|
https://personal1.vanguard.com/ngf-next-gen-form-webapp/fund-literature
|
|
| C000055209 |
|
|
|
| Shareholder Report [Line Items] |
|
|
|
| Fund Name |
|
Morningstar Mega Cap Index Fund
|
|
| Class Name |
|
Institutional Shares
|
|
| Trading Symbol |
|
VMCTX
|
|
| Annual or Semi-Annual Statement [Text Block] |
|
This annual shareholder report contains important information about Vanguard Morningstar Mega Cap Index Fund (the "Fund") (formerly known as Vanguard Mega Cap Index Fund) for the period of September 1, 2025, to August 31, 2026.
|
|
| Additional Information [Text Block] |
|
You can find additional information about the Fund at https://personal1.vanguard.com/ngf-next-gen-form-webapp/fund-literature. You can also request this information by contacting us at 800-662-7447.
|
|
| Material Fund Change Notice [Text Block] |
|
The report describes changes to the Fund that occurred during the reporting period.
|
|
| Additional Information Phone Number |
|
<span style="white-space: nowrap; box-sizing: border-box; color: rgb(0, 0, 0); display: inline; flex-wrap: nowrap; font-size: 10.6667px; font-weight: 400; grid-area: auto; line-height: 16px; margin: 0px; overflow: visible; text-align: left; text-align-last: auto;"> 800-662-7447</span>
|
|
| Additional Information Website |
|
<span style="white-space: nowrap; box-sizing: border-box; color: rgb(0, 0, 0); display: inline; flex-wrap: nowrap; font-size: 10.6667px; font-weight: 400; grid-area: auto; line-height: 16px; margin: 0px; overflow: visible; text-align: left; text-align-last: auto;"> <span style="box-sizing: border-box; color: rgb(0, 0, 0); display: inline; flex-wrap: nowrap; font-size: 10.6667px; font-weight: 400; grid-area: auto; line-height: 16px; margin: 0px; overflow: visible; text-align: left; text-align-last: auto; white-space-collapse: collapse;"><span style="text-decoration: underline; box-sizing: border-box; color: rgb(0, 0, 0); display: inline; flex-wrap: nowrap; font-size: 10.6667px; font-weight: 400; grid-area: auto; line-height: 16px; margin: 0px; overflow: visible; text-align: left; text-align-last: auto; white-space-collapse: collapse;">https://personal1.vanguard.com/ngf-next-gen-form-webapp/fund-literature</span></span></span>
|
|
| Expenses [Text Block] |
|
What were the Fund costs for the last year?(based on a hypothetical $10,000 investment) Table SummaryShare Class Name | Costs of a $10,000 investment | Costs paid as a percentage of a $10,000 investment |
|---|
Institutional Shares | $6 | 0.05% |
|---|
|
|
| Expenses Paid, Amount |
|
$ 6
|
|
| Expense Ratio, Percent |
|
0.05%
|
|
| Factors Affecting Performance [Text Block] |
|
How did the Fund perform during the reporting period? For the 12 months ended August 31, 2026, the Fund performed roughly in line with its benchmark. Global equities posted strong returns, while global bonds struggled. Resilient growth and corporate earnings supported stocks, though shifting U.S. trade policy, persistent inflation, and Middle East tensions that disrupted energy supplies and raised oil prices fueled volatility. Some central banks, including those in the United States and the United Kingdom, lowered rates. However, developed-market government bond yields generally rose amid concerns about borrowing, inflation, and monetary policy. Each of the benchmark’s 11 industry sectors posted positive returns for the 12 months. Technology, health care, and industrials contributed the most to the benchmark’s return.
|
|
| Performance Past Does Not Indicate Future [Text] |
|
Keep in mind that the Fund's past performance does not indicate how the Fund will perform in the future.
|
|
| Line Graph [Table Text Block] |
|
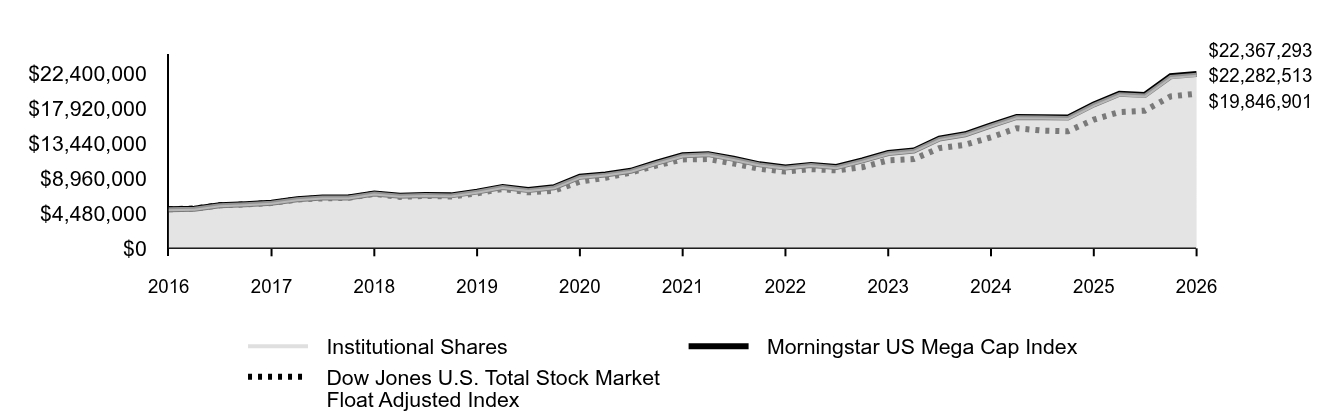 Table Summary | Institutional Shares | Morningstar US Mega Cap Index | Dow Jones U.S. Total Stock Market Float Adjusted Index |
|---|
2016 | $5,000,000 | $5,000,000 | $5,000,000 |
|---|
2016 | $5,091,920 | $5,092,557 | $5,116,612 |
|---|
2017 | $5,516,425 | $5,517,768 | $5,513,817 |
|---|
2017 | $5,666,190 | $5,668,131 | $5,632,496 |
|---|
2017 | $5,851,154 | $5,854,007 | $5,802,313 |
|---|
2017 | $6,303,065 | $6,305,785 | $6,256,892 |
|---|
2018 | $6,516,816 | $6,520,455 | $6,408,855 |
|---|
2018 | $6,512,161 | $6,516,301 | $6,482,327 |
|---|
2018 | $7,036,391 | $7,041,340 | $6,977,843 |
|---|
2018 | $6,751,188 | $6,755,654 | $6,600,859 |
|---|
2019 | $6,830,749 | $6,836,269 | $6,728,954 |
|---|
2019 | $6,789,327 | $6,795,090 | $6,639,384 |
|---|
2019 | $7,265,284 | $7,272,113 | $7,063,661 |
|---|
2019 | $7,853,992 | $7,862,463 | $7,615,631 |
|---|
2020 | $7,469,511 | $7,478,285 | $7,184,422 |
|---|
2020 | $7,817,563 | $7,827,065 | $7,390,068 |
|---|
2020 | $9,168,139 | $9,180,701 | $8,561,505 |
|---|
2020 | $9,458,474 | $9,472,015 | $9,057,250 |
|---|
2021 | $9,940,067 | $9,954,802 | $9,735,081 |
|---|
2021 | $10,968,882 | $10,985,726 | $10,639,299 |
|---|
2021 | $11,915,560 | $11,935,934 | $11,414,050 |
|---|
2021 | $12,065,579 | $12,087,322 | $11,456,415 |
|---|
2022 | $11,470,756 | $11,491,537 | $10,896,787 |
|---|
2022 | $10,757,675 | $10,778,613 | $10,214,460 |
|---|
2022 | $10,357,965 | $10,379,471 | $9,846,677 |
|---|
2022 | $10,682,367 | $10,705,926 | $10,167,204 |
|---|
2023 | $10,413,119 | $10,437,864 | $9,999,579 |
|---|
2023 | $11,255,139 | $11,284,437 | $10,410,644 |
|---|
2023 | $12,202,268 | $12,235,111 | $11,298,765 |
|---|
2023 | $12,510,257 | $12,541,177 | $11,450,657 |
|---|
2024 | $14,044,654 | $14,080,741 | $12,859,424 |
|---|
2024 | $14,599,258 | $14,639,476 | $13,292,095 |
|---|
2024 | $15,735,388 | $15,781,197 | $14,255,636 |
|---|
2024 | $16,813,360 | $16,863,751 | $15,407,713 |
|---|
2025 | $16,776,790 | $16,830,203 | $15,110,339 |
|---|
2025 | $16,722,085 | $16,777,666 | $15,022,328 |
|---|
2025 | $18,405,396 | $18,468,830 | $16,518,955 |
|---|
2025 | $19,763,902 | $19,835,168 | $17,492,634 |
|---|
2026 | $19,603,475 | $19,676,548 | $17,666,856 |
|---|
2026 | $22,000,907 | $22,085,943 | $19,505,184 |
|---|
2026 | $22,282,513 | $22,367,293 | $19,846,901 |
|---|
|
|
| Average Annual Return [Table Text Block] |
|
Table Summary | 1 Year | 5 Years | 10 Years |
|---|
Institutional Shares | 21.07% | 13.34% | 16.12% |
|---|
Morningstar US Mega Cap Index | 21.11% | 13.38% | 16.16% |
|---|
Dow Jones U.S. Total Stock Market Float Adjusted Index | 20.15% | 11.70% | 14.78% |
|---|
|
|
| No Deduction of Taxes [Text Block] |
|
The graph and returns shown do not reflect taxes that a shareholder would pay on fund distributions or on the sale of fund shares.
|
|
| Material Change Date |
|
|
Aug. 31, 2025
|
| Updated Performance Information Location [Text Block] |
|
Updated performance information is available on our website at vanguard.com/performance or by calling Vanguard toll-free at 800-662-7447.
|
|
| AssetsNet |
|
$ 10,899,000,000
|
|
| Holdings Count | Holding |
|
178
|
|
| Advisory Fees Paid, Amount |
|
$ 107,000
|
|
| InvestmentCompanyPortfolioTurnover |
|
7.00%
|
|
| Additional Fund Statistics [Text Block] |
|
Fund Statistics
(as of August 31, 2026)Table SummaryFund Net Assets (in millions) | $10,899 |
|---|
Number of Portfolio Holdings | 178 |
|---|
Portfolio Turnover Rate | 7% |
|---|
Total Investment Advisory Fees (in thousands) | $107 |
|---|
|
|
| Holdings [Text Block] |
|
Portfolio Composition % of Net Assets
(as of August 31, 2026)Table SummaryBasic Materials | 0.9% |
|---|
Consumer Discretionary | 11.9% |
|---|
Consumer Staples | 3.1% |
|---|
Energy | 2.5% |
|---|
Financials | 9.3% |
|---|
Health Care | 9.0% |
|---|
Industrials | 8.9% |
|---|
Real Estate | 0.9% |
|---|
Technology | 50.1% |
|---|
Telecommunications | 2.3% |
|---|
Utilities | 0.9% |
|---|
Other Assets and Liabilities—Net | 0.2% |
|---|
This table reflects the Fund's investments, including short-term investments, derivatives and other assets and liabilities. |
|
| Material Fund Change [Text Block] |
|
How has the Fund changed?During the reporting period, the expense ratio for the Institutional Share class of the Fund was reduced. The Fund's name changed from Vanguard Mega Cap Index Fund to Vanguard Morningstar Mega Cap Index Fund. This is a summary of certain changes to the Fund since August 31, 2025. For more complete information, you may review the Fund’s next prospectus, which we expect to be available by December 31, 2026, at https://personal1.vanguard.com/ngf-next-gen-form-webapp/fund-literature or upon request at 800-662-7447. |
|
| Material Fund Change Name [Text Block] |
|
The Fund's name changed from Vanguard Mega Cap Index Fund to Vanguard Morningstar Mega Cap Index Fund.
|
|
| Material Fund Change Expenses [Text Block] |
|
During the reporting period, the expense ratio for the Institutional Share class of the Fund was reduced.
|
|
| Summary of Change Legend [Text Block] |
|
This is a summary of certain changes to the Fund since August 31, 2025. For more complete information, you may review the Fund’s next prospectus, which we expect to be available by December 31, 2026, at https://personal1.vanguard.com/ngf-next-gen-form-webapp/fund-literature or upon request at 800-662-7447.
|
|
| Updated Prospectus Phone Number |
|
800-662-7447
|
|
| Updated Prospectus Web Address |
|
https://personal1.vanguard.com/ngf-next-gen-form-webapp/fund-literature
|
|
| C000055213 |
|
|
|
| Shareholder Report [Line Items] |
|
|
|
| Fund Name |
|
Morningstar Mega Cap Value Index Fund
|
|
| Class Name |
|
ETF Shares
|
|
| Trading Symbol |
|
MGV
|
|
| Security Exchange Name |
|
NYSEArca
|
|
| Annual or Semi-Annual Statement [Text Block] |
|
This annual shareholder report contains important information about Vanguard Morningstar Mega Cap Value Index Fund (the "Fund") (formerly known as Vanguard Mega Cap Value Index Fund) for the period of September 1, 2025, to August 31, 2026.
|
|
| Additional Information [Text Block] |
|
You can find additional information about the Fund at https://personal1.vanguard.com/ngf-next-gen-form-webapp/fund-literature. You can also request this information by contacting us at 800-662-7447.
|
|
| Material Fund Change Notice [Text Block] |
|
The report describes changes to the Fund that occurred during the reporting period.
|
|
| Additional Information Phone Number |
|
<span style="white-space: nowrap; box-sizing: border-box; color: rgb(0, 0, 0); display: inline; flex-wrap: nowrap; font-size: 10.6667px; font-weight: 400; grid-area: auto; line-height: 16px; margin: 0px; overflow: visible; text-align: left; text-align-last: auto;"> 800-662-7447</span>
|
|
| Additional Information Website |
|
<span style="white-space: nowrap; box-sizing: border-box; color: rgb(0, 0, 0); display: inline; flex-wrap: nowrap; font-size: 10.6667px; font-weight: 400; grid-area: auto; line-height: 16px; margin: 0px; overflow: visible; text-align: left; text-align-last: auto;"> <span style="box-sizing: border-box; color: rgb(0, 0, 0); display: inline; flex-wrap: nowrap; font-size: 10.6667px; font-weight: 400; grid-area: auto; line-height: 16px; margin: 0px; overflow: visible; text-align: left; text-align-last: auto; white-space-collapse: collapse;"><span style="text-decoration: underline; box-sizing: border-box; color: rgb(0, 0, 0); display: inline; flex-wrap: nowrap; font-size: 10.6667px; font-weight: 400; grid-area: auto; line-height: 16px; margin: 0px; overflow: visible; text-align: left; text-align-last: auto; white-space-collapse: collapse;">https://personal1.vanguard.com/ngf-next-gen-form-webapp/fund-literature</span></span></span>
|
|
| Expenses [Text Block] |
|
What were the Fund costs for the last year?(based on a hypothetical $10,000 investment) Table SummaryShare Class Name | Costs of a $10,000 investment | Costs paid as a percentage of a $10,000 investment |
|---|
ETF Shares | $7 | 0.06% |
|---|
|
|
| Expenses Paid, Amount |
|
$ 7
|
|
| Expense Ratio, Percent |
|
0.06%
|
|
| Factors Affecting Performance [Text Block] |
|
How did the Fund perform during the reporting period? For the 12 months ended August 31, 2026, the Fund performed roughly in line with its benchmark. Global equities posted strong returns, while global bonds struggled. Resilient growth and corporate earnings supported stocks, though shifting U.S. trade policy, persistent inflation, and Middle East tensions that disrupted energy supplies and raised oil prices fueled volatility. Some central banks, including those in the United States and the United Kingdom, lowered rates. However, developed-market government bond yields generally rose amid concerns about borrowing, inflation, and monetary policy. The Fund’s benchmark outperformed its growth counterpart. Of the benchmark’s 11 industry sectors, 10 recorded positive returns for the 12 months. Technology, health care, and financials contributed the most to the benchmark’s return. Consumer discretionary was the only sector that posted a negative return.
|
|
| Performance Past Does Not Indicate Future [Text] |
|
Keep in mind that the Fund's past performance does not indicate how the Fund will perform in the future.
|
|
| Line Graph [Table Text Block] |
|
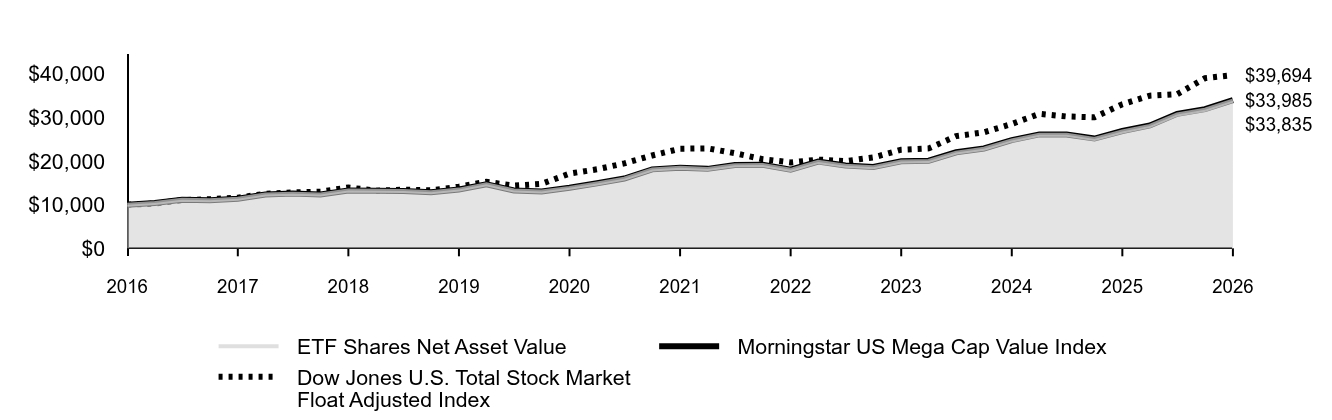 Table Summary | ETF Shares Net Asset Value | Morningstar US Mega Cap Value Index | Dow Jones U.S. Total Stock Market Float Adjusted Index |
|---|
2016 | $10,000 | $10,000 | $10,000 |
|---|
2016 | $10,393 | $10,395 | $10,233 |
|---|
2017 | $11,118 | $11,122 | $11,028 |
|---|
2017 | $11,001 | $11,006 | $11,265 |
|---|
2017 | $11,340 | $11,346 | $11,605 |
|---|
2017 | $12,324 | $12,333 | $12,514 |
|---|
2018 | $12,531 | $12,539 | $12,818 |
|---|
2018 | $12,325 | $12,334 | $12,965 |
|---|
2018 | $13,235 | $13,247 | $13,956 |
|---|
2018 | $13,183 | $13,195 | $13,202 |
|---|
2019 | $13,125 | $13,137 | $13,458 |
|---|
2019 | $12,824 | $12,835 | $13,279 |
|---|
2019 | $13,458 | $13,469 | $14,127 |
|---|
2019 | $14,678 | $14,693 | $15,231 |
|---|
2020 | $13,259 | $13,272 | $14,369 |
|---|
2020 | $13,025 | $13,044 | $14,780 |
|---|
2020 | $13,854 | $13,876 | $17,123 |
|---|
2020 | $14,873 | $14,901 | $18,115 |
|---|
2021 | $15,969 | $16,001 | $19,470 |
|---|
2021 | $18,058 | $18,097 | $21,279 |
|---|
2021 | $18,449 | $18,493 | $22,828 |
|---|
2021 | $18,168 | $18,214 | $22,913 |
|---|
2022 | $19,021 | $19,072 | $21,794 |
|---|
2022 | $19,087 | $19,144 | $20,429 |
|---|
2022 | $17,986 | $18,041 | $19,693 |
|---|
2022 | $19,805 | $19,874 | $20,334 |
|---|
2023 | $18,928 | $18,996 | $19,999 |
|---|
2023 | $18,591 | $18,659 | $20,821 |
|---|
2023 | $19,880 | $19,952 | $22,598 |
|---|
2023 | $20,024 | $20,080 | $22,901 |
|---|
2024 | $21,941 | $22,006 | $25,719 |
|---|
2024 | $22,816 | $22,889 | $26,584 |
|---|
2024 | $24,729 | $24,811 | $28,511 |
|---|
2024 | $26,017 | $26,108 | $30,815 |
|---|
2025 | $26,003 | $26,097 | $30,221 |
|---|
2025 | $25,062 | $25,156 | $30,045 |
|---|
2025 | $26,783 | $26,885 | $33,038 |
|---|
2025 | $28,050 | $28,163 | $34,985 |
|---|
2026 | $30,690 | $30,819 | $35,334 |
|---|
2026 | $31,766 | $31,901 | $39,010 |
|---|
2026 | $33,835 | $33,985 | $39,694 |
|---|
|
|
| Average Annual Return [Table Text Block] |
|
Table Summary | 1 Year | 5 Years | 10 Years |
|---|
ETF Shares Net Asset Value | 26.33% | 12.90% | 12.96% |
|---|
ETF Shares Market Price | 26.31% | 12.90% | 12.96% |
|---|
Morningstar US Mega Cap Value Index | 26.41% | 12.94% | 13.01% |
|---|
Dow Jones U.S. Total Stock Market Float Adjusted Index | 20.15% | 11.70% | 14.78% |
|---|
|
|
| No Deduction of Taxes [Text Block] |
|
The graph and returns shown do not reflect taxes that a shareholder would pay on fund distributions or on the sale of fund shares.
|
|
| Material Change Date |
|
|
Aug. 31, 2025
|
| Updated Performance Information Location [Text Block] |
|
Updated performance information is available on our website at vanguard.com/performance or by calling Vanguard toll-free at 800-662-7447.
|
|
| AssetsNet |
|
$ 13,908,000,000
|
|
| Holdings Count | Holding |
|
127
|
|
| Advisory Fees Paid, Amount |
|
$ 121,000
|
|
| InvestmentCompanyPortfolioTurnover |
|
12.00%
|
|
| Additional Fund Statistics [Text Block] |
|
Fund Statistics
(as of August 31, 2026)Table SummaryFund Net Assets (in millions) | $13,908 |
|---|
Number of Portfolio Holdings | 127 |
|---|
Portfolio Turnover Rate | 12% |
|---|
Total Investment Advisory Fees (in thousands) | $121 |
|---|
|
|
| Holdings [Text Block] |
|
Portfolio Composition % of Net Assets
(as of August 31, 2026)Table SummaryBasic Materials | 2.0% |
|---|
Consumer Discretionary | 8.9% |
|---|
Consumer Staples | 7.5% |
|---|
Energy | 6.3% |
|---|
Financials | 22.7% |
|---|
Health Care | 16.7% |
|---|
Industrials | 15.3% |
|---|
Real Estate | 1.0% |
|---|
Technology | 12.8% |
|---|
Telecommunications | 4.3% |
|---|
Utilities | 2.3% |
|---|
Other Assets and Liabilities—Net | 0.2% |
|---|
This table reflects the Fund's investments, including short-term investments, derivatives and other assets and liabilities. |
|
| Material Fund Change [Text Block] |
|
How has the Fund changed?During the reporting period, the expense ratio for the ETF Share class of the Fund was reduced. The Fund's name changed from Vanguard Mega Cap Value Index Fund to Vanguard Morningstar Mega Cap Value Index Fund. This is a summary of certain changes to the Fund since August 31, 2025. For more complete information, you may review the Fund’s next prospectus, which we expect to be available by December 31, 2026, at https://personal1.vanguard.com/ngf-next-gen-form-webapp/fund-literature or upon request at 800-662-7447. |
|
| Material Fund Change Name [Text Block] |
|
The Fund's name changed from Vanguard Mega Cap Value Index Fund to Vanguard Morningstar Mega Cap Value Index Fund.
|
|
| Material Fund Change Expenses [Text Block] |
|
During the reporting period, the expense ratio for the ETF Share class of the Fund was reduced.
|
|
| Summary of Change Legend [Text Block] |
|
This is a summary of certain changes to the Fund since August 31, 2025. For more complete information, you may review the Fund’s next prospectus, which we expect to be available by December 31, 2026, at https://personal1.vanguard.com/ngf-next-gen-form-webapp/fund-literature or upon request at 800-662-7447.
|
|
| Updated Prospectus Phone Number |
|
800-662-7447
|
|
| Updated Prospectus Web Address |
|
https://personal1.vanguard.com/ngf-next-gen-form-webapp/fund-literature
|
|
| C000055212 |
|
|
|
| Shareholder Report [Line Items] |
|
|
|
| Fund Name |
|
Morningstar Mega Cap Value Index Fund
|
|
| Class Name |
|
Institutional Shares
|
|
| Trading Symbol |
|
VMVLX
|
|
| Annual or Semi-Annual Statement [Text Block] |
|
This annual shareholder report contains important information about Vanguard Morningstar Mega Cap Value Index Fund (the "Fund") (formerly known as Vanguard Mega Cap Value Index Fund) for the period of September 1, 2025, to August 31, 2026.
|
|
| Additional Information [Text Block] |
|
You can find additional information about the Fund at https://personal1.vanguard.com/ngf-next-gen-form-webapp/fund-literature. You can also request this information by contacting us at 800-662-7447.
|
|
| Material Fund Change Notice [Text Block] |
|
The report describes changes to the Fund that occurred during the reporting period.
|
|
| Additional Information Phone Number |
|
<span style="white-space: nowrap; box-sizing: border-box; color: rgb(0, 0, 0); display: inline; flex-wrap: nowrap; font-size: 10.6667px; font-weight: 400; grid-area: auto; line-height: 16px; margin: 0px; overflow: visible; text-align: left; text-align-last: auto;"> 800-662-7447</span>
|
|
| Additional Information Website |
|
<span style="white-space: nowrap; box-sizing: border-box; color: rgb(0, 0, 0); display: inline; flex-wrap: nowrap; font-size: 10.6667px; font-weight: 400; grid-area: auto; line-height: 16px; margin: 0px; overflow: visible; text-align: left; text-align-last: auto;"> <span style="box-sizing: border-box; color: rgb(0, 0, 0); display: inline; flex-wrap: nowrap; font-size: 10.6667px; font-weight: 400; grid-area: auto; line-height: 16px; margin: 0px; overflow: visible; text-align: left; text-align-last: auto; white-space-collapse: collapse;"><span style="text-decoration: underline; box-sizing: border-box; color: rgb(0, 0, 0); display: inline; flex-wrap: nowrap; font-size: 10.6667px; font-weight: 400; grid-area: auto; line-height: 16px; margin: 0px; overflow: visible; text-align: left; text-align-last: auto; white-space-collapse: collapse;">https://personal1.vanguard.com/ngf-next-gen-form-webapp/fund-literature</span></span></span>
|
|
| Expenses [Text Block] |
|
What were the Fund costs for the last year?(based on a hypothetical $10,000 investment) Table SummaryShare Class Name | Costs of a $10,000 investment | Costs paid as a percentage of a $10,000 investment |
|---|
Institutional Shares | $6 | 0.05% |
|---|
|
|
| Expenses Paid, Amount |
|
$ 6
|
|
| Expense Ratio, Percent |
|
0.05%
|
|
| Factors Affecting Performance [Text Block] |
|
How did the Fund perform during the reporting period? For the 12 months ended August 31, 2026, the Fund performed roughly in line with its benchmark. Global equities posted strong returns, while global bonds struggled. Resilient growth and corporate earnings supported stocks, though shifting U.S. trade policy, persistent inflation, and Middle East tensions that disrupted energy supplies and raised oil prices fueled volatility. Some central banks, including those in the United States and the United Kingdom, lowered rates. However, developed-market government bond yields generally rose amid concerns about borrowing, inflation, and monetary policy. The Fund’s benchmark outperformed its growth counterpart. Of the benchmark’s 11 industry sectors, 10 recorded positive returns for the 12 months. Technology, health care, and financials contributed the most to the benchmark’s return. Consumer discretionary was the only sector that posted a negative return.
|
|
| Performance Past Does Not Indicate Future [Text] |
|
Keep in mind that the Fund's past performance does not indicate how the Fund will perform in the future.
|
|
| Line Graph [Table Text Block] |
|
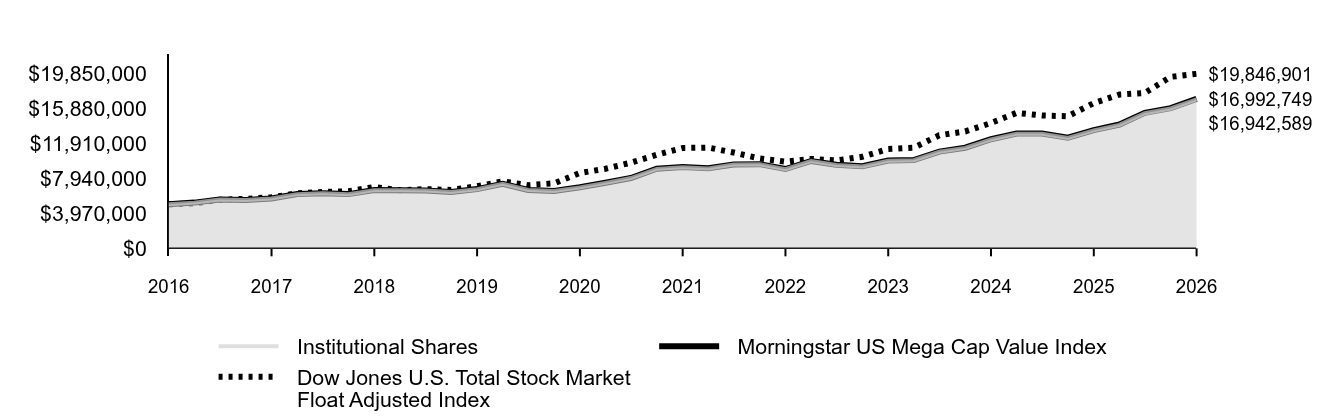 Table Summary | Institutional Shares | Morningstar US Mega Cap Value Index | Dow Jones U.S. Total Stock Market Float Adjusted Index |
|---|
2016 | $5,000,000 | $5,000,000 | $5,000,000 |
|---|
2016 | $5,196,407 | $5,197,405 | $5,116,612 |
|---|
2017 | $5,559,727 | $5,560,910 | $5,513,817 |
|---|
2017 | $5,501,072 | $5,502,829 | $5,632,496 |
|---|
2017 | $5,670,599 | $5,673,084 | $5,802,313 |
|---|
2017 | $6,163,180 | $6,166,392 | $6,256,892 |
|---|
2018 | $6,266,204 | $6,269,670 | $6,408,855 |
|---|
2018 | $6,162,964 | $6,166,916 | $6,482,327 |
|---|
2018 | $6,617,971 | $6,623,280 | $6,977,843 |
|---|
2018 | $6,591,882 | $6,597,278 | $6,600,859 |
|---|
2019 | $6,562,535 | $6,568,706 | $6,728,954 |
|---|
2019 | $6,411,486 | $6,417,667 | $6,639,384 |
|---|
2019 | $6,728,904 | $6,734,554 | $7,063,661 |
|---|
2019 | $7,338,456 | $7,346,291 | $7,615,631 |
|---|
2020 | $6,629,182 | $6,636,112 | $7,184,422 |
|---|
2020 | $6,515,041 | $6,521,769 | $7,390,068 |
|---|
2020 | $6,930,670 | $6,937,993 | $8,561,505 |
|---|
2020 | $7,441,876 | $7,450,335 | $9,057,250 |
|---|
2021 | $7,989,822 | $8,000,255 | $9,735,081 |
|---|
2021 | $9,036,075 | $9,048,589 | $10,639,299 |
|---|
2021 | $9,232,975 | $9,246,423 | $11,414,050 |
|---|
2021 | $9,092,636 | $9,107,038 | $11,456,415 |
|---|
2022 | $9,520,162 | $9,535,975 | $10,896,787 |
|---|
2022 | $9,554,030 | $9,572,156 | $10,214,460 |
|---|
2022 | $9,002,889 | $9,020,713 | $9,846,677 |
|---|
2022 | $9,915,375 | $9,937,219 | $10,167,204 |
|---|
2023 | $9,475,707 | $9,497,809 | $9,999,579 |
|---|
2023 | $9,307,445 | $9,329,528 | $10,410,644 |
|---|
2023 | $9,952,379 | $9,976,185 | $11,298,765 |
|---|
2023 | $10,023,750 | $10,039,930 | $11,450,657 |
|---|
2024 | $10,984,213 | $11,003,000 | $12,859,424 |
|---|
2024 | $11,423,556 | $11,444,521 | $13,292,095 |
|---|
2024 | $12,380,897 | $12,405,653 | $14,255,636 |
|---|
2024 | $13,026,736 | $13,054,147 | $15,407,713 |
|---|
2025 | $13,019,703 | $13,048,273 | $15,110,339 |
|---|
2025 | $12,549,230 | $12,577,811 | $15,022,328 |
|---|
2025 | $13,410,377 | $13,442,619 | $16,518,955 |
|---|
2025 | $14,046,010 | $14,081,362 | $17,492,634 |
|---|
2026 | $15,367,957 | $15,409,565 | $17,666,856 |
|---|
2026 | $15,906,657 | $15,950,544 | $19,505,184 |
|---|
2026 | $16,942,589 | $16,992,749 | $19,846,901 |
|---|
|
|
| Average Annual Return [Table Text Block] |
|
Table Summary | 1 Year | 5 Years | 10 Years |
|---|
Institutional Shares | 26.34% | 12.91% | 12.98% |
|---|
Morningstar US Mega Cap Value Index | 26.41% | 12.94% | 13.01% |
|---|
Dow Jones U.S. Total Stock Market Float Adjusted Index | 20.15% | 11.70% | 14.78% |
|---|
|
|
| No Deduction of Taxes [Text Block] |
|
The graph and returns shown do not reflect taxes that a shareholder would pay on fund distributions or on the sale of fund shares.
|
|
| Material Change Date |
|
|
Aug. 31, 2025
|
| Updated Performance Information Location [Text Block] |
|
Updated performance information is available on our website at vanguard.com/performance or by calling Vanguard toll-free at 800-662-7447.
|
|
| AssetsNet |
|
$ 13,908,000,000
|
|
| Holdings Count | Holding |
|
127
|
|
| Advisory Fees Paid, Amount |
|
$ 121,000
|
|
| InvestmentCompanyPortfolioTurnover |
|
12.00%
|
|
| Additional Fund Statistics [Text Block] |
|
Fund Statistics
(as of August 31, 2026)Table SummaryFund Net Assets (in millions) | $13,908 |
|---|
Number of Portfolio Holdings | 127 |
|---|
Portfolio Turnover Rate | 12% |
|---|
Total Investment Advisory Fees (in thousands) | $121 |
|---|
|
|
| Holdings [Text Block] |
|
Portfolio Composition % of Net Assets
(as of August 31, 2026)Table SummaryBasic Materials | 2.0% |
|---|
Consumer Discretionary | 8.9% |
|---|
Consumer Staples | 7.5% |
|---|
Energy | 6.3% |
|---|
Financials | 22.7% |
|---|
Health Care | 16.7% |
|---|
Industrials | 15.3% |
|---|
Real Estate | 1.0% |
|---|
Technology | 12.8% |
|---|
Telecommunications | 4.3% |
|---|
Utilities | 2.3% |
|---|
Other Assets and Liabilities—Net | 0.2% |
|---|
This table reflects the Fund's investments, including short-term investments, derivatives and other assets and liabilities. |
|
| Material Fund Change [Text Block] |
|
How has the Fund changed?During the reporting period, the expense ratio for the Institutional Share class of the Fund was reduced. The Fund's name changed from Vanguard Mega Cap Value Index Fund to Vanguard Morningstar Mega Cap Value Index Fund. This is a summary of certain changes to the Fund since August 31, 2025. For more complete information, you may review the Fund’s next prospectus, which we expect to be available by December 31, 2026, at https://personal1.vanguard.com/ngf-next-gen-form-webapp/fund-literature or upon request at 800-662-7447. |
|
| Material Fund Change Name [Text Block] |
|
The Fund's name changed from Vanguard Mega Cap Value Index Fund to Vanguard Morningstar Mega Cap Value Index Fund.
|
|
| Material Fund Change Expenses [Text Block] |
|
During the reporting period, the expense ratio for the Institutional Share class of the Fund was reduced.
|
|
| Summary of Change Legend [Text Block] |
|
This is a summary of certain changes to the Fund since August 31, 2025. For more complete information, you may review the Fund’s next prospectus, which we expect to be available by December 31, 2026, at https://personal1.vanguard.com/ngf-next-gen-form-webapp/fund-literature or upon request at 800-662-7447.
|
|
| Updated Prospectus Phone Number |
|
800-662-7447
|
|
| Updated Prospectus Web Address |
|
https://personal1.vanguard.com/ngf-next-gen-form-webapp/fund-literature
|
|
| C000271969 |
|
|
|
| Shareholder Report [Line Items] |
|
|
|
| Fund Name |
|
Developed Markets ex-US Growth Index ETF
|
|
| Class Name |
|
ETF Shares
|
|
| Trading Symbol |
|
VDG
|
|
| Security Exchange Name |
|
CboeBZX
|
|
| Annual or Semi-Annual Statement [Text Block] |
|
This annual shareholder report contains important information about Vanguard Developed Markets ex-US Growth Index ETF (the "Fund") for the period of April 14, 2026, to August 31, 2026.
|
|
| Additional Information [Text Block] |
|
You can find additional information about the Fund at https://personal1.vanguard.com/ngf-next-gen-form-webapp/fund-literature. You can also request this information by contacting us at 800-662-7447.
|
|
| Additional Information Phone Number |
|
<span style="white-space: nowrap; box-sizing: border-box; color: rgb(0, 0, 0); display: inline; flex-wrap: nowrap; font-size: 10.6667px; font-weight: 400; grid-area: auto; line-height: 16px; margin: 0px; overflow: visible; text-align: left; text-align-last: auto;"> 800-662-7447</span>
|
|
| Additional Information Website |
|
<span style="white-space: nowrap; box-sizing: border-box; color: rgb(0, 0, 0); display: inline; flex-wrap: nowrap; font-size: 10.6667px; font-weight: 400; grid-area: auto; line-height: 16px; margin: 0px; overflow: visible; text-align: left; text-align-last: auto;"> <span style="box-sizing: border-box; color: rgb(0, 0, 0); display: inline; flex-wrap: nowrap; font-size: 10.6667px; font-weight: 400; grid-area: auto; line-height: 16px; margin: 0px; overflow: visible; text-align: left; text-align-last: auto; white-space-collapse: collapse;"><span style="text-decoration: underline; box-sizing: border-box; color: rgb(0, 0, 0); display: inline; flex-wrap: nowrap; font-size: 10.6667px; font-weight: 400; grid-area: auto; line-height: 16px; margin: 0px; overflow: visible; text-align: left; text-align-last: auto; white-space-collapse: collapse;">https://personal1.vanguard.com/ngf-next-gen-form-webapp/fund-literature</span></span></span>
|
|
| Expenses [Text Block] |
|
What were the Fund costs for the last period?(based on a hypothetical $10,000 investment) Table SummaryShare Class Name | Costs of a $10,000 investment | Costs paid as a percentage of a $10,000 investment |
|---|
ETF Shares | $3Footnote Reference1 | 0.08%Footnote Reference2 |
|---|
| Footnote | Description | Footnote1 | Costs would be higher for a full year. | Footnote2 | Annualized. |
|
|
| Expenses Paid, Amount |
[1] |
$ 3
|
|
| Expense Ratio, Percent |
[2] |
0.08%
|
|
| Expenses Short Period Footnote [Text Block] |
|
Costs would be higher for a full year.
|
|
| Factors Affecting Performance [Text Block] |
|
How did the Fund perform during the reporting period? From its inception on April 14, 2026, through August 31, 2026, the ETF underperformed its benchmark, largely because of fair-value pricing. Global equities posted strong returns for the 12 months ended August 31, 2026, while global bonds struggled. Resilient growth and corporate earnings supported stocks, though shifting U.S. trade policy and persistent inflation fueled volatility, as did Middle East tensions that disrupted energy supplies and raised oil prices. Some central banks, including those in the United States and the United Kingdom, lowered rates. However, developed-market government bond yields generally rose amid concerns about borrowing, inflation, and monetary policy. For the benchmark, seven of the 11 sectors posted positive returns. Strong performance from the two sectors with the heaviest weights—information technology and financials—contributed most to the benchmark's return. By region, the Pacific, the second largest region by weight, contributed the most to the benchmark’s performance. Europe, the largest region, also contributed positively.
|
|
| Performance Past Does Not Indicate Future [Text] |
|
Keep in mind that the Fund's past performance does not indicate how the Fund will perform in the future.
|
|
| Line Graph [Table Text Block] |
|
Table Summary | ETF Shares Net Asset Value | S&P Developed Ex-U.S. LargeMidCap Growth (USD) NTR | MSCI All Country World Index ex USA Net |
|---|
4/14/26 | $10,000 | $10,000 | $10,000 |
|---|
2026 | $10,923 | $10,982 | $10,755 |
|---|
|
|
| Average Annual Return [Table Text Block] |
|
Table Summary | Since Inception 4/14/26 |
|---|
ETF Shares Net Asset Value | 9.23% |
|---|
ETF Shares Market Price | 9.46% |
|---|
S&P Developed Ex-U.S. LargeMidCap Growth (USD) NTR | 9.82% |
|---|
MSCI All Country World Index ex USA Net | 7.55% |
|---|
|
|
| Performance Inception Date |
|
Apr. 14, 2026
|
|
| No Deduction of Taxes [Text Block] |
|
The graph and returns shown do not reflect taxes that a shareholder would pay on fund distributions or on the sale of fund shares.
|
|
| Updated Performance Information Location [Text Block] |
|
Updated performance information is available on our website at vanguard.com/performance or by calling Vanguard toll-free at 800-662-7447.
|
|
| AssetsNet |
|
$ 33,000,000
|
|
| Holdings Count | Holding |
|
629
|
|
| Advisory Fees Paid, Amount |
|
$ 0
|
|
| InvestmentCompanyPortfolioTurnover |
|
1.00%
|
|
| Additional Fund Statistics [Text Block] |
|
Fund Statistics
(as of August 31, 2026)Table SummaryFund Net Assets (in millions) | $33 |
|---|
Number of Portfolio Holdings | 629 |
|---|
Portfolio Turnover Rate | 1% |
|---|
Total Investment Advisory Fees (in thousands) | $0 |
|---|
|
|
| Holdings [Text Block] |
|
Portfolio Composition % of Net Assets
(as of August 31, 2026)Table SummaryAsia | 34.4% |
|---|
Europe | 48.8% |
|---|
North America | 11.8% |
|---|
Oceania | 4.8% |
|---|
Other Assets and Liabilities—Net | 0.2% |
|---|
This table reflects the Fund's investments, including short-term investments and other assets and liabilities. |
|
| Material Fund Change [Text Block] |
|
|
|
| Updated Prospectus Phone Number |
|
800-662-7447
|
|
| Updated Prospectus Web Address |
|
https://personal1.vanguard.com/ngf-next-gen-form-webapp/fund-literature
|
|
| C000271970 |
|
|
|
| Shareholder Report [Line Items] |
|
|
|
| Fund Name |
|
Developed Markets ex-US Value Index ETF
|
|
| Class Name |
|
ETF Shares
|
|
| Trading Symbol |
|
VDV
|
|
| Security Exchange Name |
|
CboeBZX
|
|
| Annual or Semi-Annual Statement [Text Block] |
|
This annual shareholder report contains important information about Vanguard Developed Markets ex-US Value Index ETF (the "Fund") for the period of April 14, 2026, to August 31, 2026.
|
|
| Additional Information [Text Block] |
|
You can find additional information about the Fund at https://personal1.vanguard.com/ngf-next-gen-form-webapp/fund-literature. You can also request this information by contacting us at 800-662-7447.
|
|
| Additional Information Phone Number |
|
<span style="white-space: nowrap; box-sizing: border-box; color: rgb(0, 0, 0); display: inline; flex-wrap: nowrap; font-size: 10.6667px; font-weight: 400; grid-area: auto; line-height: 16px; margin: 0px; overflow: visible; text-align: left; text-align-last: auto;"> 800-662-7447</span>
|
|
| Additional Information Website |
|
<span style="white-space: nowrap; box-sizing: border-box; color: rgb(0, 0, 0); display: inline; flex-wrap: nowrap; font-size: 10.6667px; font-weight: 400; grid-area: auto; line-height: 16px; margin: 0px; overflow: visible; text-align: left; text-align-last: auto;"> <span style="box-sizing: border-box; color: rgb(0, 0, 0); display: inline; flex-wrap: nowrap; font-size: 10.6667px; font-weight: 400; grid-area: auto; line-height: 16px; margin: 0px; overflow: visible; text-align: left; text-align-last: auto; white-space-collapse: collapse;"><span style="text-decoration: underline; box-sizing: border-box; color: rgb(0, 0, 0); display: inline; flex-wrap: nowrap; font-size: 10.6667px; font-weight: 400; grid-area: auto; line-height: 16px; margin: 0px; overflow: visible; text-align: left; text-align-last: auto; white-space-collapse: collapse;">https://personal1.vanguard.com/ngf-next-gen-form-webapp/fund-literature</span></span></span>
|
|
| Expenses [Text Block] |
|
What were the Fund costs for the last period?(based on a hypothetical $10,000 investment) Table SummaryShare Class Name | Costs of a $10,000 investment | Costs paid as a percentage of a $10,000 investment |
|---|
ETF Shares | $3Footnote Reference1 | 0.08%Footnote Reference2 |
|---|
| Footnote | Description | Footnote1 | Costs would be higher for a full year. | Footnote2 | Annualized. |
|
|
| Expenses Paid, Amount |
[3] |
$ 3
|
|
| Expense Ratio, Percent |
[4] |
0.08%
|
|
| Expenses Short Period Footnote [Text Block] |
|
Costs would be higher for a full year.
|
|
| Factors Affecting Performance [Text Block] |
|
How did the Fund perform during the reporting period? From its inception on April 14, 2026, through August 31, 2026, the ETF underperformed its benchmark, largely because of fair-value pricing. Global equities posted strong returns for the 12 months ended August 31, 2026, while global bonds struggled. Resilient growth and corporate earnings supported stocks, though shifting U.S. trade policy and persistent inflation fueled volatility, as did Middle East tensions that disrupted energy supplies and raised oil prices. Some central banks, including those in the United States and the United Kingdom, lowered rates. However, developed-market government bond yields generally rose amid concerns about borrowing, inflation, and monetary policy. For the benchmark, eight of 11 sectors posted positive returns. Financials, the largest sector by weight in the index, contributed the most to returns, followed by top-performing information technology. By region, the Pacific, the second largest region by weight, contributed the most to the benchmark’s performance. Europe, the largest region by weight in the index, also contributed positively.
|
|
| Performance Past Does Not Indicate Future [Text] |
|
Keep in mind that the Fund's past performance does not indicate how the Fund will perform in the future.
|
|
| Line Graph [Table Text Block] |
|
Table Summary | ETF Shares Net Asset Value | S&P Developed Ex-U.S. LargeMidCap Value (USD) NTR | MSCI All Country World Index ex USA Net |
|---|
4/14/26 | $10,000 | $10,000 | $10,000 |
|---|
2026 | $10,586 | $10,630 | $10,755 |
|---|
|
|
| Average Annual Return [Table Text Block] |
|
Table Summary | Since Inception 4/14/26 |
|---|
ETF Shares Net Asset Value | 5.86% |
|---|
ETF Shares Market Price | 6.39% |
|---|
S&P Developed Ex-U.S. LargeMidCap Value (USD) NTR | 6.30% |
|---|
MSCI All Country World Index ex USA Net | 7.55% |
|---|
|
|
| Performance Inception Date |
|
Apr. 14, 2026
|
|
| No Deduction of Taxes [Text Block] |
|
The graph and returns shown do not reflect taxes that a shareholder would pay on fund distributions or on the sale of fund shares.
|
|
| Updated Performance Information Location [Text Block] |
|
Updated performance information is available on our website at vanguard.com/performance or by calling Vanguard toll-free at 800-662-7447.
|
|
| AssetsNet |
|
$ 32,000,000
|
|
| Holdings Count | Holding |
|
794
|
|
| Advisory Fees Paid, Amount |
|
$ 0
|
|
| InvestmentCompanyPortfolioTurnover |
|
1.00%
|
|
| Additional Fund Statistics [Text Block] |
|
Fund Statistics
(as of August 31, 2026)Table SummaryFund Net Assets (in millions) | $32 |
|---|
Number of Portfolio Holdings | 794 |
|---|
Portfolio Turnover Rate | 1% |
|---|
Total Investment Advisory Fees (in thousands) | $0 |
|---|
|
|
| Holdings [Text Block] |
|
Portfolio Composition % of Net Assets
(as of August 31, 2026)Table SummaryAsia | 35.0% |
|---|
Europe | 46.6% |
|---|
North America | 11.3% |
|---|
Oceania | 6.8% |
|---|
Other Assets and Liabilities—Net | 0.3% |
|---|
This table reflects the Fund's investments, including short-term investments, derivatives and other assets and liabilities. |
|
| Material Fund Change [Text Block] |
|
|
|
| Updated Prospectus Phone Number |
|
800-662-7447
|
|
| Updated Prospectus Web Address |
|
https://personal1.vanguard.com/ngf-next-gen-form-webapp/fund-literature
|
|
|
|