Shareholder Report
Aug. 31, 2026
USD ($)
Holding
What were the Fund costs for the last year?
(based on a hypothetical $10,000 investment)
| Share Class Name | Costs of a $10,000 investment | Costs paid as a percentage of a $10,000 investment |
| Institutional Shares | $3 | 0.03% |
How did the Fund perform during the reporting period?
-
For the 12 months ended August 31, 2026, the Fund performed roughly in line with its benchmark.
-
Global equities posted strong returns, while global bonds struggled. Resilient growth and corporate earnings supported stocks, though shifting U.S. trade policy, persistent inflation, and Middle East tensions that disrupted energy supplies and raised oil prices fueled volatility.
-
Some central banks, including those in the United States and the United Kingdom, lowered rates. However, developed-market government bond yields generally rose amid concerns about borrowing, inflation, and monetary policy.
-
In general, mortgage-backed securities outperformed corporate bonds and Treasuries for the period, and short-term Treasuries outperformed their intermediate- and long-term counterparts.
How did the Fund perform over the past 10 years?
Keep in mind that the Fund's past performance does not indicate how the Fund will perform in the future. Updated performance information is available on our website at vanguard.com/performance or by calling Vanguard toll-free at 800-662-7447. The graph and returns shown do not reflect taxes that a shareholder would pay on fund distributions or on the sale of fund shares.
Cumulative Performance: August 31, 2016, Through August 31, 2026
Initial Investment of $5,000,000
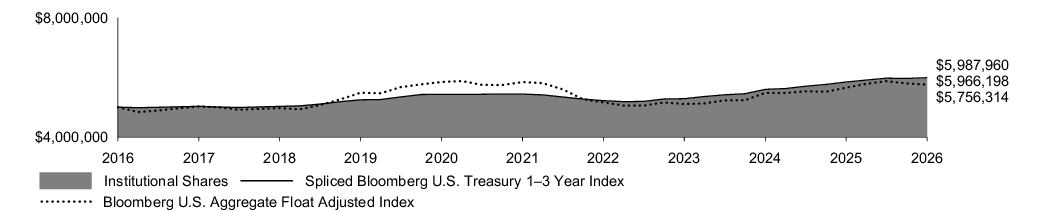
| Average Annual Total Returns | |||
| 1 Year | 5 Years | 10 Years | |
| Institutional Shares | 2.49% | 1.92% | 1.78% |
| Spliced Bloomberg U.S. Treasury 1–3 Year Index | 2.49% | 1.95% | 1.82% |
| Bloomberg U.S. Aggregate Float Adjusted Index | 1.84% | -0.29% | 1.42% |
| Fund Statistics (as of August 31, 2026) |
|
| Fund Net Assets (in millions) |
$39,322 |
| Number of Portfolio Holdings | 93 |
| Portfolio Turnover Rate | 88% |
| Total Investment Advisory Fees (in thousands) |
$1,138 |
| Distribution by Stated Maturity % of Net Asset (as of August 31, 2026) |
|
| Under 1 Year | 0.8% |
| 1 - 2 Years | 55.5% |
| 2 - 3 Years | 42.7% |
| Other Assets and Liabilities—Net | 1.0% |
| This table reflects the Fund’s investments, including short-term investments and other assets and liabilities. | |
How has the Fund changed?
During the reporting period, the expense ratio for the Institutional Share class of the Fund was reduced.
This is a summary of certain changes to the Fund since August 31, 2025. For more complete information, you may review the Fund’s next prospectus, which we expect to be available by December 31, 2026, at https://personal1.vanguard.com/ngf-next-gen-form-webapp/fund-literature or upon request at 800-662-7447.
During the reporting period, the expense ratio for the Institutional Share class of the Fund was reduced.
This is a summary of certain changes to the Fund since August 31, 2025. For more complete information, you may review the Fund’s next prospectus, which we expect to be available by December 31, 2026, at https://personal1.vanguard.com/ngf-next-gen-form-webapp/fund-literature or upon request at 800-662-7447.
What were the Fund costs for the last year?
(based on a hypothetical $10,000 investment)
| Share Class Name | Costs of a $10,000 investment | Costs paid as a percentage of a $10,000 investment |
| Admiral Shares | $6 | 0.06% |
How did the Fund perform during the reporting period?
-
For the 12 months ended August 31, 2026, the Fund performed roughly in line with its benchmark.
-
Global equities posted strong returns, while global bonds struggled. Resilient growth and corporate earnings supported stocks, though shifting U.S. trade policy, persistent inflation, and Middle East tensions that disrupted energy supplies and raised oil prices fueled volatility.
-
Some central banks, including those in the United States and the United Kingdom, lowered rates. However, developed-market government bond yields generally rose amid concerns about borrowing, inflation, and monetary policy.
-
In general, mortgage-backed securities outperformed corporate bonds and Treasuries for the period, and short-term Treasuries outperformed their intermediate- and long-term counterparts.
How did the Fund perform over the past 10 years?
Keep in mind that the Fund's past performance does not indicate how the Fund will perform in the future. Updated performance information is available on our website at vanguard.com/performance or by calling Vanguard toll-free at 800-662-7447. The graph and returns shown do not reflect taxes that a shareholder would pay on fund distributions or on the sale of fund shares.
Cumulative Performance: August 31, 2016, Through August 31, 2026
Initial Investment of $10,000

| Average Annual Total Returns | |||
| 1 Year | 5 Years | 10 Years | |
| Admiral Shares | 2.42% | 1.89% | 1.76% |
| Spliced Bloomberg U.S. Treasury 1–3 Year Index | 2.49% | 1.95% | 1.82% |
| Bloomberg U.S. Aggregate Float Adjusted Index | 1.84% | -0.29% | 1.42% |
| Fund Statistics (as of August 31, 2026) |
|
| Fund Net Assets (in millions) |
$39,322 |
| Number of Portfolio Holdings | 93 |
| Portfolio Turnover Rate | 88% |
| Total Investment Advisory Fees (in thousands) |
$1,138 |
| Distribution by Stated Maturity % of Net Asset (as of August 31, 2026) |
|
| Under 1 Year | 0.8% |
| 1 - 2 Years | 55.5% |
| 2 - 3 Years | 42.7% |
| Other Assets and Liabilities—Net | 1.0% |
| This table reflects the Fund’s investments, including short-term investments and other assets and liabilities. | |
What were the Fund costs for the last year?
(based on a hypothetical $10,000 investment)
| Share Class Name | Costs of a $10,000 investment | Costs paid as a percentage of a $10,000 investment |
| ETF Shares | $3 | 0.03% |
How did the Fund perform during the reporting period?
-
For the 12 months ended August 31, 2026, the Fund performed roughly in line with its benchmark.
-
Global equities posted strong returns, while global bonds struggled. Resilient growth and corporate earnings supported stocks, though shifting U.S. trade policy, persistent inflation, and Middle East tensions that disrupted energy supplies and raised oil prices fueled volatility.
-
Some central banks, including those in the United States and the United Kingdom, lowered rates. However, developed-market government bond yields generally rose amid concerns about borrowing, inflation, and monetary policy.
-
In general, mortgage-backed securities outperformed corporate bonds and Treasuries for the period, and short-term Treasuries outperformed their intermediate- and long-term counterparts.
How did the Fund perform over the past 10 years?
Keep in mind that the Fund's past performance does not indicate how the Fund will perform in the future. Updated performance information is available on our website at vanguard.com/performance or by calling Vanguard toll-free at 800-662-7447. The graph and returns shown do not reflect taxes that a shareholder would pay on fund distributions or on the sale of fund shares.
Cumulative Performance: August 31, 2016, Through August 31, 2026
Initial Investment of $10,000
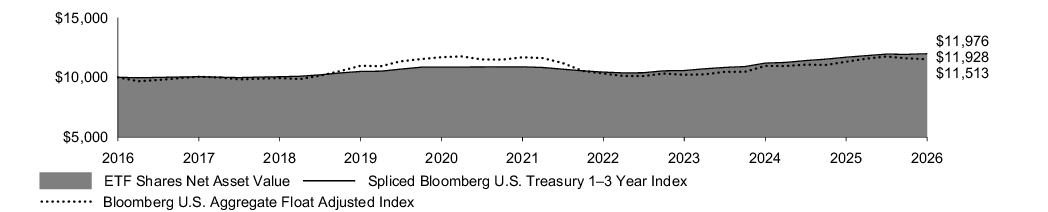
| Average Annual Total Returns | |||
| 1 Year | 5 Years | 10 Years | |
| ETF Shares Net Asset Value | 2.47% | 1.92% | 1.78% |
| ETF Shares Market Price | 2.43% | 1.92% | 1.78% |
| Spliced Bloomberg U.S. Treasury 1–3 Year Index | 2.49% | 1.95% | 1.82% |
| Bloomberg U.S. Aggregate Float Adjusted Index | 1.84% | -0.29% | 1.42% |
| Fund Statistics (as of August 31, 2026) |
|
| Fund Net Assets (in millions) |
$39,322 |
| Number of Portfolio Holdings | 93 |
| Portfolio Turnover Rate | 88% |
| Total Investment Advisory Fees (in thousands) |
$1,138 |
| Distribution by Stated Maturity % of Net Asset (as of August 31, 2026) |
|
| Under 1 Year | 0.8% |
| 1 - 2 Years | 55.5% |
| 2 - 3 Years | 42.7% |
| Other Assets and Liabilities—Net | 1.0% |
| This table reflects the Fund’s investments, including short-term investments and other assets and liabilities. | |
What were the Fund costs for the last year?
(based on a hypothetical $10,000 investment)
| Share Class Name | Costs of a $10,000 investment | Costs paid as a percentage of a $10,000 investment |
| ETF Shares | $3 | 0.03% |
How did the Fund perform during the reporting period?
-
For the 12 months ended August 31, 2026, the Fund performed roughly in line with its benchmark.
-
Global equities posted strong returns, while global bonds struggled. Resilient growth and corporate earnings supported stocks, though shifting U.S. trade policy, persistent inflation, and Middle East tensions that disrupted energy supplies and raised oil prices fueled volatility.
-
Some central banks, including those in the United States and the United Kingdom, lowered rates. However, developed-market government bond yields generally rose amid concerns about borrowing, inflation, and monetary policy.
-
In general, mortgage-backed securities outperformed corporate bonds and Treasuries for the period, and short-term Treasuries outperformed their intermediate- and long-term counterparts.
-
Within the Fund's benchmark, bonds with maturities of less than 5 years returned more than those with maturities of 5–10 years.
How did the Fund perform over the past 10 years?
Keep in mind that the Fund's past performance does not indicate how the Fund will perform in the future. Updated performance information is available on our website at vanguard.com/performance or by calling Vanguard toll-free at 800-662-7447. The graph and returns shown do not reflect taxes that a shareholder would pay on fund distributions or on the sale of fund shares.
Cumulative Performance: August 31, 2016, Through August 31, 2026
Initial Investment of $10,000
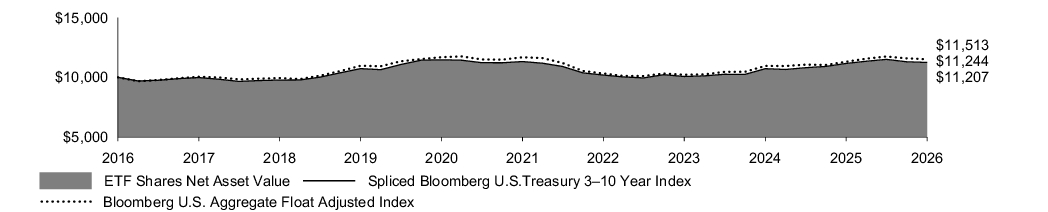
| Average Annual Total Returns | |||
| 1 Year | 5 Years | 10 Years | |
| ETF Shares Net Asset Value | 0.71% | -0.16% | 1.15% |
| ETF Shares Market Price | 0.65% | -0.17% | 1.14% |
| Spliced Bloomberg U.S.Treasury 3–10 Year Index | 0.72% | -0.14% | 1.18% |
| Bloomberg U.S. Aggregate Float Adjusted Index | 1.84% | -0.29% | 1.42% |
| Fund Statistics (as of August 31, 2026) |
|
| Fund Net Assets (in millions) |
$48,254 |
| Number of Portfolio Holdings | 103 |
| Portfolio Turnover Rate | 53% |
| Total Investment Advisory Fees (in thousands) |
$1,671 |
| Distribution by Stated Maturity % of Net Asset (as of August 31, 2026) |
|
| 2 - 4 Years | 23.5% |
| 4 - 6 Years | 40.5% |
| 6 - 8 Years | 21.4% |
| 8 - 10 Years | 13.6% |
| Other Assets and Liabilities—Net | 1.0% |
| This table reflects the Fund’s investments, including short-term investments and other assets and liabilities. | |
What were the Fund costs for the last year?
(based on a hypothetical $10,000 investment)
| Share Class Name | Costs of a $10,000 investment | Costs paid as a percentage of a $10,000 investment |
| Admiral Shares | $6 | 0.06% |
How did the Fund perform during the reporting period?
-
For the 12 months ended August 31, 2026, the Fund performed roughly in line with its benchmark.
-
Global equities posted strong returns, while global bonds struggled. Resilient growth and corporate earnings supported stocks, though shifting U.S. trade policy, persistent inflation, and Middle East tensions that disrupted energy supplies and raised oil prices fueled volatility.
-
Some central banks, including those in the United States and the United Kingdom, lowered rates. However, developed-market government bond yields generally rose amid concerns about borrowing, inflation, and monetary policy.
-
In general, mortgage-backed securities outperformed corporate bonds and Treasuries for the period, and short-term Treasuries outperformed their intermediate- and long-term counterparts.
-
Within the Fund's benchmark, bonds with maturities of less than 5 years returned more than those with maturities of 5–10 years.
How did the Fund perform over the past 10 years?
Keep in mind that the Fund's past performance does not indicate how the Fund will perform in the future. Updated performance information is available on our website at vanguard.com/performance or by calling Vanguard toll-free at 800-662-7447. The graph and returns shown do not reflect taxes that a shareholder would pay on fund distributions or on the sale of fund shares.
Cumulative Performance: August 31, 2016, Through August 31, 2026
Initial Investment of $10,000
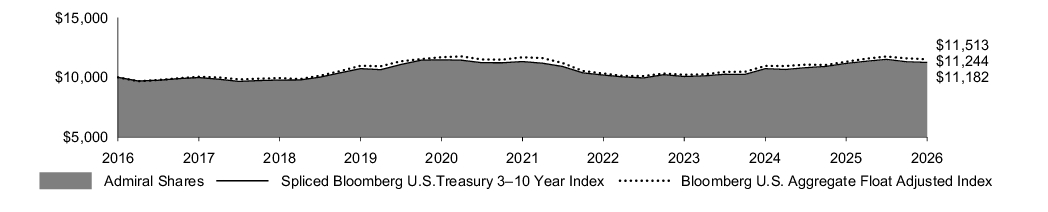
| Average Annual Total Returns | |||
| 1 Year | 5 Years | 10 Years | |
| Admiral Shares | 0.66% | -0.19% | 1.12% |
| Spliced Bloomberg U.S.Treasury 3–10 Year Index | 0.72% | -0.14% | 1.18% |
| Bloomberg U.S. Aggregate Float Adjusted Index | 1.84% | -0.29% | 1.42% |
| Fund Statistics (as of August 31, 2026) |
|
| Fund Net Assets (in millions) |
$48,254 |
| Number of Portfolio Holdings | 103 |
| Portfolio Turnover Rate | 53% |
| Total Investment Advisory Fees (in thousands) |
$1,671 |
| Distribution by Stated Maturity % of Net Asset (as of August 31, 2026) |
|
| 2 - 4 Years | 23.5% |
| 4 - 6 Years | 40.5% |
| 6 - 8 Years | 21.4% |
| 8 - 10 Years | 13.6% |
| Other Assets and Liabilities—Net | 1.0% |
| This table reflects the Fund’s investments, including short-term investments and other assets and liabilities. | |
What were the Fund costs for the last year?
(based on a hypothetical $10,000 investment)
| Share Class Name | Costs of a $10,000 investment | Costs paid as a percentage of a $10,000 investment |
| Institutional Shares | $3 | 0.03% |
How did the Fund perform during the reporting period?
-
For the 12 months ended August 31, 2026, the Fund performed roughly in line with its benchmark.
-
Global equities posted strong returns, while global bonds struggled. Resilient growth and corporate earnings supported stocks, though shifting U.S. trade policy, persistent inflation, and Middle East tensions that disrupted energy supplies and raised oil prices fueled volatility.
-
Some central banks, including those in the United States and the United Kingdom, lowered rates. However, developed-market government bond yields generally rose amid concerns about borrowing, inflation, and monetary policy.
-
In general, mortgage-backed securities outperformed corporate bonds and Treasuries for the period, and short-term Treasuries outperformed their intermediate- and long-term counterparts.
-
Within the Fund's benchmark, bonds with maturities of less than 5 years returned more than those with maturities of 5–10 years.
How did the Fund perform over the past 10 years?
Keep in mind that the Fund's past performance does not indicate how the Fund will perform in the future. Updated performance information is available on our website at vanguard.com/performance or by calling Vanguard toll-free at 800-662-7447. The graph and returns shown do not reflect taxes that a shareholder would pay on fund distributions or on the sale of fund shares.
Cumulative Performance: August 31, 2016, Through August 31, 2026
Initial Investment of $5,000,000
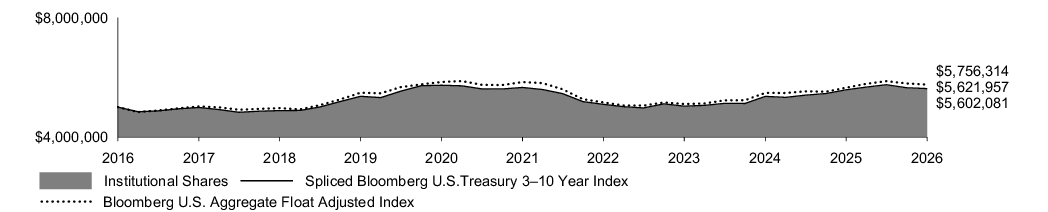
| Average Annual Total Returns | |||
| 1 Year | 5 Years | 10 Years | |
| Institutional Shares | 0.66% | -0.18% | 1.14% |
| Spliced Bloomberg U.S.Treasury 3–10 Year Index | 0.72% | -0.14% | 1.18% |
| Bloomberg U.S. Aggregate Float Adjusted Index | 1.84% | -0.29% | 1.42% |
| Fund Statistics (as of August 31, 2026) |
|
| Fund Net Assets (in millions) |
$48,254 |
| Number of Portfolio Holdings | 103 |
| Portfolio Turnover Rate | 53% |
| Total Investment Advisory Fees (in thousands) |
$1,671 |
| Distribution by Stated Maturity % of Net Asset (as of August 31, 2026) |
|
| 2 - 4 Years | 23.5% |
| 4 - 6 Years | 40.5% |
| 6 - 8 Years | 21.4% |
| 8 - 10 Years | 13.6% |
| Other Assets and Liabilities—Net | 1.0% |
| This table reflects the Fund’s investments, including short-term investments and other assets and liabilities. | |
How has the Fund changed?
During the reporting period, the expense ratio for the Institutional Share class of the Fund was reduced.
This is a summary of certain changes to the Fund since August 31, 2025. For more complete information, you may review the Fund’s next prospectus, which we expect to be available by December 31, 2026, at https://personal1.vanguard.com/ngf-next-gen-form-webapp/fund-literature or upon request at 800-662-7447.
During the reporting period, the expense ratio for the Institutional Share class of the Fund was reduced.
This is a summary of certain changes to the Fund since August 31, 2025. For more complete information, you may review the Fund’s next prospectus, which we expect to be available by December 31, 2026, at https://personal1.vanguard.com/ngf-next-gen-form-webapp/fund-literature or upon request at 800-662-7447.
What were the Fund costs for the last year?
(based on a hypothetical $10,000 investment)
| Share Class Name | Costs of a $10,000 investment | Costs paid as a percentage of a $10,000 investment |
| Institutional Shares | $3 | 0.03% |
How did the Fund perform during the reporting period?
-
For the 12 months ended August 31, 2026, the Fund performed roughly in line with its benchmark.
-
Global equities posted strong returns, while global bonds struggled. Resilient growth and corporate earnings supported stocks, though shifting U.S. trade policy, persistent inflation, and Middle East tensions that disrupted energy supplies and raised oil prices fueled volatility.
-
Some central banks, including those in the United States and United Kingdom, lowered rates. However, developed-market government bond yields generally rose amid concerns about borrowing, inflation, and monetary policy.
-
In general, mortgage-backed securities outperformed corporate bonds and Treasuries for the period, and short-term Treasuries outperformed their intermediate- and long-term counterparts.
-
Within the Fund's benchmark, bonds with maturities of 10–15 years and 15–20 years had the highest returns.
How did the Fund perform over the past 10 years?
Keep in mind that the Fund's past performance does not indicate how the Fund will perform in the future. Updated performance information is available on our website at vanguard.com/performance or by calling Vanguard toll-free at 800-662-7447. The graph and returns shown do not reflect taxes that a shareholder would pay on fund distributions or on the sale of fund shares.
Cumulative Performance: August 31, 2016, Through August 31, 2026
Initial Investment of $5,000,000

| Average Annual Total Returns | |||
| 1 Year | 5 Years | 10 Years | |
| Institutional Shares | 0.17% | -6.87% | -1.79% |
| Spliced Bloomberg U.S. Long Treasury Index | 0.18% | -6.85% | -1.75% |
| Bloomberg U.S. Aggregate Float Adjusted Index | 1.84% | -0.29% | 1.42% |
| Fund Statistics (as of August 31, 2026) |
|
| Fund Net Assets (in millions) |
$15,134 |
| Number of Portfolio Holdings | 102 |
| Portfolio Turnover Rate | 16% |
| Total Investment Advisory Fees (in thousands) |
$506 |
| Distribution by Stated Maturity % of Net Asset (as of August 31, 2026) |
|
| 10 - 15 Years | 11.2% |
| 15 - 20 Years | 34.7% |
| 20 - 25 Years | 18.1% |
| Over 25 Years | 34.9% |
| Other Assets and Liabilities—Net | 1.1% |
| This table reflects the Fund’s investments, including short-term investments and other assets and liabilities. | |
How has the Fund changed?
During the reporting period, the expense ratio for the Institutional Share class of the Fund was reduced.
This is a summary of certain changes to the Fund since August 31, 2025. For more complete information, you may review the Fund’s next prospectus, which we expect to be available by December 31, 2026, at https://personal1.vanguard.com/ngf-next-gen-form-webapp/fund-literature or upon request at 800-662-7447.
During the reporting period, the expense ratio for the Institutional Share class of the Fund was reduced.
This is a summary of certain changes to the Fund since August 31, 2025. For more complete information, you may review the Fund’s next prospectus, which we expect to be available by December 31, 2026, at https://personal1.vanguard.com/ngf-next-gen-form-webapp/fund-literature or upon request at 800-662-7447.
What were the Fund costs for the last year?
(based on a hypothetical $10,000 investment)
| Share Class Name | Costs of a $10,000 investment | Costs paid as a percentage of a $10,000 investment |
| Admiral Shares | $6 | 0.06% |
How did the Fund perform during the reporting period?
-
For the 12 months ended August 31, 2026, the Fund performed roughly in line with its benchmark.
-
Global equities posted strong returns, while global bonds struggled. Resilient growth and corporate earnings supported stocks, though shifting U.S. trade policy, persistent inflation, and Middle East tensions that disrupted energy supplies and raised oil prices fueled volatility.
-
Some central banks, including those in the United States and United Kingdom, lowered rates. However, developed-market government bond yields generally rose amid concerns about borrowing, inflation, and monetary policy.
-
In general, mortgage-backed securities outperformed corporate bonds and Treasuries for the period, and short-term Treasuries outperformed their intermediate- and long-term counterparts.
-
Within the Fund's benchmark, bonds with maturities of 10–15 years and 15–20 years had the highest returns.
How did the Fund perform over the past 10 years?
Keep in mind that the Fund's past performance does not indicate how the Fund will perform in the future. Updated performance information is available on our website at vanguard.com/performance or by calling Vanguard toll-free at 800-662-7447. The graph and returns shown do not reflect taxes that a shareholder would pay on fund distributions or on the sale of fund shares.
Cumulative Performance: August 31, 2016, Through August 31, 2026
Initial Investment of $10,000

| Average Annual Total Returns | |||
| 1 Year | 5 Years | 10 Years | |
| Admiral Shares | 0.17% | -6.90% | -1.81% |
| Spliced Bloomberg U.S. Long Treasury Index | 0.18% | -6.85% | -1.75% |
| Bloomberg U.S. Aggregate Float Adjusted Index | 1.84% | -0.29% | 1.42% |
| Fund Statistics (as of August 31, 2026) |
|
| Fund Net Assets (in millions) |
$15,134 |
| Number of Portfolio Holdings | 102 |
| Portfolio Turnover Rate | 16% |
| Total Investment Advisory Fees (in thousands) |
$506 |
| Distribution by Stated Maturity % of Net Asset (as of August 31, 2026) |
|
| 10 - 15 Years | 11.2% |
| 15 - 20 Years | 34.7% |
| 20 - 25 Years | 18.1% |
| Over 25 Years | 34.9% |
| Other Assets and Liabilities—Net | 1.1% |
| This table reflects the Fund’s investments, including short-term investments and other assets and liabilities. | |
What were the Fund costs for the last year?
(based on a hypothetical $10,000 investment)
| Share Class Name | Costs of a $10,000 investment | Costs paid as a percentage of a $10,000 investment |
| ETF Shares | $3 | 0.03% |
How did the Fund perform during the reporting period?
-
For the 12 months ended August 31, 2026, the Fund performed roughly in line with its benchmark.
-
Global equities posted strong returns, while global bonds struggled. Resilient growth and corporate earnings supported stocks, though shifting U.S. trade policy, persistent inflation, and Middle East tensions that disrupted energy supplies and raised oil prices fueled volatility.
-
Some central banks, including those in the United States and United Kingdom, lowered rates. However, developed-market government bond yields generally rose amid concerns about borrowing, inflation, and monetary policy.
-
In general, mortgage-backed securities outperformed corporate bonds and Treasuries for the period, and short-term Treasuries outperformed their intermediate- and long-term counterparts.
-
Within the Fund's benchmark, bonds with maturities of 10–15 years and 15–20 years had the highest returns.
How did the Fund perform over the past 10 years?
Keep in mind that the Fund's past performance does not indicate how the Fund will perform in the future. Updated performance information is available on our website at vanguard.com/performance or by calling Vanguard toll-free at 800-662-7447. The graph and returns shown do not reflect taxes that a shareholder would pay on fund distributions or on the sale of fund shares.
Cumulative Performance: August 31, 2016, Through August 31, 2026
Initial Investment of $10,000
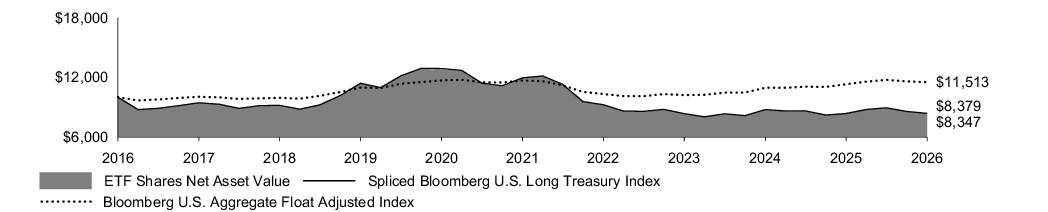
| Average Annual Total Returns | |||
| 1 Year | 5 Years | 10 Years | |
| ETF Shares Net Asset Value | 0.19% | -6.87% | -1.79% |
| ETF Shares Market Price | 0.09% | -6.88% | -1.80% |
| Spliced Bloomberg U.S. Long Treasury Index | 0.18% | -6.85% | -1.75% |
| Bloomberg U.S. Aggregate Float Adjusted Index | 1.84% | -0.29% | 1.42% |
| Fund Statistics (as of August 31, 2026) |
|
| Fund Net Assets (in millions) |
$15,134 |
| Number of Portfolio Holdings | 102 |
| Portfolio Turnover Rate | 16% |
| Total Investment Advisory Fees (in thousands) |
$506 |
| Distribution by Stated Maturity % of Net Asset (as of August 31, 2026) |
|
| 10 - 15 Years | 11.2% |
| 15 - 20 Years | 34.7% |
| 20 - 25 Years | 18.1% |
| Over 25 Years | 34.9% |
| Other Assets and Liabilities—Net | 1.1% |
| This table reflects the Fund’s investments, including short-term investments and other assets and liabilities. | |
What were the Fund costs for the last year?
(based on a hypothetical $10,000 investment)
| Share Class Name | Costs of a $10,000 investment | Costs paid as a percentage of a $10,000 investment |
| ETF Shares | $3 | 0.03% |
How did the Fund perform during the reporting period?
-
For the 12 months ended August 31, 2026, the Fund performed roughly in line with its benchmark.
-
Global equities posted strong returns, while global bonds struggled. Resilient growth and corporate earnings supported stocks, though shifting U.S. trade policy, persistent inflation, and Middle East tensions that disrupted energy supplies and raised oil prices fueled volatility.
-
Some central banks, including those in the United States and the United Kingdom, lowered rates. However, developed-market government bond yields generally rose amid concerns about borrowing, inflation, and monetary policy.
-
In general, mortgage-backed securities outperformed corporate bonds and Treasuries for the period, and short- and intermediate-term corporate bonds outpaced their long-term counterparts.
-
Within the Fund's benchmark, utility bonds outperformed financial and industrial issues. By credit quality, lower-quality bonds outperformed their higher-quality counterparts.
How did the Fund perform over the past 10 years?
Keep in mind that the Fund's past performance does not indicate how the Fund will perform in the future. Updated performance information is available on our website at vanguard.com/performance or by calling Vanguard toll-free at 800-662-7447. The graph and returns shown do not reflect taxes that a shareholder would pay on fund distributions or on the sale of fund shares.
Cumulative Performance: August 31, 2016, Through August 31, 2026
Initial Investment of $10,000
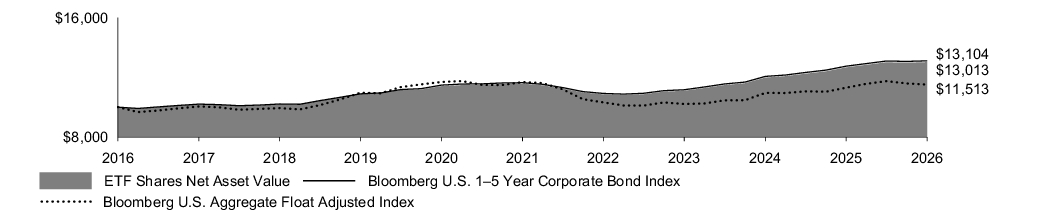
| Average Annual Total Returns | |||
| 1 Year | 5 Years | 10 Years | |
| ETF Shares Net Asset Value | 2.78% | 2.38% | 2.67% |
| ETF Shares Market Price | 2.76% | 2.37% | 2.64% |
| Bloomberg U.S. 1–5 Year Corporate Bond Index | 2.80% | 2.40% | 2.74% |
| Bloomberg U.S. Aggregate Float Adjusted Index | 1.84% | -0.29% | 1.42% |
| Fund Statistics (as of August 31, 2026) |
|
| Fund Net Assets (in millions) |
$51,893 |
| Number of Portfolio Holdings | 3,031 |
| Portfolio Turnover Rate | 71% |
| Total Investment Advisory Fees (in thousands) |
$1,728 |
| Portfolio Composition % of Net Assets (as of August 31, 2026) |
|
| Communications | 5.0% |
| Consumer Discretionary | 7.5% |
| Consumer Staples | 4.9% |
| Energy | 5.2% |
| Financials | 37.5% |
| Health Care | 8.7% |
| Industrials | 6.4% |
| Materials | 2.5% |
| Real Estate | 4.4% |
| Technology | 8.4% |
| Utilities | 7.2% |
| U.S. Government and Agency Obligations | 0.8% |
| Other Assets and Liabilities—Net | 1.5% |
| This table reflects the Fund’s investments, including short-term investments, derivatives and other assets and liabilities. | |
What were the Fund costs for the last year?
(based on a hypothetical $10,000 investment)
| Share Class Name | Costs of a $10,000 investment | Costs paid as a percentage of a $10,000 investment |
| Admiral Shares | $6 | 0.06% |
How did the Fund perform during the reporting period?
-
For the 12 months ended August 31, 2026, the Fund performed roughly in line with its benchmark.
-
Global equities posted strong returns, while global bonds struggled. Resilient growth and corporate earnings supported stocks, though shifting U.S. trade policy, persistent inflation, and Middle East tensions that disrupted energy supplies and raised oil prices fueled volatility.
-
Some central banks, including those in the United States and the United Kingdom, lowered rates. However, developed-market government bond yields generally rose amid concerns about borrowing, inflation, and monetary policy.
-
In general, mortgage-backed securities outperformed corporate bonds and Treasuries for the period, and short- and intermediate-term corporate bonds outpaced their long-term counterparts.
-
Within the Fund's benchmark, utility bonds outperformed financial and industrial issues. By credit quality, lower-quality bonds outperformed their higher-quality counterparts.
How did the Fund perform over the past 10 years?
Keep in mind that the Fund's past performance does not indicate how the Fund will perform in the future. Updated performance information is available on our website at vanguard.com/performance or by calling Vanguard toll-free at 800-662-7447. The graph and returns shown do not reflect taxes that a shareholder would pay on fund distributions or on the sale of fund shares.
Cumulative Performance: August 31, 2016, Through August 31, 2026
Initial Investment of $10,000

| Average Annual Total Returns | |||
| 1 Year | 5 Years | 10 Years | |
| Admiral Shares | 2.76% | 2.35% | 2.65% |
| Bloomberg U.S. 1–5 Year Corporate Bond Index | 2.80% | 2.40% | 2.74% |
| Bloomberg U.S. Aggregate Float Adjusted Index | 1.84% | -0.29% | 1.42% |
| Fund Statistics (as of August 31, 2026) |
|
| Fund Net Assets (in millions) |
$51,893 |
| Number of Portfolio Holdings | 3,031 |
| Portfolio Turnover Rate | 71% |
| Total Investment Advisory Fees (in thousands) |
$1,728 |
| Portfolio Composition % of Net Assets (as of August 31, 2026) |
|
| Communications | 5.0% |
| Consumer Discretionary | 7.5% |
| Consumer Staples | 4.9% |
| Energy | 5.2% |
| Financials | 37.5% |
| Health Care | 8.7% |
| Industrials | 6.4% |
| Materials | 2.5% |
| Real Estate | 4.4% |
| Technology | 8.4% |
| Utilities | 7.2% |
| U.S. Government and Agency Obligations | 0.8% |
| Other Assets and Liabilities—Net | 1.5% |
| This table reflects the Fund’s investments, including short-term investments, derivatives and other assets and liabilities. | |
What were the Fund costs for the last year?
(based on a hypothetical $10,000 investment)
| Share Class Name | Costs of a $10,000 investment | Costs paid as a percentage of a $10,000 investment |
| Institutional Shares | $3 | 0.03% |
How did the Fund perform during the reporting period?
-
For the 12 months ended August 31, 2026, the Fund performed roughly in line with its benchmark.
-
Global equities posted strong returns, while global bonds struggled. Resilient growth and corporate earnings supported stocks, though shifting U.S. trade policy, persistent inflation, and Middle East tensions that disrupted energy supplies and raised oil prices fueled volatility.
-
Some central banks, including those in the United States and the United Kingdom, lowered rates. However, developed-market government bond yields generally rose amid concerns about borrowing, inflation, and monetary policy.
-
In general, mortgage-backed securities outperformed corporate bonds and Treasuries for the period, and short- and intermediate-term corporate bonds outpaced their long-term counterparts.
-
Within the Fund's benchmark, utility bonds outperformed financial and industrial issues. By credit quality, lower-quality bonds outperformed their higher-quality counterparts.
How did the Fund perform over the past 10 years?
Keep in mind that the Fund's past performance does not indicate how the Fund will perform in the future. Updated performance information is available on our website at vanguard.com/performance or by calling Vanguard toll-free at 800-662-7447. The graph and returns shown do not reflect taxes that a shareholder would pay on fund distributions or on the sale of fund shares.
Cumulative Performance: August 31, 2016, Through August 31, 2026
Initial Investment of $5,000,000
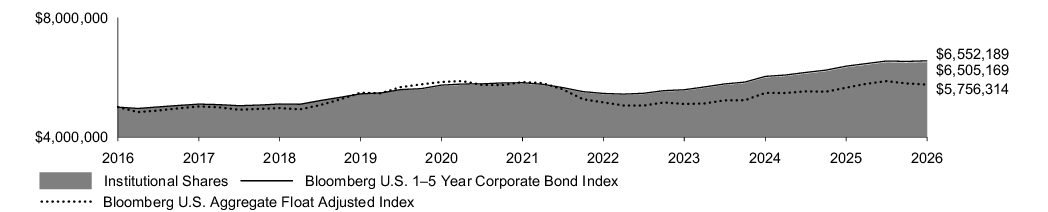
| Average Annual Total Returns | |||
| 1 Year | 5 Years | 10 Years | |
| Institutional Shares | 2.76% | 2.37% | 2.67% |
| Bloomberg U.S. 1–5 Year Corporate Bond Index | 2.80% | 2.40% | 2.74% |
| Bloomberg U.S. Aggregate Float Adjusted Index | 1.84% | -0.29% | 1.42% |
| Fund Statistics (as of August 31, 2026) |
|
| Fund Net Assets (in millions) |
$51,893 |
| Number of Portfolio Holdings | 3,031 |
| Portfolio Turnover Rate | 71% |
| Total Investment Advisory Fees (in thousands) |
$1,728 |
| Portfolio Composition % of Net Assets (as of August 31, 2026) |
|
| Communications | 5.0% |
| Consumer Discretionary | 7.5% |
| Consumer Staples | 4.9% |
| Energy | 5.2% |
| Financials | 37.5% |
| Health Care | 8.7% |
| Industrials | 6.4% |
| Materials | 2.5% |
| Real Estate | 4.4% |
| Technology | 8.4% |
| Utilities | 7.2% |
| U.S. Government and Agency Obligations | 0.8% |
| Other Assets and Liabilities—Net | 1.5% |
| This table reflects the Fund’s investments, including short-term investments, derivatives and other assets and liabilities. | |
How has the Fund changed?
During the reporting period, the expense ratio for the Institutional Share class of the Fund was reduced.
This is a summary of certain changes to the Fund since August 31, 2025. For more complete information, you may review the Fund’s next prospectus, which we expect to be available by December 31, 2026, at https://personal1.vanguard.com/ngf-next-gen-form-webapp/fund-literature or upon request at 800-662-7447.
During the reporting period, the expense ratio for the Institutional Share class of the Fund was reduced.
This is a summary of certain changes to the Fund since August 31, 2025. For more complete information, you may review the Fund’s next prospectus, which we expect to be available by December 31, 2026, at https://personal1.vanguard.com/ngf-next-gen-form-webapp/fund-literature or upon request at 800-662-7447.
What were the Fund costs for the last year?
(based on a hypothetical $10,000 investment)
| Share Class Name | Costs of a $10,000 investment | Costs paid as a percentage of a $10,000 investment |
| Institutional Shares | $3 | 0.03% |
How did the Fund perform during the reporting period?
-
For the 12 months ended August 31, 2026, the Fund performed roughly in line with its benchmark.
-
Global equities posted strong returns, while global bonds struggled. Resilient growth and corporate earnings supported stocks, though shifting U.S. trade policy, persistent inflation, and Middle East tensions that disrupted energy supplies and raised oil prices fueled volatility.
-
Some central banks, including those in the United States and the United Kingdom, lowered rates. However, developed-market government bond yields generally rose amid concerns about borrowing, inflation, and monetary policy.
-
In general, mortgage-backed securities outperformed corporate bonds and Treasuries for the period, and short- and intermediate-term corporate bonds outpaced their long-term counterparts.
-
Within the Fund's benchmark, utility bonds outperformed financial and industrial issues. By credit quality, results were mixed. By maturity, bonds with maturities of 5–10 years returned more than those with maturities of 10–15 years.
How did the Fund perform over the past 10 years?
Keep in mind that the Fund's past performance does not indicate how the Fund will perform in the future. Updated performance information is available on our website at vanguard.com/performance or by calling Vanguard toll-free at 800-662-7447. The graph and returns shown do not reflect taxes that a shareholder would pay on fund distributions or on the sale of fund shares.
Cumulative Performance: August 31, 2016, Through August 31, 2026
Initial Investment of $5,000,000
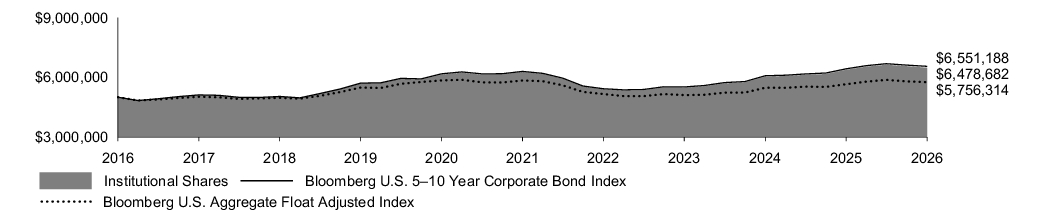
| Average Annual Total Returns | |||
| 1 Year | 5 Years | 10 Years | |
| Institutional Shares | 1.65% | 0.69% | 2.62% |
| Bloomberg U.S. 5–10 Year Corporate Bond Index | 1.93% | 0.80% | 2.74% |
| Bloomberg U.S. Aggregate Float Adjusted Index | 1.84% | -0.29% | 1.42% |
| Fund Statistics (as of August 31, 2026) |
|
| Fund Net Assets (in millions) |
$72,180 |
| Number of Portfolio Holdings | 2,327 |
| Portfolio Turnover Rate | 73% |
| Total Investment Advisory Fees (in thousands) |
$2,353 |
| Portfolio Composition % of Net Assets (as of August 31, 2026) |
|
| Communications | 7.7% |
| Consumer Discretionary | 5.7% |
| Consumer Staples | 5.3% |
| Energy | 6.6% |
| Financials | 31.7% |
| Health Care | 8.6% |
| Industrials | 5.8% |
| Materials | 3.1% |
| Real Estate | 4.6% |
| Technology | 9.0% |
| Utilities | 10.1% |
| U.S. Government and Agency Obligations | 0.1% |
| Other Assets and Liabilities—Net | 1.7% |
| This table reflects the Fund’s investments, including short-term investments, derivatives and other assets and liabilities. | |
How has the Fund changed?
During the reporting period, the purchase fee for the Institutional Share class was eliminated. Additionally, during the reporting period, the expense ratio for the Institutional Share class of the Fund was reduced.
This is a summary of certain changes to the Fund since August 31, 2025. For more complete information, you may review the Fund’s next prospectus, which we expect to be available by December 31, 2026, at https://personal1.vanguard.com/ngf-next-gen-form-webapp/fund-literature or upon request at 800-662-7447.
During the reporting period, the purchase fee for the Institutional Share class was eliminated. Additionally, during the reporting period, the expense ratio for the Institutional Share class of the Fund was reduced.
This is a summary of certain changes to the Fund since August 31, 2025. For more complete information, you may review the Fund’s next prospectus, which we expect to be available by December 31, 2026, at https://personal1.vanguard.com/ngf-next-gen-form-webapp/fund-literature or upon request at 800-662-7447.
What were the Fund costs for the last year?
(based on a hypothetical $10,000 investment)
| Share Class Name | Costs of a $10,000 investment | Costs paid as a percentage of a $10,000 investment |
| Admiral Shares | $6 | 0.06% |
How did the Fund perform during the reporting period?
-
For the 12 months ended August 31, 2026, the Fund performed roughly in line with its benchmark.
-
Global equities posted strong returns, while global bonds struggled. Resilient growth and corporate earnings supported stocks, though shifting U.S. trade policy, persistent inflation, and Middle East tensions that disrupted energy supplies and raised oil prices fueled volatility.
-
Some central banks, including those in the United States and the United Kingdom, lowered rates. However, developed-market government bond yields generally rose amid concerns about borrowing, inflation, and monetary policy.
-
In general, mortgage-backed securities outperformed corporate bonds and Treasuries for the period, and short- and intermediate-term corporate bonds outpaced their long-term counterparts.
-
Within the Fund's benchmark, utility bonds outperformed financial and industrial issues. By credit quality, results were mixed. By maturity, bonds with maturities of 5–10 years returned more than those with maturities of 10–15 years.
How did the Fund perform over the past 10 years?
Keep in mind that the Fund's past performance does not indicate how the Fund will perform in the future. Updated performance information is available on our website at vanguard.com/performance or by calling Vanguard toll-free at 800-662-7447. The graph and returns shown do not reflect taxes that a shareholder would pay on fund distributions or on the sale of fund shares.
Cumulative Performance: August 31, 2016, Through August 31, 2026
Initial Investment of $10,000

| Average Annual Total Returns | |||
| 1 Year | 5 Years | 10 Years | |
| Admiral Shares | 1.63% | 0.68% | 2.61% |
| Bloomberg U.S. 5–10 Year Corporate Bond Index | 1.93% | 0.80% | 2.74% |
| Bloomberg U.S. Aggregate Float Adjusted Index | 1.84% | -0.29% | 1.42% |
| Fund Statistics (as of August 31, 2026) |
|
| Fund Net Assets (in millions) |
$72,180 |
| Number of Portfolio Holdings | 2,327 |
| Portfolio Turnover Rate | 73% |
| Total Investment Advisory Fees (in thousands) |
$2,353 |
| Portfolio Composition % of Net Assets (as of August 31, 2026) |
|
| Communications | 7.7% |
| Consumer Discretionary | 5.7% |
| Consumer Staples | 5.3% |
| Energy | 6.6% |
| Financials | 31.7% |
| Health Care | 8.6% |
| Industrials | 5.8% |
| Materials | 3.1% |
| Real Estate | 4.6% |
| Technology | 9.0% |
| Utilities | 10.1% |
| U.S. Government and Agency Obligations | 0.1% |
| Other Assets and Liabilities—Net | 1.7% |
| This table reflects the Fund’s investments, including short-term investments, derivatives and other assets and liabilities. | |
How has the Fund changed?
During the reporting period, the purchase fee for the Admiral Share class was eliminated.
This is a summary of certain changes to the Fund since August 31, 2025. For more complete information, you may review the Fund’s next prospectus, which we expect to be available by December 31, 2026, at https://personal1.vanguard.com/ngf-next-gen-form-webapp/fund-literature or upon request at 800-662-7447.
During the reporting period, the purchase fee for the Admiral Share class was eliminated.
This is a summary of certain changes to the Fund since August 31, 2025. For more complete information, you may review the Fund’s next prospectus, which we expect to be available by December 31, 2026, at https://personal1.vanguard.com/ngf-next-gen-form-webapp/fund-literature or upon request at 800-662-7447.
What were the Fund costs for the last year?
(based on a hypothetical $10,000 investment)
| Share Class Name | Costs of a $10,000 investment | Costs paid as a percentage of a $10,000 investment |
| ETF Shares | $3 | 0.03% |
How did the Fund perform during the reporting period?
-
For the 12 months ended August 31, 2026, the Fund performed roughly in line with its benchmark.
-
Global equities posted strong returns, while global bonds struggled. Resilient growth and corporate earnings supported stocks, though shifting U.S. trade policy, persistent inflation, and Middle East tensions that disrupted energy supplies and raised oil prices fueled volatility.
-
Some central banks, including those in the United States and the United Kingdom, lowered rates. However, developed-market government bond yields generally rose amid concerns about borrowing, inflation, and monetary policy.
-
In general, mortgage-backed securities outperformed corporate bonds and Treasuries for the period, and short- and intermediate-term corporate bonds outpaced their long-term counterparts.
-
Within the Fund's benchmark, utility bonds outperformed financial and industrial issues. By credit quality, results were mixed. By maturity, bonds with maturities of 5–10 years returned more than those with maturities of 10–15 years.
How did the Fund perform over the past 10 years?
Keep in mind that the Fund's past performance does not indicate how the Fund will perform in the future. Updated performance information is available on our website at vanguard.com/performance or by calling Vanguard toll-free at 800-662-7447. The graph and returns shown do not reflect taxes that a shareholder would pay on fund distributions or on the sale of fund shares.
Cumulative Performance: August 31, 2016, Through August 31, 2026
Initial Investment of $10,000
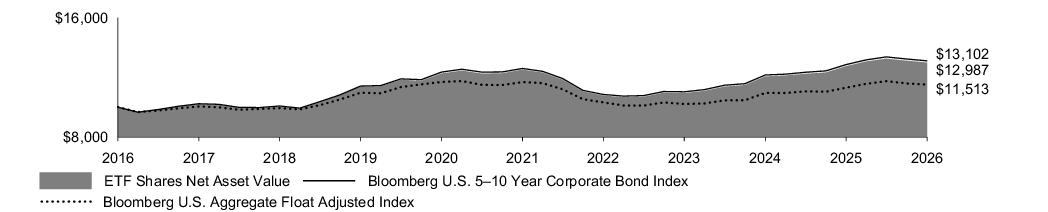
| Average Annual Total Returns | |||
| 1 Year | 5 Years | 10 Years | |
| ETF Shares Net Asset Value | 1.90% | 0.75% | 2.65% |
| ETF Shares Market Price | 1.95% | 0.74% | 2.62% |
| Bloomberg U.S. 5–10 Year Corporate Bond Index | 1.93% | 0.80% | 2.74% |
| Bloomberg U.S. Aggregate Float Adjusted Index | 1.84% | -0.29% | 1.42% |
| Fund Statistics (as of August 31, 2026) |
|
| Fund Net Assets (in millions) |
$72,180 |
| Number of Portfolio Holdings | 2,327 |
| Portfolio Turnover Rate | 73% |
| Total Investment Advisory Fees (in thousands) |
$2,353 |
| Portfolio Composition % of Net Assets (as of August 31, 2026) |
|
| Communications | 7.7% |
| Consumer Discretionary | 5.7% |
| Consumer Staples | 5.3% |
| Energy | 6.6% |
| Financials | 31.7% |
| Health Care | 8.6% |
| Industrials | 5.8% |
| Materials | 3.1% |
| Real Estate | 4.6% |
| Technology | 9.0% |
| Utilities | 10.1% |
| U.S. Government and Agency Obligations | 0.1% |
| Other Assets and Liabilities—Net | 1.7% |
| This table reflects the Fund’s investments, including short-term investments, derivatives and other assets and liabilities. | |
What were the Fund costs for the last year?
(based on a hypothetical $10,000 investment)
| Share Class Name | Costs of a $10,000 investment | Costs paid as a percentage of a $10,000 investment |
| ETF Shares | $3 | 0.03% |
How did the Fund perform during the reporting period?
-
For the 12 months ended August 31, 2026, the Fund performed roughly in line with its benchmark.
-
Global equities posted strong returns, while global bonds struggled. Resilient growth and corporate earnings supported stocks, though shifting U.S. trade policy, persistent inflation, and Middle East tensions that disrupted energy supplies and raised oil prices fueled volatility.
-
Some central banks, including those in the United States and the United Kingdom, lowered rates. However, developed-market government bond yields generally rose amid concerns about borrowing, inflation, and monetary policy.
-
In general, mortgage-backed securities outperformed corporate bonds and Treasuries for the period, and short- and intermediate-term corporate bonds outpaced their long-term counterparts.
-
Within the Fund's benchmark, utility bonds outperformed financial and industrial issues. By credit quality, results were mixed. By maturity, bonds with maturities of 10–15 years and 15–20 years had the highest returns.
How did the Fund perform over the past 10 years?
Keep in mind that the Fund's past performance does not indicate how the Fund will perform in the future. Updated performance information is available on our website at vanguard.com/performance or by calling Vanguard toll-free at 800-662-7447. The graph and returns shown do not reflect taxes that a shareholder would pay on fund distributions or on the sale of fund shares.
Cumulative Performance: August 31, 2016, Through August 31, 2026
Initial Investment of $10,000
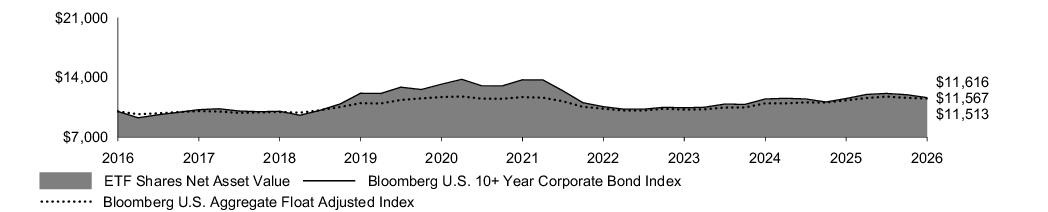
| Average Annual Total Returns | |||
| 1 Year | 5 Years | 10 Years | |
| ETF Shares Net Asset Value | 0.82% | -3.28% | 1.47% |
| ETF Shares Market Price | 0.92% | -3.27% | 1.46% |
| Bloomberg U.S. 10+ Year Corporate Bond Index | 0.89% | -3.26% | 1.51% |
| Bloomberg U.S. Aggregate Float Adjusted Index | 1.84% | -0.29% | 1.42% |
| Fund Statistics (as of August 31, 2026) |
|
| Fund Net Assets (in millions) |
$9,771 |
| Number of Portfolio Holdings | 2,861 |
| Portfolio Turnover Rate | 43% |
| Total Investment Advisory Fees (in thousands) |
$317 |
| Portfolio Composition % of Net Assets (as of August 31, 2026) |
|
| Communications | 12.5% |
| Consumer Discretionary | 6.3% |
| Consumer Staples | 6.4% |
| Energy | 8.9% |
| Financials | 13.3% |
| Health Care | 15.9% |
| Industrials | 7.9% |
| Materials | 3.1% |
| Real Estate | 1.2% |
| Technology | 8.8% |
| Utilities | 13.6% |
| U.S. Government and Agency Obligations | 0.1% |
| Other Assets and Liabilities—Net | 2.0% |
| This table reflects the Fund’s investments, including short-term investments, derivatives and other assets and liabilities. | |
What were the Fund costs for the last year?
(based on a hypothetical $10,000 investment)
| Share Class Name | Costs of a $10,000 investment | Costs paid as a percentage of a $10,000 investment |
| Admiral Shares | $6 | 0.06% |
How did the Fund perform during the reporting period?
-
For the 12 months ended August 31, 2026, the Fund performed roughly in line with its benchmark, after taking expenses and fees into account.
-
Global equities posted strong returns, while global bonds struggled. Resilient growth and corporate earnings supported stocks, though shifting U.S. trade policy, persistent inflation, and Middle East tensions that disrupted energy supplies and raised oil prices fueled volatility.
-
Some central banks, including those in the United States and the United Kingdom, lowered rates. However, developed-market government bond yields generally rose amid concerns about borrowing, inflation, and monetary policy.
-
In general, mortgage-backed securities outperformed corporate bonds and Treasuries for the period, and short- and intermediate-term corporate bonds outpaced their long-term counterparts.
-
Within the Fund's benchmark, utility bonds outperformed financial and industrial issues. By credit quality, results were mixed. By maturity, bonds with maturities of 10–15 years and 15–20 years had the highest returns.
How did the Fund perform over the past 10 years?
Keep in mind that the Fund's past performance does not indicate how the Fund will perform in the future. Updated performance information is available on our website at vanguard.com/performance or by calling Vanguard toll-free at 800-662-7447. The graph and returns shown do not reflect taxes that a shareholder would pay on fund distributions or on the sale of fund shares.
Cumulative Performance: August 31, 2016, Through August 31, 2026
Initial Investment of $10,000

| Average Annual Total Returns | |||
| 1 Year | 5 Years | 10 Years | |
| Admiral Shares | -0.22% | -3.49% | 1.35% |
| Bloomberg U.S. 10+ Year Corporate Bond Index | 0.89% | -3.26% | 1.51% |
| Bloomberg U.S. Aggregate Float Adjusted Index | 1.84% | -0.29% | 1.42% |
| Fund Statistics (as of August 31, 2026) |
|
| Fund Net Assets (in millions) |
$9,771 |
| Number of Portfolio Holdings | 2,861 |
| Portfolio Turnover Rate | 43% |
| Total Investment Advisory Fees (in thousands) |
$317 |
| Portfolio Composition % of Net Assets (as of August 31, 2026) |
|
| Communications | 12.5% |
| Consumer Discretionary | 6.3% |
| Consumer Staples | 6.4% |
| Energy | 8.9% |
| Financials | 13.3% |
| Health Care | 15.9% |
| Industrials | 7.9% |
| Materials | 3.1% |
| Real Estate | 1.2% |
| Technology | 8.8% |
| Utilities | 13.6% |
| U.S. Government and Agency Obligations | 0.1% |
| Other Assets and Liabilities—Net | 2.0% |
| This table reflects the Fund’s investments, including short-term investments, derivatives and other assets and liabilities. | |
How has the Fund changed?
During the reporting period, the purchase fee for the Admiral Share class was eliminated.
This is a summary of certain changes to the Fund since August 31, 2025. For more complete information, you may review the Fund’s next prospectus, which we expect to be available by December 31, 2026, at https://personal1.vanguard.com/ngf-next-gen-form-webapp/fund-literature or upon request at 800-662-7447.
During the reporting period, the purchase fee for the Admiral Share class was eliminated.
This is a summary of certain changes to the Fund since August 31, 2025. For more complete information, you may review the Fund’s next prospectus, which we expect to be available by December 31, 2026, at https://personal1.vanguard.com/ngf-next-gen-form-webapp/fund-literature or upon request at 800-662-7447.
What were the Fund costs for the last year?
(based on a hypothetical $10,000 investment)
| Share Class Name | Costs of a $10,000 investment | Costs paid as a percentage of a $10,000 investment |
| Institutional Shares | $3 | 0.03% |
How did the Fund perform during the reporting period?
-
For the 12 months ended August 31, 2026, the Fund performed roughly in line with its benchmark, after taking expenses and fees into account.
-
Global equities posted strong returns, while global bonds struggled. Resilient growth and corporate earnings supported stocks, though shifting U.S. trade policy, persistent inflation, and Middle East tensions that disrupted energy supplies and raised oil prices fueled volatility.
-
Some central banks, including those in the United States and the United Kingdom, lowered rates. However, developed-market government bond yields generally rose amid concerns about borrowing, inflation, and monetary policy.
-
In general, mortgage-backed securities outperformed corporate bonds and Treasuries for the period, and short- and intermediate-term corporate bonds outpaced their long-term counterparts.
-
Within the Fund's benchmark, utility bonds outperformed financial and industrial issues. By credit quality, results were mixed. By maturity, bonds with maturities of 10–15 years and 15–20 years had the highest returns.
How did the Fund perform over the past 10 years?
Keep in mind that the Fund's past performance does not indicate how the Fund will perform in the future. Updated performance information is available on our website at vanguard.com/performance or by calling Vanguard toll-free at 800-662-7447. The graph and returns shown do not reflect taxes that a shareholder would pay on fund distributions or on the sale of fund shares.
Cumulative Performance: August 31, 2016, Through August 31, 2026
Initial Investment of $5,000,000
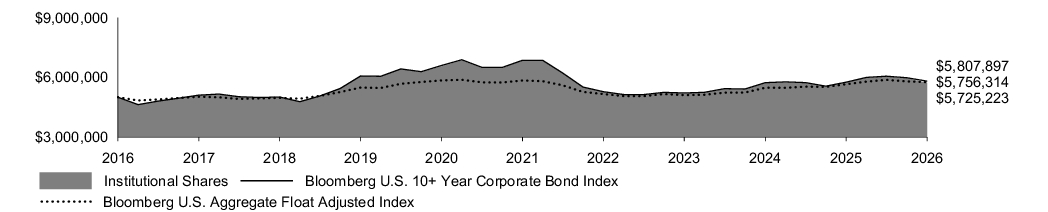
| Average Annual Total Returns | |||
| 1 Year | 5 Years | 10 Years | |
| Institutional Shares | -0.21% | -3.48% | 1.36% |
| Bloomberg U.S. 10+ Year Corporate Bond Index | 0.89% | -3.26% | 1.51% |
| Bloomberg U.S. Aggregate Float Adjusted Index | 1.84% | -0.29% | 1.42% |
| Fund Statistics (as of August 31, 2026) |
|
| Fund Net Assets (in millions) |
$9,771 |
| Number of Portfolio Holdings | 2,861 |
| Portfolio Turnover Rate | 43% |
| Total Investment Advisory Fees (in thousands) |
$317 |
| Portfolio Composition % of Net Assets (as of August 31, 2026) |
|
| Communications | 12.5% |
| Consumer Discretionary | 6.3% |
| Consumer Staples | 6.4% |
| Energy | 8.9% |
| Financials | 13.3% |
| Health Care | 15.9% |
| Industrials | 7.9% |
| Materials | 3.1% |
| Real Estate | 1.2% |
| Technology | 8.8% |
| Utilities | 13.6% |
| U.S. Government and Agency Obligations | 0.1% |
| Other Assets and Liabilities—Net | 2.0% |
| This table reflects the Fund’s investments, including short-term investments, derivatives and other assets and liabilities. | |
How has the Fund changed?
During the reporting period, the purchase fee for the Institutional Share class was eliminated. Additionally, during the reporting period, the expense ratio for the Institutional Share class of the Fund was reduced.
This is a summary of certain changes to the Fund since August 31, 2025. For more complete information, you may review the Fund’s next prospectus, which we expect to be available by December 31, 2026, at https://personal1.vanguard.com/ngf-next-gen-form-webapp/fund-literature or upon request at 800-662-7447.
During the reporting period, the purchase fee for the Institutional Share class was eliminated. Additionally, during the reporting period, the expense ratio for the Institutional Share class of the Fund was reduced.
This is a summary of certain changes to the Fund since August 31, 2025. For more complete information, you may review the Fund’s next prospectus, which we expect to be available by December 31, 2026, at https://personal1.vanguard.com/ngf-next-gen-form-webapp/fund-literature or upon request at 800-662-7447.
What were the Fund costs for the last year?
(based on a hypothetical $10,000 investment)
| Share Class Name | Costs of a $10,000 investment | Costs paid as a percentage of a $10,000 investment |
| Institutional Shares | $3 | 0.03% |
How did the Fund perform during the reporting period?
-
For the 12 months ended August 31, 2026, the Fund performed roughly in line with its benchmark.
-
Global equities posted strong returns, while global bonds struggled. Resilient growth and corporate earnings supported stocks, though shifting U.S. trade policy, persistent inflation, and Middle East tensions that disrupted energy supplies and raised oil prices fueled volatility.
-
Some central banks, including those in the United States and the United Kingdom, lowered rates. However, developed-market government bond yields generally rose amid concerns about borrowing, inflation, and monetary policy.
-
In general, mortgage-backed securities outperformed corporate bonds and Treasuries for the period.
-
Within the Fund's benchmark, shorter-dated bonds outperformed their longer-dated counterparts.
-
The average interest rate for 30-year fixed-rate mortgages rose from 6.56% for the week ended August 28, 2025, to 6.66% for the week ended August 27, 2026.
How did the Fund perform over the past 10 years?
Keep in mind that the Fund's past performance does not indicate how the Fund will perform in the future. Updated performance information is available on our website at vanguard.com/performance or by calling Vanguard toll-free at 800-662-7447. The graph and returns shown do not reflect taxes that a shareholder would pay on fund distributions or on the sale of fund shares.
Cumulative Performance: August 31, 2016, Through August 31, 2026
Initial Investment of $5,000,000

| Average Annual Total Returns | |||
| 1 Year | 5 Years | 10 Years | |
| Institutional Shares | 3.11% | 0.35% | 1.25% |
| Bloomberg U.S. MBS Float Adjusted Index | 3.12% | 0.42% | 1.34% |
| Bloomberg U.S. Aggregate Float Adjusted Index | 1.84% | -0.29% | 1.42% |
| Fund Statistics (as of August 31, 2026) |
|
| Fund Net Assets (in millions) |
$17,585 |
| Number of Portfolio Holdings | 88 |
| Portfolio Turnover Rate | 109% |
| Total Investment Advisory Fees (in thousands) |
$597 |
| Distribution by Stated Maturity % of Net Asset (as of August 31, 2026) |
|
| 0 - 10 Years | 2.8% |
| 10 - 20 Years | 9.5% |
| 20 - 30 Years | 83.9% |
| 30 - 40 Years | 2.9% |
| Other Assets and Liabilities—Net | 0.9% |
| This table reflects the Fund’s investments, including short-term investments and other assets and liabilities. | |
How has the Fund changed?
During the reporting period, the expense ratio for the Institutional Share class of the Fund was reduced.
This is a summary of certain changes to the Fund since August 31, 2025. For more complete information, you may review the Fund’s next prospectus, which we expect to be available by December 31, 2026, at https://personal1.vanguard.com/ngf-next-gen-form-webapp/fund-literature or upon request at 800-662-7447.
During the reporting period, the expense ratio for the Institutional Share class of the Fund was reduced.
This is a summary of certain changes to the Fund since August 31, 2025. For more complete information, you may review the Fund’s next prospectus, which we expect to be available by December 31, 2026, at https://personal1.vanguard.com/ngf-next-gen-form-webapp/fund-literature or upon request at 800-662-7447.
What were the Fund costs for the last year?
(based on a hypothetical $10,000 investment)
| Share Class Name | Costs of a $10,000 investment | Costs paid as a percentage of a $10,000 investment |
| Admiral Shares | $5 | 0.05% |
How did the Fund perform during the reporting period?
-
For the 12 months ended August 31, 2026, the Fund performed roughly in line with its benchmark.
-
Global equities posted strong returns, while global bonds struggled. Resilient growth and corporate earnings supported stocks, though shifting U.S. trade policy, persistent inflation, and Middle East tensions that disrupted energy supplies and raised oil prices fueled volatility.
-
Some central banks, including those in the United States and the United Kingdom, lowered rates. However, developed-market government bond yields generally rose amid concerns about borrowing, inflation, and monetary policy.
-
In general, mortgage-backed securities outperformed corporate bonds and Treasuries for the period.
-
Within the Fund's benchmark, shorter-dated bonds outperformed their longer-dated counterparts.
-
The average interest rate for 30-year fixed-rate mortgages rose from 6.56% for the week ended August 28, 2025, to 6.66% for the week ended August 27, 2026.
How did the Fund perform over the past 10 years?
Keep in mind that the Fund's past performance does not indicate how the Fund will perform in the future. Updated performance information is available on our website at vanguard.com/performance or by calling Vanguard toll-free at 800-662-7447. The graph and returns shown do not reflect taxes that a shareholder would pay on fund distributions or on the sale of fund shares.
Cumulative Performance: August 31, 2016, Through August 31, 2026
Initial Investment of $10,000

| Average Annual Total Returns | |||
| 1 Year | 5 Years | 10 Years | |
| Admiral Shares | 3.09% | 0.34% | 1.23% |
| Bloomberg U.S. MBS Float Adjusted Index | 3.12% | 0.42% | 1.34% |
| Bloomberg U.S. Aggregate Float Adjusted Index | 1.84% | -0.29% | 1.42% |
| Fund Statistics (as of August 31, 2026) |
|
| Fund Net Assets (in millions) |
$17,585 |
| Number of Portfolio Holdings | 88 |
| Portfolio Turnover Rate | 109% |
| Total Investment Advisory Fees (in thousands) |
$597 |
| Distribution by Stated Maturity % of Net Asset (as of August 31, 2026) |
|
| 0 - 10 Years | 2.8% |
| 10 - 20 Years | 9.5% |
| 20 - 30 Years | 83.9% |
| 30 - 40 Years | 2.9% |
| Other Assets and Liabilities—Net | 0.9% |
| This table reflects the Fund’s investments, including short-term investments and other assets and liabilities. | |
How has the Fund changed?
During the reporting period, the expense ratio for the Admiral Share class of the Fund was reduced.
This is a summary of certain changes to the Fund since August 31, 2025. For more complete information, you may review the Fund’s next prospectus, which we expect to be available by December 31, 2026, at https://personal1.vanguard.com/ngf-next-gen-form-webapp/fund-literature or upon request at 800-662-7447.
During the reporting period, the expense ratio for the Admiral Share class of the Fund was reduced.
This is a summary of certain changes to the Fund since August 31, 2025. For more complete information, you may review the Fund’s next prospectus, which we expect to be available by December 31, 2026, at https://personal1.vanguard.com/ngf-next-gen-form-webapp/fund-literature or upon request at 800-662-7447.
What were the Fund costs for the last year?
(based on a hypothetical $10,000 investment)
| Share Class Name | Costs of a $10,000 investment | Costs paid as a percentage of a $10,000 investment |
| ETF Shares | $3 | 0.03% |
How did the Fund perform during the reporting period?
-
For the 12 months ended August 31, 2026, the Fund performed roughly in line with its benchmark.
-
Global equities posted strong returns, while global bonds struggled. Resilient growth and corporate earnings supported stocks, though shifting U.S. trade policy, persistent inflation, and Middle East tensions that disrupted energy supplies and raised oil prices fueled volatility.
-
Some central banks, including those in the United States and the United Kingdom, lowered rates. However, developed-market government bond yields generally rose amid concerns about borrowing, inflation, and monetary policy.
-
In general, mortgage-backed securities outperformed corporate bonds and Treasuries for the period.
-
Within the Fund's benchmark, shorter-dated bonds outperformed their longer-dated counterparts.
-
The average interest rate for 30-year fixed-rate mortgages rose from 6.56% for the week ended August 28, 2025, to 6.66% for the week ended August 27, 2026.
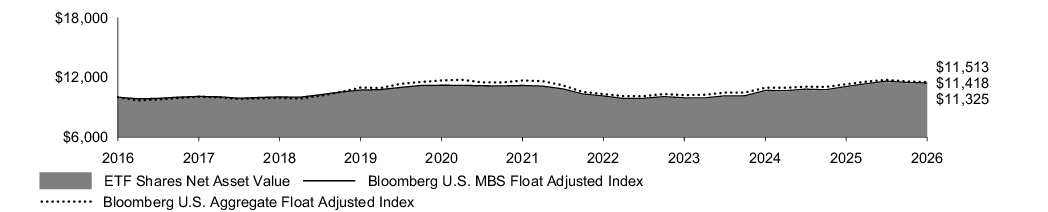
How did the Fund perform over the past 10 years?
Keep in mind that the Fund's past performance does not indicate how the Fund will perform in the future. Updated performance information is available on our website at vanguard.com/performance or by calling Vanguard toll-free at 800-662-7447. The graph and returns shown do not reflect taxes that a shareholder would pay on fund distributions or on the sale of fund shares.
Cumulative Performance: August 31, 2016, Through August 31, 2026
Initial Investment of $10,000
| Average Annual Total Returns | |||
| 1 Year | 5 Years | 10 Years | |
| ETF Shares Net Asset Value | 3.12% | 0.36% | 1.25% |
| ETF Shares Market Price | 3.16% | 0.37% | 1.26% |
| Bloomberg U.S. MBS Float Adjusted Index | 3.12% | 0.42% | 1.34% |
| Bloomberg U.S. Aggregate Float Adjusted Index | 1.84% | -0.29% | 1.42% |
| Fund Statistics (as of August 31, 2026) |
|
| Fund Net Assets (in millions) |
$17,585 |
| Number of Portfolio Holdings | 88 |
| Portfolio Turnover Rate | 109% |
| Total Investment Advisory Fees (in thousands) |
$597 |
| Distribution by Stated Maturity % of Net Asset (as of August 31, 2026) |
|
| 0 - 10 Years | 2.8% |
| 10 - 20 Years | 9.5% |
| 20 - 30 Years | 83.9% |
| 30 - 40 Years | 2.9% |
| Other Assets and Liabilities—Net | 0.9% |
| This table reflects the Fund’s investments, including short-term investments and other assets and liabilities. | |
What were the Fund costs for the last year?
(based on a hypothetical $10,000 investment)
| Share Class Name | Costs of a $10,000 investment | Costs paid as a percentage of a $10,000 investment |
| ETF Shares | $3 | 0.03% |
How did the Fund perform during the reporting period?
-
For the 12 months ended August 31, 2026, the Fund performed roughly in line with its benchmark.
-
Global equities posted strong returns, while global bonds struggled. Resilient growth and corporate earnings supported stocks, though shifting U.S. trade policy, persistent inflation, and Middle East tensions that disrupted energy supplies and raised oil prices fueled volatility.
-
Some central banks, including those in the United States and the United Kingdom, lowered rates. However, developed-market government bond yields generally rose amid concerns about borrowing, inflation, and monetary policy.
-
In general, mortgage-backed securities outperformed corporate bonds and Treasuries for the period.
-
Within the Fund's benchmark, bonds issued by financial institutions returned more than those issued by utilities and industrial companies. By credit quality, lower-quality bonds outperformed their higher-quality counterparts. By maturity, shorter-dated bonds performed best.
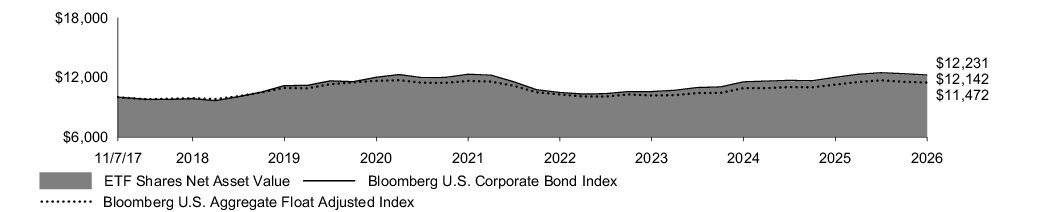
How did the Fund perform since inception?
Keep in mind that the Fund's past performance does not indicate how the Fund will perform in the future. Updated performance information is available on our website at vanguard.com/performance or by calling Vanguard toll-free at 800-662-7447. The graph and returns shown do not reflect taxes that a shareholder would pay on fund distributions or on the sale of fund shares.
Cumulative Performance: November 7, 2017, Through August 31, 2026
Initial Investment of $10,000
| Average Annual Total Returns | |||
| 1 Year | 5 Years | Since Inception (11/7/2017) |
|
| ETF Shares Net Asset Value | 1.94% | -0.15% | 2.23% |
| ETF Shares Market Price | 1.89% | -0.17% | 2.22% |
| Bloomberg U.S. Corporate Bond Index | 1.94% | -0.12% | 2.31% |
| Bloomberg U.S. Aggregate Float Adjusted Index | 1.84% | -0.29% | 1.57% |
| Fund Statistics (as of August 31, 2026) |
|
| Fund Net Assets (in millions) |
$1,703 |
| Number of Portfolio Holdings | 5,322 |
| Portfolio Turnover Rate | 53% |
| Total Investment Advisory Fees (in thousands) |
$57 |
| Portfolio Composition % of Net Assets (as of August 31, 2026) |
|
| Communications | 8.3% |
| Consumer Discretionary | 6.7% |
| Consumer Staples | 5.1% |
| Energy | 6.8% |
| Financials | 28.3% |
| Health Care | 11.2% |
| Industrials | 6.7% |
| Materials | 2.9% |
| Real Estate | 3.5% |
| Technology | 8.5% |
| Utilities | 10.0% |
| U.S. Government and Agency Obligations | 0.2% |
| Other Assets and Liabilities—Net | 1.8% |
| This table reflects the Fund’s investments, including short-term investments, derivatives and other assets and liabilities. | |
What were the Fund costs for the last year?
(based on a hypothetical $10,000 investment)
| Share Class Name | Costs of a $10,000 investment | Costs paid as a percentage of a $10,000 investment |
| ETF Shares | $5 | 0.05% |
How did the Fund perform during the reporting period?
-
For the 12 months ended August 31, 2026, the Fund performed roughly in line with its benchmark.
-
Global equities posted strong returns, while global bonds struggled. Resilient growth and corporate earnings supported stocks, though shifting U.S. trade policy, persistent inflation, and Middle East tensions that disrupted energy supplies and raised oil prices fueled volatility.
-
Some central banks, including those in the United States and the United Kingdom, lowered rates. However, developed-market government bond yields generally rose amid concerns about borrowing, inflation, and monetary policy.
-
Bonds from the United States, by far the largest component in the index, outperformed the index as a whole. Canada, the United Kingdom, and France were also among the outperformers. Japan, South Korea, and Thailand posted negative returns.
-
Within the Fund's benchmark, Treasuries, agency fixed-rate bonds, and industrial company bonds returned the most. By credit quality, results were mixed. By maturity, shorter-dated bonds outperformed their longer-dated counterparts.
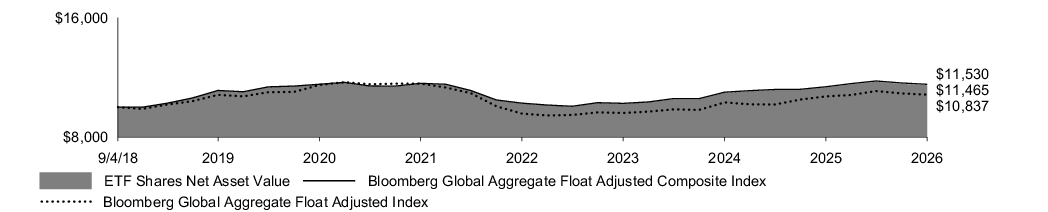
How did the Fund perform since inception?
Keep in mind that the Fund's past performance does not indicate how the Fund will perform in the future. Updated performance information is available on our website at vanguard.com/performance or by calling Vanguard toll-free at 800-662-7447. The graph and returns shown do not reflect taxes that a shareholder would pay on fund distributions or on the sale of fund shares.
Cumulative Performance: September 4, 2018, Through August 31, 2026
Initial Investment of $10,000
| Average Annual Total Returns | |||
| 1 Year | 5 Years | Since Inception (9/4/2018) |
|
| ETF Shares Net Asset Value | 1.33% | -0.16% | 1.73% |
| ETF Shares Market Price | 1.35% | -0.16% | 1.73% |
| Bloomberg Global Aggregate Float Adjusted Composite Index | 1.44% | -0.12% | 1.80% |
| Bloomberg Global Aggregate Float Adjusted Index | 1.08% | -1.32% | 1.01% |
| Fund Statistics (as of August 31, 2026) |
|
| Fund Net Assets (in millions) |
$1,891 |
| Number of Portfolio Holdings | 3 |
| Portfolio Turnover Rate | 7% |
| Total Investment Advisory Fees (in thousands) |
$0 |
| Portfolio Composition % of Net Assets (as of August 31, 2026) |
|
| Vanguard Total Bond Market ETF | 51.1% |
| Vanguard Total International Bond ETF | 48.9% |
| Other Assets and Liabilities—Net | 0.0% |
| This table reflects the Fund’s investments, including short-term investments and other assets and liabilities. | |