Exhibit 99.2
electrabrain.ai October 30, 2026
Disclaimer 2 About this Presentation This investor presentation (this "Presentation") is provided for informational purposes only and has been prepared to assist interested parties in making their own evaluation with respect to a potential business combination (the "Business Combination") between Electra Vehicles, Inc. (the "Company") and Iron Horse Acquisition II Corp. ("IRHO") and related transactions and for no other purpose. The information contained herein does not purport to be all-inclusive and none of IRHO, the Company or their respective representatives or affiliates makes any representation or warranty, express or implied, as to the accuracy, completeness or reliability of the information contained in this Presentation. This Presentation does not constitute (i) a solicitation of a proxy, consent or authorization with respect to any securities or in respect of the proposed Business Combination or (ii) an offer to sell, a solicitation of an offer to buy, or a recommendation to purchase any securities. No such offering of securities shall be made except by means of a prospectus meeting the requirements of section 10 of the Securities Act of 1933, as amended, or an exemption therefrom. You should not construe the contents of this Presentation as legal, tax, accounting or investment advice or a recommendation. You should consult your own counsel and tax and financial advisors as to legal and related matters concerning the matters described herein, and, by accepting this Presentation, you confirm that you are not relying upon the information contained herein to make any decision. The distribution of this Presentation may also be restricted by law and persons into whose possession this Presentation comes should inform themselves about and observe any such restrictions. The recipient acknowledges that it is (a) aware that the United States securities laws prohibit any person who has material, non-public information concerning a company from purchasing or selling securities of such company or from communicating such information to any other person under circumstances in which it is reasonably foreseeable that such person is likely to purchase or sell such securities, and (b) familiar with the Securities Exchange Act of 1934, as amended, and the rules and regulations promulgated thereunder (collectively, the "Exchange Act"), and that the recipient will neither use, nor cause any third party to use, this Presentation or any information contained herein in contravention of the Exchange Act, including, without limitation, Rule 10b-5 thereunder. This Presentation and information contained herein constitutes confidential information and is provided to you on the condition that you agree that you will hold it in strict confidence and not reproduce, disclose, forward or distribute it in whole or in part without the prior written consent of the Company and is intended for the recipient hereof only. Forward Looking Statements This Presentation contains certain forward-looking statements with respect to the proposed Business Combination. Forward-looking statements generally relate to future events or the Company's future financial or operating performance. For example, statements regarding anticipated growth in the industry in which the Company operates and anticipated growth in demand for the Company's products and services, the satisfaction of closing conditions to the Business Combination and the timing of the completion of the Business Combination are forward-looking statements. In some cases, you can identify forward-looking statements by terminology such as "pro forma", "may", "should", "could", "might", "plan", "possible", "project", "strive", "budget", "forecast", "expect", "intend", "will", "estimate", "anticipate", "believe", "predict", "potential" or "continue", or the negatives of these terms or variations of them or similar terminology. Such forward-looking statements are subject to risks, uncertainties, and other factors which could cause actual results to differ materially from those expressed or implied by such forward looking statements. These forward-looking statements are based upon estimates and assumptions that, while considered reasonable by the Company and its management, as the case may be, are inherently uncertain. Factors that may cause actual results to differ materially from current expectations include, but are not limited to: competition, the ability of the Company to grow and manage growth, maintain relationships with customers and retain its management and key employees; costs related to the Business Combination; changes in applicable laws or regulations; the possibility that the Company may be adversely affected by other economic, business or competitive factors; the Company's estimates of expenses and profitability; the evolution of the markets in which the Company competes; the ability of the Company to implement its strategic initiatives and continue to innovate its existing products and services. Nothing in this Presentation should be regarded as a representation by any person that the forward-looking statements set forth herein will be achieved or that any of the contemplated results of such forward-looking statements will be achieved. You should not place undue reliance on forward-looking statements, which speak only as of the date they are made. The Company undertakes no duty to update these forward-looking statements. Financial Information The financial information and data contained in this Presentation is unaudited and does not conform to Regulation S-X. Such information and data may not be included in, may be adjusted in or may be presented differently in the registration statement to be filed relating to the Business Combination and the proxy statement/prospectus contained therein. Industry and Market Data In this Presentation, the Company relies on and refer to certain information and statistics obtained from third-party sources which the Company believes to be reliable. The Company has not independently verified the accuracy or completeness of any such third-party information.
Disclaimer (cont'd) 3 Use of Projections This Presentation contains financial forecasts, projections and other forward-looking financial information with respect to the Company, including expected contribution margins, net cash, pro forma enterprise value and pipeline conversion (collectively, the "Projections"). Neither IRHO's nor the Company's independent auditors have audited, reviewed, compiled or performed any procedures with respect to the Projections for the purpose of their inclusion in this Presentation, and accordingly, neither of them has expressed an opinion or provided any other form of assurance with respect thereto. The Projections were not prepared with a view toward public disclosure or compliance with the published guidelines of the SEC, the guidelines established by the American Institute of Certified Public Accountants for preparation and presentation of prospective financial information, or GAAP. The Projections are based on numerous assumptions, estimates and judgments made by management, including with respect to pipeline conversion rates, customer deployment timing, pricing and cost structure, which are inherently uncertain and subject to significant business, economic, competitive and regulatory risks and uncertainties that could cause actual results to differ materially from those contained in the Projections. The pro forma enterprise value presented herein is illustrative only, is based on assumptions regarding the terms of the Business Combination, redemptions by IRHO shareholders and other transaction-related matters, and may differ materially from the actual value of the combined company following the closing. Pipeline conversion figures reflect management's assessment of opportunities at various stages of the sales process and should not be construed as contracted or committed revenue. The inclusion of the Projections in this Presentation should not be regarded as a representation by any person that the results reflected in the Projections will be achieved. Neither IRHO nor the Company undertakes any obligation to update the Projections or to disclose any changes in circumstances occurring after the date of this Presentation. Projections and related assumptions may be presented differently, or omitted, in the Registration Statement. Non-GAAP Financial Measures This Presentation includes certain financial measures that are not calculated in accordance with GAAP, including contribution margin, net cash and pro forma enterprise value (the "Non-GAAP Measures"). The Company believes the Non-GAAP Measures provide useful information to investors regarding the Company's financial condition and results of operations and are used by management for operational and financial decision-making. However, the Non-GAAP Measures are supplemental to, and not a substitute for, financial measures prepared in accordance with GAAP, and may be defined and calculated differently by other companies, limiting their comparability. The Company does not provide reconciliations of forward-looking Non-GAAP Measures to the most directly comparable GAAP measures because certain reconciling items cannot be reasonably predicted without unreasonable efforts; such items could be material to the Company's results computed in accordance with GAAP. You should review the Company's historical audited financial statements, when included in the Registration Statement, and not rely on any single financial measure to evaluate the Company's business. Performance Claims and Industry Benchmarks. ELECTRA AI's estimation accuracy figures for State of Charge (SoC), State of Health (SoH) and State of Power (SoP) are drawn from internal validation tests conducted on customers and laboratory data, with results reviewed with the respective customers. They reflect the mean estimation error of ELECTRA AI's models against reference measurements on specific datasets and battery chemistries, represent the best results observed, and may be higher on other datasets. Other performance figures in this presentation and fault prediction lead times, are illustrative. They are calculated by ELECTRA AI using internal models, with the validated accuracy figures as their calculation basis, and represent best-case scenarios under specific assumptions. These modeled figures combine SoH and Remaining Useful Life (RUL) estimation, fault detection and prediction, and optimization recommendations, generated through statistical and physics-informed machine learning calculations. They are not measured field results, have not been independently verified, and are not representative of typical outcomes. Their underlying assumptions have not been verified in field deployments and have been benchmarked only against comparable market research and published studies. ELECTRA AI detects faults, and prediction ahead of failure is possible only in a limited number of cases; "up to 3 months" reflects the maximum lead time observed in a limited internal retrospective analysis, and typical lead times are shorter. Industry benchmark figures for conventional onboard battery management systems (BMS) are drawn from third-party published sources, including China's national BMS technical requirements for electric vehicles, trade and technical literature (Motor, May 2026; Engineer Live), and peer-reviewed research (Journal of Power Sources, 2017; MDPI Processes, 2023). These benchmarks are not the result of head-to-head testing by ELECTRA AI on the same batteries, datasets, or conditions, use differing error definitions and methodologies, and are indicative only. Actual results depend on battery chemistry, application, data quality, operating conditions, and customer adoption of recommendations, and may differ materially. These statements are forward-looking and subject to the risks described in the Registration Statement on Form S-4.
4 Trademarks This Presentation may contain trademarks, service marks, trade names and copyrights of other companies, which are the property of their respective owners. Solely for convenience, some of the trademarks, service marks, trade names and copyrights referred to in this Presentation may be listed without the TM, SM © or ® symbols, but the Company will assert, to the fullest extent under applicable law, the rights of the applicable owners, if any, to these trademarks, service marks, trade names and copyrights. Important Information for Investors and Stockholders This Presentation relates to a proposed transaction between IRHO and the Company. This Presentation does not constitute an offer to sell or exchange, or the solicitation of an offer to buy or exchange, any securities, nor shall there be any sale of securities in any jurisdiction in which such offer, sale or exchange would be unlawful prior to registration or qualification under the securities laws of any such jurisdiction. The Business Combination will be submitted to shareholders of IRHO for their consideration. IRHO and the Company have filed a registration statement on Form S-4 (the "Registration Statement") – Registration Number: 333-286047 - with the Securities and Exchange Commission (the "SEC"), which includes a preliminary proxy statement/prospectus (a "Proxy Statement/Prospectus"). A definitive Proxy Statement/Prospectus will be mailed to IRHO's shareholders as of a record date to be established for voting on the Business Combination and other proposals. IRHO may also file other relevant documents regarding the Business Combination with the SEC. IRHO's shareholders and other interested persons are advised to read, once available, the preliminary Proxy Statement/Prospectus and any amendments thereto and, once available, the definitive Proxy Statement/Prospectus, in connection with IRHO's solicitation of proxies for its extraordinary meeting of shareholders to be held to approve, among other things, the Business Combination, because these documents will contain important information about IRHO, the Company and the Business Combination. Shareholders may also obtain a copy of the preliminary or definitive Proxy Statement/Prospectus, once available, as well as other documents filed with the SEC regarding the Business Combination and other documents filed with the SEC by IRHO, without charge, at the SEC's website located at www.sec.gov or by directing a request to: IRHO's Chief Executive Officer at 851 Broken Sound Parkway NW, Suite 230, Boca Raton, FL 33487. Participants in the Solicitation IRHO and the Company and certain of their respective directors, executive officers and other members of management and employees may be considered participants in the solicitation of proxies with respect to the Business Combination under the rules of the SEC. Information about (i) the directors and executive officers of IRHO is set forth in the IRHO Annual Report on Form 10-K for the year ended November 30, 2025, which was filed with the SEC on February 13, 2026, and (ii) a description of the interests of the directors and executive officers of IRHO and the Company, and the Business Combination, will be contained in the Registration Statement and the Proxy Statement/Prospectus when available, which documents can be obtained free of charge from the sources indicated above. This communication does not constitute an offer to sell or the solicitation of an offer to buy any securities or a solicitation of any vote or approval, nor shall there be any sale of any securities in any state or jurisdiction in which such offer, solicitation, or sale would be unlawful prior to registration or qualification under the securities laws of such other jurisdiction. Disclaimer (cont'd)
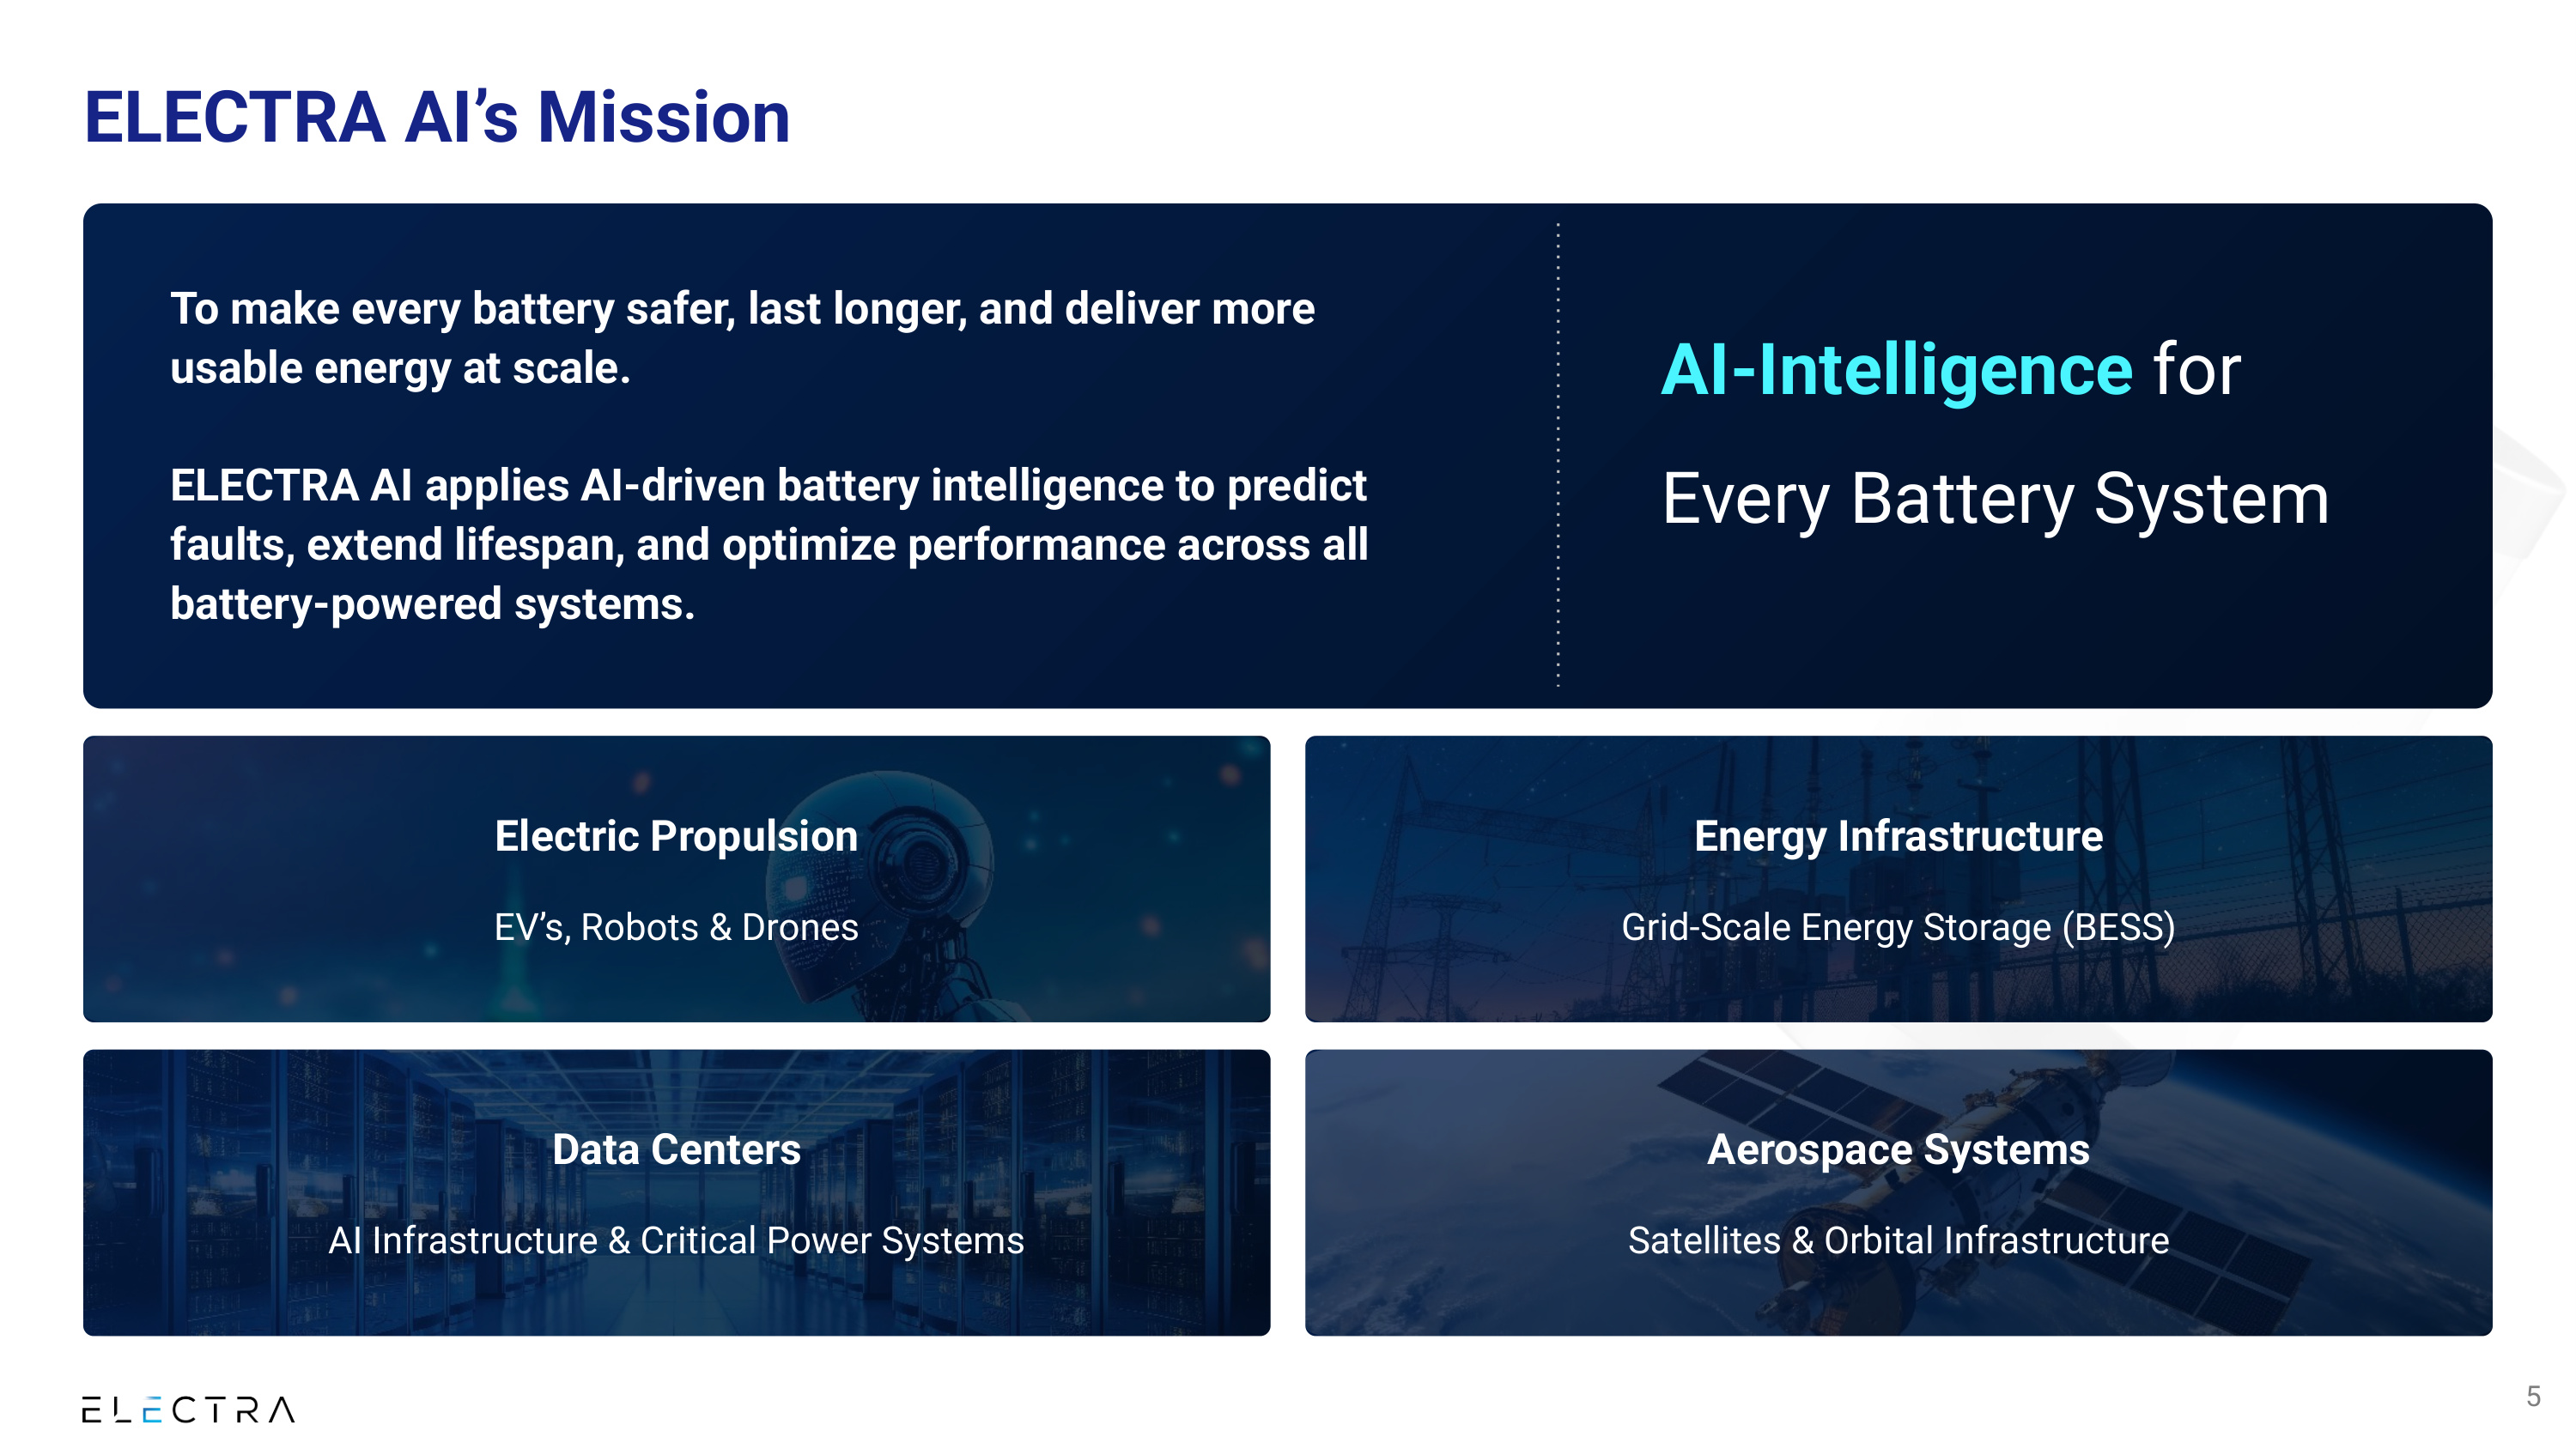
ELECTRA AI's Mission To make every battery safer, last longer, and deliver more usable energy at scale. ELECTRA AI applies AI-driven battery intelligence to predict faults, extend lifespan, and optimize performance across all battery-powered systems. AI-Intelligence for Every Battery System 5 Electric Propulsion EV's, Robots & Drones Energy Infrastructure Grid-Scale Energy Storage (BESS) Data Centers AI Infrastructure & Critical Power Systems Aerospace Systems Satellites & Orbital Infrastructure
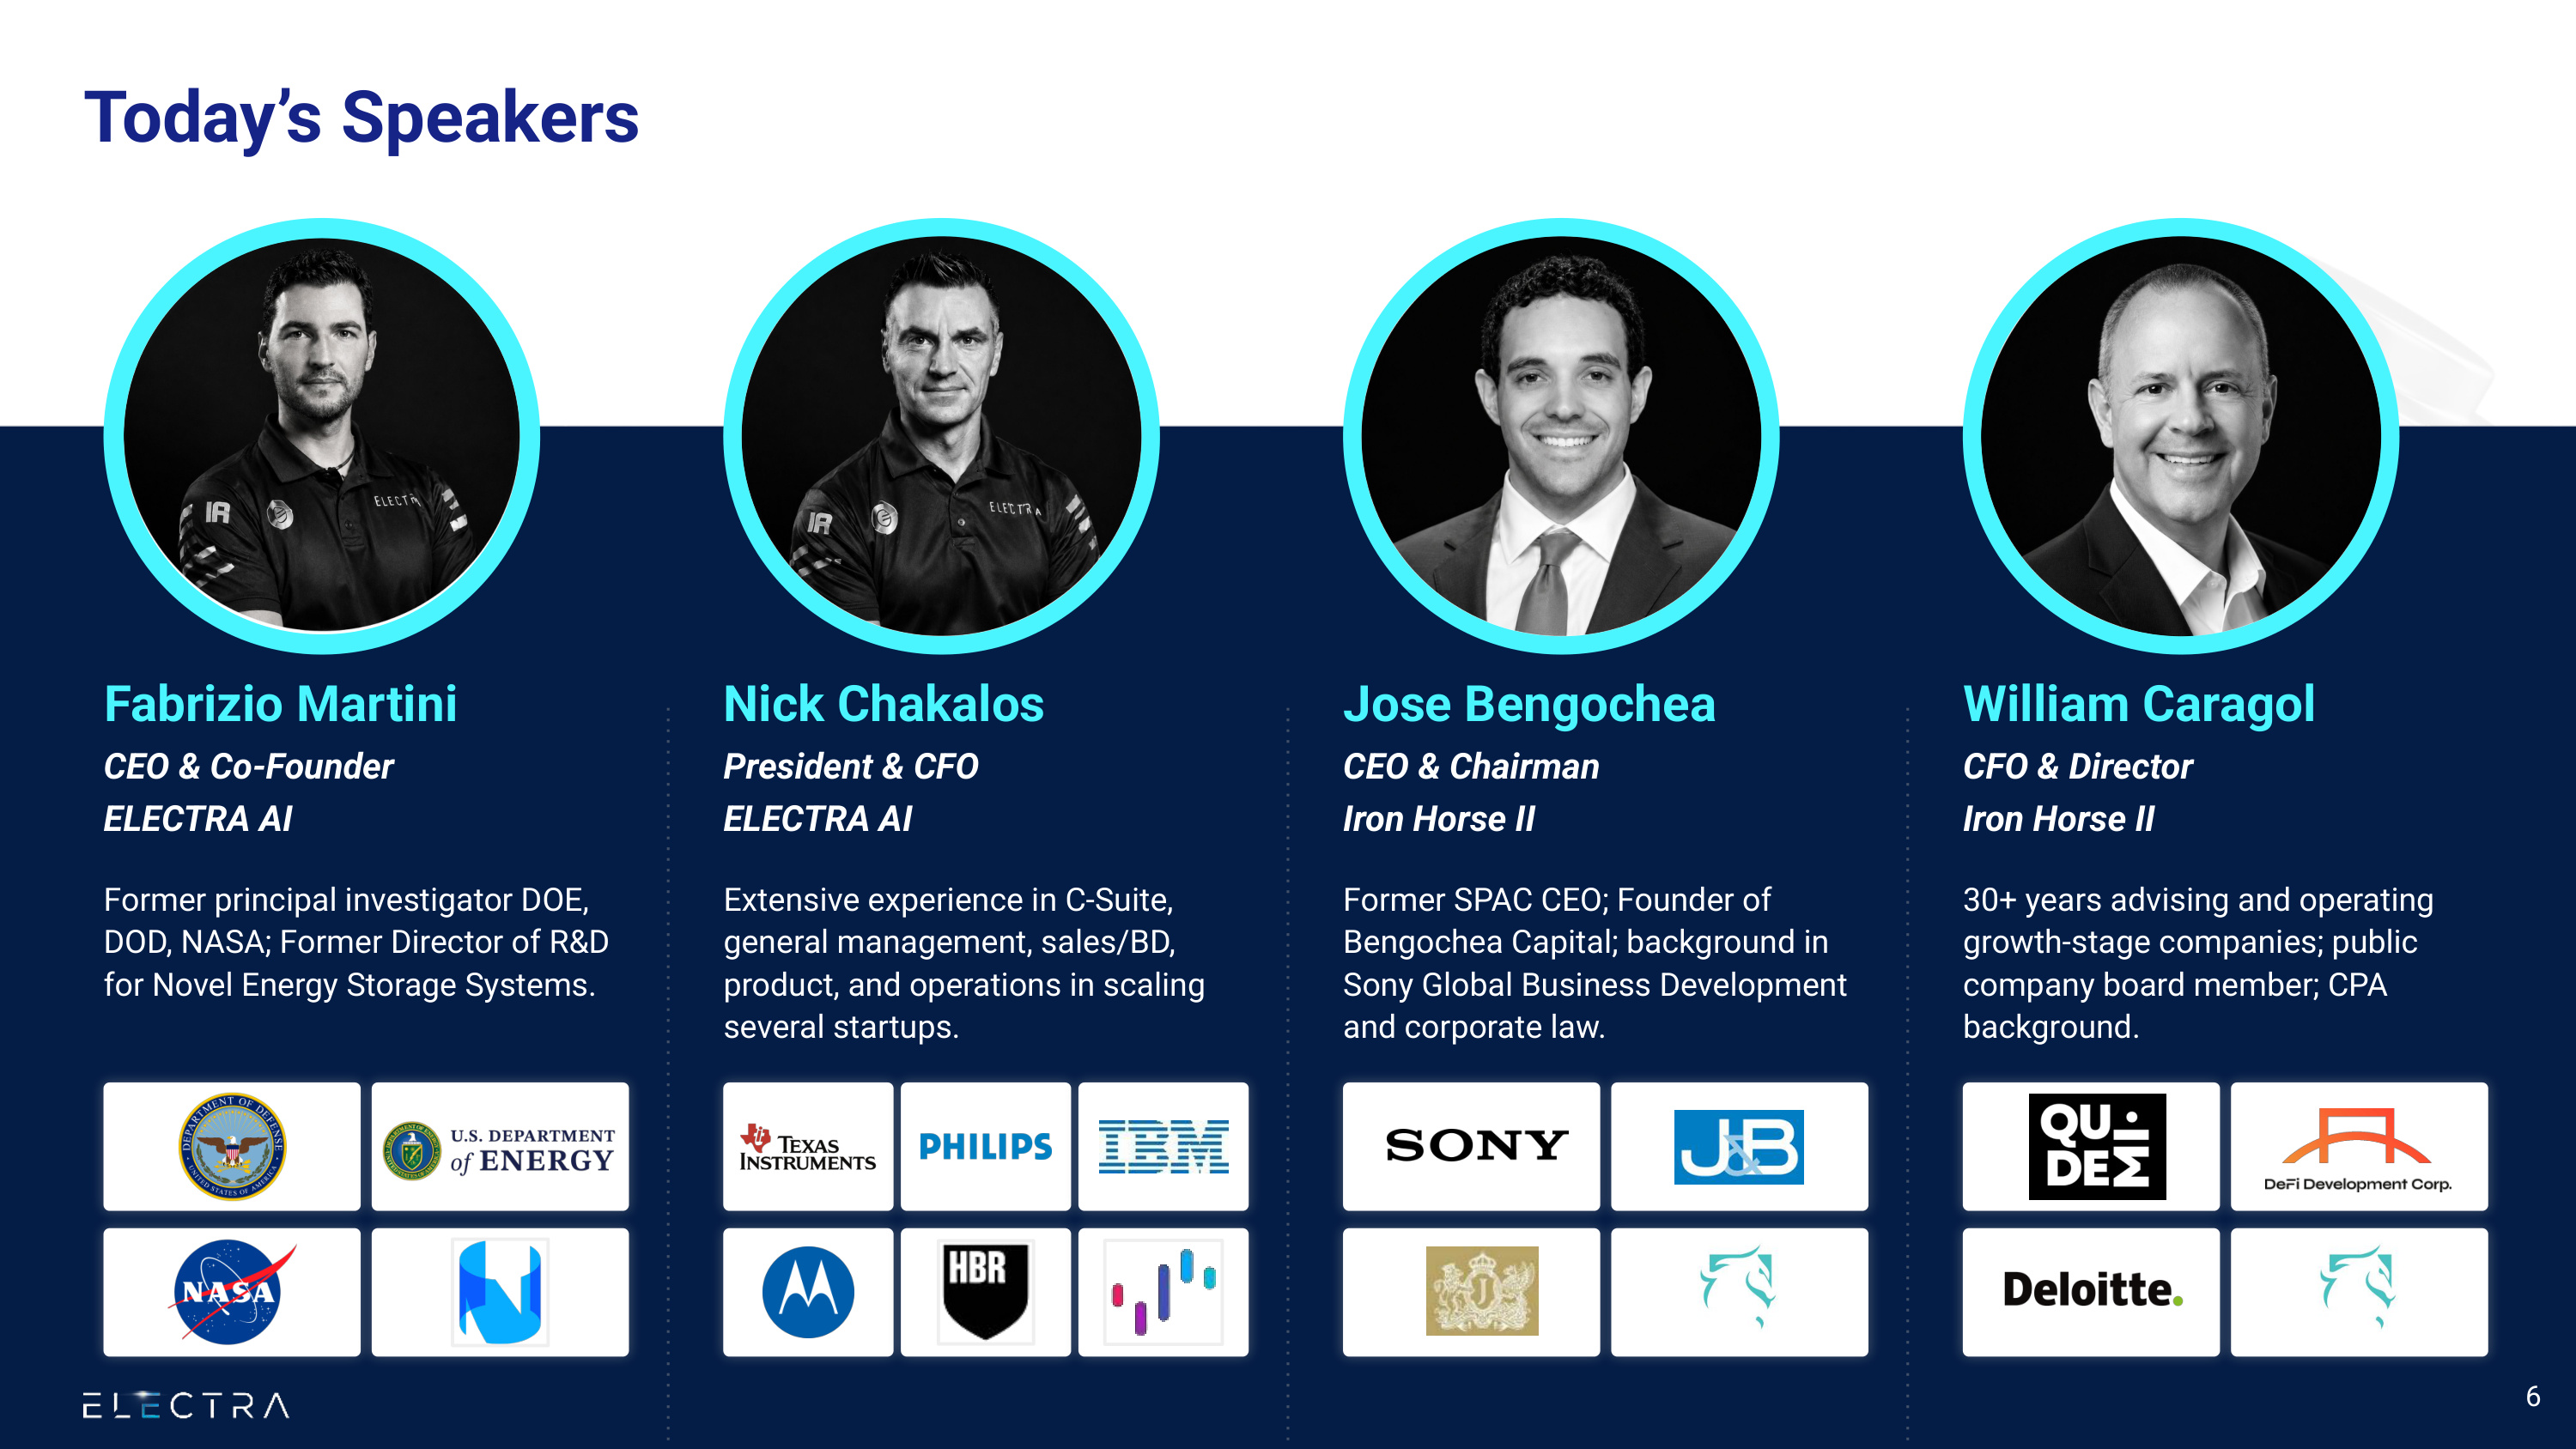
Today's Speakers Former principal investigator DOE, DOD, NASA; Former Director of R&D for Novel Energy Storage Systems. Former SPAC CEO; Founder of Bengochea Capital; background in Sony Global Business Development and corporate law. Extensive experience in C-Suite, general management, sales/BD, product, and operations in scaling several startups. 30+ years advising and operating growth-stage companies; public company board member; CPA background. Fabrizio Martini CEO & Co-Founder ELECTRA AI Jose Bengochea CEO & Chairman Iron Horse II Nick Chakalos President & CFO ELECTRA AI William Caragol CFO & Director Iron Horse II 6
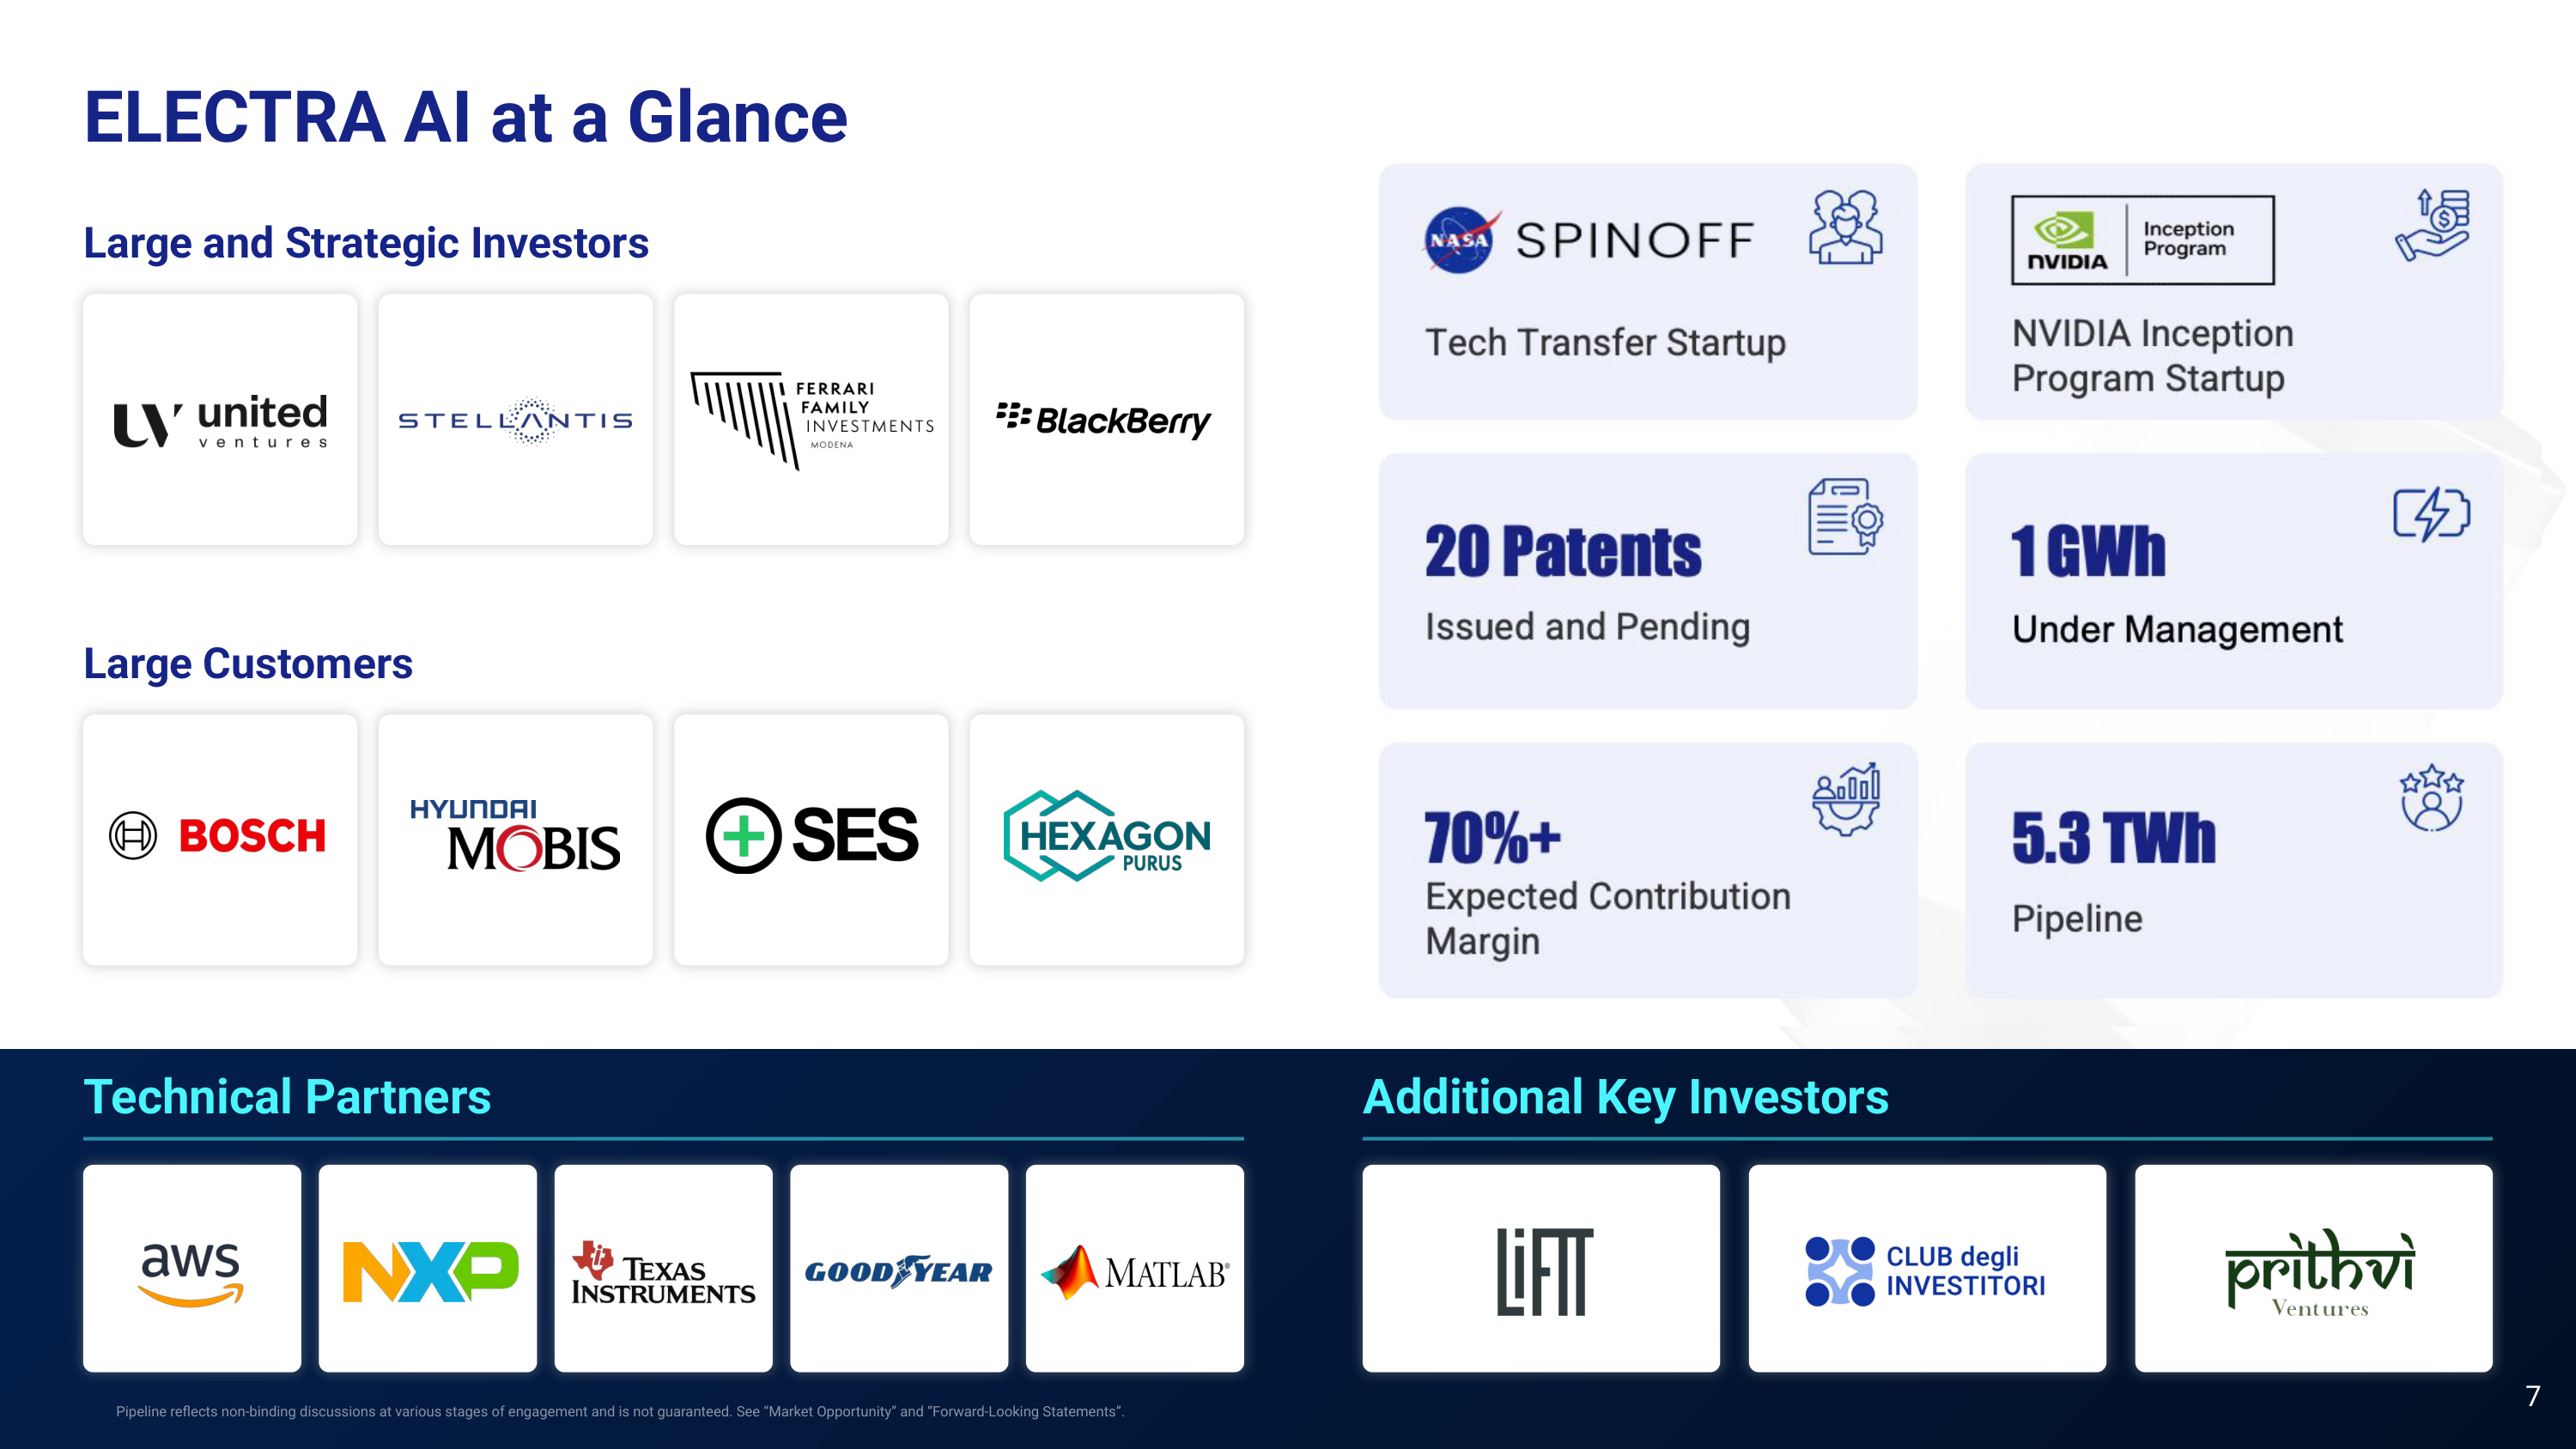
ELECTRA AI at a Glance Tech Transfer Startup NVIDIA Inception Program Startup 70%+ Expected Contribution Margin 5.3 TWh Pipeline Issued and Pending 1 GWh Batteries Controlled 20 Patents Technical Partners Additional Key Investors Large and Strategic Investors Large Customers 7 Pipeline reflects non-binding discussions at various stages of engagement and is not guaranteed. See "Market Opportunity" and "Forward-Looking Statements".

MARKET OPPORTUNITY
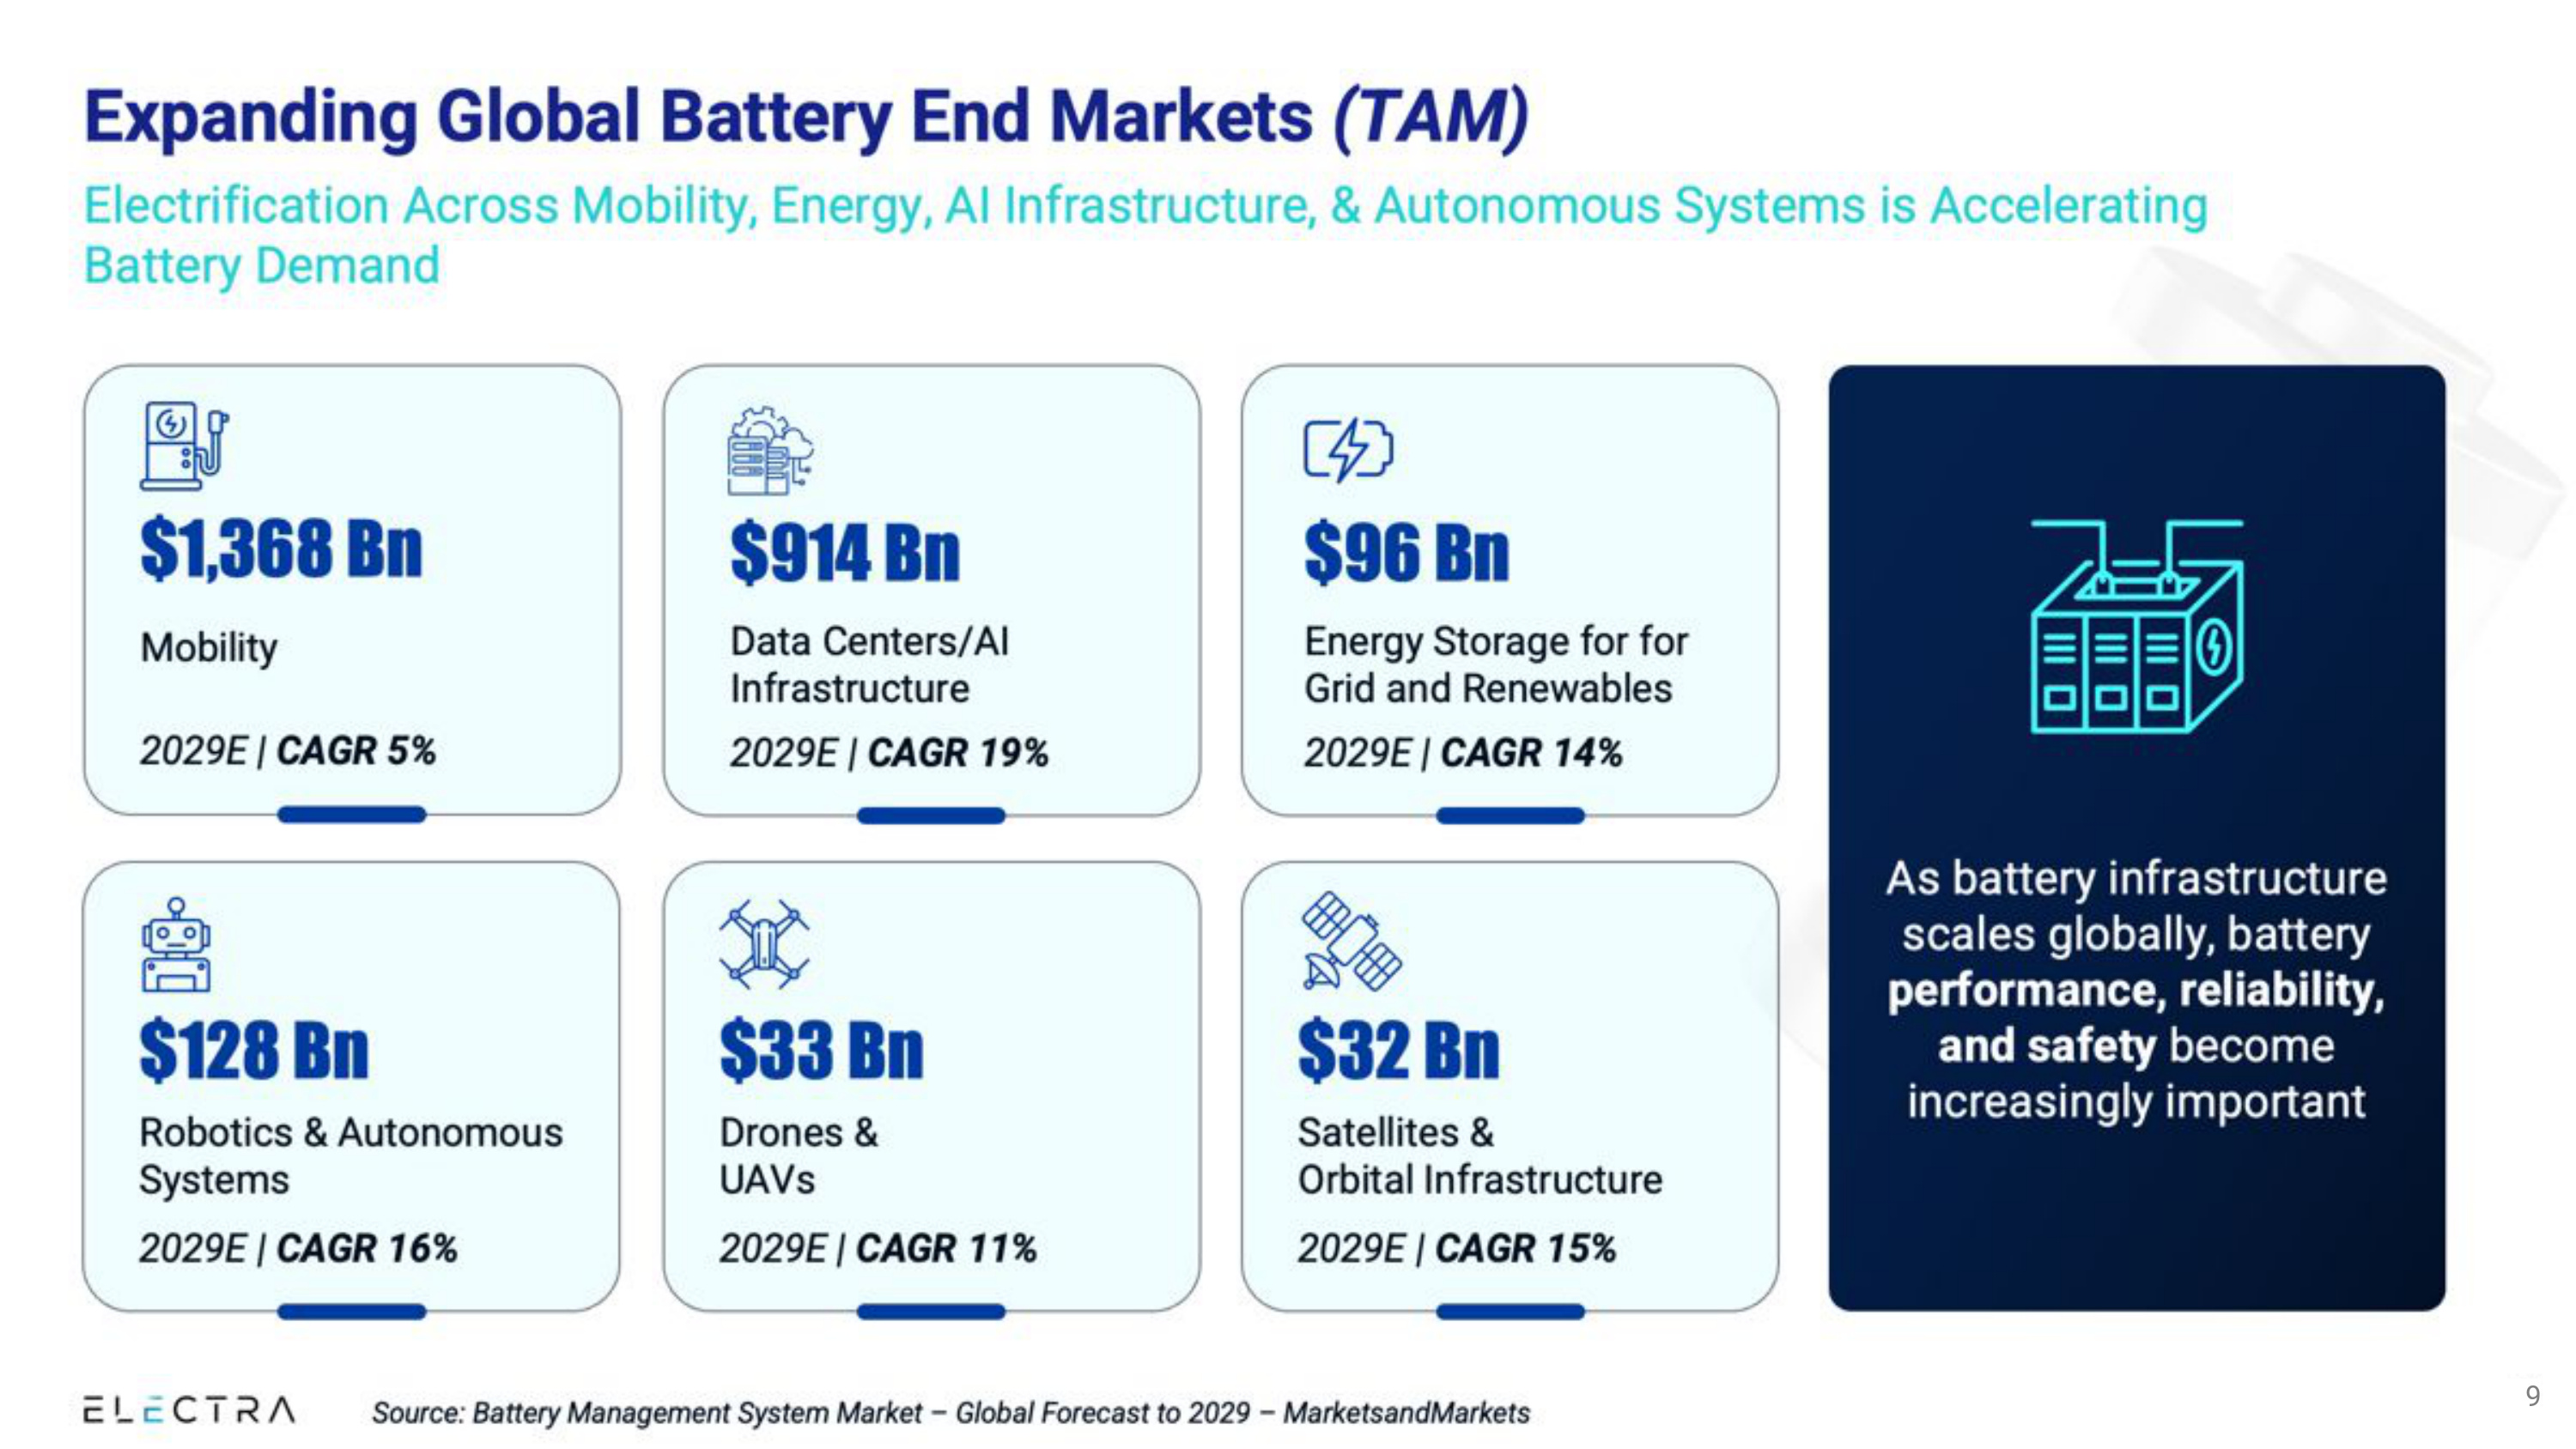
Expanding Global Battery End Markets (TAM) Electrification Across Mobility, Energy, AI Infrastructure, & Autonomous Systems is Accelerating Battery Demand 9 $128 Bn 2029E | CAGR 16% Robotics & Autonomous Systems $33 Bn 2029E | CAGR 11% Drones & UAVs $1,368 Bn 2029E | CAGR 5% Mobility $914 Bn 2029E | CAGR 19% Data Centers/AI Infrastructure $96 Bn 2029E | CAGR 14% $32 Bn 2029E | CAGR 15% Satellites & Orbital Infrastructure Energy Storage for for Grid and Renewables As battery infrastructure scales globally, battery performance, reliability, and safety become increasingly important Source: Battery Management System Market – Global Forecast to 2029 – MarketsandMarkets 9
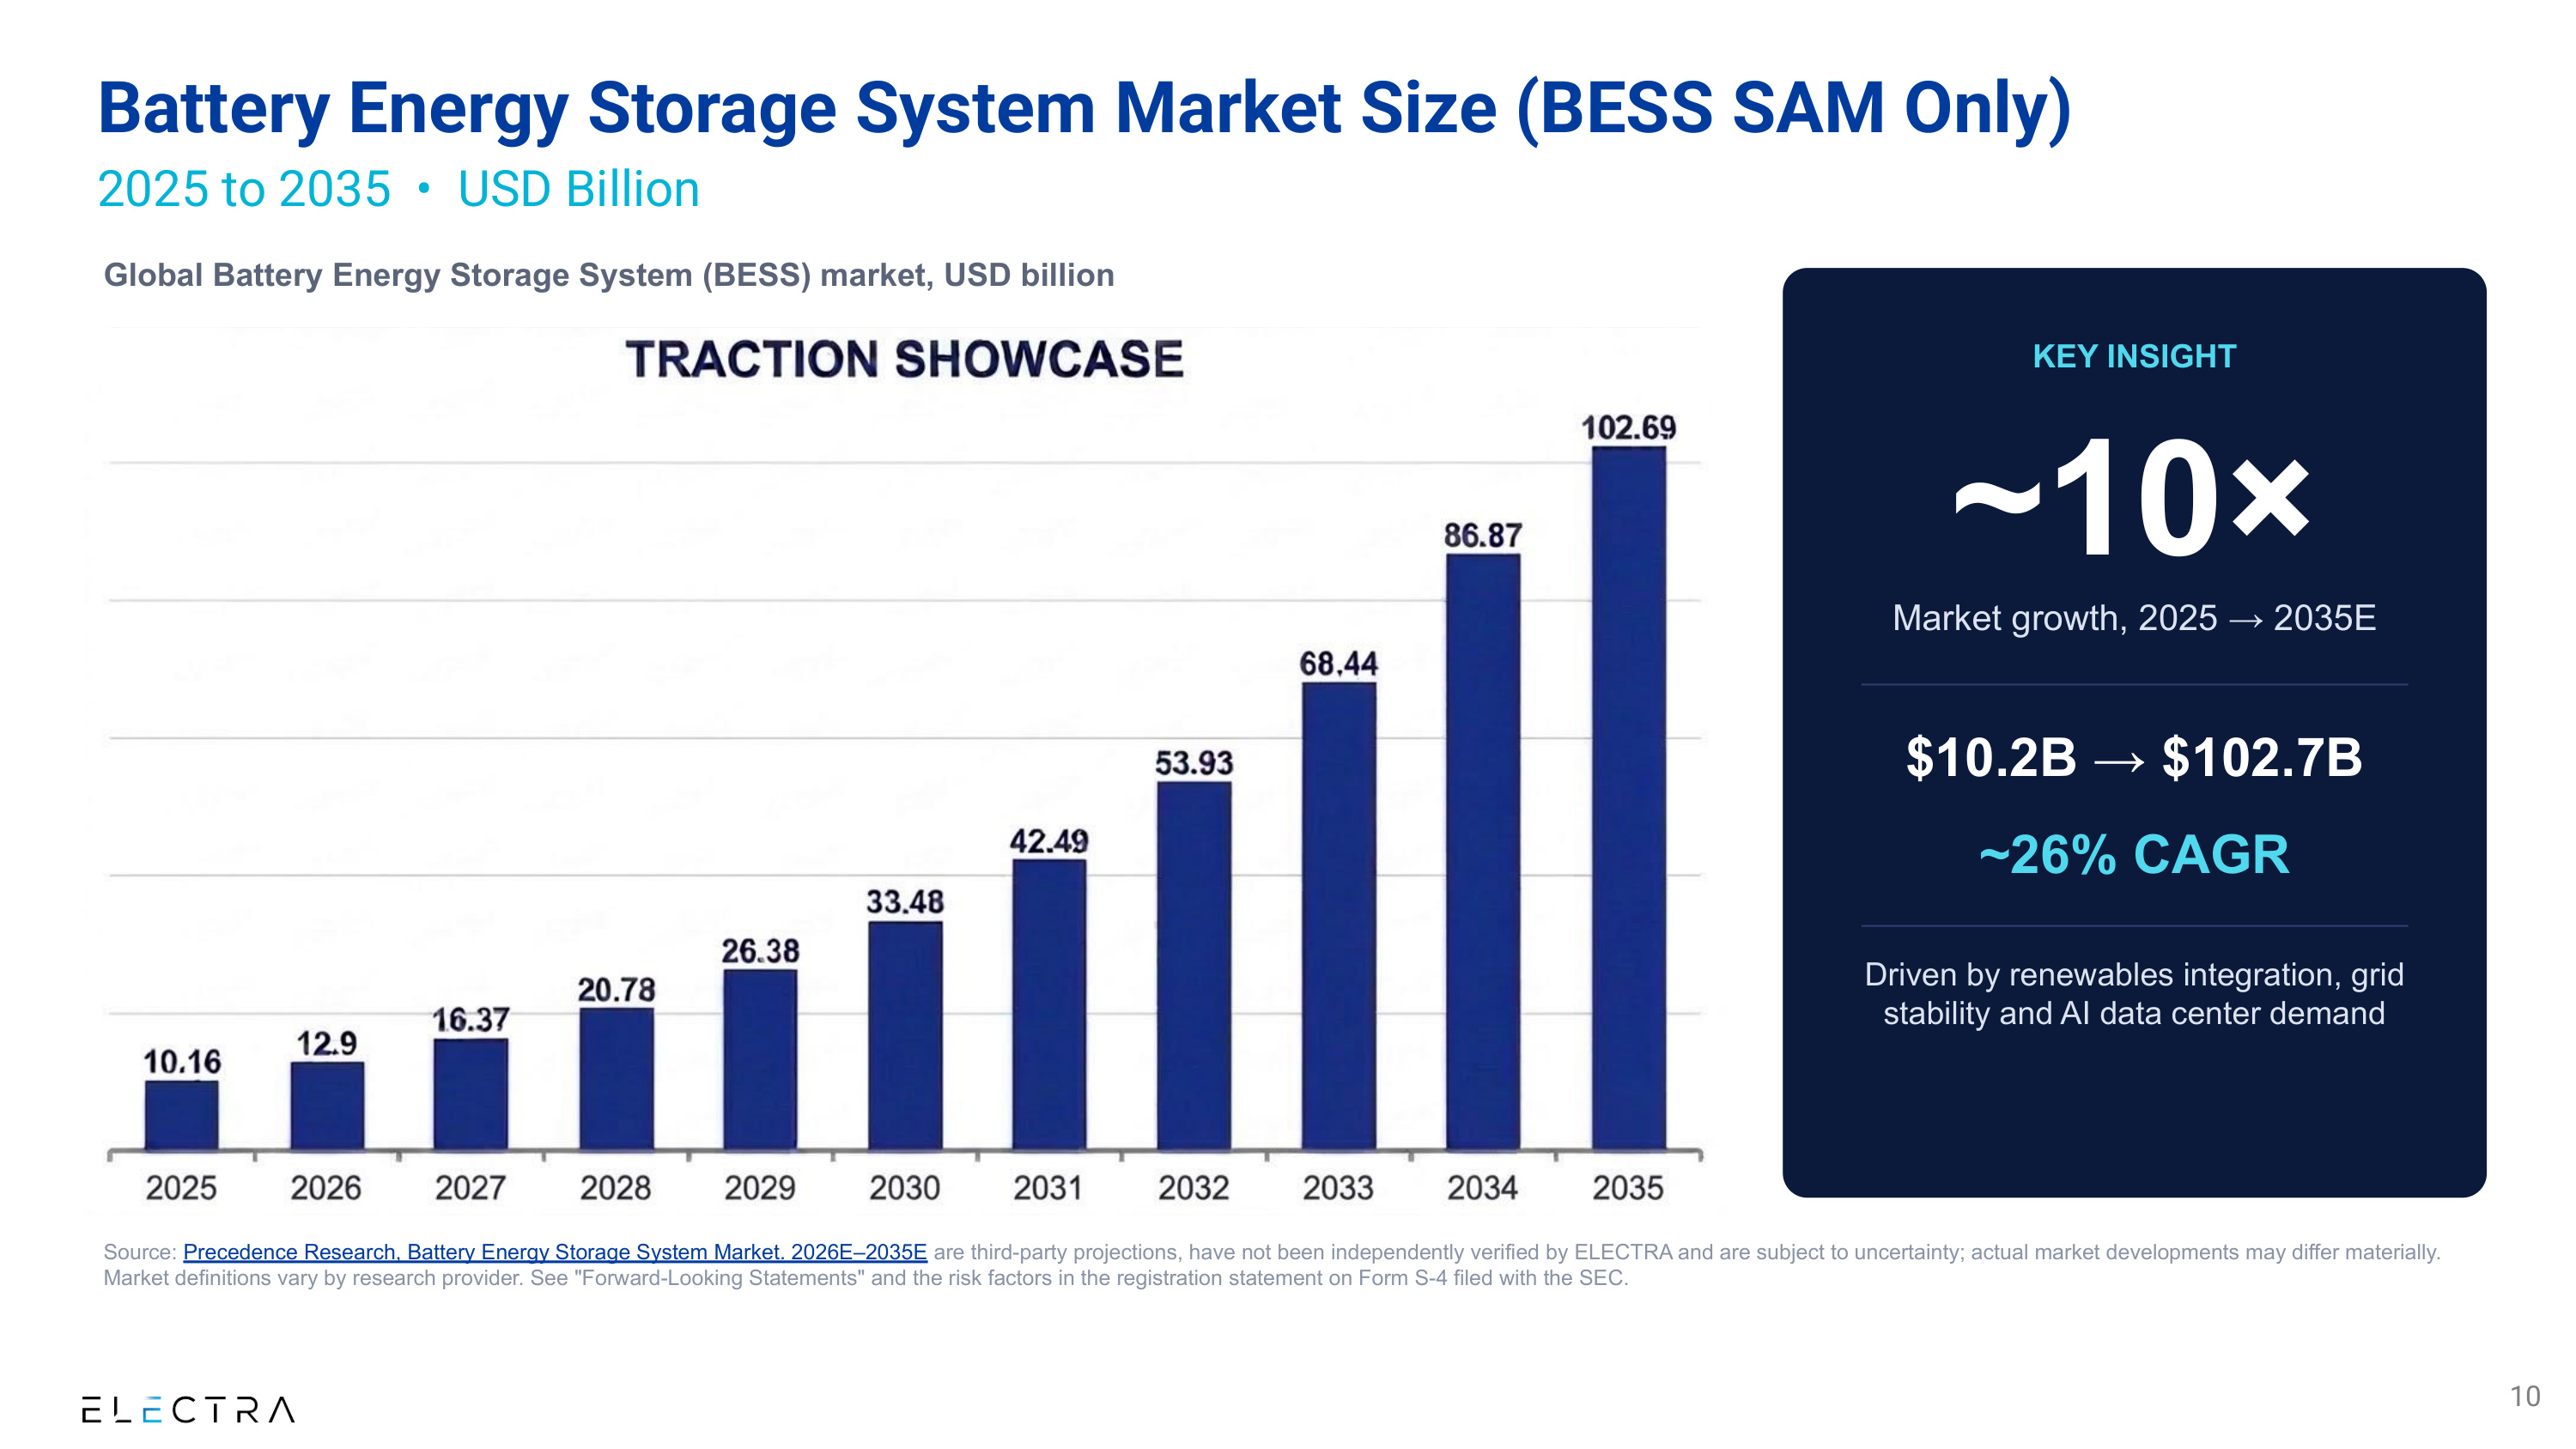
Battery Energy Storage System Market Size (BESS SAM Only) 2025 to 2035 • USD Billion Global Battery Energy Storage System (BESS) market, USD billion KEY INSIGHT ~10× Market growth, 2025 → 2035E $10.2B → $102.7B ~26% CAGR Driven by renewables integration, grid stability and AI data center demand Source: Precedence Research, Battery Energy Storage System Market. 2026E–2035E are third-party projections, have not been independently verified by ELECTRA and are subject to uncertainty; actual market developments may differ materially. Market definitions vary by research provider. See "Forward-Looking Statements" and the risk factors in the registration statement on Form S-4 filed with the SEC. 10
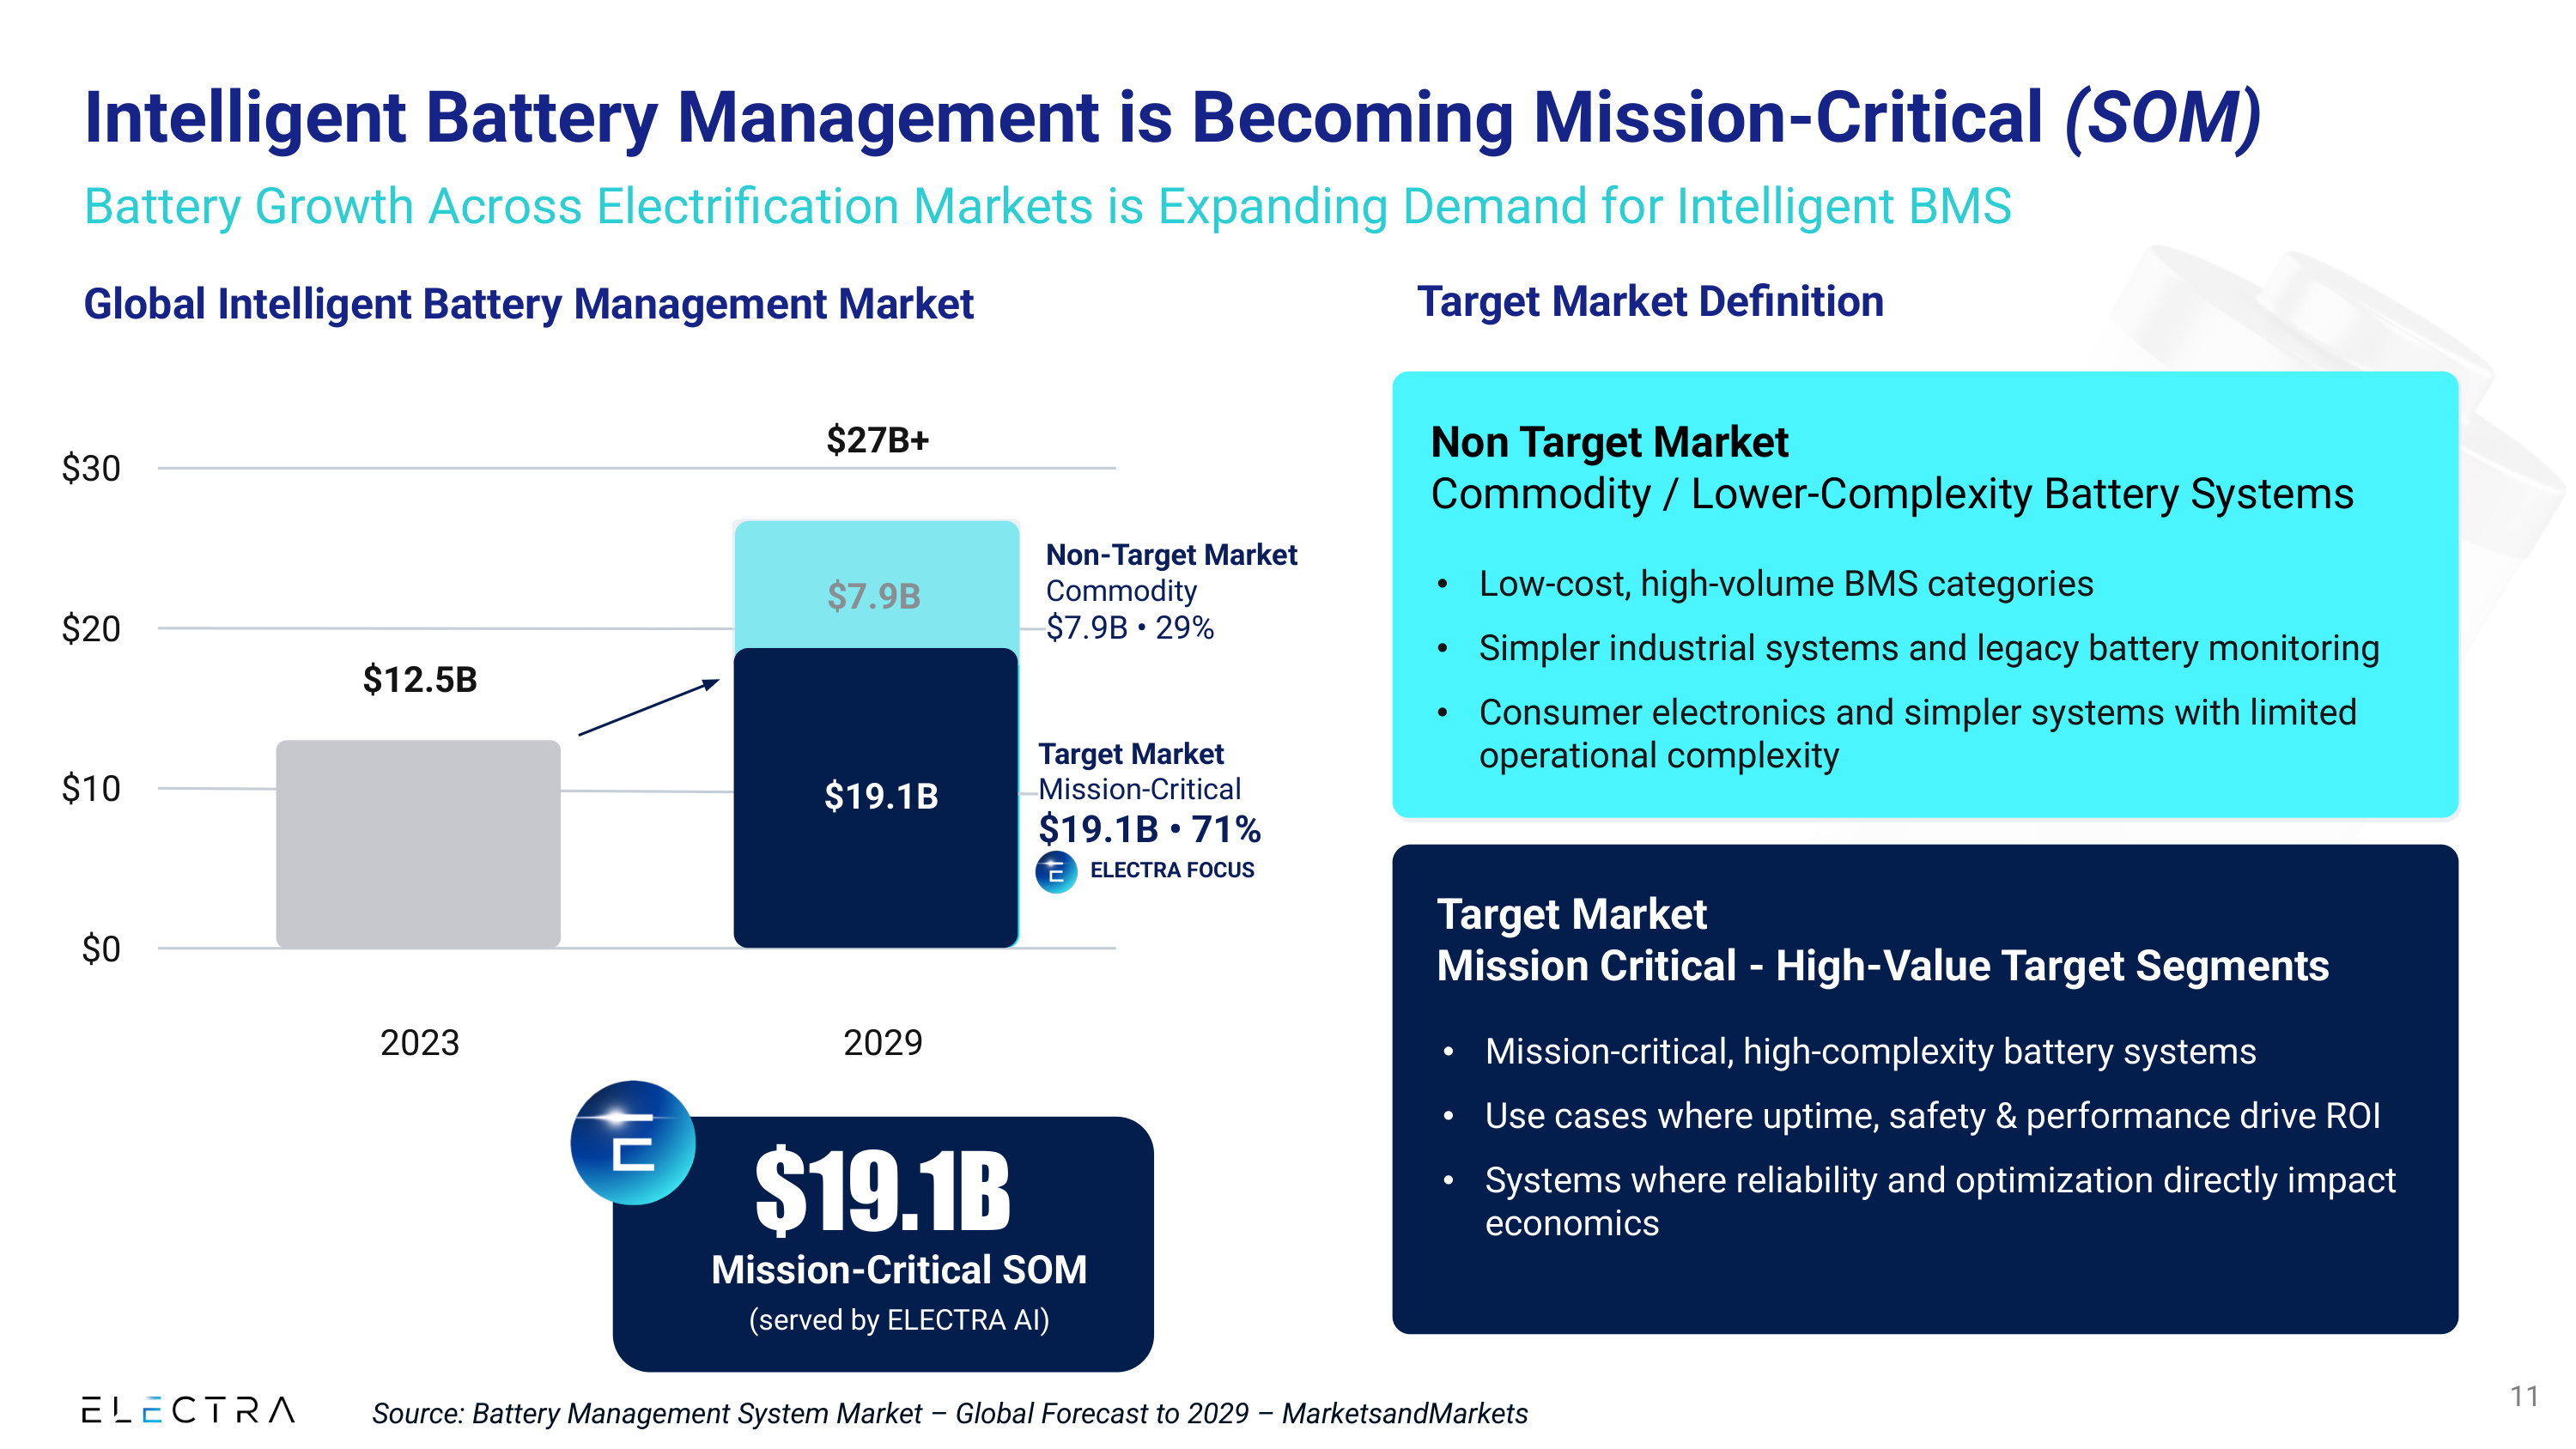
Intelligent Battery Management is Becoming Mission-Critical (SOM) Battery Growth Across Electrification Markets is Expanding Demand for Intelligent BMS 11 $12.5B $27B+ 2023 2029 $0 $10 $20 $30 Global Intelligent Battery Management Market Target Market Mission-Critical $19.1B • 71% Non-Target Market Commodity $7.9B • 29% $19.1B Mission-Critical SOM (served by ELECTRA AI) ELECTRA FOCUS $7.9B Non Target Market Commodity / Lower-Complexity Battery Systems • Low-cost, high-volume BMS categories • Simpler industrial systems and legacy battery monitoring • Consumer electronics and simpler systems with limited operational complexity Target Market Mission Critical - High-Value Target Segments • Mission-critical, high-complexity battery systems • Use cases where uptime, safety & performance drive ROI • Systems where reliability and optimization directly impact economics Target Market Definition $19.1B Source: Battery Management System Market – Global Forecast to 2029 – MarketsandMarkets

BUSINESS OVERVIEW
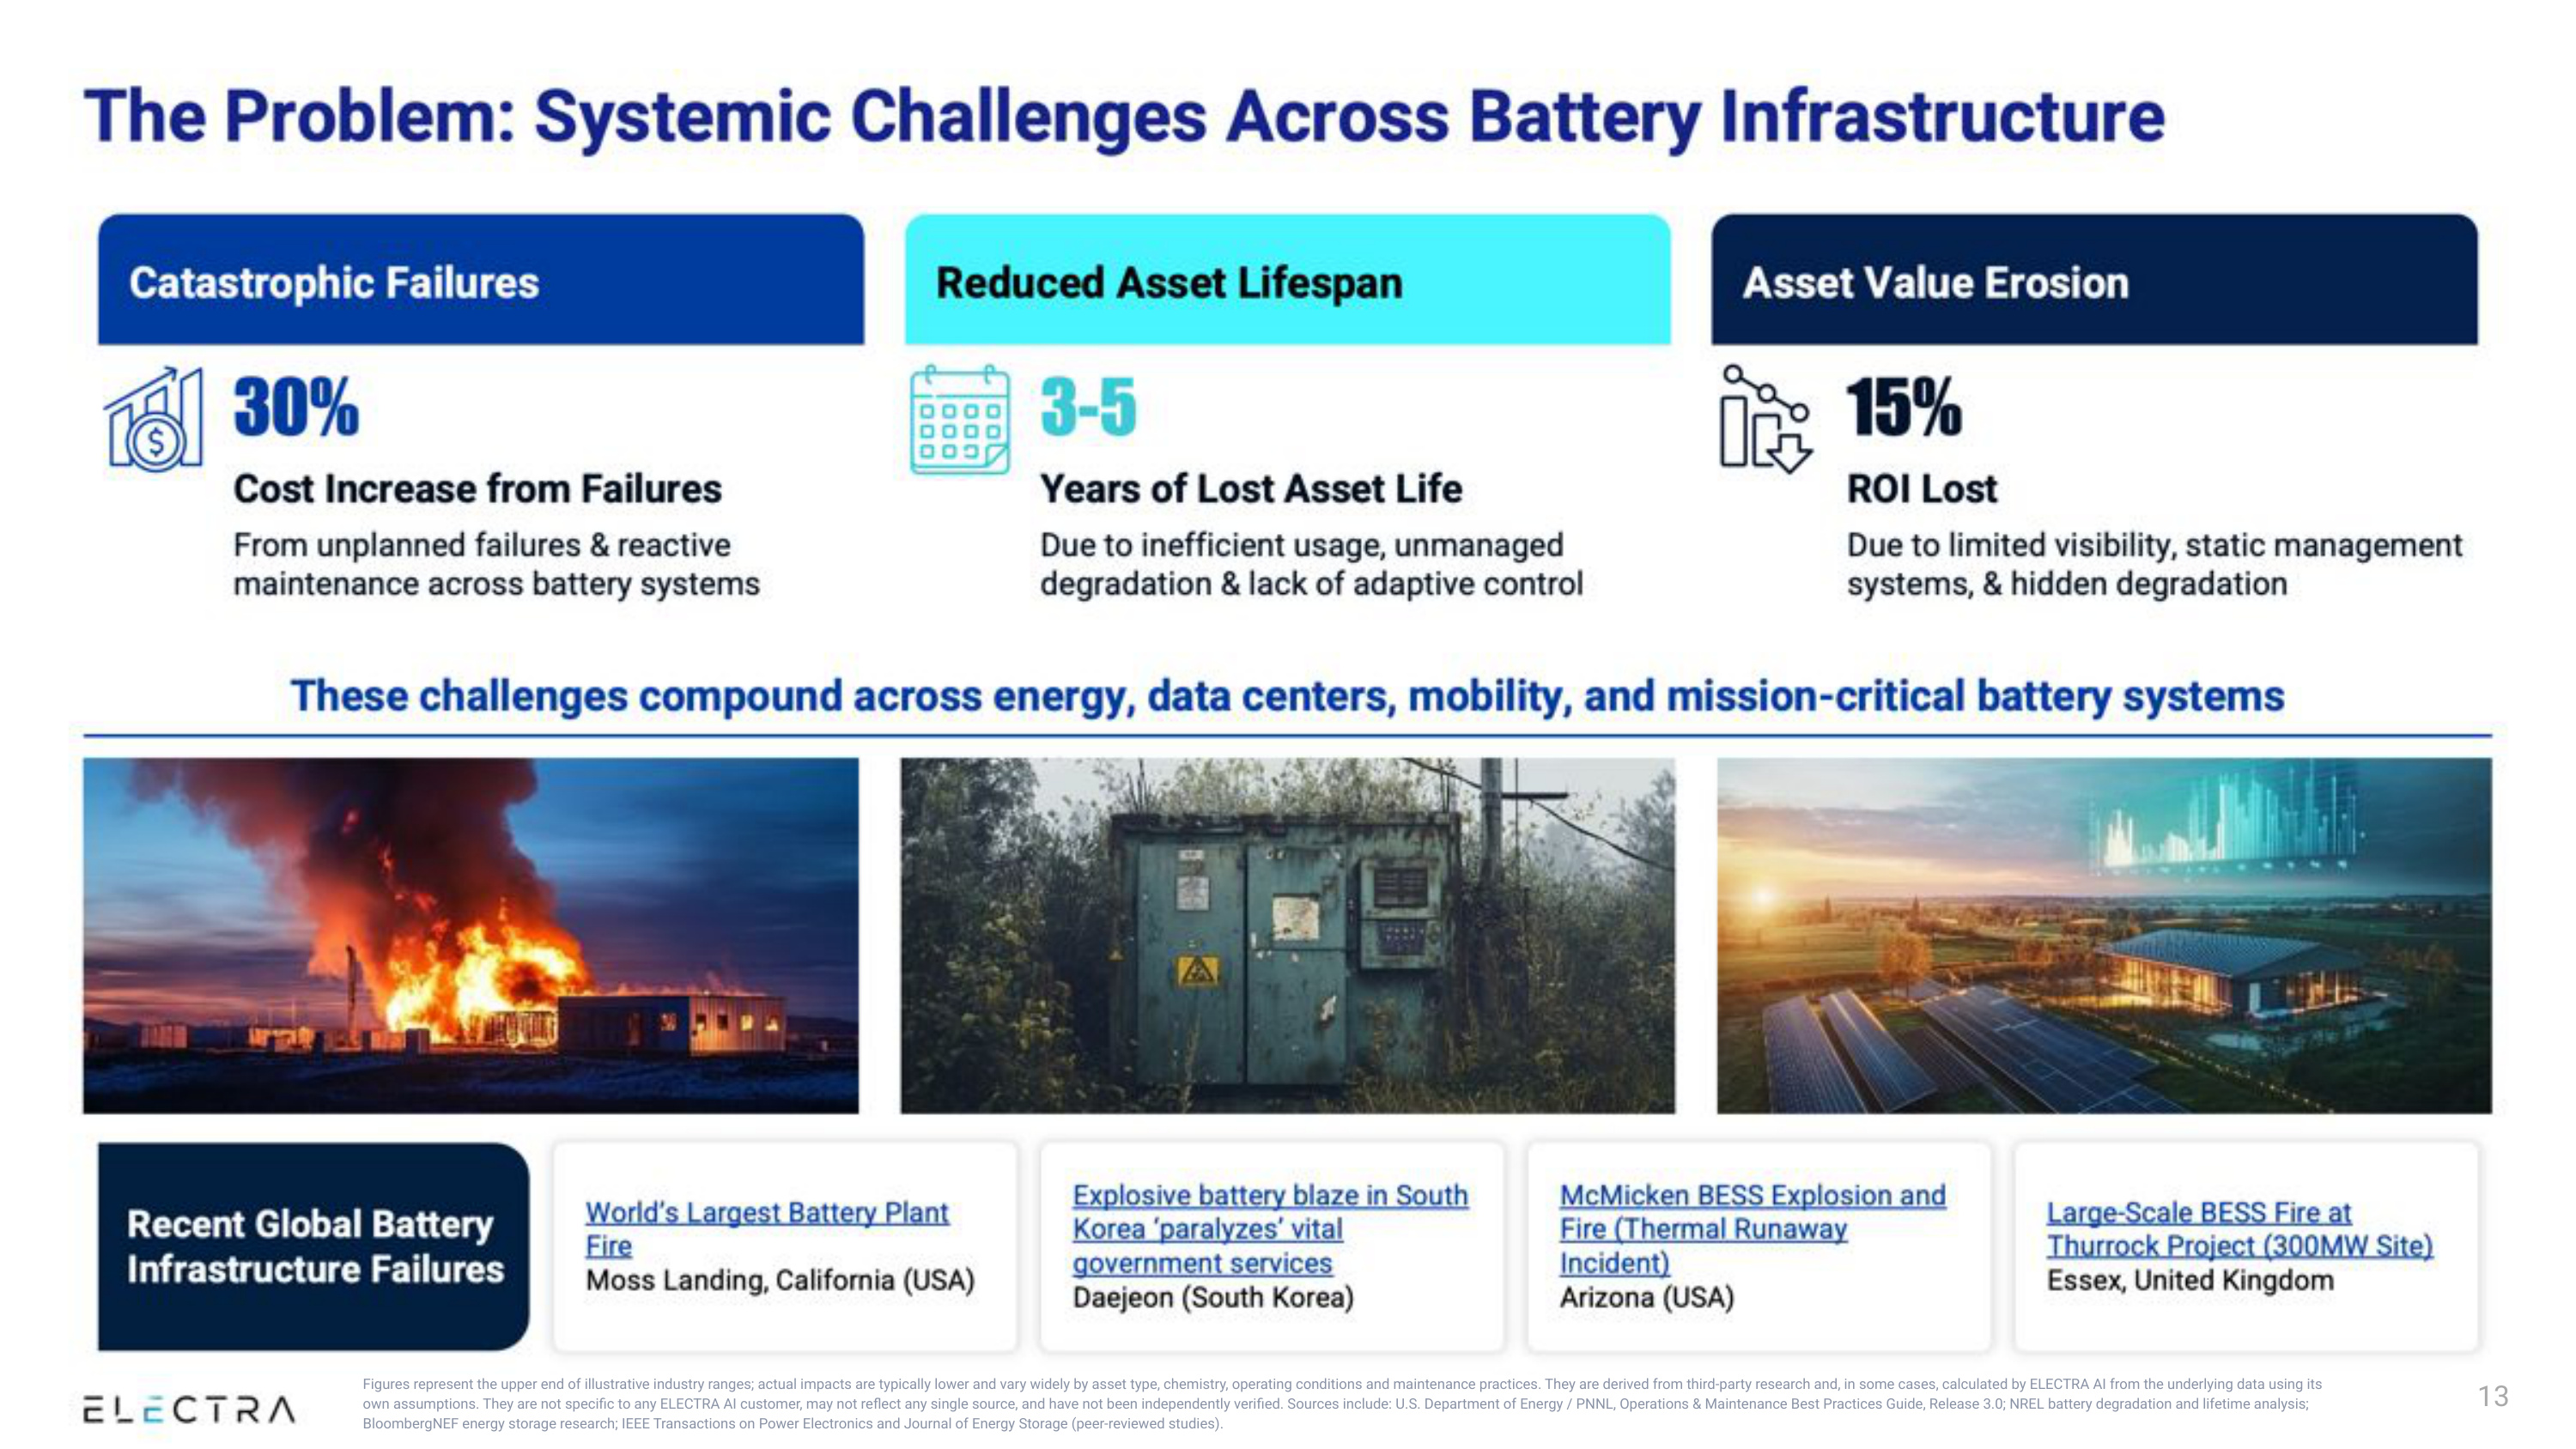
Catastrophic Failures Reduced Asset Lifespan Asset Value Erosion 30% Cost Increase from Failures From unplanned failures & reactive maintenance across battery systems 3-5 Years of Lost Asset Life Due to inefficient usage, unmanaged degradation & lack of adaptive control 15% ROI Lost Due to limited visibility, static management systems, & hidden degradation Recent Global Battery Infrastructure Failures World's Largest Battery Plant Fire Moss Landing, California (USA) Explosive battery blaze in South Korea 'paralyzes' vital government services Daejeon (South Korea) McMicken BESS Explosion and Fire (Thermal Runaway Incident) Arizona (USA) Large-Scale BESS Fire at Thurrock Project (300MW Site) Essex, United Kingdom The Problem: Systemic Challenges Across Battery Infrastructure 13 These challenges compound across energy, data centers, mobility, and mission-critical battery systems 13 Figures represent the upper end of illustrative industry ranges; actual impacts are typically lower and vary widely by asset type, chemistry, operating conditions and maintenance practices. They are derived from third-party research and, in some cases, calculated by ELECTRA AI from the underlying data using its own assumptions. They are not specific to any ELECTRA AI customer, may not reflect any single source, and have not been independently verified. Sources include: U.S. Department of Energy / PNNL, Operations & Maintenance Best Practices Guide, Release 3.0; NREL battery degradation and lifetime analysis; BloombergNEF energy storage research; IEEE Transactions on Power Electronics and Journal of Energy Storage (peer-reviewed studies).
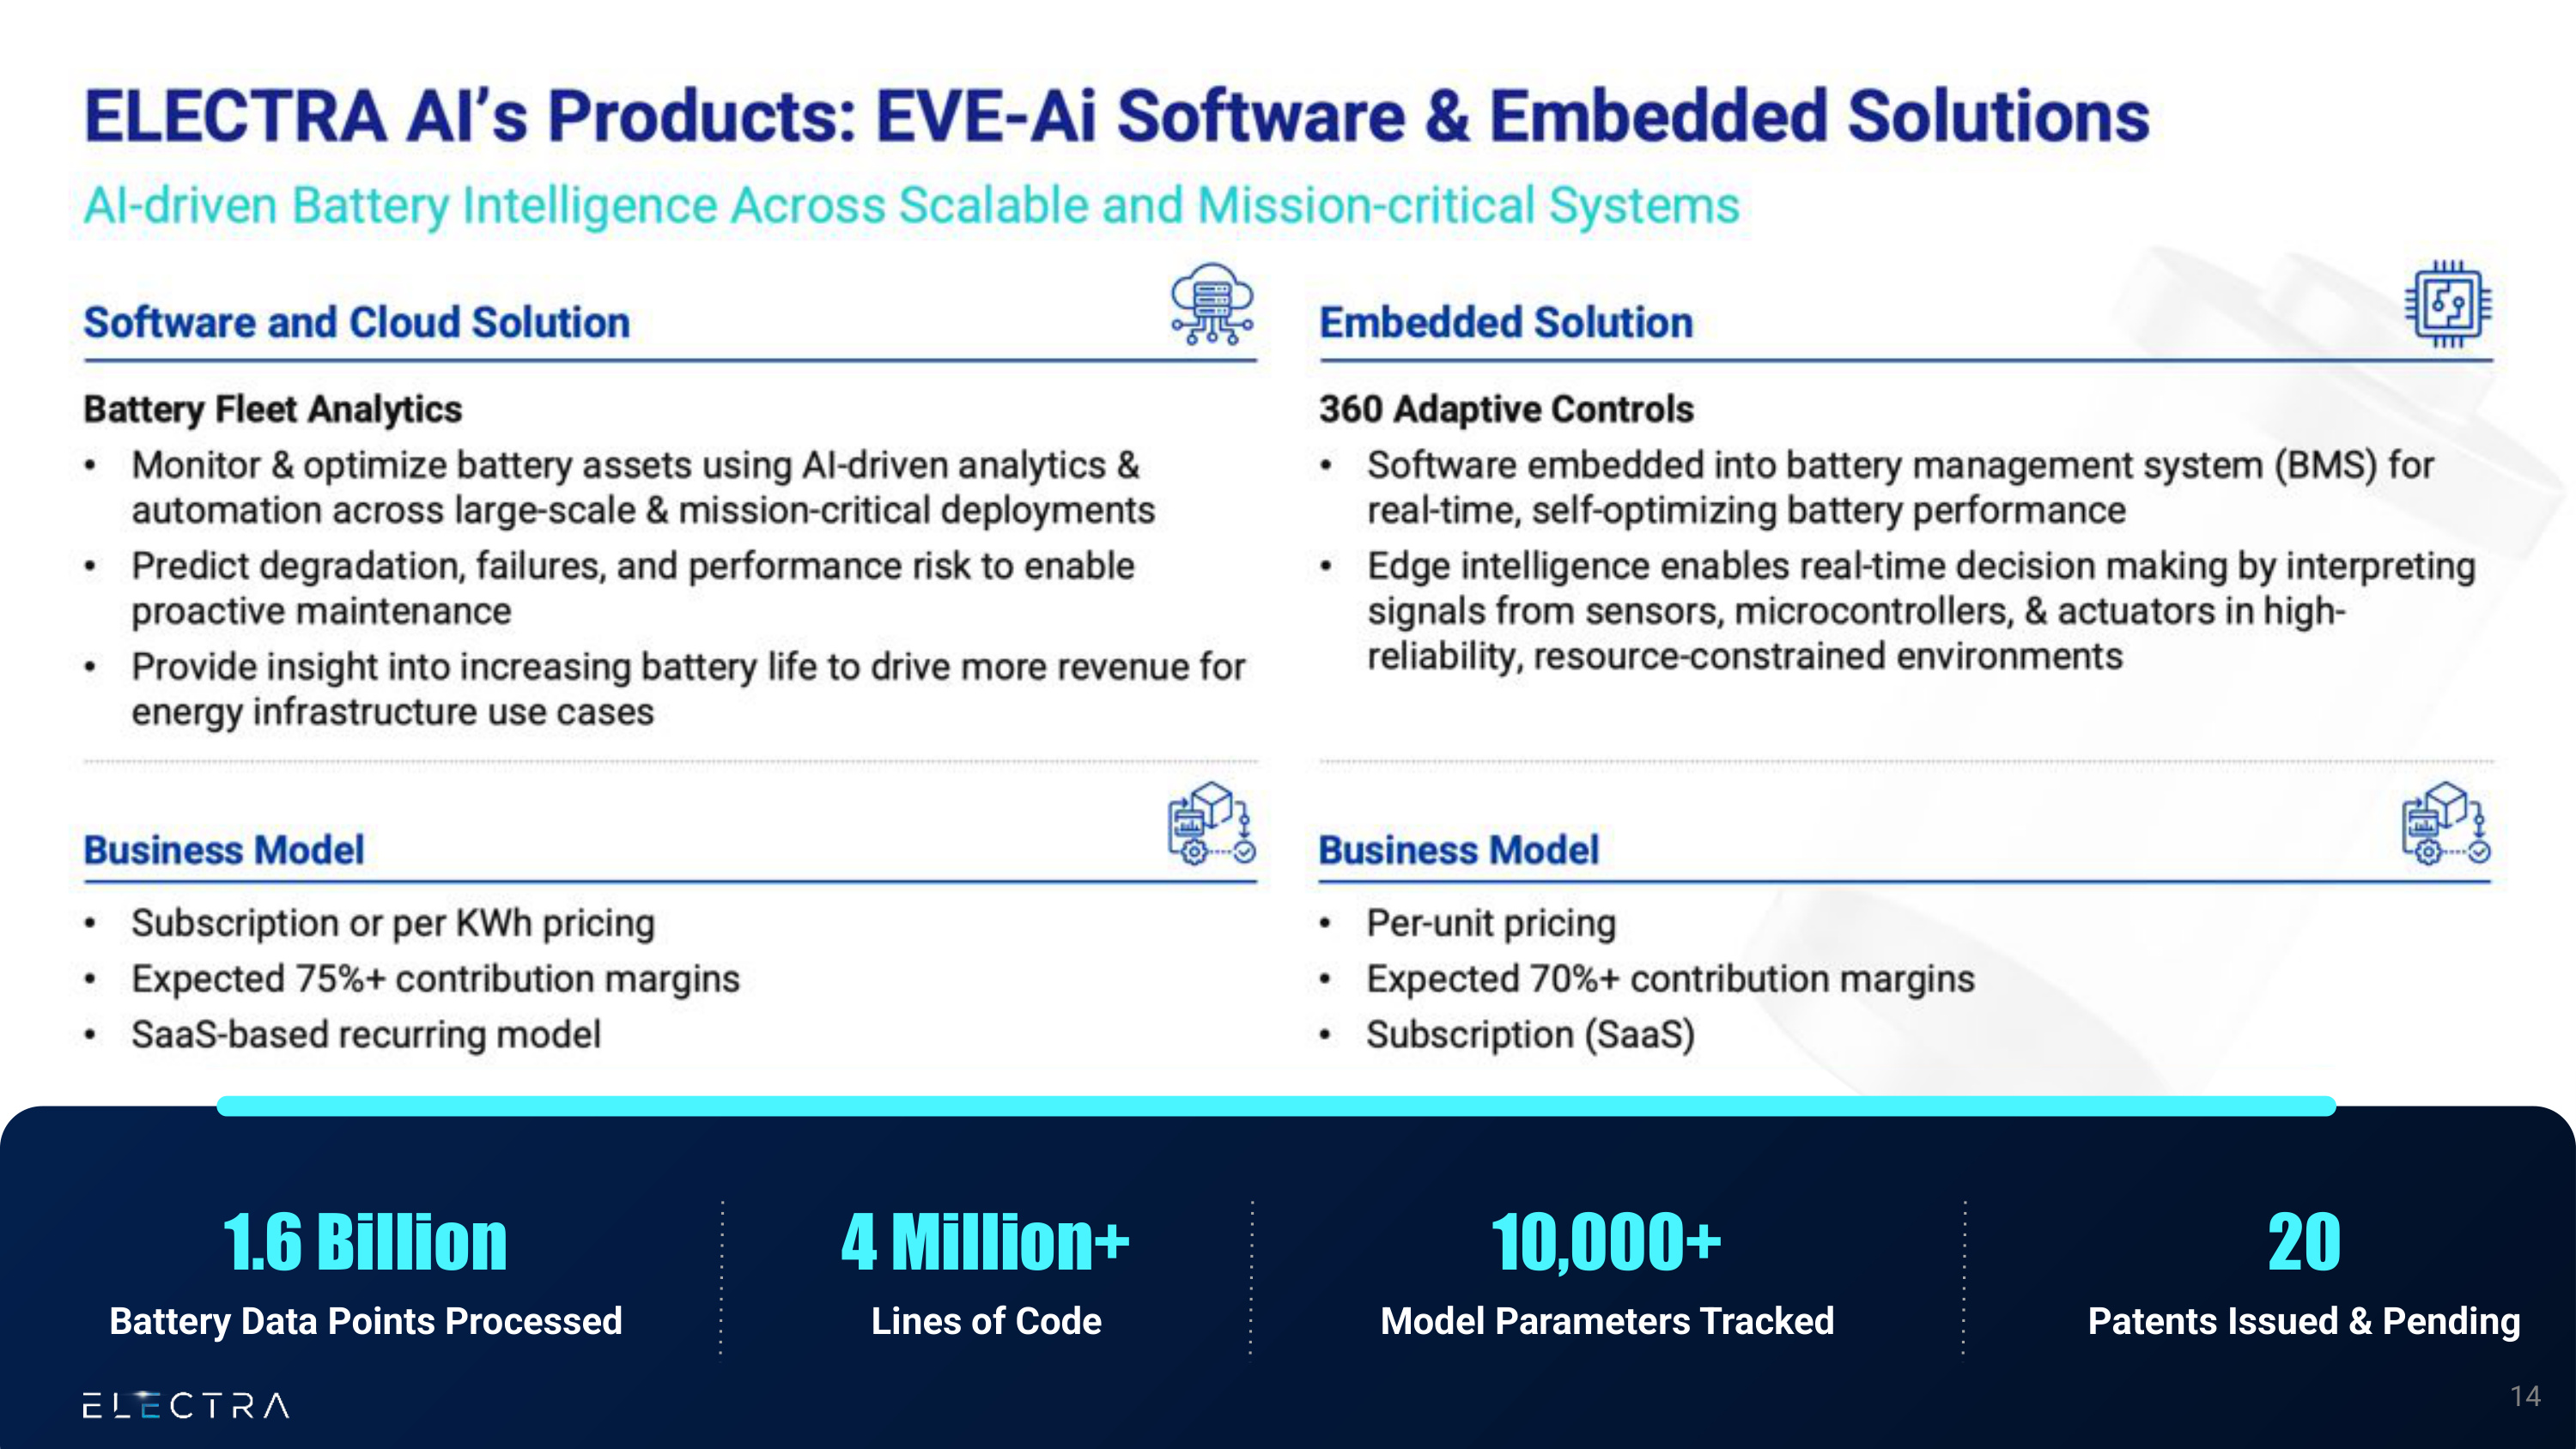
ELECTRA AI's Products: EVE-Ai Software & Embedded Solutions AI-driven Battery Intelligence Across Scalable and Mission-critical Systems 1.6 Billion Battery Data Points Processed 4 Million+ Lines of Code 10,000+ Model Parameters Tracked 20 Patents Issued & Pending Software and Cloud Solution Embedded Solution Battery Fleet Analytics • Monitor & optimize battery assets using AI-driven analytics & automation across large-scale & mission-critical deployments • Predict degradation, failures, and performance risk to enable proactive maintenance • Provide insight into increasing battery life to drive more revenue for energy infrastructure use cases 360 Adaptive Controls • Software embedded into battery management system (BMS) for real-time, self-optimizing battery performance • Edge intelligence enables real-time decision making by interpreting signals from sensors, microcontrollers, & actuators in high-reliability, resource-constrained environments Business Model • Subscription or per KWh pricing • Expected 75%+ contribution margins • SaaS-based recurring model • Per-unit pricing • Expected 70%+ contribution margins • Subscription (SaaS) Business Model 14
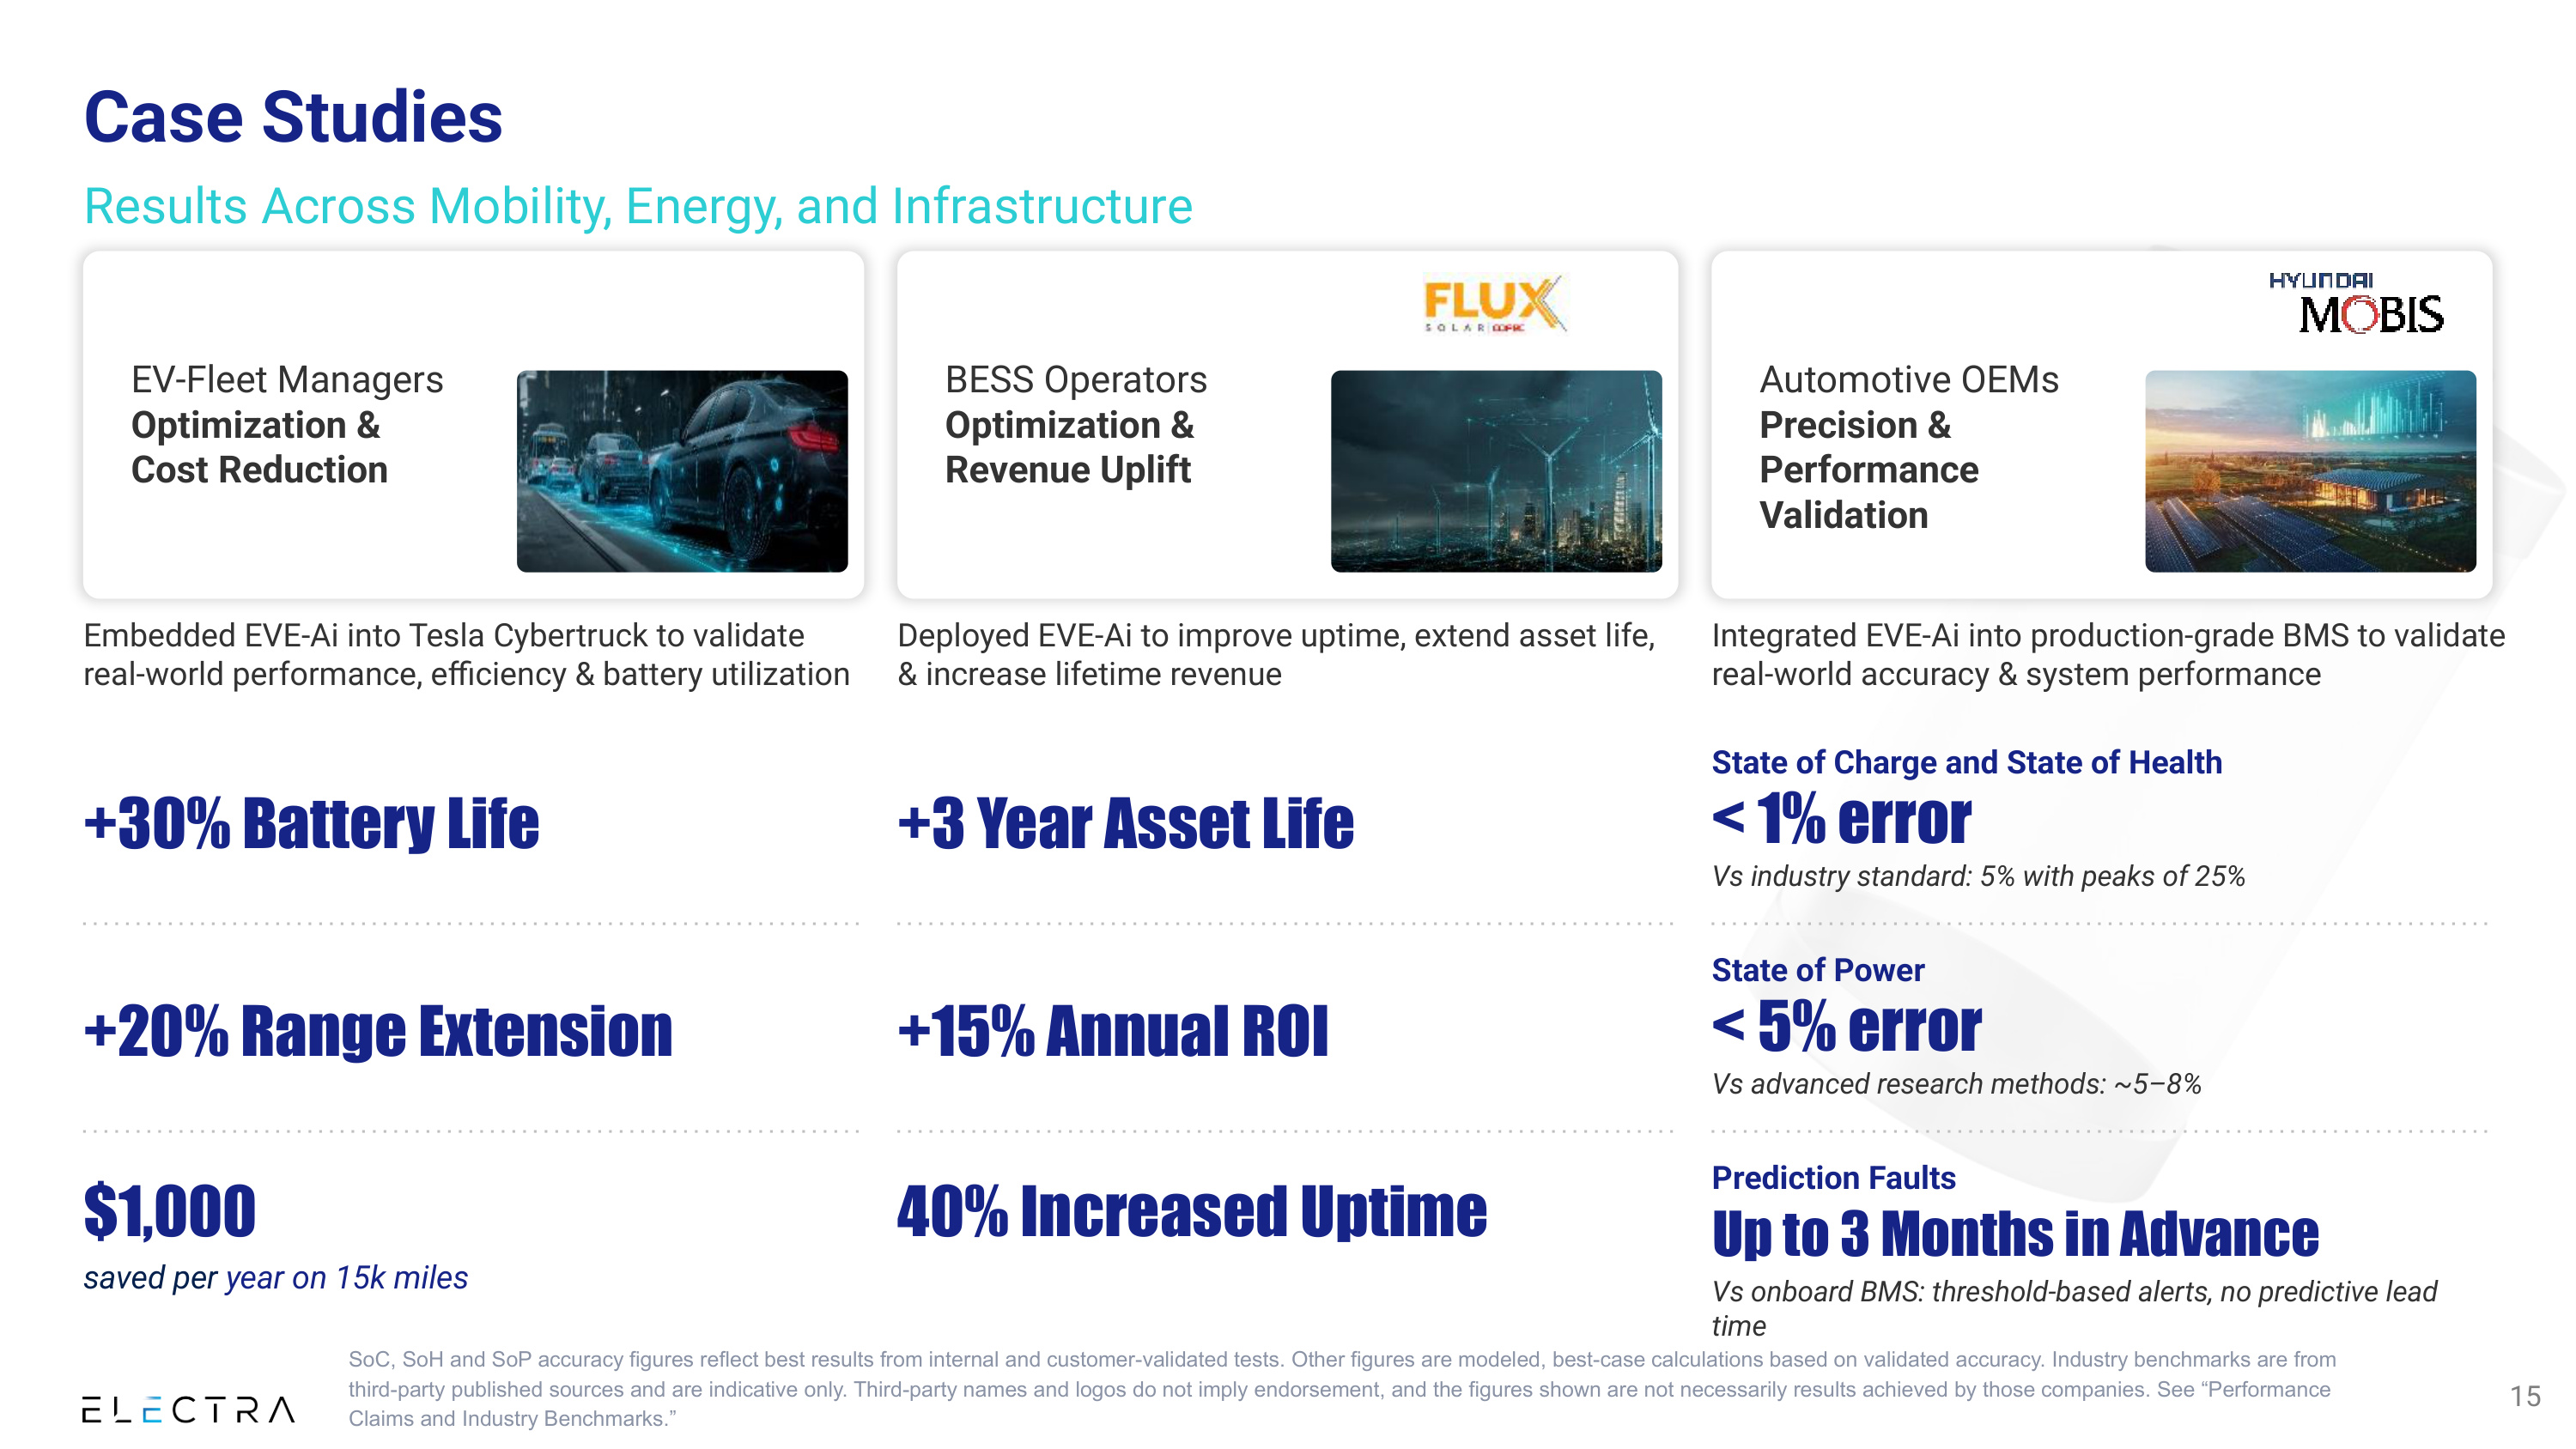
Case Studies Results Across Mobility, Energy, and Infrastructure EV-Fleet Managers Optimization & Cost Reduction BESS Operators Optimization & Revenue Uplift Automotive OEMs Precision & Performance Validation Embedded EVE-Ai into Tesla Cybertruck to validate real-world performance, efficiency & battery utilization Deployed EVE-Ai to improve uptime, extend asset life, & increase lifetime revenue Integrated EVE-Ai into production-grade BMS to validate real-world accuracy & system performance +30% Battery Life +20% Range Extension $1,000 saved per year on 15k miles +3 Year Asset Life +15% Annual ROI 40% Increased Uptime State of Charge and State of Health < 1% error Vs industry standard: 5% with peaks of 25% < 5% error Vs advanced research methods: ~5–8% State of Power Up to 3 Months in Advance Vs onboard BMS: threshold-based alerts, no predictive lead time Prediction Faults 15 SoC, SoH and SoP accuracy figures reflect best results from internal and customer-validated tests. Other figures are modeled, best-case calculations based on validated accuracy. Industry benchmarks are from third-party published sources and are indicative only. Third-party names and logos do not imply endorsement, and the figures shown are not necessarily results achieved by those companies. See "Performance Claims and Industry Benchmarks."
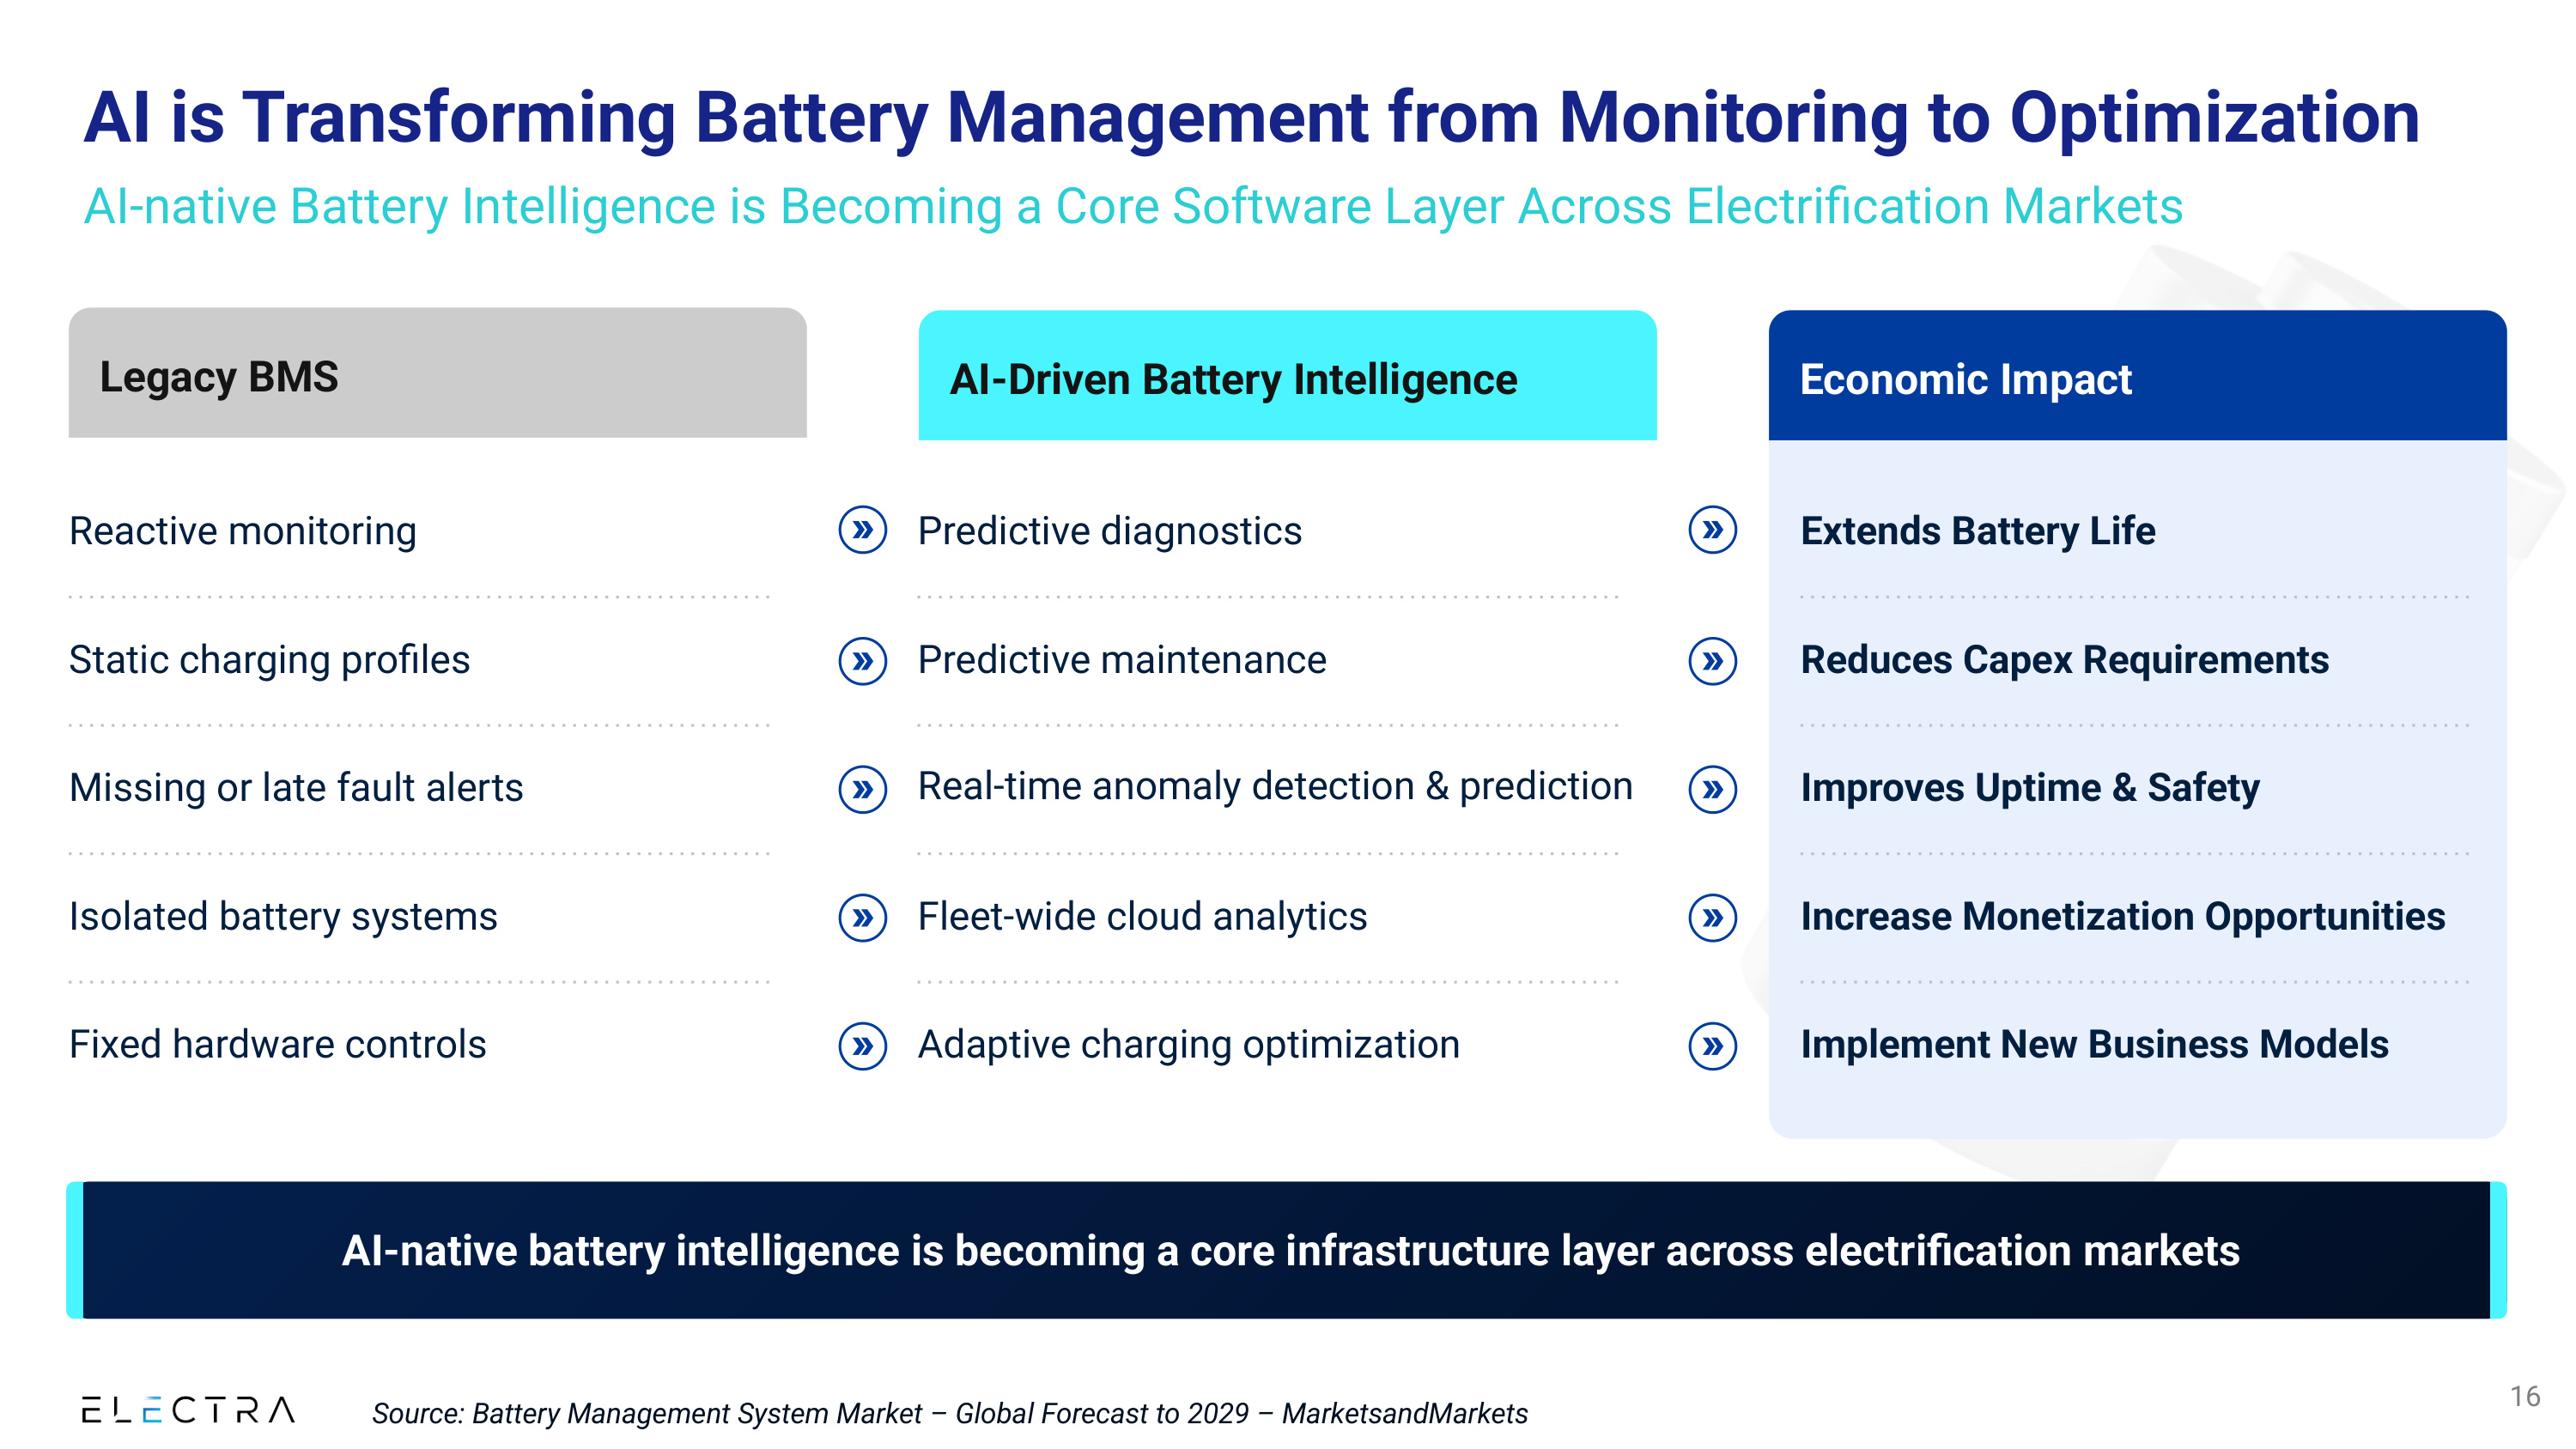
AI is Transforming Battery Management from Monitoring to Optimization AI-native Battery Intelligence is Becoming a Core Software Layer Across Electrification Markets AI-native battery intelligence is becoming a core infrastructure layer across electrification markets 16 Economic Impact Legacy BMS AI-Driven Battery Intelligence Reactive monitoring Static charging profiles Missing or late fault alerts Isolated battery systems Fixed hardware controls Predictive diagnostics Predictive maintenance Real-time anomaly detection & prediction Fleet-wide cloud analytics Adaptive charging optimization Extends Battery Life Reduces Capex Requirements Improves Uptime & Safety Increase Monetization Opportunities Implement New Business Models Source: Battery Management System Market – Global Forecast to 2029 – MarketsandMarkets
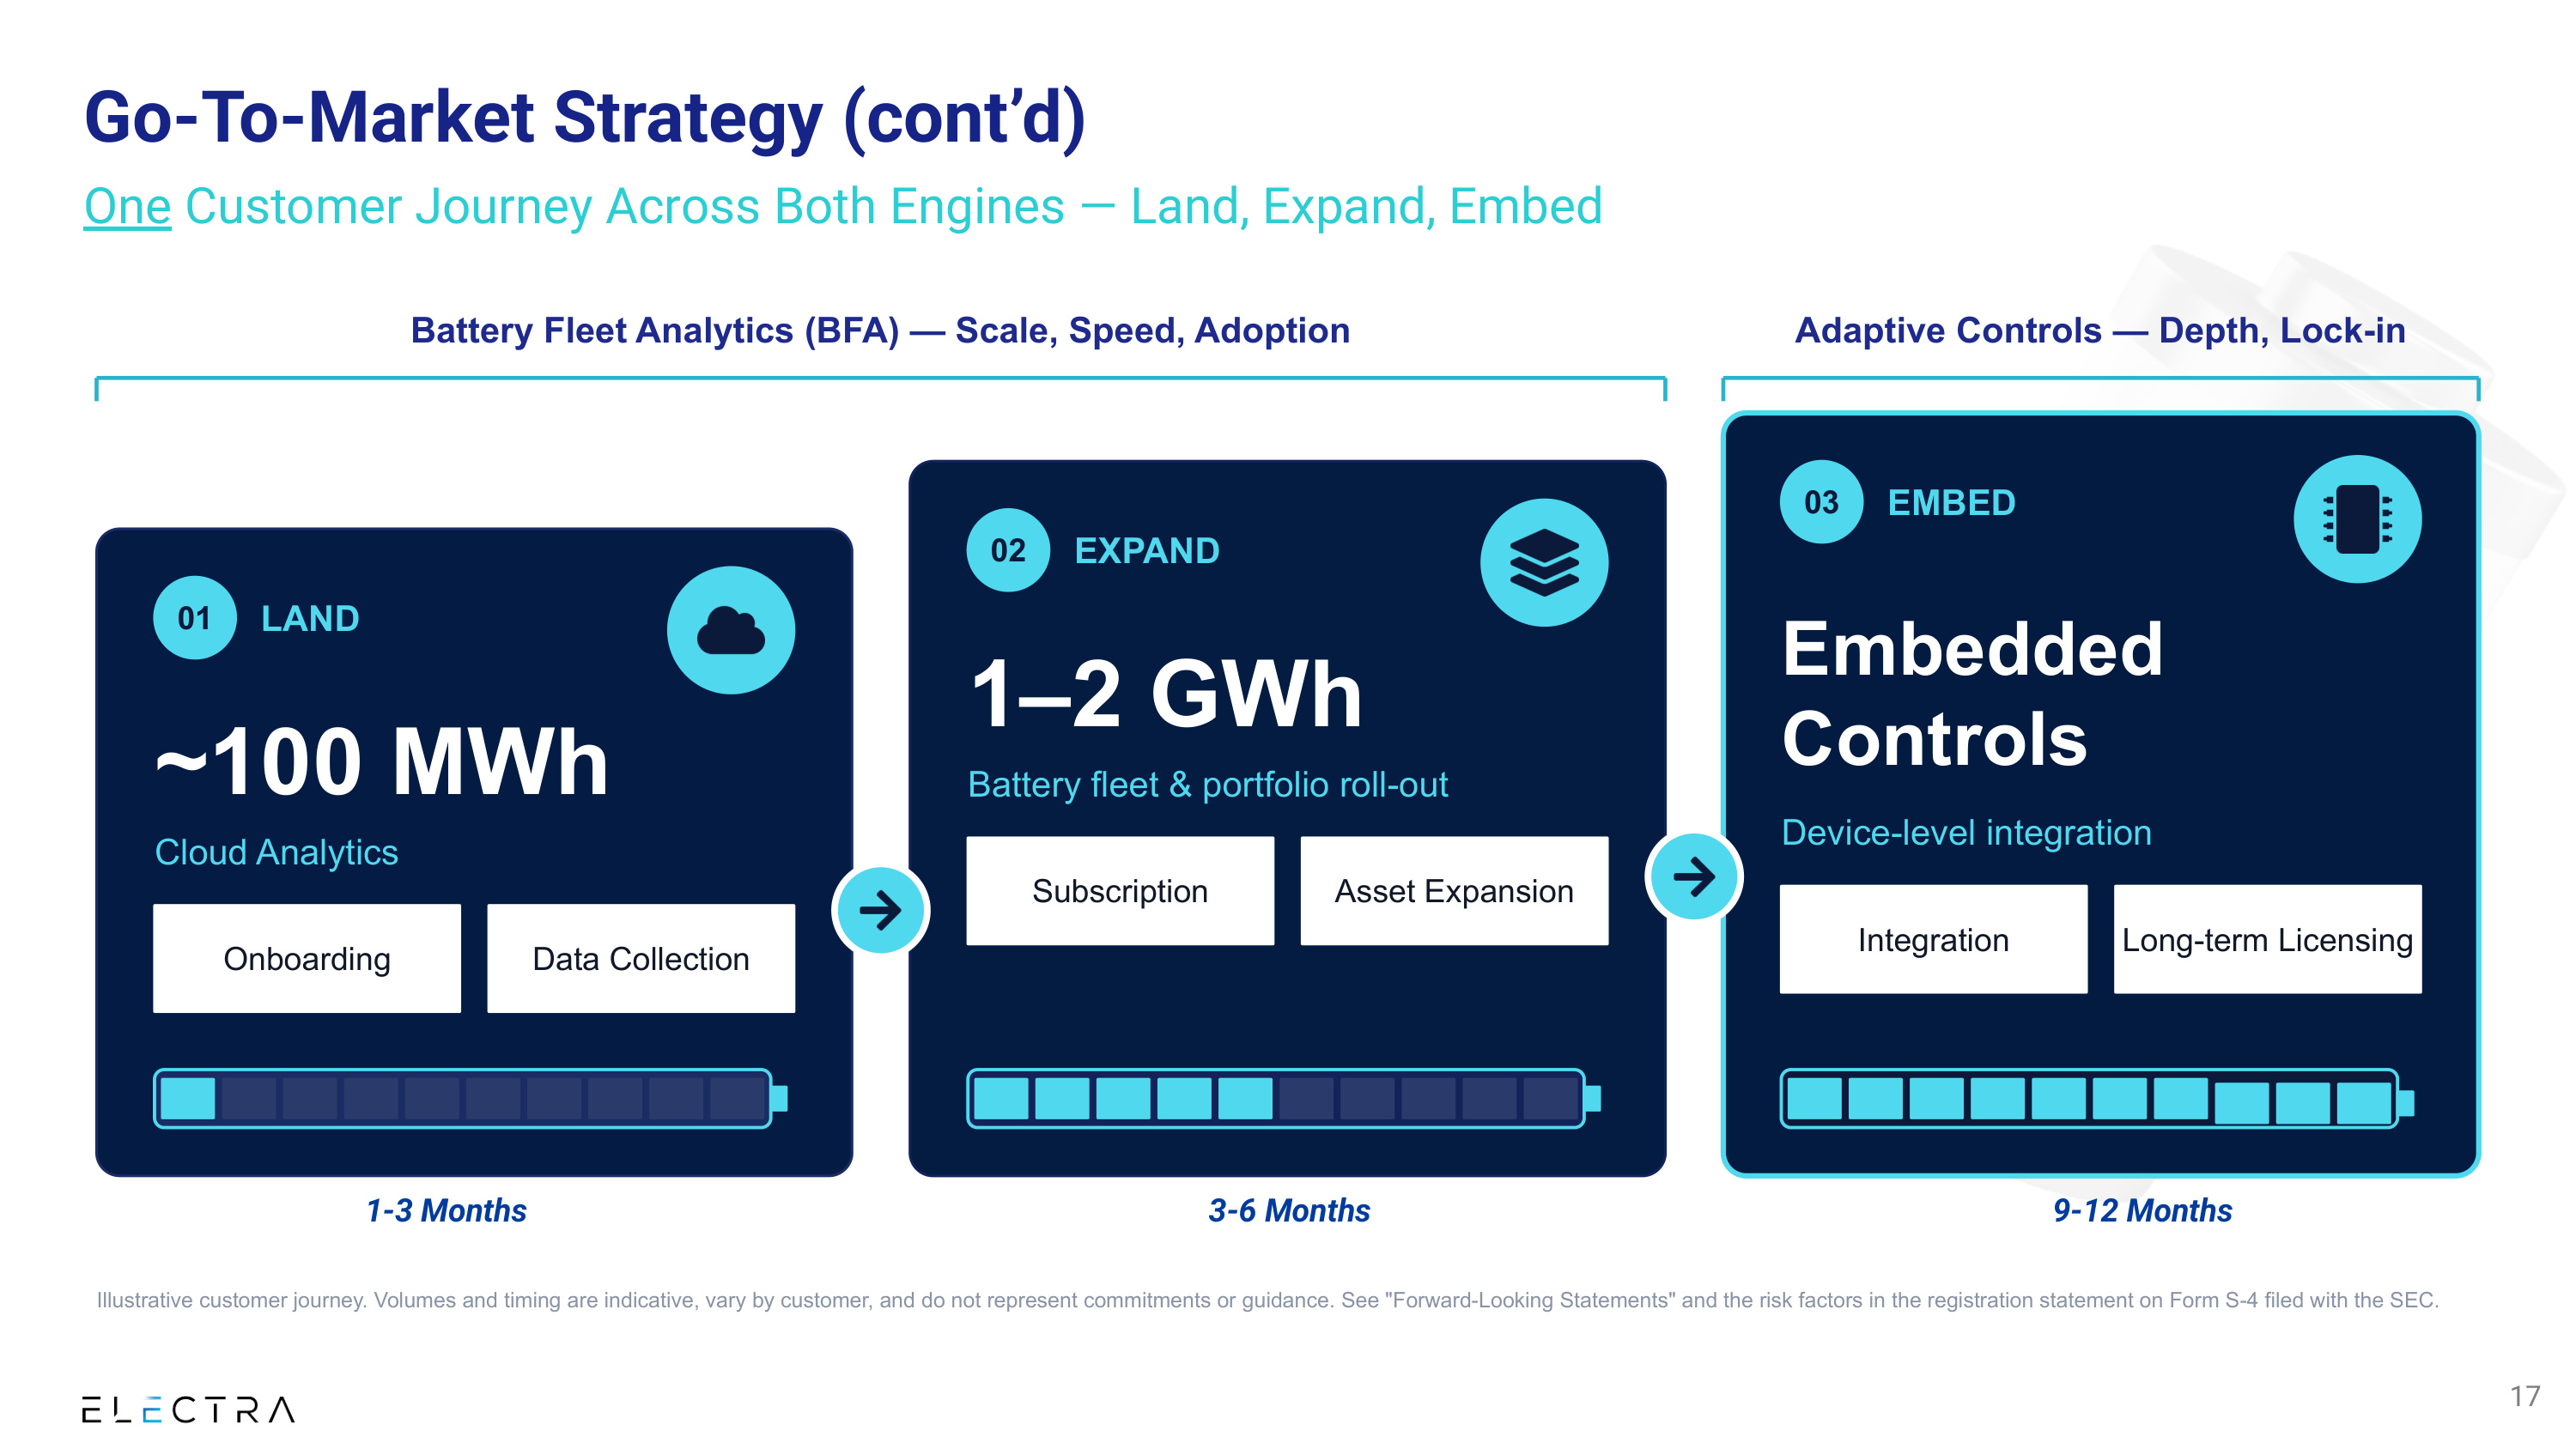
Battery Fleet Analytics (BFA) — Scale, Speed, Adoption Adaptive Controls — Depth, Lock-in 01 LAND ~100 MWh Cloud Analytics Onboarding Data Collection 02 EXPAND 1–2 GWh Battery fleet & portfolio roll-out Subscription Asset Expansion 03 EMBED Embedded Controls Device-level integration Integration Long-term Licensing Illustrative customer journey. Volumes and timing are indicative, vary by customer, and do not represent commitments or guidance. See "Forward-Looking Statements" and the risk factors in the registration statement on Form S-4 filed with the SEC. Go-To-Market Strategy (cont'd) One Customer Journey Across Both Engines — Land, Expand, Embed 1-3 Months 3-6 Months 9-12 Months 17
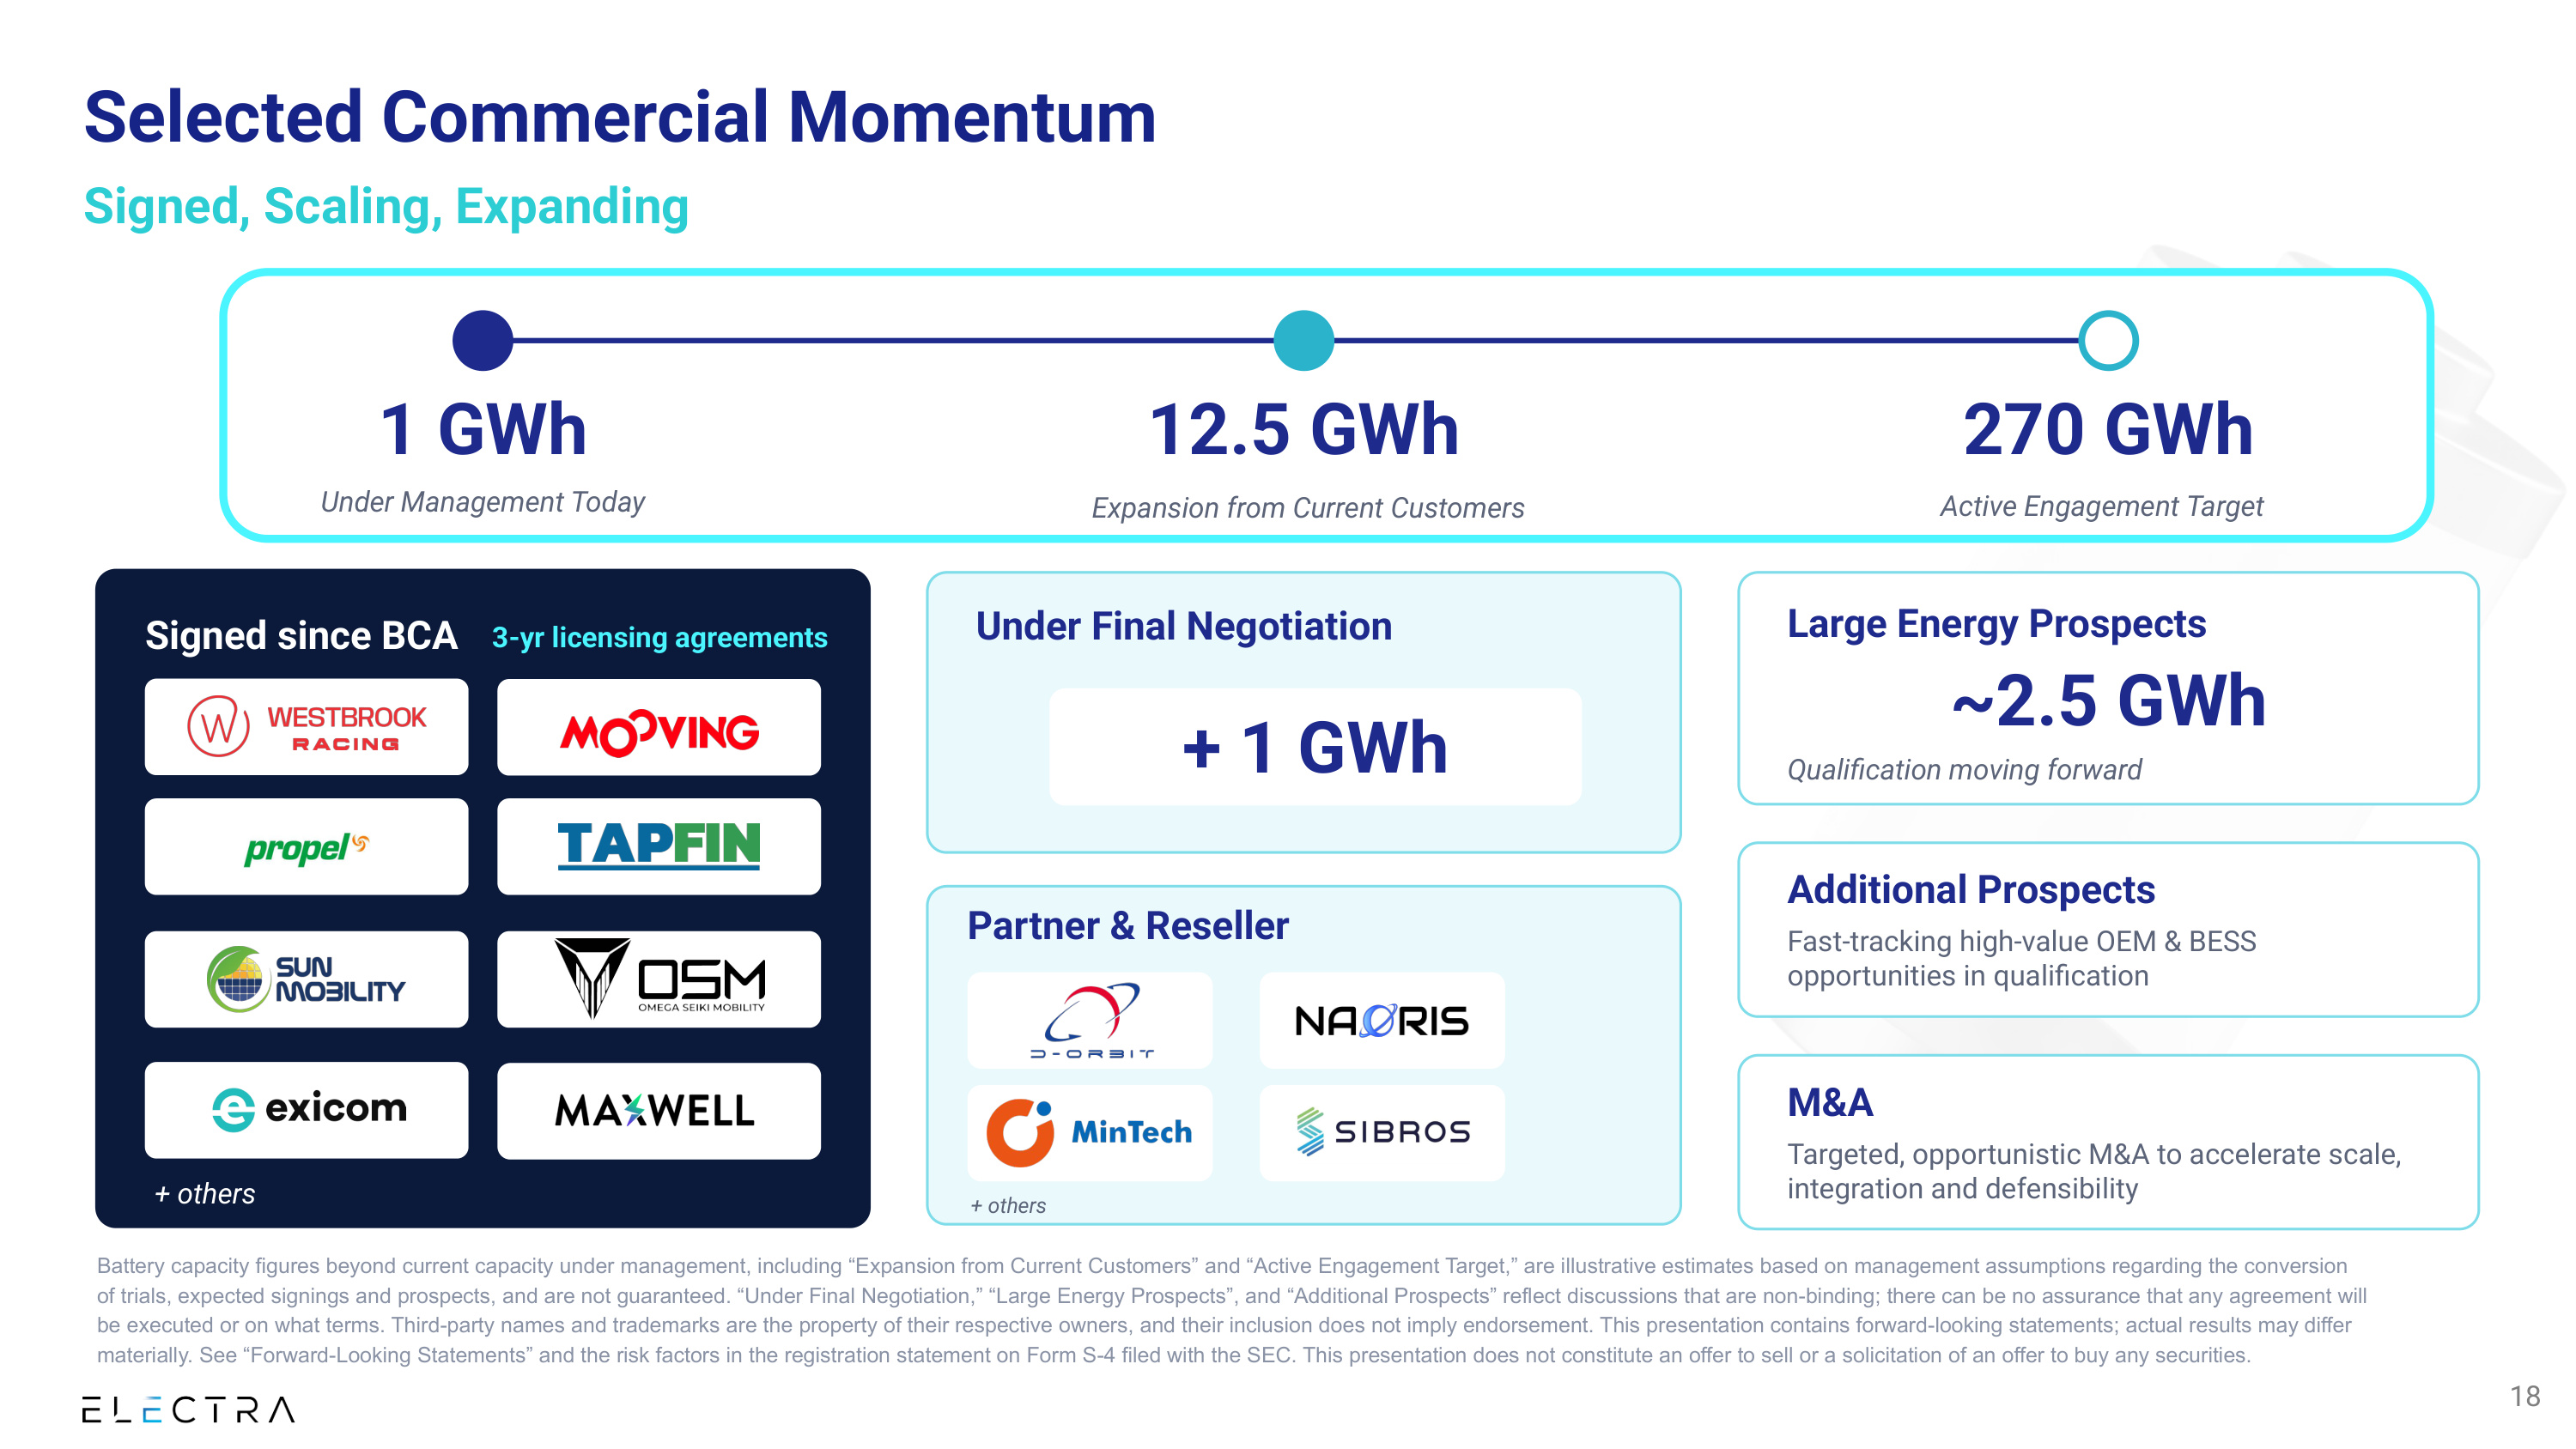
1 GWh Under Management Today 12.5 GWh 270 GWh Active Engagement Target Battery capacity figures beyond current capacity under management, including "Expansion from Current Customers" and "Active Engagement Target," are illustrative estimates based on management assumptions regarding the conversion of trials, expected signings and prospects, and are not guaranteed. "Under Final Negotiation," "Large Energy Prospects", and "Additional Prospects" reflect discussions that are non-binding; there can be no assurance that any agreement will be executed or on what terms. Third-party names and trademarks are the property of their respective owners, and their inclusion does not imply endorsement. This presentation contains forward-looking statements; actual results may differ materially. See "Forward-Looking Statements" and the risk factors in the registration statement on Form S-4 filed with the SEC. This presentation does not constitute an offer to sell or a solicitation of an offer to buy any securities. Signed since BCA 3-yr licensing agreements Under Final Negotiation + 1 GWh Large Energy Prospects Qualification moving forward Additional Prospects Fast-tracking high-value OEM & BESS opportunities in qualification M&A Targeted, opportunistic M&A to accelerate scale, integration and defensibility Selected Commercial Momentum Signed, Scaling, Expanding + others + others Expansion from Current Customers ~2.5 GWh Partner & Reseller 18
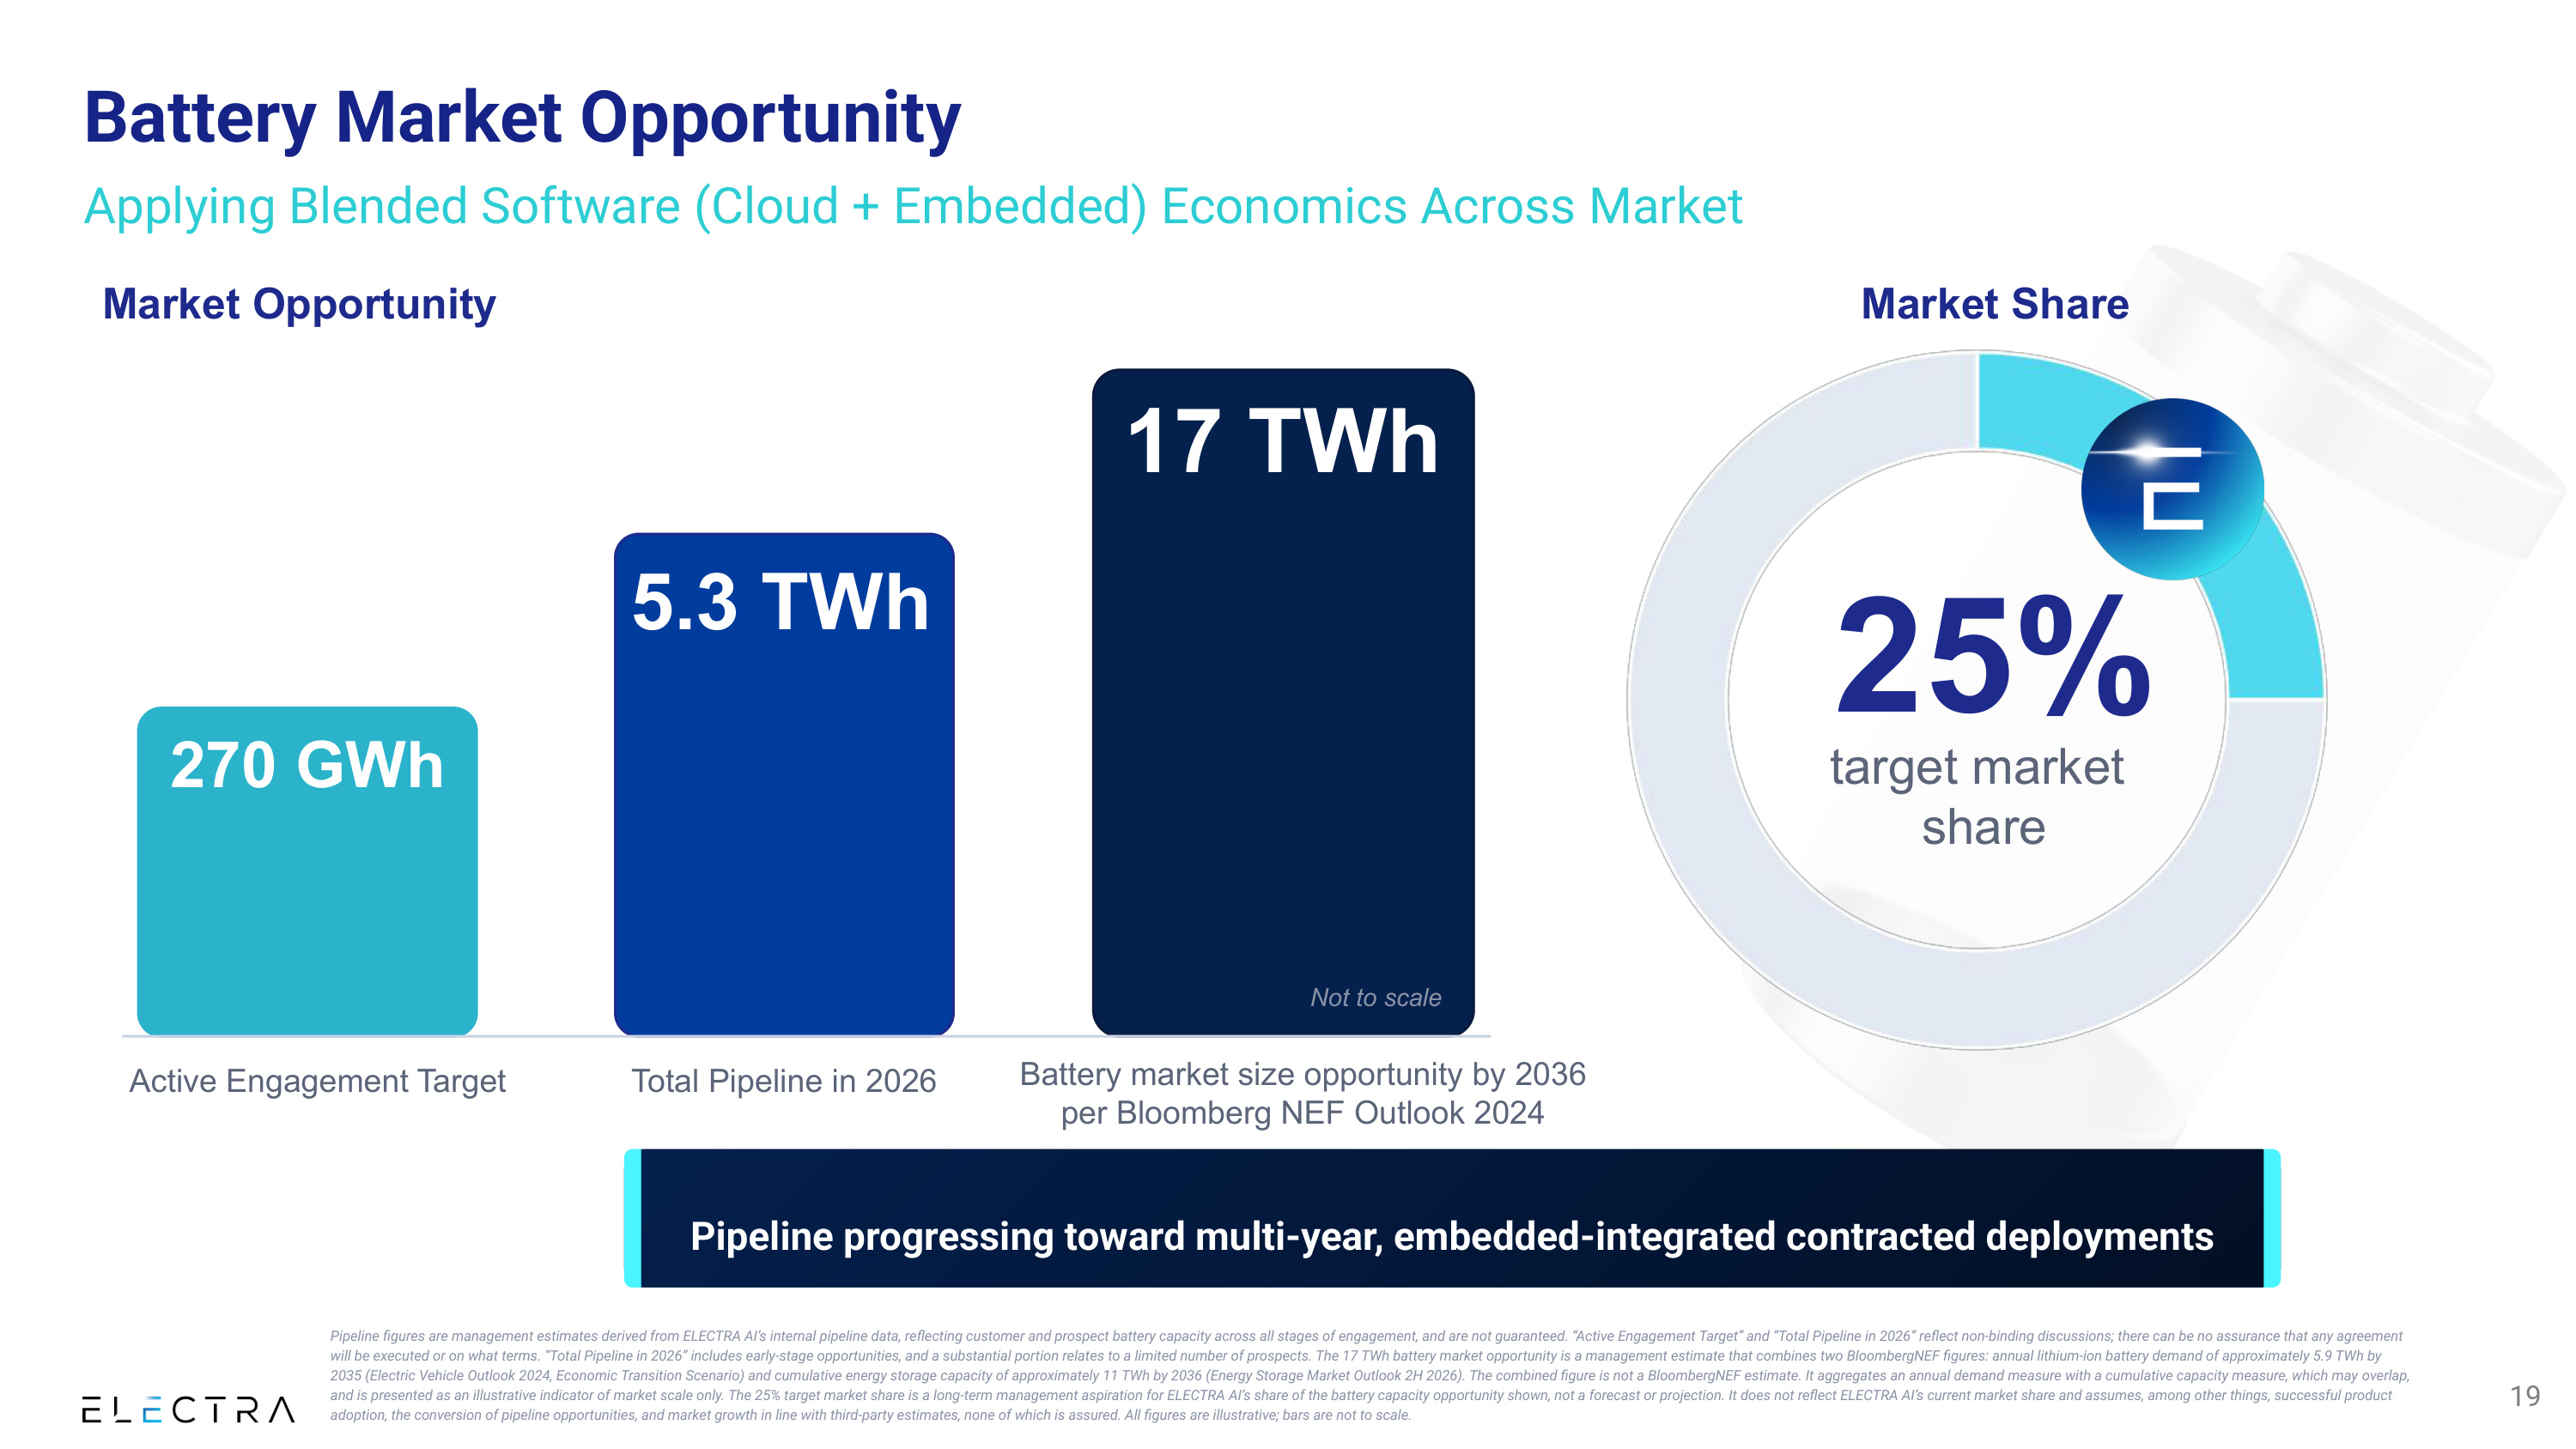
Market Opportunity 270 GWh Active Engagement Target 5.3 TWh Total Pipeline in 2026 17 TWh Battery market size opportunity by 2036 per Bloomberg NEF Outlook 2024 Not to scale Market Share 25% target market share Pipeline progressing toward multi-year, embedded-integrated contracted deployments Pipeline figures are management estimates derived from ELECTRA AI's internal pipeline data, reflecting customer and prospect battery capacity across all stages of engagement, and are not guaranteed. "Active Engagement Target" and "Total Pipeline in 2026" reflect non-binding discussions; there can be no assurance that any agreement will be executed or on what terms. "Total Pipeline in 2026" includes early-stage opportunities, and a substantial portion relates to a limited number of prospects. The 17 TWh battery market opportunity is a management estimate that combines two BloombergNEF figures: annual lithium-ion battery demand of approximately 5.9 TWh by 2035 (Electric Vehicle Outlook 2024, Economic Transition Scenario) and cumulative energy storage capacity of approximately 11 TWh by 2036 (Energy Storage Market Outlook 2H 2026). The combined figure is not a BloombergNEF estimate. It aggregates an annual demand measure with a cumulative capacity measure, which may overlap, and is presented as an illustrative indicator of market scale only. The 25% target market share is a long-term management aspiration for ELECTRA AI's share of the battery capacity opportunity shown, not a forecast or projection. It does not reflect ELECTRA AI's current market share and assumes, among other things, successful product adoption, the conversion of pipeline opportunities, and market growth in line with third-party estimates, none of which is assured. All figures are illustrative; bars are not to scale. Battery Market Opportunity Applying Blended Software (Cloud + Embedded) Economics Across Market 19

FINANCIAL OVERVIEW
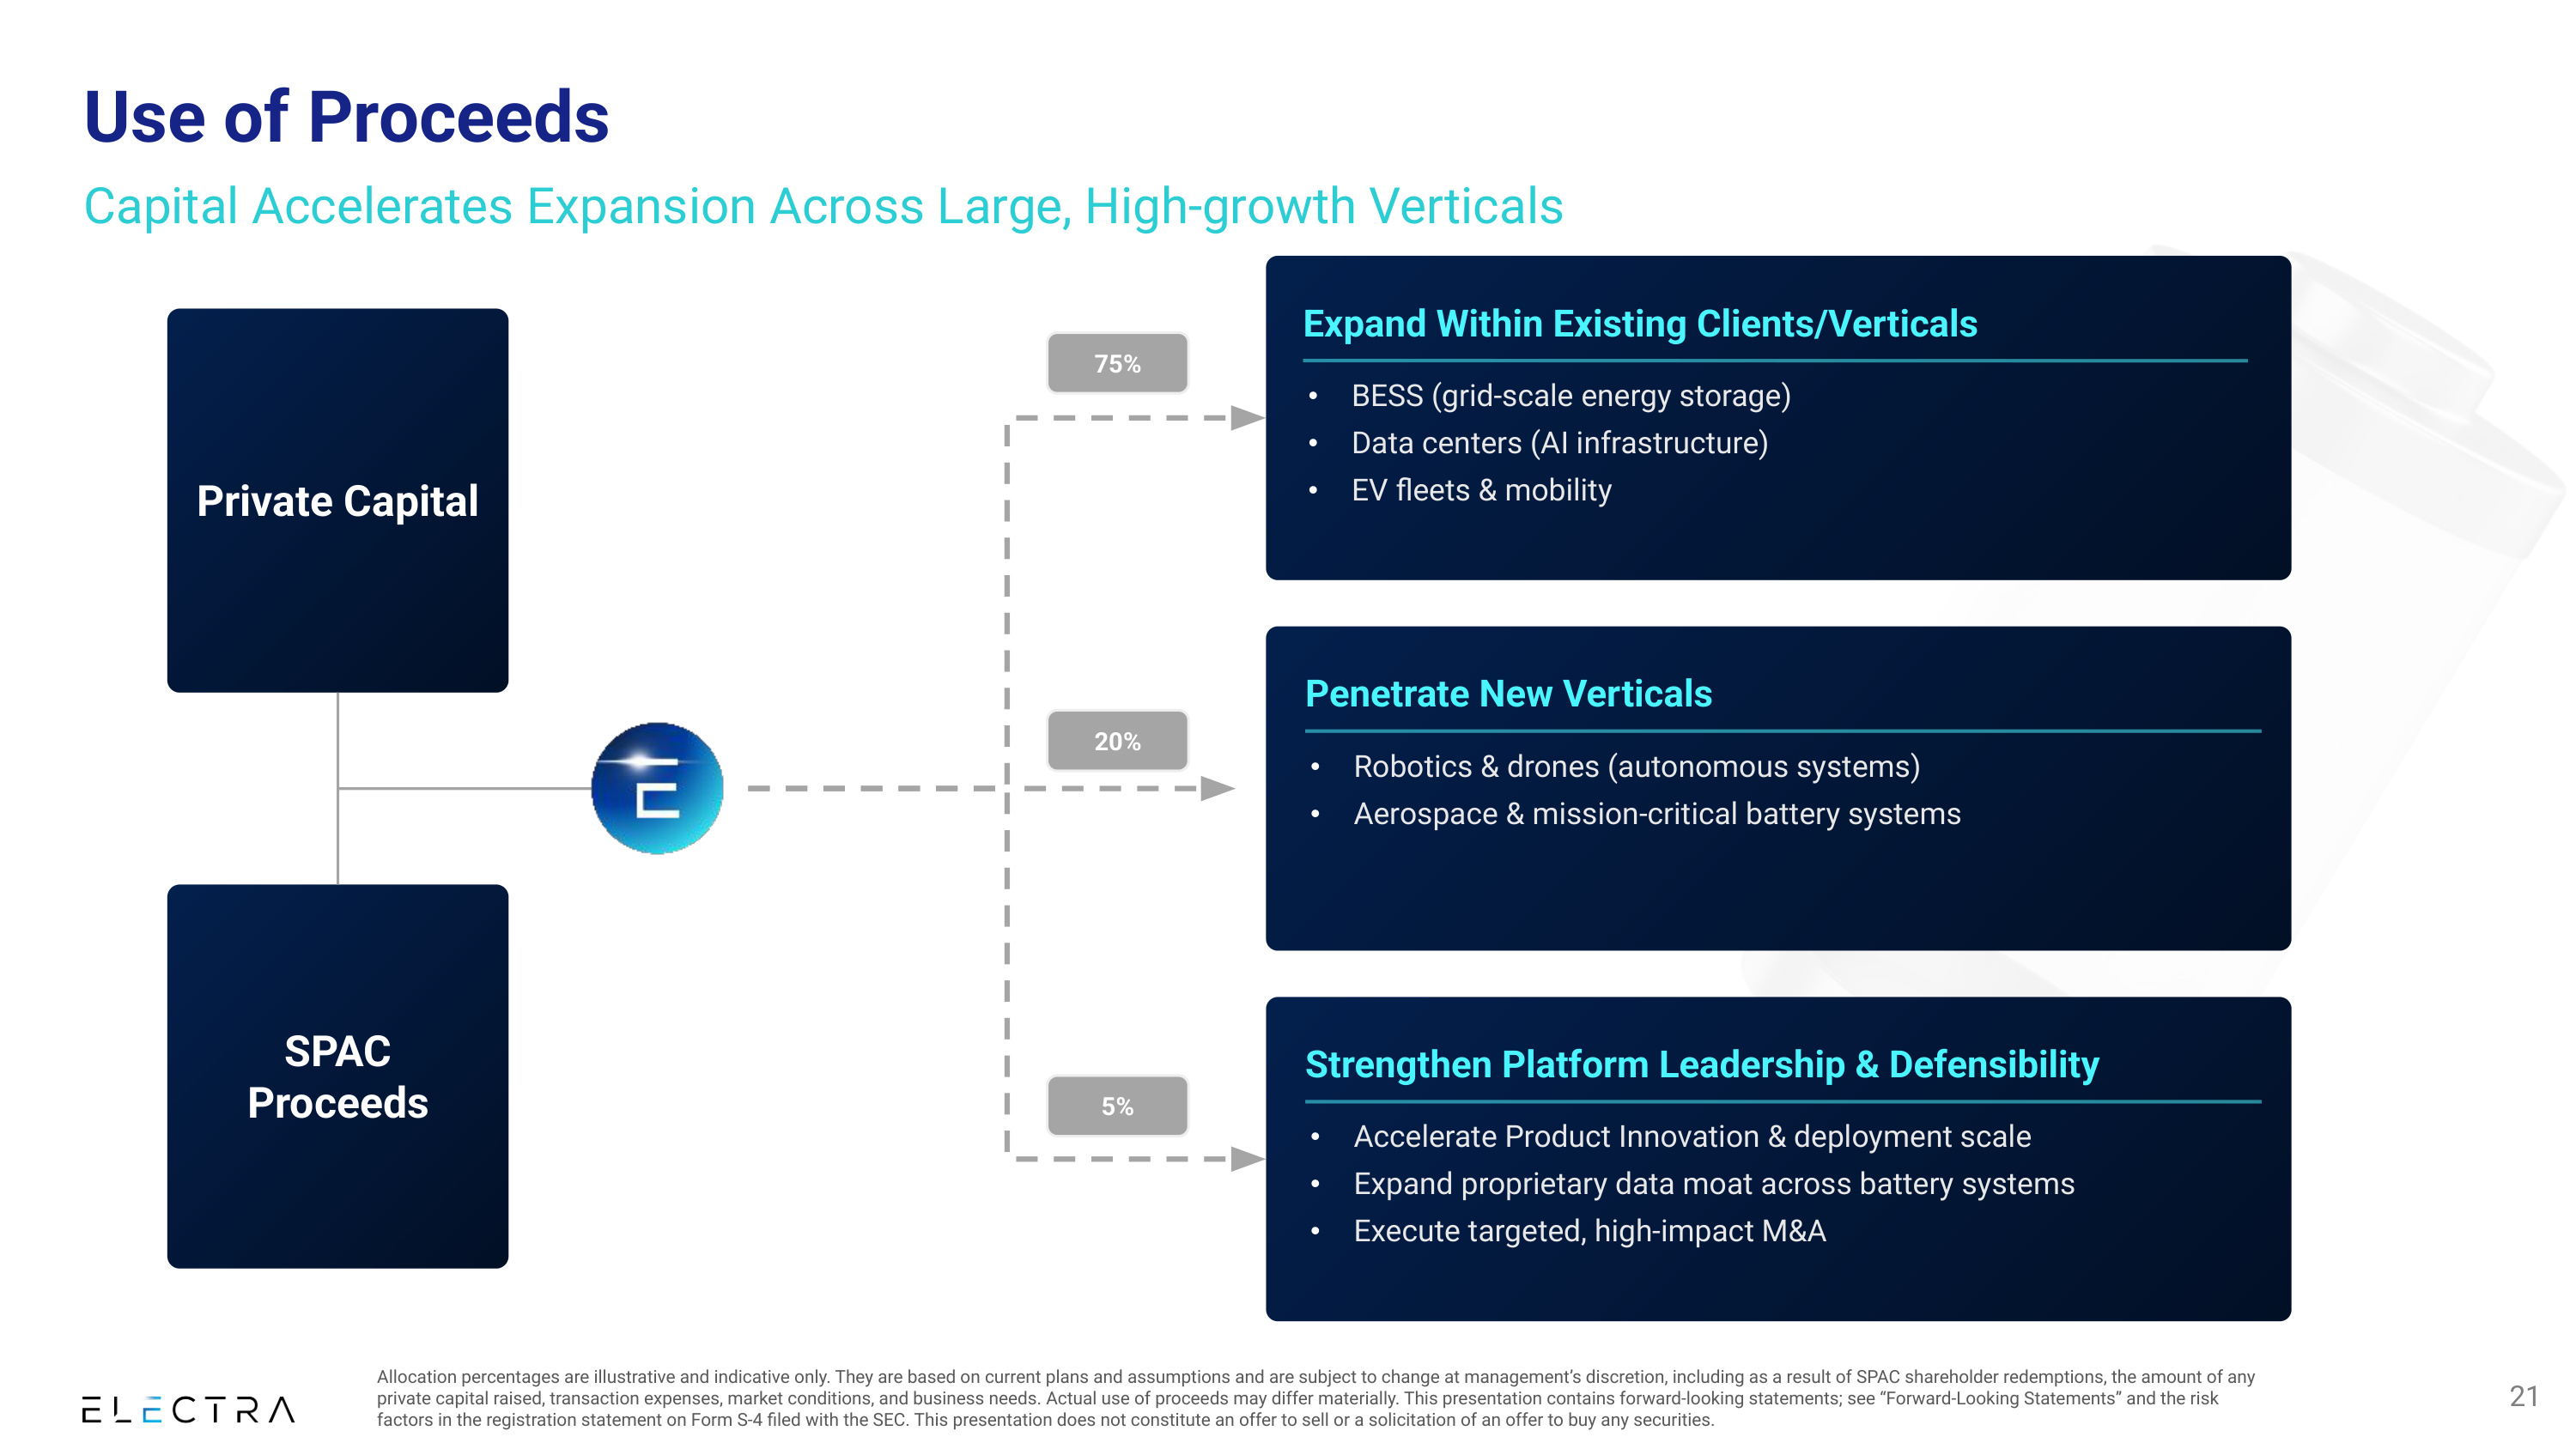
Use of Proceeds Capital Accelerates Expansion Across Large, High-growth Verticals Private Capital SPAC Proceeds 21 Expand Within Existing Clients/Verticals • BESS (grid-scale energy storage) • Data centers (AI infrastructure) • EV fleets & mobility Penetrate New Verticals • Robotics & drones (autonomous systems) • Aerospace & mission-critical battery systems Strengthen Platform Leadership & Defensibility • Accelerate Product Innovation & deployment scale • Expand proprietary data moat across battery systems • Execute targeted, high-impact M&A 75% 20% 5% Allocation percentages are illustrative and indicative only. They are based on current plans and assumptions and are subject to change at management's discretion, including as a result of SPAC shareholder redemptions, the amount of any private capital raised, transaction expenses, market conditions, and business needs. Actual use of proceeds may differ materially. This presentation contains forward-looking statements; see "Forward-Looking Statements" and the risk factors in the registration statement on Form S-4 filed with the SEC. This presentation does not constitute an offer to sell or a solicitation of an offer to buy any securities.
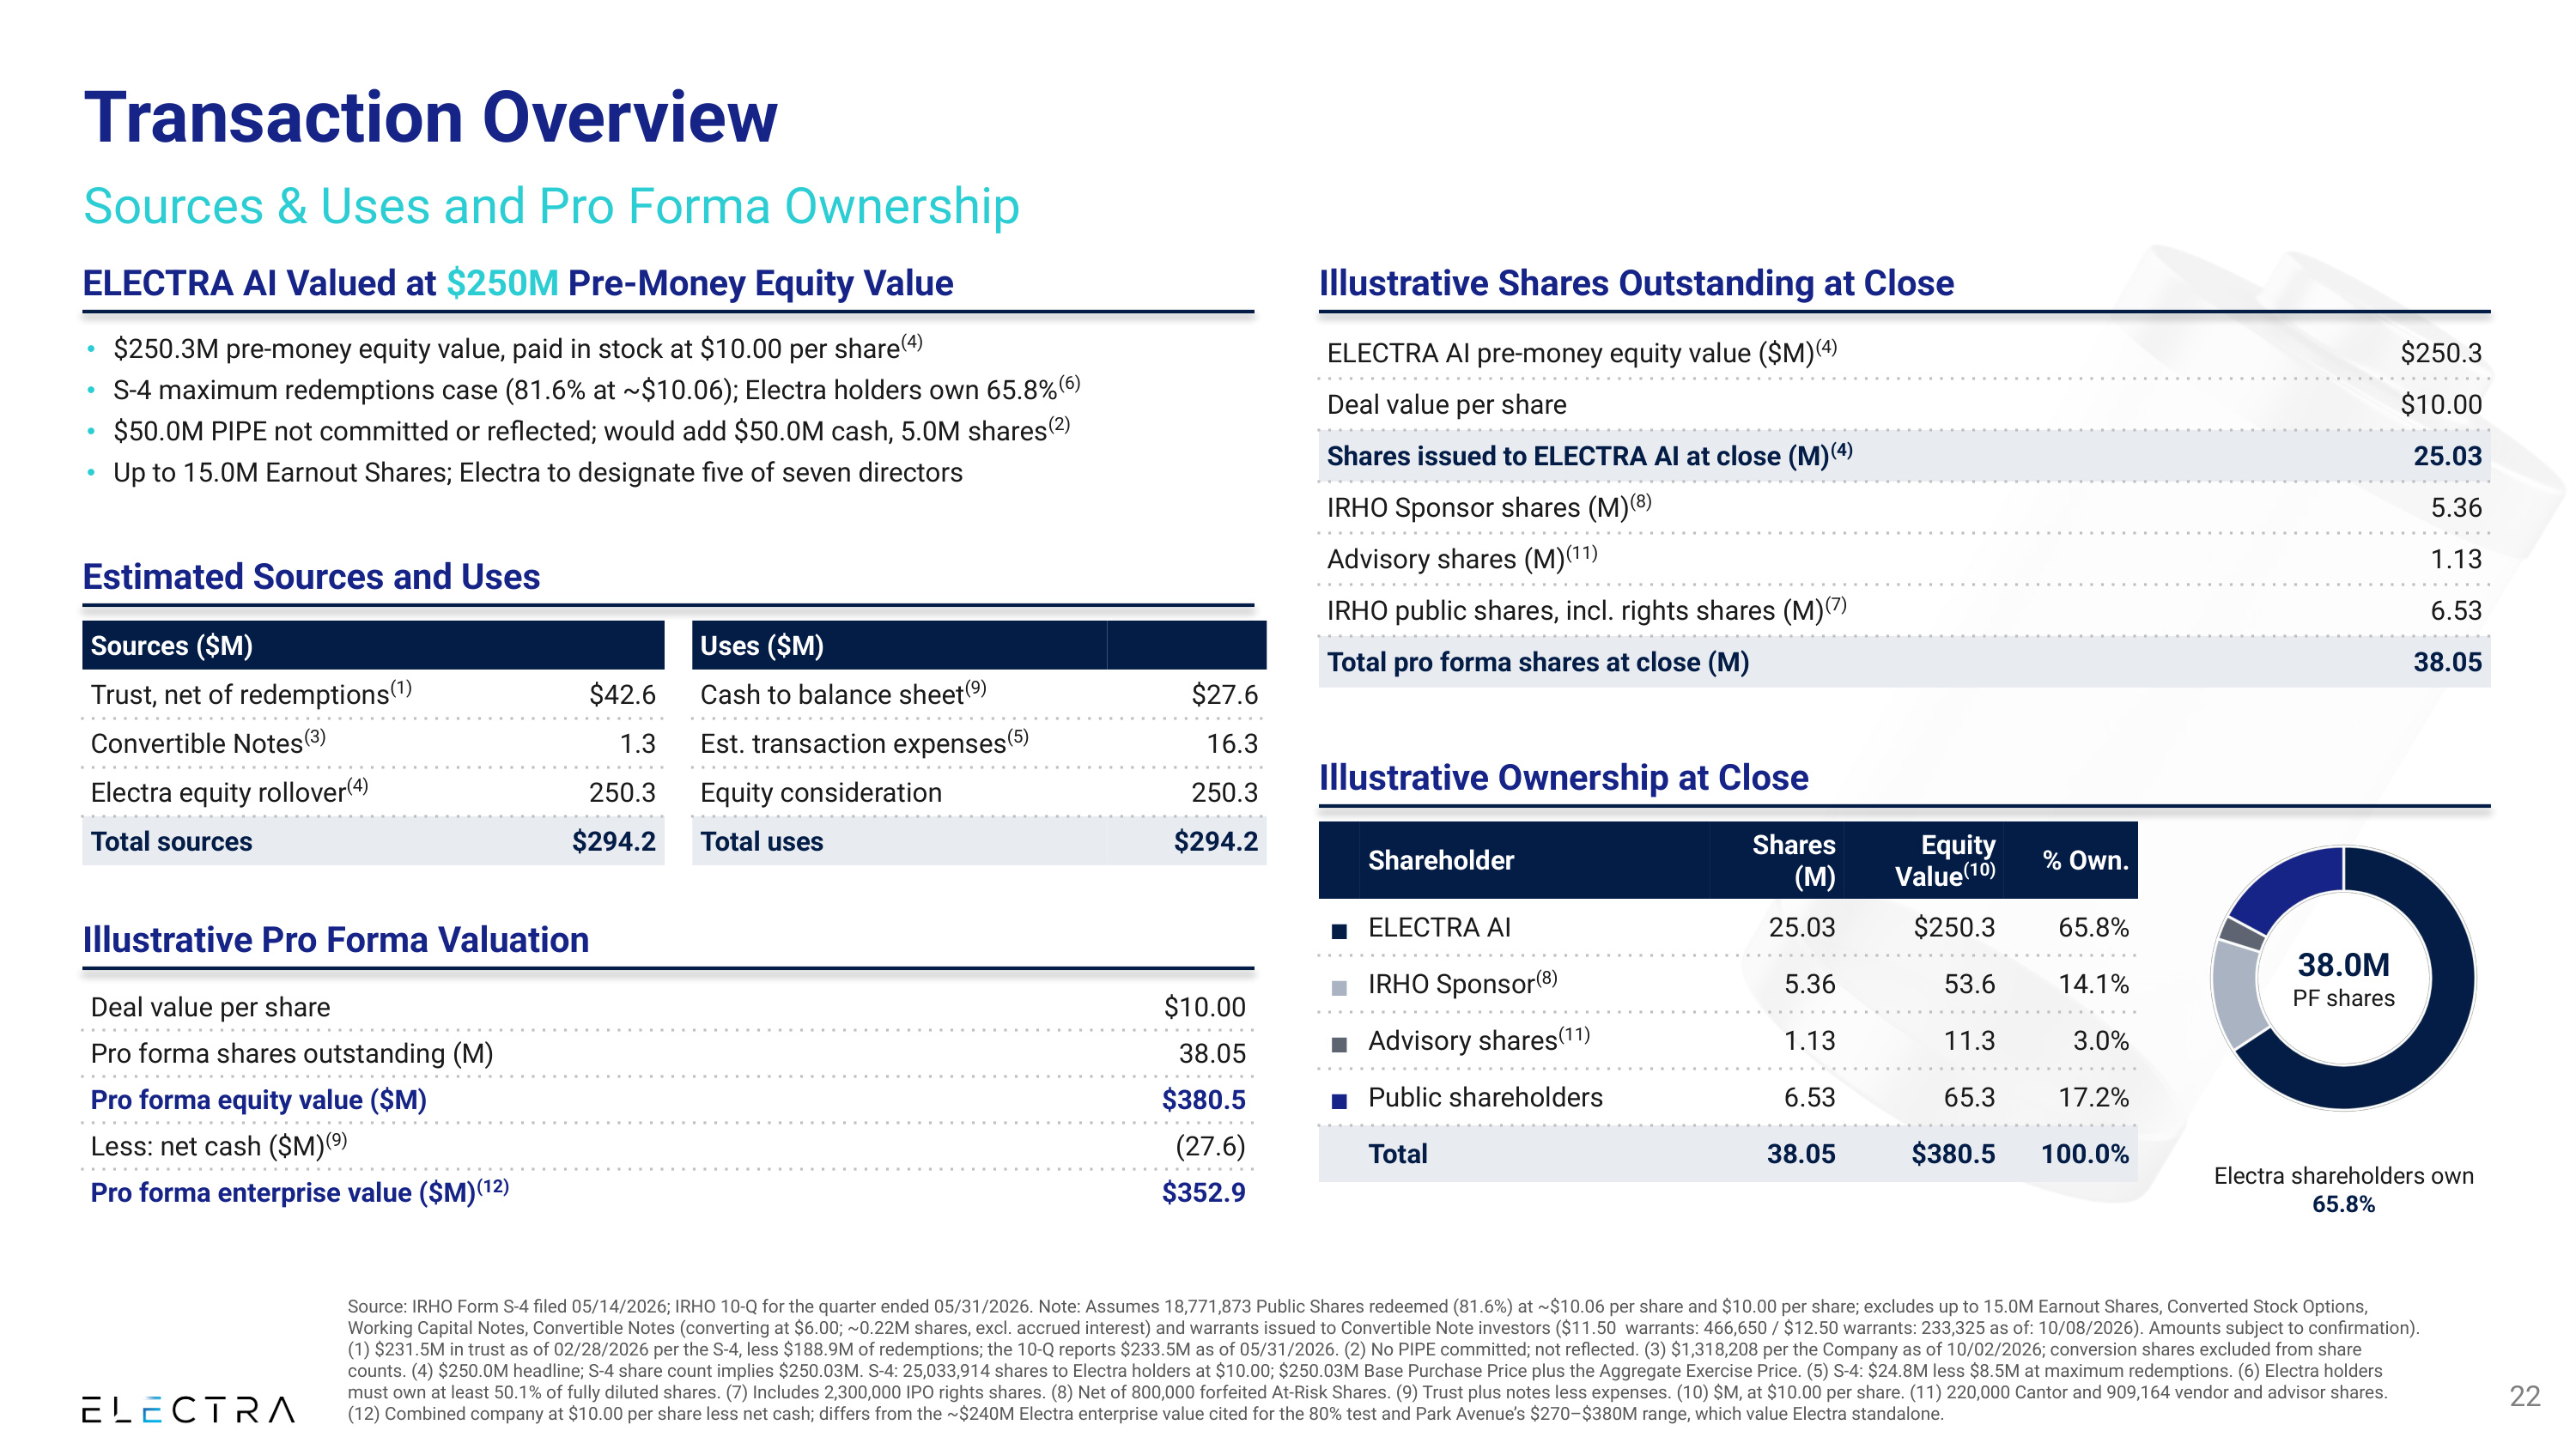
Transaction Overview Sources & Uses and Pro Forma Ownership 22 ELECTRA AI Valued at $250M Pre-Money Equity Value • $250.3M pre-money equity value, paid in stock at $10.00 per share(4) • S-4 maximum redemptions case (81.6% at ~$10.06); Electra holders own 65.8%(6) • $50.0M PIPE not committed or reflected; would add $50.0M cash, 5.0M shares(2) • Up to 15.0M Earnout Shares; Electra to designate five of seven directors Estimated Sources and Uses Sources ($M) Uses ($M) Trust, net of redemptions(1) $42.6 Cash to balance sheet(9) $27.6 Convertible Notes(3) 1.3 Est. transaction expenses(5) 16.3 Electra equity rollover(4) 250.3 Equity consideration 250.3 Total sources $294.2 Total uses $294.2 Illustrative Pro Forma Valuation Deal value per share $10.00 Pro forma shares outstanding (M) 38.05 Pro forma equity value ($M) $380.5 Less: net cash ($M)(9) (27.6) Pro forma enterprise value ($M)(12) $352.9 Illustrative Shares Outstanding at Close ELECTRA AI pre-money equity value ($M)(4) $250.3 Deal value per share $10.00 Shares issued to ELECTRA AI at close (M)(4) 25.03 IRHO Sponsor shares (M)(8) 5.36 Advisory shares (M)(11) 1.13 IRHO public shares, incl. rights shares (M)(7) 6.53 Total pro forma shares at close (M) 38.05 Illustrative Ownership at Close Shareholder Shares (M) Equity Value(10) % Own. ■ELECTRA AI 25.03 $250.3 65.8% ■IRHO Sponsor(8) 5.36 53.6 14.1% ■Advisory shares(11) 1.13 11.3 3.0% ■Public shareholders 6.53 65.3 17.2% Total 38.05 $380.5 100.0% 38.0M PF shares Electra shareholders own 65.8% Source: IRHO Form S-4 filed 05/14/2026; IRHO 10-Q for the quarter ended 05/31/2026. Note: Assumes 18,771,873 Public Shares redeemed (81.6%) at ~$10.06 per share and $10.00 per share; excludes up to 15.0M Earnout Shares, Converted Stock Options, Working Capital Notes, Convertible Notes (converting at $6.00; ~0.22M shares, excl. accrued interest) and warrants issued to Convertible Note investors ($11.50 warrants: 466,650 / $12.50 warrants: 233,325 as of: 10/08/2026). Amounts subject to confirmation). (1) $231.5M in trust as of 02/28/2026 per the S-4, less $188.9M of redemptions; the 10-Q reports $233.5M as of 05/31/2026. (2) No PIPE committed; not reflected. (3) $1,318,208 per the Company as of 10/02/2026; conversion shares excluded from share counts. (4) $250.0M headline; S-4 share count implies $250.03M. S-4: 25,033,914 shares to Electra holders at $10.00; $250.03M Base Purchase Price plus the Aggregate Exercise Price. (5) S-4: $24.8M less $8.5M at maximum redemptions. (6) Electra holders must own at least 50.1% of fully diluted shares. (7) Includes 2,300,000 IPO rights shares. (8) Net of 800,000 forfeited At-Risk Shares. (9) Trust plus notes less expenses. (10) $M, at $10.00 per share. (11) 220,000 Cantor and 909,164 vendor and advisor shares. (12) Combined company at $10.00 per share less net cash; differs from the ~$240M Electra enterprise value cited for the 80% test and Park Avenue's $270–$380M range, which value Electra standalone.
electrabrain.ai