Shareholder Report
Aug. 31, 2026
USD ($)
Holding
FUND COSTS FOR THE LAST year ENDED August 31, 2026 (BASED ON A HYPOTHETICAL $10,000 INVESTMENT)
COSTS OF A $10,000 INVESTMENT |
COSTS PAID AS A PERCENTAGE OF A $10,000 INVESTMENT | |
Schwab International Dividend Equity ETF |
$9 |
0.08% |
MANAGEMENT’S DISCUSSION OF FUND PERFORMANCE
For the 12-month reporting period ended August 31, 2026, the fund’s NAV return was 22.94% (for an explanation of NAV return, please refer to footnote 2 on the following page). The MSCI EAFE® Index (Net)1, which serves as the fund’s regulatory index and provides a broad measure of market performance, returned 21.62%. The fund generally invests in securities that are included in the Dow Jones International Dividend 100 Index (Net)1 which returned 22.79% during the same period. The fund does not seek to track the regulatory index.
Top contributors to total return:
■ Australian securities, including BHP Group Ltd.
■ French securities
Top detractors from total return:
■ Indian securities, including Infosys Ltd.
■ Indonesian securities
Portfolio holdings may have changed since the report date.
1
The net version of the index reflects reinvested dividends net of withholding taxes but reflects no deductions for expenses or other taxes.
Performance of Hypothetical $10,000 Investment (April 29, 2021 - August 31, 2026)1,2,3,4
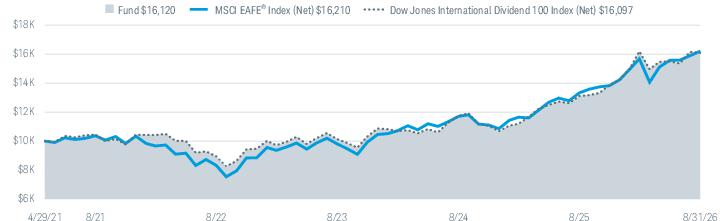
All total returns on this page assume dividends and distributions were reinvested. Index figures do not include trading and management costs, which would lower
performance. Indices are unmanaged and cannot be invested in directly. Performance results less than one year are not annualized.
For index definitions, please see www.schwabassetmanagement.com/glossary.
Shares are bought and sold at market price, which may be higher or lower than the net asset value (NAV). Brokerage commissions will reduce returns.
Index ownership — Dow Jones
®
is a registered trademark of Dow Jones Trademark Holdings LLC (Dow Jones). The Dow Jones International Dividend 100 Index is a product of
S&P Dow Jones Indices LLC and/or its affiliates, and has been licensed for use by Charles Schwab Investment Management, Inc., dba Schwab Asset Management. The
Schwab International Dividend Equity ETF is not sponsored, endorsed, sold or promoted by S&P Dow Jones Indices LLC, Dow Jones, or any of their respective affiliates and
neither S&P Dow Jones Indices LLC, Dow Jones, nor any of their respective affiliates make any representation regarding the advisability of investing in such product.
*
Inception (04/29/2021) represents the date that the shares began trading in the secondary market.
1
Performance does not reflect the deduction of taxes that a shareholder would pay on fund distributions or on the redemption or sale of fund shares.
2
Performance is shown on a NAV basis. The fund’s per share NAV is the value of one share of the fund. NAV is calculated by taking the fund’s total assets (including the fair
value of securities owned), subtracting liabilities, and dividing by the number of shares outstanding. Returns assume that dividends and capital gain distributions have been
reinvested in the fund at NAV.
3
The fund’s performance relative to the index may be affected by fair-value pricing and timing differences in foreign exchange calculations.
4
The net version of the index reflects reinvested dividends net of withholding taxes but reflects no deductions for expenses or other taxes.
5
The MSCI EAFE
®
Index (Net) serves as the fund’s regulatory index and provides a broad measure of market performance. The fund generally invests in securities that are
included in the Dow Jones International Dividend 100 Index (Net). The fund does not seek to track the regulatory index.
Average Annual Total Returns
Fund and Inception Date |
1 Year |
5 Years |
Since Inception* |
Fund: Schwab International Dividend Equity ETF (04/29/2021)1,2,3 |
22.94% |
9.06% |
9.35% |
MSCI EAFE® Index (Net)4,5 |
21.62% |
9.35% |
9.47% |
Dow Jones International Dividend 100 Index (Net)4 |
22.79% |
9.03% |
9.32% |
All total returns on this page assume dividends and distributions were reinvested. Index figures do not include trading and management costs, which would lower
performance. Indices are unmanaged and cannot be invested in directly. Performance results less than one year are not annualized.
For index definitions, please see www.schwabassetmanagement.com/glossary.
Shares are bought and sold at market price, which may be higher or lower than the net asset value (NAV). Brokerage commissions will reduce returns.
Index ownership — Dow Jones
®
is a registered trademark of Dow Jones Trademark Holdings LLC (Dow Jones). The Dow Jones International Dividend 100 Index is a product of
S&P Dow Jones Indices LLC and/or its affiliates, and has been licensed for use by Charles Schwab Investment Management, Inc., dba Schwab Asset Management. The
Schwab International Dividend Equity ETF is not sponsored, endorsed, sold or promoted by S&P Dow Jones Indices LLC, Dow Jones, or any of their respective affiliates and
neither S&P Dow Jones Indices LLC, Dow Jones, nor any of their respective affiliates make any representation regarding the advisability of investing in such product.
*
Inception (04/29/2021) represents the date that the shares began trading in the secondary market.
1
Performance does not reflect the deduction of taxes that a shareholder would pay on fund distributions or on the redemption or sale of fund shares.
2
Performance is shown on a NAV basis. The fund’s per share NAV is the value of one share of the fund. NAV is calculated by taking the fund’s total assets (including the fair
value of securities owned), subtracting liabilities, and dividing by the number of shares outstanding. Returns assume that dividends and capital gain distributions have been
reinvested in the fund at NAV.
3
The fund’s performance relative to the index may be affected by fair-value pricing and timing differences in foreign exchange calculations.
4
The net version of the index reflects reinvested dividends net of withholding taxes but reflects no deductions for expenses or other taxes.
5
The MSCI EAFE
®
Index (Net) serves as the fund’s regulatory index and provides a broad measure of market performance. The fund generally invests in securities that are
included in the Dow Jones International Dividend 100 Index (Net). The fund does not seek to track the regulatory index.
Statistics
Net Assets (millions) |
$2,613 |
Number of Holdings (excludes derivatives) |
103 |
Portfolio Turnover Rate (excludes in-kind transactions) |
29% |
Advisory Fees Paid by the Fund |
$1,564,195 |
Weighted Average Market Cap (millions) |
$94,273 |
Price/Earnings Ratio (P/E) |
15.2 |
Price/Book Ratio (P/B) |
2.7 |
Foreign Tax Paid and Passed Through |
$7,080,287 |
Gross Income from Foreign Sources |
$93,641,251 |
Qualified Dividend Income |
$66,699,231 |
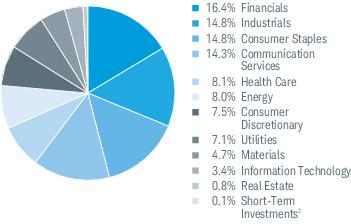
Sector Weightings % of Investments1
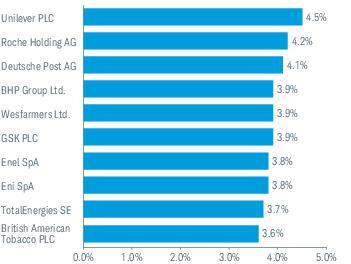
Top Equity Holdings % of Net Assets
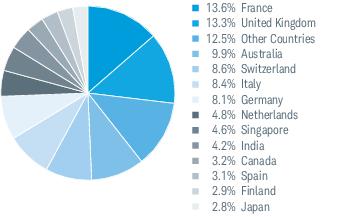
Country Weightings % of Investments
1
Portfolio holdings may have changed since the report date.
The Sector/Industry classifications in this report use the Global Industry Classification Standard (GICS) which wa
s dev
eloped by and is the exclu
sive property of MSC
I Inc. (MSCI) and Standard & Poor’s (S&P). GICS is a service mark of MSCI and S&P and has been licensed fo
r use
by Charles Schwab & Co., Inc.1
Excludes derivatives.
2
Includes the fund’s position(s) in money market mutual funds registered under the Investment Company Act of 1940, as amended.
Top Equity Holdings % of Net Assets
Portfolio holdings may have changed since the report date.
FUND COSTS FOR THE LAST year ENDED August 31, 2026 (BASED ON A HYPOTHETICAL $10,000 INVESTMENT)
COSTS OF A $10,000 INVESTMENT |
COSTS PAID AS A PERCENTAGE OF A $10,000 INVESTMENT | |
Schwab International Equity ETF |
$3 |
0.03% |
MANAGEMENT’S DISCUSSION OF FUND PERFORMANCE
For the 12-month reporting period ended August 31, 2026, the fund’s NAV return was 28.65% (for an explanation of NAV return, please refer to footnote 2 on the following page). The MSCI EAFE® Index (Net)1, which serves as the fund’s regulatory index and provides a broad measure of market performance, returned 21.62%. The fund generally invests in securities that are included in the FTSE Developed ex US Index (Net)1 which returned 28.50% during the same period. The fund does not seek to track the regulatory index.
Top contributors to total return:
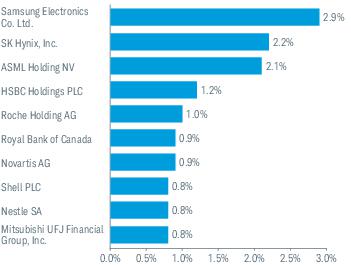
■ South Korean securities, including Samsung Electronics Co. Ltd.
■ Japanese securities
Over the reporting period, no markets detracted from the return of the fund. However, the smallest contributors to total return were:
■ Securities from the United States, including Sunbelt Rentals Holdings, Inc.
■ Securities from New Zealand
Portfolio holdings may have changed since the report date.
1
The net version of the index reflects reinvested dividends net of withholding taxes but reflects no deductions for expenses or other taxes.
Performance of Hypothetical $10,000 Investment (August 31, 2016 - August 31, 2026)1,2,3,4
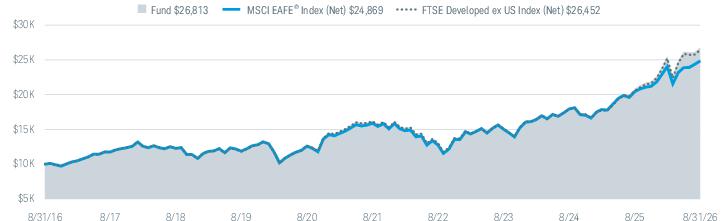
All total returns on this page assume dividends and distributions were reinvested. Index figures do not include trading and management costs, which would lower
performance. Indices are unmanaged and cannot be invested in directly. Performance results less than one year are not annualized.
For index definitions, please see www.schwabassetmanagement.com/glossary.
Shares are bought and sold at market price, which may be higher or lower than the net asset value (NAV). Brokerage commissions will reduce returns.
Index ownership — FTSE is a trademark of the London Stock Exchange Group companies (LSEG) and is used by the fund under license. The Schwab International Equity ETF is
not sponsored, endorsed, sold or promoted by FTSE nor LSEG and neither FTSE nor LSEG makes any representation regarding the advisability of investing in shares of the
fund. Fees payable under the license are paid by the investment adviser.
1
Performance does not reflect the deduction of taxes that a shareholder would pay on fund distributions or on the redemption or sale of fund shares.
2
Performance is shown on a NAV basis. The fund’s per share NAV is the value of one share of the fund. NAV is calculated by taking the fund’s total assets (including the fair
value of securities owned), subtracting liabilities, and dividing by the number of shares outstanding. Returns assume that dividends and capital gain distributions have been
reinvested in the fund at NAV.
3
The fund’s performance relative to the index may be affected by fair-value pricing and timing differences in foreign exchange calculations.
4
The net version of the index reflects reinvested dividends net of withholding taxes but reflects no deductions for expenses or other taxes.
5
The MSCI EAFE
®
Index (Net) serves as the fund’s regulatory index and provides a broad measure of market performance. The fund generally invests in securities that are
included in the FTSE Developed ex US Index (Net). The fund does not seek to track the regulatory index.
Average Annual Total Returns
Fund and Inception Date |
1 Year |
5 Years |
10 Years |
Fund: Schwab International Equity ETF (11/03/2009)1,2,3 |
28.65% |
10.53% |
10.37% |
MSCI EAFE® Index (Net)4,5 |
21.62% |
9.35% |
9.54% |
FTSE Developed ex US Index (Net)4 |
28.50% |
10.35% |
10.22% |
All total returns on this page assume dividends and distributions were reinvested. Index figures do not include trading and management costs, which would lower
performance. Indices are unmanaged and cannot be invested in directly. Performance results less than one year are not annualized.
For index definitions, please see www.schwabassetmanagement.com/glossary.
Shares are bought and sold at market price, which may be higher or lower than the net asset value (NAV). Brokerage commissions will reduce returns.
Index ownership — FTSE is a trademark of the London Stock Exchange Group companies (LSEG) and is used by the fund under license. The Schwab International Equity ETF is
not sponsored, endorsed, sold or promoted by FTSE nor LSEG and neither FTSE nor LSEG makes any representation regarding the advisability of investing in shares of the
fund. Fees payable under the license are paid by the investment adviser.
1
Performance does not reflect the deduction of taxes that a shareholder would pay on fund distributions or on the redemption or sale of fund shares.
2
Performance is shown on a NAV basis. The fund’s per share NAV is the value of one share of the fund. NAV is calculated by taking the fund’s total assets (including the fair
value of securities owned), subtracting liabilities, and dividing by the number of shares outstanding. Returns assume that dividends and capital gain distributions have been
reinvested in the fund at NAV.
3
The fund’s performance relative to the index may be affected by fair-value pricing and timing differences in foreign exchange calculations.
4
The net version of the index reflects reinvested dividends net of withholding taxes but reflects no deductions for expenses or other taxes.
5
The MSCI EAFE
®
Index (Net) serves as the fund’s regulatory index and provides a broad measure of market performance. The fund generally invests in securities that are
included in the FTSE Developed ex US Index (Net). The fund does not seek to track the regulatory index.
Statistics
Net Assets (millions) |
$69,684 |
Number of Holdings (excludes derivatives) |
1,476 |
Portfolio Turnover Rate (excludes in-kind transactions) |
4% |
Advisory Fees Paid by the Fund |
$17,786,344 |
Weighted Average Market Cap (millions) |
$163,241 |
Price/Earnings Ratio (P/E) |
16.6 |
Price/Book Ratio (P/B) |
2.3 |
Foreign Tax Paid and Passed Through |
$123,166,051 |
Gross Income from Foreign Sources |
$1,640,946,842 |
Qualified Dividend Income |
$1,539,917,697 |
Sector Weightings % of Investments1
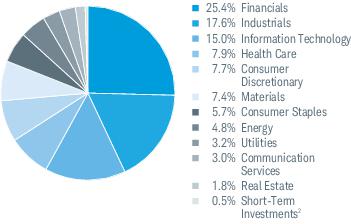
Top Equity Holdings % of Net Assets
Country Weightings % of Investments
1
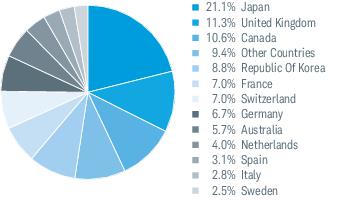
Portfolio holdings may have changed since the report date.
The Sector/Industry classifications in this report use the Global Industry Classification Standard (GICS) which was developed by and is the exclusive
prope
rty of MSCI Inc. (MSCI) and Standard & Poor’s (S&P). GICS is a service mark of MSCI and S&P and has been licensed for use by Charles Schwab & Co., Inc.
1
Excludes derivatives.
2
Includes the fund’s position(s) in money market mutual funds registered under the Investment Company Act of 1940, as amended.
Top Equity Holdings % of Net Assets
Portfolio holdings may have changed since the report date.
FUND COSTS FOR THE LAST year ENDED August 31, 2026 (BASED ON A HYPOTHETICAL $10,000 INVESTMENT)
COSTS OF A $10,000 INVESTMENT |
COSTS PAID AS A PERCENTAGE OF A $10,000 INVESTMENT | |
Schwab International Small-Cap Equity ETF |
$9 |
0.08% * |
*
Effective June 11, 2026, the advisory fee of the fund was reduced from 0.08% to 0.06%. The amount shown is the aggregate advisory fee paid during the period.
MANAGEMENT’S DISCUSSION OF FUND PERFORMANCE
For the 12-month reporting period ended August 31, 2026, the fund’s NAV return was 20.33% (for an explanation of NAV return, please refer to footnote 2 on the following page). The MSCI EAFE® Index (Net)1, which serves as the fund’s regulatory index and provides a broad measure of market performance, returned 21.62%. The fund generally invests in securities that are included in the FTSE Developed Small Cap ex US Liquid Index (Net)1 which returned 20.03% during the same period. The fund does not seek to track the regulatory index.
Top contributors to total return:
■
Canadian securities, including Celestica, Inc.
■
Japanese securities
Top detractors from total return:
■
Securities from Hong Kong, including Guotai Junan International Holdings Ltd.
■
Securities from the United States
Portfolio holdings may have changed since the report date.
1
The net version of the index reflects reinvested dividends net of withholding taxes but reflects no deductions for expenses or other taxes.
Performance of Hypothetical $10,000 Investment (August 31, 2016 - August 31, 2026)1,2,3,4
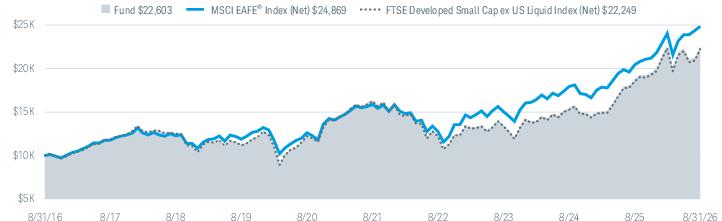
All total returns on this page assume dividends and distributions were reinvested. Index figures do not include trading and management costs, which would lower
performance. Indices are unmanaged and cannot be invested in directly. Performance results less than one year are not annualized.
For index definitions, please see www.schwabassetmanagement.com/glossary.
Shares are bought and sold at market price, which may be higher or lower than the net asset value (NAV). Brokerage commissions will reduce returns.
Index ownership — FTSE is a trademark of the London Stock Exchange Group companies (LSEG) and is used by the fund under license. The Schwab International Small-Cap
Equity ETF is not sponsored, endorsed, sold or promoted by FTSE nor LSEG and neither FTSE nor LSEG makes any representation regarding the advisability of investing in
shares of the fund. Fees payable under the license are paid by the investment adviser.
1
Performance does not reflect the deduction of taxes that a shareholder would pay on fund distributions or on the redemption or sale of fund shares.
2
Performance is shown on a NAV basis. The fund’s per share NAV is the value of one share of the fund. NAV is calculated by taking the fund’s total assets (including the fair
value of securities owned), subtracting liabilities, and dividing by the number of shares outstanding. Returns assume that dividends and capital gain distributions have been
reinvested in the fund at NAV.
3
The fund’s performance relative to the index may be affected by fair-value pricing and timing differences in foreign exchange calculations.
4
The net version of the index reflects reinvested dividends net of withholding taxes but reflects no deductions for expenses or other taxes.
5
The MSCI EAFE
®
Index (Net) serves as the fund’s regulatory index and provides a broad measure of market performance. The fund generally invests in securities that are
included in the FTSE Developed Small Cap ex US Liquid Index (Net). The fund does not seek to track the regulatory index.
Average Annual Total Returns
Fund and Inception Date |
1 Year |
5 Years |
10 Years |
Fund: Schwab International Small-Cap Equity ETF (01/14/2010) 1,2,3 |
20.33% |
6.66% |
8.50% |
MSCI EAFE® Index (Net) 4,5 |
21.62% |
9.35% |
9.54% |
FTSE Developed Small Cap ex US Liquid Index (Net) 4 |
20.03% |
6.48% |
8.33% |
All total returns on this page assume dividends and distributions were reinvested. Index figures do not include trading and management costs, which would lower
performance. Indices are unmanaged and cannot be invested in directly. Performance results less than one year are not annualized.
For index definitions, please see www.schwabassetmanagement.com/glossary.
Shares are bought and sold at market price, which may be higher or lower than the net asset value (NAV). Brokerage commissions will reduce returns.
Index ownership — FTSE is a trademark of the London Stock Exchange Group companies (LSEG) and is used by the fund under license. The Schwab International Small-Cap
Equity ETF is not sponsored, endorsed, sold or promoted by FTSE nor LSEG and neither FTSE nor LSEG makes any representation regarding the advisability of investing in
shares of the fund. Fees payable under the license are paid by the investment adviser.
1
Performance does not reflect the deduction of taxes that a shareholder would pay on fund distributions or on the redemption or sale of fund shares.
2
Performance is shown on a NAV basis. The fund’s per share NAV is the value of one share of the fund. NAV is calculated by taking the fund’s total assets (including the fair
value of securities owned), subtracting liabilities, and dividing by the number of shares outstanding. Returns assume that dividends and capital gain distributions have been
reinvested in the fund at NAV.
3
The fund’s performance relative to the index may be affected by fair-value pricing and timing differences in foreign exchange calculations.
4
The net version of the index reflects reinvested dividends net of withholding taxes but reflects no deductions for expenses or other taxes.
5
The MSCI EAFE
®
Index (Net) serves as the fund’s regulatory index and provides a broad measure of market performance. The fund generally invests in securities that are
included in the FTSE Developed Small Cap ex US Liquid Index (Net). The fund does not seek to track the regulatory index.
Statistics
Net Assets (millions) |
$5,771 |
Number of Holdings (excludes derivatives) |
2,182 |
Portfolio Turnover Rate (excludes in-kind transactions) |
26% |
Advisory Fees Paid by the Fund |
$3,945,680 |
Weighted Average Market Cap (millions) |
$3,512 |
Price/Earnings Ratio (P/E) |
15.2 |
Price/Book Ratio (P/B) |
1.6 |
Foreign Tax Paid and Passed Through |
$11,730,854 |
Gross Income from Foreign Sources |
$157,275,588 |
Qualified Dividend Income |
$123,543,360 |
Sector Weightings % of Investments1
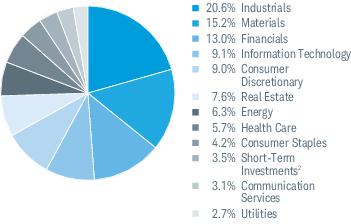
Top Equity Holdings % of Net Assets
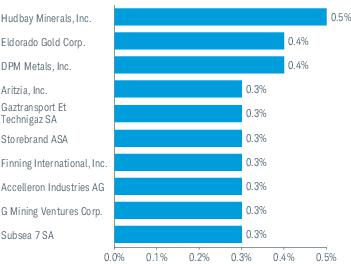
Country Weightings % of Investments
1
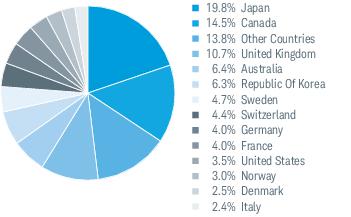
Portfolio holdings may have changed since the report date.
The Sector/Industry classifications in this report use the Global Industry Classification Standard (GICS) which was developed by and is the exclusive property of MSCI Inc.
(MSCI) and Standard & Poor’s (S&P). GICS is a service mark o
f M
SCI and S&P and has been licensed for use by Charles Schwab & Co., Inc.1
Excludes derivatives.
2
Includes the fund’s position(s) in money market mutual funds registered under the Investment Company Act of 1940, as amended.
Top Equity Holdings % of Net Assets
Portfolio holdings may have changed since the report date.
FUND CHANGES
This is a summary of certain changes to the fund since September 1, 2025. For more complete information, you may review the fund’s prospectus at www.schwabassetmanagement.com/prospectus or upon request by calling 1-866-414-6349 or by sending an email request to orders@mysummaryprospectus.com.
■ Effective June 11, 2026, the management fee of the fund was reduced from 0.08% to 0.06%.
This is a summary of certain changes to the fund since September 1, 2025. For more complete information, you may review the fund’s prospectus at www.schwabassetmanagement.com/prospectus or upon request by calling 1-866-414-6349 or by sending an email request to orders@mysummaryprospectus.com.
FUND COSTS FOR THE LAST year ENDED August 31, 2026 (BASED ON A HYPOTHETICAL $10,000 INVESTMENT)
COSTS OF A $10,000 INVESTMENT |
COSTS PAID AS A PERCENTAGE OF A $10,000 INVESTMENT | |
Schwab Emerging Markets Equity ETF |
$8 |
0.07% * |
*
Effective June 11, 2026, the advisory fee of the fund was reduced from 0.07% to 0.06%. The amount shown is the aggregate advisory fee paid during the period.
MANAGEMENT’S DISCUSSION OF FUND PERFORMANCE
For the 12-month reporting period ended August 31, 2026, the fund’s NAV return was 22.32% (for an explanation of NAV return, please refer to footnote 2 on the following page). The MSCI Emerging Markets Index (Net)1, which serves as the fund’s regulatory index and provides a broad measure of market performance, returned 39.25%. The fund generally invests in securities that are included in the FTSE Emerging Index (Net)1 which returned 22.05% during the same period.
Top contributors to total return:
■
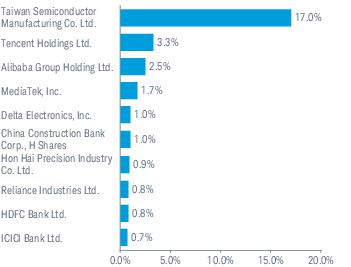
Taiwanese securities, including Taiwan Semiconductor Manufacturing Co. Ltd.
■
Brazilian securities
Top detractors from total return:
■
Chinese securities, including Tencent Holdings Ltd.
■
Indian securities
Portfolio holdings may have changed since the report date.
1
The net version of the index reflects reinvested dividends net of withholding taxes but reflects no deductions for expenses or other taxes.
Performance of Hypothetical $10,000 Investment (August 31, 2016 - August 31, 2026)1,2,3,4
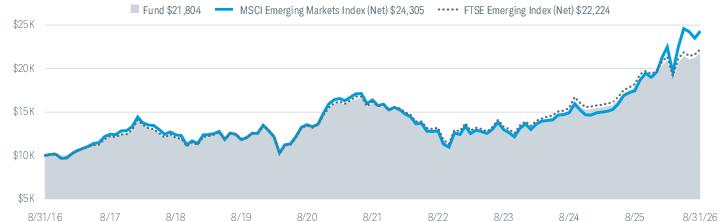
All total returns on this page assume dividends and distributions were reinvested. Index figures do not include trading and management costs, which would lower
performance. Indices are unmanaged and cannot be invested in directly. Performance results less than one year are not annualized.
For index definitions, please see www.schwabassetmanagement.com/glossary.
Shares are bought and sold at market price, which may be higher or lower than the net asset value (NAV). Brokerage commissions will reduce returns.
Index ownership — FTSE is a trademark of the London Stock Exchange Group companies (LSEG) and is used by the fund under license. The Schwab Emerging Markets Equity
ETF is not sponsored, endorsed, sold or promoted by FTSE nor LSEG and neither FTSE nor LSEG makes any representation regarding the advisability of investing in shares of
the fund. Fees payable under the license are paid by the investment adviser.
1
Performance does not reflect the deduction of taxes that a shareholder would pay on fund distributions or on the redemption or sale of fund shares.
2
Performance is shown on a NAV basis. The fund’s per share NAV is the value of one share of the fund. NAV is calculated by taking the fund’s total assets (including the fair
value of securities owned), subtracting liabilities, and dividing by the number of shares outstanding. Returns assume that dividends and capital gain distributions have been
reinvested in the fund at NAV.
3
The fund’s performance relative to the index may be affected by fair-value pricing and timing differences in foreign exchange calculations.
4
The net version of the index reflects reinvested dividends net of withholding taxes but reflects no deductions for expenses or other taxes.
5
The MSCI Emerging Markets Index (Net) serves as the fund’s regulatory index and provides a broad measure of market performance. The fund generally invests in securities
that are included in the FTSE Emerging Index (Net). The fund does not seek to track the regulatory index.
Average Annual Total Returns
Fund and Inception Date |
1 Year |
5 Years |
10 Years |
Fund: Schwab Emerging Markets Equity ETF (01/14/2010)1,2,3 |
22.32% |
6.33% |
8.11% |
MSCI Emerging Markets Index (Net)4,5 |
39.25% |
8.18% |
9.29% |
FTSE Emerging Index (Net)4 |
22.05% |
6.53% |
8.31% |
All total returns on this page assume dividends and distributions were reinvested. Index figures do not include trading and management costs, which would lower
performance. Indices are unmanaged and cannot be invested in directly. Performance results less than one year are not annualized.
For index definitions, please see www.schwabassetmanagement.com/glossary.
Shares are bought and sold at market price, which may be higher or lower than the net asset value (NAV). Brokerage commissions will reduce returns.
Index ownership — FTSE is a trademark of the London Stock Exchange Group companies (LSEG) and is used by the fund under license. The Schwab Emerging Markets Equity
ETF is not sponsored, endorsed, sold or promoted by FTSE nor LSEG and neither FTSE nor LSEG makes any representation regarding the advisability of investing in shares of
the fund. Fees payable under the license are paid by the investment adviser.
1
Performance does not reflect the deduction of taxes that a shareholder would pay on fund distributions or on the redemption or sale of fund shares.
2
Performance is shown on a NAV basis. The fund’s per share NAV is the value of one share of the fund. NAV is calculated by taking the fund’s total assets (including the fair
value of securities owned), subtracting liabilities, and dividing by the number of shares outstanding. Returns assume that dividends and capital gain distributions have been
reinvested in the fund at NAV.
3
The fund’s performance relative to the index may be affected by fair-value pricing and timing differences in foreign exchange calculations.
4
The net version of the index reflects reinvested dividends net of withholding taxes but reflects no deductions for expenses or other taxes.
5
The MSCI Emerging Markets Index (Net) serves as the fund’s regulatory index and provides a broad measure of market performance. The fund generally invests in securities
that are included in the FTSE Emerging Index (Net). The fund does not seek to track the regulatory index.
Statistics
Net Assets (millions) |
$13,003 |
Number of Holdings (excludes derivatives) |
2,193 |
Portfolio Turnover Rate (excludes in-kind transactions) |
4% |
Advisory Fees Paid by the Fund |
$8,082,708 |
Weighted Average Market Cap (millions) |
$406,921 |
Price/Earnings Ratio (P/E) |
16.1 |
Price/Book Ratio (P/B) |
2.5 |
Foreign Tax Paid and Passed Through |
$37,741,794 |
Gross Income from Foreign Sources |
$301,773,579 |
Qualified Dividend Income |
$136,504,882 |
Sector Weightings % of Investments1
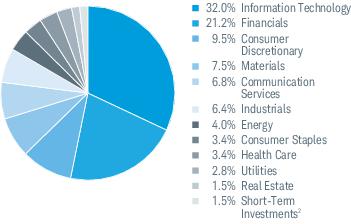
Top Equity Holdings % of Net Assets
Country Weightings % of Investments
1
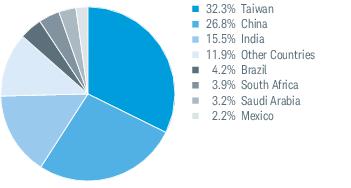
Portfolio holdings may have changed since the report date.
The Sector/Industry classifications in this report use the Global Industry Classification Standard (GICS) which was developed by and is the exclusive property of MSCI Inc.
(MSCI) and Standard & Poor’s (S&P). GICS is a service mark of MSCI and S&P and has been licensed for use by Charles Schwab & Co., Inc.
1
Excludes derivatives.
2
Includes the fund’s position(s) in money market mutual funds registered under the Investment Company Act of 1940, as amended.
Top Equity Holdings % of Net Assets
Portfolio holdings may have changed since the report date.
FUND CHANGES
This is a summary of certain changes to the fund since September 1, 2025. For more complete information, you may review the fund’s prospectus at www.schwabassetmanagement.com/prospectus or upon request by calling 1-866-414-6349 or by sending an email request to orders@mysummaryprospectus.com.
■ Effective June 11, 2026, the management fee of the fund was reduced from 0.07% to 0.06%.
FUND COSTS FOR THE LAST year ENDED August 31, 2026 (BASED ON A HYPOTHETICAL $10,000 INVESTMENT)
COSTS OF A $10,000 INVESTMENT |
COSTS PAID AS A PERCENTAGE OF A $10,000 INVESTMENT | |
Schwab U.S. Broad Market ETF |
$3 |
0.03% |
MANAGEMENT’S DISCUSSION OF FUND PERFORMANCE
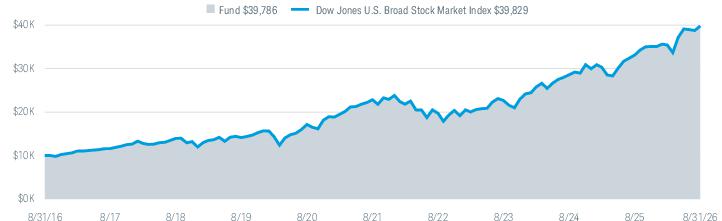
For the 12-month reporting period ended August 31, 2026, the fund’s NAV return was 20.14% (for an explanation of NAV return, please refer to footnote 2 on the following page). The Dow Jones U.S. Broad Stock Market Index returned 20.15% during the same period. Differences between the return of the fund and the return of the Dow Jones U.S. Broad Stock Market Index may be attributable to, among other things, the operational and transactional costs incurred by the fund and not the index.
Over the reporting period, no sectors detracted from the return of the fund. However, the smallest contributors to total return were:
■ Utilities sector securities, including Vistra Corp. (which detracted from the total return of the fund)
■ Real estate sector securities
Top contributors to total return:
■ Information technology sector securities, including Apple, Inc.
■ Health care sector securities
Portfolio holdings may have changed since the report date.
Performance of Hypothetical $10,000 Investment (August 31, 2016 - August 31, 2026)1,2
All total returns on this page
assume
dividends and distributions were reinvested. Index figures do not include
trading and management costs, which would lower performance. Indices are unmanaged and cannot be invested in directly. Performance results less than one year are not annualized.
For index definitions, please see www.schwabassetmanagement.com/glossary.
Shares are bought and sold at market price, which may be higher or lower than the net asset value (NAV). Brokerage commissions will reduce returns.
Index ownership — Dow Jones
®
is a registered trademark of Dow Jones Trademark Holdings LLC (Dow Jones). The Dow Jones U.S. Broad Stock Market Index is a product of
S&P Dow Jones Indices LLC and/or its affiliates, and has been licensed for use by Charles Schwab Investment Management, Inc., dba Schwab Asset Management. The
Schwab U.S. Broad Market ETF is not sponsored, endorsed, sold or promoted by S&P Dow Jones Indices LLC, Dow Jones, or any of their respective affiliates and neither S&P
Dow Jones Indices LLC, Dow Jones, nor any of their respective affiliates make any representation regarding the advisability of investing in such product.
1
Performance does not reflect the deduction of taxes that a shareholder would pay on fund distributions or on the redemption or sale of fund shares.
2
Performance is shown on a NAV basis. The fund’s per share NAV is the value of one share of the fund. NAV is calculated by taking the fund’s total assets (including the fair
value of securities owned), subtracting liabilities, and dividing by the number of shares outstanding. Returns assume that dividends and capital gain distributions have been
reinvested in the fund at NAV.
Average Annual Total Returns
Fund and Inception Date |
1 Year |
5 Years |
10 Years |
Fund: Schwab U.S. Broad Market ETF (11/03/2009)1,2 |
20.14% |
11.75% |
14.81% |
Dow Jones U.S. Broad Stock Market Index |
20.15% |
11.76% |
14.82% |
All total returns on this page
assume
dividends and distributions were reinvested. Index figures do not include
trading and management costs, which would lower performance. Indices are unmanaged and cannot be invested in directly. Performance results less than one year are not annualized.
For index definitions, please see www.schwabassetmanagement.com/glossary.
Shares are bought and sold at market price, which may be higher or lower than the net asset value (NAV). Brokerage commissions will reduce returns.
Index ownership — Dow Jones
®
is a registered trademark of Dow Jones Trademark Holdings LLC (Dow Jones). The Dow Jones U.S. Broad Stock Market Index is a product of
S&P Dow Jones Indices LLC and/or its affiliates, and has been licensed for use by Charles Schwab Investment Management, Inc., dba Schwab Asset Management. The
Schwab U.S. Broad Market ETF is not sponsored, endorsed, sold or promoted by S&P Dow Jones Indices LLC, Dow Jones, or any of their respective affiliates and neither S&P
Dow Jones Indices LLC, Dow Jones, nor any of their respective affiliates make any representation regarding the advisability of investing in such product.
1
Performance does not reflect the deduction of taxes that a shareholder would pay on fund distributions or on the redemption or sale of fund shares.
2
Performance is shown on a NAV basis. The fund’s per share NAV is the value of one share of the fund. NAV is calculated by taking the fund’s total assets (including the fair
value of securities owned), subtracting liabilities, and dividing by the number of shares outstanding. Returns assume that dividends and capital gain distributions have been
reinvested in the fund at NAV.
Statistics
Net Assets (millions) |
$44,620 |
Number of Holdings (excludes derivatives) |
2,380 |
Portfolio Turnover Rate (excludes in-kind transactions) |
3% |
Advisory Fees Paid by the Fund |
$11,899,198 |
Weighted Average Market Cap (millions) |
$1,421,927 |
Price/Earnings Ratio (P/E) |
24.7 |
Price/Book Ratio (P/B) |
5.1 |
Dividends Received Deduction |
90.74% |
Qualified Dividend Income |
$411,867,930 |
Qualified Business Income Deduction (199A) |
$25,830,845 |
Sector Weightings % of Investments1
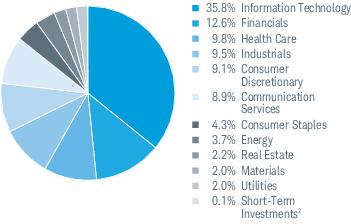
Top Equity Holdings % of Net Assets
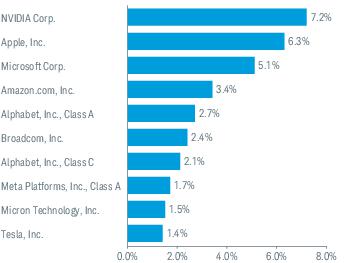
Portfolio holdings may have changed since the report date.
The Sector/Industry classifications in this report use the Global Industry Classification Standard (GICS) which was developed by and is the exclusive property of MSCI Inc.
(MSCI) and Standard & Poor’s (S&P). GICS is a service mark of MSCI and S&P and has been licensed for use by Charles Schwab & Co., Inc.
1
Excludes derivatives.
2
Includes the fund’s position(s) in money market mutual funds registered under the Investment Company Act of 1940, as amended.
Top Equity Holdings % of Net Assets
Portfolio holdings may have changed since the report date.
FUND COSTS FOR THE LAST year ENDED August 31, 2026 (BASED ON A HYPOTHETICAL $10,000 INVESTMENT)
COSTS OF A $10,000 INVESTMENT |
COSTS PAID AS A PERCENTAGE OF A $10,000 INVESTMENT | |
Schwab 1000 Index ETF |
$3 |
0.03% |
MANAGEMENT’S DISCUSSION OF FUND PERFORMANCE
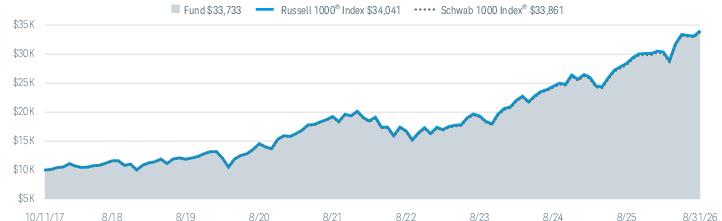
For the 12-month reporting period ended August 31, 2026, the fund’s NAV return was 20.03% (for an explanation of NAV return, please refer to footnote 2 on the following page). The Russell 1000® Index, which serves as the fund’s regulatory index and provides a broad measure of market performance, returned 19.77%. The fund generally invests in securities that are included in the Schwab 1000 Index® which returned 20.08% during the same period. The fund does not seek to track the regulatory index. Differences between the return of the fund and the return of the Schwab 1000 Index® may be attributable to, among other things, the operational and transactional costs incurred by the fund and not the index.
Over the reporting period, no sectors detracted from the return of the fund. However, the smallest contributors to total return were:
■
Utilities sector securities, including Vistra Corp. (which detracted from the total return of the fund)
■
Real estate sector securities
Top contributors to total return:
■
Information technology sector securities, including Apple, Inc.
■
Health care sector securities
Portfolio holdings may have changed since the report date.
Performance of Hypothetical $10,000 Investment (October 11, 2017 - August 31, 2026)1,2
All total returns on this page assume dividends and distributions were reinvested. Index figures do not include trading and management costs, which would lower
performance. Indices are unmanaged and cannot be invested in directly. Performance results less than one year are not annualized.
For index definitions, please see www.schwabassetmanagement.com/glossary.
Shares are bought and sold at market price, which may be higher or lower than the net asset value (NAV). Brokerage commissions will reduce returns.
*
Inception (10/11/2017) represents the date that the shares began trading in the secondary market.
1
Performance does not reflect the deduction of taxes that a shareholder would pay on fund distributions or on the redemption or sale of fund shares.
2
Performance is shown on a NAV basis. The fund’s per share NAV is the value of one share of the fund. NAV is calculated by taking the fund’s total assets (including the fair
value of securities owned), subtracting liabilities, and dividing by the number of shares outstanding. Returns assume that dividends and capital gain distributions have been
reinvested in the fund at NAV.
3
The Russell 1000
®
Index serves as the fund’s regulatory index and provides a broad measure of market performance. The fund generally invests in securities that are
included in the Schwab 1000 Index
®
. The fund does not seek to track the regulatory index.
Average Annual Total Returns
Fund and Inception Date |
1 Year |
5 Years |
Since Inception* |
Fund: Schwab 1000 Index ETF (10/11/2017)1,2 |
20.03% |
12.02% |
14.66% |
Russell 1000® Index3 |
19.77% |
12.10% |
14.77% |
Schwab 1000 Index® |
20.08% |
12.06% |
14.71% |
All total returns on this page assume dividends and distributions were reinvested. Index figures do not include trading and management costs, which would lower
performance. Indices are unmanaged and cannot be invested in directly. Performance results less than one year are not annualized.
For index definitions, please see www.schwabassetmanagement.com/glossary.
Shares are bought and sold at market price, which may be higher or lower than the net asset value (NAV). Brokerage commissions will reduce returns.
*
Inception (10/11/2017) represents the date that the shares began trading in the secondary market.
1
Performance does not reflect the deduction of taxes that a shareholder would pay on fund distributions or on the redemption or sale of fund shares.
2
Performance is shown on a NAV basis. The fund’s per share NAV is the value of one share of the fund. NAV is calculated by taking the fund’s total assets (including the fair
value of securities owned), subtracting liabilities, and dividing by the number of shares outstanding. Returns assume that dividends and capital gain distributions have been
reinvested in the fund at NAV.
3
The Russell 1000
®
Index serves as the fund’s regulatory index and provides a broad measure of market performance. The fund generally invests in securities that are
included in the Schwab 1000 Index
®
. The fund does not seek to track the regulatory index.
Statistics
Net Assets (millions) |
$5,860 |
Number of Holdings (excludes derivatives) |
981 |
Portfolio Turnover Rate (excludes in-kind transactions) |
3% |
Advisory Fees Paid by the Fund |
$1,530,629 |
Weighted Average Market Cap (millions) |
$1,476,960 |
Price/Earnings Ratio (P/E) |
25.0 |
Price/Book Ratio (P/B) |
5.3 |
Dividends Received Deduction |
91.58% |
Qualified Dividend Income |
$53,067,617 |
Qualified Business Income Deduction (199A) |
$2,873,363 |
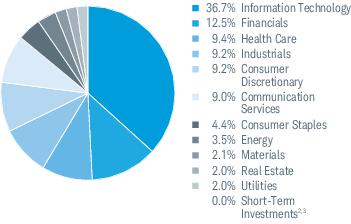
Sector Weightings % of Investments1
Top Equity Holdings % of Net Assets
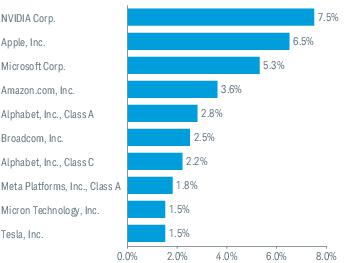
Portfolio holdings may have changed since the report date.
The Sector/Industry classifications in this report use the Global Industry Classification Standard (GICS) which was developed by and is the exclusive property of MSCI Inc.
(MSCI) and Standard & Poor’s (S&P). GICS is a service mark of MSCI and S&P and has been licensed for use by Charles Schwab & Co., Inc.
1
Excludes derivatives.
2
Amount is less than 0.05%.
3
Includes the fund’s position(s) in money market mutual funds registered under the Investment Company Act of 1940, as amended.
Top Equity Holdings % of Net Assets
Portfolio holdings may have changed since the report date.
FUND COSTS FOR THE LAST year ENDED August 31, 2026 (BASED ON A HYPOTHETICAL $10,000 INVESTMENT)
COSTS OF A $10,000 INVESTMENT |
COSTS PAID AS A PERCENTAGE OF A $10,000 INVESTMENT | |
Schwab U.S. Large-Cap ETF |
$3 |
0.03% |
MANAGEMENT’S DISCUSSION OF FUND PERFORMANCE
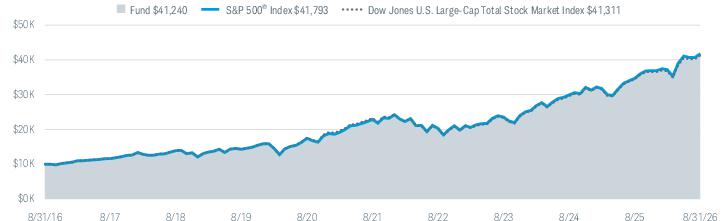
For the 12-month reporting period ended August 31, 2026, the fund’s NAV return was 19.74% (for an explanation of NAV return, please refer to footnote 2 on the following page). The S&P 500® Index, which serves as the fund’s regulatory index and provides a broad measure of market performance, returned 20.38%. The fund generally invests in securities that are included in the Dow Jones U.S. Large-Cap Total Stock Market Index which returned 19.74% during the same period. The fund does not seek to track the regulatory index.
Top contributors to total return:
■ Information technology sector securities, including Apple, Inc.
■ Health care sector securities
Over the reporting period, no sectors detracted from the return of the fund. However, the smallest contributors to total return were:
■ Utilities sector securities, including Vistra Corp. (which detracted from the total return of the fund)
■ Real estate sector securities
Portfolio holdings may have changed since the report date.
Performance of Hypothetical $10,000 Investment (August 31, 2016 - August 31, 2026)1,2
All total returns on this page assume dividends and distributions were reinvested. Index figures do not include trading and management costs, which would lower
performance. Indices are unmanaged and cannot be invested in directly. Performance results less than one year are not annualized.
For index definitions, please see www.schwabassetmanagement.com/glossary.
Shares are bought and sold at market price, which may be higher or lower than the net asset value (NAV). Brokerage commissions will reduce returns.
Index ownership — Dow Jones
®
is a registered trademark of Dow Jones Trademark Holdings LLC (Dow Jones). The Dow Jones U.S. Large-Cap Total Stock Market Index is a
product of S&P Dow Jones Indices LLC and/or its affiliates, and has been licensed for use by Charles Schwab Investment Management, Inc., dba Schwab Asset Management.
The Schwab U.S. Large-Cap ETF is not sponsored, endorsed, sold or promoted by S&P Dow Jones Indices LLC, Dow Jones, or any of their respective affiliates and neither S&P
Dow Jones Indices LLC, Dow Jones, nor any of their respective affiliates make any representation regarding the advisability of investing in such product.
1
Performance does not reflect the deduction of taxes that a shareholder would pay on fund distributions or on the redemption or sale of fund shares.
2
Performance is shown on a NAV basis. The fund’s per share NAV is the value of one share of the fund. NAV is calculated by taking the fund’s total assets (including the fair
value of securities owned), subtracting liabilities, and dividing by the number of shares outstanding. Returns assume that dividends and capital gain distributions have been
reinvested in the fund at NAV.
3
The S&P 500
®
Index serves as the fund’s regulatory index and provides a broad measure of market performance. The fund generally invests in securities that are included in
the Dow Jones U.S. Large-Cap Total Stock Market Index. The fund does not seek to track the regulatory index.
Average Annual Total Returns
Fund and Inception Date |
1 Year |
5 Years |
10 Years |
Fund: Schwab U.S. Large-Cap ETF (11/03/2009)1,2 |
19.74% |
12.16% |
15.22% |
S&P 500® Index3 |
20.38% |
12.79% |
15.37% |
Dow Jones U.S. Large-Cap Total Stock Market Index |
19.74% |
12.17% |
15.24% |
All total returns on this page assume dividends and distributions were reinvested. Index figures do not include trading and management costs, which would lower
performance. Indices are unmanaged and cannot be invested in directly. Performance results less than one year are not annualized.
For index definitions, please see www.schwabassetmanagement.com/glossary.
Shares are bought and sold at market price, which may be higher or lower than the net asset value (NAV). Brokerage commissions will reduce returns.
Index ownership — Dow Jones
®
is a registered trademark of Dow Jones Trademark Holdings LLC (Dow Jones). The Dow Jones U.S. Large-Cap Total Stock Market Index is a
product of S&P Dow Jones Indices LLC and/or its affiliates, and has been licensed for use by Charles Schwab Investment Management, Inc., dba Schwab Asset Management.
The Schwab U.S. Large-Cap ETF is not sponsored, endorsed, sold or promoted by S&P Dow Jones Indices LLC, Dow Jones, or any of their respective affiliates and neither S&P
Dow Jones Indices LLC, Dow Jones, nor any of their respective affiliates make any representation regarding the advisability of investing in such product.
1
Performance does not reflect the deduction of taxes that a shareholder would pay on fund distributions or on the redemption or sale of fund shares.
2
Performance is shown on a NAV basis. The fund’s per share NAV is the value of one share of the fund. NAV is calculated by taking the fund’s total assets (including the fair
value of securities owned), subtracting liabilities, and dividing by the number of shares outstanding. Returns assume that dividends and capital gain distributions have been
reinvested in the fund at NAV.
3
The S&P 500
®
Index serves as the fund’s regulatory index and provides a broad measure of market performance. The fund generally invests in securities that are included in
the Dow Jones U.S. Large-Cap Total Stock Market Index. The fund does not seek to track the regulatory index.
Statistics
Net Assets (millions) |
$74,137 |
Number of Holdings (excludes derivatives) |
748 |
Portfolio Turnover Rate (excludes in-kind transactions) |
3% |
Advisory Fees Paid by the Fund |
$19,709,093 |
Weighted Average Market Cap (millions) |
$1,517,731 |
Price/Earnings Ratio (P/E) |
25.1 |
Price/Book Ratio (P/B) |
5.4 |
Dividends Received Deduction |
91.96% |
Qualified Dividend Income |
$683,653,674 |
Qualified Business Income Deduction (199A) |
$35,424,766 |
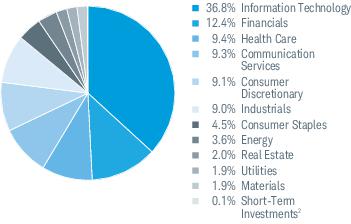
Sector Weightings % of Investments1
Top Equity Holdings % of Net Assets
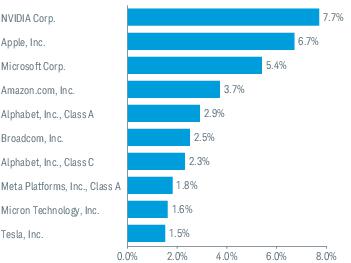
Portfolio holdings may have changed since the report date.
The Sector/Industry classifications in this report use the Global Industry Classification Standard (GICS) which was developed by and is the exclusive property of MSCI Inc.
(MSCI) and Standard & Poor’s (S&P). GICS is a service mark of MSCI and S&P and has been licensed for use by Charles Schwab & Co., Inc.
1
Excludes derivatives.
2
Includes the fund’s position(s) in money market mutual funds registered under the Investment Company Act of 1940, as amended.
Top Equity Holdings % of Net Assets
Portfolio holdings may have changed since the report date.
FUND COSTS FOR THE LAST year ENDED August 31, 2026 (BASED ON A HYPOTHETICAL $10,000 INVESTMENT)
COSTS OF A $10,000 INVESTMENT |
COSTS PAID AS A PERCENTAGE OF A $10,000 INVESTMENT | |
Schwab U.S. Large-Cap Growth ETF |
$4 |
0.04% |
MANAGEMENT’S DISCUSSION OF FUND PERFORMANCE
For the 12-month reporting period ended August 31, 2026, the fund’s NAV return was 17.33% (for an explanation of NAV return, please refer to footnote 2 on the following page). The S&P 500® Index, which serves as the fund’s regulatory index and provides a broad measure of market performance, returned 20.38%. The fund generally invests in securities that are included in the Dow Jones U.S. Large-Cap Growth Total Stock Market Index which returned 17.36% during the same period. The fund does not seek to track the regulatory index. Differences between the return of the fund and the return of the Dow Jones U.S. Large-Cap Growth Total Stock Market Index may be attributable to, among other things, the operational and transactional costs incurred by the fund and not the index.
Top detractors from total return:
■ Financials sector securities, including S&P Global, Inc.
■ Utilities sector securities
Top contributors to total return:
■ Information technology sector securities, including Apple, Inc.
■ Health care sector securities
Portfolio holdings may have changed since the report date.
Performance of Hypothetical $10,000 Investment (August 31, 2016 - August 31, 2026)1,2
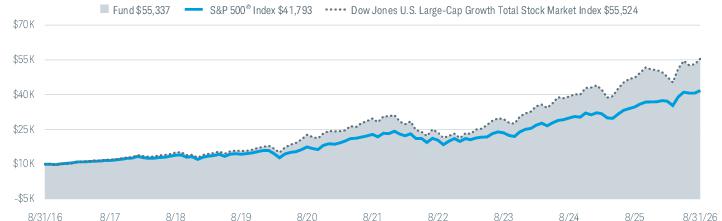
All total returns on this page assume dividends and distributions were reinvested. Index
figures
do not include trading and management costs, which would lower performance. Indices are unmanaged and cannot be invested in directly. Performance results less than one year are not annualized.
For index definitions, please see www.schwabassetmanagement.com/glossary.
Shares are bought and sold at market price, which may be higher or lower than the net asset value (NAV). Brokerage commissions will reduce returns.
Index ownership — Dow Jones
®
is a registered trademark of Dow Jones Trademark Holdings LLC (Dow Jones). The Dow Jones U.S. Large-Cap Growth Total Stock Market Index
is a product of S&P Dow Jones Indices LLC and/or its affiliates, and has been licensed for use by Charles Schwab Investment Management, Inc., dba Schwab Asset
Management. The Schwab U.S. Large-Cap Growth ETF is not sponsored, endorsed, sold or promoted by S&P Dow Jones Indices LLC, Dow Jones, or any of their respective
affiliates and neither S&P Dow Jones Indices LLC, Dow Jones, nor any of their respective affiliates make any representation regarding the advisability of investing in such
product.
1
Performance does not reflect the deduction of taxes that a shareholder would pay on fund distributions or on the redemption or sale of fund shares.
2
Performance is shown on a NAV basis. The fund’s per share NAV is the value of one share of the fund. NAV is calculated by taking the fund’s total assets (including the fair
value of securities owned), subtracting liabilities, and dividing by the number of shares outstanding. Returns assume that dividends and capital gain distributions have been
reinvested in the fund at NAV.
3
The S&P 500
®
Index serves as the fund’s regulatory index and provides a broad measure of market performance. The fund generally invests in securities that are included in
the Dow Jones U.S. Large-Cap Growth Total Stock Market Index. The fund does not seek to track the regulatory index.
Average Annual Total Returns
Fund and Inception Date |
1 Year |
5 Years |
10 Years |
Fund: Schwab U.S. Large-Cap Growth ETF (12/11/2009)1,2 |
17.33% |
13.26% |
18.66% |
S&P 500® Index3 |
20.38% |
12.79% |
15.37% |
Dow Jones U.S. Large-Cap Growth Total Stock Market Index |
17.36% |
13.29% |
18.70% |
All total returns on this page assume dividends and distributions were reinvested. Index
figures
do not include trading and management costs, which would lower performance. Indices are unmanaged and cannot be invested in directly. Performance results less than one year are not annualized.
For index definitions, please see www.schwabassetmanagement.com/glossary.
Shares are bought and sold at market price, which may be higher or lower than the net asset value (NAV). Brokerage commissions will reduce returns.
Index ownership — Dow Jones
®
is a registered trademark of Dow Jones Trademark Holdings LLC (Dow Jones). The Dow Jones U.S. Large-Cap Growth Total Stock Market Index
is a product of S&P Dow Jones Indices LLC and/or its affiliates, and has been licensed for use by Charles Schwab Investment Management, Inc., dba Schwab Asset
Management. The Schwab U.S. Large-Cap Growth ETF is not sponsored, endorsed, sold or promoted by S&P Dow Jones Indices LLC, Dow Jones, or any of their respective
affiliates and neither S&P Dow Jones Indices LLC, Dow Jones, nor any of their respective affiliates make any representation regarding the advisability of investing in such
product.
1
Performance does not reflect the deduction of taxes that a shareholder would pay on fund distributions or on the redemption or sale of fund shares.
2
Performance is shown on a NAV basis. The fund’s per share NAV is the value of one share of the fund. NAV is calculated by taking the fund’s total assets (including the fair
value of securities owned), subtracting liabilities, and dividing by the number of shares outstanding. Returns assume that dividends and capital gain distributions have been
reinvested in the fund at NAV.
3
The S&P 500
®
Index serves as the fund’s regulatory index and provides a broad measure of market performance. The fund generally invests in securities that are included in
the Dow Jones U.S. Large-Cap Growth Total Stock Market Index. The fund does not seek to track the regulatory index.
Statistics
Net Assets (millions) |
$63,049 |
Number of Holdings (excludes derivatives) |
193 |
Portfolio Turnover Rate (excludes in-kind transactions) |
17% |
Advisory Fees Paid by the Fund |
$21,628,308 |
Weighted Average Market Cap (millions) |
$1,999,126 |
Price/Earnings Ratio (P/E) |
30.5 |
Price/Book Ratio (P/B) |
9.3 |
Dividends Received Deduction |
100.00% |
Qualified Dividend Income |
$217,088,505 |
Sector Weightings % of Investments1
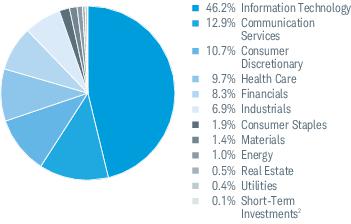
Top Equity Holdings % of Net Assets
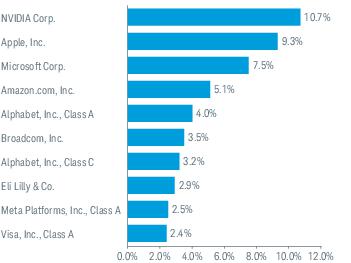
Portfolio holdings may have changed since the report date.
The Sector/Industry classifications in this report use the Global Industry Classification Standard (GICS) which was developed by and is the exclusive property of MSCI Inc.
(MSCI) and Standard & Poor’s (S&P). GICS is a service mark of MSCI and S&P and has been licensed for use by Charles Schwab & Co., Inc.
1
Excludes derivatives.
2
Includes the fund’s position(s) in money market mutual funds registered under the Investment Company Act of 1940, as amended.
Top Equity Holdings % of Net Assets
Portfolio holdings may have changed since the report date.
FUND COSTS FOR THE LAST year ENDED August 31, 2026 (BASED ON A HYPOTHETICAL $10,000 INVESTMENT)
COSTS OF A $10,000 INVESTMENT |
COSTS PAID AS A PERCENTAGE OF A $10,000 INVESTMENT | |
Schwab U.S. Large-Cap Value ETF |
$4 |
0.04% |
MANAGEMENT’S DISCUSSION OF FUND PERFORMANCE
For the 12-month reporting period ending August 31, 2026, the fund’s NAV return was 22.48% (for an explanation of NAV return, please refer to footnote 2 on the following page). The S&P 500® Index, which serves as the fund’s regulatory index and provides a broad measure of market performance, returned 20.38%. The fund generally invests in securities that are included in the Dow Jones U.S. Large-Cap Value Total Stock Market Index which returned 22.53% during the same period. The fund does not seek to track the regulatory index. Differences between the return of the fund and the return of the Dow Jones U.S. Large-Cap Value Total Stock Market Index may be attributable to, among other things, the operational and transactional costs incurred by the fund and not the index.
Top detractors from total return:
■
Consumer discretionary sector securities, including Home Depot, Inc.
■
Communication services sector securities
Top contributors to total return:
■
Information technology sector securities, including Micron Technology, Inc.
■
Health care sector securities
Portfolio holdings may have changed since the report date.
Performance of Hypothetical $10,000 Investment (August 31, 2016 - August 31, 2026)1,2
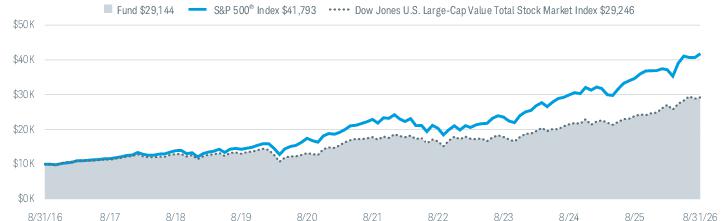
All total returns on this page assume dividends and distributions were reinvested. Index figures do not include trading and management costs, which would lower
performance. Indices are unmanaged and cannot be invested in directly. Performance results less than one year are not annualized.
For index definitions, please see www.schwabassetmanagement.com/glossary.
Shares are bought and sold at market price, which may be higher or lower than the net asset value (NAV). Brokerage commissions will reduce returns.
Index ownership — Dow Jones
®
is a registered trademark of Dow Jones Trademark Holdings LLC (Dow Jones). The Dow Jones U.S. Large-Cap Value Total Stock Market Index is
a product of S&P Dow Jones Indices LLC and/or its affiliates, and has been licensed for use by Charles Schwab Investment Management, Inc., dba Schwab Asset
Management. The Schwab U.S. Large-Cap Value ETF is not sponsored, endorsed, sold or promoted by S&P Dow Jones Indices LLC, Dow Jones, or any of their respective
affiliates and neither S&P Dow Jones Indices LLC, Dow Jones, nor any of their respective affiliates make any representation regarding the advisability of investing in such
product.
1
Performance does not reflect the deduction of taxes that a shareholder would pay on fund distributions or on the redemption or sale of fund shares.
2
Performance is shown on a NAV basis. The fund’s per share NAV is the value of one share of the fund. NAV is calculated by taking the fund’s total assets (including the fair
value of securities owned), subtracting liabilities, and dividing by the number of shares outstanding. Returns assume that dividends and capital gain distributions have been
reinvested in the fund at NAV.
3
The S&P 500
®
Index serves as the fund’s regulatory index and provides a broad measure of market performance. The fund generally invests in securities that are included in
the Dow Jones U.S. Large-Cap Value Total Stock Market Index. The fund does not seek to track the regulatory index.
Average Annual Total Returns
Fund and Inception Date |
1 Year |
5 Years |
10 Years |
Fund: Schwab U.S. Large-Cap Value ETF (12/11/2009)1,2 |
22.48% |
10.42% |
11.29% |
S&P 500® Index3 |
20.38% |
12.79% |
15.37% |
Dow Jones U.S. Large-Cap Value Total Stock Market Index |
22.53% |
10.46% |
11.33% |
All total returns on this page assume dividends and distributions were reinvested. Index figures do not include trading and management costs, which would lower
performance. Indices are unmanaged and cannot be invested in directly. Performance results less than one year are not annualized.
For index definitions, please see www.schwabassetmanagement.com/glossary.
Shares are bought and sold at market price, which may be higher or lower than the net asset value (NAV). Brokerage commissions will reduce returns.
Index ownership — Dow Jones
®
is a registered trademark of Dow Jones Trademark Holdings LLC (Dow Jones). The Dow Jones U.S. Large-Cap Value Total Stock Market Index is
a product of S&P Dow Jones Indices LLC and/or its affiliates, and has been licensed for use by Charles Schwab Investment Management, Inc., dba Schwab Asset
Management. The Schwab U.S. Large-Cap Value ETF is not sponsored, endorsed, sold or promoted by S&P Dow Jones Indices LLC, Dow Jones, or any of their respective
affiliates and neither S&P Dow Jones Indices LLC, Dow Jones, nor any of their respective affiliates make any representation regarding the advisability of investing in such
product.
1
Performance does not reflect the deduction of taxes that a shareholder would pay on fund distributions or on the redemption or sale of fund shares.
2
Performance is shown on a NAV basis. The fund’s per share NAV is the value of one share of the fund. NAV is calculated by taking the fund’s total assets (including the fair
value of securities owned), subtracting liabilities, and dividing by the number of shares outstanding. Returns assume that dividends and capital gain distributions have been
reinvested in the fund at NAV.
3
The S&P 500
®
Index serves as the fund’s regulatory index and provides a broad measure of market performance. The fund generally invests in securities that are included in
the Dow Jones U.S. Large-Cap Value Total Stock Market Index. The fund does not seek to track the regulatory index.
Statistics
Net Assets (millions) |
$15,661 |
Number of Holdings (excludes derivatives) |
556 |
Portfolio Turnover Rate (excludes in-kind transactions) |
9% |
Advisory Fees Paid by the Fund |
$5,920,121 |
Weighted Average Market Cap (millions) |
$274,693 |
Price/Earnings Ratio (P/E) |
21.3 |
Price/Book Ratio (P/B) |
3.6 |
Dividends Received Deduction |
89.46% |
Qualified Dividend Income |
$267,323,306 |
Qualified Business Income Deduction (199A) |
$17,960,589 |
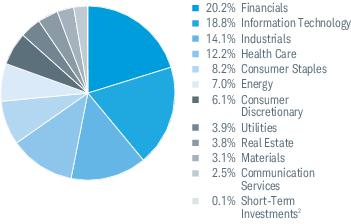
Sector Weightings % of Investments1
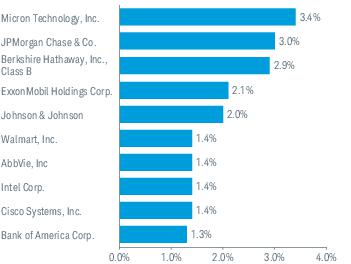
Top Equity Holdings % of Net Assets
Portfolio holdings may have changed since the report date.
The Sector/Industry classifications in this report use the Global Industry Classification Standard (GICS) which was developed by and is the exclusive property of MSCI Inc.
(MSCI) and Standard & Poor’s (S&P). GICS is a service mark of MSCI and S&P and has been licensed for use by Charles Schwab & Co., Inc.
1
Excludes derivatives.
2
Includes the fund’s position(s) in money market mutual funds registered under the Investment Company Act of 1940, as amended.
Top Equity Holdings % of Net Assets
Portfolio holdings may have changed since the report date.
FUND COSTS FOR THE LAST year ENDED August 31, 2026 (BASED ON A HYPOTHETICAL $10,000 INVESTMENT)
COSTS OF A $10,000 INVESTMENT |
COSTS PAID AS A PERCENTAGE OF A $10,000 INVESTMENT | |
Schwab U.S. Mid-Cap ETF |
$4 |
0.04% * |
*
Effective June 11, 2026, the advisory fee of the fund was reduced from 0.04% to 0.03%. The amount shown is the aggregate advisory fee paid during the period.
MANAGEMENT’S DISCUSSION OF FUND PERFORMANCE
For the 12-month reporting period ended August 31, 2026, the fund’s NAV return was 22.11% (for an explanation of NAV return, please refer to footnote 2 on the following page). The S&P 500® Index, which serves as the fund’s regulatory index and provides a broad measure of market performance, returned 20.38%. The fund generally invests in securities that are included in the Dow Jones U.S. Mid-Cap Total Stock Market Index which returned 22.08% during the same period. The fund does not seek to track the regulatory index.
Top contributors to total return:
■ Information technology sector securities, including Sandisk Corp.
■ Health care sector securities
Top detractors from total return:
■ Consumer discretionary sector securities, including Class A holdings of Duolingo, Inc.
■ Consumer staples sector securities
Portfolio holdings may have changed since the report date.
Performance of Hypothetical $10,000 Investment (August 31, 2016 - August 31, 2026)1,2
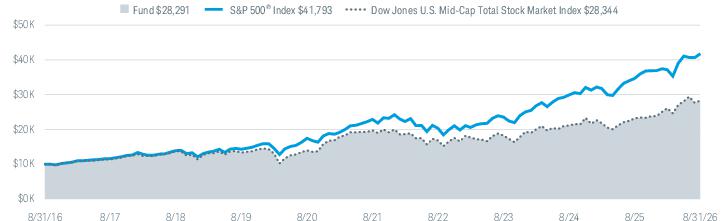
All total returns on this page assume dividends and distributions were reinvested. Index figures do not include trading and management costs, which would lower
performance. Indices are unmanaged and cannot be invested in directly. Performance results less than one year are not annualized.
For index definitions, please see www.schwabassetmanagement.com/glossary.
Shares are bought and sold at market price, which may be higher or lower than the net asset value (NAV). Brokerage commissions will reduce returns.
Index ownership — Dow Jones
®
is a registered trademark of Dow Jones Trademark Holdings LLC (Dow Jones). The Dow Jones U.S. Mid-Cap Total Stock Market Index is a
product of S&P Dow Jones Indices LLC and/or its affiliates, and has been licensed for use by Charles Schwab Investment Management, Inc., dba Schwab Asset Management.
The Schwab U.S. Mid-Cap ETF is not sponsored, endorsed, sold or promoted by S&P Dow Jones Indices LLC, Dow Jones, or any of their respective affiliates and neither S&P
Dow Jones Indices LLC, Dow Jones, nor any of their respective affiliates make any representation regarding the advisability of investing in such product.
1
Performance does not reflect the deduction of taxes that a shareholder would pay on fund distributions or on the redemption or sale of fund shares.
2
Performance is shown on a NAV basis. The fund’s per share NAV is the value of one share of the fund. NAV is calculated by taking the fund’s total assets (including the fair
value of securities owned), subtracting liabilities, and dividing by the number of shares outstanding. Returns assume that dividends and capital gain distributions have been
reinvested in the fund at NAV.
3
The S&P 500
®
Index serves as the fund’s regulatory index and provides a broad measure of market performance. The fund generally invests in securities that are included in
the Dow Jones U.S. Mid-Cap Total Stock Market Index. The fund does not seek to track the regulatory index.
Average Annual Total Returns
Fund and Inception Date |
1 Year |
5 Years |
10 Years |
Fund: Schwab U.S. Mid-Cap ETF (01/13/2011)1,2 |
22.11% |
7.52% |
10.96% |
S&P 500® Index3 |
20.38% |
12.79% |
15.37% |
Dow Jones U.S. Mid-Cap Total Stock Market Index |
22.08% |
7.51% |
10.98% |
All total returns on this page assume dividends and distributions were reinvested. Index figures do not include trading and management costs, which would lower
performance. Indices are unmanaged and cannot be invested in directly. Performance results less than one year are not annualized.
For index definitions, please see www.schwabassetmanagement.com/glossary.
Shares are bought and sold at market price, which may be higher or lower than the net asset value (NAV). Brokerage commissions will reduce returns.
Index ownership — Dow Jones
®
is a registered trademark of Dow Jones Trademark Holdings LLC (Dow Jones). The Dow Jones U.S. Mid-Cap Total Stock Market Index is a
product of S&P Dow Jones Indices LLC and/or its affiliates, and has been licensed for use by Charles Schwab Investment Management, Inc., dba Schwab Asset Management.
The Schwab U.S. Mid-Cap ETF is not sponsored, endorsed, sold or promoted by S&P Dow Jones Indices LLC, Dow Jones, or any of their respective affiliates and neither S&P
Dow Jones Indices LLC, Dow Jones, nor any of their respective affiliates make any representation regarding the advisability of investing in such product.
1
Performance does not reflect the deduction of taxes that a shareholder would pay on fund distributions or on the redemption or sale of fund shares.
2
Performance is shown on a NAV basis. The fund’s per share NAV is the value of one share of the fund. NAV is calculated by taking the fund’s total assets (including the fair
value of securities owned), subtracting liabilities, and dividing by the number of shares outstanding. Returns assume that dividends and capital gain distributions have been
reinvested in the fund at NAV.
3
The S&P 500
®
Index serves as the fund’s regulatory index and provides a broad measure of market performance. The fund generally invests in securities that are included in
the Dow Jones U.S. Mid-Cap Total Stock Market Index. The fund does not seek to track the regulatory index.
Statistics
Net Assets (millions) |
$14,878 |
Number of Holdings (excludes derivatives) |
492 |
Portfolio Turnover Rate (excludes in-kind transactions) |
18% |
Advisory Fees Paid by the Fund |
$5,013,386 |
Weighted Average Market Cap (millions) |
$26,260 |
Price/Earnings Ratio (P/E) |
20.9 |
Price/Book Ratio (P/B) |
3.0 |
Dividends Received Deduction |
63.98% |
Qualified Dividend Income |
$121,208,041 |
Qualified Business Income Deduction (199A) |
$33,716,523 |
Sector Weightings % of Investments1
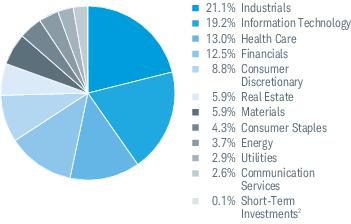
Top Equity Holdings % of Net Assets
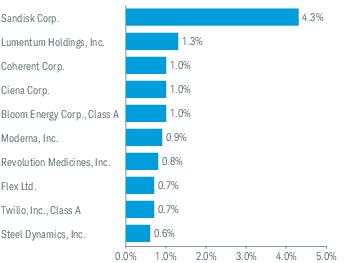
Portfolio holdings may have changed since the report date.
The Sector/Industry classifications in this report use the Global Industry Classification Standard (GICS) which was developed by and is the exclusive property of MSCI Inc.
(MSCI) and Standard & Poor’s (S&P). GICS is a service mark of MSCI and S&P and has been licensed for use by Charles Schwab & Co., Inc.
1
Excludes derivatives.
2
Includes the fund’s position(s) in money market mutual funds registered under the Investment Company Act of 1940, as amended.
Top Equity Holdings % of Net Assets
Portfolio holdings may have changed since the report date.
FUND CHANGES
This is a summary of certain changes to the fund since September 1, 2025. For more complete information, you may review the fund’s prospectus at www.schwabassetmanagement.com/prospectus or upon request by calling 1-866-414-6349 or by sending an email request to orders@mysummaryprospectus.com.
■ Effective June 11, 2026, the management fee of the fund was reduced from 0.04% to 0.03%.
FUND COSTS FOR THE LAST year ENDED August 31, 2026 (BASED ON A HYPOTHETICAL $10,000 INVESTMENT)
COSTS OF A $10,000 INVESTMENT |
COSTS PAID AS A PERCENTAGE OF A $10,000 INVESTMENT | |
Schwab U.S. Small-Cap ETF |
$5 |
0.04% * |
*
Effective June 11, 2026, the advisory fee of the fund was reduced from 0.04% to 0.03%. The amount shown is the aggregate advisory fee paid during the period.
MANAGEMENT’S DISCUSSION OF FUND PERFORMANCE
For the 12-month reporting period ended August 31, 2026, the fund’s NAV return was 26.52% (for an explanation of NAV return, please refer to footnote 2 on the following page). The S&P 500® Index, which serves as the fund’s regulatory index and provides a broad measure of market performance, returned 20.38%. The fund generally invests in securities that are included in the Dow Jones U.S. Small-Cap Total Stock Market Index which returned 26.43% during the same period. The fund does not seek to track the regulatory index.
Top contributors to total return:
■ Information technology sector securities, including Sandisk Corp.
■ Health care sector securities
Top detractors from total return:
■ Consumer discretionary sector stocks, including Class A holdings of Chewy, Inc.
■ Consumer staples sector securities
Portfolio holdings may have changed since the report date.
Performance of Hypothetical $10,000 Investment (August 31, 2016 - August 31, 2026)1,2
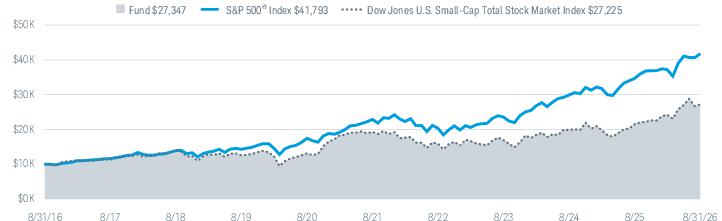
All total returns on this page assume dividends and distributions were reinvested. Index figures do not include trading and management costs, which would lower
performance. Indices are unmanaged and cannot be invested in directly. Performance results less than one year are not annualized.
For index definitions, please see www.schwabassetmanagement.com/glossary.
Shares are bought and sold at market price, which may be higher or lower than the net asset value (NAV). Brokerage commissions will reduce returns.
Index ownership — Dow Jones
®
is a registered trademark of Dow Jones Trademark Holdings LLC (Dow Jones). The Dow Jones U.S. Small-Cap Total Stock Market Index is a
product of S&P Dow Jones Indices LLC and/or its affiliates, and has been licensed for use by Charles Schwab Investment Management, Inc., dba Schwab Asset Management.
The Schwab U.S. Small-Cap ETF is not sponsored, endorsed, sold or promoted by S&P Dow Jones Indices LLC, Dow Jones, or any of their respective affiliates and neither S&P
Dow Jones Indices LLC, Dow Jones, nor any of their respective affiliates make any representation regarding the advisability of investing in such product.
1
Performance does not reflect the deduction of taxes that a shareholder would pay on fund distributions or on the redemption or sale of fund shares.
2
Performance is shown on a NAV basis. The fund’s per share NAV is the value of one share of the fund. NAV is calculated by taking the fund’s total assets (including the fair
value of securities owned), subtracting liabilities, and dividing by the number of shares outstanding. Returns assume that dividends and capital gain distributions have been
reinvested in the fund at NAV.
3
The S&P 500
®
Index serves as the fund’s regulatory index and provides a broad measure of market performance. The fund generally invests in securities that are included in
the Dow Jones U.S. Small-Cap Total Stock Market Index. The fund does not seek to track the regulatory index.
Average Annual Total Returns
Fund and Inception Date |
1 Year |
5 Years |
10 Years |
Fund: Schwab U.S. Small-Cap ETF (11/03/2009)1,2 |
26.52% |
7.16% |
10.58% |
S&P 500® Index3 |
20.38% |
12.79% |
15.37% |
Dow Jones U.S. Small-Cap Total Stock Market Index |
26.43% |
7.09% |
10.53% |
All total returns on this page assume dividends and distributions were reinvested. Index figures do not include trading and management costs, which would lower
performance. Indices are unmanaged and cannot be invested in directly. Performance results less than one year are not annualized.
For index definitions, please see www.schwabassetmanagement.com/glossary.
Shares are bought and sold at market price, which may be higher or lower than the net asset value (NAV). Brokerage commissions will reduce returns.
Index ownership — Dow Jones
®
is a registered trademark of Dow Jones Trademark Holdings LLC (Dow Jones). The Dow Jones U.S. Small-Cap Total Stock Market Index is a
product of S&P Dow Jones Indices LLC and/or its affiliates, and has been licensed for use by Charles Schwab Investment Management, Inc., dba Schwab Asset Management.
The Schwab U.S. Small-Cap ETF is not sponsored, endorsed, sold or promoted by S&P Dow Jones Indices LLC, Dow Jones, or any of their respective affiliates and neither S&P
Dow Jones Indices LLC, Dow Jones, nor any of their respective affiliates make any representation regarding the advisability of investing in such product.
1
Performance does not reflect the deduction of taxes that a shareholder would pay on fund distributions or on the redemption or sale of fund shares.
2
Performance is shown on a NAV basis. The fund’s per share NAV is the value of one share of the fund. NAV is calculated by taking the fund’s total assets (including the fair
value of securities owned), subtracting liabilities, and dividing by the number of shares outstanding. Returns assume that dividends and capital gain distributions have been
reinvested in the fund at NAV.
3
The S&P 500
®
Index serves as the fund’s regulatory index and provides a broad measure of market performance. The fund generally invests in securities that are included in
the Dow Jones U.S. Small-Cap Total Stock Market Index. The fund does not seek to track the regulatory index.
Statistics
Net Assets (millions) |
$22,646 |
Number of Holdings (excludes derivatives) |
1,706 |
Portfolio Turnover Rate (excludes in-kind transactions) |
14% |
Advisory Fees Paid by the Fund |
$7,787,549 |
Weighted Average Market Cap (millions) |
$18,558 |
Price/Earnings Ratio (P/E) |
18.9 |
Price/Book Ratio (P/B) |
2.5 |
Dividends Received Deduction |
76.55% |
Qualified Dividend Income |
$189,484,979 |
Qualified Business Income Deduction (199A) |
$36,726,155 |
Sector Weightings % of Investments1
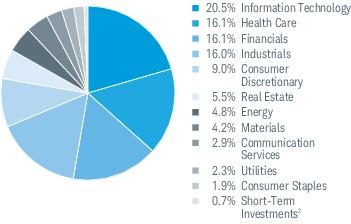
Top Equity Holdings % of Net Assets
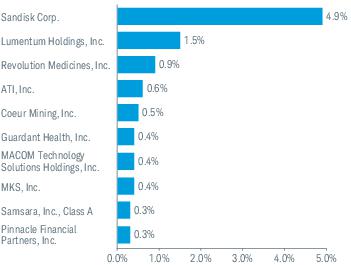
Portfolio holdings may have changed since the report date.
The Sector/Industry classifications in this report use the Global Industry Classification Standard (GICS) which was developed by and is the exclusive property of MSCI Inc.
(MSCI) and Standard & Poor’s (S&P). GICS is a service mark of MSCI and S&P and has been licensed for use by Charles Schwab & Co., Inc.
1
Excludes derivatives.
2
Includes the fund’s position(s) in money market mutual funds registered under the Investment Company Act of 1940, as amended.
Top Equity Holdings % of Net Assets
Portfolio holdings may have changed since the report date.
FUND CHANGES
This is a summary of certain changes to the fund since September 1, 2025. For more complete information, you may review the fund’s prospectus at www.schwabassetmanagement.com/prospectus or upon request by calling 1-866-414-6349 or by sending an email request to orders@mysummaryprospectus.com.
■ Effective June 11, 2026, the management fee of the fund was reduced from 0.04% to 0.03%.
FUND COSTS FOR THE LAST year ENDED August 31, 2026 (BASED ON A HYPOTHETICAL $10,000 INVESTMENT)
COSTS OF A $10,000 INVESTMENT |
COSTS PAID AS A PERCENTAGE OF A $10,000 INVESTMENT | |
Schwab U.S. Dividend Equity ETF |
$7 |
0.06% |
MANAGEMENT’S DISCUSSION OF FUND PERFORMANCE
For the 12-month reporting period ended August 31, 2026, the fund’s NAV return was 29.45% (for an explanation of NAV return, please refer to footnote 2 on the following page). The S&P 500® Index, which serves as the fund’s regulatory index and provides a broad measure of market performance, returned 20.38%. The fund generally invests in securities that are included in the Dow Jones U.S. Dividend 100TM Index which returned 29.57% during the same period. The fund does not seek to track the regulatory index. Differences between the return of the fund and the return of the Dow Jones U.S. Dividend 100TM Index may be attributable to, among other things, the operational and transactional costs incurred by the fund and not the index.
Top detractors from total return:
■ Consumer discretionary sector securities, including Home Depot, Inc.
■ Utilities sector securities
Top contributors to total return:
■ Health care sector securities, including Merck & Co., Inc.
■ Energy sector securities
Portfolio holdings may have changed since the report date.
Performance of Hypothetical $10,000 Investment (August 31, 2016 - August 31, 2026)1,2
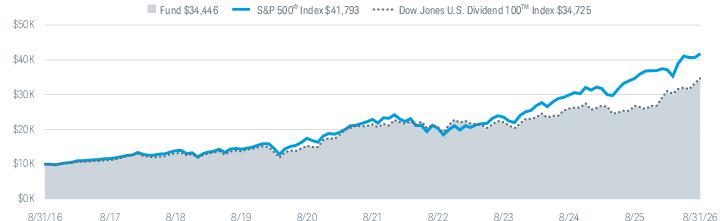
All total returns on this page assume dividends and distributions were reinvested. Index figures do not include trading and management costs, which would lower
performance. Indices are unmanaged and cannot be invested in directly. Performance results less than one year are not annualized.
For index definitions, please see www.schwabassetmanagement.com/glossary.
Shares are bought and sold at market price, which may be higher or lower than the net asset value (NAV). Brokerage commissions will reduce returns.
Index ownership — Dow Jones
®
is a registered trademark of Dow Jones Trademark Holdings LLC (Dow Jones). The Dow Jones U.S. Dividend 100
TM
Index is a product of S&P
Dow Jones Indices LLC and/or its affiliates, and has been licensed for use by Charles Schwab Investment Management, Inc., dba Schwab Asset Management. The Schwab
U.S. Dividend Equity ETF is not sponsored, endorsed, sold or promoted by S&P Dow Jones Indices LLC, Dow Jones, or any of their respective affiliates and neither S&P Dow
Jones Indices LLC, Dow Jones, nor any of their respective affiliates make any representation regarding the advisability of investing in such product.
1
Performance does not reflect the deduction of taxes that a shareholder would pay on fund distributions or on the redemption or sale of fund shares.
2
Performance is shown on a NAV basis. The fund’s per share NAV is the value of one share of the fund. NAV is calculated by taking the fund’s total assets (including the fair
value of securities owned), subtracting liabilities, and dividing by the number of shares outstanding. Returns assume that dividends and capital gain distributions have been
reinvested in the fund at NAV.
3
The S&P 500
®
Index serves as the fund’s regulatory index and provides a broad measure of market performance. The fund generally invests in securities that are included in
the Dow Jones U.S. Dividend 100™ Index. The fund does not seek to track the regulatory index.
Average Annual Total Returns
Fund and Inception Date |
1 Year |
5 Years |
10 Years |
Fund: Schwab U.S. Dividend Equity ETF (10/20/2011)1,2 |
29.45% |
10.01% |
13.17% |
S&P 500® Index3 |
20.38% |
12.79% |
15.37% |
Dow Jones U.S. Dividend 100TM Index |
29.57% |
10.09% |
13.26% |
All total returns on this page assume dividends and distributions were reinvested. Index figures do not include trading and management costs, which would lower
performance. Indices are unmanaged and cannot be invested in directly. Performance results less than one year are not annualized.
For index definitions, please see www.schwabassetmanagement.com/glossary.
Shares are bought and sold at market price, which may be higher or lower than the net asset value (NAV). Brokerage commissions will reduce returns.
Index ownership — Dow Jones
®
is a registered trademark of Dow Jones Trademark Holdings LLC (Dow Jones). The Dow Jones U.S. Dividend 100
TM
Index is a product of S&P
Dow Jones Indices LLC and/or its affiliates, and has been licensed for use by Charles Schwab Investment Management, Inc., dba Schwab Asset Management. The Schwab
U.S. Dividend Equity ETF is not sponsored, endorsed, sold or promoted by S&P Dow Jones Indices LLC, Dow Jones, or any of their respective affiliates and neither S&P Dow
Jones Indices LLC, Dow Jones, nor any of their respective affiliates make any representation regarding the advisability of investing in such product.
1
Performance does not reflect the deduction of taxes that a shareholder would pay on fund distributions or on the redemption or sale of fund shares.
2
Performance is shown on a NAV basis. The fund’s per share NAV is the value of one share of the fund. NAV is calculated by taking the fund’s total assets (including the fair
value of securities owned), subtracting liabilities, and dividing by the number of shares outstanding. Returns assume that dividends and capital gain distributions have been
reinvested in the fund at NAV.
3
The S&P 500
®
Index serves as the fund’s regulatory index and provides a broad measure of market performance. The fund generally invests in securities that are included in
the Dow Jones U.S. Dividend 100™ Index. The fund does not seek to track the regulatory index.
Statistics
Net Assets (millions) |
$112,384 |
Number of Holdings (excludes derivatives) |
99 |
Portfolio Turnover Rate (excludes in-kind transactions) |
40% |
Advisory Fees Paid by the Fund |
$50,454,583 |
Weighted Average Market Cap (millions) |
$180,686 |
Price/Earnings Ratio (P/E) |
19.6 |
Price/Book Ratio (P/B) |
3.9 |
Dividends Received Deduction |
96.61% |
Qualified Dividend Income |
$2,864,348,770 |
Sector Weightings % of Investments1
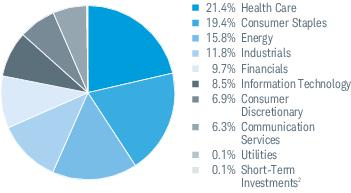
Top Equity Holdings % of Net Assets
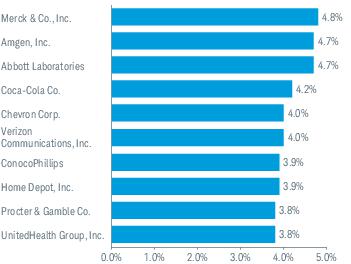
Portfolio holdings may have changed since the report date.
The Sector/Industry classifications in this report use the Global Industry Classification Standard (GICS) which was developed by and is the exclusive property of MSCI Inc.
(MSCI) and Standard & Poor’s (S&P). GICS is a service mark of MSCI and S&P and has been licensed for use by Charles Schwab & Co., Inc.
1
Excludes derivatives.
2
Includes the fund’s position(s) in money market mutual funds registered under the Investment Company Act of 1940, as amended.
Top Equity Holdings % of Net Assets
Portfolio holdings may have changed since the report date.
FUND COSTS FOR THE LAST year ENDED August 31, 2026 (BASED ON A HYPOTHETICAL $10,000 INVESTMENT)
COSTS OF A $10,000 INVESTMENT |
COSTS PAID AS A PERCENTAGE OF A $10,000 INVESTMENT | |
Schwab Mortgage-Backed Securities ETF |
$3 |
0.03% |
MANAGEMENT’S DISCUSSION OF FUND PERFORMANCE
For the 12-month reporting period ended August 31, 2026, the fund’s NAV return was 3.03% (for an explanation of NAV return, please refer to footnote 2 on the following page). The Bloomberg US Aggregate Bond Index, which serves as the fund’s regulatory index and provides a broad measure of market performance, returned 1.89%. The fund generally invests in securities that are included in the Bloomberg US MBS Float Adjusted Total Return Index which returned 3.12%. The fund does not seek to track the regulatory index. Differences between the return of the fund and the return of the Bloomberg US MBS Float Adjusted Total Return Index may be attributable to, among other things, the operational and transactional costs incurred by the fund and not the index.
■ Negative price returns detracted from the total return of the fund, albeit to a smaller degree than coupon income generated by the fund’s holdings and, to a more limited extent, paydown (return of principal from the underlying mortgages to the mortgage-backed securities investors) contributed to the total return of the fund
■ The fund held positions in TBAs, or “to-be-announced” securities, which are mortgage-backed bonds that settle on a forward date. The fund’s average month-end position in these securities was 0.3%, with a minimum exposure of 0.0% and maximum exposure of 0.4% over the period.
Portfolio holdings may have changed since the report date.
Performance of Hypothetical $10,000 Investment (November 19, 2024 - August 31, 2026)1,2
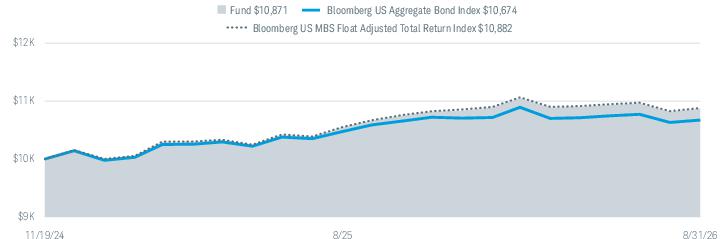
All total returns on this page assume dividends and distributions were reinvested. Index figures do not include trading and management costs, which would lower
performance. Indices are unmanaged and cannot be invested in directly. Performance results less than one year are not annualized.
For index definitions, please see www.schwabassetmanagement.com/glossary.
Shares are bought and sold at market price, which may be higher or lower than the net asset value (NAV). Brokerage commissions will reduce returns.
Bloomberg
®
and Bloomberg US MBS Float Adjusted Total Return Index are service marks of Bloomberg Finance L.P. and its affiliates, including Bloomberg Index Services
Limited (BISL), the administrator of the indices (collectively, “Bloomberg”). Bloomberg is not affiliated with Charles Schwab Investment Management, Inc., dba Schwab Asset
Management, and Bloomberg does not approve, endorse, review, or recommend Schwab Mortgage-Backed Securities ETF. Bloomberg does not guarantee the timeliness,
accurateness, or completeness of any data or information relating to Schwab Mortgage-Backed Securities ETF.
*
Inception (11/19/2024) represents the date that the shares began trading in the secondary market.
1
Performance does not reflect the deduction of taxes that a shareholder would pay on fund distributions or on the redemption or sale of fund shares.
2
Performance is shown on a NAV basis. The fund’s per share NAV is the value of one share of the fund. NAV is calculated by taking the fund’s total assets (including the fair
value of securities owned), subtracting liabilities, and dividing by the number of shares outstanding. Returns assume that dividends and capital gain distributions have been
reinvested in the fund at NAV.
3
The Bloomberg US Aggregate Bond Index serves as the fund’s regulatory index and provides a broad measure of market performance. The fund generally invests in
securities that are included in the Bloomberg US MBS Float Adjusted Total Return Index. The fund does not seek to track the regulatory index.
Average Annual Total Returns
Fund and Inception Date |
1 Year |
Since Inception* |
Fund: Schwab Mortgage-Backed Securities ETF (11/19/2024)1,2 |
3.03% |
4.79% |
Bloomberg US Aggregate Bond Index3 |
1.89% |
3.73% |
Bloomberg US MBS Float Adjusted Total Return Index |
3.12% |
4.86% |
All total returns on this page assume dividends and distributions were reinvested. Index figures do not include trading and management costs, which would lower
performance. Indices are unmanaged and cannot be invested in directly. Performance results less than one year are not annualized.
For index definitions, please see www.schwabassetmanagement.com/glossary.
Shares are bought and sold at market price, which may be higher or lower than the net asset value (NAV). Brokerage commissions will reduce returns.
Bloomberg
®
and Bloomberg US MBS Float Adjusted Total Return Index are service marks of Bloomberg Finance L.P. and its affiliates, including Bloomberg Index Services
Limited (BISL), the administrator of the indices (collectively, “Bloomberg”). Bloomberg is not affiliated with Charles Schwab Investment Management, Inc., dba Schwab Asset
Management, and Bloomberg does not approve, endorse, review, or recommend Schwab Mortgage-Backed Securities ETF. Bloomberg does not guarantee the timeliness,
accurateness, or completeness of any data or information relating to Schwab Mortgage-Backed Securities ETF.
*
Inception (11/19/2024) represents the date that the shares began trading in the secondary market.
1
Performance does not reflect the deduction of taxes that a shareholder would pay on fund distributions or on the redemption or sale of fund shares.
2
Performance is shown on a NAV basis. The fund’s per share NAV is the value of one share of the fund. NAV is calculated by taking the fund’s total assets (including the fair
value of securities owned), subtracting liabilities, and dividing by the number of shares outstanding. Returns assume that dividends and capital gain distributions have been
reinvested in the fund at NAV.
3
The Bloomberg US Aggregate Bond Index serves as the fund’s regulatory index and provides a broad measure of market performance. The fund generally invests in
securities that are included in the Bloomberg US MBS Float Adjusted Total Return Index. The fund does not seek to track the regulatory index.
Statistics
Net Assets (millions) |
$6,584 |
Number of Holdings |
4,342 |
Portfolio Turnover Rate (excludes in-kind transactions) |
21% |
Advisory Fees Paid by the Fund |
$1,824,474 |
Weighted Average Maturity (Source: Aladdin) |
7.2 Yrs |
Weighted Average Duration (Source: Aladdin) |
5.4 Yrs |
Qualified Interest Income |
100.00% |
Business Interest Deduction (163j) |
99.98% |
Portfolio Composition By Security Type % of Investments
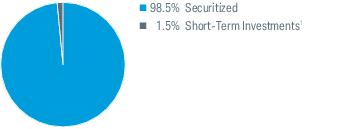
Portfolio holdings may have changed since the report date.
1
Includes the fund’s position(s) in money market mutual funds registered under the Investment Company Act of 1940, as amended.
FUND COSTS FOR THE LAST year ENDED August 31, 2026 (BASED ON A HYPOTHETICAL $10,000 INVESTMENT)
COSTS OF A $10,000 INVESTMENT |
COSTS PAID AS A PERCENTAGE OF A $10,000 INVESTMENT | |
Schwab High Yield Bond ETF |
$3 |
0.03% |
MANAGEMENT’S DISCUSSION OF FUND PERFORMANCE
For the 12-month reporting period ended August 31, 2026, the fund’s NAV return was 4.89% (for an explanation of NAV return, please refer to footnote 2 on the following page). The Bloomberg US Aggregate Bond Index, which serves as the fund’s regulatory index and provides a broad measure of market performance, returned 1.89%. The fund generally invests in securities that are included in the ICE BofA US Cash Pay High Yield Constrained Index which returned 4.77%. The fund does not seek to track the regulatory index.
■ Coupon income generated by the fund’s holdings contributed to fund performance while negative price returns detracted from fund performance, albeit to a smaller degree
Portfolio holdings may have changed since the report date.
Performance of Hypothetical $10,000 Investment (July 11, 2023 - August 31, 2026)1,2
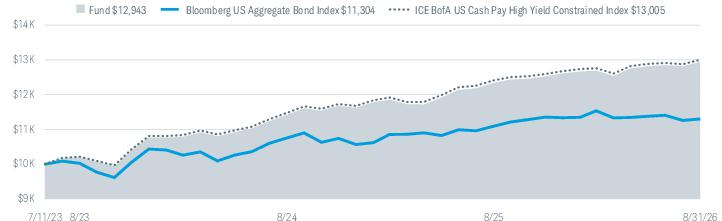
All total returns on this page assume dividends and distributions were reinvested. Index figures do not include trading and management costs, which would lower
performance. Indices are unmanaged and cannot be invested in directly. Performance results less than one year are not annualized.
For index definitions, please see www.schwabassetmanagement.com/glossary.
Shares are bought and sold at market price, which may be higher or lower than the net asset value (NAV). Brokerage commissions will reduce returns.
“ICE
®
” is a registered trademark of ICE Data Indices, LLC or its affiliates and “BofA
®
” is a registered trademark of Bank of America Corporation licensed by Bank of America
Corporation and its affiliates (“BofA”) and may not be used without BofA’s prior written approval. These trademarks have been licensed, along with the ICE BofA US Cash Pay
High Yield Constrained Index (“Index”) for use by Charles Schwab Investment Management, Inc., dba Schwab Asset Management, in connection with the Schwab High Yield
Bond ETF. The Schwab High Yield Bond ETF is not sponsored, endorsed, sold or promoted by ICE Data Indices, LLC, its affiliates or its Third Party Suppliers (“ICE Data and its
Suppliers”). ICE Data and its Suppliers make no representations or warranties regarding the advisability of investing in the Schwab High Yield Bond ETF.
*
Inception (07/11/2023) represents the date that the shares began trading in the secondary market.
1
Performance does not reflect the deduction of taxes that a shareholder would pay on fund distributions or on the redemption or sale of fund shares.
2
Performance is shown on a NAV basis. The fund’s per share NAV is the value of one share of the fund. NAV is calculated by taking the fund’s total assets (including the fair
value of securities owned), subtracting liabilities, and dividing by the number of shares outstanding. Returns assume that dividends and capital gain distributions have been
reinvested in the fund at NAV.
3
The Bloomberg US Aggregate Bond Index serves as the fund’s regulatory index and provides a broad measure of market performance. The fund generally invests in
securities that are included in the ICE BofA US Cash Pay High Yield Constrained Index. The fund does not seek to track the regulatory index.
Average Annual Total Returns
Fund and Inception Date |
1 Year |
Since Inception* |
Fund: Schwab High Yield Bond ETF (07/11/2023)1,2 |
4.89% |
8.55% |
Bloomberg US Aggregate Bond Index3 |
1.89% |
3.98% |
ICE BofA US Cash Pay High Yield Constrained Index |
4.77% |
8.72% |
All total returns on this page assume dividends and distributions were reinvested. Index figures do not include trading and management costs, which would lower
performance. Indices are unmanaged and cannot be invested in directly. Performance results less than one year are not annualized.
For index definitions, please see www.schwabassetmanagement.com/glossary.
Shares are bought and sold at market price, which may be higher or lower than the net asset value (NAV). Brokerage commissions will reduce returns.
“ICE
®
” is a registered trademark of ICE Data Indices, LLC or its affiliates and “BofA
®
” is a registered trademark of Bank of America Corporation licensed by Bank of America
Corporation and its affiliates (“BofA”) and may not be used without BofA’s prior written approval. These trademarks have been licensed, along with the ICE BofA US Cash Pay
High Yield Constrained Index (“Index”) for use by Charles Schwab Investment Management, Inc., dba Schwab Asset Management, in connection with the Schwab High Yield
Bond ETF. The Schwab High Yield Bond ETF is not sponsored, endorsed, sold or promoted by ICE Data Indices, LLC, its affiliates or its Third Party Suppliers (“ICE Data and its
Suppliers”). ICE Data and its Suppliers make no representations or warranties regarding the advisability of investing in the Schwab High Yield Bond ETF.
*
Inception (07/11/2023) represents the date that the shares began trading in the secondary market.
1
Performance does not reflect the deduction of taxes that a shareholder would pay on fund distributions or on the redemption or sale of fund shares.
2
Performance is shown on a NAV basis. The fund’s per share NAV is the value of one share of the fund. NAV is calculated by taking the fund’s total assets (including the fair
value of securities owned), subtracting liabilities, and dividing by the number of shares outstanding. Returns assume that dividends and capital gain distributions have been
reinvested in the fund at NAV.
3
The Bloomberg US Aggregate Bond Index serves as the fund’s regulatory index and provides a broad measure of market performance. The fund generally invests in
securities that are included in the ICE BofA US Cash Pay High Yield Constrained Index. The fund does not seek to track the regulatory index.
Statistics
Net Assets (millions) |
$2,863 |
Number of Holdings |
1,837 |
Portfolio Turnover Rate (excludes in-kind transactions) |
23% |
Advisory Fees Paid by the Fund |
$675,636 |
Weighted Average Maturity (Source: Aladdin) |
3.8 Yrs |
Weighted Average Duration (Source: Aladdin) |
3.0 Yrs |
Qualified Interest Income |
80.43% |
Business Interest Deduction (163j) |
96.28% |
Portfolio Composition By Security Type % of Investments
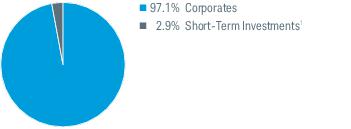
Portfolio Composition By Credit Quality % of Investments
2,3
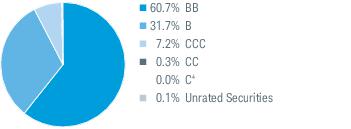
Portfolio holdings may have changed since the report date.
1
Includes the fund’s position(s) in money market mutual funds registered under the Investment Company Act of 1940, as amended.
2
Bloomberg Index Rating: Based on the middle rating of Moody’s, S&P and Fitch; when a rating from only two agencies is available, the lower is used; when only one agency rates a bond, that rating is used. In cases where explicit bond level ratings may not be available, other sources may be used to classify securities by credit quality. Source: Bloomberg Index Service Ltd.
3
Excludes short-term investments.
4
Less than 0.05%.
| [1] | Effective June 11, 2026, the advisory fee of the fund was reduced from 0.08% to 0.06%. The amount shown is the aggregate advisory fee paid during the period. |
| [2] | Effective June 11, 2026, the advisory fee of the fund was reduced from 0.07% to 0.06%. The amount shown is the aggregate advisory fee paid during the period. |
| [3] | Effective June 11, 2026, the advisory fee of the fund was reduced from 0.04% to 0.03%. The amount shown is the aggregate advisory fee paid during the period. |
| [4] | Effective June 11, 2026, the advisory fee of the fund was reduced from 0.04% to 0.03%. The amount shown is the aggregate advisory fee paid during the period. |