
Investor Presentation Q3 2026 November 2026
Celanese Corporation Disclosures Forward-Looking Statements This presentation may contain "forward-looking statements," which include information concerning Celanese Corporation’s (the “Company”) plans objectives, goals, strategies, future revenues, cash flow, financial performance, synergies, capital expenditures, deleveraging efforts, planned cost reductions, dividend policy, financing needs and other information that is not historical information. All forward-looking statements are based upon current expectations and beliefs and various assumptions. There can be no assurance that the Company will realize these expectations or that these beliefs will prove correct. There are a number of risks and uncertainties that could cause actual results to differ materially from the results expressed or implied in the forward-looking statements contained in this presentation. These risks and uncertainties include, among other things: the ability to successfully achieve planned cost reductions; changes in general economic, business, political and regulatory conditions in the countries or regions in which we operate; the length and depth of product and industry business cycles, particularly in the automotive, electrical, textiles, electronics and construction industries; potential liability resulting from pending or future claims or litigation, including investigations or enforcement actions, or from changes in the laws, regulations or policies of governments or other governmental activities, in the countries in which we operate; our level of indebtedness and our financial condition, each of which could diminish our ability to raise additional capital to fund operations, reduce our business and strategic flexibility, increase our interest expense, limit the success of our deleveraging efforts, and impact changes to our credit ratings, which could increase our interest expense in the event of additional downgrades; volatility or changes in the price and availability of raw materials and energy, particularly changes in the demand for, supply of, and market prices of ethylene, methanol, natural gas, carbon monoxide, wood pulp, hexamethylene diamine, Polyamide 66 ("PA66"), polybutylene terephthalate, ethanol, natural gas and fuel oil, and the prices for electricity and other energy sources; the ability to pass increases in raw materials prices, logistics costs and other costs on to customers or otherwise improve margins through price increases; the possibility that we will not be able to realize the anticipated benefits of the Mobility & Materials business (the "M&M Business") we acquired from DuPont de Nemours, Inc. (the "M&M Acquisition"), including synergies and growth opportunities, whether as a result of difficulties arising from the operation of the M&M Business or other unanticipated delays, costs, inefficiencies or liabilities; additional impairment of goodwill or intangible assets; increased commercial, legal or regulatory complexity of entering into, or expanding our exposure to, certain end markets and geographies; risks in the global economy and equity and credit markets and their potential impact on our ability to pay down debt in the future and/or refinance at suitable rates, in a timely manner, or at all; the ability to maintain plant utilization rates and to implement planned capacity additions, expansions and maintenance; the ability to reduce or maintain current levels of production costs and to improve productivity by implementing technological improvements to existing plants; increased price competition and the introduction of competing products by other companies; the ability to identify desirable potential acquisition or divestiture opportunities and to complete such transactions, including obtaining regulatory approvals, consistent with the Company's strategy; market acceptance of our products and technology; compliance and other costs and potential disruption or interruption of production or operations due to accidents, interruptions in sources of raw materials, transportation, logistics or supply chain disruptions, cybersecurity incidents, AI-related vulnerabilities, terrorism or political unrest, public health crises, or other unforeseen events or delays in construction or operation of facilities, including as a result of geopolitical conditions, the direct or indirect consequences of acts of war or conflict (such as the Russia- Ukraine conflict or conflicts in the Middle East) or terrorist incidents or as a result of fire, flood, hurricanes, other severe weather, natural disasters, other catastrophic events or other crises; the ability to obtain governmental approvals and to construct facilities on terms and schedules acceptable to the Company; changes in applicable tariffs, duties, treaties and trade agreements, tax rates or legislation throughout the world including, but not limited to, anti-dumping and countervailing duties, adjustments, changes in estimates or interpretations or the resolution of tax examinations or audits that may impact recorded or future tax impacts and potential regulatory and legislative tax developments in the United States and other jurisdictions; changes in the degree of intellectual property and other legal protection afforded to our products or technologies, or the theft of such intellectual property; potential liability for remedial actions and increased costs under existing or future environmental, health and safety regulations, including those relating to climate change or other sustainability matters; changes in currency exchange rates and interest rates; tax rates and changes thereto; and various other factors discussed from time to time in the Company's filings with the Securities and Exchange Commission. Any forward-looking statement speaks only as of the date on which it is made, and the Company undertakes no obligation to update any forward-looking statements to reflect events or circumstances after the date on which it is made or to reflect the occurrence of anticipated or unanticipated events or circumstances. Results Unaudited The results in this document, together with the adjustments made to present the results on a comparable basis, have not been audited and are based on internal financial data furnished to management. Historical results should not be taken as an indication of the results of operations to be reported for any future period. Pro forma financial information herein is preliminary and subject to change. Presentation This document presents the Company’s two business segments, Engineered Materials and Acetyl Chain. Non-GAAP Financial Measures This presentation, and statements made in connection with this presentation, may refer to non-GAAP financial measures. For more information on the non-GAAP financial measures used by the Company, including the most directly comparable GAAP financial measure for each non-GAAP financial measures used, including definitions and reconciliations of the differences between such non-GAAP financial measures and the comparable GAAP financial measures, please refer to the Non-US GAAP Financial Measures and Supplemental Information document available on our website, investors.celanese.com, under Financial Information/Non-GAAP Financial Measures. 2

Discussion Topics 3 Earnings update Key actions and near- term imperatives
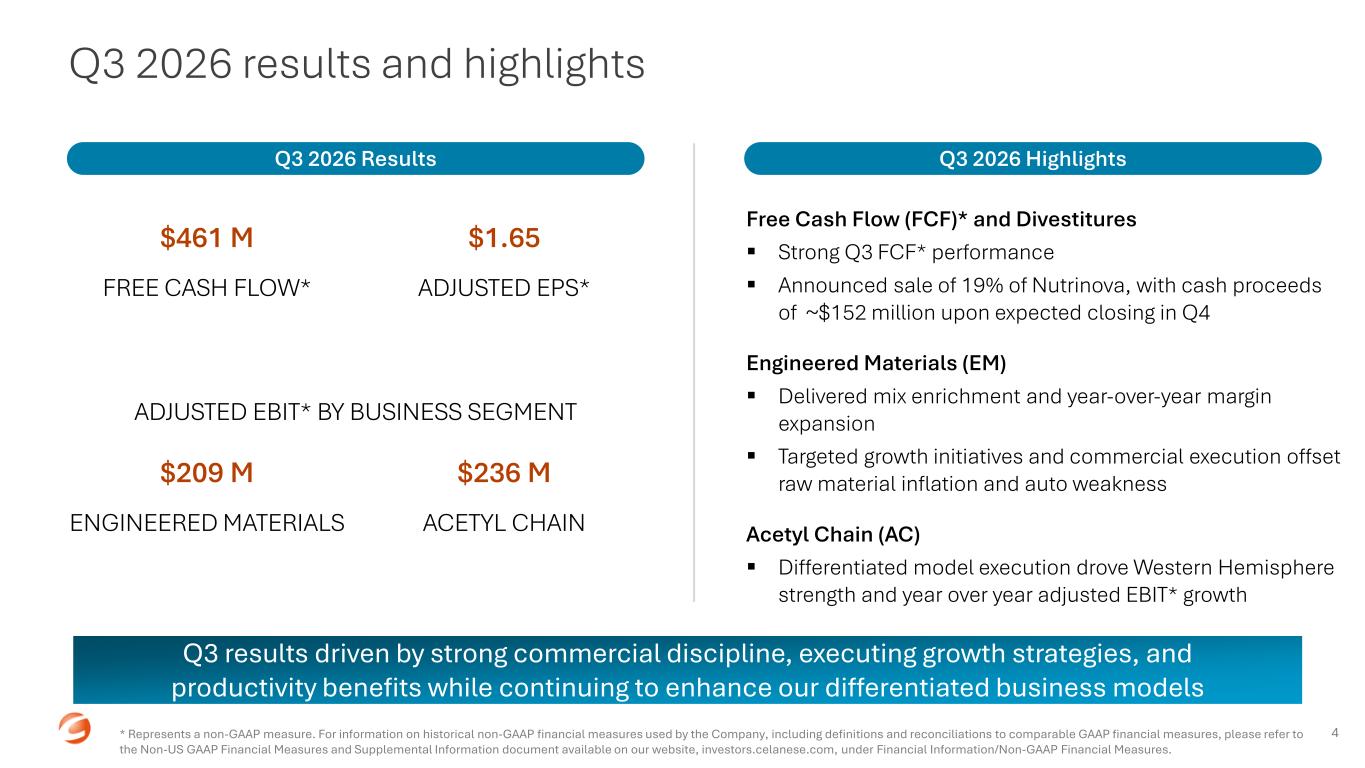
Q3 2026 results and highlights Q3 2026 Results 4 Q3 2026 Highlights * Represents a non-GAAP measure. For information on historical non-GAAP financial measures used by the Company, including definitions and reconciliations to comparable GAAP financial measures, please refer to the Non-US GAAP Financial Measures and Supplemental Information document available on our website, investors.celanese.com, under Financial Information/Non-GAAP Financial Measures. Free Cash Flow (FCF)* and Divestitures ▪ Strong Q3 FCF* performance ▪ Announced sale of 19% of Nutrinova, with cash proceeds of ~$152 million upon expected closing in Q4 Engineered Materials (EM) ▪ Delivered mix enrichment and year-over-year margin expansion ▪ Targeted growth initiatives and commercial execution offset raw material inflation and auto weakness Acetyl Chain (AC) ▪ Differentiated model execution drove Western Hemisphere strength and year over year adjusted EBIT* growth Q3 results driven by strong commercial discipline, executing growth strategies, and productivity benefits while continuing to enhance our differentiated business models $461 M FREE CASH FLOW* $1.65 ADJUSTED EPS* ADJUSTED EBIT* BY BUSINESS SEGMENT $209 M ENGINEERED MATERIALS $236 M ACETYL CHAIN
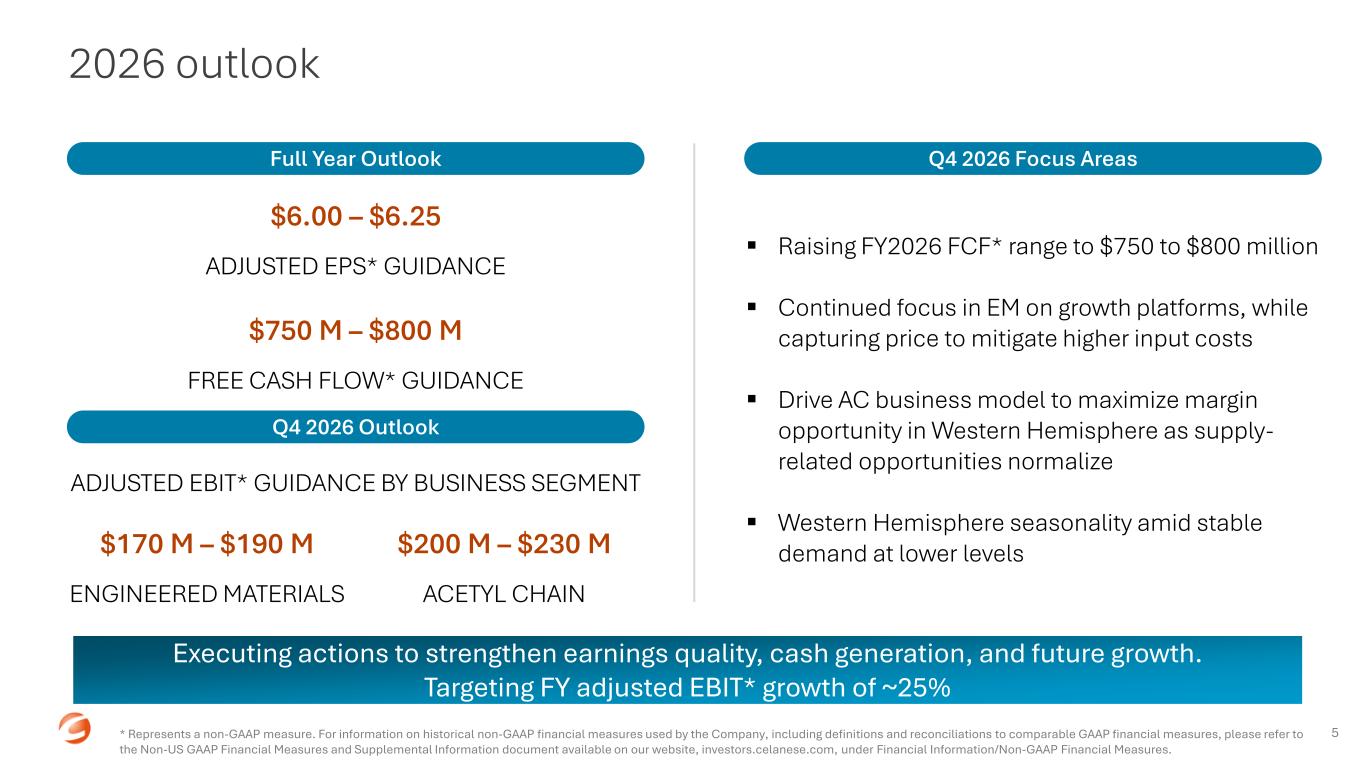
▪ Raising FY2026 FCF* range to $750 to $800 million ▪ Continued focus in EM on growth platforms, while capturing price to mitigate higher input costs ▪ Drive AC business model to maximize margin opportunity in Western Hemisphere as supply- related opportunities normalize ▪ Western Hemisphere seasonality amid stable demand at lower levels 2026 outlook Full Year Outlook 5 Q4 2026 Focus Areas * Represents a non-GAAP measure. For information on historical non-GAAP financial measures used by the Company, including definitions and reconciliations to comparable GAAP financial measures, please refer to the Non-US GAAP Financial Measures and Supplemental Information document available on our website, investors.celanese.com, under Financial Information/Non-GAAP Financial Measures. $6.00 – $6.25 ADJUSTED EPS* GUIDANCE $750 M – $800 M FREE CASH FLOW* GUIDANCE ADJUSTED EBIT* GUIDANCE BY BUSINESS SEGMENT $170 M – $190 M ENGINEERED MATERIALS $200 M – $230 M ACETYL CHAIN Executing actions to strengthen earnings quality, cash generation, and future growth. Targeting FY adjusted EBIT* growth of ~25% Q4 2026 Outlook
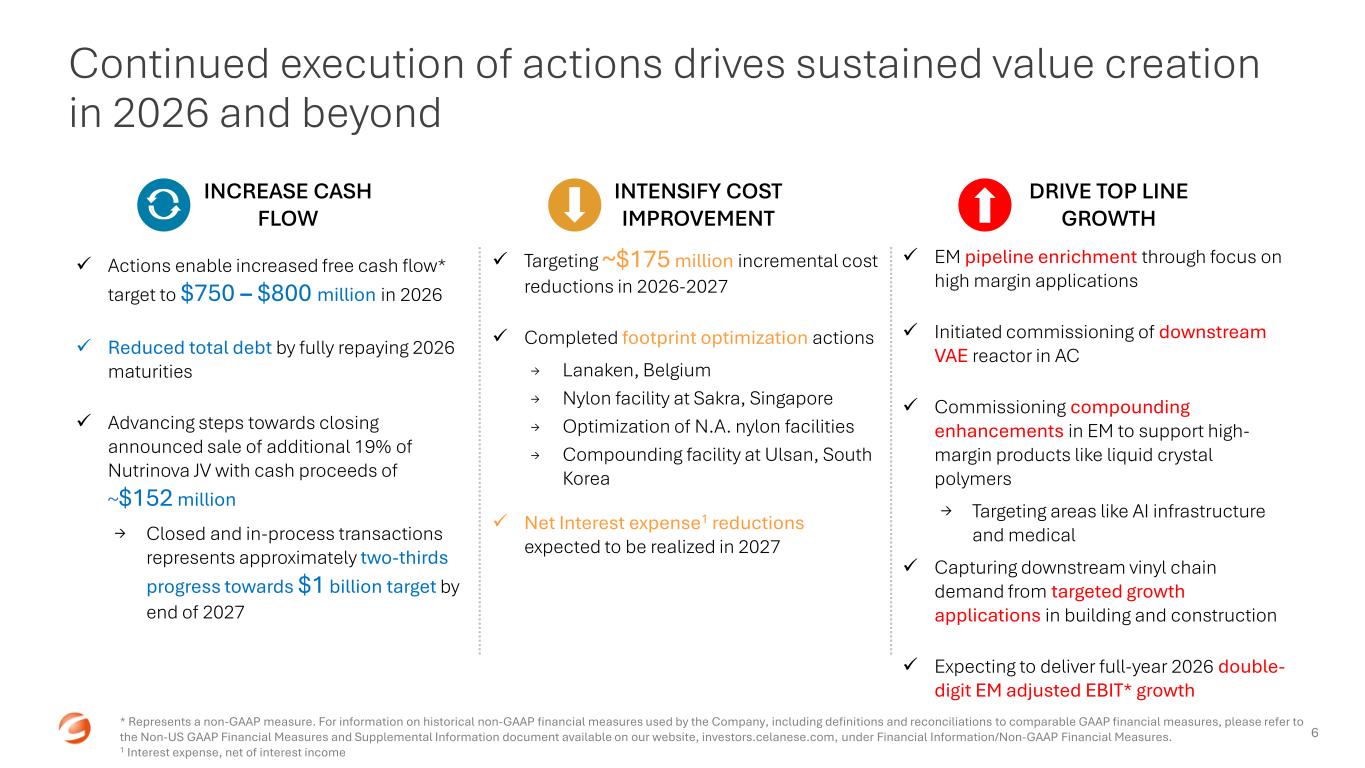
Continued execution of actions drives sustained value creation in 2026 and beyond 6 ✓ Actions enable increased free cash flow* target to $750 – $800 million in 2026 ✓ Reduced total debt by fully repaying 2026 maturities ✓ Advancing steps towards closing announced sale of additional 19% of Nutrinova JV with cash proceeds of ~$152 million → Closed and in-process transactions represents approximately two-thirds progress towards $1 billion target by end of 2027 ✓ Targeting ~$175 million incremental cost reductions in 2026-2027 ✓ Completed footprint optimization actions → Lanaken, Belgium → Nylon facility at Sakra, Singapore → Optimization of N.A. nylon facilities → Compounding facility at Ulsan, South Korea ✓ Net Interest expense1 reductions expected to be realized in 2027 ✓ EM pipeline enrichment through focus on high margin applications ✓ Initiated commissioning of downstream VAE reactor in AC ✓ Commissioning compounding enhancements in EM to support high- margin products like liquid crystal polymers → Targeting areas like AI infrastructure and medical ✓ Capturing downstream vinyl chain demand from targeted growth applications in building and construction ✓ Expecting to deliver full-year 2026 double- digit EM adjusted EBIT* growth INCREASE CASH FLOW DRIVE TOP LINE GROWTH INTENSIFY COST IMPROVEMENT * Represents a non-GAAP measure. For information on historical non-GAAP financial measures used by the Company, including definitions and reconciliations to comparable GAAP financial measures, please refer to the Non-US GAAP Financial Measures and Supplemental Information document available on our website, investors.celanese.com, under Financial Information/Non-GAAP Financial Measures. 1 Interest expense, net of interest income
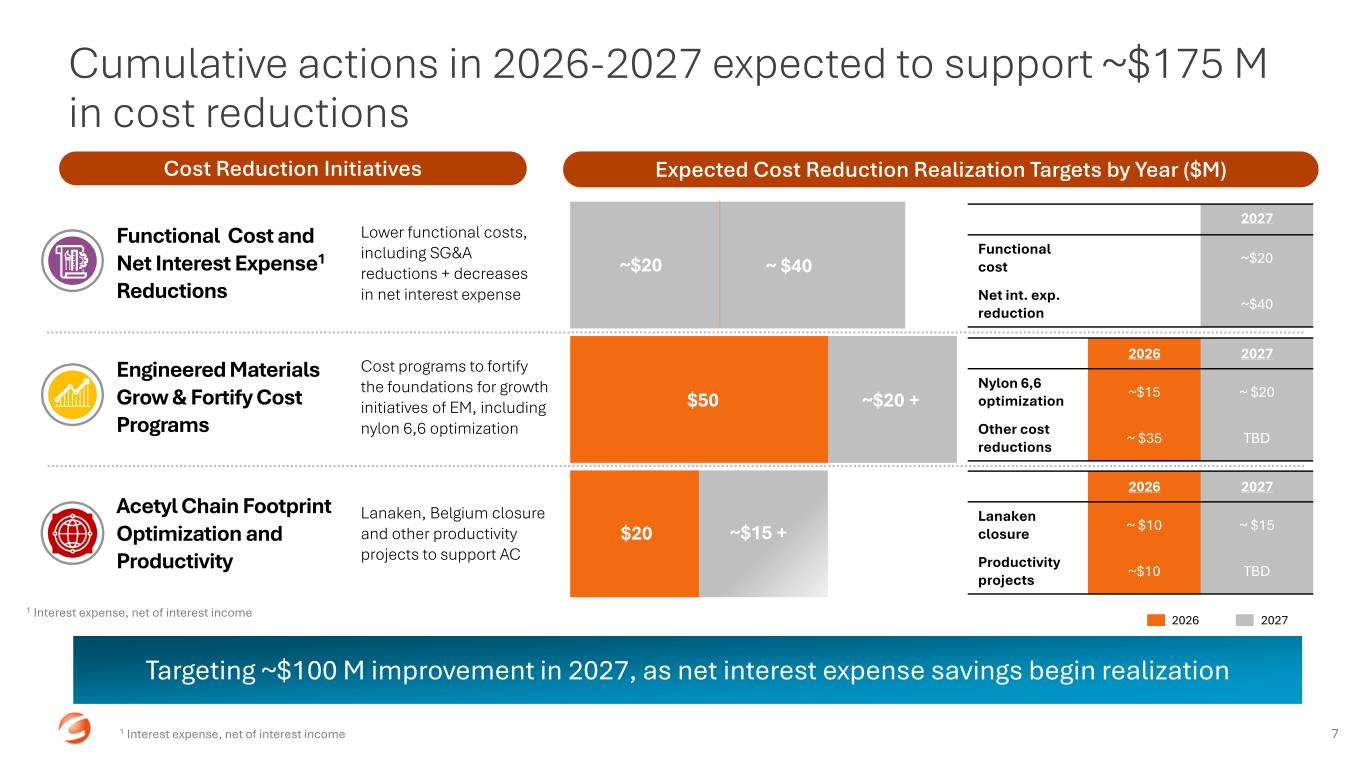
Functional Cost and Net Interest Expense1 Reductions Cumulative actions in 2026-2027 expected to support ~$175 M in cost reductions 7 Engineered Materials Grow & Fortify Cost Programs Acetyl Chain Footprint Optimization and Productivity Lower functional costs, including SG&A reductions + decreases in net interest expense Cost Reduction Initiatives Expected Cost Reduction Realization Targets by Year ($M) Targeting ~$100 M improvement in 2027, as net interest expense savings begin realization ~$15 + $50 $20 Cost programs to fortify the foundations for growth initiatives of EM, including nylon 6,6 optimization ~$20 Lanaken, Belgium closure and other productivity projects to support AC 2026 2027 2026 2027 Functional cost ~$10M ~$20 Net int. exp. reduction - ~$40 2026 2027 Nylon 6,6 optimization ~$15 ~ $20 Other cost reductions ~ $35 TBD 2026 2027 Lanaken closure ~ $10 ~ $15 Productivity projects ~$10 TBD ~ $40 ~$20 + 1 Interest expense, net of interest income 1 Interest expense, net of interest income
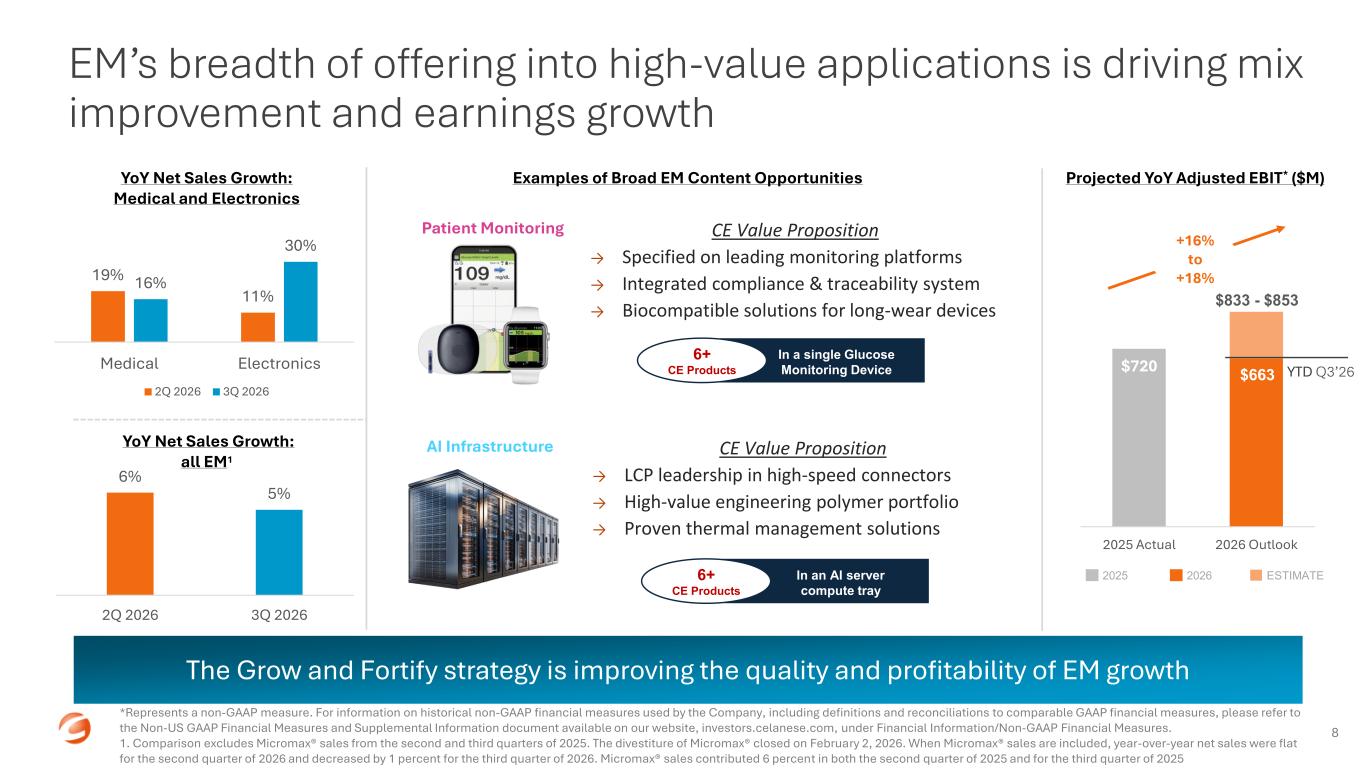
EM’s breadth of offering into high-value applications is driving mix improvement and earnings growth 8 *Represents a non-GAAP measure. For information on historical non-GAAP financial measures used by the Company, including definitions and reconciliations to comparable GAAP financial measures, please refer to the Non-US GAAP Financial Measures and Supplemental Information document available on our website, investors.celanese.com, under Financial Information/Non-GAAP Financial Measures. 1. Comparison excludes Micromax® sales from the second and third quarters of 2025. The divestiture of Micromax® closed on February 2, 2026. When Micromax® sales are included, year-over-year net sales were flat for the second quarter of 2026 and decreased by 1 percent for the third quarter of 2026. Micromax® sales contributed 6 percent in both the second quarter of 2025 and for the third quarter of 2025 ESTIMATE2026 The Grow and Fortify strategy is improving the quality and profitability of EM growth 2025 19% 11% 16% 30% Medical Electronics 2Q 2026 3Q 2026 6% 5% 2Q 2026 3Q 2026 $720 2025 Actual 2026 Outlook YoY Net Sales Growth: Medical and Electronics YoY Net Sales Growth: all EM1 Patient Monitoring AI Infrastructure Across 11 separate applications CE Value Proposition → LCP leadership in high-speed connectors → High-value engineering polymer portfolio → Proven thermal management solutions CE Value Propo ition → Specified on leading monitoring platforms → Integrated compliance & traceability system → Biocompatible solutions for long-wear devices Examples of Broad EM Content Opportunities Projected YoY Adjusted EBIT* ($M) $833 - $853 $663 YTD Q3’26 6+ CE Products In a single Glucose Monitoring Device 6+ CE Products In an AI server compute tray +16% to +18%
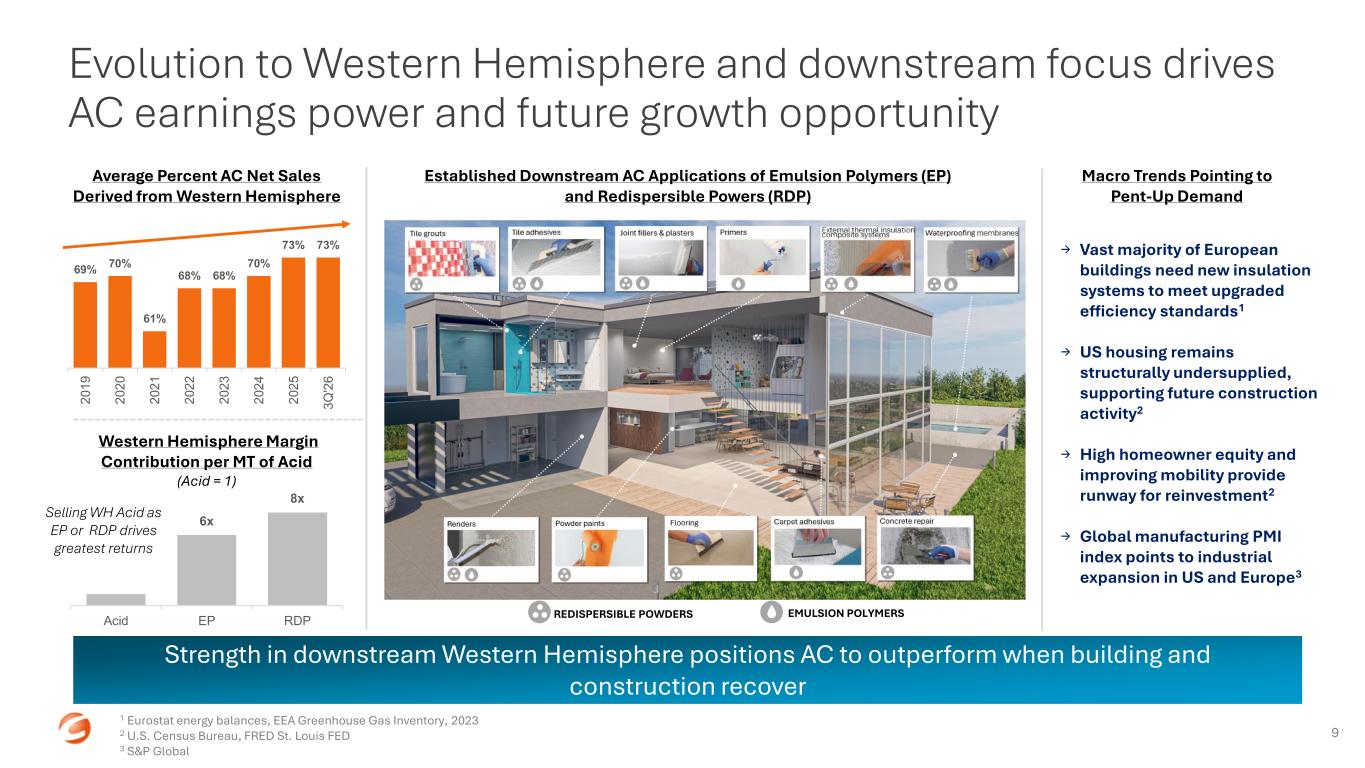
69% 70% 61% 68% 68% 70% 73% 73% 2 0 1 9 2 0 2 0 2 0 2 1 2 0 2 2 2 0 2 3 2 0 2 4 2 0 2 5 3 Q '2 6 Evolution to Western Hemisphere and downstream focus drives AC earnings power and future growth opportunity 9 Strength in downstream Western Hemisphere positions AC to outperform when building and construction recover 6x 8x Acid EP RDP Western Hemisphere Margin Contribution per MT of Acid (Acid = 1) Selling WH Acid as EP or RDP drives greatest returns → Vast majority of European buildings need new insulation systems to meet upgraded efficiency standards1 → US housing remains structurally undersupplied, supporting future construction activity2 → High homeowner equity and improving mobility provide runway for reinvestment2 → Global manufacturing PMI index points to industrial expansion in US and Europe3 Average Percent AC Net Sales Derived from Western Hemisphere Established Downstream AC Applications of Emulsion Polymers (EP) and Redispersible Powers (RDP) Macro Trends Pointing to Pent-Up Demand REDISPERSIBLE POWDERS EMULSION POLYMERS 1 Eurostat energy balances, EEA Greenhouse Gas Inventory, 2023 2 U.S. Census Bureau, FRED St. Louis FED 3 S&P Global
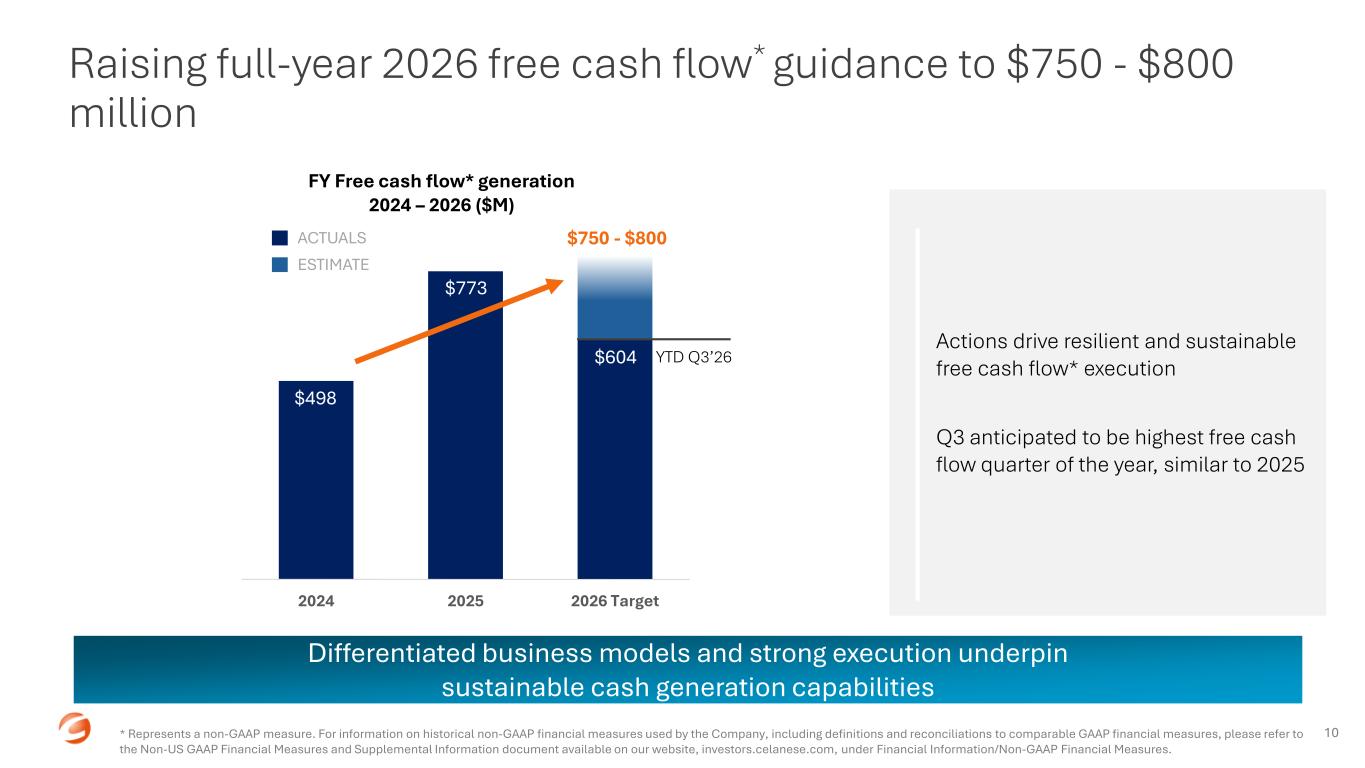
Raising full-year 2026 free cash flow* guidance to $750 - $800 million 10* Represents a non-GAAP measure. For information on historical non-GAAP financial measures used by the Company, including definitions and reconciliations to comparable GAAP financial measures, please refer to the Non-US GAAP Financial Measures and Supplemental Information document available on our website, investors.celanese.com, under Financial Information/Non-GAAP Financial Measures. Differentiated business models and strong execution underpin sustainable cash generation capabilities 2024 2025 2026 Target $498 ACTUALS ESTIMATE $773 $750 - $800 FY Free cash flow* generation 2024 – 2026 ($M) Actions drive resilient and sustainable free cash flow* execution Q3 anticipated to be highest free cash flow quarter of the year, similar to 2025 $604 YTD Q3’26
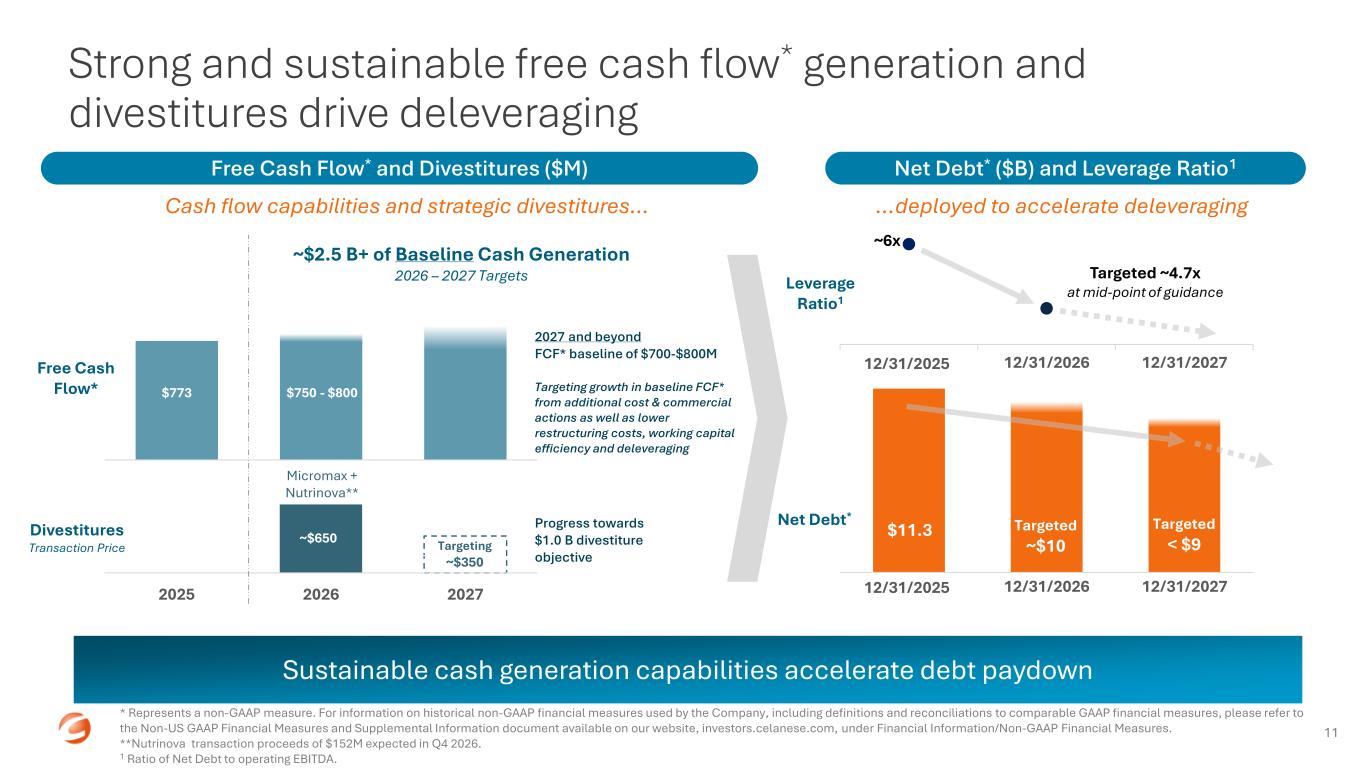
0 200 400 600 800 1000 2025 2026 2027 0 500 1000 1500 2025 2026 2027 1 2 3 1 2 3 Strong and sustainable free cash flow* generation and divestitures drive deleveraging Free Cash Flow* and Divestitures ($M) 11 Sustainable cash generation capabilities accelerate debt paydown Cash flow capabilities and strategic divestitures… * Represents a non-GAAP measure. For information on historical non-GAAP financial measures used by the Company, including definitions and reconciliations to comparable GAAP financial measures, please refer to the Non-US GAAP Financial Measures and Supplemental Information document available on our website, investors.celanese.com, under Financial Information/Non-GAAP Financial Measures. **Nutrinova transaction proceeds of $152M expected in Q4 2026. 1 Ratio of Net Debt to operating EBITDA. Net Debt* ($B) and Leverage Ratio1 …deployed to accelerate deleveraging ~ $500 ~$2.5 B+ of Baseline Cash Generation 2026 – 2027 Targets 2027 and beyond FCF* baseline of $700-$800M Targeting growth in baseline FCF* from additional cost & commercial actions as well as lower restructuring costs, working capital efficiency and deleveraging Divestitures Transaction Price $500 ~$500 Targeting ~$350 Micromax + Nutrinova** Progress towards $1.0 B divestiture objective $498 $773 Free Cash Flow* 12/31/2025 12/31/2027 $11.3 Targeted < $9 ~ $750 - $800 Targeted ~$10~$650 12/31/2026 Net Debt* Leverage Ratio1 12/31/2025 12/31/202712/31/2026 ~6x Targeted ~4.7x at mid-point of guidance
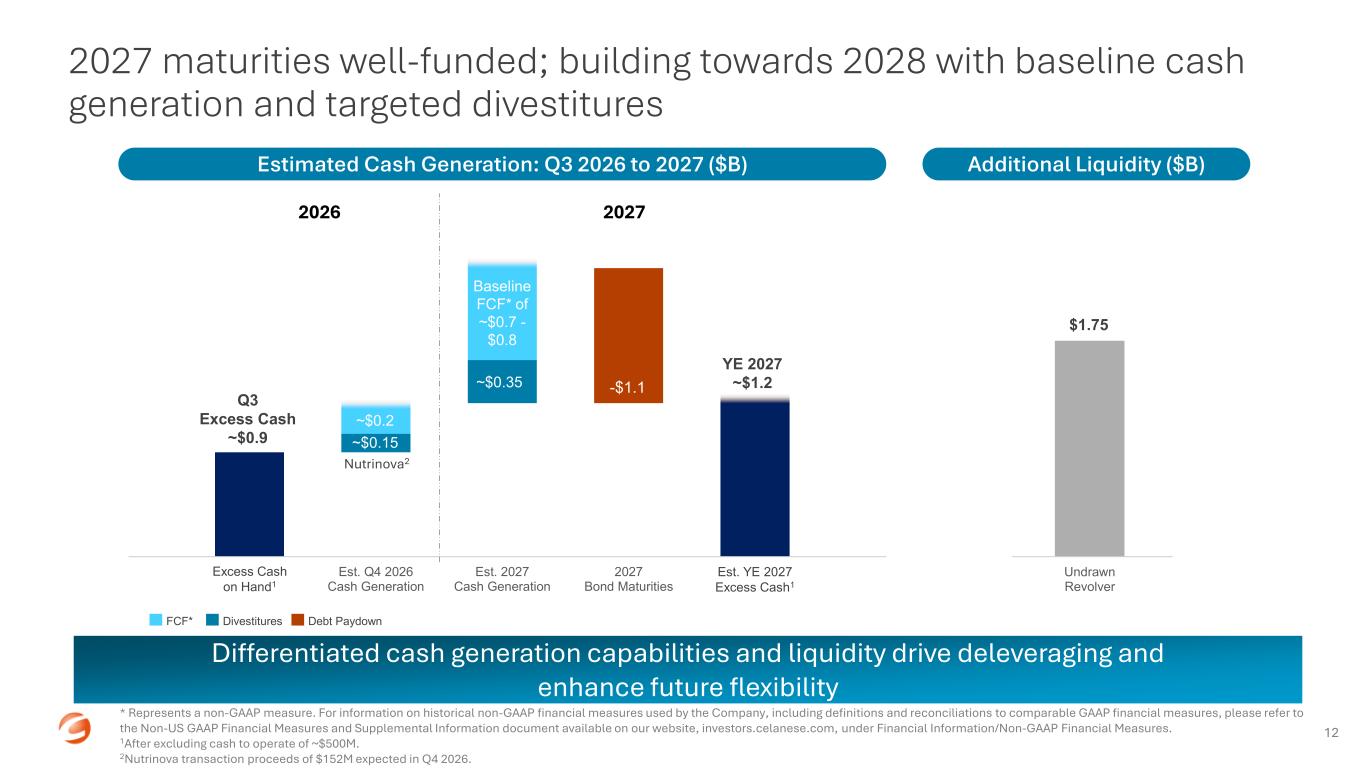
Undrawn Revolver 2027 maturities well-funded; building towards 2028 with baseline cash generation and targeted divestitures 12 Differentiated cash generation capabilities and liquidity drive deleveraging and enhance future flexibility * Represents a non-GAAP measure. For information on historical non-GAAP financial measures used by the Company, including definitions and reconciliations to comparable GAAP financial measures, please refer to the Non-US GAAP Financial Measures and Supplemental Information document available on our website, investors.celanese.com, under Financial Information/Non-GAAP Financial Measures. 1After excluding cash to operate of ~$500M. 2Nutrinova transaction proceeds of $152M expected in Q4 2026. Estimated Cash Generation: Q3 2026 to 2027 ($B) $1.75 Additional Liquidity ($B) Excess Cash on Hand1 Est. Q4 2026 Cash Generation Est. 2027 Cash Generation 2027 Bond Maturities Est. YE 2027 Excess Cash YE 2027 ~$1.2 ~$0.2 Baseline FCF* of ~$0.7 - $0.8 ~$0.35 -$1.1 20272026 Nutrinova2 ~$0.15 DivestituresFCF* Debt Paydown 1 Q3 Excess Cash ~$0.9 xcess ash1
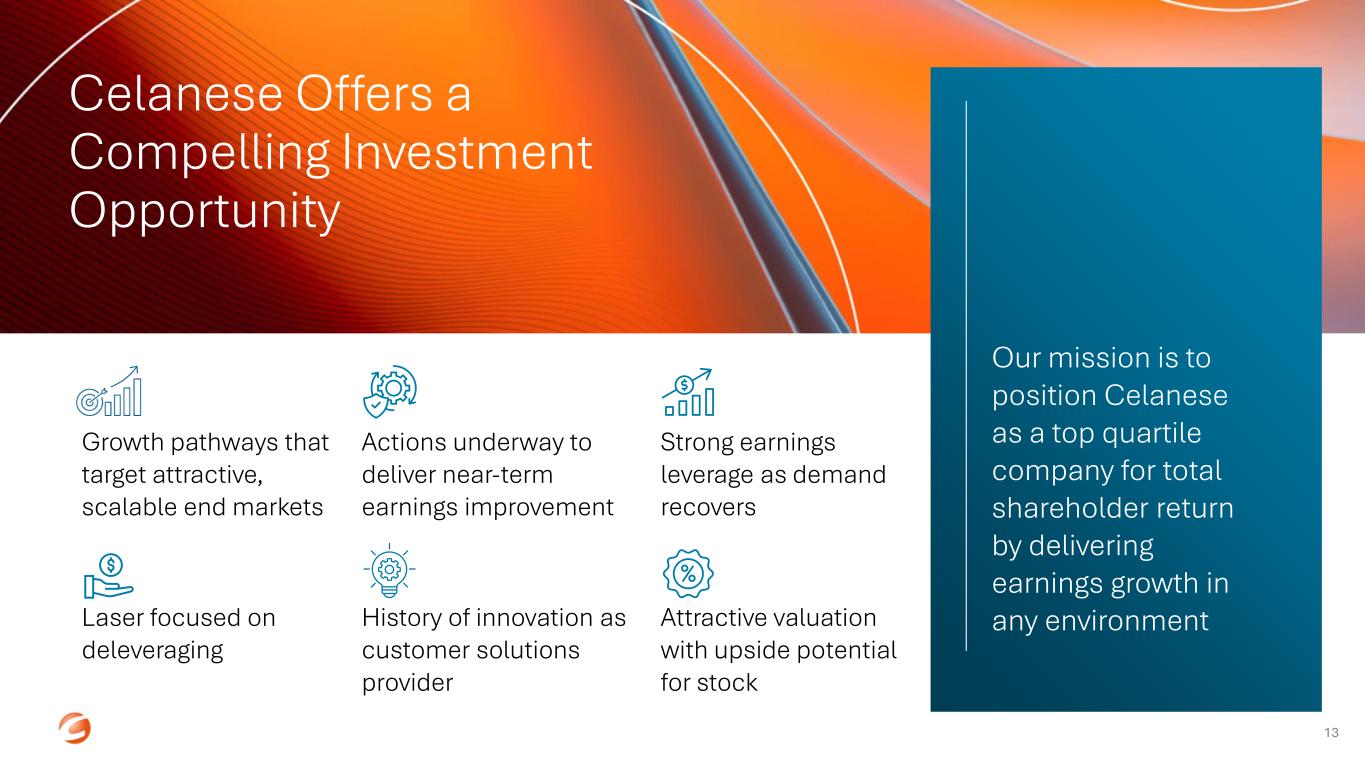
Growth pathways that target attractive, scalable end markets Actions underway to deliver near-term earnings improvement Strong earnings leverage as demand recovers Laser focused on deleveraging History of innovation as customer solutions provider Attractive valuation with upside potential for stock Celanese Offers a Compelling Investment Opportunity Our mission is to position Celanese as a top quartile company for total shareholder return by delivering earnings growth in any environment 13