Shareholder Report
|
12 Months Ended |
|
Aug. 31, 2026
USD ($)
Holding
|
|---|
| Shareholder Report [Line Items] |
|
|
| Document Type |
N-CSR
|
|
| Amendment Flag |
false
|
|
| Registrant Name |
SEI TAX EXEMPT TRUST
|
|
| Entity Central Index Key |
0000701817
|
|
| Entity Investment Company Type |
N-1A
|
|
| Document Period End Date |
Aug. 31, 2026
|
|
| Shareholder Report Annual or Semi-Annual |
annual shareholder report
|
|
| C000017636 |
|
|
| Shareholder Report [Line Items] |
|
|
| Fund Name |
Intermediate-Term Municipal Fund
|
|
| Class Name |
Class F
|
|
| Trading Symbol |
SEIMX
|
|
| Annual or Semi-Annual Statement [Text Block] |
Annual Shareholder Report
|
|
| Additional Information [Text Block] |
This annual shareholder report contains important information about Class F Shares of the Intermediate-Term Municipal Fund (the "Fund") for the period from September 1, 2025 to August 31, 2026. You can find additional information about the Fund at https://www.seic.com/mutual-fund-documentation/prospectuses-and-reports. You can also request this information by contacting us at (610) 676-1000.
|
|
| Additional Information Phone Number |
(610) 676-1000
|
|
| Additional Information Website |
https://www.seic.com/mutual-fund-documentation/prospectuses-and-reports
|
|
| Expenses [Text Block] |
What were the Fund costs for the last year?(based on a hypothetical $10,000 investment) Table SummaryFund Name | Costs of a $10,000 investment | Costs paid as a percentage of a $10,000 investment |
|---|
Intermediate-Term Municipal Fund, Class F Shares | $64 | 0.63% |
|---|
|
|
| Expenses Paid, Amount |
$ 64
|
|
| Expense Ratio, Percent |
0.63%
|
|
| Factors Affecting Performance [Text Block] |
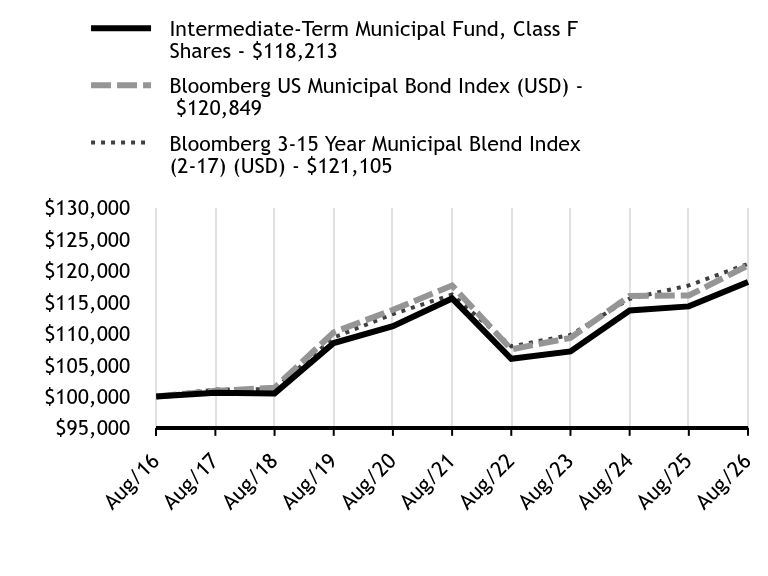
How did the Fund perform in the last year?Class F Shares of the Fund outperformed its benchmark, the Bloomberg 3-15 Year Municipal Blend Index (2-17) (USD), for the 12-month period ending August 31, 2026. The target range on the federal funds rate began the reporting period at 4.25%-4.50%. The Federal Reserve (Fed) then cut its benchmark interest rate by 25 basis points (0.25%) at its September 2025 meeting. The Fed subsequently reduced the rate by 25 basis points at both its October and December 2025 meetings, bringing the target range to 3.50%-3.75%. The Fed maintained the range for the first eight months of 2026. The ongoing conflict between the U.S. and Iran, which began on February 28, 2026, has contributed to renewed inflationary pressure, while the labor market has remained on solid ground. Municipal market performance has remained resilient thus far in 2026, supported by strong fund inflows and solid issuer fundamentals despite record issuance and a higher interest-rate environment. Additionally, lower-rated and high-yield municipal sectors have led performance this year, while investment-grade municipals have generated modest positive returns amid upward pressure on long-term interest rates. The Fund’s outperformance versus its benchmark for the reporting period was due primarily to an overweight allocation to longer-dated bonds and overweight to BBB and A rated names relative to the index. Security selection within the healthcare and education sectors contributed positively to Fund performance, while security selection in tobacco was a detractor. At the sub-adviser level, Wellington Management Company LLP outperformed the benchmark, benefiting from security selection in the housing sector, while an overweight allocation to healthcare bonds had a negative impact on performance. Insight North America LLC outperformed due to an underweight allocation to general obligation (GO) bonds and an overweight to revenue bonds. Nomura Investments Fund Advisers’ outperformance was attributable to allocations to BBB rated and high-yield bonds. |
|
| Performance Past Does Not Indicate Future [Text] |
Past performance is not indicative of future performance.
|
|
| Line Graph [Table Text Block] |
Table Summary | Intermediate-Term Municipal Fund, Class F Shares | Bloomberg US Municipal Bond Index (USD) | Bloomberg 3-15 Year Municipal Blend Index (2-17) (USD) |
|---|
Aug/16 | $100,000 | $100,000 | $100,000 |
|---|
Aug/17 | $100,586 | $100,883 | $101,094 |
|---|
Aug/18 | $100,482 | $101,376 | $101,136 |
|---|
Aug/19 | $108,499 | $110,215 | $109,387 |
|---|
Aug/20 | $111,168 | $113,781 | $113,098 |
|---|
Aug/21 | $115,588 | $117,645 | $116,205 |
|---|
Aug/22 | $105,987 | $107,490 | $107,966 |
|---|
Aug/23 | $107,165 | $109,322 | $109,779 |
|---|
Aug/24 | $113,670 | $115,978 | $115,550 |
|---|
Aug/25 | $114,329 | $116,067 | $117,662 |
|---|
Aug/26 | $118,213 | $120,849 | $121,105 |
|---|
|
|
| Average Annual Return [Table Text Block] |
Table SummaryFund/Index Name | 1 Year | 5 Years | 10 Years |
|---|
Intermediate-Term Municipal Fund, Class F Shares | 3.40% | 0.45% | 1.69% |
|---|
Bloomberg US Municipal Bond Index (USD) | 4.12% | 0.54% | 1.91% |
|---|
Bloomberg 3-15 Year Municipal Blend Index (2-17) (USD) | 2.93% | 0.83% | 1.93% |
|---|
|
|
| No Deduction of Taxes [Text Block] |
The table and graph presented above do not reflect the deduction of taxes a shareholder would pay on Fund distributions or the redemption of Fund Shares.
|
|
| AssetsNet |
$ 1,556,636,000
|
|
| Holdings Count | Holding |
893
|
|
| Advisory Fees Paid, Amount |
$ 3,002
|
|
| InvestmentCompanyPortfolioTurnover |
17.00%
|
|
| Additional Fund Statistics [Text Block] |
Key Fund Statistics as of August 31, 2026Table Summary | Total Net Assets (000's) | Number of Holdings | Total Advisory Fees Paid (000's) | Portfolio Turnover Rate |
|---|
| $1,556,636 | 893 | $3,002 | 17% |
|---|
|
|
| Holdings [Text Block] |
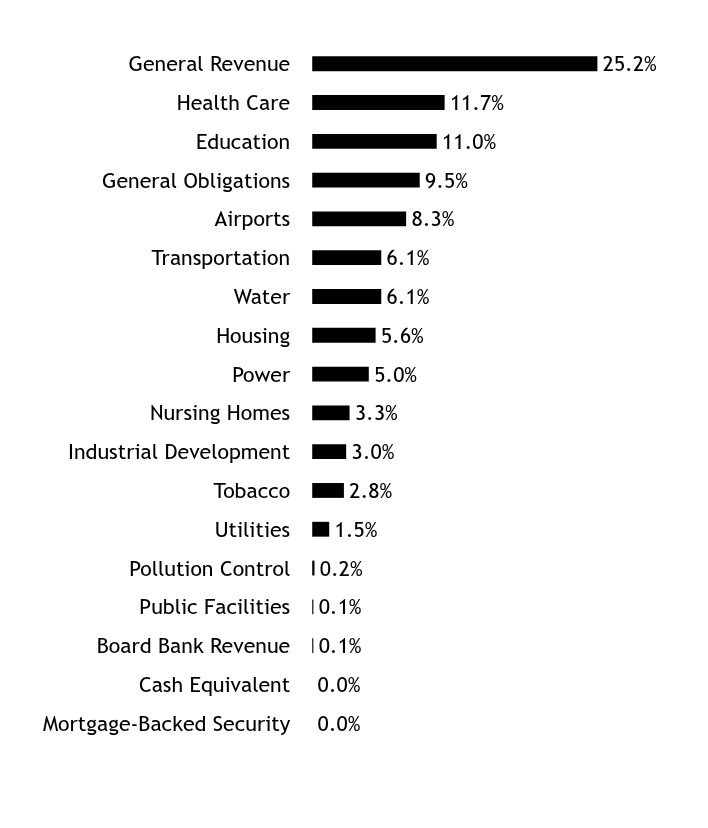
Sector WeightingsFootnote Reference*Table SummaryValue | Value |
|---|
Mortgage-Backed Security | 0.0% | Cash Equivalent | 0.0% | Board Bank Revenue | 0.1% | Public Facilities | 0.1% | Pollution Control | 0.2% | Utilities | 1.5% | Tobacco | 2.8% | Industrial Development | 3.0% | Nursing Homes | 3.3% | Power | 5.0% | Housing | 5.6% | Water | 6.1% | Transportation | 6.1% | Airports | 8.3% | General Obligations | 9.5% | Education | 11.0% | Health Care | 11.7% | General Revenue | 25.2% | | Footnote | Description | Footnote* | Percentages are calculated based on total net assets. |
|
|
| Largest Holdings [Text Block] |
Table SummaryHolding Name | Coupon Rate | Maturity Date | Percentage of Total
Net AssetsFootnote Reference(A) |
|---|
Southeast Alabama, Energy Authority, Ser E | 5.000%
| 10/01/30
| 0.8% | Wisconsin State, Public Finance Authority, Duke Energy Progress Project | 3.700%
| 10/01/46
| 0.7% | Massachusetts State, Development Finance Agency, Dana Farber Cancer Institute | 5.000%
| 12/01/42
| 0.7% | New Jersey State, Tobacco Settlement Financing, Ser A | 5.000%
| 06/01/35
| 0.7% | Massachusetts State, Development Finance Agency, Beth Israel Lahey Health | 5.250%
| 07/01/44
| 0.6% | Pennsylvania State, Economic Development Financing Authority, PENNDOT Major Bridges Project, AMT | 5.000%
| 06/30/34
| 0.6% | King County, Public Hospital District No. 1 | 5.000%
| 12/01/27
| 0.5% | Southeast Alabama, Energy Authority, Cooperative District, Ser B | 5.000%
| 09/01/33
| 0.5% | California State, Community Choice Financing Authority, Clean Energy Project, Ser B-1 | 4.000%
| 02/01/52
| 0.5% | Texas State, Municipal Gas Acquisition & Supply IV, Ser B | 5.500%
| 01/01/54
| 0.5% | | Footnote | Description | Footnote(A) | Cash Equivalents are not shown in the top ten holdings. |
|
|
| Material Fund Change [Text Block] |
There were no material fund changes during the reporting period. |
|
| C000147417 |
|
|
| Shareholder Report [Line Items] |
|
|
| Fund Name |
Intermediate-Term Municipal Fund
|
|
| Class Name |
Class Y
|
|
| Trading Symbol |
SINYX
|
|
| Annual or Semi-Annual Statement [Text Block] |
Annual Shareholder Report
|
|
| Additional Information [Text Block] |
This annual shareholder report contains important information about Class Y Shares of the Intermediate-Term Municipal Fund (the "Fund") for the period from September 1, 2025 to August 31, 2026. You can find additional information about the Fund at https://www.seic.com/mutual-fund-documentation/prospectuses-and-reports. You can also request this information by contacting us at (610) 676-1000.
|
|
| Additional Information Phone Number |
(610) 676-1000
|
|
| Additional Information Website |
https://www.seic.com/mutual-fund-documentation/prospectuses-and-reports
|
|
| Expenses [Text Block] |
What were the Fund costs for the last year?(based on a hypothetical $10,000 investment) Table SummaryFund Name | Costs of a $10,000 investment | Costs paid as a percentage of a $10,000 investment |
|---|
Intermediate-Term Municipal Fund, Class Y Shares | $39 | 0.38% |
|---|
|
|
| Expenses Paid, Amount |
$ 39
|
|
| Expense Ratio, Percent |
0.38%
|
|
| Factors Affecting Performance [Text Block] |
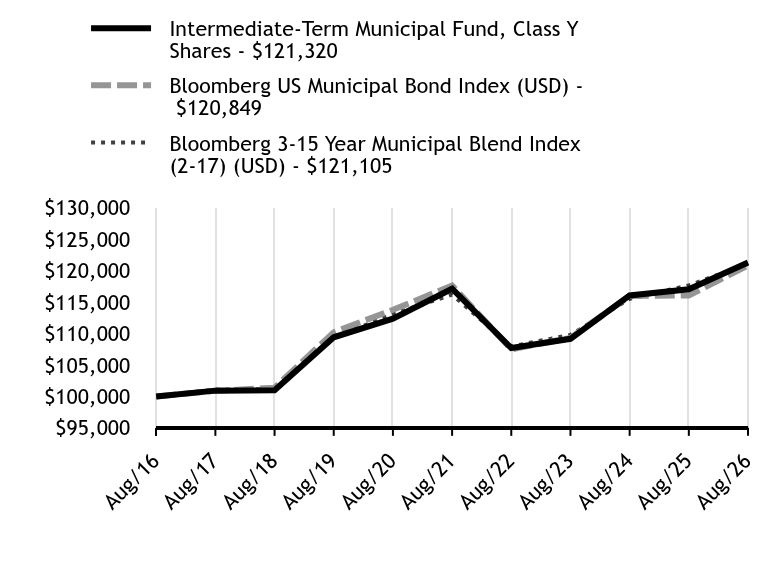
How did the Fund perform in the last year?Class Y Shares of the Fund outperformed its benchmark, the Bloomberg 3-15 Year Municipal Blend Index (2-17) (USD), for the 12-month period ending August 31, 2026. The target range on the federal funds rate began the reporting period at 4.25%-4.50%. The Federal Reserve (Fed) then cut its benchmark interest rate by 25 basis points (0.25%) at its September 2025 meeting. The Fed subsequently reduced the rate by 25 basis points at both its October and December 2025 meetings, bringing the target range to 3.50%-3.75%. The Fed maintained the range for the first eight months of 2026. The ongoing conflict between the U.S. and Iran, which began on February 28, 2026, has contributed to renewed inflationary pressure, while the labor market has remained on solid ground. Municipal market performance has remained resilient thus far in 2026, supported by strong fund inflows and solid issuer fundamentals despite record issuance and a higher interest-rate environment. Additionally, lower-rated and high-yield municipal sectors have led performance this year, while investment-grade municipals have generated modest positive returns amid upward pressure on long-term interest rates. The Fund’s outperformance versus its benchmark for the reporting period was due primarily to an overweight allocation to longer-dated bonds and overweight to BBB and A rated names relative to the index. Security selection within the healthcare and education sectors contributed positively to Fund performance, while security selection in tobacco was a detractor. At the sub-adviser level, Wellington Management Company LLP outperformed the benchmark, benefiting from security selection in the housing sector, while an overweight allocation to healthcare bonds had a negative impact on performance. Insight North America LLC outperformed due to an underweight allocation to general obligation (GO) bonds and an overweight to revenue bonds. Nomura Investments Fund Advisers’ outperformance was attributable to allocations to BBB rated and high-yield bonds. |
|
| Performance Past Does Not Indicate Future [Text] |
Past performance is not indicative of future performance.
|
|
| Line Graph [Table Text Block] |
Table Summary | Intermediate-Term Municipal Fund, Class Y Shares | Bloomberg US Municipal Bond Index (USD) | Bloomberg 3-15 Year Municipal Blend Index (2-17) (USD) |
|---|
Aug/16 | $100,000 | $100,000 | $100,000 |
|---|
Aug/17 | $100,921 | $100,883 | $101,094 |
|---|
Aug/18 | $100,995 | $101,376 | $101,136 |
|---|
Aug/19 | $109,414 | $110,215 | $109,387 |
|---|
Aug/20 | $112,385 | $113,781 | $113,098 |
|---|
Aug/21 | $117,144 | $117,645 | $116,205 |
|---|
Aug/22 | $107,693 | $107,490 | $107,966 |
|---|
Aug/23 | $109,164 | $109,322 | $109,779 |
|---|
Aug/24 | $116,076 | $115,978 | $115,550 |
|---|
Aug/25 | $117,042 | $116,067 | $117,662 |
|---|
Aug/26 | $121,320 | $120,849 | $121,105 |
|---|
|
|
| Average Annual Return [Table Text Block] |
Table SummaryFund/Index Name | 1 Year | 5 Years | 10 Years |
|---|
Intermediate-Term Municipal Fund, Class Y Shares | 3.66% | 0.70% | 1.95% |
|---|
Bloomberg US Municipal Bond Index (USD) | 4.12% | 0.54% | 1.91% |
|---|
Bloomberg 3-15 Year Municipal Blend Index (2-17) (USD) | 2.93% | 0.83% | 1.93% |
|---|
|
|
| No Deduction of Taxes [Text Block] |
The table and graph presented above do not reflect the deduction of taxes a shareholder would pay on Fund distributions or the redemption of Fund Shares.
|
|
| AssetsNet |
$ 1,556,636,000
|
|
| Holdings Count | Holding |
893
|
|
| Advisory Fees Paid, Amount |
$ 3,002
|
|
| InvestmentCompanyPortfolioTurnover |
17.00%
|
|
| Additional Fund Statistics [Text Block] |
Key Fund Statistics as of August 31, 2026Table Summary | Total Net Assets (000's) | Number of Holdings | Total Advisory Fees Paid (000's) | Portfolio Turnover Rate |
|---|
| $1,556,636 | 893 | $3,002 | 17% |
|---|
|
|
| Holdings [Text Block] |
Sector WeightingsFootnote Reference*Table SummaryValue | Value |
|---|
Mortgage-Backed Security | 0.0% | Cash Equivalent | 0.0% | Board Bank Revenue | 0.1% | Public Facilities | 0.1% | Pollution Control | 0.2% | Utilities | 1.5% | Tobacco | 2.8% | Industrial Development | 3.0% | Nursing Homes | 3.3% | Power | 5.0% | Housing | 5.6% | Water | 6.1% | Transportation | 6.1% | Airports | 8.3% | General Obligations | 9.5% | Education | 11.0% | Health Care | 11.7% | General Revenue | 25.2% | | Footnote | Description | Footnote* | Percentages are calculated based on total net assets. |
|
|
| Largest Holdings [Text Block] |
Table SummaryHolding Name | Coupon Rate | Maturity Date | Percentage of Total
Net AssetsFootnote Reference(A) |
|---|
Southeast Alabama, Energy Authority, Ser E | 5.000%
| 10/01/30
| 0.8% | Wisconsin State, Public Finance Authority, Duke Energy Progress Project | 3.700%
| 10/01/46
| 0.7% | Massachusetts State, Development Finance Agency, Dana Farber Cancer Institute | 5.000%
| 12/01/42
| 0.7% | New Jersey State, Tobacco Settlement Financing, Ser A | 5.000%
| 06/01/35
| 0.7% | Massachusetts State, Development Finance Agency, Beth Israel Lahey Health | 5.250%
| 07/01/44
| 0.6% | Pennsylvania State, Economic Development Financing Authority, PENNDOT Major Bridges Project, AMT | 5.000%
| 06/30/34
| 0.6% | King County, Public Hospital District No. 1 | 5.000%
| 12/01/27
| 0.5% | Southeast Alabama, Energy Authority, Cooperative District, Ser B | 5.000%
| 09/01/33
| 0.5% | California State, Community Choice Financing Authority, Clean Energy Project, Ser B-1 | 4.000%
| 02/01/52
| 0.5% | Texas State, Municipal Gas Acquisition & Supply IV, Ser B | 5.500%
| 01/01/54
| 0.5% | | Footnote | Description | Footnote(A) | Cash Equivalents are not shown in the top ten holdings. |
|
|
| Material Fund Change [Text Block] |
There were no material fund changes during the reporting period. |
|
| C000017624 |
|
|
| Shareholder Report [Line Items] |
|
|
| Fund Name |
Short Duration Municipal Fund
|
|
| Class Name |
Class F
|
|
| Trading Symbol |
SUMAX
|
|
| Annual or Semi-Annual Statement [Text Block] |
Annual Shareholder Report
|
|
| Additional Information [Text Block] |
This annual shareholder report contains important information about Class F Shares of the Short Duration Municipal Fund (the "Fund") for the period from September 1, 2025 to August 31, 2026. You can find additional information about the Fund at https://www.seic.com/mutual-fund-documentation/prospectuses-and-reports. You can also request this information by contacting us at (610) 676-1000.
|
|
| Additional Information Phone Number |
(610) 676-1000
|
|
| Additional Information Website |
https://www.seic.com/mutual-fund-documentation/prospectuses-and-reports
|
|
| Expenses [Text Block] |
What were the Fund costs for the last year?(based on a hypothetical $10,000 investment) Table SummaryFund Name | Costs of a $10,000 investment | Costs paid as a percentage of a $10,000 investment |
|---|
Short Duration Municipal Fund, Class F Shares | $64 | 0.63% |
|---|
|
|
| Expenses Paid, Amount |
$ 64
|
|
| Expense Ratio, Percent |
0.63%
|
|
| Factors Affecting Performance [Text Block] |
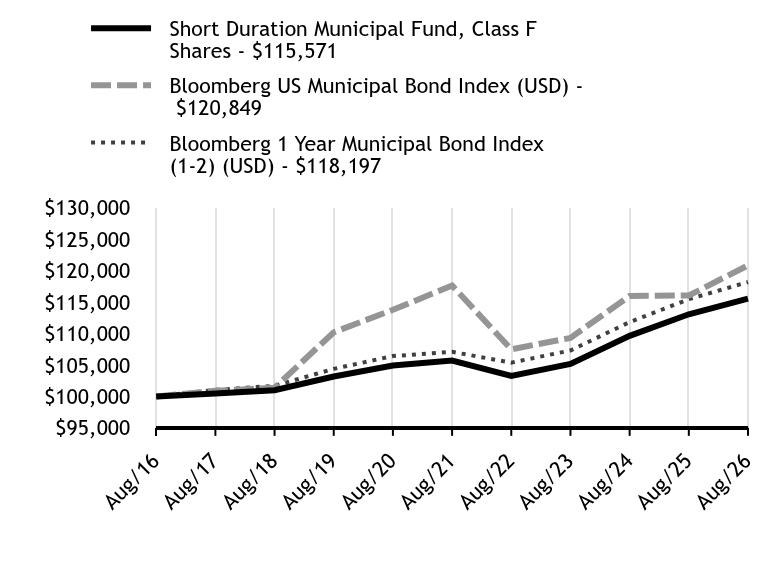
How did the Fund perform in the last year?Class F Shares of the Fund modestly underperformed its benchmark, the Bloomberg 1-Year Municipal Bond Index, for the 12-month period ending August 31, 2026. The target range on the federal funds rate began the reporting period at 4.25%-4.50%. The Federal Reserve (Fed) then cut its benchmark interest rate by 25 basis points (0.25%) at its September 2025 meeting. The Fed subsequently reduced the rate by 25 basis points at both its October and December 2025 meetings, bringing the target range to 3.50%-3.75%. The Fed maintained the range for the first eight months of 2026. The ongoing conflict between the U.S. and Iran, which began on February 28, 2026, has contributed to renewed inflationary pressure, while the labor market has remained on solid ground. Municipal market performance has remained resilient thus far in 2026, supported by strong fund inflows and solid issuer fundamentals despite record issuance and a higher interest-rate environment. Additionally, lower-rated and high-yield municipal sectors have led performance this year, while investment-grade municipals have generated modest positive returns amid upward pressure on long-term interest rates. Security selection in the housing sector weighed on Fund performance over the reporting period. Fund performance was enhanced by security selection in revenue sectors such as prepaid gas and transportation, while an underweight allocation to general obligation (GO) bonds had a positive impact as the sector underperformed the overall municipal market. At the sub-adviser level, both Neuberger Berman Investment Advisers LLC and Allspring Global Investments LLC outperformed the benchmark for the reporting period. Neuberger Berman Investment Advisers LLC benefited from an overweight to cash-collateralized housing bonds, which property developers use to secure favorable tax credits for affordable housing projects. Allspring Global Investments LLC’s performance was bolstered by security selection in healthcare and transportation bonds. |
|
| Performance Past Does Not Indicate Future [Text] |
Past performance is not indicative of future performance.
|
|
| Line Graph [Table Text Block] |
Table Summary | Short Duration Municipal Fund, Class F Shares | Bloomberg US Municipal Bond Index (USD) | Bloomberg 1 Year Municipal Bond Index (1-2) (USD) |
|---|
Aug/16 | $100,000 | $100,000 | $100,000 |
|---|
Aug/17 | $100,471 | $100,883 | $101,040 |
|---|
Aug/18 | $100,996 | $101,376 | $101,689 |
|---|
Aug/19 | $103,168 | $110,215 | $104,388 |
|---|
Aug/20 | $104,911 | $113,781 | $106,425 |
|---|
Aug/21 | $105,714 | $117,645 | $107,089 |
|---|
Aug/22 | $103,253 | $107,490 | $105,383 |
|---|
Aug/23 | $105,184 | $109,322 | $107,312 |
|---|
Aug/24 | $109,646 | $115,978 | $111,829 |
|---|
Aug/25 | $113,071 | $116,067 | $115,474 |
|---|
Aug/26 | $115,571 | $120,849 | $118,197 |
|---|
|
|
| Average Annual Return [Table Text Block] |
Table SummaryFund/Index Name | 1 Year | 5 Years | 10 Years |
|---|
Short Duration Municipal Fund, Class F Shares | 2.21% | 1.80% | 1.46% |
|---|
Bloomberg US Municipal Bond Index (USD) | 4.12% | 0.54% | 1.91% |
|---|
Bloomberg 1 Year Municipal Bond Index (1-2) (USD) | 2.36% | 1.99% | 1.69% |
|---|
|
|
| No Deduction of Taxes [Text Block] |
The table and graph presented above do not reflect the deduction of taxes a shareholder would pay on Fund distributions or the redemption of Fund Shares.
|
|
| AssetsNet |
$ 713,612,000
|
|
| Holdings Count | Holding |
502
|
|
| Advisory Fees Paid, Amount |
$ 1,458
|
|
| InvestmentCompanyPortfolioTurnover |
28.00%
|
|
| Additional Fund Statistics [Text Block] |
Key Fund Statistics as of August 31, 2026Table Summary | Total Net Assets (000's) | Number of Holdings | Total Advisory Fees Paid (000's) | Portfolio Turnover Rate |
|---|
| $713,612 | 502 | $1,458 | 28% |
|---|
|
|
| Holdings [Text Block] |
Sector WeightingsFootnote Reference*Table SummaryValue | Value |
|---|
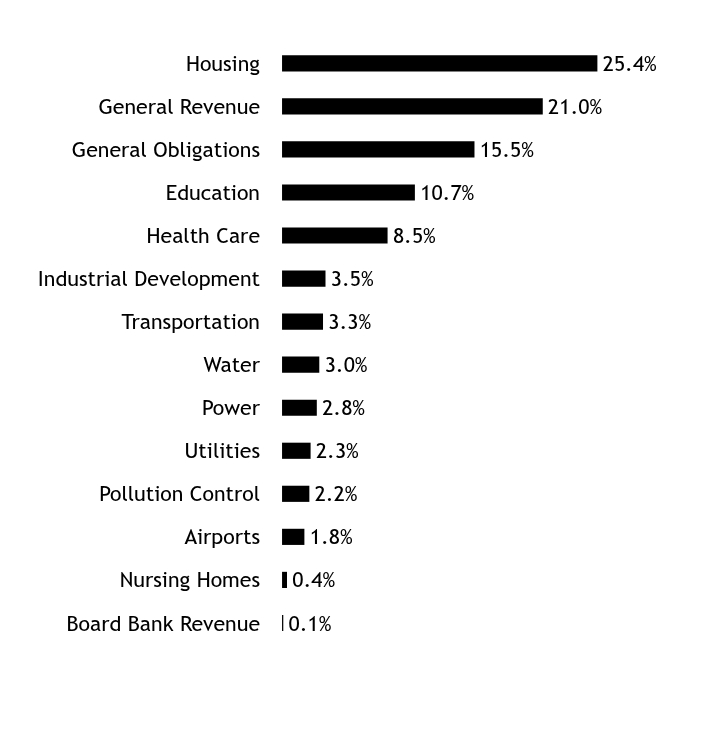
Board Bank Revenue | 0.1% | Nursing Homes | 0.4% | Airports | 1.8% | Pollution Control | 2.2% | Utilities | 2.3% | Power | 2.8% | Water | 3.0% | Transportation | 3.3% | Industrial Development | 3.5% | Health Care | 8.5% | Education | 10.7% | General Obligations | 15.5% | General Revenue | 21.0% | Housing | 25.4% | | Footnote | Description | Footnote* | Percentages are calculated based on total net assets. |
|
|
| Largest Holdings [Text Block] |
Table SummaryHolding Name | Coupon Rate | Maturity Date | Percentage of Total
Net Assets |
|---|
Kentucky Public Energy Authority, Ser A | 5.250%
| 06/01/55
| 2.1% | City of Andover Kansas, Ser A | 3.500%
| 10/01/28
| 1.4% | City of Lawrence Kansas, Ser I | 3.000%
| 05/01/29
| 1.3% | Dallas City, Housing Finance Corporation, Multifamily Housing Revenue, Waterford at Goldmark | 3.300%
| 01/01/43
| 1.2% | Georgia State, Main Street Natural Gas, Ser C | 4.000%
| 03/01/50
| 1.2% | Tennergy | 5.000%
| 10/01/54
| 1.1% | Alachua County, Housing Finance Authority | 3.300%
| 12/01/29
| 1.0% | Salt Verde Financial Corp, Gas Revenue | 5.250%
| 12/01/27
| 1.0% | Board of Cooperative Educational Services of Second Supervisory District | 3.750%
| 06/30/27
| 1.0% | Southeast Alabama, Energy Authority, Ser E | 5.000%
| 10/01/30
| 1.0% | |
|
| Material Fund Change [Text Block] |
There were no material fund changes during the reporting period. |
|
| C000147411 |
|
|
| Shareholder Report [Line Items] |
|
|
| Fund Name |
Short Duration Municipal Fund
|
|
| Class Name |
Class Y
|
|
| Trading Symbol |
SHYMX
|
|
| Annual or Semi-Annual Statement [Text Block] |
Annual Shareholder Report
|
|
| Additional Information [Text Block] |
This annual shareholder report contains important information about Class Y Shares of the Short Duration Municipal Fund (the "Fund") for the period from September 1, 2025 to August 31, 2026. You can find additional information about the Fund at https://www.seic.com/mutual-fund-documentation/prospectuses-and-reports. You can also request this information by contacting us at (610) 676-1000.
|
|
| Additional Information Phone Number |
(610) 676-1000
|
|
| Additional Information Website |
https://www.seic.com/mutual-fund-documentation/prospectuses-and-reports
|
|
| Expenses [Text Block] |
What were the Fund costs for the last year?(based on a hypothetical $10,000 investment) Table SummaryFund Name | Costs of a $10,000 investment | Costs paid as a percentage of a $10,000 investment |
|---|
Short Duration Municipal Fund, Class Y Shares | $38 | 0.38% |
|---|
|
|
| Expenses Paid, Amount |
$ 38
|
|
| Expense Ratio, Percent |
0.38%
|
|
| Factors Affecting Performance [Text Block] |
How did the Fund perform in the last year?Class Y Shares of the Fund modestly outperformed its benchmark, the Bloomberg 1-Year Municipal Bond Index, for the 12-month period ending August 31, 2026. The target range on the federal funds rate began the reporting period at 4.25%-4.50%. The Federal Reserve (Fed) then cut its benchmark interest rate by 25 basis points (0.25%) at its September 2025 meeting. The Fed subsequently reduced the rate by 25 basis points at both its October and December 2025 meetings, bringing the target range to 3.50%-3.75%. The Fed maintained the range for the first eight months of 2026. The ongoing conflict between the U.S. and Iran, which began on February 28, 2026, has contributed to renewed inflationary pressure, while the labor market has remained on solid ground. Municipal market performance has remained resilient thus far in 2026, supported by strong fund inflows and solid issuer fundamentals despite record issuance and a higher interest-rate environment. Additionally, lower-rated and high-yield municipal sectors have led performance this year, while investment-grade municipals have generated modest positive returns amid upward pressure on long-term interest rates. Security selection in the housing sector weighed on Fund performance over the reporting period. Fund performance was enhanced by security selection in revenue sectors such as prepaid gas and transportation, while an underweight allocation to general obligation (GO) bonds had a positive impact as the sector underperformed the overall municipal market. At the sub-adviser level, both Neuberger Berman Investment Advisers LLC and Allspring Global Investments LLC outperformed the benchmark for the reporting period. Neuberger Berman Investment Advisers LLC benefited from an overweight to cash-collateralized housing bonds, which property developers use to secure favorable tax credits for affordable housing projects. Allspring Global Investments LLC’s performance was bolstered by security selection in healthcare and transportation bonds. |
|
| Performance Past Does Not Indicate Future [Text] |
Past performance is not indicative of future performance.
|
|
| Line Graph [Table Text Block] |
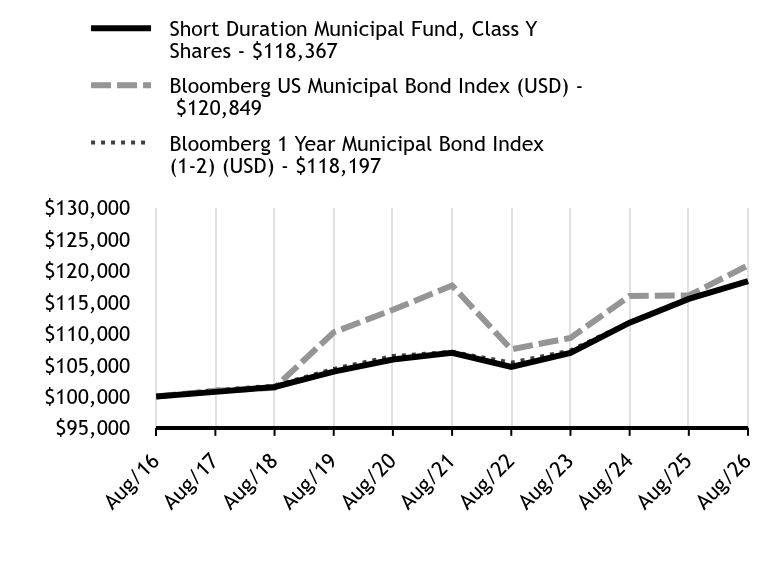
Table Summary | Short Duration Municipal Fund, Class Y Shares | Bloomberg US Municipal Bond Index (USD) | Bloomberg 1 Year Municipal Bond Index (1-2) (USD) |
|---|
Aug/16 | $100,000 | $100,000 | $100,000 |
|---|
Aug/17 | $100,724 | $100,883 | $101,040 |
|---|
Aug/18 | $101,504 | $101,376 | $101,689 |
|---|
Aug/19 | $103,947 | $110,215 | $104,388 |
|---|
Aug/20 | $105,873 | $113,781 | $106,425 |
|---|
Aug/21 | $106,946 | $117,645 | $107,089 |
|---|
Aug/22 | $104,700 | $107,490 | $105,383 |
|---|
Aug/23 | $106,925 | $109,322 | $107,312 |
|---|
Aug/24 | $111,740 | $115,978 | $111,829 |
|---|
Aug/25 | $115,519 | $116,067 | $115,474 |
|---|
Aug/26 | $118,367 | $120,849 | $118,197 |
|---|
|
|
| Average Annual Return [Table Text Block] |
Table SummaryFund/Index Name | 1 Year | 5 Years | 10 Years |
|---|
Short Duration Municipal Fund, Class Y Shares | 2.47% | 2.05% | 1.70% |
|---|
Bloomberg US Municipal Bond Index (USD) | 4.12% | 0.54% | 1.91% |
|---|
Bloomberg 1 Year Municipal Bond Index (1-2) (USD) | 2.36% | 1.99% | 1.69% |
|---|
|
|
| No Deduction of Taxes [Text Block] |
The table and graph presented above do not reflect the deduction of taxes a shareholder would pay on Fund distributions or the redemption of Fund Shares.
|
|
| AssetsNet |
$ 713,612,000
|
|
| Holdings Count | Holding |
502
|
|
| Advisory Fees Paid, Amount |
$ 1,458
|
|
| InvestmentCompanyPortfolioTurnover |
28.00%
|
|
| Additional Fund Statistics [Text Block] |
Key Fund Statistics as of August 31, 2026Table Summary | Total Net Assets (000's) | Number of Holdings | Total Advisory Fees Paid (000's) | Portfolio Turnover Rate |
|---|
| $713,612 | 502 | $1,458 | 28% |
|---|
|
|
| Holdings [Text Block] |
Sector WeightingsFootnote Reference*Table SummaryValue | Value |
|---|
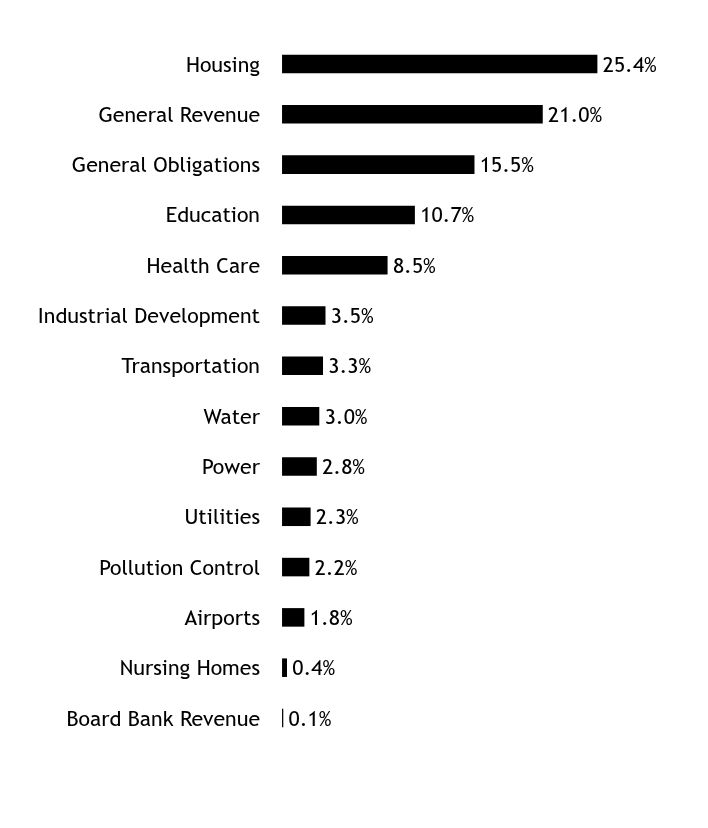
Board Bank Revenue | 0.1% | Nursing Homes | 0.4% | Airports | 1.8% | Pollution Control | 2.2% | Utilities | 2.3% | Power | 2.8% | Water | 3.0% | Transportation | 3.3% | Industrial Development | 3.5% | Health Care | 8.5% | Education | 10.7% | General Obligations | 15.5% | General Revenue | 21.0% | Housing | 25.4% | | Footnote | Description | Footnote* | Percentages are calculated based on total net assets. |
|
|
| Largest Holdings [Text Block] |
Table SummaryHolding Name | Coupon Rate | Maturity Date | Percentage of Total
Net Assets |
|---|
Kentucky Public Energy Authority, Ser A | 5.250%
| 06/01/55
| 2.1% | City of Andover Kansas, Ser A | 3.500%
| 10/01/28
| 1.4% | City of Lawrence Kansas, Ser I | 3.000%
| 05/01/29
| 1.3% | Dallas City, Housing Finance Corporation, Multifamily Housing Revenue, Waterford at Goldmark | 3.300%
| 01/01/43
| 1.2% | Georgia State, Main Street Natural Gas, Ser C | 4.000%
| 03/01/50
| 1.2% | Tennergy | 5.000%
| 10/01/54
| 1.1% | Alachua County, Housing Finance Authority | 3.300%
| 12/01/29
| 1.0% | Salt Verde Financial Corp, Gas Revenue | 5.250%
| 12/01/27
| 1.0% | Board of Cooperative Educational Services of Second Supervisory District | 3.750%
| 06/30/27
| 1.0% | Southeast Alabama, Energy Authority, Ser E | 5.000%
| 10/01/30
| 1.0% | |
|
| Material Fund Change [Text Block] |
There were no material fund changes during the reporting period. |
|
| C000017631 |
|
|
| Shareholder Report [Line Items] |
|
|
| Fund Name |
California Municipal Bond Fund
|
|
| Class Name |
Class F
|
|
| Trading Symbol |
SBDAX
|
|
| Annual or Semi-Annual Statement [Text Block] |
Annual Shareholder Report
|
|
| Additional Information [Text Block] |
This annual shareholder report contains important information about Class F Shares of the California Municipal Bond Fund (the "Fund") for the period from September 1, 2025 to August 31, 2026. You can find additional information about the Fund at https://www.seic.com/mutual-fund-documentation/prospectuses-and-reports. You can also request this information by contacting us at (610) 676-1000.
|
|
| Additional Information Phone Number |
(610) 676-1000
|
|
| Additional Information Website |
https://www.seic.com/mutual-fund-documentation/prospectuses-and-reports
|
|
| Expenses [Text Block] |
What were the Fund costs for the last year?(based on a hypothetical $10,000 investment) Table SummaryFund Name | Costs of a $10,000 investment | Costs paid as a percentage of a $10,000 investment |
|---|
California Municipal Bond Fund, Class F Shares | $61 | 0.60%Footnote Reference(1) |
|---|
| Footnote | Description | Footnote(1) | The expense ratio includes a proxy fee expense. Had this expense been excluded the ratio would have been 0.59%. |
|
|
| Expenses Paid, Amount |
$ 61
|
|
| Expense Ratio, Percent |
0.60%
|
[1] |
| Factors Affecting Performance [Text Block] |
How did the Fund perform in the last year?Class F shares of the Fund outperformed its benchmark, the Bloomberg California Intermediate Municipal Index (USD), for the 12-month period ending August 31, 2026. The target range on the federal funds rate began the reporting period at 4.25%-4.50%. The Federal Reserve (Fed) then cut its benchmark interest rate by 25 basis points (0.25%) at its September 2025 meeting. The Fed subsequently reduced the rate by 25 basis points at both its October and December 2025 meetings, bringing the target range to 3.50%-3.75%. The Fed maintained the range for the first eight months of 2026. The ongoing conflict between the U.S. and Iran, which began on February 28, 2026, has contributed to renewed inflationary pressure, while the labor market has remained on solid ground. Municipal market performance has remained resilient thus far in 2026, supported by strong fund inflows and solid issuer fundamentals despite record issuance and a higher interest-rate environment. Additionally, lower-rated and high-yield municipal sectors have led performance this year, while investment-grade municipals have generated modest positive returns amid upward pressure on long-term interest rates. Insight North America LLC is the sub-adviser for the Fund. Security selection was the largest driver of the Fund’s relative performance over the reporting period. Positions in the healthcare and education sectors contributed to performance, while security selection within California general obligation bonds was a detractor. As California is one of the largest economies in the world, the state’s general obligation (GO) bonds are currently rated AA/AA2/AA- by Fitch Ratings, Moody’s Corp., and S&P Global Ratings, respectively, reflecting a strong credit profile. The state’s reserves of nearly $20 billion provide protection from a credit standpoint, in addition to numerous spending cuts to which the state government has committed. While wildfires in January 2025 were devastating, the state of California has significant resources to help navigate the recovery. |
|
| Performance Past Does Not Indicate Future [Text] |
Past performance is not indicative of future performance.
|
|
| Line Graph [Table Text Block] |
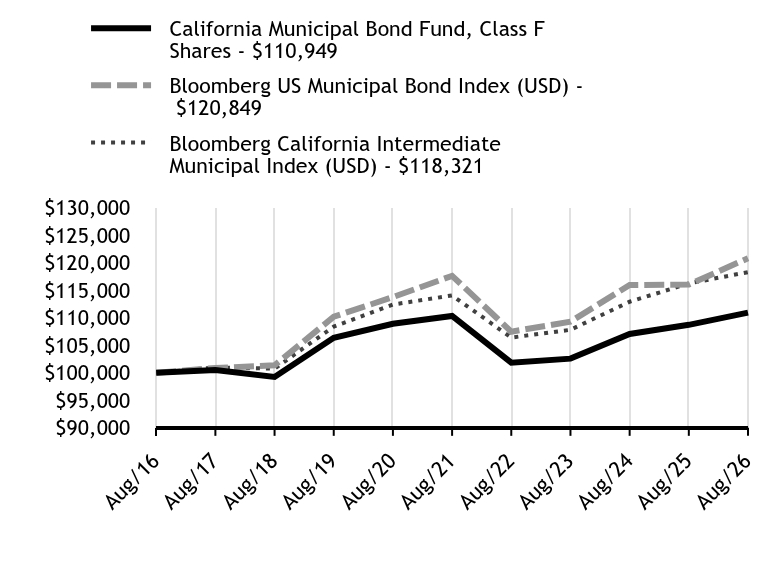
Table Summary | California Municipal Bond Fund, Class F Shares | Bloomberg US Municipal Bond Index (USD) | Bloomberg California Intermediate Municipal Index (USD) |
|---|
Aug/16 | $100,000 | $100,000 | $100,000 |
|---|
Aug/17 | $100,537 | $100,883 | $100,989 |
|---|
Aug/18 | $99,263 | $101,376 | $100,760 |
|---|
Aug/19 | $106,373 | $110,215 | $108,412 |
|---|
Aug/20 | $108,919 | $113,781 | $112,430 |
|---|
Aug/21 | $110,346 | $117,645 | $114,080 |
|---|
Aug/22 | $101,844 | $107,490 | $106,419 |
|---|
Aug/23 | $102,589 | $109,322 | $107,834 |
|---|
Aug/24 | $107,075 | $115,978 | $112,936 |
|---|
Aug/25 | $108,737 | $116,067 | $116,270 |
|---|
Aug/26 | $110,949 | $120,849 | $118,321 |
|---|
|
|
| Average Annual Return [Table Text Block] |
Table SummaryFund/Index Name | 1 Year | 5 Years | 10 Years |
|---|
California Municipal Bond Fund, Class F Shares | 2.04% | 0.11% | 1.04% |
|---|
Bloomberg US Municipal Bond Index (USD) | 4.12% | 0.54% | 1.91% |
|---|
Bloomberg California Intermediate Municipal Index (USD) | 1.76% | 0.73% | 1.70% |
|---|
|
|
| No Deduction of Taxes [Text Block] |
The table and graph presented above do not reflect the deduction of taxes a shareholder would pay on Fund distributions or the redemption of Fund Shares.
|
|
| AssetsNet |
$ 217,102,000
|
|
| Holdings Count | Holding |
137
|
|
| Advisory Fees Paid, Amount |
$ 536
|
|
| InvestmentCompanyPortfolioTurnover |
22.00%
|
|
| Additional Fund Statistics [Text Block] |
Key Fund Statistics as of August 31, 2026Table Summary | Total Net Assets (000's) | Number of Holdings | Total Advisory Fees Paid (000's) | Portfolio Turnover Rate |
|---|
| $217,102 | 137 | $536 | 22% |
|---|
|
|
| Holdings [Text Block] |
Asset/Sector WeightingsFootnote Reference*Table SummaryValue | Value |
|---|
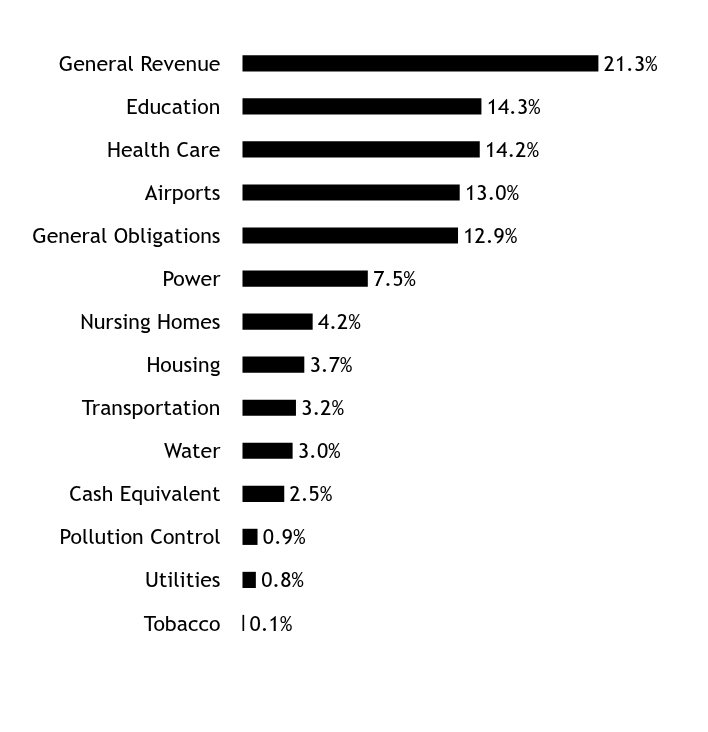
Tobacco | 0.1% | Utilities | 0.8% | Pollution Control | 0.9% | Cash Equivalent | 2.5% | Water | 3.0% | Transportation | 3.2% | Housing | 3.7% | Nursing Homes | 4.2% | Power | 7.5% | General Obligations | 12.9% | Airports | 13.0% | Health Care | 14.2% | Education | 14.3% | General Revenue | 21.3% | | Footnote | Description | Footnote* | Percentages are calculated based on total net assets. |
|
|
| Largest Holdings [Text Block] |
Table SummaryHolding Name | Coupon Rate | Maturity Date | Percentage of Total
Net AssetsFootnote Reference(A) |
|---|
Los Angeles, Department of Water & Power, Water System Revenue, Ser E | 5.000%
| 07/01/35
| 3.1% | California State | 5.000%
| 10/01/35
| 2.5% | California State, Community Choice Financing Authority, Clean Energy Project, Ser B-1 | 4.000%
| 02/01/52
| 2.3% | California State | 5.000%
| 11/01/31
| 2.2% | Burbank-Glendale-Pasadena Airport Authority Brick Campaign, Ser B, AMT | 5.000%
| 07/01/32
| 2.1% | Los Angeles, Department of Airports, Ser B, AMT | 5.000%
| 05/15/33
| 2.0% | California State, Community Choice Financing Authority, Clean Energy Project | 5.000%
| 01/01/55
| 2.0% | California State, Health Facilities Financing Authority, Kaiser Permanente Project, Ser 2006-C | 5.000%
| 06/01/41
| 2.0% | California State, Statewide Communities Development Authority, Kaiser Permanente Project, Ser 2004-M | 5.000%
| 04/01/38
| 2.0% | California State | 4.000%
| 08/01/34
| 1.9% | | Footnote | Description | Footnote(A) | Cash Equivalents are not shown in the top ten holdings. |
|
|
| Material Fund Change [Text Block] |
There were no material fund changes during the reporting period. |
|
| C000147416 |
|
|
| Shareholder Report [Line Items] |
|
|
| Fund Name |
California Municipal Bond Fund
|
|
| Class Name |
Class Y
|
|
| Trading Symbol |
SCYYX
|
|
| Annual or Semi-Annual Statement [Text Block] |
Annual Shareholder Report
|
|
| Additional Information [Text Block] |
This annual shareholder report contains important information about Class Y Shares of the California Municipal Bond Fund (the "Fund") for the period from September 1, 2025 to August 31, 2026. You can find additional information about the Fund at https://www.seic.com/mutual-fund-documentation/prospectuses-and-reports. You can also request this information by contacting us at (610) 676-1000.
|
|
| Additional Information Phone Number |
(610) 676-1000
|
|
| Additional Information Website |
https://www.seic.com/mutual-fund-documentation/prospectuses-and-reports
|
|
| Expenses [Text Block] |
What were the Fund costs for the last year?(based on a hypothetical $10,000 investment) Table SummaryFund Name | Costs of a $10,000 investment | Costs paid as a percentage of a $10,000 investment |
|---|
California Municipal Bond Fund, Class Y Shares | $45 | 0.45%Footnote Reference(1) |
|---|
| Footnote | Description | Footnote(1) | The expense ratio includes a proxy fee expense. Had this expense been excluded the ratio would have been 0.44%. |
|
|
| Expenses Paid, Amount |
$ 45
|
|
| Expense Ratio, Percent |
0.45%
|
[2] |
| Factors Affecting Performance [Text Block] |
How did the Fund perform in the last year?Class Y shares of the Fund outperformed its benchmark, the Bloomberg California Intermediate Municipal Index (USD), for the 12-month period ending August 31, 2026. The target range on the federal funds rate began the reporting period at 4.25%-4.50%. The Federal Reserve (Fed) then cut its benchmark interest rate by 25 basis points (0.25%) at its September 2025 meeting. The Fed subsequently reduced the rate by 25 basis points at both its October and December 2025 meetings, bringing the target range to 3.50%-3.75%. The Fed maintained the range for the first eight months of 2026. The ongoing conflict between the U.S. and Iran, which began on February 28, 2026, has contributed to renewed inflationary pressure, while the labor market has remained on solid ground. Municipal market performance has remained resilient thus far in 2026, supported by strong fund inflows and solid issuer fundamentals despite record issuance and a higher interest-rate environment. Additionally, lower-rated and high-yield municipal sectors have led performance this year, while investment-grade municipals have generated modest positive returns amid upward pressure on long-term interest rates. Insight North America LLC is the sub-adviser for the Fund. Security selection was the largest driver of the Fund’s relative performance over the reporting period. Positions in the healthcare and education sectors contributed to performance, while security selection within California general obligation bonds was a detractor. As California is one of the largest economies in the world, the state’s general obligation (GO) bonds are currently rated AA/AA2/AA- by Fitch Ratings, Moody’s Corp., and S&P Global Ratings, respectively, reflecting a strong credit profile. The state’s reserves of nearly $20 billion provide protection from a credit standpoint, in addition to numerous spending cuts to which the state government has committed. While wildfires in January 2025 were devastating, the state of California has significant resources to help navigate the recovery. |
|
| Performance Past Does Not Indicate Future [Text] |
Past performance is not indicative of future performance.
|
|
| Line Graph [Table Text Block] |
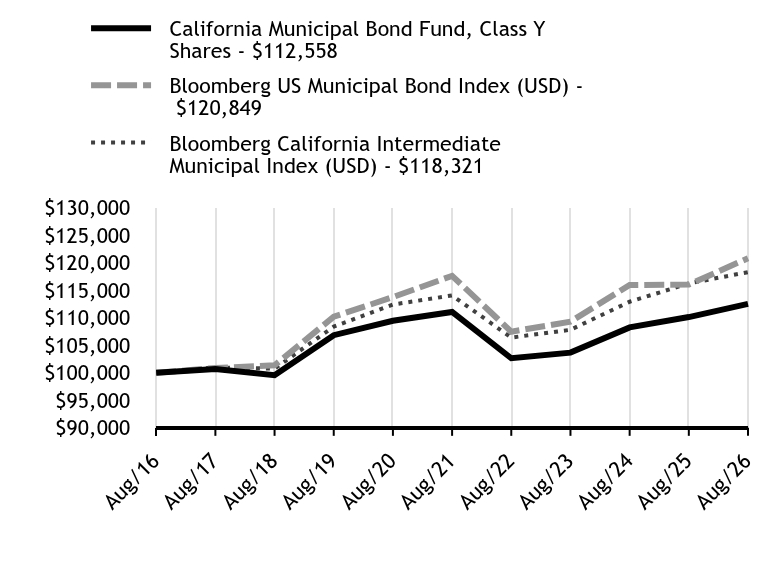
Table Summary | California Municipal Bond Fund, Class Y Shares | Bloomberg US Municipal Bond Index (USD) | Bloomberg California Intermediate Municipal Index (USD) |
|---|
Aug/16 | $100,000 | $100,000 | $100,000 |
|---|
Aug/17 | $100,688 | $100,883 | $100,989 |
|---|
Aug/18 | $99,561 | $101,376 | $100,760 |
|---|
Aug/19 | $106,853 | $110,215 | $108,412 |
|---|
Aug/20 | $109,475 | $113,781 | $112,430 |
|---|
Aug/21 | $111,071 | $117,645 | $114,080 |
|---|
Aug/22 | $102,655 | $107,490 | $106,419 |
|---|
Aug/23 | $103,679 | $109,322 | $107,834 |
|---|
Aug/24 | $108,267 | $115,978 | $112,936 |
|---|
Aug/25 | $110,150 | $116,067 | $116,270 |
|---|
Aug/26 | $112,558 | $120,849 | $118,321 |
|---|
|
|
| Average Annual Return [Table Text Block] |
Table SummaryFund/Index Name | 1 Year | 5 Years | 10 Years |
|---|
California Municipal Bond Fund, Class Y Shares | 2.19% | 0.27% | 1.19% |
|---|
Bloomberg US Municipal Bond Index (USD) | 4.12% | 0.54% | 1.91% |
|---|
Bloomberg California Intermediate Municipal Index (USD) | 1.76% | 0.73% | 1.70% |
|---|
|
|
| No Deduction of Taxes [Text Block] |
The table and graph presented above do not reflect the deduction of taxes a shareholder would pay on Fund distributions or the redemption of Fund Shares.
|
|
| AssetsNet |
$ 217,102,000
|
|
| Holdings Count | Holding |
137
|
|
| Advisory Fees Paid, Amount |
$ 536
|
|
| InvestmentCompanyPortfolioTurnover |
22.00%
|
|
| Additional Fund Statistics [Text Block] |
Key Fund Statistics as of August 31, 2026Table Summary | Total Net Assets (000's) | Number of Holdings | Total Advisory Fees Paid (000's) | Portfolio Turnover Rate |
|---|
| $217,102 | 137 | $536 | 22% |
|---|
|
|
| Holdings [Text Block] |
Asset/Sector WeightingsFootnote Reference*Table SummaryValue | Value |
|---|
Tobacco | 0.1% | Utilities | 0.8% | Pollution Control | 0.9% | Cash Equivalent | 2.5% | Water | 3.0% | Transportation | 3.2% | Housing | 3.7% | Nursing Homes | 4.2% | Power | 7.5% | General Obligations | 12.9% | Airports | 13.0% | Health Care | 14.2% | Education | 14.3% | General Revenue | 21.3% | | Footnote | Description | Footnote* | Percentages are calculated based on total net assets. |
|
|
| Largest Holdings [Text Block] |
Table SummaryHolding Name | Coupon Rate | Maturity Date | Percentage of Total
Net AssetsFootnote Reference(A) |
|---|
Los Angeles, Department of Water & Power, Water System Revenue, Ser E | 5.000%
| 07/01/35
| 3.1% | California State | 5.000%
| 10/01/35
| 2.5% | California State, Community Choice Financing Authority, Clean Energy Project, Ser B-1 | 4.000%
| 02/01/52
| 2.3% | California State | 5.000%
| 11/01/31
| 2.2% | Burbank-Glendale-Pasadena Airport Authority Brick Campaign, Ser B, AMT | 5.000%
| 07/01/32
| 2.1% | Los Angeles, Department of Airports, Ser B, AMT | 5.000%
| 05/15/33
| 2.0% | California State, Community Choice Financing Authority, Clean Energy Project | 5.000%
| 01/01/55
| 2.0% | California State, Health Facilities Financing Authority, Kaiser Permanente Project, Ser 2006-C | 5.000%
| 06/01/41
| 2.0% | California State, Statewide Communities Development Authority, Kaiser Permanente Project, Ser 2004-M | 5.000%
| 04/01/38
| 2.0% | California State | 4.000%
| 08/01/34
| 1.9% | | Footnote | Description | Footnote(A) | Cash Equivalents are not shown in the top ten holdings. |
|
|
| Material Fund Change [Text Block] |
There were no material fund changes during the reporting period. |
|
| C000017627 |
|
|
| Shareholder Report [Line Items] |
|
|
| Fund Name |
Massachusetts Municipal Bond Fund
|
|
| Class Name |
Class F
|
|
| Trading Symbol |
SMAAX
|
|
| Annual or Semi-Annual Statement [Text Block] |
Annual Shareholder Report
|
|
| Additional Information [Text Block] |
This annual shareholder report contains important information about Class F Shares of the Massachusetts Municipal Bond Fund (the "Fund") for the period from September 1, 2025 to August 31, 2026. You can find additional information about the Fund at https://www.seic.com/mutual-fund-documentation/prospectuses-and-reports. You can also request this information by contacting us at (610) 676-1000.
|
|
| Additional Information Phone Number |
(610) 676-1000
|
|
| Additional Information Website |
https://www.seic.com/mutual-fund-documentation/prospectuses-and-reports
|
|
| Expenses [Text Block] |
What were the Fund costs for the last year?(based on a hypothetical $10,000 investment) Table SummaryFund Name | Costs of a $10,000 investment | Costs paid as a percentage of a $10,000 investment |
|---|
Massachusetts Municipal Bond Fund, Class F Shares | $62 | 0.61% |
|---|
|
|
| Expenses Paid, Amount |
$ 62
|
|
| Expense Ratio, Percent |
0.61%
|
|
| Factors Affecting Performance [Text Block] |
How did the Fund perform in the last year?Class F Shares of the Fund performed in line with its benchmark, the Bloomberg Massachusetts Intermediate Municipal Bond Index, for the 12-month period ending August 31, 2026. The target range on the federal funds rate began the reporting period at 4.25%-4.50%. The Federal Reserve (Fed) then cut its benchmark interest rate by 25 basis points (0.25%) at its September 2025 meeting. The Fed subsequently reduced the rate by 25 basis points at both its October and December 2025 meetings, bringing the target range to 3.50%-3.75%. The Fed maintained the range for the first eight months of 2026. The ongoing conflict between the U.S. and Iran, which began on February 28, 2026, has contributed to renewed inflationary pressure, while the labor market has remained on solid ground. Municipal market performance has remained resilient thus far in 2026, supported by strong fund inflows and solid issuer fundamentals despite record issuance and a higher interest-rate environment. Additionally, lower-rated and high-yield municipal sectors have led performance this year, while investment-grade municipals have generated modest positive returns amid upward pressure on long-term interest rates. Insight North America LLC is the sub-adviser for the Fund. An overweight to utilities and security selection in transportation detracted from Fund performance for the period. Fund performance benefited from security selection in the education and healthcare sectors. |
|
| Performance Past Does Not Indicate Future [Text] |
Past performance is not indicative of future performance.
|
|
| Line Graph [Table Text Block] |
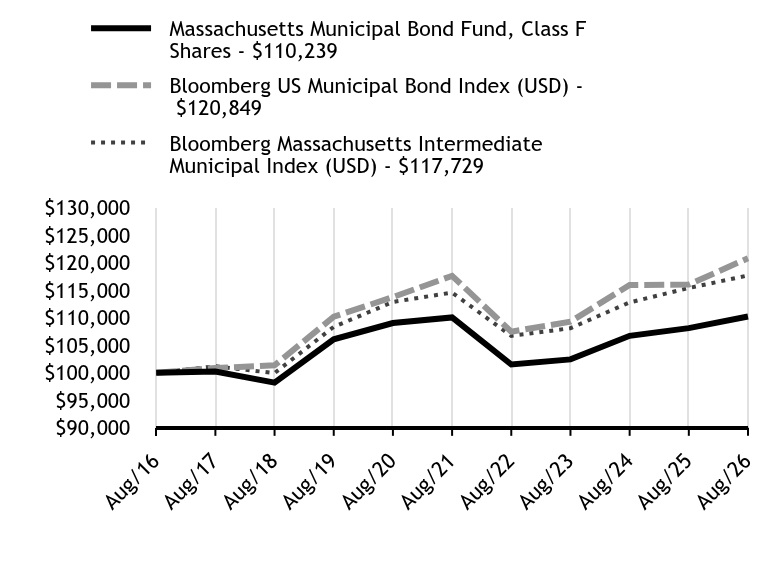
Table Summary | Massachusetts Municipal Bond Fund, Class F Shares | Bloomberg US Municipal Bond Index (USD) | Bloomberg Massachusetts Intermediate Municipal Index (USD) |
|---|
Aug/16 | $100,000 | $100,000 | $100,000 |
|---|
Aug/17 | $100,226 | $100,883 | $101,191 |
|---|
Aug/18 | $98,214 | $101,376 | $99,956 |
|---|
Aug/19 | $106,098 | $110,215 | $108,371 |
|---|
Aug/20 | $109,061 | $113,781 | $112,896 |
|---|
Aug/21 | $110,079 | $117,645 | $114,608 |
|---|
Aug/22 | $101,516 | $107,490 | $106,723 |
|---|
Aug/23 | $102,451 | $109,322 | $108,125 |
|---|
Aug/24 | $106,734 | $115,978 | $112,816 |
|---|
Aug/25 | $108,138 | $116,067 | $115,433 |
|---|
Aug/26 | $110,239 | $120,849 | $117,729 |
|---|
|
|
| Average Annual Return [Table Text Block] |
Table SummaryFund/Index Name | 1 Year | 5 Years | 10 Years |
|---|
Massachusetts Municipal Bond Fund, Class F Shares | 1.94% | 0.03% | 0.98% |
|---|
Bloomberg US Municipal Bond Index (USD) | 4.12% | 0.54% | 1.91% |
|---|
Bloomberg Massachusetts Intermediate Municipal Index (USD) | 1.99% | 0.54% | 1.65% |
|---|
|
|
| No Deduction of Taxes [Text Block] |
The table and graph presented above do not reflect the deduction of taxes a shareholder would pay on Fund distributions or the redemption of Fund Shares.
|
|
| AssetsNet |
$ 59,591,000
|
|
| Holdings Count | Holding |
73
|
|
| Advisory Fees Paid, Amount |
$ 158
|
|
| InvestmentCompanyPortfolioTurnover |
21.00%
|
|
| Additional Fund Statistics [Text Block] |
Key Fund Statistics as of August 31, 2026Table Summary | Total Net Assets (000's) | Number of Holdings | Total Advisory Fees Paid (000's) | Portfolio Turnover Rate |
|---|
| $59,591 | 73 | $158 | 21% |
|---|
|
|
| Holdings [Text Block] |
Asset/Sector WeightingsFootnote Reference*Table SummaryValue | Value |
|---|
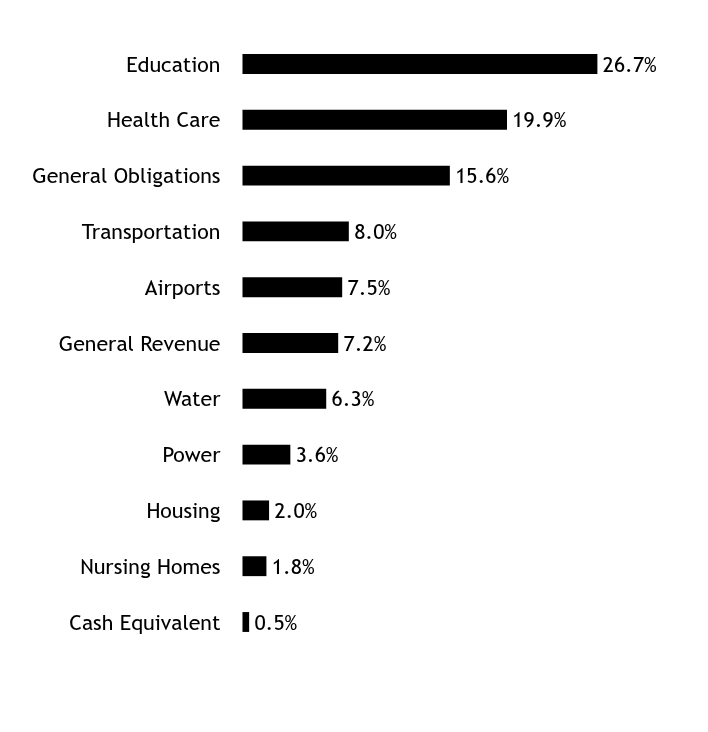
Cash Equivalent | 0.5% | Nursing Homes | 1.8% | Housing | 2.0% | Power | 3.6% | Water | 6.3% | General Revenue | 7.2% | Airports | 7.5% | Transportation | 8.0% | General Obligations | 15.6% | Health Care | 19.9% | Education | 26.7% | | Footnote | Description | Footnote* | Percentages are calculated based on total net assets. |
|
|
| Largest Holdings [Text Block] |
Table SummaryHolding Name | Coupon Rate | Maturity Date | Percentage of Total
Net AssetsFootnote Reference(A) |
|---|
Massachusetts State, Development Finance Agency, Children's Hospital, Ser T | 5.000%
| 03/01/34
| 5.6% | Massachusetts State, Ser C | 5.000%
| 10/01/33
| 4.6% | Massachusetts Development Finance Agency | 5.000%
| 12/01/38
| 3.3% | Massachusetts Bay, Transportation Authority, Ser A | 5.000%
| 07/01/36
| 2.8% | Boston, Ser A | 4.000%
| 11/01/31
| 2.6% | Massachusetts State, Development Finance Agency, Harvard University, Ser B | 4.000%
| 02/15/36
| 2.2% | Massachusetts State, Development Finance Agency, Babson College | 5.000%
| 10/01/33
| 2.1% | Massachusetts State, Development Finance Agency, Amherst College | 5.000%
| 11/01/55
| 1.9% | Massachusetts State, Development Finance Agency, Trustees of Deerfield Academy | 5.000%
| 10/01/32
| 1.9% | Massachusetts Water Resources Authority, Ser C | 5.000%
| 08/01/38
| 1.9% | | Footnote | Description | Footnote(A) | Cash Equivalents are not shown in the top ten holdings. |
|
|
| Material Fund Change [Text Block] |
There were no material fund changes during the reporting period. |
|
| C000147413 |
|
|
| Shareholder Report [Line Items] |
|
|
| Fund Name |
Massachusetts Municipal Bond Fund
|
|
| Class Name |
Class Y
|
|
| Trading Symbol |
SMSYX
|
|
| Annual or Semi-Annual Statement [Text Block] |
Annual Shareholder Report
|
|
| Additional Information [Text Block] |
This annual shareholder report contains important information about Class Y Shares of the Massachusetts Municipal Bond Fund (the "Fund") for the period from September 1, 2025 to August 31, 2026. You can find additional information about the Fund at https://www.seic.com/mutual-fund-documentation/prospectuses-and-reports. You can also request this information by contacting us at (610) 676-1000.
|
|
| Additional Information Phone Number |
(610) 676-1000
|
|
| Additional Information Website |
https://www.seic.com/mutual-fund-documentation/prospectuses-and-reports
|
|
| Expenses [Text Block] |
What were the Fund costs for the last year?(based on a hypothetical $10,000 investment) Table SummaryFund Name | Costs of a $10,000 investment | Costs paid as a percentage of a $10,000 investment |
|---|
Massachusetts Municipal Bond Fund, Class Y Shares | $46 | 0.46% |
|---|
|
|
| Expenses Paid, Amount |
$ 46
|
|
| Expense Ratio, Percent |
0.46%
|
|
| Factors Affecting Performance [Text Block] |
How did the Fund perform in the last year?Class Y Shares of the Fund performed in line with its benchmark, the Bloomberg Massachusetts Intermediate Municipal Bond Index, for the 12-month period ending August 31, 2026. The target range on the federal funds rate began the reporting period at 4.25%-4.50%. The Federal Reserve (Fed) then cut its benchmark interest rate by 25 basis points (0.25%) at its September 2025 meeting. The Fed subsequently reduced the rate by 25 basis points at both its October and December 2025 meetings, bringing the target range to 3.50%-3.75%. The Fed maintained the range for the first eight months of 2026. The ongoing conflict between the U.S. and Iran, which began on February 28, 2026, has contributed to renewed inflationary pressure, while the labor market has remained on solid ground. Municipal market performance has remained resilient thus far in 2026, supported by strong fund inflows and solid issuer fundamentals despite record issuance and a higher interest-rate environment. Additionally, lower-rated and high-yield municipal sectors have led performance this year, while investment-grade municipals have generated modest positive returns amid upward pressure on long-term interest rates. Insight North America LLC is the sub-adviser for the Fund. An overweight to utilities and security selection in transportation detracted from Fund performance for the period. Fund performance benefited from security selection in the education and healthcare sectors. |
|
| Performance Past Does Not Indicate Future [Text] |
Past performance is not indicative of future performance.
|
|
| Line Graph [Table Text Block] |
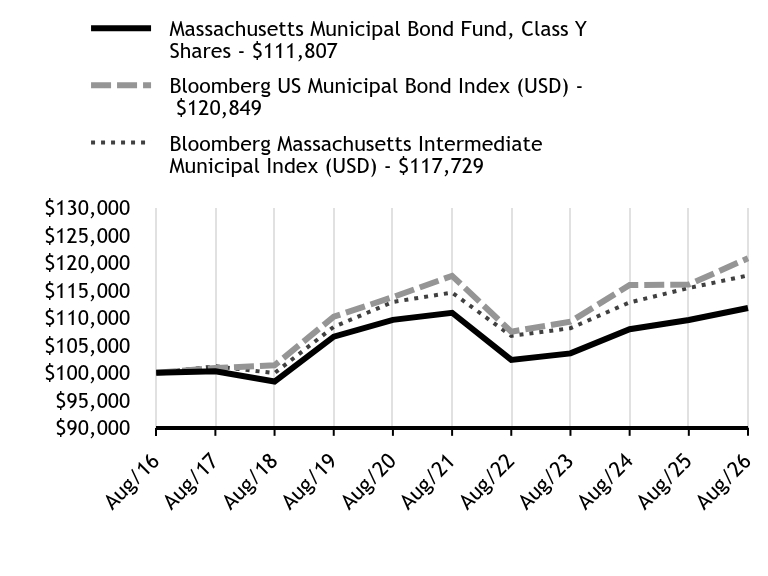
Table Summary | Massachusetts Municipal Bond Fund, Class Y Shares | Bloomberg US Municipal Bond Index (USD) | Bloomberg Massachusetts Intermediate Municipal Index (USD) |
|---|
Aug/16 | $100,000 | $100,000 | $100,000 |
|---|
Aug/17 | $100,291 | $100,883 | $101,191 |
|---|
Aug/18 | $98,422 | $101,376 | $99,956 |
|---|
Aug/19 | $106,590 | $110,215 | $108,371 |
|---|
Aug/20 | $109,637 | $113,781 | $112,896 |
|---|
Aug/21 | $110,930 | $117,645 | $114,608 |
|---|
Aug/22 | $102,344 | $107,490 | $106,723 |
|---|
Aug/23 | $103,545 | $109,322 | $108,125 |
|---|
Aug/24 | $107,932 | $115,978 | $112,816 |
|---|
Aug/25 | $109,622 | $116,067 | $115,433 |
|---|
Aug/26 | $111,807 | $120,849 | $117,729 |
|---|
|
|
| Average Annual Return [Table Text Block] |
Table SummaryFund/Index Name | 1 Year | 5 Years | 10 Years |
|---|
Massachusetts Municipal Bond Fund, Class Y Shares | 1.99% | 0.16% | 1.12% |
|---|
Bloomberg US Municipal Bond Index (USD) | 4.12% | 0.54% | 1.91% |
|---|
Bloomberg Massachusetts Intermediate Municipal Index (USD) | 1.99% | 0.54% | 1.65% |
|---|
|
|
| No Deduction of Taxes [Text Block] |
The table and graph presented above do not reflect the deduction of taxes a shareholder would pay on Fund distributions or the redemption of Fund Shares.
|
|
| AssetsNet |
$ 59,591,000
|
|
| Holdings Count | Holding |
73
|
|
| Advisory Fees Paid, Amount |
$ 158
|
|
| InvestmentCompanyPortfolioTurnover |
21.00%
|
|
| Additional Fund Statistics [Text Block] |
Key Fund Statistics as of August 31, 2026Table Summary | Total Net Assets (000's) | Number of Holdings | Total Advisory Fees Paid (000's) | Portfolio Turnover Rate |
|---|
| $59,591 | 73 | $158 | 21% |
|---|
|
|
| Holdings [Text Block] |
Asset/Sector WeightingsFootnote Reference*Table SummaryValue | Value |
|---|
Cash Equivalent | 0.5% | Nursing Homes | 1.8% | Housing | 2.0% | Power | 3.6% | Water | 6.3% | General Revenue | 7.2% | Airports | 7.5% | Transportation | 8.0% | General Obligations | 15.6% | Health Care | 19.9% | Education | 26.7% | | Footnote | Description | Footnote* | Percentages are calculated based on total net assets. |
|
|
| Largest Holdings [Text Block] |
Table SummaryHolding Name | Coupon Rate | Maturity Date | Percentage of Total
Net AssetsFootnote Reference(A) |
|---|
Massachusetts State, Development Finance Agency, Children's Hospital, Ser T | 5.000%
| 03/01/34
| 5.6% | Massachusetts State, Ser C | 5.000%
| 10/01/33
| 4.6% | Massachusetts Development Finance Agency | 5.000%
| 12/01/38
| 3.3% | Massachusetts Bay, Transportation Authority, Ser A | 5.000%
| 07/01/36
| 2.8% | Boston, Ser A | 4.000%
| 11/01/31
| 2.6% | Massachusetts State, Development Finance Agency, Harvard University, Ser B | 4.000%
| 02/15/36
| 2.2% | Massachusetts State, Development Finance Agency, Babson College | 5.000%
| 10/01/33
| 2.1% | Massachusetts State, Development Finance Agency, Amherst College | 5.000%
| 11/01/55
| 1.9% | Massachusetts State, Development Finance Agency, Trustees of Deerfield Academy | 5.000%
| 10/01/32
| 1.9% | Massachusetts Water Resources Authority, Ser C | 5.000%
| 08/01/38
| 1.9% | | Footnote | Description | Footnote(A) | Cash Equivalents are not shown in the top ten holdings. |
|
|
| Material Fund Change [Text Block] |
There were no material fund changes during the reporting period. |
|
| C000017630 |
|
|
| Shareholder Report [Line Items] |
|
|
| Fund Name |
New Jersey Municipal Bond Fund
|
|
| Class Name |
Class F
|
|
| Trading Symbol |
SENJX
|
|
| Annual or Semi-Annual Statement [Text Block] |
Annual Shareholder Report
|
|
| Additional Information [Text Block] |
This annual shareholder report contains important information about Class F Shares of the New Jersey Municipal Bond Fund (the "Fund") for the period from September 1, 2025 to August 31, 2026. You can find additional information about the Fund at https://www.seic.com/mutual-fund-documentation/prospectuses-and-reports. You can also request this information by contacting us at (610) 676-1000.
|
|
| Additional Information Phone Number |
(610) 676-1000
|
|
| Additional Information Website |
https://www.seic.com/mutual-fund-documentation/prospectuses-and-reports
|
|
| Expenses [Text Block] |
What were the Fund costs for the last year?(based on a hypothetical $10,000 investment) Table SummaryFund Name | Costs of a $10,000 investment | Costs paid as a percentage of a $10,000 investment |
|---|
New Jersey Municipal Bond Fund, Class F Shares | $61 | 0.60% |
|---|
|
|
| Expenses Paid, Amount |
$ 61
|
|
| Expense Ratio, Percent |
0.60%
|
|
| Factors Affecting Performance [Text Block] |
How did the Fund perform in the last year?Class F Shares of the Fund modestly underperformed its benchmark, the Bloomberg 3-10 Year Municipal Blend Index (2-12) (USD), for the 12-month period ending August 31, 2026. The target range on the federal funds rate began the reporting period at 4.25%-4.50%. The Federal Reserve (Fed) then cut its benchmark interest rate by 25 basis points (0.25%) at its September 2025 meeting. The Fed subsequently reduced the rate by 25 basis points at both its October and December 2025 meetings, bringing the target range to 3.50%-3.75%. The Fed maintained the range for the first eight months of 2026. The ongoing conflict between the U.S. and Iran, which began on February 28, 2026, has contributed to renewed inflationary pressure, while the labor market has remained on solid ground. Municipal market performance has remained resilient thus far in 2026, supported by strong fund inflows and solid issuer fundamentals despite record issuance and a higher interest-rate environment. Additionally, lower-rated and high-yield municipal sectors have led performance this year, while investment-grade municipals have generated modest positive returns amid upward pressure on long-term interest rates. Insight North America LLC is the sub-adviser for the Fund. The manager’s slight underperformance versus the benchmark during the reporting period was due to an overweight to education bonds and security selection in the transportation sector. Fund performance was bolstered by security selection in revenue bonds and the education sector, as well as an overweight allocation to tobacco bonds. New Jersey municipal bonds outperformed the municipal market overall for the reporting period, which contributed positively to the Fund’s relative performance. |
|
| Performance Past Does Not Indicate Future [Text] |
Past performance is not indicative of future performance.
|
|
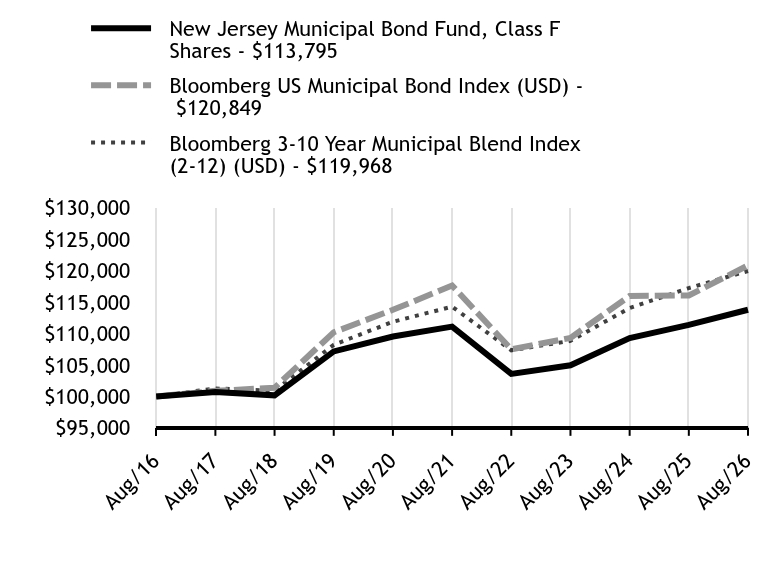
| Line Graph [Table Text Block] |
Table Summary | New Jersey Municipal Bond Fund, Class F Shares | Bloomberg US Municipal Bond Index (USD) | Bloomberg 3-10 Year Municipal Blend Index (2-12) (USD) |
|---|
Aug/16 | $100,000 | $100,000 | $100,000 |
|---|
Aug/17 | $100,687 | $100,883 | $101,263 |
|---|
Aug/18 | $100,167 | $101,376 | $100,909 |
|---|
Aug/19 | $107,156 | $110,215 | $108,214 |
|---|
Aug/20 | $109,540 | $113,781 | $111,879 |
|---|
Aug/21 | $111,114 | $117,645 | $114,290 |
|---|
Aug/22 | $103,584 | $107,490 | $107,341 |
|---|
Aug/23 | $104,964 | $109,322 | $108,839 |
|---|
Aug/24 | $109,292 | $115,978 | $114,071 |
|---|
Aug/25 | $111,376 | $116,067 | $117,248 |
|---|
Aug/26 | $113,795 | $120,849 | $119,968 |
|---|
|
|
| Average Annual Return [Table Text Block] |
Table SummaryFund/Index Name | 1 Year | 5 Years | 10 Years |
|---|
New Jersey Municipal Bond Fund, Class F Shares | 2.17% | 0.48% | 1.30% |
|---|
Bloomberg US Municipal Bond Index (USD) | 4.12% | 0.54% | 1.91% |
|---|
Bloomberg 3-10 Year Municipal Blend Index (2-12) (USD) | 2.32% | 0.97% | 1.84% |
|---|
|
|
| No Deduction of Taxes [Text Block] |
The table and graph presented above do not reflect the deduction of taxes a shareholder would pay on Fund distributions or the redemption of Fund Shares.
|
|
| AssetsNet |
$ 91,649,000
|
|
| Holdings Count | Holding |
85
|
|
| Advisory Fees Paid, Amount |
$ 212
|
|
| InvestmentCompanyPortfolioTurnover |
20.00%
|
|
| Additional Fund Statistics [Text Block] |
Key Fund Statistics as of August 31, 2026Table Summary | Total Net Assets (000's) | Number of Holdings | Total Advisory Fees Paid (000's) | Portfolio Turnover Rate |
|---|
| $91,649 | 85 | $212 | 20% |
|---|
|
|
| Holdings [Text Block] |
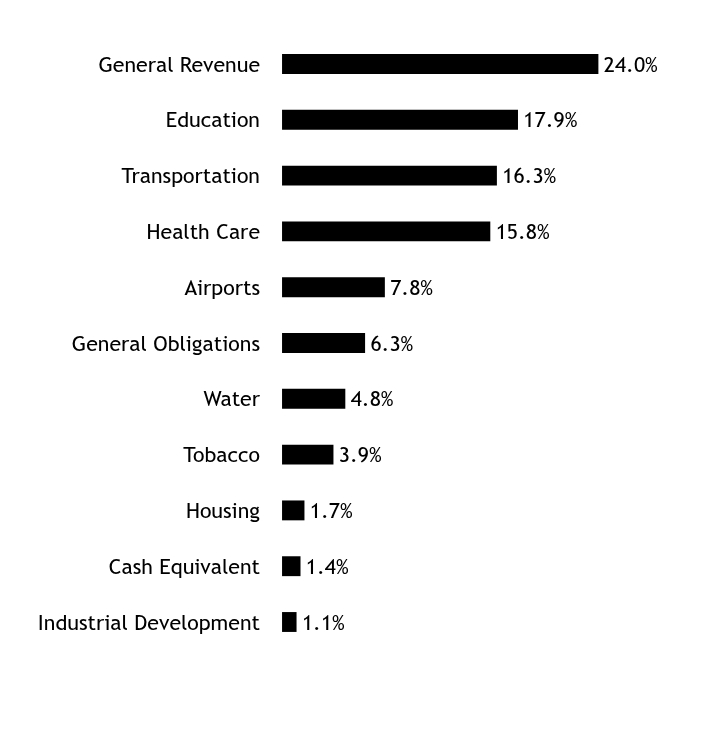
Asset/Sector WeightingsFootnote Reference*Table SummaryValue | Value |
|---|
Industrial Development | 1.1% | Cash Equivalent | 1.4% | Housing | 1.7% | Tobacco | 3.9% | Water | 4.8% | General Obligations | 6.3% | Airports | 7.8% | Health Care | 15.8% | Transportation | 16.3% | Education | 17.9% | General Revenue | 24.0% | | Footnote | Description | Footnote* | Percentages are calculated based on total net assets. |
|
|
| Largest Holdings [Text Block] |
Table SummaryHolding Name | Coupon Rate | Maturity Date | Percentage of Total
Net AssetsFootnote Reference(A) |
|---|
New Jersey State, Turnpike Authority, Ser B | 5.000%
| 01/01/34
| 3.6% | Tobacco Settlement Financing, Ser A | 5.000%
| 06/01/34
| 3.3% | New Jersey State, Transportation Trust Fund Authority, Ser S | 5.000%
| 06/15/32
| 2.9% | New Jersey State, Transportation Trust Fund Authority, Ser A | 4.000%
| 06/15/35
| 2.8% | New Jersey State, Higher Education Student Assistance Authority, Ser A, AMT | 5.000%
| 12/01/33
| 2.8% | New York & New Jersey, Port Authority, AMT | 5.000%
| 11/01/32
| 2.7% | New York & New Jersey, Port Authority, Ser 223, AMT | 5.000%
| 07/15/33
| 2.5% | New Jersey State, Educational Facilities Authority, Ser A1 | 5.000%
| 03/01/37
| 2.4% | New Jersey State, Health Care Facilities Financing Authority, RWJ Barnabas Health Obligated Group | 5.000%
| 07/01/36
| 2.4% | New Jersey State, Health Care Facilities Financing Authority, RWJ Barnabas Health Obligated Group | 5.000%
| 07/01/29
| 2.3% | | Footnote | Description | Footnote(A) | Cash Equivalents are not shown in the top ten holdings. |
|
|
| Material Fund Change [Text Block] |
There were no material fund changes during the reporting period. |
|
| C000147415 |
|
|
| Shareholder Report [Line Items] |
|
|
| Fund Name |
New Jersey Municipal Bond Fund
|
|
| Class Name |
Class Y
|
|
| Trading Symbol |
SNJYX
|
|
| Annual or Semi-Annual Statement [Text Block] |
Annual Shareholder Report
|
|
| Additional Information [Text Block] |
This annual shareholder report contains important information about Class Y Shares of the New Jersey Municipal Bond Fund (the "Fund") for the period from September 1, 2025 to August 31, 2026. You can find additional information about the Fund at https://www.seic.com/mutual-fund-documentation/prospectuses-and-reports. You can also request this information by contacting us at (610) 676-1000.
|
|
| Additional Information Phone Number |
(610) 676-1000
|
|
| Additional Information Website |
https://www.seic.com/mutual-fund-documentation/prospectuses-and-reports
|
|
| Expenses [Text Block] |
What were the Fund costs for the last year?(based on a hypothetical $10,000 investment) Table SummaryFund Name | Costs of a $10,000 investment | Costs paid as a percentage of a $10,000 investment |
|---|
New Jersey Municipal Bond Fund, Class Y Shares | $45 | 0.45% |
|---|
|
|
| Expenses Paid, Amount |
$ 45
|
|
| Expense Ratio, Percent |
0.45%
|
|
| Factors Affecting Performance [Text Block] |
How did the Fund perform in the last year?Class Y Shares of the Fund modestly underperformed its benchmark, the Bloomberg 3-10 Year Municipal Blend Index (2-12) (USD), for the 12-month period ending August 31, 2026. The target range on the federal funds rate began the reporting period at 4.25%-4.50%. The Federal Reserve (Fed) then cut its benchmark interest rate by 25 basis points (0.25%) at its September 2025 meeting. The Fed subsequently reduced the rate by 25 basis points at both its October and December 2025 meetings, bringing the target range to 3.50%-3.75%. The Fed maintained the range for the first eight months of 2026. The ongoing conflict between the U.S. and Iran, which began on February 28, 2026, has contributed to renewed inflationary pressure, while the labor market has remained on solid ground. Municipal market performance has remained resilient thus far in 2026, supported by strong fund inflows and solid issuer fundamentals despite record issuance and a higher interest-rate environment. Additionally, lower-rated and high-yield municipal sectors have led performance this year, while investment-grade municipals have generated modest positive returns amid upward pressure on long-term interest rates. Insight North America LLC is the sub-adviser for the Fund. The manager’s slight underperformance versus the benchmark during the reporting period was due to an overweight to education bonds and security selection in the transportation sector. Fund performance was bolstered by security selection in revenue bonds and the education sector, as well as an overweight allocation to tobacco bonds. New Jersey municipal bonds outperformed the municipal market overall for the reporting period, which contributed positively to the Fund’s relative performance. |
|
| Performance Past Does Not Indicate Future [Text] |
Past performance is not indicative of future performance.
|
|
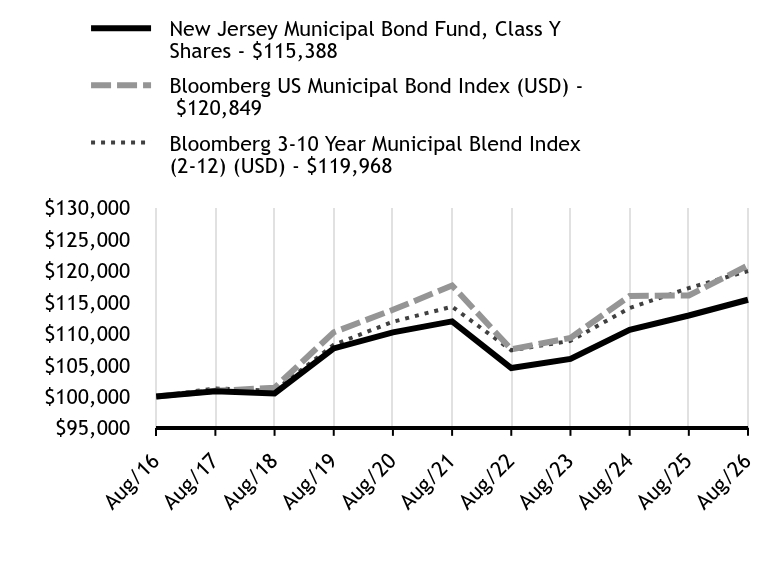
| Line Graph [Table Text Block] |
Table Summary | New Jersey Municipal Bond Fund, Class Y Shares | Bloomberg US Municipal Bond Index (USD) | Bloomberg 3-10 Year Municipal Blend Index (2-12) (USD) |
|---|
Aug/16 | $100,000 | $100,000 | $100,000 |
|---|
Aug/17 | $100,834 | $100,883 | $101,263 |
|---|
Aug/18 | $100,464 | $101,376 | $100,909 |
|---|
Aug/19 | $107,634 | $110,215 | $108,214 |
|---|
Aug/20 | $110,194 | $113,781 | $111,879 |
|---|
Aug/21 | $111,945 | $117,645 | $114,290 |
|---|
Aug/22 | $104,515 | $107,490 | $107,341 |
|---|
Aug/23 | $105,959 | $109,322 | $108,839 |
|---|
Aug/24 | $110,607 | $115,978 | $114,071 |
|---|
Aug/25 | $112,882 | $116,067 | $117,248 |
|---|
Aug/26 | $115,388 | $120,849 | $119,968 |
|---|
|
|
| Average Annual Return [Table Text Block] |
Table SummaryFund/Index Name | 1 Year | 5 Years | 10 Years |
|---|
New Jersey Municipal Bond Fund, Class Y Shares | 2.22% | 0.61% | 1.44% |
|---|
Bloomberg US Municipal Bond Index (USD) | 4.12% | 0.54% | 1.91% |
|---|
Bloomberg 3-10 Year Municipal Blend Index (2-12) (USD) | 2.32% | 0.97% | 1.84% |
|---|
|
|
| No Deduction of Taxes [Text Block] |
The table and graph presented above do not reflect the deduction of taxes a shareholder would pay on Fund distributions or the redemption of Fund Shares.
|
|
| AssetsNet |
$ 91,649,000
|
|
| Holdings Count | Holding |
85
|
|
| Advisory Fees Paid, Amount |
$ 212
|
|
| InvestmentCompanyPortfolioTurnover |
20.00%
|
|
| Additional Fund Statistics [Text Block] |
Key Fund Statistics as of August 31, 2026Table Summary | Total Net Assets (000's) | Number of Holdings | Total Advisory Fees Paid (000's) | Portfolio Turnover Rate |
|---|
| $91,649 | 85 | $212 | 20% |
|---|
|
|
| Holdings [Text Block] |
Asset/Sector WeightingsFootnote Reference*Table SummaryValue | Value |
|---|
Industrial Development | 1.1% | Cash Equivalent | 1.4% | Housing | 1.7% | Tobacco | 3.9% | Water | 4.8% | General Obligations | 6.3% | Airports | 7.8% | Health Care | 15.8% | Transportation | 16.3% | Education | 17.9% | General Revenue | 24.0% | | Footnote | Description | Footnote* | Percentages are calculated based on total net assets. |
|
|
| Largest Holdings [Text Block] |
Table SummaryHolding Name | Coupon Rate | Maturity Date | Percentage of Total
Net AssetsFootnote Reference(A) |
|---|
New Jersey State, Turnpike Authority, Ser B | 5.000%
| 01/01/34
| 3.6% | Tobacco Settlement Financing, Ser A | 5.000%
| 06/01/34
| 3.3% | New Jersey State, Transportation Trust Fund Authority, Ser S | 5.000%
| 06/15/32
| 2.9% | New Jersey State, Transportation Trust Fund Authority, Ser A | 4.000%
| 06/15/35
| 2.8% | New Jersey State, Higher Education Student Assistance Authority, Ser A, AMT | 5.000%
| 12/01/33
| 2.8% | New York & New Jersey, Port Authority, AMT | 5.000%
| 11/01/32
| 2.7% | New York & New Jersey, Port Authority, Ser 223, AMT | 5.000%
| 07/15/33
| 2.5% | New Jersey State, Educational Facilities Authority, Ser A1 | 5.000%
| 03/01/37
| 2.4% | New Jersey State, Health Care Facilities Financing Authority, RWJ Barnabas Health Obligated Group | 5.000%
| 07/01/36
| 2.4% | New Jersey State, Health Care Facilities Financing Authority, RWJ Barnabas Health Obligated Group | 5.000%
| 07/01/29
| 2.3% | | Footnote | Description | Footnote(A) | Cash Equivalents are not shown in the top ten holdings. |
|
|
| Material Fund Change [Text Block] |
There were no material fund changes during the reporting period. |
|
| C000017629 |
|
|
| Shareholder Report [Line Items] |
|
|
| Fund Name |
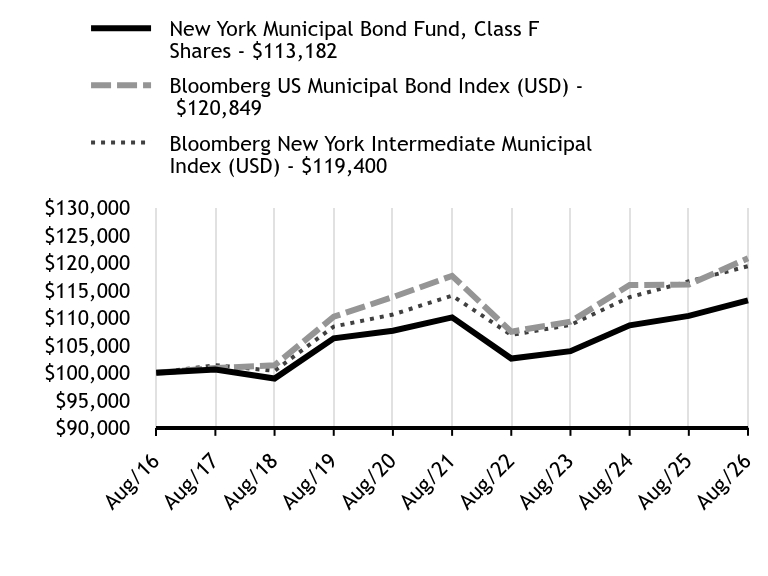
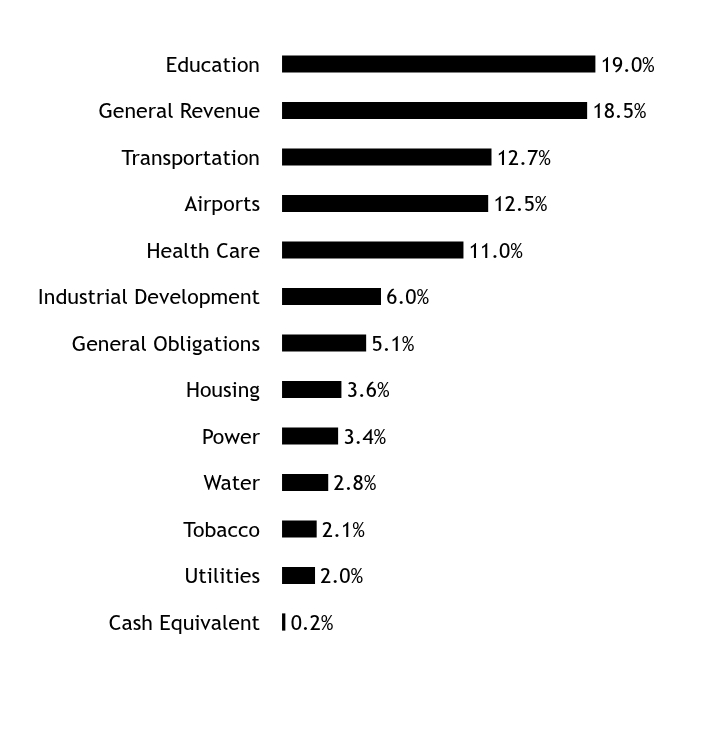
New York Municipal Bond Fund
|
|
| Class Name |
Class F
|
|
| Trading Symbol |
SENYX
|
|
| Annual or Semi-Annual Statement [Text Block] |
Annual Shareholder Report
|
|
| Additional Information [Text Block] |
This annual shareholder report contains important information about Class F Shares of the New York Municipal Bond Fund (the "Fund") for the period from September 1, 2025 to August 31, 2026. You can find additional information about the Fund at https://www.seic.com/mutual-fund-documentation/prospectuses-and-reports. You can also request this information by contacting us at (610) 676-1000.
|
|
| Additional Information Phone Number |
(610) 676-1000
|
|
| Additional Information Website |
https://www.seic.com/mutual-fund-documentation/prospectuses-and-reports
|
|
| Expenses [Text Block] |
What were the Fund costs for the last year?(based on a hypothetical $10,000 investment) Table SummaryFund Name | Costs of a $10,000 investment | Costs paid as a percentage of a $10,000 investment |
|---|
New York Municipal Bond Fund, Class F Shares | $61 | 0.60% |
|---|
|
|
| Expenses Paid, Amount |
$ 61
|
|
| Expense Ratio, Percent |
0.60%
|
|
| Factors Affecting Performance [Text Block] |
How did the Fund perform in the last year?Class F Shares of the Fund modestly outperformed its benchmark, the Bloomberg New York Intermediate Municipal Index, for the 12-month period ending August 31, 2026. The target range on the federal funds rate began the reporting period at 4.25%-4.50%. The Federal Reserve (Fed) then cut its benchmark interest rate by 25 basis points (0.25%) at its September 2025 meeting. The Fed subsequently reduced the rate by 25 basis points at both its October and December 2025 meetings, bringing the target range to 3.50%-3.75%. The Fed maintained the range for the first eight months of 2026. The ongoing conflict between the U.S. and Iran, which began on February 28, 2026, has contributed to renewed inflationary pressure, while the labor market has remained on solid ground. Municipal market performance has remained resilient thus far in 2026, supported by strong fund inflows and solid issuer fundamentals despite record issuance and a higher interest-rate environment. Additionally, lower-rated and high-yield municipal sectors have led performance this year, while investment-grade municipals have generated modest positive returns amid upward pressure on long-term interest rates. Insight North America LLC is the sub-adviser for the Fund. The manager outperformed the Fund’s benchmark for the reporting period due to security selection within revenue sectors, particularly transportation and utilities. Overweight allocations to education and transportation bonds also bolstered Fund performance while selection in healthcare detracted. While New York State faces challenges, including an above-average debt burden, large other post-employment benefits (OPEB) liability (a commitment to provide future non-pension benefits, such as healthcare and life insurance, to retired employees) and population growth issues, the state is buffered by sizable financial reserves and benefits from a diverse economy and well-funded pension system. The state’s debt is rated AA+/AA+/Aa1 by S&P Global Ratings, Fitch Ratings, and Moody’s Ratings, respectively, reflecting a strong credit profile. |
|
| Performance Past Does Not Indicate Future [Text] |
Past performance is not indicative of future performance.
|
|
| Line Graph [Table Text Block] |
Table Summary | New York Municipal Bond Fund, Class F Shares | Bloomberg US Municipal Bond Index (USD) | Bloomberg New York Intermediate Municipal Index (USD) |
|---|
Aug/16 | $100,000 | $100,000 | $100,000 |
|---|
Aug/17 | $100,609 | $100,883 | $101,391 |
|---|
Aug/18 | $98,961 | $101,376 | $100,369 |
|---|
Aug/19 | $106,292 | $110,215 | $108,422 |
|---|
Aug/20 | $107,658 | $113,781 | $110,611 |
|---|
Aug/21 | $110,092 | $117,645 | $114,047 |
|---|
Aug/22 | $102,601 | $107,490 | $106,901 |
|---|
Aug/23 | $103,945 | $109,322 | $108,720 |
|---|
Aug/24 | $108,640 | $115,978 | $113,765 |
|---|
Aug/25 | $110,367 | $116,067 | $116,655 |
|---|
Aug/26 | $113,182 | $120,849 | $119,400 |
|---|
|
|
| Average Annual Return [Table Text Block] |
Table SummaryFund/Index Name | 1 Year | 5 Years | 10 Years |
|---|
New York Municipal Bond Fund, Class F Shares | 2.55% | 0.56% | 1.25% |
|---|
Bloomberg US Municipal Bond Index (USD) | 4.12% | 0.54% | 1.91% |
|---|
Bloomberg New York Intermediate Municipal Index (USD) | 2.35% | 0.92% | 1.79% |
|---|
|
|
| No Deduction of Taxes [Text Block] |
The table and graph presented above do not reflect the deduction of taxes a shareholder would pay on Fund distributions or the redemption of Fund Shares.
|
|
| AssetsNet |
$ 109,470,000
|
|
| Holdings Count | Holding |
78
|
|
| Advisory Fees Paid, Amount |
$ 254
|
|
| InvestmentCompanyPortfolioTurnover |
21.00%
|
|
| Additional Fund Statistics [Text Block] |
Key Fund Statistics as of August 31, 2026Table Summary | Total Net Assets (000's) | Number of Holdings | Total Advisory Fees Paid (000's) | Portfolio Turnover Rate |
|---|
| $109,470 | 78 | $254 | 21% |
|---|
|
|
| Holdings [Text Block] |
Asset/Sector WeightingsFootnote Reference*Table SummaryValue | Value |
|---|
Cash Equivalent | 0.2% | Utilities | 2.0% | Tobacco | 2.1% | Water | 2.8% | Power | 3.4% | Housing | 3.6% | General Obligations | 5.1% | Industrial Development | 6.0% | Health Care | 11.0% | Airports | 12.5% | Transportation | 12.7% | General Revenue | 18.5% | Education | 19.0% | | Footnote | Description | Footnote* | Percentages are calculated based on total net assets. |
|
|
| Largest Holdings [Text Block] |
Table SummaryHolding Name | Coupon Rate | Maturity Date | Percentage of Total
Net AssetsFootnote Reference(A) |
|---|
Triborough, Bridge & Tunnel Authority, MTA Bridges & Tunnels, Sub-Ser A | 5.000%
| 02/01/28
| 3.1% | New York & New Jersey, Port Authority, AMT | 5.000%
| 11/01/30
| 3.0% | New York City Transitional Finance Authority Future Tax Secured Revenue, Sub-Ser S | 5.000%
| 02/01/39
| 2.9% | New York State, Dormitory Authority, School Districts Financing Program, Ser A, ST AID WITHHLDG | 5.000%
| 10/01/29
| 2.3% | New York City Transitional Finance Authority Future Tax Secured Revenue, Future Tax Secured, Sub-Ser | 5.000%
| 05/01/37
| 2.2% | Suffolk, Tobacco Asset Securitization | 4.000%
| 06/01/35
| 2.1% | New York State, Dormitory Authority, AG ST AID WITHHLDG | 5.000%
| 10/01/32
| 2.0% | Metropolitan Transportation Authority | 5.000%
| 11/15/32
| 2.0% | New York State, Dormitory Authority, Presbyterian Hospital Obligated Group | 5.000%
| 08/01/35
| 2.0% | Trust for Cultural Resources of The City of New York | 5.000%
| 12/01/32
| 2.0% | | Footnote | Description | Footnote(A) | Cash Equivalents are not shown in the top ten holdings. |
|
|
| Material Fund Change [Text Block] |
There were no material fund changes during the reporting period. |
|
| C000147414 |
|
|
| Shareholder Report [Line Items] |
|
|
| Fund Name |
New York Municipal Bond Fund
|
|
| Class Name |
Class Y
|
|
| Trading Symbol |
SNYYX
|
|
| Annual or Semi-Annual Statement [Text Block] |
Annual Shareholder Report
|
|
| Additional Information [Text Block] |
This annual shareholder report contains important information about Class Y Shares of the New York Municipal Bond Fund (the "Fund") for the period from September 1, 2025 to August 31, 2026. You can find additional information about the Fund at https://www.seic.com/mutual-fund-documentation/prospectuses-and-reports. You can also request this information by contacting us at (610) 676-1000.
|
|
| Additional Information Phone Number |
(610) 676-1000
|
|
| Additional Information Website |
https://www.seic.com/mutual-fund-documentation/prospectuses-and-reports
|
|
| Expenses [Text Block] |
What were the Fund costs for the last year?(based on a hypothetical $10,000 investment) Table SummaryFund Name | Costs of a $10,000 investment | Costs paid as a percentage of a $10,000 investment |
|---|
New York Municipal Bond Fund, Class Y Shares | $46 | 0.45% |
|---|
|
|
| Expenses Paid, Amount |
$ 46
|
|
| Expense Ratio, Percent |
0.45%
|
|
| Factors Affecting Performance [Text Block] |
How did the Fund perform in the last year?Class Y Shares of the Fund modestly outperformed its benchmark, the Bloomberg New York Intermediate Municipal Index, for the 12-month period ending August 31, 2026. The target range on the federal funds rate began the reporting period at 4.25%-4.50%. The Federal Reserve (Fed) then cut its benchmark interest rate by 25 basis points (0.25%) at its September 2025 meeting. The Fed subsequently reduced the rate by 25 basis points at both its October and December 2025 meetings, bringing the target range to 3.50%-3.75%. The Fed maintained the range for the first eight months of 2026. The ongoing conflict between the U.S. and Iran, which began on February 28, 2026, has contributed to renewed inflationary pressure, while the labor market has remained on solid ground. Municipal market performance has remained resilient thus far in 2026, supported by strong fund inflows and solid issuer fundamentals despite record issuance and a higher interest-rate environment. Additionally, lower-rated and high-yield municipal sectors have led performance this year, while investment-grade municipals have generated modest positive returns amid upward pressure on long-term interest rates. Insight North America LLC is the sub-adviser for the Fund. The manager outperformed the Fund’s benchmark for the reporting period due to security selection within revenue sectors, particularly transportation and utilities. Overweight allocations to education and transportation bonds also bolstered Fund performance while selection in healthcare detracted. While New York State faces challenges, including an above-average debt burden, large other post-employment benefits (OPEB) liability (a commitment to provide future non-pension benefits, such as healthcare and life insurance, to retired employees) and population growth issues, the state is buffered by sizable financial reserves and benefits from a diverse economy and well-funded pension system. The state’s debt is rated AA+/AA+/Aa1 by S&P Global Ratings, Fitch Ratings, and Moody’s Ratings, respectively, reflecting a strong credit profile. |
|
| Performance Past Does Not Indicate Future [Text] |
Past performance is not indicative of future performance.
|
|
| Line Graph [Table Text Block] |
Table Summary | New York Municipal Bond Fund, Class Y Shares | Bloomberg US Municipal Bond Index (USD) | Bloomberg New York Intermediate Municipal Index (USD) |
|---|
Aug/16 | $100,000 | $100,000 | $100,000 |
|---|
Aug/17 | $100,859 | $100,883 | $101,391 |
|---|
Aug/18 | $99,262 | $101,376 | $100,369 |
|---|
Aug/19 | $106,789 | $110,215 | $108,422 |
|---|
Aug/20 | $108,327 | $113,781 | $110,611 |
|---|
Aug/21 | $110,948 | $117,645 | $114,047 |
|---|
Aug/22 | $103,538 | $107,490 | $106,901 |
|---|
Aug/23 | $105,046 | $109,322 | $108,720 |
|---|
Aug/24 | $110,068 | $115,978 | $113,765 |
|---|
Aug/25 | $111,984 | $116,067 | $116,655 |
|---|
Aug/26 | $115,013 | $120,849 | $119,400 |
|---|
|
|
| Average Annual Return [Table Text Block] |
Table SummaryFund/Index Name | 1 Year | 5 Years | 10 Years |
|---|
New York Municipal Bond Fund, Class Y Shares | 2.70% | 0.72% | 1.41% |
|---|
Bloomberg US Municipal Bond Index (USD) | 4.12% | 0.54% | 1.91% |
|---|
Bloomberg New York Intermediate Municipal Index (USD) | 2.35% | 0.92% | 1.79% |
|---|
|
|
| No Deduction of Taxes [Text Block] |
The table and graph presented above do not reflect the deduction of taxes a shareholder would pay on Fund distributions or the redemption of Fund Shares.
|
|
| AssetsNet |
$ 109,470,000
|
|
| Holdings Count | Holding |
78
|
|
| Advisory Fees Paid, Amount |
$ 254
|
|
| InvestmentCompanyPortfolioTurnover |
21.00%
|
|
| Additional Fund Statistics [Text Block] |
Key Fund Statistics as of August 31, 2026Table Summary | Total Net Assets (000's) | Number of Holdings | Total Advisory Fees Paid (000's) | Portfolio Turnover Rate |
|---|
| $109,470 | 78 | $254 | 21% |
|---|
|
|
| Holdings [Text Block] |
Asset/Sector WeightingsFootnote Reference*Table SummaryValue | Value |
|---|
Cash Equivalent | 0.2% | Utilities | 2.0% | Tobacco | 2.1% | Water | 2.8% | Power | 3.4% | Housing | 3.6% | General Obligations | 5.1% | Industrial Development | 6.0% | Health Care | 11.0% | Airports | 12.5% | Transportation | 12.7% | General Revenue | 18.5% | Education | 19.0% | | Footnote | Description | Footnote* | Percentages are calculated based on total net assets. |
|
|
| Largest Holdings [Text Block] |
Table SummaryHolding Name | Coupon Rate | Maturity Date | Percentage of Total
Net AssetsFootnote Reference(A) |
|---|
Triborough, Bridge & Tunnel Authority, MTA Bridges & Tunnels, Sub-Ser A | 5.000%
| 02/01/28
| 3.1% | New York & New Jersey, Port Authority, AMT | 5.000%
| 11/01/30
| 3.0% | New York City Transitional Finance Authority Future Tax Secured Revenue, Sub-Ser S | 5.000%
| 02/01/39
| 2.9% | New York State, Dormitory Authority, School Districts Financing Program, Ser A, ST AID WITHHLDG | 5.000%
| 10/01/29
| 2.3% | New York City Transitional Finance Authority Future Tax Secured Revenue, Future Tax Secured, Sub-Ser | 5.000%
| 05/01/37
| 2.2% | Suffolk, Tobacco Asset Securitization | 4.000%
| 06/01/35
| 2.1% | New York State, Dormitory Authority, AG ST AID WITHHLDG | 5.000%
| 10/01/32
| 2.0% | Metropolitan Transportation Authority | 5.000%
| 11/15/32
| 2.0% | New York State, Dormitory Authority, Presbyterian Hospital Obligated Group | 5.000%
| 08/01/35
| 2.0% | Trust for Cultural Resources of The City of New York | 5.000%
| 12/01/32
| 2.0% | | Footnote | Description | Footnote(A) | Cash Equivalents are not shown in the top ten holdings. |
|
|
| Material Fund Change [Text Block] |
There were no material fund changes during the reporting period. |
|
| C000017626 |
|
|
| Shareholder Report [Line Items] |
|
|
| Fund Name |
Pennsylvania Municipal Bond Fund
|
|
| Class Name |
Class F
|
|
| Trading Symbol |
SEPAX
|
|
| Annual or Semi-Annual Statement [Text Block] |
Annual Shareholder Report
|
|
| Additional Information [Text Block] |
This annual shareholder report contains important information about Class F Shares of the Pennsylvania Municipal Bond Fund (the "Fund") for the period from September 1, 2025 to August 31, 2026. You can find additional information about the Fund at https://www.seic.com/mutual-fund-documentation/prospectuses-and-reports. You can also request this information by contacting us at (610) 676-1000.
|
|
| Additional Information Phone Number |
(610) 676-1000
|
|
| Additional Information Website |
https://www.seic.com/mutual-fund-documentation/prospectuses-and-reports
|
|
| Expenses [Text Block] |
What were the Fund costs for the last year?(based on a hypothetical $10,000 investment) Table SummaryFund Name | Costs of a $10,000 investment | Costs paid as a percentage of a $10,000 investment |
|---|
Pennsylvania Municipal Bond Fund, Class F Shares | $64 | 0.63% |
|---|
|
|
| Expenses Paid, Amount |
$ 64
|
|
| Expense Ratio, Percent |
0.63%
|
|
| Factors Affecting Performance [Text Block] |
How did the Fund perform in the last year?Class F of the Fund modestly underperformed its benchmark, the Bloomberg Pennsylvania Intermediate Municipal Index (USD), for the 12-month period ending August 31, 2026. The target range on the federal funds rate began the reporting period at 4.25%-4.50%. The Federal Reserve (Fed) then cut its benchmark interest rate by 25 basis points (0.25%) at its September 2025 meeting. The Fed subsequently reduced the rate by 25 basis points at both its October and December 2025 meetings, bringing the target range to 3.50%-3.75%. The Fed maintained the range for the first eight months of 2026. The ongoing conflict between the U.S. and Iran, which began on February 28, 2026, has contributed to renewed inflationary pressure, while the labor market has remained on solid ground. Municipal market performance has remained resilient thus far in 2026, supported by strong fund inflows and solid issuer fundamentals despite record issuance and a higher interest-rate environment. Additionally, lower-rated and high-yield municipal sectors have led performance this year, while investment-grade municipals have generated modest positive returns amid upward pressure on long-term interest rates. Insight North America LLC is the sub-adviser for the Fund. Security selection in the utility and tobacco sectors detracted from performance for the reporting period. Fund performance benefited from security selection in revenue sectors such as education and healthcare, as well as overweight allocations to the utility and healthcare sectors. |
|
| Performance Past Does Not Indicate Future [Text] |
Past performance is not indicative of future performance.
|
|
| Line Graph [Table Text Block] |
Table Summary | Pennsylvania Municipal Bond Fund, Class F Shares | Bloomberg US Municipal Bond Index (USD) | Bloomberg Pennsylvania Intermediate Municipal Index (USD) |
|---|
Aug/16 | $100,000 | $100,000 | $100,000 |
|---|
Aug/17 | $100,930 | $100,883 | $102,004 |
|---|
Aug/18 | $99,504 | $101,376 | $101,578 |
|---|
Aug/19 | $107,870 | $110,215 | $111,473 |
|---|
Aug/20 | $111,303 | $113,781 | $115,768 |
|---|
Aug/21 | $113,004 | $117,645 | $119,313 |
|---|
Aug/22 | $104,347 | $107,490 | $110,819 |
|---|
Aug/23 | $105,057 | $109,322 | $112,231 |
|---|
Aug/24 | $109,637 | $115,978 | $117,276 |
|---|
Aug/25 | $112,073 | $116,067 | $120,848 |
|---|
Aug/26 | $114,330 | $120,849 | $123,715 |
|---|
|
|
| Average Annual Return [Table Text Block] |
Table SummaryFund/Index Name | 1 Year | 5 Years | 10 Years |
|---|
Pennsylvania Municipal Bond Fund, Class F Shares | 2.01% | 0.23% | 1.35% |
|---|
Bloomberg US Municipal Bond Index (USD) | 4.12% | 0.54% | 1.91% |
|---|
Bloomberg Pennsylvania Intermediate Municipal Index (USD) | 2.37% | 0.73% | 2.15% |
|---|
|
|
| No Deduction of Taxes [Text Block] |
The table and graph presented above do not reflect the deduction of taxes a shareholder would pay on Fund distributions or the redemption of Fund Shares.
|
|
| AssetsNet |
$ 137,022,000
|
|
| Holdings Count | Holding |
115
|
|
| Advisory Fees Paid, Amount |
$ 367
|
|
| InvestmentCompanyPortfolioTurnover |
22.00%
|
|
| Additional Fund Statistics [Text Block] |
Key Fund Statistics as of August 31, 2026Table Summary | Total Net Assets (000's) | Number of Holdings | Total Advisory Fees Paid (000's) | Portfolio Turnover Rate |
|---|
| $137,022 | 115 | $367 | 22% |
|---|
|
|
| Holdings [Text Block] |
Asset/Sector WeightingsFootnote Reference*Table SummaryValue | Value |
|---|
Utilities | 0.8% | Public Facilities | 1.6% | Cash Equivalent | 1.6% | Housing | 2.3% | Tobacco | 2.3% | Airports | 3.1% | Nursing Homes | 4.5% | General Revenue | 9.7% | Water | 9.8% | Transportation | 10.4% | General Obligations | 11.5% | Health Care | 18.5% | Education | 24.8% | | Footnote | Description | Footnote* | Percentages are calculated based on total net assets. |
|
|
| Largest Holdings [Text Block] |
Table SummaryHolding Name | Coupon Rate | Maturity Date | Percentage of Total
Net AssetsFootnote Reference(A) |
|---|
Philadelphia, Industrial Development Authority, The Children's Hospital of Philadelphia Project | 4.000%
| 07/01/35
| 3.9% | Pennsylvania State, Higher Education Assistance Agency, AMT | 5.000%
| 06/01/35
| 3.6% | Pennsylvania State, BAM | 4.000%
| 03/01/35
| 2.6% | Pennsylvania State | 5.000%
| 09/01/32
| 2.1% | Philadelphia, Water & Wastewater Revenue Authority, Ser C, AGC | 5.000%
| 09/01/35
| 2.1% | Philadelphia, Housing Authority, PHADC Acquisition Program | 5.250%
| 03/01/38
| 2.0% | Adams County, General Authority, The Brethren Home Community | 5.000%
| 06/01/34
| 1.9% | Commonwealth Financing Authority, Tobacco Master Settlement | 5.000%
| 06/01/28
| 1.9% | Allegheny County, Hospital Development Authority, Allegheny Health Network | 5.000%
| 04/01/28
| 1.9% | Philadelphia, Water & Wastewater Revenue Authority, Ser C | 5.000%
| 10/01/31
| 1.8% | | Footnote | Description | Footnote(A) | Cash Equivalents are not shown in the top ten holdings. |
|
|
| Material Fund Change [Text Block] |
There were no material fund changes during the reporting period. |
|
| C000147412 |
|
|
| Shareholder Report [Line Items] |
|
|
| Fund Name |
Pennsylvania Municipal Bond Fund
|
|
| Class Name |
Class Y
|
|
| Trading Symbol |
SPAYX
|
|
| Annual or Semi-Annual Statement [Text Block] |
Annual Shareholder Report
|
|
| Additional Information [Text Block] |
This annual shareholder report contains important information about Class Y Shares of the Pennsylvania Municipal Bond Fund (the "Fund") for the period from September 1, 2025 to August 31, 2026. You can find additional information about the Fund at https://www.seic.com/mutual-fund-documentation/prospectuses-and-reports. You can also request this information by contacting us at (610) 676-1000.
|
|
| Additional Information Phone Number |
(610) 676-1000
|
|
| Additional Information Website |
https://www.seic.com/mutual-fund-documentation/prospectuses-and-reports
|
|
| Expenses [Text Block] |
What were the Fund costs for the last year?(based on a hypothetical $10,000 investment) Table SummaryFund Name | Costs of a $10,000 investment | Costs paid as a percentage of a $10,000 investment |
|---|
Pennsylvania Municipal Bond Fund, Class Y Shares | $49 | 0.48% |
|---|
|
|
| Expenses Paid, Amount |
$ 49
|
|
| Expense Ratio, Percent |
0.48%
|
|
| Factors Affecting Performance [Text Block] |
How did the Fund perform in the last year?Class Y of the Fund modestly underperformed its benchmark, the Bloomberg Pennsylvania Intermediate Municipal Index (USD), for the 12-month period ending August 31, 2026. The target range on the federal funds rate began the reporting period at 4.25%-4.50%. The Federal Reserve (Fed) then cut its benchmark interest rate by 25 basis points (0.25%) at its September 2025 meeting. The Fed subsequently reduced the rate by 25 basis points at both its October and December 2025 meetings, bringing the target range to 3.50%-3.75%. The Fed maintained the range for the first eight months of 2026. The ongoing conflict between the U.S. and Iran, which began on February 28, 2026, has contributed to renewed inflationary pressure, while the labor market has remained on solid ground. Municipal market performance has remained resilient thus far in 2026, supported by strong fund inflows and solid issuer fundamentals despite record issuance and a higher interest-rate environment. Additionally, lower-rated and high-yield municipal sectors have led performance this year, while investment-grade municipals have generated modest positive returns amid upward pressure on long-term interest rates. Insight North America LLC is the sub-adviser for the Fund. Security selection in the utility and tobacco sectors detracted from performance for the reporting period. Fund performance benefited from security selection in revenue sectors such as education and healthcare, as well as overweight allocations to the utility and healthcare sectors. |
|
| Performance Past Does Not Indicate Future [Text] |
Past performance is not indicative of future performance.
|
|
| Line Graph [Table Text Block] |
Table Summary | Pennsylvania Municipal Bond Fund, Class Y Shares | Bloomberg US Municipal Bond Index (USD) | Bloomberg Pennsylvania Intermediate Municipal Index (USD) |
|---|
Aug/16 | $100,000 | $100,000 | $100,000 |
|---|
Aug/17 | $101,080 | $100,883 | $102,004 |
|---|
Aug/18 | $99,707 | $101,376 | $101,578 |
|---|
Aug/19 | $108,355 | $110,215 | $111,473 |
|---|
Aug/20 | $111,970 | $113,781 | $115,768 |
|---|
Aug/21 | $113,842 | $117,645 | $119,313 |
|---|
Aug/22 | $105,279 | $107,490 | $110,819 |
|---|
Aug/23 | $106,045 | $109,322 | $112,231 |
|---|
Aug/24 | $110,922 | $115,978 | $117,276 |
|---|
Aug/25 | $113,559 | $116,067 | $120,848 |
|---|
Aug/26 | $116,016 | $120,849 | $123,715 |
|---|
|
|
| Average Annual Return [Table Text Block] |
Table SummaryFund/Index Name | 1 Year | 5 Years | 10 Years |
|---|
Pennsylvania Municipal Bond Fund, Class Y Shares | 2.16% | 0.38% | 1.50% |
|---|
Bloomberg US Municipal Bond Index (USD) | 4.12% | 0.54% | 1.91% |
|---|
Bloomberg Pennsylvania Intermediate Municipal Index (USD) | 2.37% | 0.73% | 2.15% |
|---|
|
|
| No Deduction of Taxes [Text Block] |
The table and graph presented above do not reflect the deduction of taxes a shareholder would pay on Fund distributions or the redemption of Fund Shares.
|
|
| AssetsNet |
$ 137,022,000
|
|
| Holdings Count | Holding |
115
|
|
| Advisory Fees Paid, Amount |
$ 367
|
|
| InvestmentCompanyPortfolioTurnover |
22.00%
|
|
| Additional Fund Statistics [Text Block] |
Key Fund Statistics as of August 31, 2026Table Summary | Total Net Assets (000's) | Number of Holdings | Total Advisory Fees Paid (000's) | Portfolio Turnover Rate |
|---|
| $137,022 | 115 | $367 | 22% |
|---|
|
|
| Holdings [Text Block] |
Asset/Sector WeightingsFootnote Reference*Table SummaryValue | Value |
|---|
Utilities | 0.8% | Public Facilities | 1.6% | Cash Equivalent | 1.6% | Housing | 2.3% | Tobacco | 2.3% | Airports | 3.1% | Nursing Homes | 4.5% | General Revenue | 9.7% | Water | 9.8% | Transportation | 10.4% | General Obligations | 11.5% | Health Care | 18.5% | Education | 24.8% | | Footnote | Description | Footnote* | Percentages are calculated based on total net assets. |
|
|
| Largest Holdings [Text Block] |
Table SummaryHolding Name | Coupon Rate | Maturity Date | Percentage of Total
Net AssetsFootnote Reference(A) |
|---|
Philadelphia, Industrial Development Authority, The Children's Hospital of Philadelphia Project | 4.000%
| 07/01/35
| 3.9% | Pennsylvania State, Higher Education Assistance Agency, AMT | 5.000%
| 06/01/35
| 3.6% | Pennsylvania State, BAM | 4.000%
| 03/01/35
| 2.6% | Pennsylvania State | 5.000%
| 09/01/32
| 2.1% | Philadelphia, Water & Wastewater Revenue Authority, Ser C, AGC | 5.000%
| 09/01/35
| 2.1% | Philadelphia, Housing Authority, PHADC Acquisition Program | 5.250%
| 03/01/38
| 2.0% | Adams County, General Authority, The Brethren Home Community | 5.000%
| 06/01/34
| 1.9% | Commonwealth Financing Authority, Tobacco Master Settlement | 5.000%
| 06/01/28
| 1.9% | Allegheny County, Hospital Development Authority, Allegheny Health Network | 5.000%
| 04/01/28
| 1.9% | Philadelphia, Water & Wastewater Revenue Authority, Ser C | 5.000%
| 10/01/31
| 1.8% | | Footnote | Description | Footnote(A) | Cash Equivalents are not shown in the top ten holdings. |
|
|
| Material Fund Change [Text Block] |
There were no material fund changes during the reporting period. |
|
| C000047166 |
|
|
| Shareholder Report [Line Items] |
|
|
| Fund Name |
Tax-Advantaged Income Fund
|
|
| Class Name |
Class F
|
|
| Trading Symbol |
SEATX
|
|
| Annual or Semi-Annual Statement [Text Block] |
Annual Shareholder Report
|
|
| Additional Information [Text Block] |
This annual shareholder report contains important information about Class F Shares of the Tax-Advantaged Income Fund (the "Fund") for the period from September 1, 2025 to August 31, 2026. You can find additional information about the Fund at https://www.seic.com/mutual-fund-documentation/prospectuses-and-reports. You can also request this information by contacting us at (610) 676-1000.
|
|
| Additional Information Phone Number |
(610) 676-1000
|
|
| Additional Information Website |
https://www.seic.com/mutual-fund-documentation/prospectuses-and-reports
|
|
| Expenses [Text Block] |
What were the Fund costs for the last year?(based on a hypothetical $10,000 investment) Table SummaryFund Name | Costs of a $10,000 investment | Costs paid as a percentage of a $10,000 investment |
|---|
Tax-Advantaged Income Fund, Class F Shares | $88 | 0.86% |
|---|
|
|
| Expenses Paid, Amount |
$ 88
|
|
| Expense Ratio, Percent |
0.86%
|
|
| Factors Affecting Performance [Text Block] |
How did the Fund perform in the last year?Class F Shares of the Fund underperformed its benchmark, a 60%/40% blend of the Bloomberg High Yield Municipal Bond Index and the Bloomberg U.S. Municipal Bond Index, for the 12-month period ending August 31, 2026. The target range on the federal funds rate began the reporting period at 4.25%-4.50%. The Federal Reserve (Fed) then cut its benchmark interest rate by 25 basis points (0.25%) at its September 2025 meeting. The Fed subsequently reduced the rate by 25 basis points at both its October and December 2025 meetings, bringing the target range to 3.50%-3.75%. The Fed maintained the range for the first eight months of 2026. The ongoing conflict between the U.S. and Iran, which began on February 28, 2026, has contributed to renewed inflationary pressure, while the labor market has remained on solid ground. Municipal market performance has remained resilient thus far in 2026, supported by strong fund inflows and solid issuer fundamentals despite record issuance and a higher interest-rate environment. Additionally, lower-rated and high-yield municipal sectors have led performance this year, while investment-grade municipals have generated modest positive returns amid upward pressure on long-term interest rates. An allocation to preferred securities, which are not represented in the benchmark, hampered Fund performance for the reporting period. Fund performance was bolstered by security selection within the transportation, tobacco, and housing sectors. Additionally, an allocation to BBB rated bonds contributed to performance as lower-quality bonds outperformed higher-quality bonds during the period. The largest detractor from performance among sub-advisers for the period was Spectrum Asset Management Inc, the Fund’s preferred securities sub-adviser. Allspring Global Investments LLC benefited from security selection in revenue sectors, while Pacific Investment Management Company LLC’s performance was enhanced by security selection within the project finance sector. |
|
| Performance Past Does Not Indicate Future [Text] |
Past performance is not indicative of future performance.
|
|
| Line Graph [Table Text Block] |
Table Summary | Tax-Advantaged Income Fund, Class F Shares | Bloomberg US Municipal Bond Index (USD) | Bloomberg 60% Tax-Exempt High Yield/40% Municipal Investment Grade Custom Capped Custom Weighted Index Unhedged US |
|---|
Aug/16 | $100,000 | $100,000 | $100,000 |
|---|
Aug/17 | $102,374 | $100,883 | $101,713 |
|---|
Aug/18 | $105,237 | $101,376 | $105,668 |
|---|
Aug/19 | $113,556 | $110,215 | $115,573 |
|---|
Aug/20 | $116,957 | $113,781 | $117,844 |
|---|
Aug/21 | $127,401 | $117,645 | $127,963 |
|---|
Aug/22 | $114,649 | $107,490 | $115,821 |
|---|
Aug/23 | $114,573 | $109,322 | $116,991 |
|---|
Aug/24 | $126,908 | $115,978 | $128,489 |
|---|
Aug/25 | $125,167 | $116,067 | $127,377 |
|---|
Aug/26 | $131,017 | $120,849 | $134,560 |
|---|
|
|
| Average Annual Return [Table Text Block] |
Table SummaryFund/Index Name | 1 Year | 5 Years | 10 Years |
|---|
Tax-Advantaged Income Fund, Class F Shares | 4.67% | 0.56% | 2.74% |
|---|
Bloomberg US Municipal Bond Index (USD) | 4.12% | 0.54% | 1.91% |
|---|
Bloomberg 60% Tax-Exempt High Yield/40% Municipal Investment Grade Custom Capped Custom Weighted Index Unhedged US | 5.64% | 1.01% | 3.01% |
|---|
|
|
| No Deduction of Taxes [Text Block] |
The table and graph presented above do not reflect the deduction of taxes a shareholder would pay on Fund distributions or the redemption of Fund Shares.
|
|
| AssetsNet |
$ 826,087,000
|
|
| Holdings Count | Holding |
479
|
|
| Advisory Fees Paid, Amount |
$ 3,026
|
|
| InvestmentCompanyPortfolioTurnover |
39.00%
|
|
| Additional Fund Statistics [Text Block] |
Key Fund Statistics as of August 31, 2026Table Summary | Total Net Assets (000's) | Number of Holdings | Total Advisory Fees Paid (000's) | Portfolio Turnover Rate |
|---|
| $826,087 | 479 | $3,026 | 39% |
|---|
|
|
| Holdings [Text Block] |
Asset/Sector WeightingsFootnote Reference*Table SummaryValue | Value |
|---|
Cash Equivalent | 0.1% | Board Bank Revenue | 0.4% | Pollution Control | 0.7% | Loan Participation | 1.0% | Mortgage-Backed Securities | 1.2% | Airports | 1.5% | Power | 1.6% | Transportation | 2.1% | General Obligations | 3.1% | Water | 3.7% | Preferred Stock | 3.9% | Health Care | 4.4% | U.S. Treasury Obligations | 4.7% | Nursing Homes | 6.0% | Education | 6.1% | Tobacco | 6.6% | Industrial Development | 7.4% | Housing | 9.9% | General Revenue | 17.2% | Corporate Obligations | 18.9% | | Footnote | Description | Footnote* | Percentages are calculated based on total net assets. |
|
|
| Largest Holdings [Text Block] |
Table SummaryHolding Name | Coupon Rate | Maturity Date | Percentage of Total
Net AssetsFootnote Reference(A) |
|---|
U.S. Treasury Notes | 4.250%
| 07/31/28
| 1.3% | Puerto Rico, Sales Tax Financing, Sales Tax Revenue, Ser A1 | 0.000%
| 07/01/51
| 1.3% | Texas State, Water Development Board, Ser A | 4.875%
| 10/15/48
| 1.3% | Puerto Rico, Sub-Ser Senior | 0.000%
| 11/01/51
| 1.0% | North Fort Bend Water Authority, Ser A | 4.000%
| 12/15/44
| 0.9% | West Virginia State, Tobacco Settlement, Finance Authority, Ser B | 0.000%
| 06/01/47
| 0.9% | M-S-R, Energy Authority, Ser C | 6.500%
| 11/01/39
| 0.8% | Rhode Island State, Tobacco Settlement Financing Authority, Ser B | 5.000%
| 06/01/50
| 0.8% | Puerto Rico, GDB Debt Recovery Authority | 7.500%
| 08/20/40
| 0.8% | Freddie Mac, Multifamily ML Certificates, Ser ML-29 | 4.870%
| 01/25/43
| 0.8% | | Footnote | Description | Footnote(A) | Cash Equivalents are not shown in the top ten holdings. |
|
|
| Material Fund Change [Text Block] |
There were no material fund changes during the reporting period. |
|
| C000147418 |
|
|
| Shareholder Report [Line Items] |
|
|
| Fund Name |
Tax-Advantaged Income Fund
|
|
| Class Name |
Class Y
|
|
| Trading Symbol |
STAYX
|
|
| Annual or Semi-Annual Statement [Text Block] |
Annual Shareholder Report
|
|
| Additional Information [Text Block] |
This annual shareholder report contains important information about Class Y Shares of the Tax-Advantaged Income Fund (the "Fund") for the period from September 1, 2025 to August 31, 2026. You can find additional information about the Fund at https://www.seic.com/mutual-fund-documentation/prospectuses-and-reports. You can also request this information by contacting us at (610) 676-1000.
|
|
| Additional Information Phone Number |
(610) 676-1000
|
|
| Additional Information Website |
https://www.seic.com/mutual-fund-documentation/prospectuses-and-reports
|
|
| Expenses [Text Block] |
What were the Fund costs for the last year?(based on a hypothetical $10,000 investment) Table SummaryFund Name | Costs of a $10,000 investment | Costs paid as a percentage of a $10,000 investment |
|---|
Tax-Advantaged Income Fund, Class Y Shares | $63 | 0.61% |
|---|
|
|
| Expenses Paid, Amount |
$ 63
|
|
| Expense Ratio, Percent |
0.61%
|
|
| Factors Affecting Performance [Text Block] |
How did the Fund perform in the last year?Class Y Shares of the Fund underperformed its benchmark, a 60%/40% blend of the Bloomberg High Yield Municipal Bond Index and the Bloomberg U.S. Municipal Bond Index, for the 12-month period ending August 31, 2026. The target range on the federal funds rate began the reporting period at 4.25%-4.50%. The Federal Reserve (Fed) then cut its benchmark interest rate by 25 basis points (0.25%) at its September 2025 meeting. The Fed subsequently reduced the rate by 25 basis points at both its October and December 2025 meetings, bringing the target range to 3.50%-3.75%. The Fed maintained the range for the first eight months of 2026. The ongoing conflict between the U.S. and Iran, which began on February 28, 2026, has contributed to renewed inflationary pressure, while the labor market has remained on solid ground. Municipal market performance has remained resilient thus far in 2026, supported by strong fund inflows and solid issuer fundamentals despite record issuance and a higher interest-rate environment. Additionally, lower-rated and high-yield municipal sectors have led performance this year, while investment-grade municipals have generated modest positive returns amid upward pressure on long-term interest rates. An allocation to preferred securities, which are not represented in the benchmark, hampered Fund performance for the reporting period. Fund performance was bolstered by security selection within the transportation, tobacco, and housing sectors. Additionally, an allocation to BBB rated bonds contributed to performance as lower-quality bonds outperformed higher-quality bonds during the period. The largest detractor from performance among sub-advisers for the period was Spectrum Asset Management Inc, the Fund’s preferred securities sub-adviser. Allspring Global Investments LLC benefited from security selection in revenue sectors, while Pacific Investment Management Company LLC’s performance was enhanced by security selection within the project finance sector. |
|
| Performance Past Does Not Indicate Future [Text] |
Past performance is not indicative of future performance.
|
|
| Line Graph [Table Text Block] |
Table Summary | Tax-Advantaged Income Fund, Class Y Shares | Bloomberg US Municipal Bond Index (USD) | Bloomberg 60% Tax-Exempt High Yield/40% Municipal Investment Grade Custom Capped Custom Weighted Index Unhedged US |
|---|
Aug/16 | $100,000 | $100,000 | $100,000 |
|---|
Aug/17 | $102,626 | $100,883 | $101,713 |
|---|
Aug/18 | $105,757 | $101,376 | $105,668 |
|---|
Aug/19 | $114,401 | $110,215 | $115,573 |
|---|
Aug/20 | $118,119 | $113,781 | $117,844 |
|---|
Aug/21 | $128,989 | $117,645 | $127,963 |
|---|
Aug/22 | $116,350 | $107,490 | $115,821 |
|---|
Aug/23 | $116,555 | $109,322 | $116,991 |
|---|
Aug/24 | $129,431 | $115,978 | $128,489 |
|---|
Aug/25 | $127,962 | $116,067 | $127,377 |
|---|
Aug/26 | $134,274 | $120,849 | $134,560 |
|---|
|
|
| Average Annual Return [Table Text Block] |
Table SummaryFund/Index Name | 1 Year | 5 Years | 10 Years |
|---|
Tax-Advantaged Income Fund, Class Y Shares | 4.93% | 0.81% | 2.99% |
|---|
Bloomberg US Municipal Bond Index (USD) | 4.12% | 0.54% | 1.91% |
|---|
Bloomberg 60% Tax-Exempt High Yield/40% Municipal Investment Grade Custom Capped Custom Weighted Index Unhedged US | 5.64% | 1.01% | 3.01% |
|---|
|
|
| No Deduction of Taxes [Text Block] |
The table and graph presented above do not reflect the deduction of taxes a shareholder would pay on Fund distributions or the redemption of Fund Shares.
|
|
| AssetsNet |
$ 826,087,000
|
|
| Holdings Count | Holding |
479
|
|
| Advisory Fees Paid, Amount |
$ 3,026
|
|
| InvestmentCompanyPortfolioTurnover |
39.00%
|
|
| Additional Fund Statistics [Text Block] |
Key Fund Statistics as of August 31, 2026Table Summary | Total Net Assets (000's) | Number of Holdings | Total Advisory Fees Paid (000's) | Portfolio Turnover Rate |
|---|
| $826,087 | 479 | $3,026 | 39% |
|---|
|
|
| Holdings [Text Block] |
Asset/Sector WeightingsFootnote Reference*Table SummaryValue | Value |
|---|
Cash Equivalent | 0.1% | Board Bank Revenue | 0.4% | Pollution Control | 0.7% | Loan Participation | 1.0% | Mortgage-Backed Securities | 1.2% | Airports | 1.5% | Power | 1.6% | Transportation | 2.1% | General Obligations | 3.1% | Water | 3.7% | Preferred Stock | 3.9% | Health Care | 4.4% | U.S. Treasury Obligations | 4.7% | Nursing Homes | 6.0% | Education | 6.1% | Tobacco | 6.6% | Industrial Development | 7.4% | Housing | 9.9% | General Revenue | 17.2% | Corporate Obligations | 18.9% | | Footnote | Description | Footnote* | Percentages are calculated based on total net assets. |
|
|
| Largest Holdings [Text Block] |
Table SummaryHolding Name | Coupon Rate | Maturity Date | Percentage of Total
Net AssetsFootnote Reference(A) |
|---|
U.S. Treasury Notes | 4.250%
| 07/31/28
| 1.3% | Puerto Rico, Sales Tax Financing, Sales Tax Revenue, Ser A1 | 0.000%
| 07/01/51
| 1.3% | Texas State, Water Development Board, Ser A | 4.875%
| 10/15/48
| 1.3% | Puerto Rico, Sub-Ser Senior | 0.000%
| 11/01/51
| 1.0% | North Fort Bend Water Authority, Ser A | 4.000%
| 12/15/44
| 0.9% | West Virginia State, Tobacco Settlement, Finance Authority, Ser B | 0.000%
| 06/01/47
| 0.9% | M-S-R, Energy Authority, Ser C | 6.500%
| 11/01/39
| 0.8% | Rhode Island State, Tobacco Settlement Financing Authority, Ser B | 5.000%
| 06/01/50
| 0.8% | Puerto Rico, GDB Debt Recovery Authority | 7.500%
| 08/20/40
| 0.8% | Freddie Mac, Multifamily ML Certificates, Ser ML-29 | 4.870%
| 01/25/43
| 0.8% | | Footnote | Description | Footnote(A) | Cash Equivalents are not shown in the top ten holdings. |
|
|
| Material Fund Change [Text Block] |
There were no material fund changes during the reporting period. |
|
|
|