Shareholder Report
Aug. 31, 2026
USD ($)
Holding
FUND COSTS FOR THE LAST six months ENDED August 31, 2026 (BASED ON A HYPOTHETICAL $10,000 INVESTMENT)
COSTS OF A $10,000 INVESTMENT |
COSTS PAID AS A PERCENTAGE OF A $10,000 INVESTMENT | |
Schwab U.S. REIT ETF |
$4 |
0.07% * |
*
Annualized.
Average Annual Total Returns
Fund and Inception Date |
6 Months |
1 Year |
5 Years |
10 Years |
Fund: Schwab U.S. REIT ETF (01/13/2011)1,2 |
3.54% |
12.33% |
2.23% |
3.65% |
S&P 500® Index3 |
12.37% |
20.38% |
12.79% |
15.37% |
Dow Jones Equity All REIT Capped Index4 |
3.61% |
12.44% |
2.31% |
N/A |
REIT Spliced Index |
3.61% |
12.44% |
2.31% |
3.71% |
All total returns on this page assume dividends and distributions were reinvested. Index figures do not include trading and management costs, which would lower
performance. Indices are unmanaged and cannot be invested in directly. Performance results less than one year are not annualized.
For index definitions, please see www.schwabassetmanagement.com/glossary.
Shares are bought and sold at market price, which may be higher or lower than the net asset value (NAV). Brokerage commissions will reduce returns.
Index ownership — Dow Jones
®
is a registered trademark of Dow Jones Trademark Holdings LLC (Dow Jones). The Dow Jones Equity All REIT Capped Index (the Index) is a
product of S&P Dow Jones Indices LLC, and the trademark and Index have been licensed for use by Charles Schwab Investment Management, Inc. The Schwab U.S. REIT ETF
is not sponsored, endorsed, sold or promoted by S&P Dow Jones Indices LLC, Dow Jones, or any of their respective affiliates and neither S&P Dow Jones Indices LLC, Dow
Jones, nor any of their respective affiliates make any representation regarding the advisability of investing in such product.
1
Performance does not reflect the deduction of taxes that a shareholder would pay on fund distributions or on the redemption or sale of fund shares.
2
Performance is shown on a NAV basis. The fund’s per share NAV is the value of one share of the fund. NAV is calculated by taking the fund’s total assets (including the fair
value of securities owned), subtracting liabilities, and dividing by the number of shares outstanding. Returns assume that dividends and capital gain distributions have been
reinvested in the fund at NAV.
3
The S&P 500
®
Index serves as the fund’s regulatory index and provides a broad measure of market performance. The fund generally invests in securities that are included in
the Dow Jones Equity All REIT Capped Index. The fund does not seek to track the regulatory index.
4
The inception date of the Dow Jones Equity All REIT Capped Index is April 13, 2020. The fund began tracking the index on June 22, 2020.
Statistics
Net Assets (millions) |
$11,202 |
Number of Holdings (excludes derivatives) |
118 |
Portfolio Turnover Rate (not annualized; excludes in-kind transactions) |
3% |
Weighted Average Market Cap (millions) |
$57,844 |
Price/Earnings Ratio (P/E) |
30.5 |
Price/Book Ratio (P/B) |
2.7 |
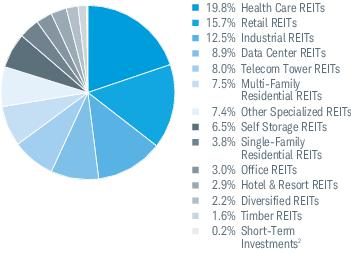
Industry Weightings % of Investments1
Top Equity Holdings % of Net Assets
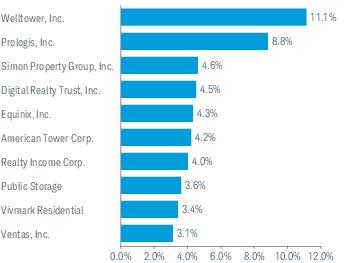
Portfolio holdings may have changed since the report date.
The Sector/Industry classifications in this report use the Global Industry Classification Standard (GICS) which was developed by and is the exclusive property of MSCI Inc.
(MSCI) and Standard & Poor’s (S&P). GICS is a service mark of MSCI and S&P and has been licensed for use by Charles Schwab & Co., Inc.
1
Excludes derivatives.
2
Includes the fund’s position(s) in money market mutual funds registered under the Investment
Company
Act of 1940, as amended.Top Equity Holdings % of Net Assets
Portfolio holdings may have changed since the report date.
FUND COSTS FOR THE LAST six months ENDED August 31, 2026 (BASED ON A HYPOTHETICAL $10,000 INVESTMENT)
COSTS OF A $10,000 INVESTMENT |
COSTS PAID AS A PERCENTAGE OF A $10,000 INVESTMENT | |
Schwab Fundamental U.S. Broad Market ETF |
$13 |
0.25% * |
*
Annualized.
Average Annual Total Returns
Fund and Inception Date |
6 Months |
1 Year |
5 Years |
10 Years |
Fund: Schwab Fundamental U.S. Broad Market ETF (08/15/2013)1,2 |
12.04% |
27.19% |
13.29% |
14.11% |
Russell 3000® Index3 |
12.17% |
20.10% |
11.80% |
14.84% |
RAFI Fundamental High Liquidity US All Index4 |
12.21% |
27.53% |
N/A |
N/A |
Fundamental US All Spliced Index |
12.21% |
27.53% |
13.56% |
14.38% |
All total returns on this page assume dividends and distributions were reinvested. Index figures do not include trading and management costs, which would lower
performance. Indices are unmanaged and cannot be invested in directly. Performance results less than one year are not annualized.
For index definitions, please see www.schwabassetmanagement.com/glossary.
Shares are bought and sold at market price, which may be higher or lower than the net asset value (NAV). Brokerage commissions will reduce returns.
Index ownership — The RAFI Fundamental High Liquidity US All Index (the Index) is a service mark of RAFI Indices, LLC or its affiliates (collectively, RAFI) and has been licensed
for use by Charles Schwab Investment Management, Inc. The intellectual and other property rights to the Index are owned by or licensed to RAFI. The Schwab Fundamental
U.S. Broad Market ETF is not sponsored, endorsed, sold or promoted by RAFI, its agents or service providers (collectively, the RAFI Parties). The RAFI Parties: (i) make no
representation or warranty as to the results to be obtained from the use of the Index or otherwise; and (ii) shall not be liable (whether in negligence or otherwise) to any
person for any error in the Index. For full disclaimer, please see the fund’s statement of additional information.
1
Performance does not reflect the deduction of taxes that a shareholder would pay on fund distributions or on the redemption or sale of fund shares.
2
Performance is shown on a NAV basis. The fund’s per share NAV is the value of one share of the fund. NAV is calculated by taking the fund’s total assets (including the fair
value of securities owned), subtracting liabilities, and dividing by the number of shares outstanding. Returns assume that dividends and capital gain distributions have been
reinvested in the fund at NAV.
3
The Russell 3000
®
Index serves as the fund’s regulatory index and provides a broad measure of market performance. The fund generally invests in securities that are
included in the RAFI Fundamental High Liquidity US All Index. The fund does not seek to track the regulatory index.
4
The inception date of the RAFI Fundamental High Liquidity US All Index is January 31, 2024. The fund began tracking the index on June 21, 2024.
Statistics
Net Assets (millions) |
$1,486 |
Number of Holdings (excludes derivatives) |
1,624 |
Portfolio Turnover Rate (not annualized; excludes in-kind transactions) |
7% |
Weighted Average Market Cap (millions) |
$696,621 |
Price/Earnings Ratio (P/E) |
19.7 |
Price/Book Ratio (P/B) |
3.0 |
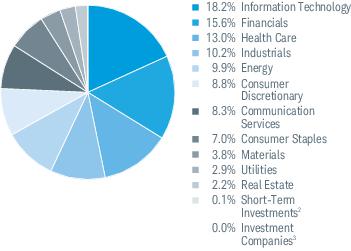
Sector Weightings % of Investments1
Top Equity Holdings % of Net Assets
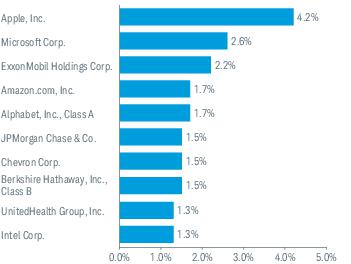
Portfolio holdings may have changed since the report date.
The Sector/Industry classifications in this report use the Global Industry Classification Standard (GICS) which was developed by and is the exclusive property of MSCI Inc.
(MSCI) and Standard & Poor’s (S&P). GICS is a service mark of MSCI and S&P and has been licensed for use by Charles Schwab & Co., Inc.
1
Excludes derivatives.
2
Includes the fund’s position(s) in money market mutual funds registered under the Investment Company Act of 1940, as amended.
3
Amount is less than 0.05%.
Top Equity Holdings % of Net Assets
Portfolio holdings may have changed since the report date.
FUND COSTS FOR THE LAST six months ENDED August 31, 2026 (BASED ON A HYPOTHETICAL $10,000 INVESTMENT)
COSTS OF A $10,000 INVESTMENT |
COSTS PAID AS A PERCENTAGE OF A $10,000 INVESTMENT | |
Schwab Fundamental U.S. Large Company ETF |
$13 |
0.25% * |
*
Annualized.
Average Annual Total Returns
Fund and Inception Date |
6 Months |
1 Year |
5 Years |
10 Years |
Fund: Schwab Fundamental U.S. Large Company ETF (08/15/2013)1,2 |
12.45% |
27.87% |
13.73% |
14.39% |
Russell 1000® Index3 |
12.10% |
19.77% |
12.10% |
15.13% |
RAFI Fundamental High Liquidity US Large Index4 |
12.56% |
28.16% |
N/A |
N/A |
Fundamental US Large Spliced Index |
12.56% |
28.16% |
14.00% |
14.65% |
All total returns on this page assume dividends and distributions were reinvested. Index figures do not include trading and management costs, which would lower
performance. Indices are unmanaged and cannot be invested in directly. Performance results less than one year are not annualized.
For index definitions, please see www.schwabassetmanagement.com/glossary.
Shares are bought and sold at market price, which may be higher or lower than the net asset value (NAV). Brokerage commissions will reduce returns.
Index ownership — The RAFI Fundamental High Liquidity US Large Index (the Index) is a service mark of RAFI Indices, LLC or its affiliates (collectively, RAFI) and has been
licensed for use by Charles Schwab Investment Management, Inc. The intellectual and other property rights to the Index are owned by or licensed to RAFI. The Schwab
Fundamental U.S. Large Company ETF is not sponsored, endorsed, sold or promoted by RAFI, its agents or service providers (collectively, the RAFI Parties). The RAFI Parties: (i)
make no representation or warranty as to the results to be obtained from the use of the Index or otherwise; and (ii) shall not be liable (whether in negligence or otherwise) to
any person for any error in the Index. For full disclaimer, please see the fund’s statement of additional information.
1
Performance does not reflect the deduction of taxes that a shareholder would pay on fund distributions or on the redemption or sale of fund shares.
2
Performance is shown on a NAV basis. The fund’s per share NAV is the value of one share of the fund. NAV is calculated by taking the fund’s total assets (including the fair
value of securities owned), subtracting liabilities, and dividing by the number of shares outstanding. Returns assume that dividends and capital gain distributions have been
reinvested in the fund at NAV.
3
The Russell 1000
®
Index serves as the fund’s regulatory index and provides a broad measure of market performance. The fund generally invests in securities that are
included in the RAFI Fundamental High Liquidity US Large Index. The fund does not seek to track the regulatory index.
4
The inception date of the RAFI Fundamental High Liquidity US Large Index is January 31, 2024. The fund began tracking the index on June 21, 2024.
Statistics
Net Assets (millions) |
$27,594 |
Number of Holdings (excludes derivatives) |
732 |
Portfolio Turnover Rate (not annualized; excludes in-kind transactions) |
6% |
Weighted Average Market Cap (millions) |
$746,179 |
Price/Earnings Ratio (P/E) |
19.8 |
Price/Book Ratio (P/B) |
3.1 |
Sector Weightings % of Investments1
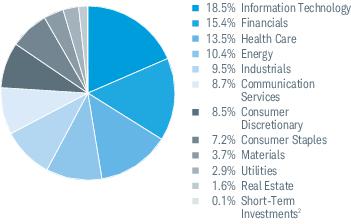
Top Equity Holdings % of Net Assets
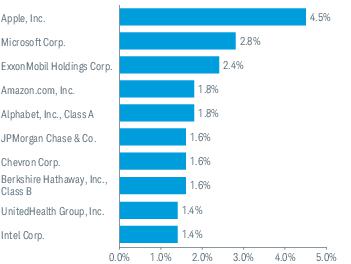
Portfolio holdings may have changed since the report date.
The Sector/Industry classifications in this report use the Global Industry Classification Standard (GICS) which was developed by and is the exclusive property of MSCI Inc.
(MSCI) and Standard & Poor’s (S&P). GICS is a service mark of MSCI and S&P and has been licensed for use by Charles Schwab & Co., Inc.
1
Excludes derivatives.
2
Includes the fund’s position(s) in money market mutual funds registered under the Investment Company Act of 1940, as amended.
Top Equity Holdings % of Net Assets
Portfolio holdings may have changed since the report date.
FUND COSTS FOR THE LAST six months ENDED August 31, 2026 (BASED ON A HYPOTHETICAL $10,000 INVESTMENT)
COSTS OF A $10,000 INVESTMENT |
COSTS PAID AS A PERCENTAGE OF A $10,000 INVESTMENT | |
Schwab Fundamental U.S. Small Company ETF |
$13 |
0.25% * |
*
Annualized.
Average Annual Total Returns
Fund and Inception Date |
6 Months |
1 Year |
5 Years |
10 Years |
Fund: Schwab Fundamental U.S. Small Company ETF (08/15/2013)1,2 |
8.24% |
20.36% |
8.03% |
10.62% |
S&P 500® Index3 |
12.37% |
20.38% |
12.79% |
15.37% |
RAFI Fundamental High Liquidity US Small Index4 |
8.37% |
20.63% |
N/A |
N/A |
Fundamental US Small Spliced Index |
8.37% |
20.63% |
8.24% |
10.82% |
Russell 2000® Index |
13.01% |
26.46% |
6.85% |
10.55% |
All total returns on this page assume dividends and distributions were reinvested. Index figures do not include trading and management costs, which would lower
performance. Indices are unmanaged and cannot be invested in directly. Performance results less than one year are not annualized.
For index definitions, please see www.schwabassetmanagement.com/glossary.
Shares are bought and sold at market price, which may be higher or lower than the net asset value (NAV). Brokerage commissions will reduce returns.
Index ownership — The RAFI Fundamental High Liquidity US Small Index (the Index) is a service mark of RAFI Indices, LLC or its affiliates (collectively, RAFI) and has been
licensed for use by Charles Schwab Investment Management, Inc. The intellectual and other property rights to the Index are owned by or licensed to RAFI. The Schwab
Fundamental U.S. Small Company ETF is not sponsored, endorsed, sold or promoted by RAFI, its agents or service providers (collectively, the RAFI Parties). The RAFI
Parties: (i) make no representation or warranty as to the results to be obtained from the use of the Index or otherwise; and (ii) shall not be liable (whether in negligence or
otherwise) to any person for any error in the Index. For full disclaimer, please see the fund’s statement of additional information.
1
Performance does not reflect the deduction of taxes that a shareholder would pay on fund distributions or on the redemption or sale of fund shares.
2
Performance is shown on a NAV basis. The fund’s per share NAV is the value of one share of the fund. NAV is calculated by taking the fund’s total assets (including the fair
value of securities owned), subtracting liabilities, and dividing by the number of shares outstanding. Returns assume that dividends and capital gain distributions have been
reinvested in the fund at NAV.
3
The S&P 500
®
Index serves as the fund’s regulatory index and provides a broad measure of market performance. The fund generally invests in securities that are included in
the RAFI Fundamental High Liquidity US Small Index. The fund does not seek to track the regulatory index.
4
The inception date of the RAFI Fundamental High Liquidity US Small Index is January 31, 2024. The fund began tracking the index on June 21, 2024.
Statistics
Net Assets (millions) |
$9,107 |
Number of Holdings (excludes derivatives) |
916 |
Portfolio Turnover Rate (not annualized; excludes in-kind transactions) |
11% |
Weighted Average Market Cap (millions) |
$9,958 |
Price/Earnings Ratio (P/E) |
18.7 |
Price/Book Ratio (P/B) |
2.0 |
Sector Weightings % of Investments1
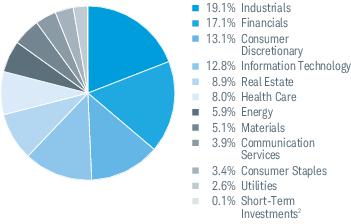
Top Equity Holdings % of Net Assets
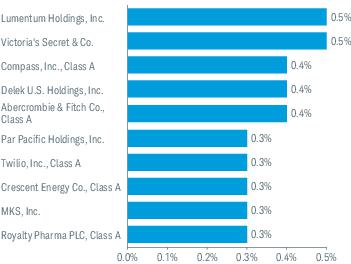
Portfolio holdings may have changed since the report date.
The Sector/Industry classifications in this report use the Global Industry Classification Standard (GICS) which was developed by and is the exclusive property of MSCI Inc.
(MSCI) and Standard & Poor’s (S&P). GICS is a service mark of MSCI and S&P and has been licensed for use by Charles Schwab & Co., Inc.
1
Excludes derivatives.
2
Includes the fund’s position(s) in money market mutual funds registered under the Investment Company Act of 1940, as amended.
Top Equity Holdings % of Net Assets
Portfolio holdings may have changed since the report date.
FUND COSTS FOR THE LAST six months ENDED August 31, 2026 (BASED ON A HYPOTHETICAL $10,000 INVESTMENT)
COSTS OF A $10,000 INVESTMENT |
COSTS PAID AS A PERCENTAGE OF A $10,000 INVESTMENT | |
Schwab Fundamental International Equity ETF |
$13 |
0.25% * |
*
Annualized.
Average Annual Total Returns
Fund and Inception Date |
6 Months |
1 Year |
5 Years |
10 Years |
Fund: Schwab Fundamental International Equity ETF (08/15/2013)1,2,3 |
5.91% |
37.02% |
14.79% |
11.95% |
MSCI EAFE® Index (Net)4,5 |
3.38% |
21.62% |
9.35% |
9.54% |
RAFI Fundamental High Liquidity Developed ex US Large Index (Net)4,6 |
5.98% |
37.24% |
N/A |
N/A |
Fundamental Developed ex US Large Spliced Index |
5.98% |
37.24% |
14.83% |
11.99% |
All total returns on this page assume dividends and distributions were reinvested. Index figures do not include trading and management costs, which would lower
performance. Indices are unmanaged and cannot be invested in directly. Performance results less than one year are not annualized.
For index definitions, please see www.schwabassetmanagement.com/glossary.
Shares are bought and sold at market price, which may be higher or lower than the net asset value (NAV). Brokerage commissions will reduce returns.
Index ownership — The RAFI Fundamental High Liquidity Developed ex US Large Index (the Index) is a service mark of RAFI Indices, LLC or its affiliates (collectively, RAFI) and
has been licensed for use by Charles Schwab Investment Management, Inc. The intellectual and other property rights to the Index are owned by or licensed to RAFI. The
Schwab Fundamental International Equity ETF is not sponsored, endorsed, sold or promoted by RAFI, its agents or service providers (collectively, the RAFI Parties). The RAFI
Parties: (i) make no representation or warranty as to the results to be obtained from the use of the Index or otherwise; and (ii) shall not be liable (whether in negligence or
otherwise) to any person for any error in the Index. For full disclaimer, please see the fund’s statement of additional information.
1
Performance does not reflect the deduction of taxes that a shareholder would pay on fund distributions or on the redemption or sale of fund shares.
2
Performance is shown on a NAV basis. The fund’s per share NAV is the value of one share of the fund. NAV is calculated by taking the fund’s total assets (including the fair
value of securities owned), subtracting liabilities, and dividing by the number of shares outstanding. Returns assume that dividends and capital gain distributions have been
reinvested in the fund at NAV.
3
The fund’s performance relative to the index may be affected by fair-value pricing and timing differences in foreign exchange calculations.
4
The net version of the index reflects reinvested dividends net of withholding taxes but reflects no deductions for expenses or other taxes.
5
The MSCI EAFE
®
Index (Net) serves as the fund’s regulatory index and provides a broad measure of market performance. The fund generally invests in securities that are
included in the RAFI Fundamental High Liquidity Developed ex US Large Index (Net). The fund does not seek to track the regulatory index.
6
The inception date of the RAFI Fundamental High Liquidity Developed ex US Large Index (Net) is January 31, 2024. The fund began tracking the index on June 21, 2024.
Statistics
Net Assets (millions) |
$26,178 |
Number of Holdings (excludes derivatives) |
889 |
Portfolio Turnover Rate (not annualized; excludes in-kind transactions) |
10% |
Weighted Average Market Cap (millions) |
$143,363 |
Price/Earnings Ratio (P/E) |
14.5 |
Price/Book Ratio (P/B) |
1.6 |
Sector Weightings % of Investments1
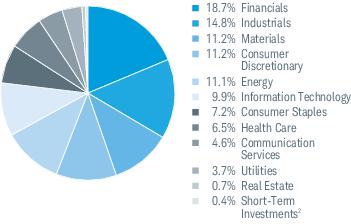
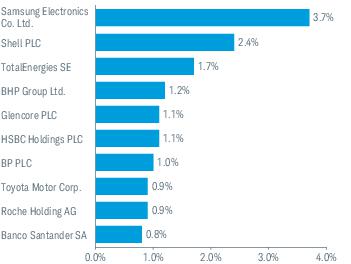
Top Equity Holdings % of Net Assets
Country Weightings % of Investments
1
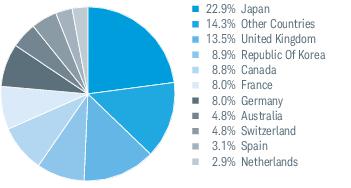
Portfolio holdings may have changed since the report date.
The Sector/Industry classifications in this report use the Global Industry Classification Standard (GICS)
which
was developed by and is the exclusive property of MSCI Inc. (MSCI) and Standard & Poor’s (S&P). GICS is a service mark of MSCI and S&P and has been licensed for use by Charles Schwab & Co., Inc.
1
Excludes derivatives.
2
Includes the fund’s position(s) in money market mutual funds registered under the Investment Company Act of 1940, as amended.
Top Equity Holdings % of Net Assets
Portfolio holdings may have changed since the report date.
FUND COSTS FOR THE LAST six months ENDED August 31, 2026 (BASED ON A HYPOTHETICAL $10,000 INVESTMENT)
COSTS OF A $10,000 INVESTMENT |
COSTS PAID AS A PERCENTAGE OF A $10,000 INVESTMENT | |
Schwab Fundamental International Small Equity ETF |
$20 |
0.39% * |
*
Annualized.
Average Annual Total Returns
Fund and Inception Date |
6 Months |
1 Year |
5 Years |
10 Years |
Fund: Schwab Fundamental International Small Equity ETF (08/15/2013)1,2,3 |
1.93% |
21.47% |
8.44% |
9.01% |
MSCI EAFE® Index (Net)4,5 |
3.38% |
21.62% |
9.35% |
9.54% |
RAFI Fundamental High Liquidity Developed ex US Small Index (Net)4,6 |
1.97% |
21.69% |
N/A |
N/A |
Fundamental Developed ex US Small Spliced Index |
1.97% |
21.69% |
8.70% |
9.26% |
S&P Developed ex-U.S. Small Cap Index (Net)4 |
-0.22% |
18.37% |
4.99% |
8.10% |
All total returns on this page assume dividends and distributions were reinvested. Index figures do not include trading and management costs, which would lower
performance. Indices are unmanaged and cannot be invested in directly. Performance results less than one year are not annualized.
For index definitions, please see www.schwabassetmanagement.com/glossary.
Shares are bought and sold at market price, which may be higher or lower than the net asset value (NAV). Brokerage commissions will reduce returns.
Index ownership — The RAFI Fundamental High Liquidity Developed ex US Small Index (the Index) is a service mark of RAFI Indices, LLC or its affiliates (collectively, RAFI) and
has been licensed for use by Charles Schwab Investment Management, Inc. The intellectual and other property rights to the Index are owned by or licensed to RAFI. The
Schwab Fundamental International Small Equity ETF is not sponsored, endorsed, sold or promoted by RAFI, its agents or service providers (collectively, the RAFI Parties). The
RAFI Parties: (i) make no representation or warranty as to the results to be obtained from the use of the Index or otherwise; and (ii) shall not be liable (whether in negligence
or otherwise) to any person for any error in the Index. For full disclaimer, please see the fund’s statement of additional information.
1
Performance does not reflect the deduction of taxes that a shareholder would pay on fund distributions or on the redemption or sale of fund shares.
2
Performance is shown on a NAV basis. The fund’s per share NAV is the value of one share of the fund. NAV is calculated by taking the fund’s total assets (including the fair
value of securities owned), subtracting liabilities, and dividing by the number of shares outstanding. Returns assume that dividends and capital gain distributions have been
reinvested in the fund at NAV.
3
The fund’s performance relative to the index may be affected by fair-value pricing and timing differences in foreign exchange calculations.
4
The net version of the index reflects reinvested dividends net of withholding taxes but reflects no deductions for expenses or other taxes.
5
The MSCI EAFE
®
Index (Net) serves as the fund’s regulatory index and provides a broad measure of market performance. The fund generally invests in securities that are
included in the RAFI Fundamental High Liquidity Developed ex US Small Index (Net). The fund does not seek to track the regulatory index.
6
The inception date of the RAFI Fundamental High Liquidity Developed ex US Small Index (Net) is January 31, 2024. The fund began tracking the index on June 21, 2024.
Statistics
Net Assets (millions) |
$3,183 |
Number of Holdings (excludes derivatives) |
1,571 |
Portfolio Turnover Rate (not annualized; excludes in-kind transactions) |
13% |
Weighted Average Market Cap (millions) |
$6,658 |
Price/Earnings Ratio (P/E) |
14.6 |
Price/Book Ratio (P/B) |
1.4 |
Sector Weightings % of Investments1
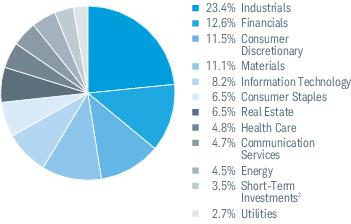
Top Equity Holdings % of Net Assets
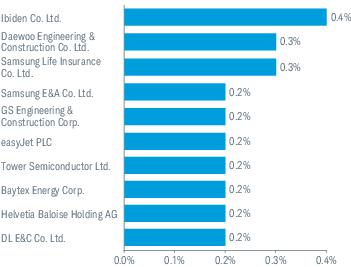
Country Weightings % of Investments
1
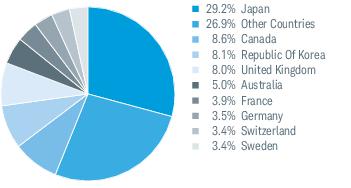
Portfolio holdings may have changed since the report date.
The Sector/Industry classifications in this report use the Global Industry Classification Standard (GICS) which was developed by and is the exclusive property of MSCI Inc.
(MSCI) and Standard & Poor’s (S&P). GICS is a service mark of MSCI and S&P and has been licensed for use by Charles Schwab & Co., Inc.
1
Excludes derivatives.
2
Includes the fund’s position(s) in money market mutual funds registered under the Investment Company Act of 1940, as amended.
Top Equity Holdings % of Net Assets
Portfolio holdings may have changed since the report date.
FUND COSTS FOR THE LAST six months ENDED August 31, 2026 (BASED ON A HYPOTHETICAL $10,000 INVESTMENT)
COSTS OF A $10,000 INVESTMENT |
COSTS PAID AS A PERCENTAGE OF A $10,000 INVESTMENT | |
Schwab Fundamental Emerging Markets Equity ETF |
$20 |
0.39% * |
*
Annualized.
Average Annual Total Returns
Fund and Inception Date |
6 Months |
1 Year |
5 Years |
10 Years |
Fund: Schwab Fundamental Emerging Markets Equity ETF (08/15/2013)1,2,3 |
4.90% |
28.60% |
10.35% |
10.17% |
MSCI Emerging Markets Index (Net)4,5 |
8.05% |
39.25% |
8.18% |
9.29% |
RAFI Fundamental High Liquidity Emerging Markets Index (Net)4,6 |
4.95% |
29.03% |
N/A |
N/A |
Fundamental Emerging Markets Spliced Index |
4.95% |
29.03% |
10.70% |
10.63% |
All total returns on this page assume dividends and distributions were reinvested. Index figures do not include trading and management costs, which would lower
performance. Indices are unmanaged and cannot be invested in directly. Performance results less than one year are not annualized.
For index definitions, please see www.schwabassetmanagement.com/glossary.
Shares are bought and sold at market price, which may be higher or lower than the net asset value (NAV). Brokerage commissions will reduce returns.
Index ownership — The RAFI Fundamental High Liquidity Emerging Markets Index (the Index) is a service mark of RAFI Indices, LLC or its affiliates (collectively, RAFI) and has
been licensed for use by Charles Schwab Investment Management, Inc. The intellectual and other property rights to the Index are owned by or licensed to RAFI. The Schwab
Fundamental Emerging Markets Equity ETF is not sponsored, endorsed, sold or promoted by RAFI, its agents or service providers (collectively, the RAFI Parties). The RAFI
Parties: (i) make no representation or warranty as to the results to be obtained from the use of the Index or otherwise; and (ii) shall not be liable (whether in negligence or
otherwise) to any person for any error in the Index. For full disclaimer, please see the fund’s statement of additional information.
1
Performance does not reflect the deduction of taxes that a shareholder would pay on fund distributions or on the redemption or sale of fund shares.
2
Performance is shown on a NAV basis. The fund’s per share NAV is the value of one share of the fund. NAV is calculated by taking the fund’s total assets (including the fair
value of securities owned), subtracting liabilities, and dividing by the number of shares outstanding. Returns assume that dividends and capital gain distributions have been
reinvested in the fund at NAV.
3
The fund’s performance relative to the index may be affected by fair-value pricing and timing differences in foreign exchange calculations.
4
The net version of the index reflects reinvested dividends net of withholding taxes but reflects no deductions for expenses or other taxes.
5
The MSCI Emerging Markets Index (Net) serves as the fund’s regulatory index and provides a broad measure of market performance. The fund generally invests in securities
that are included in the RAFI Fundamental High Liquidity Emerging Markets Index (Net). The fund does not seek to track the regulatory index.
6
The inception date of the RAFI Fundamental High Liquidity Emerging Markets Index (Net) is January 31, 2024. The fund began tracking the index on June 21, 2024.
Statistics
Net Assets (millions) |
$10,339 |
Number of Holdings (excludes derivatives) |
364 |
Portfolio Turnover Rate (not annualized; excludes in-kind transactions) |
8% |
Weighted Average Market Cap (millions) |
$208,078 |
Price/Earnings Ratio (P/E) |
11.2 |
Price/Book Ratio (P/B) |
1.4 |
Sector Weightings % of Investments1
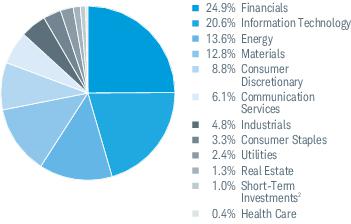
Top Equity Holdings % of Net Assets
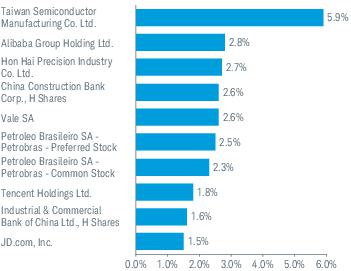
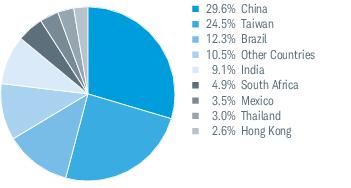
Country Weightings % of Investments
1
Portfolio holdings may have changed since the report date.
The Sector/Industry classifications in this report use the Global Industry Classification Standard (GICS) which was developed by and is the exclusive property of MSCI Inc.
(MSCI) and Standard & Poor’s (S&P). GICS is a service mark of MSCI and S&P and has been licensed for use by Charles Schwab & Co., Inc.
1
Excludes derivatives.
2
Includes the fund’s position(s) in money market mutual funds registered under the Investment Company Act of 1940, as
amended
.Top Equity Holdings % of Net Assets
Portfolio holdings may have changed since the report date.
| [1] | Annualized. |