Shareholder Report
|
12 Months Ended |
|
Aug. 31, 2026
USD ($)
Holding
|
|---|
| Shareholder Report [Line Items] |
|
| Document Type |
N-CSR
|
| Amendment Flag |
false
|
| Registrant Name |
Vanguard CMT Funds
|
| Entity Central Index Key |
0001273878
|
| Entity Investment Company Type |
N-1A
|
| Document Period End Date |
Aug. 31, 2026
|
| Shareholder Report Annual or Semi-Annual |
Annual Shareholder Report
|
| C000007079 |
|
| Shareholder Report [Line Items] |
|
| Fund Name |
Municipal Low Duration Fund
|
| Class Name |
Investor Shares
|
| No Trading Symbol [Flag] |
true
|
| Annual or Semi-Annual Statement [Text Block] |
This annual shareholder report contains important information about Vanguard Municipal Low Duration Fund (the "Fund") for the period of September 1, 2025, to August 31, 2026.
|
| Additional Information [Text Block] |
You can find additional information about the Fund at https://personal1.vanguard.com/ngf-next-gen-form-webapp/fund-literature. You can also request this information by contacting us at 800-662-7447.
|
| Additional Information Phone Number |
<span style="white-space: nowrap; box-sizing: border-box; color: rgb(0, 0, 0); display: inline; flex-wrap: nowrap; font-size: 10.6667px; font-weight: 400; grid-area: auto; line-height: 16px; margin: 0px; overflow: visible; text-align: left; text-align-last: auto;"> 800-662-7447</span>
|
| Additional Information Website |
<span style="white-space: nowrap; box-sizing: border-box; color: rgb(0, 0, 0); display: inline; flex-wrap: nowrap; font-size: 10.6667px; font-weight: 400; grid-area: auto; line-height: 16px; margin: 0px; overflow: visible; text-align: left; text-align-last: auto;"> <span style="box-sizing: border-box; color: rgb(0, 0, 0); display: inline; flex-wrap: nowrap; font-size: 10.6667px; font-weight: 400; grid-area: auto; line-height: 16px; margin: 0px; overflow: visible; text-align: left; text-align-last: auto; white-space-collapse: collapse;"><span style="text-decoration: underline; box-sizing: border-box; color: rgb(0, 0, 0); display: inline; flex-wrap: nowrap; font-size: 10.6667px; font-weight: 400; grid-area: auto; line-height: 16px; margin: 0px; overflow: visible; text-align: left; text-align-last: auto; white-space-collapse: collapse;">https://personal1.vanguard.com/ngf-next-gen-form-webapp/fund-literature</span></span></span>
|
| Expenses [Text Block] |
What were the Fund costs for the last year?(based on a hypothetical $10,000 investment) Table SummaryShare Class Name | Costs of a $10,000 investment | Costs paid as a percentage of a $10,000 investment |
|---|
Investor Shares | $1 | 0.01% |
|---|
|
| Expenses Paid, Amount |
$ 1
|
| Expense Ratio, Percent |
0.01%
|
| Factors Affecting Performance [Text Block] |
How did the Fund perform during the reporting period? For the 12 months ended August 31, 2026, the Fund outperformed its benchmark. Global equities posted strong returns, while global bonds struggled. Resilient growth and corporate earnings supported stocks, though shifting U.S. trade policy and persistent inflation fueled volatility, as did Middle East tensions that disrupted energy supplies and raised oil prices. Some central banks, including those in the United States and the United Kingdom, lowered rates. However, developed-market government bond yields generally rose amid concerns about borrowing, inflation, and monetary policy. The broad U.S. investment-grade bond market returned 1.84%, as measured by the Bloomberg U.S. Aggregate Float Adjusted Index. The Fund’s advisor uses a top-down investment management approach to select a variety of high-quality, short-term municipal securities. The Fund benefited from having a shorter duration than its peer-group average.
|
| Performance Past Does Not Indicate Future [Text] |
Keep in mind that the Fund's past performance does not indicate how the Fund will perform in the future.
|
| Line Graph [Table Text Block] |
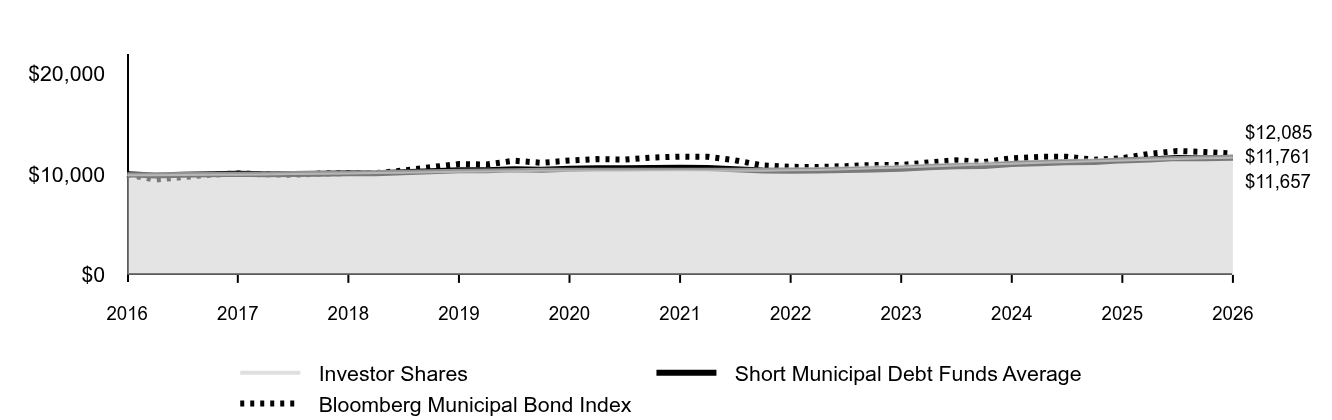 Table Summary | Investor Shares | Short Municipal Debt Funds Average | Bloomberg Municipal Bond Index |
|---|
2016 | $10,000 | $10,000 | $10,000 |
|---|
2016 | $10,015 | $9,887 | $9,479 |
|---|
2017 | $10,032 | $9,964 | $9,720 |
|---|
2017 | $10,052 | $10,019 | $9,968 |
|---|
2017 | $10,072 | $10,067 | $10,088 |
|---|
2017 | $10,094 | $10,012 | $10,008 |
|---|
2018 | $10,123 | $10,032 | $9,963 |
|---|
2018 | $10,160 | $10,056 | $10,079 |
|---|
2018 | $10,193 | $10,104 | $10,138 |
|---|
2018 | $10,233 | $10,113 | $10,121 |
|---|
2019 | $10,272 | $10,214 | $10,375 |
|---|
2019 | $10,315 | $10,307 | $10,724 |
|---|
2019 | $10,354 | $10,405 | $11,022 |
|---|
2019 | $10,387 | $10,416 | $10,980 |
|---|
2020 | $10,417 | $10,512 | $11,356 |
|---|
2020 | $10,448 | $10,470 | $11,151 |
|---|
2020 | $10,452 | $10,565 | $11,378 |
|---|
2020 | $10,454 | $10,597 | $11,518 |
|---|
2021 | $10,456 | $10,608 | $11,476 |
|---|
2021 | $10,457 | $10,645 | $11,679 |
|---|
2021 | $10,458 | $10,660 | $11,765 |
|---|
2021 | $10,459 | $10,634 | $11,745 |
|---|
2022 | $10,461 | $10,505 | $11,401 |
|---|
2022 | $10,471 | $10,388 | $10,885 |
|---|
2022 | $10,499 | $10,369 | $10,749 |
|---|
2022 | $10,545 | $10,388 | $10,730 |
|---|
2023 | $10,618 | $10,429 | $10,819 |
|---|
2023 | $10,699 | $10,495 | $10,939 |
|---|
2023 | $10,791 | $10,567 | $10,932 |
|---|
2023 | $10,888 | $10,697 | $11,189 |
|---|
2024 | $10,974 | $10,813 | $11,406 |
|---|
2024 | $11,070 | $10,829 | $11,231 |
|---|
2024 | $11,160 | $11,040 | $11,598 |
|---|
2024 | $11,251 | $11,110 | $11,741 |
|---|
2025 | $11,318 | $11,196 | $11,743 |
|---|
2025 | $11,404 | $11,227 | $11,459 |
|---|
2025 | $11,476 | $11,391 | $11,607 |
|---|
2025 | $11,555 | $11,472 | $12,050 |
|---|
2026 | $11,616 | $11,618 | $12,326 |
|---|
2026 | $11,690 | $11,613 | $12,223 |
|---|
2026 | $11,761 | $11,657 | $12,085 |
|---|
|
| Average Annual Return [Table Text Block] |
Table Summary | 1 Year | 5 Years | 10 Years |
|---|
Investor Shares | 2.48% | 2.38% | 1.64% |
|---|
Short Municipal Debt Funds Average | 2.34% | 1.80% | 1.55% |
|---|
Bloomberg Municipal Bond Index | 4.12% | 0.54% | 1.91% |
|---|
|
| No Deduction of Taxes [Text Block] |
The graph and returns shown do not reflect taxes that a shareholder would pay on fund distributions or on the sale of fund shares.
|
| Updated Performance Information Location [Text Block] |
Updated performance information is available on our website at vanguard.com/performance or by calling Vanguard toll-free at 800-662-7447.
|
| AssetsNet |
$ 5,356,000,000
|
| Holdings Count | Holding |
334
|
| Advisory Fees Paid, Amount |
$ 542,000
|
| InvestmentCompanyPortfolioTurnover |
37.00%
|
| Additional Fund Statistics [Text Block] |
Fund Statistics
(as of August 31, 2026)Table SummaryFund Net Assets (in millions) | $5,356 |
|---|
Number of Portfolio Holdings | 334 |
|---|
Portfolio Turnover Rate | 37% |
|---|
Total Investment Advisory Fees (in thousands) | $542 |
|---|
|
| Holdings [Text Block] |
Distribution by Effective Maturity % of Net Assets
(as of August 31, 2026) Table Summary1 to 7 Days | 87.3% |
|---|
8 to 30 Days | 0.4% |
|---|
31 to 60 Days | 0.3% |
|---|
61 to 90 Days | 0.7% |
|---|
91 to 180 Days | 1.6% |
|---|
Over 180 Days | 3.2% |
|---|
Other Assets and Liabilities—Net | 6.5% |
|---|
This table reflects the Fund's investments, including short-term investments and other assets and liabilities. |
| Material Fund Change [Text Block] |
|
| Updated Prospectus Phone Number |
800-662-7447
|
| Updated Prospectus Web Address |
https://personal1.vanguard.com/ngf-next-gen-form-webapp/fund-literature
|
| C000007078 |
|
| Shareholder Report [Line Items] |
|
| Fund Name |
Market Liquidity Fund
|
| Class Name |
Investor Shares
|
| No Trading Symbol [Flag] |
true
|
| Annual or Semi-Annual Statement [Text Block] |
This annual shareholder report contains important information about Vanguard Market Liquidity Fund (the "Fund") for the period of September 1, 2025, to August 31, 2026.
|
| Additional Information [Text Block] |
You can find additional information about the Fund at https://personal1.vanguard.com/ngf-next-gen-form-webapp/fund-literature. You can also request this information by contacting us at 800-662-7447.
|
| Additional Information Phone Number |
<span style="white-space: nowrap; box-sizing: border-box; color: rgb(0, 0, 0); display: inline; flex-wrap: nowrap; font-size: 10.6667px; font-weight: 400; grid-area: auto; line-height: 16px; margin: 0px; overflow: visible; text-align: left; text-align-last: auto;"> 800-662-7447</span>
|
| Additional Information Website |
<span style="white-space: nowrap; box-sizing: border-box; color: rgb(0, 0, 0); display: inline; flex-wrap: nowrap; font-size: 10.6667px; font-weight: 400; grid-area: auto; line-height: 16px; margin: 0px; overflow: visible; text-align: left; text-align-last: auto;"> <span style="box-sizing: border-box; color: rgb(0, 0, 0); display: inline; flex-wrap: nowrap; font-size: 10.6667px; font-weight: 400; grid-area: auto; line-height: 16px; margin: 0px; overflow: visible; text-align: left; text-align-last: auto; white-space-collapse: collapse;"><span style="text-decoration: underline; box-sizing: border-box; color: rgb(0, 0, 0); display: inline; flex-wrap: nowrap; font-size: 10.6667px; font-weight: 400; grid-area: auto; line-height: 16px; margin: 0px; overflow: visible; text-align: left; text-align-last: auto; white-space-collapse: collapse;">https://personal1.vanguard.com/ngf-next-gen-form-webapp/fund-literature</span></span></span>
|
| Expenses [Text Block] |
What were the Fund costs for the last year?(based on a hypothetical $10,000 investment) Table SummaryShare Class Name | Costs of a $10,000 investment | Costs paid as a percentage of a $10,000 investment |
|---|
Investor Shares | $1 | 0.005% |
|---|
|
| Expenses Paid, Amount |
$ 1
|
| Expense Ratio, Percent |
0.005%
|
| AssetsNet |
$ 115,692,000,000
|
| Holdings Count | Holding |
316
|
| Advisory Fees Paid, Amount |
$ 5,664,000
|
| Additional Fund Statistics [Text Block] |
Fund Statistics
(as of August 31, 2026)Table SummaryFund Net Assets (in millions) | $115,692 |
|---|
Number of Portfolio Holdings | 316 |
|---|
Total Investment Advisory Fees (in thousands) | $5,664 |
|---|
|
| Holdings [Text Block] |
Distribution by Effective Maturity % of Net Assets
(as of August 31, 2026) Table Summary1 to 7 Days | 54.2% |
|---|
8 to 30 Days | 24.6% |
|---|
31 to 60 Days | 6.2% |
|---|
61 to 90 Days | 6.5% |
|---|
91 to 180 Days | 9.6% |
|---|
Other Assets and Liabilities—Net | (1.1%) |
|---|
This table reflects the Fund's investments, including short-term investments and other assets and liabilities. |
| Material Fund Change [Text Block] |
|
| Updated Prospectus Phone Number |
800-662-7447
|
| Updated Prospectus Web Address |
https://personal1.vanguard.com/ngf-next-gen-form-webapp/fund-literature
|