Q3 Business Update November 2, 2026
Forward -Looking Statements This communication contains certain forward -looking statements within the meaning of the federal securities laws of the United S tates. The Company intends such forward -looking statements to be covered by the safe harbor provisions for forward -looking state ments contained in the Private Securities Litigation Reform Act of 1995 and includes this statement for purposes of complying with these safe harbor provisions. Any st ate ments made in this communication that are not statements of historical fact, such as, statements about the Company’s beliefs and expectations regarding its future results of operations and financial position, its planned business model and strategy, its data center development, timing and likelihoo d o f success, capacity, functionality and timing of operation of data centers, expectations regarding the operations of data cen ters, potential strategic initiatives, such as joint ventures and partnerships, and management plans and objectives, are forward -looking statements and should be evaluated as such. These for ward - looking statements generally are identified by the words “may,” “will,” “should,” “expects,” “plans,” “anticipates,” “could ,” “seeks,” “intends,” “targets,” “projects,” “contemplates,” “believes,” “estimates,” “strategy,” “future,” “forecasts,” “opportunity,” “predicts,” “potential,” “would,” “will likely result,” “continue,” and similar expressions (including the negative versions of such words or expressions). These forward -looking statements are based upon estimates and assumptions that, while considered reasonable by Cipher and its ma nagement, are inherently uncertain. Such forward -looking statements are subject to risks, uncertainties, and other factors that could cause actual results to differ materially from those expressed or implied by such forward looking statements. New risks and uncertainties may emerge from time to time, an d it is not possible to predict all risks and uncertainties. Many factors could cause actual future events to differ material ly from the forward -looking statements in this communication, including but not limited to: volatility in the price of Cipher’s securities due to a variety of factors, incl uding changes in the competitive and regulated industry in which Cipher operates, Cipher’s evolving business model and strategy and efforts it may make to modify aspects of its business model or engage in various strategic initiatives, variations in performance across competitors, changes in laws and regulatio ns affecting Cipher’s business, the ability of Cipher’s customers, tenants, and other counterparties to perform their contractua l obligations, the ability to Cipher to complete its data centers and future strategic growth initiatives in a timely manner or within anticipated cost estimates, risks relating to th e d evelopment, construction, and operation of Cipher’s data centers, the availability of capital and financing on acceptable ter ms, changes in market demand, and the ability to implement business plans, forecasts, and other expectations and to identify and realize additional opportunities. The foregoing list of factors is not exhaustive. You should carefully consider the foregoing factors and the other risks and uncertainties described in the “Risk Factors” section of Cipher’s Annual Report on Form 10 -K for the fiscal year ended December 31, 2025, filed with the Securities and Exchange Commission (“SEC”) on February 24, 2026, Cipher’s Quarterly Report on Form 10 -Q for the quarterly period ended June 30, 2026, filed with the SEC on August 4, 2026, Ciph er’s Quarterly Report on Form 10 -Q for the quarterly period ended September 30, 2026 to be filed with the SEC, and in Cipher’s subsequent filings with the SEC. These filings identify and address other important risks and uncertainties that co uld cause actual events and results to differ materially from those contained in the forward -looking statements. Forward -looking statements speak only as of the date they are made. Readers are cautioned not to put undue reliance on forward -looking statements, and Cipher assumes no obligation and, except as required by law, does not intend to update or revise these forward -looking statements, whether as a result of new information, future events, or otherwise. Website Disclosure The Company maintains a dedicated investor website at https://investors.cipherdigital.com/investors (“Investors’ Website”). Financial and other important information regarding the Company is routinely posted on and accessible through the Investors’ Website. Cipher uses its Investors’ Website as a distribution channel of material information about the Company, including through press releases, investor presentations, rep orts and notices of upcoming events. Cipher intends to utilize its Investors’ Website as a channel of distribution to reach publ ic investors and as a means of disclosing material non - public information for complying with disclosure obligations under Regulation FD. In addition, you may sign up to automatical ly receive email alerts and other information about the Company by visiting the “Email Alerts” option under the Investors Resour ces section of Cipher’s Investors’ Website and submitting your email address. Non -GAAP Financial Measures This communication includes supplemental financial measures Adjusted EBITDA, that excludes the impact of ( i) interest income, (ii) interest expense, (iii) income taxes, (iv) depreciation and amortization, (v) the non -cash change in fai r value of derivative asset, (vi) share -based compensation expense, (vii) nonrecurring gains and losses, (viii) the non -cash change in fair value of warrant liability, (ix) non -cash losses related to mi ners reclassified as held for sale, (x) impairment of long -lived assets, and (xi) non -cash disposal of miners. Beginning with the three months ended March 31, 2026, the Company changed its primary non -GAAP performance from "Adjusted Earnin gs (Loss)" to Adjusted EBITDA. Adjusted EBITDA differs from Adjusted Earnings (Loss) only in that, in addition to the adjustm ent s previously made to compute Adjusted Earnings (Loss), Adjusted EBITDA also excludes interest expense, interest income, and current income tax expense. We believe Adj usted EBITDA is more representative of the Company's core operating performance, more comparable to measures used by industry pe ers, and more useful to investors evaluating our underlying business. The reconciliation table below presents Adjusted EBITDA for both periods presented under the Company’s new methodology. The Company does not intend to report Adjusted Earnings (Loss) in future periods. These supplemental financial measures are not measurements of financial performance under accounting principles generally acc ept ed in the United States (“GAAP”) and, as a result, these supplemental financial measures may not be comparable to similarly t itled measures of other companies. Management uses these non -GAAP financial measures internally to help understand, manage, and evaluate our business performance and to help make operating decisions. We believe the use of these non -GAAP financial measures can also facilitate comparison of our operatin g results to those of our competitors by excluding certain items that vary in our industry based on company policy. Non -GAAP financial measures are subject to material limitations as they are not in accordance with, or a substitute for, measure ments prepared in accordance with GAAP. For example, we expect that share -based compensation expense, which is excluded from the non -GAAP financial measure, will continue to be a significant recurring expense over the coming years and is an important part of the compensation provided to certain emp loyees, officers and directors. Similarly, we expect that depreciation and amortization will continue to be a recurring expense over the term of the useful life of the related assets. Our non -GAAP financial measures are not meant to be considered in isolation and should be read only in conjunction with our cond ensed consolidated financial statements included elsewhere in this communication, which have been prepared in accordance with GA AP. We rely primarily on such condensed consolidated financial statements to understand, manage and evaluate our business performance and use the non -GAAP financial mea sures only supplementally. The contents and appearance of this presentation is copyrighted and the trademarks and service marks are owned by Cipher Digital Inc. All rights reserved. 2
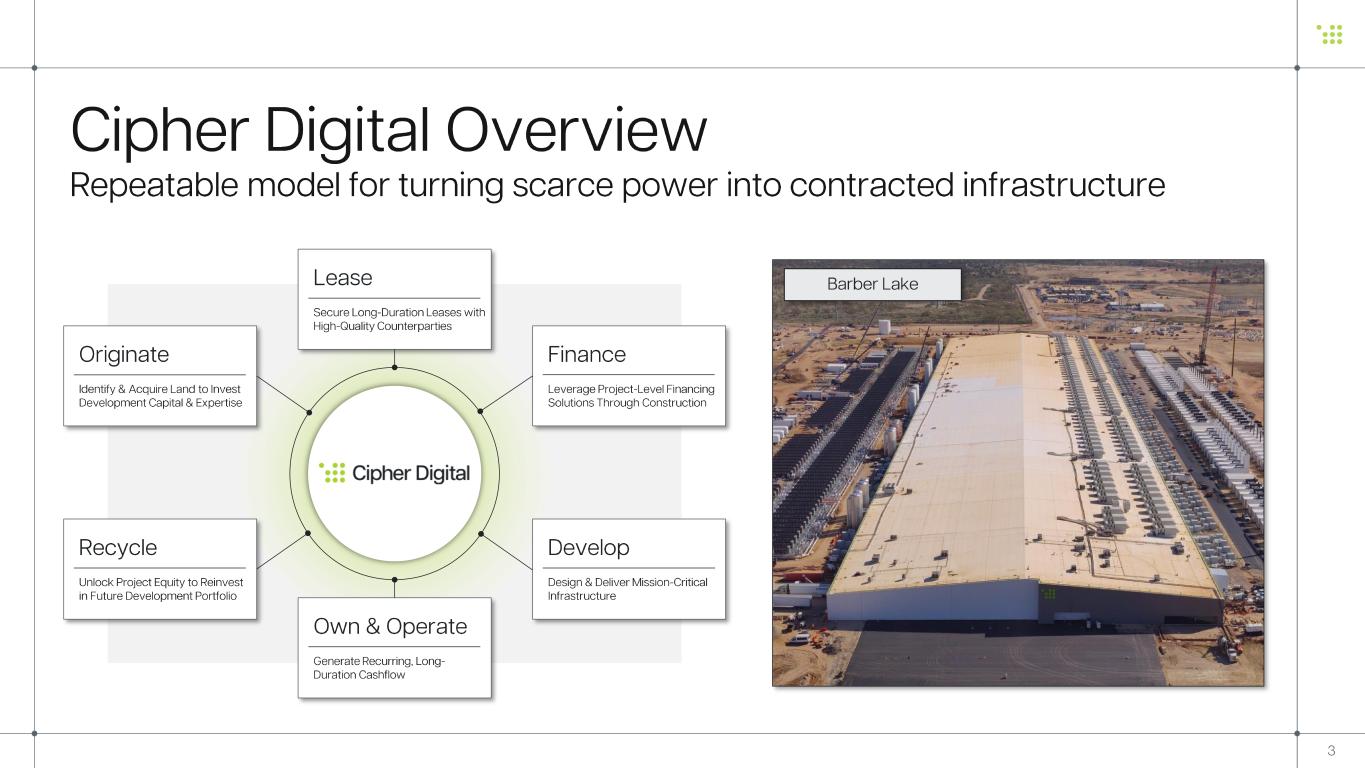
3 Cipher Digital Overview Repeatable model for turning scarce power into contracted infrastructure Barber LakeLease Secure Long -Duration Leases with High -Quality Counterparties Own & Operate Generate Recurring, Long - Duration Cashflow Finance Leverage Project -Level Financing Solutions Through Construction Develop Design & Deliver Mission -Critical Infrastructure Originate Identify & Acquire Land to Invest Development Capital & Expertise Recycle Unlock Project Equity to Reinvest in Future Development Portfolio
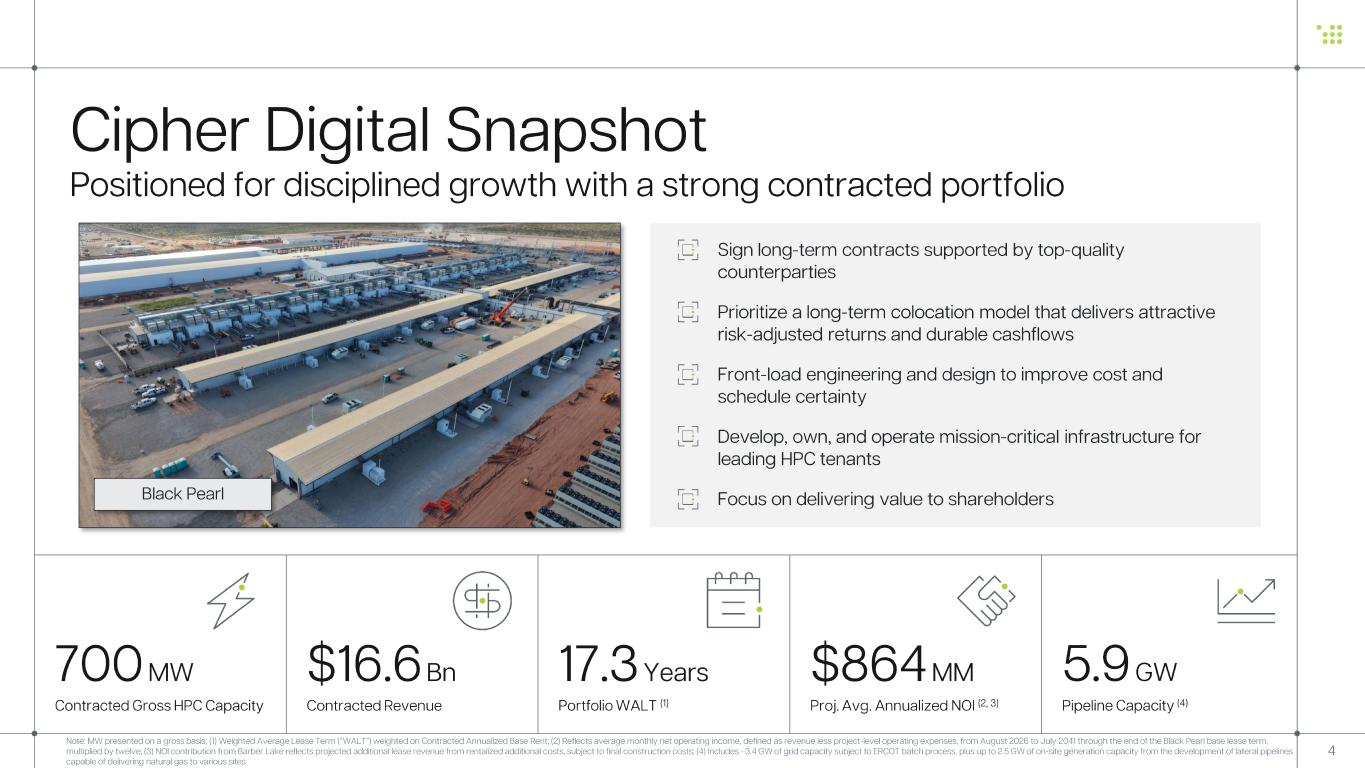
Sign long -term contracts supported by top -quality counterparties Prioritize a long -term colocation model that delivers attractive risk -adjusted returns and durable cashflows Front -load engineering and design to improve cost and schedule certainty Develop, own, and operate mission -critical infrastructure for leading HPC tenants Focus on delivering value to shareholders 17.3 Years Portfolio WALT (1) $16.6 Bn Contracted Revenue $864 MM Proj. Avg. Annualized NOI (2, 3) 700 MW Contracted Gross HPC Capacity 4 Cipher Digital Snapshot Positioned for disciplined growth with a strong contracted portfolio Note: MW presented on a gross basis; (1) Weighted Average Lease Term (“WALT”) weighted on Contracted Annualized Base Rent; (2) Reflects average monthly net operating income, defined as revenue les s p roject -level operating expenses, from August 2026 to July 2041 through the end of the Black Pearl base lease term, multiplied by twelve; (3) NOI contribution from Barber Lake reflects projected additional lease revenue from rentalized additional costs, subject to final construction costs ; (4) Includes ~3.4 GW of grid capacity subject to ERCOT batch process, plus up to 2.5 GW of on -site generation capacity from the development of lateral pipelines capable of delivering natural gas to various sites Black Pearl 5.9 GW Pipeline Capacity (4)
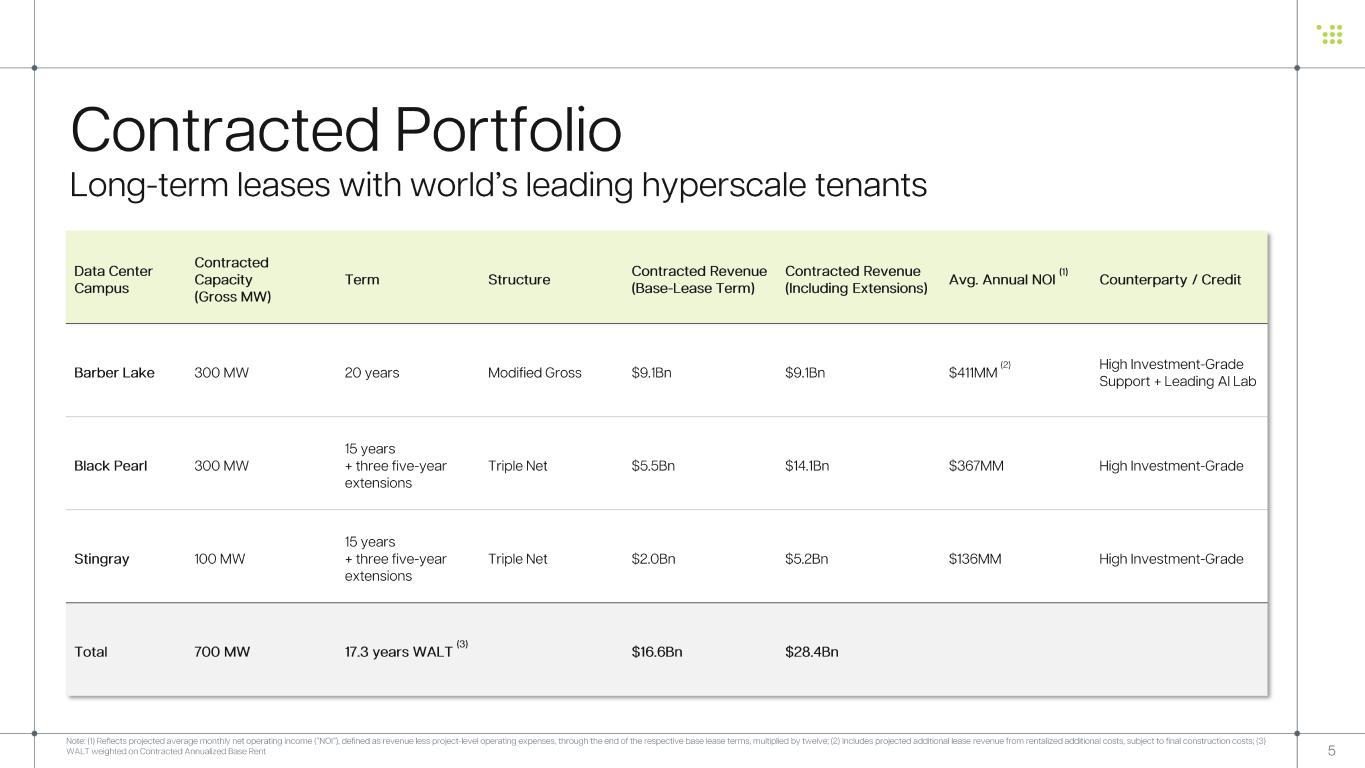
5 Note: (1) Reflects projected average monthly net operating income (“NOI”), defined as revenue less project -level operating expen ses, through the end of the respective base lease terms, multiplied by twelve; (2) Includes projected additional lease revenu e from rentalized additional costs , subject to final construction costs ; (3) WALT weighted on Contracted Annualized Base Rent Data Center Campus Contracted Capacity (Gross MW) Term Structure Contracted Revenue (Base -Lease Term) Contracted Revenue (Including Extensions) Avg. Annual NOI (1) Counterparty / Credit Barber Lake 300 MW 20 years Modified Gross $9.1Bn $9.1Bn $411MM (2) High Investment -Grade Support + Leading AI Lab Black Pearl 300 MW 15 years + three five -year extensions Triple Net $5.5Bn $14.1Bn $367MM High Investment -Grade Stingray 100 MW 15 years + three five -year extensions Triple Net $2.0Bn $5.2Bn $136MM High Investment -Grade Total 700 MW 17.3 years WALT (3) $16.6Bn $28.4Bn Contracted Portfolio Long -term leases with world’s leading hyperscale tenants
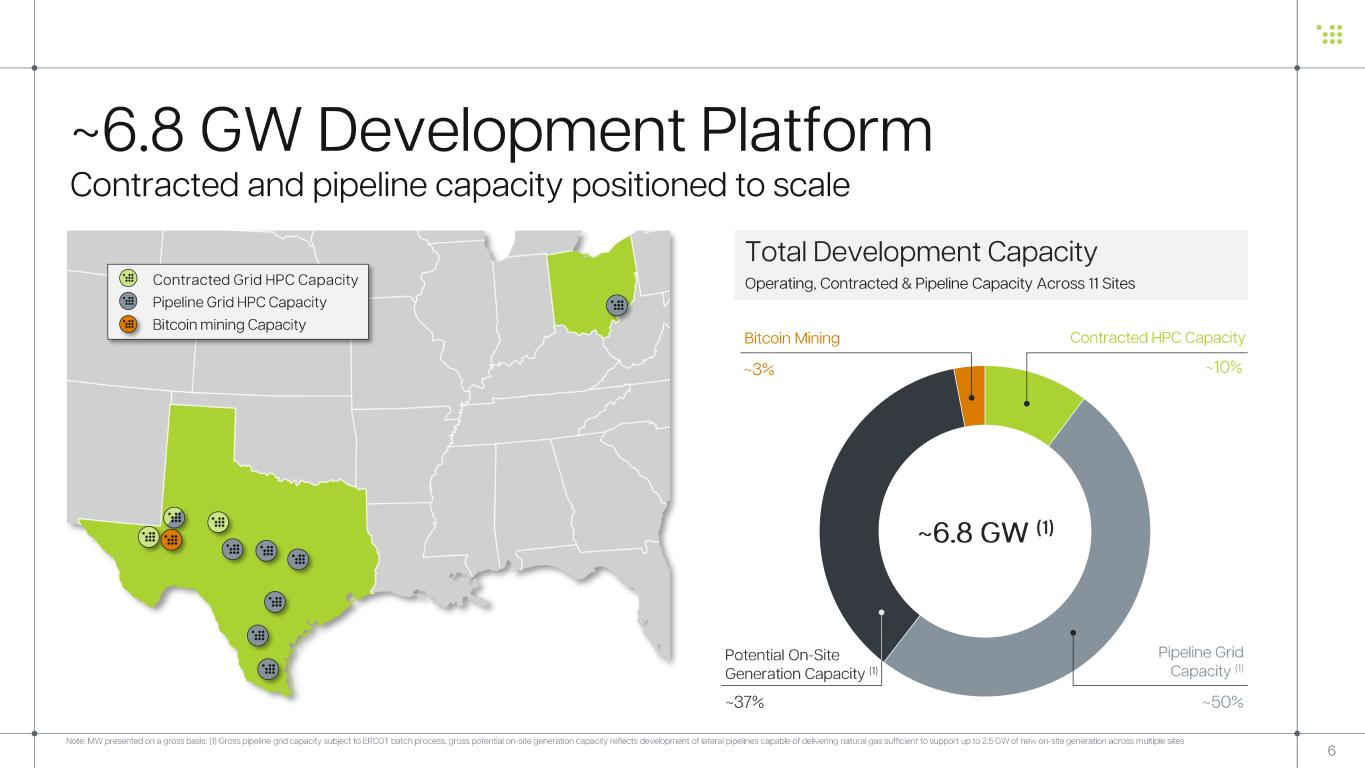
6 Note: MW presented on a gross basis; (1) Gross pipeline grid capacity subject to ERCOT batch process, gross potential on -site ge neration capacity reflects development of lateral pipelines capable of delivering natural gas sufficient to support up to 2.5 GW of new on -site generation across multiple sites • Contracted Grid HPC C apacity • Pipeline Grid HPC C apacity • Bitcoin mining C apacity ~6.8 GW Development Platform Contracted and pipeline capacity positioned to scale Total Development Capacity Operating, Contracted & Pipeline Capacity Across 11 Sites ~10% ~50%~37% ~3% Contracted HPC Capacity Pipeline Grid Capacity (1) Bitcoin Mining ~6.8 GW (1) Potential On -Site Generation Capacity (1)
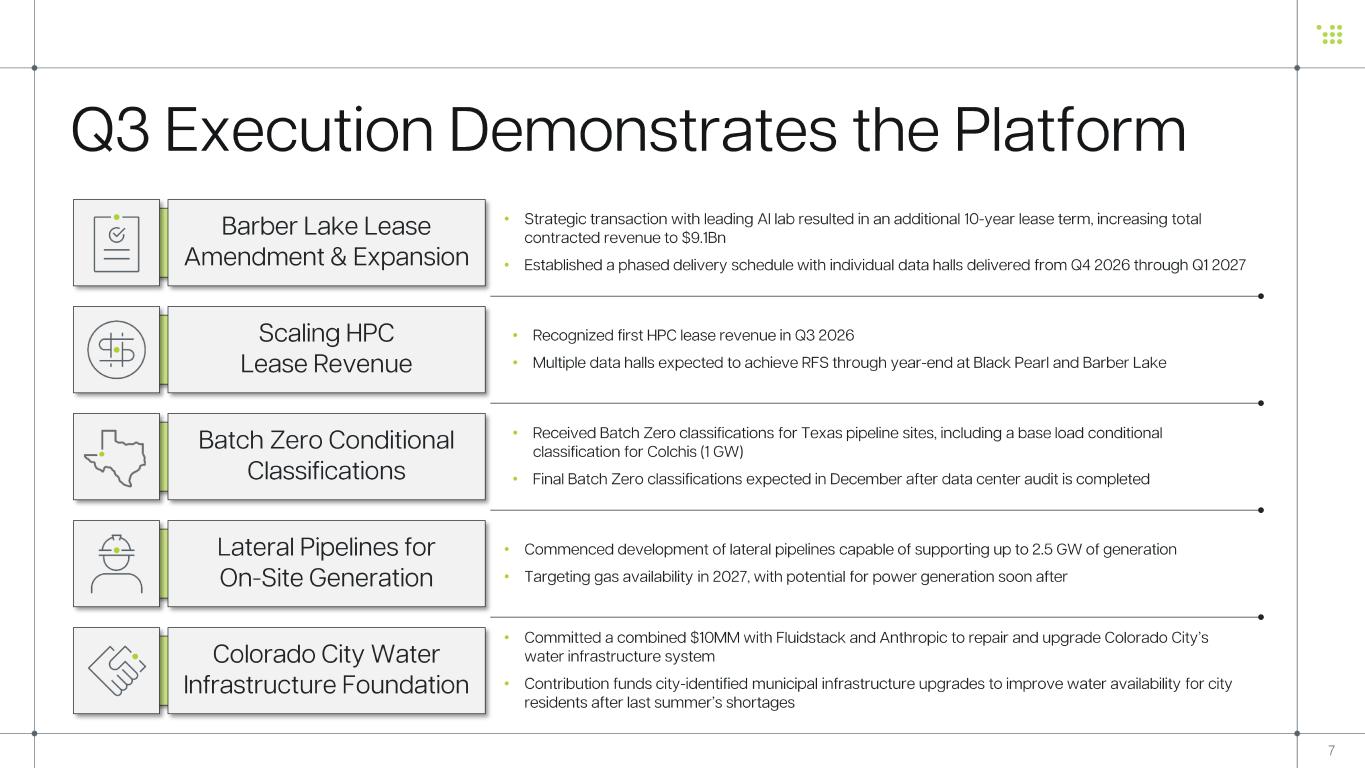
7 Q3 Execution Demonstrates the Platform Barber Lake Lease Amendment & Expansion Scaling HPC Lease Revenue Colorado City Water Infrastructure Foundation • Strategic transaction with leading AI lab resulted in an additional 10 -year lease term, increasing total contracted revenue to $9.1Bn • Established a phased delivery schedule with individual data halls delivered from Q4 2026 through Q1 2027 Batch Zero Conditional Classifications • Received Batch Zero classifications for Texas pipeline sites, including a base load conditional classification for Colchis (1 GW) • Final Batch Zero classifications expected in December after data center audit is completed • Committed a combined $10MM with Fluidstack and Anthropic to repair and upgrade Colorado City’s water infrastructure system • Contribution funds city -identified municipal infrastructure upgrades to improve water availability for city residents after last summer’s shortages Lateral Pipelines for On-Site Generation • Commenced development of lateral pipelines capable of supporting up to 2.5 GW of generation • Targeting gas availability in 2027, with potential for power generation soon after • Recognized first HPC lease revenue in Q3 2026 • Multiple data halls expected to achieve RFS through year -end at Black Pearl and Barber Lake
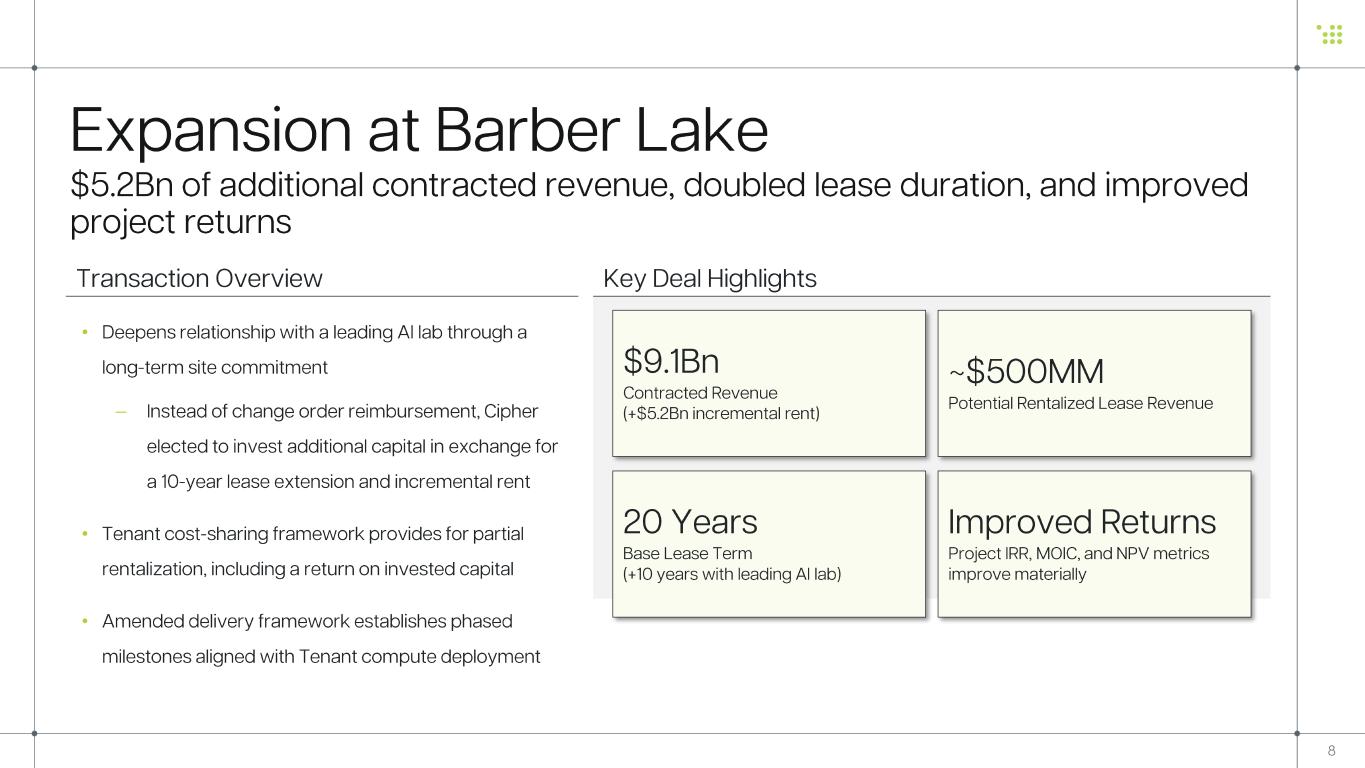
8 • Deepens relationship with a leading AI lab through a long -term site commitment — Instead of change order reimbursement, Cipher elected to invest additional capital in exchange for a 10-year lease extension and incremental rent • Tenant cost -sharing framework provides for partial rentalization, including a return on invested capital • Amended delivery framework establishes phased milestones aligned with Tenant compute deployment Transaction Overview Key Deal Highlights $9.1Bn Contracted Revenue (+$5.2Bn incremental rent) 20 Years Base Lease Term (+10 years with leading AI lab) Improved Returns Project IRR, MOIC, and NPV metrics improve materially ~$500MM Potential Rentalized Lease Revenue Expansion at Barber Lake $5.2Bn of additional contracted revenue, doubled lease duration, and improved project returns
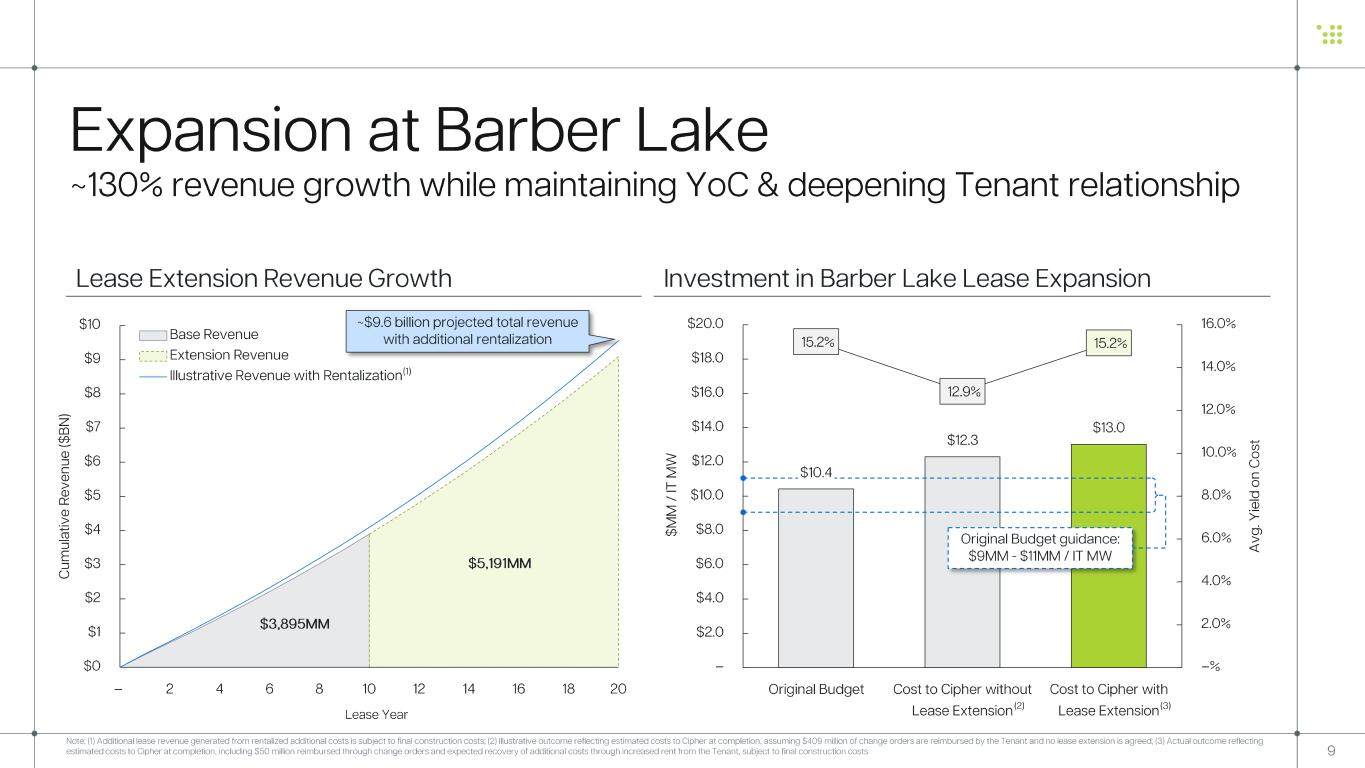
Note: (1) Additional lease revenue generated from rentalized additional costs is subject to final construction costs ; (2) Illustrative outcome reflecting estimated costs to Cipher at completion, assuming $409 million of change orders are reimburse d by the Tenant and no lease extension is agreed ; (3) Actual outcome reflecting estimated costs to Cipher at completion, including $50 million reimbursed through change orders and expected recovery of addi tional costs through increased rent from the Tenant, subject to final construction costs 9 $0 $1 $2 $3 $4 $5 $6 $7 $8 $9 $10 – 2 4 6 8 10 12 14 16 18 20 C u m u la ti ve R ev en u e ($ B N ) Lease Year Base Revenue Extension Revenue Illustrative Revenue with Rentalization $5,191MM (1) Lease Extension Revenue Growth ~$9.6 billion projected total revenue with additional rentalization Investment in Barber Lake Lease Expansion $3,895MM $10.4 $12.3 $13.0 15.2% 12.9% 15.2% –% 2.0% 4.0% 6.0% 8.0% 10.0% 12.0% 14.0% 16.0% – $2.0 $4.0 $6.0 $8.0 $10.0 $12.0 $14.0 $16.0 $18.0 $20.0 Original Budget Cost to Cipher without Lease Extension Cost to Cipher with Lease Extension A vg . Yi el d o n C o st $ M M / IT M W (2) Original Budget guidance: $9MM - $11MM / IT MW (3) Expansion at Barber Lake ~130% revenue growth while maintaining YoC & deepening Tenant relationship

10 Current Portfolio
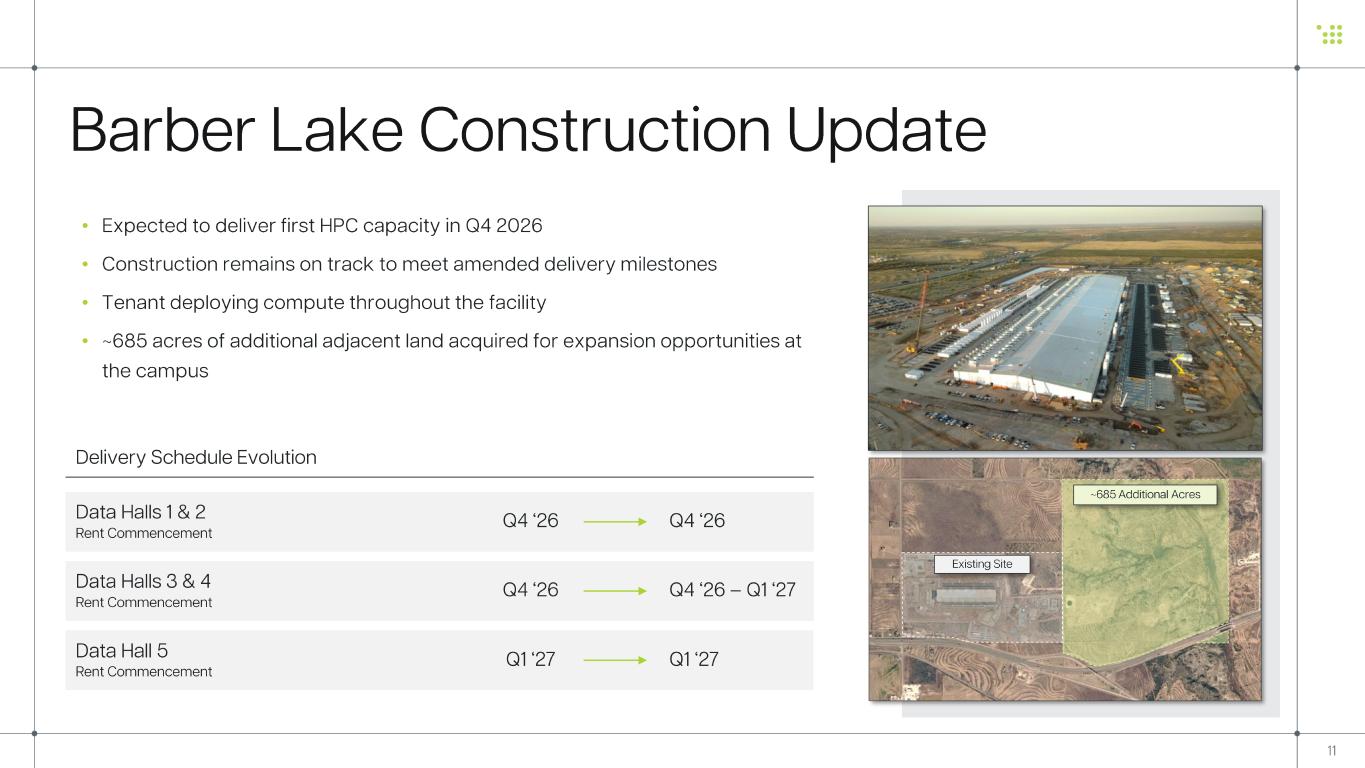
• Expected to deliver first HPC capacity in Q4 2026 • Construction remains on track to meet amended delivery milestones • Tenant deploying compute throughout the facility • ~685 acres of additional adjacent land acquired for expansion opportunities at the campus Barber Lake Construction Update 11 Delivery Schedule Evolution Data Halls 1 & 2 Rent Commencement Data Halls 3 & 4 Rent Commencement Data Hall 5 Rent Commencement Q4 ‘26 Q1 ‘27 Q4 ‘26 Q4 ‘26 – Q1 ‘27 ~685 Additional Acres Existing Site Q4 ‘26 Q1 ‘27
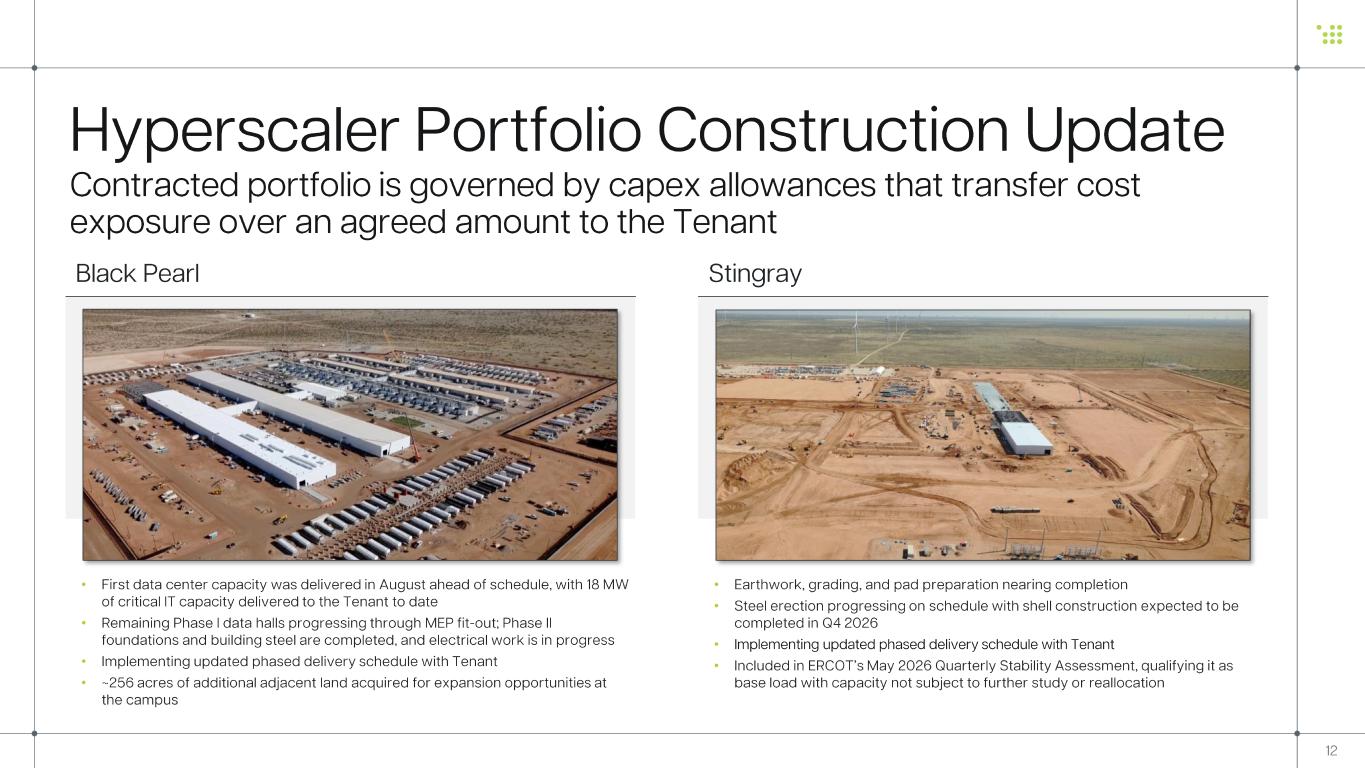
Hyperscaler Portfolio Construction Update Contracted portfolio is governed by capex allowances that transfer cost exposure over an agreed amount to the Tenant 12 • First data center capacity was delivered in August ahead of schedule, with 18 MW of critical IT capacity delivered to the Tenant to date • Remaining Phase I data halls progressing through MEP fit -out; Phase II foundations and building steel are completed, and electrical work is in progress • Implementing updated phased delivery schedule with Tenant • ~256 acres of additional adjacent land acquired for expansion opportunities at the campus • Earthwork, grading, and pad preparation nearing completion • Steel erection progressing on schedule with shell construction expected to be completed in Q4 2026 • Implementing updated phased delivery schedule with Tenant • Included in ERCOT’s May 2026 Quarterly Stability Assessment, qualifying it as base load with capacity not subject to further study or reallocation Black Pearl Stingray
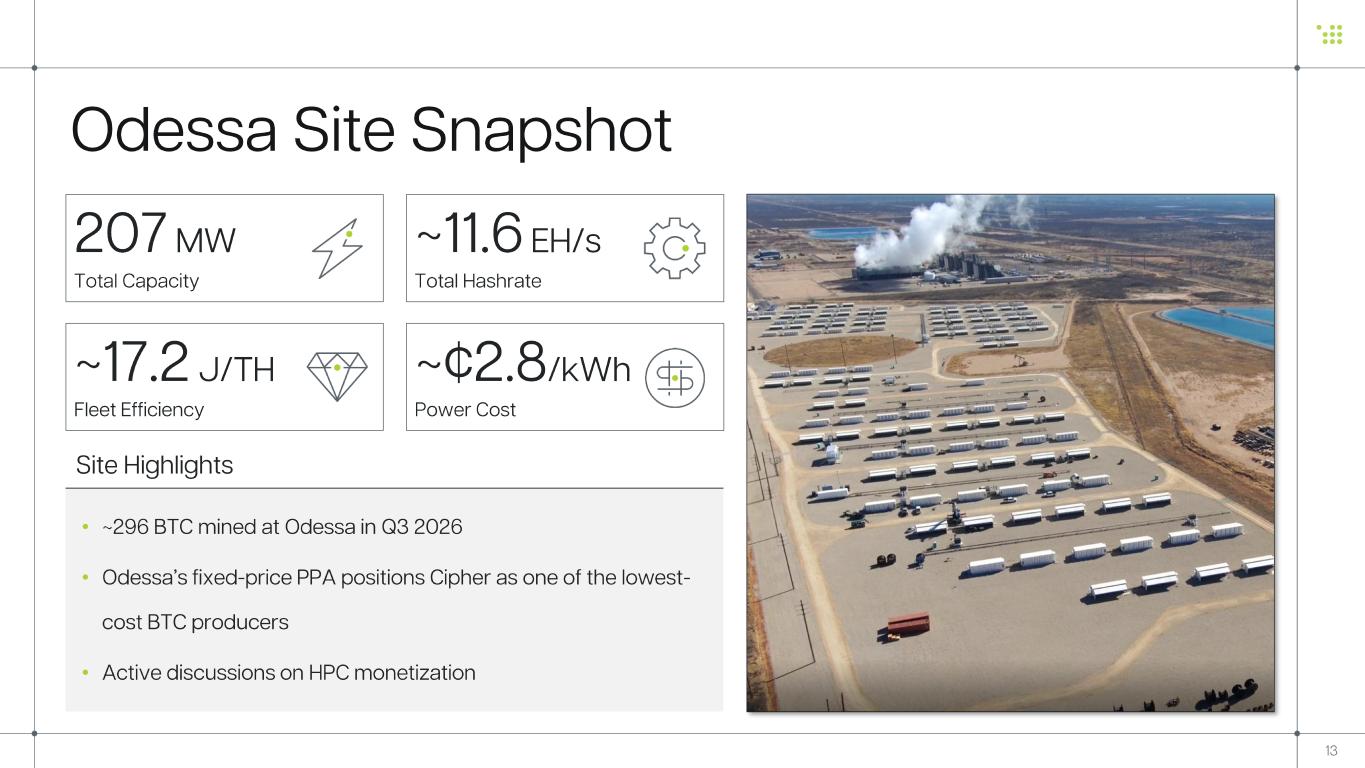
• ~296 BTC mined at Odessa in Q3 2026 • Odessa’s fixed -price PPA positions Cipher as one of the lowest - cost BTC producers • Active discussions on HPC monetization ~11.6 EH/s Total Hashrate Odessa Site Snapshot 207 MW Total Capacity ~17.2 J/TH Fleet Efficiency ~¢2.8 /kWh Power Cost 13 Site Highlights
Development Pipeline 14
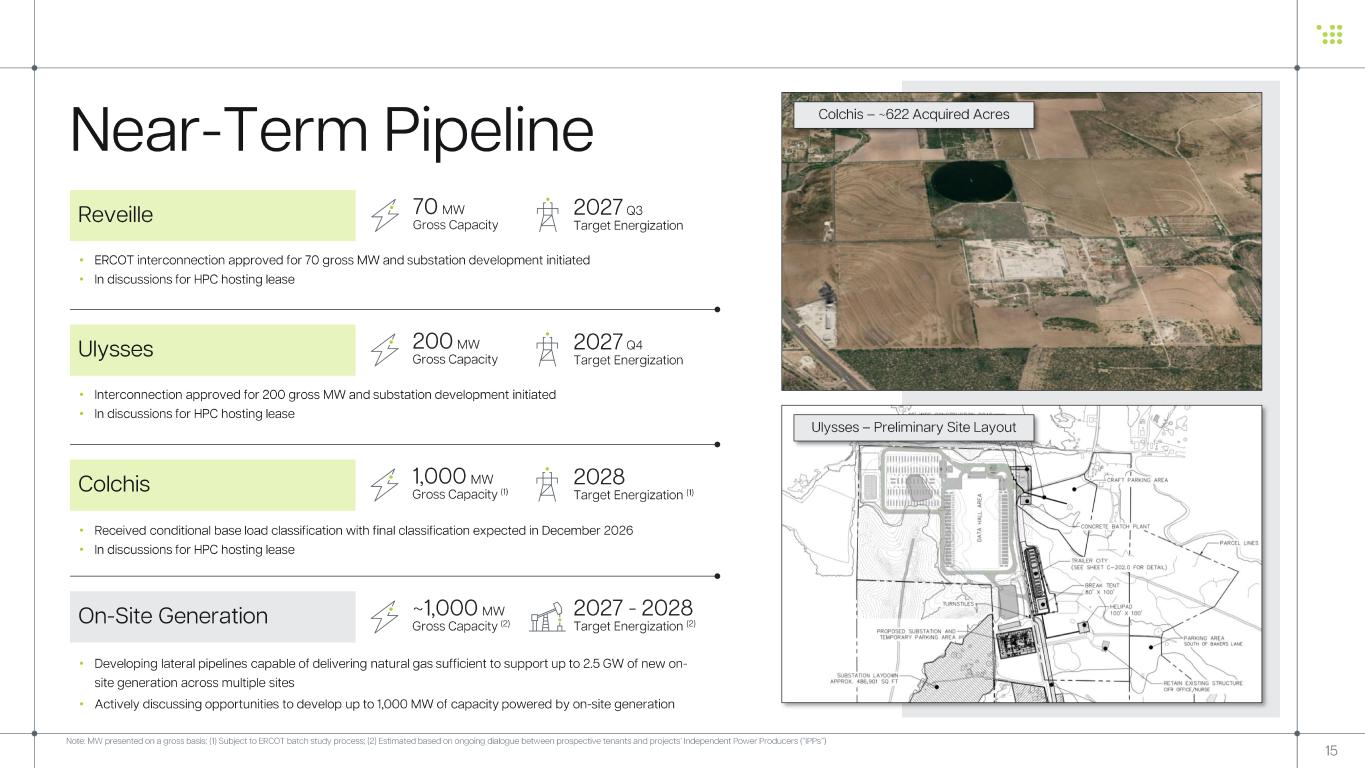
Near -Term Pipeline Note: MW presented on a gross basis; (1) Subject to ERCOT batch study process; (2) Estimated based on ongoing dialogue betwee n prospective tenants and projects’ Independent Power Producers (“IPPs”) 15 Reveille • ERCOT interconnection approved for 70 gross MW and substation development initiated • In discussions for HPC hosting lease 2027 Q3 Target Energization 70 MW Gross Capacity Ulysses • Interconnection approved for 200 gross MW and substation development initiated • In discussions for HPC hosting lease 2027 Q4 Target Energization 200 MW Gross Capacity Colchis • Received conditional base load classification with final classification expected in December 2026 • In discussions for HPC hosting lease 2028 Target Energization (1) 1,000 MW Gross Capacity (1) • Developing lateral pipelines capable of delivering natural gas sufficient to support up to 2.5 GW of new on - site generation across multiple sites • Actively discussing opportunities to develop up to 1,000 MW of capacity powered by on -site generation On-Site Generation 2027 - 2028 Target Energization (2) ~1,000 MW Gross Capacity (2) Colchis – ~622 Acquired Acres Ulysses – Preliminary Site Layout
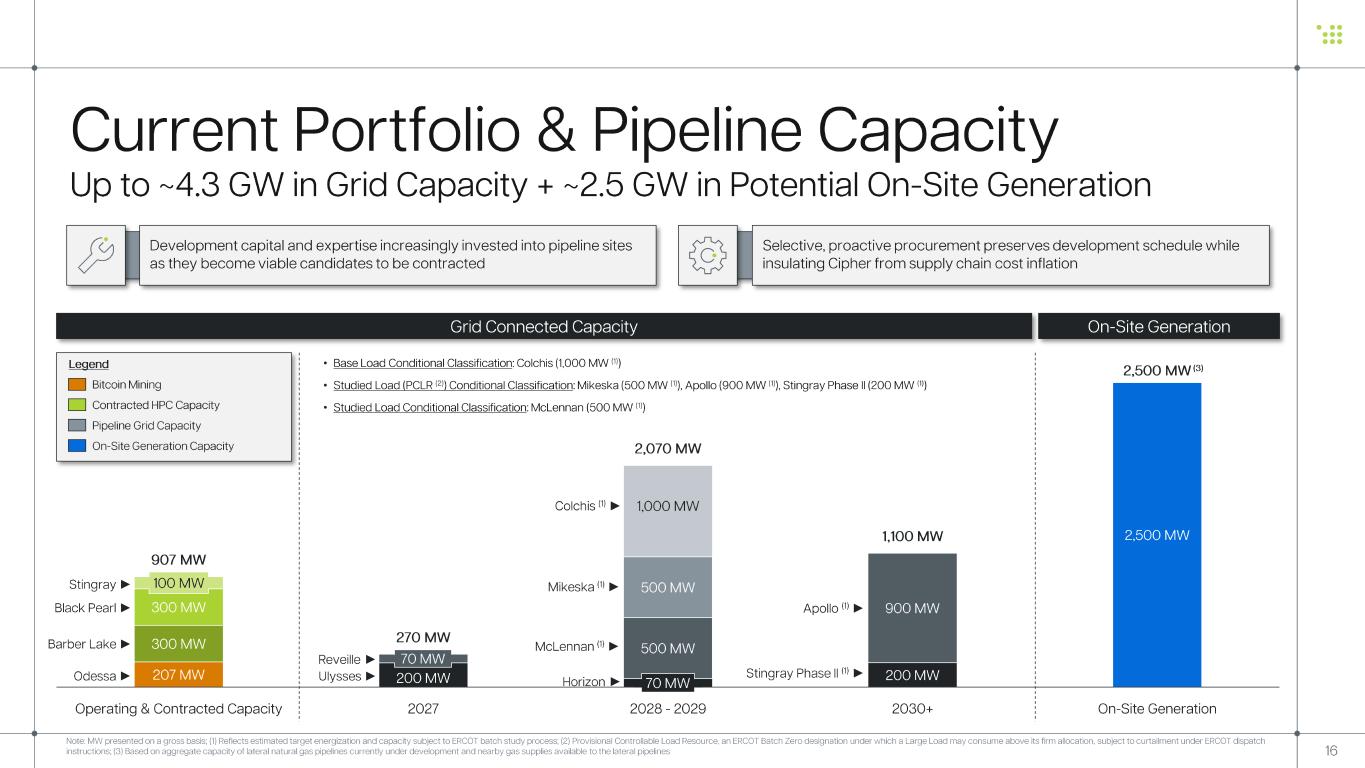
207 MW 200 MW 70 MW 200 MW 2,500 MW 300 MW 70 MW 500 MW 900 MW300 MW 500 MW100 MW 1,000 MW 907 MW 270 MW 2,070 MW 1,100 MW 2,500 MW Operating & Contracted Capacity 2027 2028 - 2029 2030+ On-Site Generation 16 Current Portfolio & Pipeline Capacity Up to ~4.3 GW in Grid Capacity + ~2.5 GW in Potential On -Site Generation Note: MW presented on a gross basis; (1) Reflects estimated target energization and capacity subject to ERCOT batch study pro ces s; (2) Provisional Controllable Load Resource, an ERCOT Batch Zero designation under which a Large Load may consume above its firm allocation, subject to curtailment under ERCOT dispatch instructions; (3) Based on aggregate capacity of lateral natural gas pipelines currently under development and nearby gas sup plies available to the lateral pipelines Barber Lake ► Black Pearl ► Odessa ► Reveille ► Ulysses ► McLennan (1) ► Horizon ► Colchis (1) ► Mikeska (1) ►Stingray ► • Base Load Conditional Classification : Colchis (1,000 MW (1)) • Studied Load (PCLR (2)) Conditional Classification : Mikeska (500 MW (1)), Apollo (900 MW (1)), Stingray Phase II (200 MW (1)) • Studied Load Conditional Classification : McLennan (500 MW (1)) Stingray Phase II (1) ► Apollo (1) ► Grid Connected Capacity On-Site Generation Legend Bitcoin Mining Contracted HPC Capacity Pipeline Grid Capacity On-Site Generation Capacity Development capital and expertise increasingly invested into pipeline sites as they become viable candidates to be contracted Selective, proactive procurement preserves development schedule while insulating Cipher from supply chain cost inflation (3)
Q3 2026 Financial Update 17
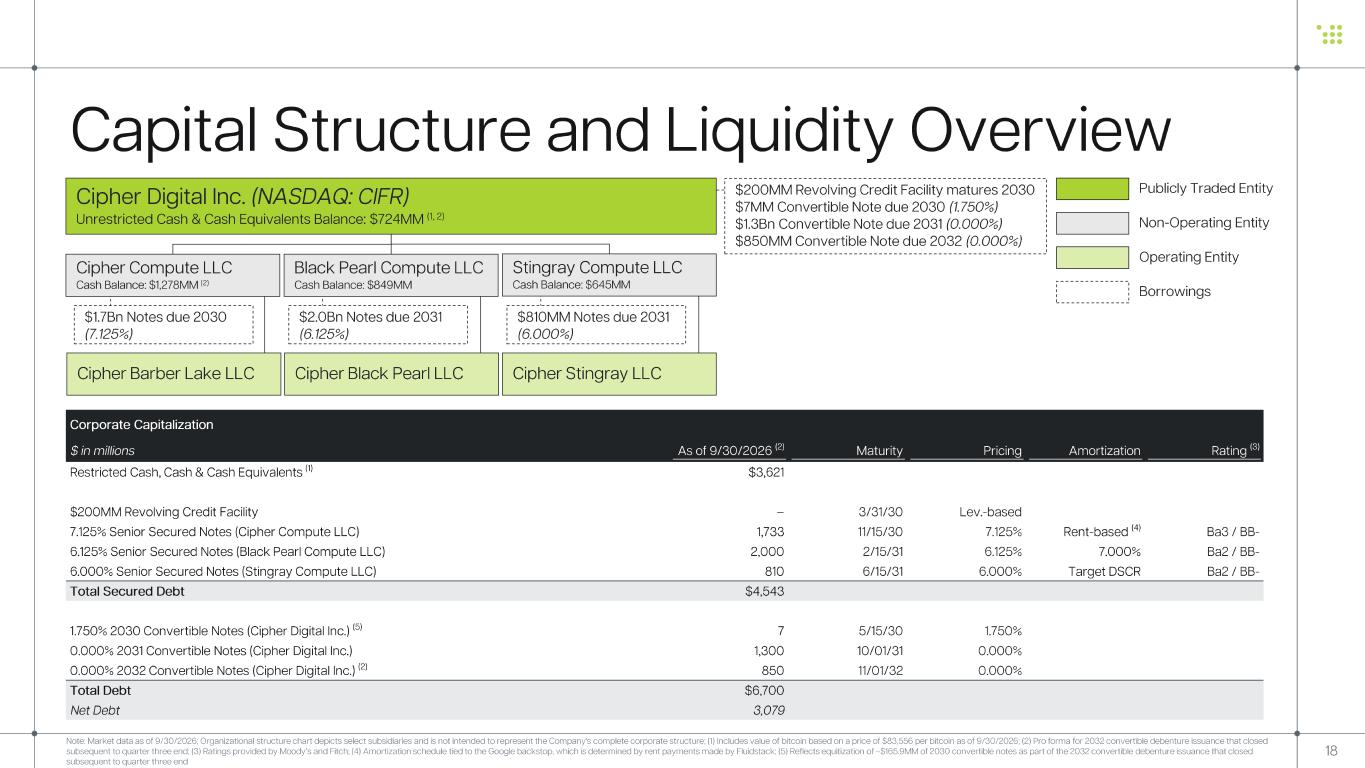
18 Capital Structure and Liquidity Overview Note: Market data as of 9/30/2026; Organizational structure chart depicts select subsidiaries and is not intended to represen t the Company's complete corporate structure; (1) Includes value of bitcoin based on a price of $83,556 per bitcoin as of 9/30/2026; ( 2) Pro forma for 2032 convertible debenture issuance that closed subsequent to quarter three end; (3) Ratings provided by Moody’s and Fitch; (4) Amortization schedule tied to the Google backstop, which is determined by rent payments made by Fluidstack; (5) Reflects equitization of ~$165.9MM of 2030 convertible notes as part of the 2032 convertible debenture issuance that closed subsequent to quarter three end Cipher Barber Lake LLC Cipher Black Pearl LLC Publicly Traded Entity Operating Entity Non-Operating Entity Borrowings $200MM Revolving Credit Facility matures 2030 $7MM Convertible Note due 2030 (1.750 %) $1.3Bn Convertible Note due 2031 (0.00 0 %) $850MM Convertible Note due 2032 (0.0 0 0 %) Cipher Digital Inc. (NASDAQ: CIFR) Unrestricted Cash & Cash Equivalents Balance: $724MM (1, 2) $1.7Bn Notes due 2030 (7.125%) $2.0Bn Notes due 2031 (6.125%) Cipher Compute LLC Cash Balance: $1,278MM (2) Black Pearl Compute LLC Cash Balance: $849MM Stingray Compute LLC Cash Balance: $645MM Cipher Stingray LLC $810MM Notes due 2031 (6.000%) Corporate Capitalization $ in millions As of 9/30/2026 (2) Maturity Pricing Amortization Rating (3) Restricted Cash, Cash & Cash Equivalents (1) $3,621 $200MM Revolving Credit Facility – 3/31/30 Lev. -based 7.125% Senior Secured Notes (Cipher Compute LLC) 1,733 11/15/30 7.125% Rent-based (4) Ba3 / BB - 6.125% Senior Secured Notes (Black Pearl Compute LLC) 2,000 2/15/31 6.125% 7.000% Ba2 / BB - 6.000% Senior Secured Notes (Stingray Compute LLC) 810 6/15/31 6.000% Target DSCR Ba2 / BB - Total Secured Debt $4,543 1.750% 2030 Convertible Notes (Cipher Digital Inc.) (5) 7 5/15/30 1.750% 0.000% 2031 Convertible Notes (Cipher Digital Inc.) 1,300 10/01/31 0.000% 0.000% 2032 Convertible Notes (Cipher Digital Inc.) (2) 850 11/01/32 0.000% Total Debt $6,700 Net Debt 3,079
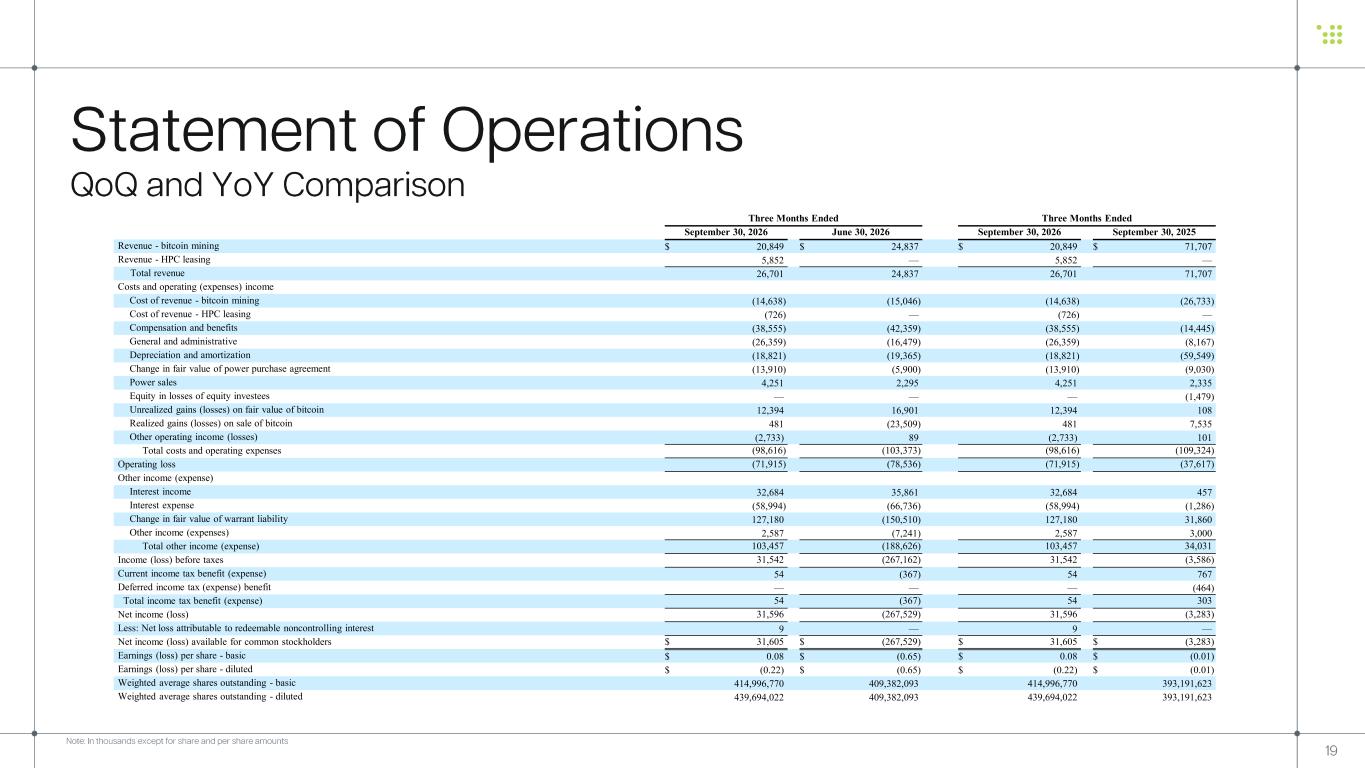
Three Months Ended Three Months Ended September 30, 2026 June 30, 2026 September 30, 2026 September 30, 2025 Revenue - bitcoin mining $ 20,849 $ 24,837 $ 20,849 $ 71,707 Revenue - HPC leasing 5,852 — 5,852 — Total revenue 26,701 24,837 26,701 71,707 Costs and operating (expenses) income Cost of revenue - bitcoin mining (14,638) (15,046) (14,638) (26,733) Cost of revenue - HPC leasing (726) — (726) — Compensation and benefits (38,555) (42,359) (38,555) (14,445) General and administrative (26,359) (16,479) (26,359) (8,167) Depreciation and amortization (18,821) (19,365) (18,821) (59,549) Change in fair value of power purchase agreement (13,910) (5,900) (13,910) (9,030) Power sales 4,251 2,295 4,251 2,335 Equity in losses of equity investees — — — (1,479) Unrealized gains (losses) on fair value of bitcoin 12,394 16,901 12,394 108 Realized gains (losses) on sale of bitcoin 481 (23,509) 481 7,535 Other operating income (losses) (2,733) 89 (2,733) 101 Total costs and operating expenses (98,616) (103,373) (98,616) (109,324) Operating loss (71,915) (78,536) (71,915) (37,617) Other income (expense) Interest income 32,684 35,861 32,684 457 Interest expense (58,994) (66,736) (58,994) (1,286) Change in fair value of warrant liability 127,180 (150,510) 127,180 31,860 Other income (expenses) 2,587 (7,241) 2,587 3,000 Total other income (expense) 103,457 (188,626) 103,457 34,031 Income (loss) before taxes 31,542 (267,162) 31,542 (3,586) Current income tax benefit (expense) 54 (367) 54 767 Deferred income tax (expense) benefit — — — (464) Total income tax benefit (expense) 54 (367) 54 303 Net income (loss) 31,596 (267,529) 31,596 (3,283) Less: Net loss attributable to redeemable noncontrolling interest 9 — 9 — Net income (loss) available for common stockholders $ 31,605 $ (267,529) $ 31,605 $ (3,283) Earnings (loss) per share - basic $ 0.08 $ (0.65) $ 0.08 $ (0.01) Earnings (loss) per share - diluted $ (0.22) $ (0.65) $ (0.22) $ (0.01) Weighted average shares outstanding - basic 414,996,770 409,382,093 414,996,770 393,191,623 Weighted average shares outstanding - diluted 439,694,022 409,382,093 439,694,022 393,191,623 19 Statement of Operations QoQ and YoY Comparison Note: In thousands except for share and per share amounts
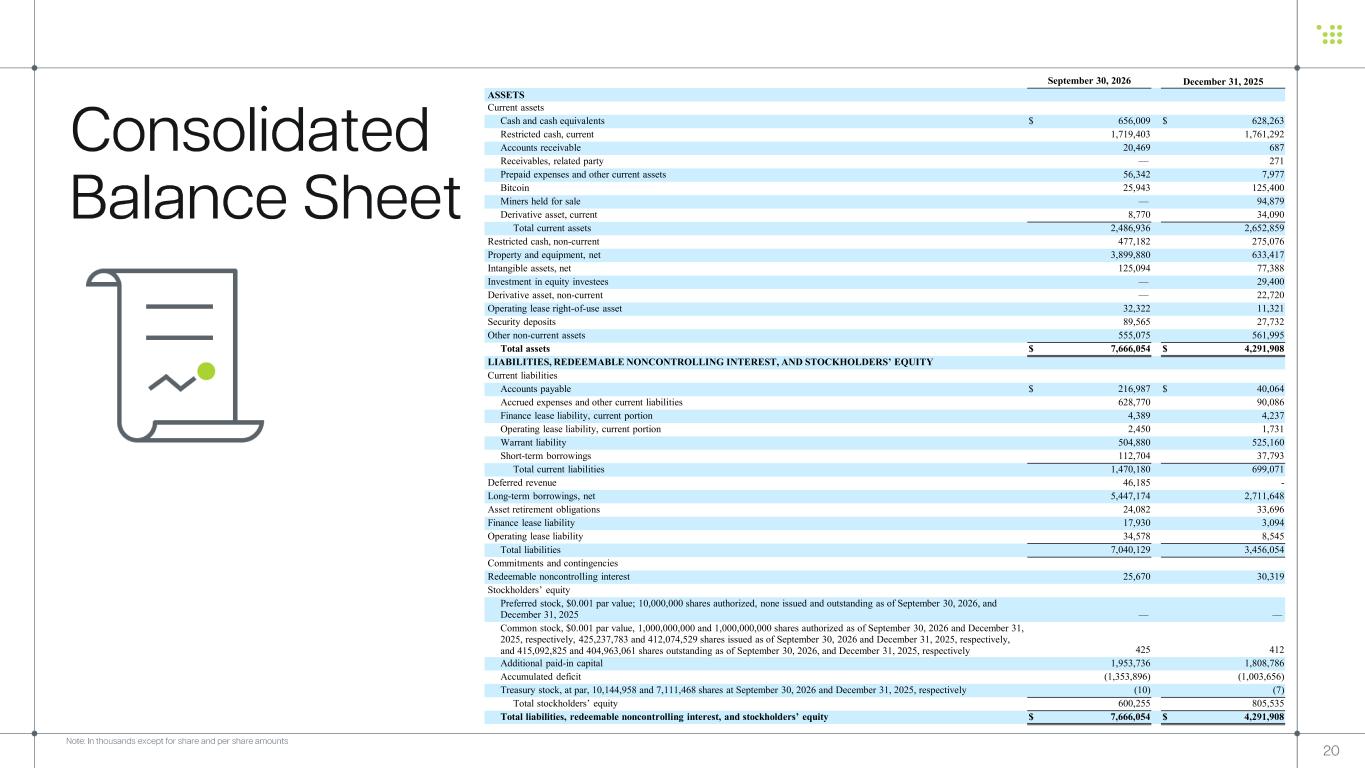
September 30, 2026 December 31, 2025 ASSETS Current assets Cash and cash equivalents $ 656,009 $ 628,263 Restricted cash, current 1,719,403 1,761,292 Accounts receivable 20,469 687 Receivables, related party — 271 Prepaid expenses and other current assets 56,342 7,977 Bitcoin 25,943 125,400 Miners held for sale — 94,879 Derivative asset, current 8,770 34,090 Total current assets 2,486,936 2,652,859 Restricted cash, non-current 477,182 275,076 Property and equipment, net 3,899,880 633,417 Intangible assets, net 125,094 77,388 Investment in equity investees — 29,400 Derivative asset, non-current — 22,720 Operating lease right-of-use asset 32,322 11,321 Security deposits 89,565 27,732 Other non-current assets 555,075 561,995 Total assets $ 7,666,054 $ 4,291,908 LIABILITIES, REDEEMABLE NONCONTROLLING INTEREST, AND STOCKHOLDERS’ EQUITY Current liabilities Accounts payable $ 216,987 $ 40,064 Accrued expenses and other current liabilities 628,770 90,086 Finance lease liability, current portion 4,389 4,237 Operating lease liability, current portion 2,450 1,731 Warrant liability 504,880 525,160 Short-term borrowings 112,704 37,793 Total current liabilities 1,470,180 699,071 Deferred revenue 46,185 - Long-term borrowings, net 5,447,174 2,711,648 Asset retirement obligations 24,082 33,696 Finance lease liability 17,930 3,094 Operating lease liability 34,578 8,545 Total liabilities 7,040,129 3,456,054 Commitments and contingencies Redeemable noncontrolling interest 25,670 30,319 Stockholders’ equity Preferred stock, $0.001 par value; 10,000,000 shares authorized, none issued and outstanding as of September 30, 2026, and December 31, 2025 — — Common stock, $0.001 par value, 1,000,000,000 and 1,000,000,000 shares authorized as of September 30, 2026 and December 31, 2025, respectively, 425,237,783 and 412,074,529 shares issued as of September 30, 2026 and December 31, 2025, respectively, and 415,092,825 and 404,963,061 shares outstanding as of September 30, 2026, and December 31, 2025, respectively 425 412 Additional paid-in capital 1,953,736 1,808,786 Accumulated deficit (1,353,896) (1,003,656) Treasury stock, at par, 10,144,958 and 7,111,468 shares at September 30, 2026 and December 31, 2025, respectively (10) (7) Total stockholders’ equity 600,255 805,535 Total liabilities, redeemable noncontrolling interest, and stockholders’ equity $ 7,666,054 $ 4,291,908 20 Consolidated Balance Sheet Note: In thousands except for share and per share amounts
Appendix 21
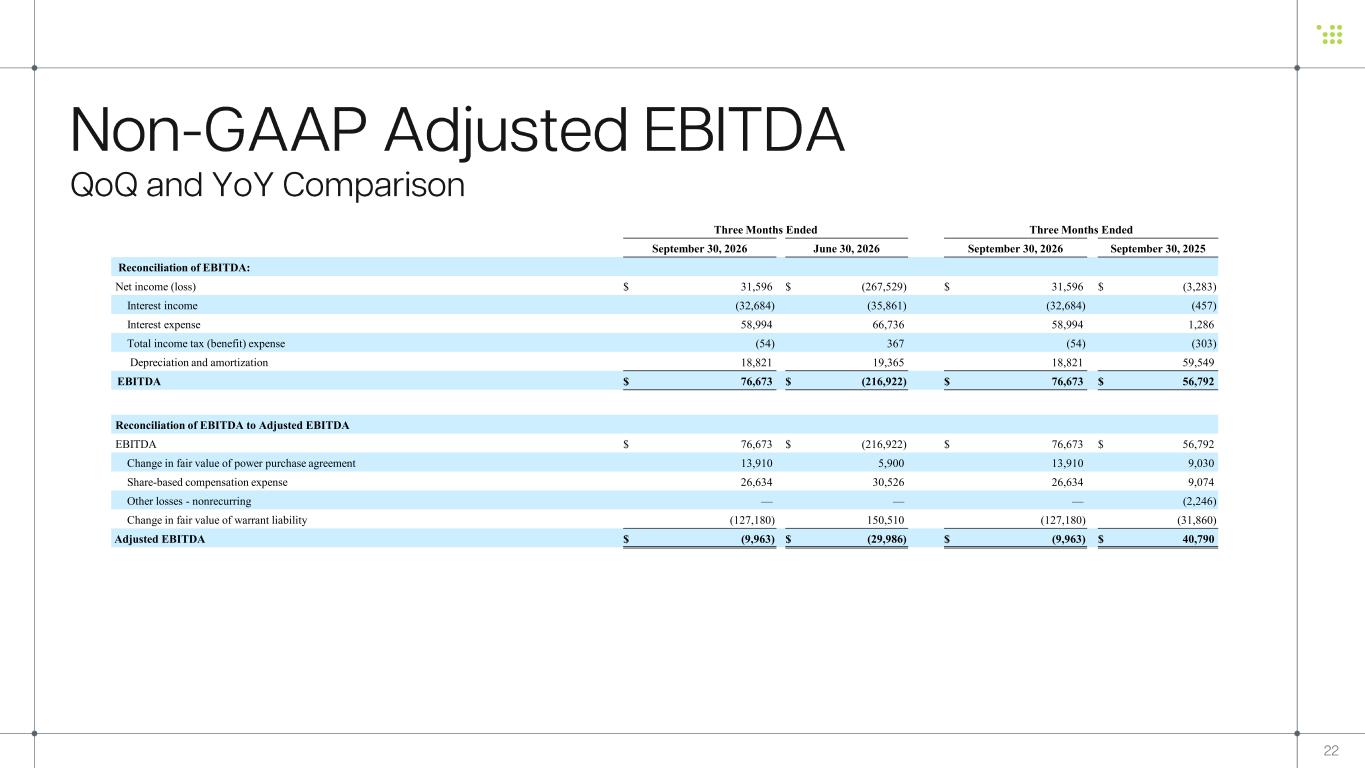
Three Months Ended Three Months Ended September 30, 2026 June 30, 2026 September 30, 2026 September 30, 2025 Reconciliation of EBITDA: Net income (loss) $ 31,596 $ (267,529) $ 31,596 $ (3,283) Interest income (32,684) (35,861) (32,684) (457) Interest expense 58,994 66,736 58,994 1,286 Total income tax (benefit) expense (54) 367 (54) (303) Depreciation and amortization 18,821 19,365 18,821 59,549 EBITDA $ 76,673 $ (216,922) $ 76,673 $ 56,792 Reconciliation of EBITDA to Adjusted EBITDA EBITDA $ 76,673 $ (216,922) $ 76,673 $ 56,792 Change in fair value of power purchase agreement 13,910 5,900 13,910 9,030 Share-based compensation expense 26,634 30,526 26,634 9,074 Other losses - nonrecurring — — — (2,246) Change in fair value of warrant liability (127,180) 150,510 (127,180) (31,860) Adjusted EBITDA $ (9,963) $ (29,986) $ (9,963) $ 40,790 22 Non-GAAP Adjusted EBITDA QoQ and YoY Comparison
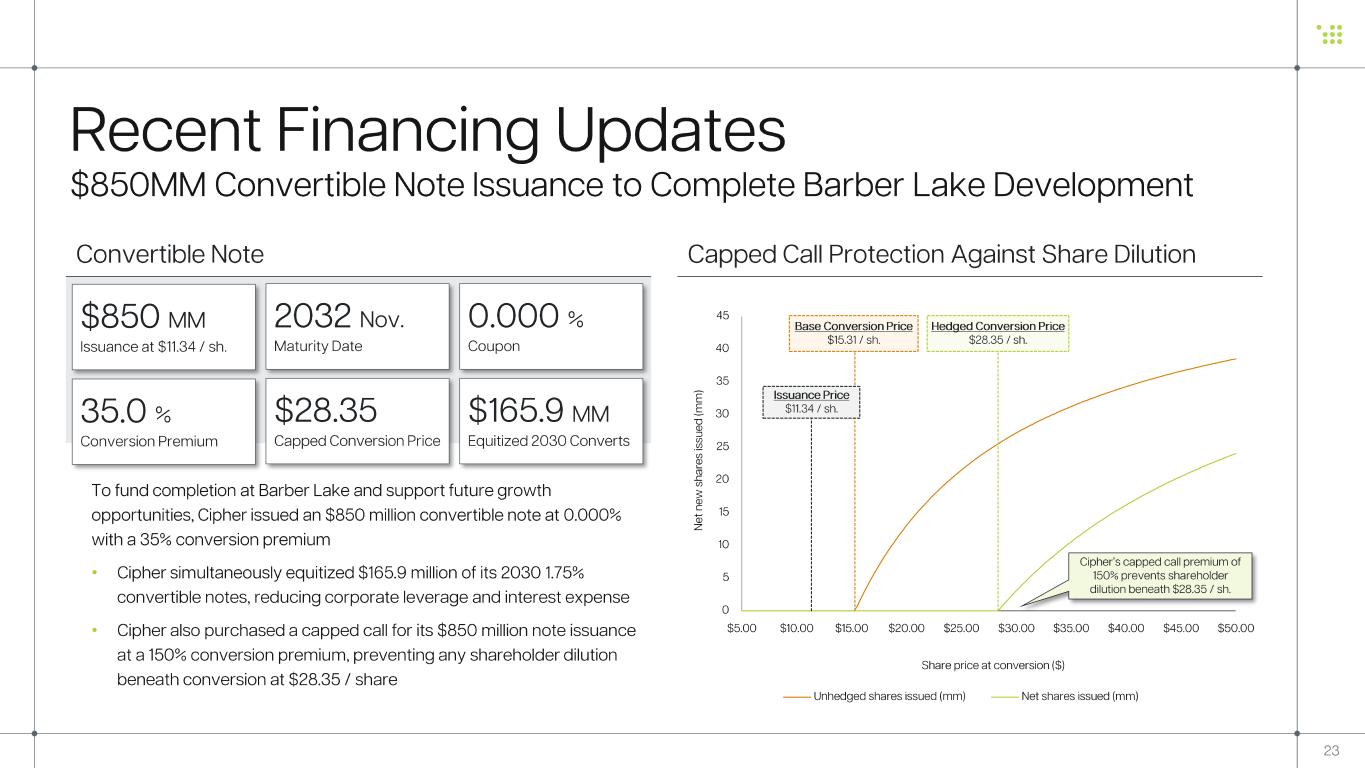
23 Recent Financing Update s $850MM Convertible Note Issuance to Complete Barber Lake Development $850 MM Issuance at $11.34 / sh. 35.0 % Conversion Premium 2032 Nov. Maturity Date $28.35 Capped Conversion Price 0.000 % Coupon $165.9 MM Equitized 2030 Converts Convertible Note Capped Call Protection Against Share Dilution 0 5 10 15 20 25 30 35 40 45 $5.00 $10.00 $15.00 $20.00 $25.00 $30.00 $35.00 $40.00 $45.00 $50.00 N et n ew s h ar es is su ed ( m m ) Share price at conversion ($) Unhedged shares issued (mm) Net shares issued (mm) Issuance Price $11.34 / sh. Base Conversion Price $15.31 / sh. Hedged Conversion Price $28.35 / sh. Cipher’s capped call premium of 150% prevents shareholder dilution beneath $28.35 / sh. To fund completion at Barber Lake and support future growth opportunities, Cipher issued an $850 million convertible note at 0.000% with a 35% conversion premium • Cipher simultaneously equitized $165.9 million of its 2030 1.75% convertible notes, reducing corporate leverage and interest expense • Cipher also purchased a capped call for its $850 million note issuance at a 150% conversion premium, preventing any shareholder dilution beneath conversion at $28.35 / share