
Exhibit 99.2 Q3 2026 EARNINGS RELEASE November 2, 2026 Dave Graziosi – Chair, President & CEO Scott Mell – CFO & Treasurer Fred Bohley – COO & Allison Transmission President Craig Price – Allison Off-Highway President 1
SAFE HARBOR STATEMENT THE FOLLOWING INFORMATION CONTAINS FORWARD-LOOKING STATEMENTS. THE WORDS “BELIEVE,” “EXPECT,” “ANTICIPATE,” “INTEND,” “ESTIMATE” AND OTHER EXPRESSIONS THAT ARE PREDICTIONS OF OR INDICATE FUTURE EVENTS AND TRENDS AND THAT DO NOT RELATE TO HISTORICAL MATTERS IDENTIFY FORWARD-LOOKING STATEMENTS. YOU SHOULD NOT PLACE UNDUE RELIANCE ON THESE FORWARD- LOOKING STATEMENTS. ALTHOUGH FORWARD-LOOKING STATEMENTS REFLECT MANAGEMENT’S GOOD FAITH BELIEFS, RELIANCE SHOULD NOT BE PLACED ON FORWARD-LOOKING STATEMENTS BECAUSE THEY INVOLVE KNOWN AND UNKNOWN RISKS, UNCERTAINTIES AND OTHER FACTORS, WHICH MAY CAUSE ACTUAL RESULTS, PERFORMANCE OR ACHIEVEMENTS TO DIFFER MATERIALLY FROM ANTICIPATED FUTURE RESULTS, PERFORMANCE OR ACHIEVEMENTS EXPRESSED OR IMPLIED BY SUCH FORWARD-LOOKING STATEMENTS. FORWARD-LOOKING STATEMENTS SPEAK ONLY AS OF THE DATE THE STATEMENTS ARE MADE. WE UNDERTAKE NO OBLIGATION TO PUBLICLY UPDATE OR REVISE ANY FORWARD-LOOKING STATEMENT, WHETHER AS A RESULT OF NEW INFORMATION, FUTURE EVENTS, CHANGED CIRCUMSTANCES OR OTHERWISE. THESE FORWARD-LOOKING STATEMENTS ARE SUBJECT TO NUMEROUS RISKS AND UNCERTAINTIES, INCLUDING, BUT NOT LIMITED TO: THE SIGNIFICANT COSTS WE ARE EXPECTED TO INCUR IN CONNECTION WITH THE INTEGRATION OF THE OFF-HIGHWAY DRIVE & MOTION SYSTEMS BUSINESS OF DANA INCORPORATED (NOW REFERRED TO AS THE “ALLISON OFF-HIGHWAY BUSINESS”); OUR ABILITY TO SUCCESSFULLY INTEGRATE THE ALLISON OFF-HIGHWAY BUSINESS AND ITS OPERATIONS IN THE EXPECTED TIME FRAME; OUR ABILITY TO REALIZE ALL OF THE ANTICIPATED BENEFITS FROM THE INTEGRATION OF THE ALLISON OFF-HIGHWAY BUSINESS AND ITS OPERATIONS AND TO EFFECTIVELY MANAGE OUR EXPANDED OPERATIONS; OUR PARTICIPATION IN MARKETS THAT ARE COMPETITIVE; OUR ABILITY TO PREPARE FOR, RESPOND TO AND SUCCESSFULLY ACHIEVE OUR OBJECTIVES RELATING TO TECHNOLOGICAL AND MARKET DEVELOPMENTS, COMPETITIVE THREATS AND CHANGING CUSTOMER NEEDS, INCLUDING WITH RESPECT TO ELECTRIC HYBRID AND FULLY ELECTRIC COMMERCIAL VEHICLES; INCREASES IN COST, DISRUPTION OF SUPPLY OR SHORTAGE OF LABOR, FREIGHT, RAW MATERIALS, ENERGY OR COMPONENTS USED TO MANUFACTURE OR TRANSPORT OUR PRODUCTS OR THOSE OF OUR CUSTOMERS OR SUPPLIERS, INCLUDING AS A RESULT OF GEOPOLITICAL RISKS, NATURAL DISASTERS, EXTREME WEATHER EVENTS, WARS AND PUBLIC HEALTH CRISES SUCH AS PANDEMICS; GLOBAL ECONOMIC VOLATILITY; GENERAL ECONOMIC AND INDUSTRY CONDITIONS, INCLUDING THE RISK OF PROLONGED INFLATION AND RECESSION; LABOR STRIKES, WORK STOPPAGES OR SIMILAR LABOR DISPUTES, WHICH COULD SIGNIFICANTLY DISRUPT OUR OPERATIONS OR THOSE OF OUR PRINCIPAL CUSTOMERS OR SUPPLIERS; THE HIGHLY CYCLICAL INDUSTRIES IN WHICH CERTAIN OF OUR END USERS OPERATE; UNCERTAINTY IN THE GLOBAL REGULATORY AND BUSINESS ENVIRONMENTS IN WHICH WE OPERATE; THE CONCENTRATION OF OUR NET SALES IN OUR TOP FIVE CUSTOMERS AND THE LOSS OF ANY ONE OF THESE CUSTOMERS; CYBERSECURITY RISKS TO OUR OPERATIONAL SYSTEMS, SECURITY SYSTEMS OR INFRASTRUCTURE OWNED BY US OR OUR THIRD- PARTY VENDORS AND SUPPLIERS; THE FAILURE OF MARKETS OUTSIDE NORTH AMERICA TO INCREASE ADOPTION OF FULLY AUTOMATIC TRANSMISSIONS; THE SUCCESS OF OUR RESEARCH AND DEVELOPMENT EFFORTS, THE OUTCOME OF WHICH IS UNCERTAIN; U.S. AND FOREIGN DEFENSE SPENDING; RISKS ASSOCIATED WITH OUR INTERNATIONAL OPERATIONS, INCLUDING ACTS OF WAR AND INCREASED TRADE PROTECTIONISM AND TARIFFS; THE DISCOVERY OF DEFECTS IN OUR PRODUCTS, RESULTING IN DELAYS IN NEW MODEL LAUNCHES, RECALL CAMPAIGNS AND/OR INCREASED WARRANTY COSTS AND REDUCTION IN FUTURE SALES OR DAMAGE TO OUR BRAND AND REPUTATION; OUR ABILITY TO IDENTIFY, CONSUMMATE AND EFFECTIVELY INTEGRATE ACQUISITIONS AND COLLABORATIONS; AND RISKS RELATED TO OUR INDEBTEDNESS. ALLISON CANNOT ASSURE YOU THAT THE ASSUMPTIONS MADE IN PREPARING ANY OF THE FORWARD-LOOKING STATEMENTS WILL PROVE ACCURATE OR THAT ANY LONG-TERM FINANCIAL GOALS WILL BE REALIZED. ALL FORWARD-LOOKING STATEMENTS INCLUDED IN THIS PRESENTATION SPEAK ONLY AS OF THE DATE MADE, AND ALLISON UNDERTAKES NO OBLIGATION TO UPDATE OR REVISE PUBLICLY ANY SUCH FORWARD-LOOKING STATEMENTS, WHETHER AS A RESULT OF NEW INFORMATION, FUTURE EVENTS, OR OTHERWISE. IN PARTICULAR, ALLISON CAUTIONS YOU NOT TO PLACE UNDUE WEIGHT ON CERTAIN FORWARD-LOOKING STATEMENTS PERTAINING TO POTENTIAL GROWTH OPPORTUNITIES OR LONG-TERM FINANCIAL GOALS SET FORTH HEREIN. ACTUAL RESULTS MAY VARY SIGNIFICANTLY FROM THESE STATEMENTS. ALLISON BUSINESS IS SUBJECT TO NUMEROUS RISKS AND UNCERTAINTIES, WHICH MAY CAUSE FUTURE RESULTS OF OPERATIONS TO VARY SIGNIFICANTLY FROM THOSE PRESENTED HEREIN. IMPORTANT FACTORS THAT COULD CAUSE ACTUAL RESULTS TO DIFFER MATERIALLY ARE DISCUSSED IN ALLISON ANNUAL REPORT ON FORM 10-K FOR THE YEAR ENDED DECEMBER 31, 2025. Q3 2026 EARNINGS RELEASE 2
NON-GAAP FINANCIAL INFORMATION WE USE ADJUSTED EARNINGS BEFORE INTEREST, TAXES, DEPRECIATION, AND AMORTIZATION (“EBITDA”) AND ADJUSTED EBITDA AS A PERCENT OF NET SALES (“ADJUSTED EBITDA MARGIN”) TO MEASURE OUR OPERATING PROFITABILITY. WE BELIEVE THAT ADJUSTED EBITDA AND ADJUSTED EBITDA MARGIN PROVIDE MANAGEMENT, INVESTORS AND CREDITORS WITH USEFUL MEASURES OF THE OPERATIONAL RESULTS OF OUR BUSINESS AND INCREASE THE PERIOD-TO-PERIOD COMPARABILITY OF OUR OPERATING PROFITABILITY. ADJUSTED EBITDA MARGIN IS ALSO USED IN THE CALCULATION OF MANAGEMENT’S INCENTIVE COMPENSATION PROGRAM. THE MOST DIRECTLY COMPARABLE GAAP MEASURE TO ADJUSTED EBITDA AND ADJUSTED EBITDA MARGIN IS NET INCOME OR SEGMENT OPERATING PROFIT (LOSS) IN THE CASE OF OUR SEGMENTS AND NET INCOME AS A PERCENT OF NET SALES (“NET INCOME MARGIN”) OR SEGMENT OPERATING PROFIT (LOSS) AS A PERCENT OF NET SALES IN THE CASE OF OUR SEGMENTS, RESPECTIVELY. ADJUSTED EBITDA IS CALCULATED AS EARNINGS BEFORE INTEREST EXPENSE, NET, INCOME TAX EXPENSE, AMORTIZATION OF INTANGIBLE ASSETS, DEPRECIATION OF PROPERTY, PLANT AND EQUIPMENT AND OTHER ADJUSTMENTS AS DEFINED BY THE SECOND AMENDED AND RESTATED CREDIT AGREEMENT DATED AS OF MARCH 29, 2019, AS AMENDED, GOVERNING ALLISON TRANSMISSION, INC.’S TERM LOANS AND REVOLVING CREDIT FACILITY. ADJUSTED EBITDA MARGIN IS CALCULATED AS ADJUSTED EBITDA DIVIDED BY NET SALES. IN ADDITION, WE BELIEVE ADJUSTED NET INCOME, ADJUSTED BASIC EARNINGS PER SHARE ATTRIBUTABLE TO COMMON STOCKHOLDERS (“ADJUSTED BASIC EPS”) AND ADJUSTED DILUTED EARNINGS PER SHARE ATTRIBUTABLE TO COMMON STOCKHOLDERS (“ADJUSTED DILUTED EPS ) PROVIDE MANAGEMENT, INVESTORS AND CREDITORS WITH USEFUL MEASURES OF OUR CORE BUSINESS PERFORMANCE AND TRENDS AND INCREASE THE PERIOD-TO-PERIOD COMPARABILITY OF OUR RESULTS OF OPERATIONS. THE MOST DIRECTLY COMPARABLE GAAP MEASURE TO ADJUSTED NET INCOME, ADJUSTED BASIC EPS AND ADJUSTED DILUTED EPS IS NET INCOME, BASIC EARNINGS PER SHARE ATTRIBUTABLE TO COMMON STOCKHOLDERS (“BASIC EPS”) AND DILUTED EARNINGS PER SHARE ATTRIBUTABLE TO COMMON STOCKHOLDERS (“DILUTED EPS ), RESPECTIVELY. ADJUSTED NET INCOME IS CALCULATED AS NET INCOME EXCLUDING THE EFFECT OF CERTAIN NON-CASH, NON-RECURRING, INFREQUENT OR UNUSUAL ITEMS SUCH AS: AMORTIZATION RELATED TO ACQUIRED INTANGIBLE ASSETS, DEPRECIATION OF THE STEPPED-UP BASIS IN PROPERTY, PLANT AND EQUIPMENT RELATED TO ACQUIRED ASSETS, STEPPED-UP BASIS IN ACQUIRED INVENTORY, STOCK-BASED COMPENSATION EXPENSE, ACQUISITION-RELATED EXPENSES, IMPAIRMENT CHARGES, OTHER ONE-OFF ADJUSTMENTS AND THE TAX EFFECT OF THE ADJUSTMENTS. ADJUSTED BASIC EPS IS CALCULATED BY DIVIDING ADJUSTED NET INCOME BY THE WEIGHTED AVERAGE SHARES OF COMMON STOCK OUTSTANDING AND ADJUSTED DILUTED EPS IS CALCULATED BY DIVIDING ADJUSTED NET INCOME BY THE DILUTED WEIGHTED AVERAGE SHARES OF COMMON STOCK OUTSTANDING. WE USE ADJUSTED FREE CASH FLOW TO EVALUATE THE AMOUNT OF CASH GENERATED BY OUR BUSINESS THAT, AFTER THE CAPITAL INVESTMENT NEEDED TO MAINTAIN AND GROW OUR BUSINESS AND CERTAIN MANDATORY DEBT SERVICE REQUIREMENTS, CAN BE USED FOR REPAYMENT OF DEBT, STOCKHOLDER DISTRIBUTIONS AND STRATEGIC OPPORTUNITIES, INCLUDING INVESTING IN OUR BUSINESS. WE BELIEVE THAT ADJUSTED FREE CASH FLOW ENHANCES THE UNDERSTANDING OF THE CASH FLOWS OF OUR BUSINESS FOR MANAGEMENT, INVESTORS AND CREDITORS. ADJUSTED FREE CASH FLOW IS ALSO USED IN THE CALCULATION OF MANAGEMENT’S INCENTIVE COMPENSATION PROGRAM. THE MOST DIRECTLY COMPARABLE GAAP MEASURE TO ADJUSTED FREE CASH FLOW IS NET CASH PROVIDED BY OPERATING ACTIVITIES. ADJUSTED FREE CASH FLOW IS CALCULATED AS NET CASH PROVIDED BY OPERATING ACTIVITIES AFTER CASH USED FOR ADDITIONS OF LONG-LIVED ASSETS. Q3 2026 EARNINGS RELEASE 3
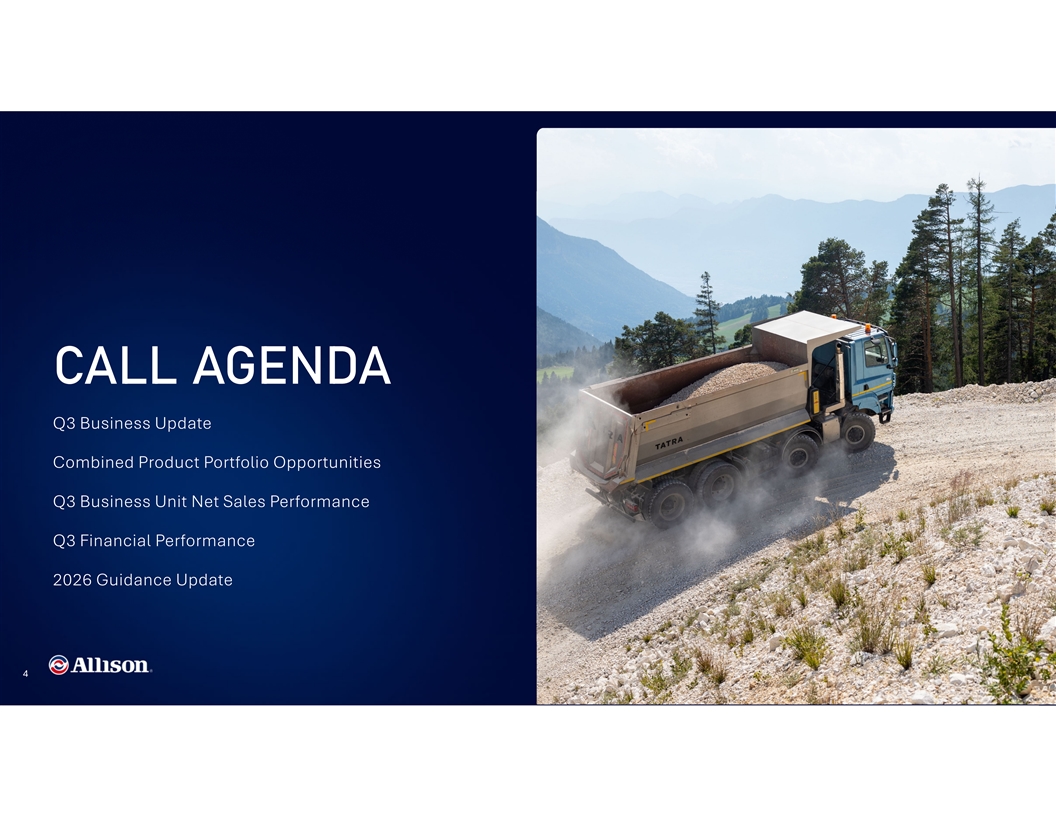
CALL AGENDA Q3 Business Update Combined Product Portfolio Opportunities Q3 Business Unit Net Sales Performance Q3 Financial Performance 2026 Guidance Update PRESENTATION TITLE 4
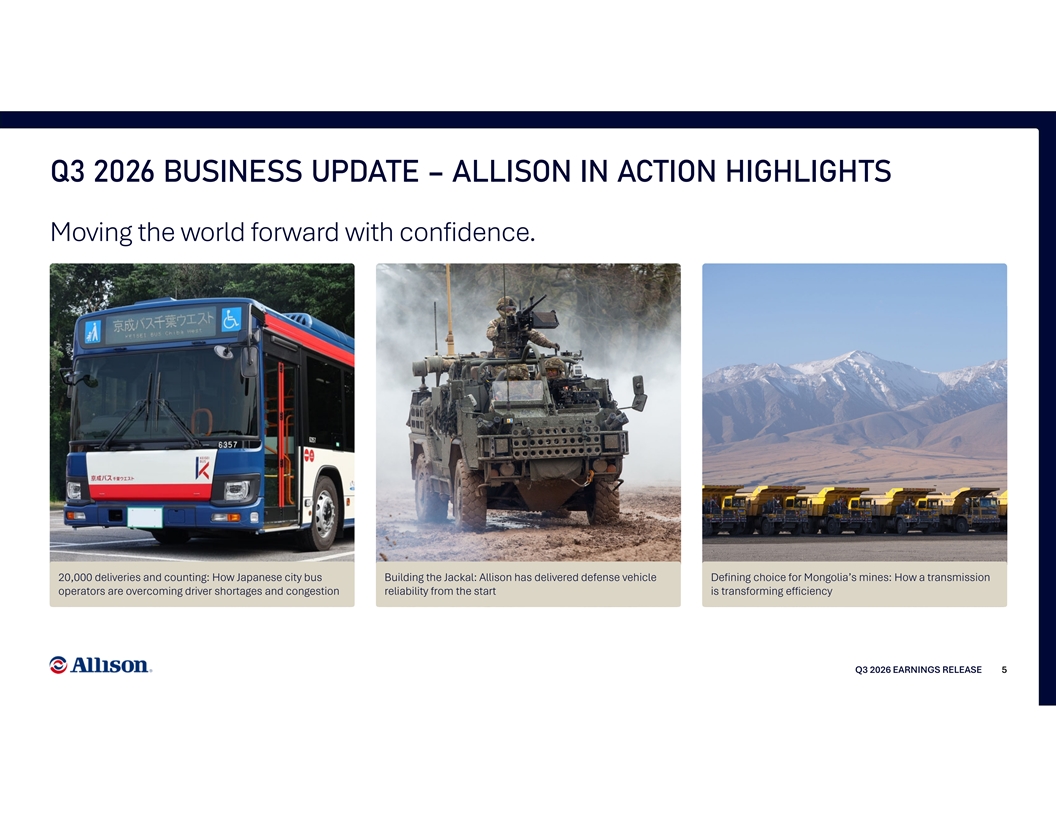
Q3 2026 BUSINESS UPDATE – ALLISON IN ACTION HIGHLIGHTS Moving the world forward with confidence. 20,000 deliveries and counting: How Japanese city bus Building the Jackal: Allison has delivered defense vehicle Defining choice for Mongolia’s mines: How a transmission operators are overcoming driver shortages and congestion reliability from the start is transforming efficiency Q3 2026 EARNINGS RELEASE 5
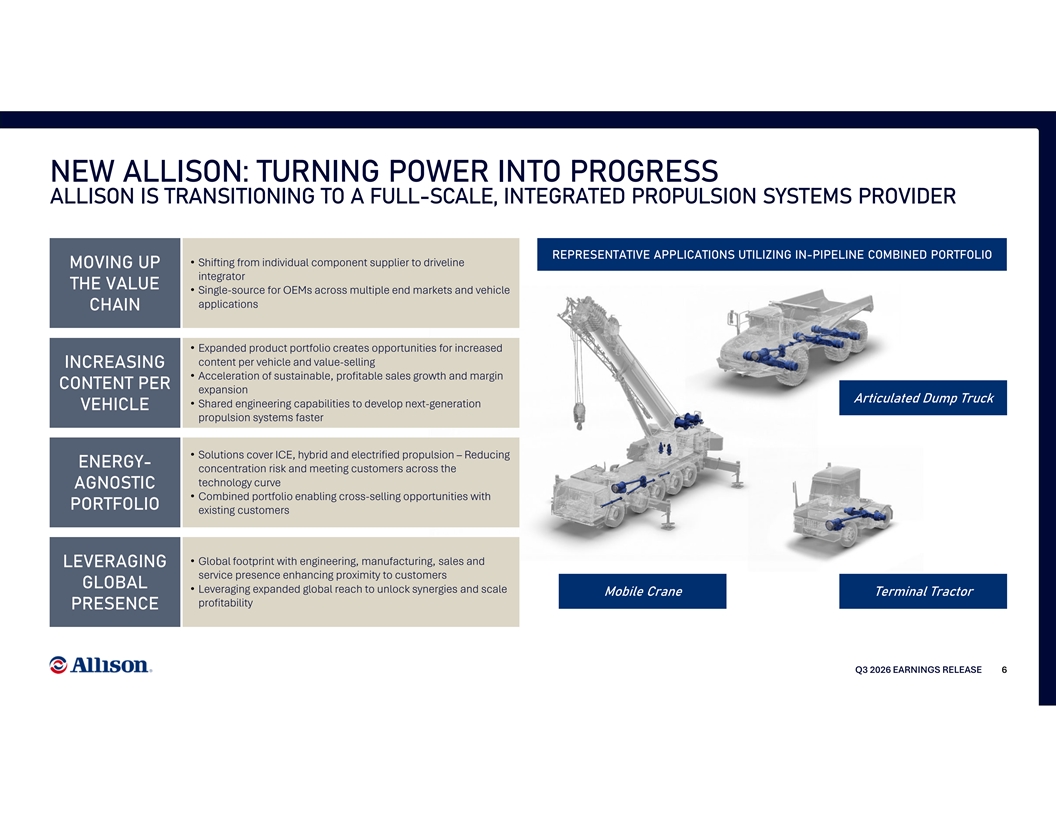
NEW ALLISON: TURNING POWER INTO PROGRESS ALLISON IS TRANSITIONING TO A FULL-SCALE, INTEGRATED PROPULSION SYSTEMS PROVIDER REPRESENTATIVE APPLICATIONS UTILIZING IN-PIPELINE COMBINED PORTFOLIO • Shifting from individual component supplier to driveline MOVING UP integrator THE VALUE • Single-source for OEMs across multiple end markets and vehicle applications CHAIN • Expanded product portfolio creates opportunities for increased content per vehicle and value-selling INCREASING • Acceleration of sustainable, profitable sales growth and margin CONTENT PER expansion Articulated Dump Truck • Shared engineering capabilities to develop next-generation VEHICLE propulsion systems faster • Solutions cover ICE, hybrid and electrified propulsion – Reducing ENERGY- concentration risk and meeting customers across the technology curve AGNOSTIC • Combined portfolio enabling cross-selling opportunities with PORTFOLIO existing customers • Global footprint with engineering, manufacturing, sales and LEVERAGING service presence enhancing proximity to customers GLOBAL • Leveraging expanded global reach to unlock synergies and scale Mobile Crane Terminal Tractor profitability PRESENCE Q3 2026 EARNINGS RELEASE 6
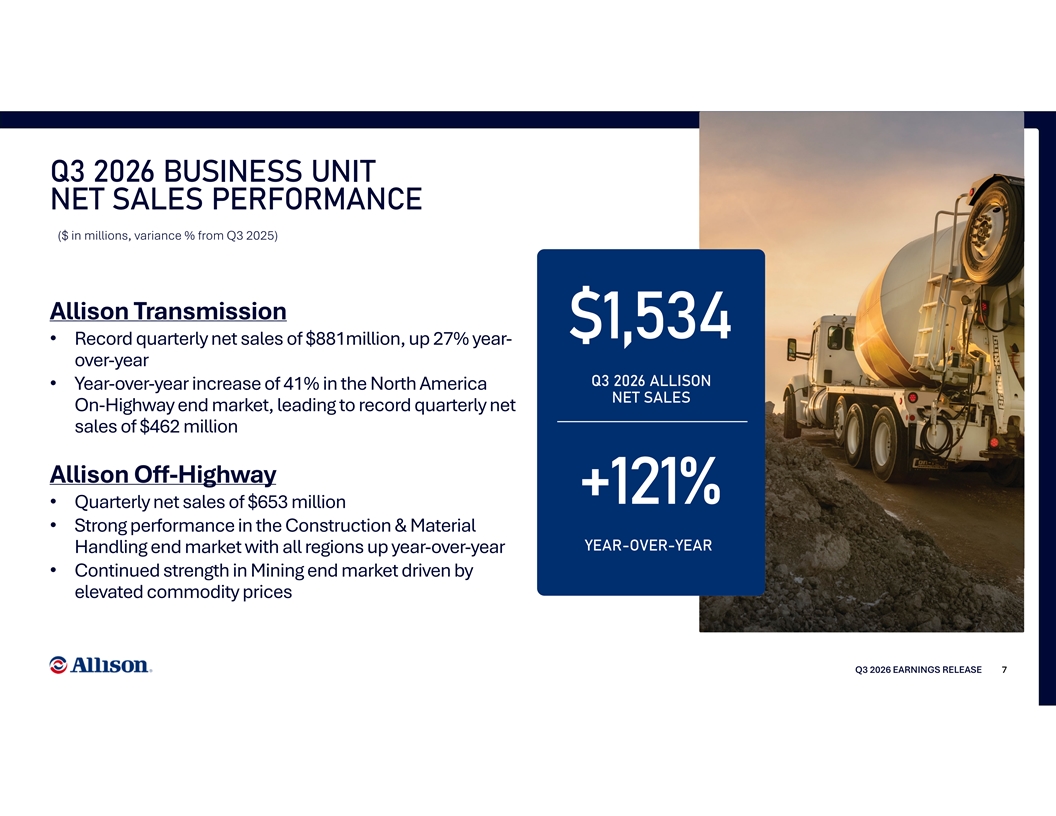
Q3 2026 BUSINESS UNIT NET SALES PERFORMANCE ($ in millions, variance % from Q3 2025) Allison Transmission $1,534 • Record quarterly net sales of $881million, up 27% year- over-year Q3 2026 ALLISON • Year-over-year increase of 41% in the North America NET SALES On-Highway end market, leading to record quarterly net sales of $462 million Allison Off-Highway +121% • Quarterly net sales of $653 million • Strong performance in the Construction & Material YEAR-OVER-YEAR Handling end market with all regions up year-over-year • Continued strength in Mining end market driven by elevated commodity prices Q3 2026 EARNINGS RELEASE 7
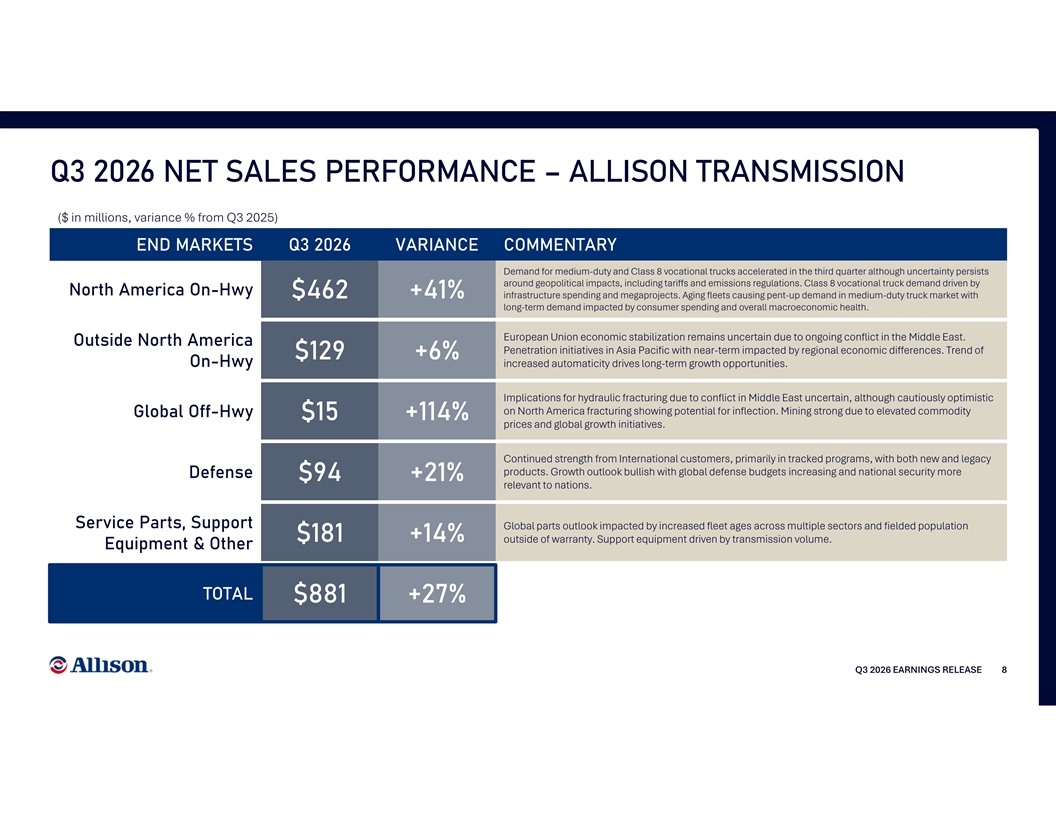
Q3 2026 NET SALES PERFORMANCE – ALLISON TRANSMISSION ($ in millions, variance % from Q3 2025) END MARKETS Q3 2026 VARIANCE COMMENTARY Demand for medium-duty and Class 8 vocational trucks accelerated in the third quarter although uncertainty persists around geopolitical impacts, including tariffs and emissions regulations. Class 8 vocational truck demand driven by North America On-Hwy $462 +41% infrastructure spending and megaprojects. Aging fleets causing pent-up demand in medium-duty truck market with long-term demand impacted by consumer spending and overall macroeconomic health. European Union economic stabilization remains uncertain due to ongoing conflict in the Middle East. Outside North America Penetration initiatives in Asia Pacific with near-term impacted by regional economic differences. Trend of $129 +6% On-Hwy increased automaticity drives long-term growth opportunities. Implications for hydraulic fracturing due to conflict in Middle East uncertain, although cautiously optimistic on North America fracturing showing potential for inflection. Mining strong due to elevated commodity Global Off-Hwy $15 +114% prices and global growth initiatives. Continued strength from International customers, primarily in tracked programs, with both new and legacy products. Growth outlook bullish with global defense budgets increasing and national security more Defense $94 +21% relevant to nations. Service Parts, Support Global parts outlook impacted by increased fleet ages across multiple sectors and fielded population $181 +14% outside of warranty. Support equipment driven by transmission volume. Equipment & Other TOTAL $881 +27% Q3 2026 EARNINGS RELEASE 8
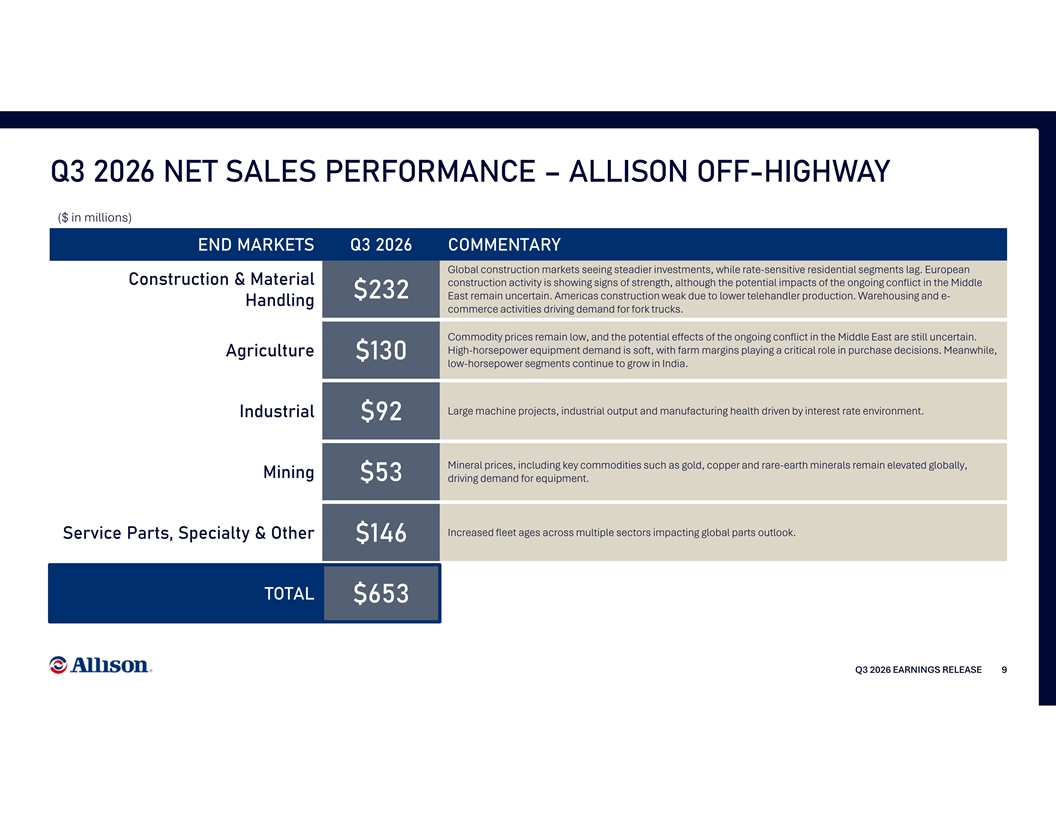
Q3 2026 NET SALES PERFORMANCE – ALLISON OFF-HIGHWAY ($ in millions) END MARKETS Q3 2026 COMMENTARY Global construction markets seeing steadier investments, while rate-sensitive residential segments lag. European Construction & Material construction activity is showing signs of strength, although the potential impacts of the ongoing conflict in the Middle $232 East remain uncertain. Americas construction weak due to lower telehandler production. Warehousing and e- Handling commerce activities driving demand for fork trucks. Commodity prices remain low, and the potential effects of the ongoing conflict in the Middle East are still uncertain. High-horsepower equipment demand is soft, with farm margins playing a critical role in purchase decisions. Meanwhile, Agriculture $130 low-horsepower segments continue to grow in India. Large machine projects, industrial output and manufacturing health driven by interest rate environment. Industrial $92 Mineral prices, including key commodities such as gold, copper and rare-earth minerals remain elevated globally, Mining $53 driving demand for equipment. Increased fleet ages across multiple sectors impacting global parts outlook. Service Parts, Specialty & Other $146 TOTAL $653 Q3 2026 EARNINGS RELEASE 9
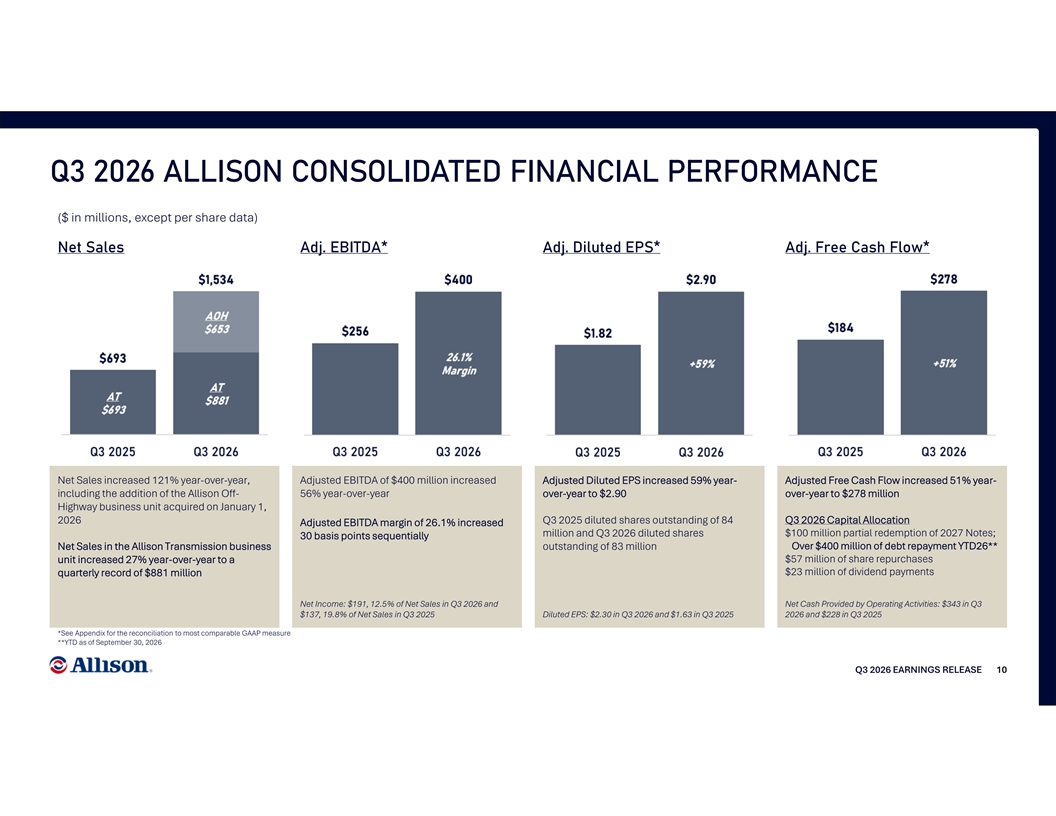
Q3 2026 ALLISON CONSOLIDATED FINANCIAL PERFORMANCE ($ in millions, except per share data) Net Sales Adj. EBITDA* Adj. Diluted EPS* Adj. Free Cash Flow* Net Sales increased 121% year-over-year, Adjusted EBITDA of $400 million increased Adjusted Diluted EPS increased 59% year- Adjusted Free Cash Flow increased 51% year- including the addition of the Allison Off- 56% year-over-year over-year to $2.90 over-year to $278 million Highway business unit acquired on January 1, 2026 Q3 2025 diluted shares outstanding of 84 Q3 2026 Capital Allocation Adjusted EBITDA margin of 26.1% increased million and Q3 2026 diluted shares $100 million partial redemption of 2027 Notes; 30 basis points sequentially Over $400 million of debt repayment YTD26** Net Sales in the Allison Transmission business outstanding of 83 million unit increased 27% year-over-year to a $57 million of share repurchases quarterly record of $881 million $23 million of dividend payments Net Income: $191, 12.5% of Net Sales in Q3 2026 and Net Cash Provided by Operating Activities: $343 in Q3 $137, 19.8% of Net Sales in Q3 2025 Diluted EPS: $2.30 in Q3 2026 and $1.63 in Q3 2025 2026 and $228 in Q3 2025 *See Appendix for the reconciliation to most comparable GAAP measure **YTD as of September 30, 2026 Q3 2026 EARNINGS RELEASE 10
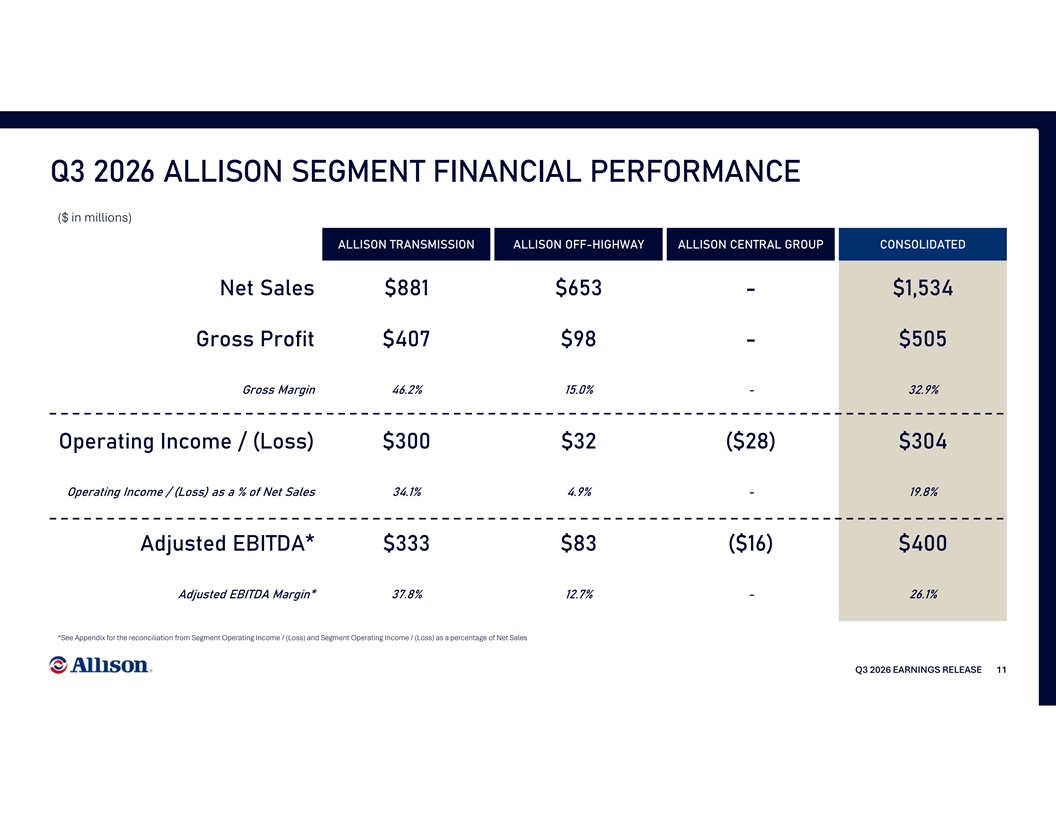
Q3 2026 ALLISON SEGMENT FINANCIAL PERFORMANCE ($ in millions) ALLISON TRANSMISSION ALLISON OFF-HIGHWAY ALLISON CENTRAL GROUP CONSOLIDATED Net Sales $881 $653 - $1,534 Gross Profit $407 $98 - $505 Gross Margin 46.2% 15.0% - 32.9% Operating Income / (Loss) $300 $32 ($28) $304 Operating Income / (Loss) as a % of Net Sales 34.1% 4.9% - 19.8% Adjusted EBITDA* $333 $83 ($16) $400 Adjusted EBITDA Margin* 37.8% 12.7% - 26.1% *See Appendix for the reconciliation from Segment Operating Income / (Loss) and Segment Operating Income / (Loss) as a percentage of Net Sales Q3 2026 EARNINGS RELEASE 11
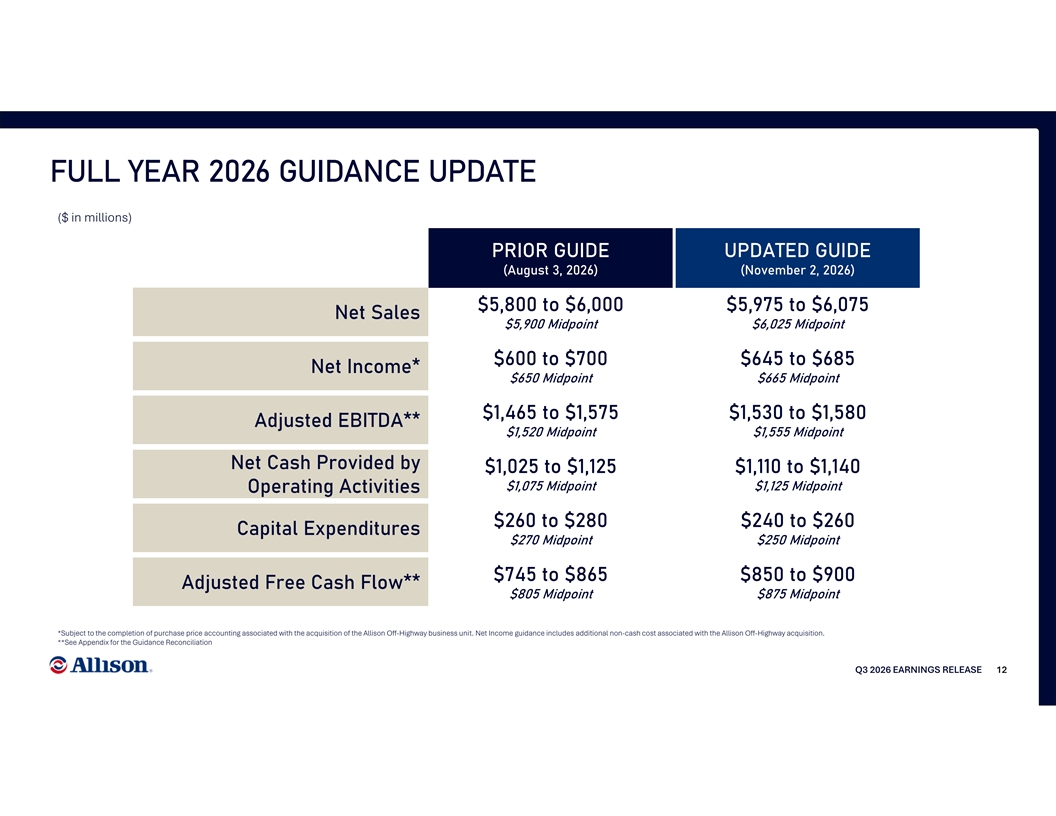
FULL YEAR 2026 GUIDANCE UPDATE ($ in millions) PRIOR GUIDE UPDATED GUIDE (August 3, 2026) (November 2, 2026) $5,800 to $6,000 $5,975 to $6,075 Net Sales $5,900 Midpoint $6,025 Midpoint $600 to $700 $645 to $685 Net Income* $650 Midpoint $665 Midpoint $1,465 to $1,575 $1,530 to $1,580 Adjusted EBITDA** $1,520 Midpoint $1,555 Midpoint Net Cash Provided by $1,025 to $1,125 $1,110 to $1,140 $1,075 Midpoint $1,125 Midpoint Operating Activities $260 to $280 $240 to $260 Capital Expenditures $270 Midpoint $250 Midpoint $745 to $865 $850 to $900 Adjusted Free Cash Flow** $805 Midpoint $875 Midpoint *Subject to the completion of purchase price accounting associated with the acquisition of the Allison Off-Highway business unit. Net Income guidance includes additional non-cash cost associated with the Allison Off-Highway acquisition. **See Appendix for the Guidance Reconciliation Q3 2026 EARNINGS RELEASE 12
APPENDIX Non-GAAP Financial Information PRESENTATION TITLE 13
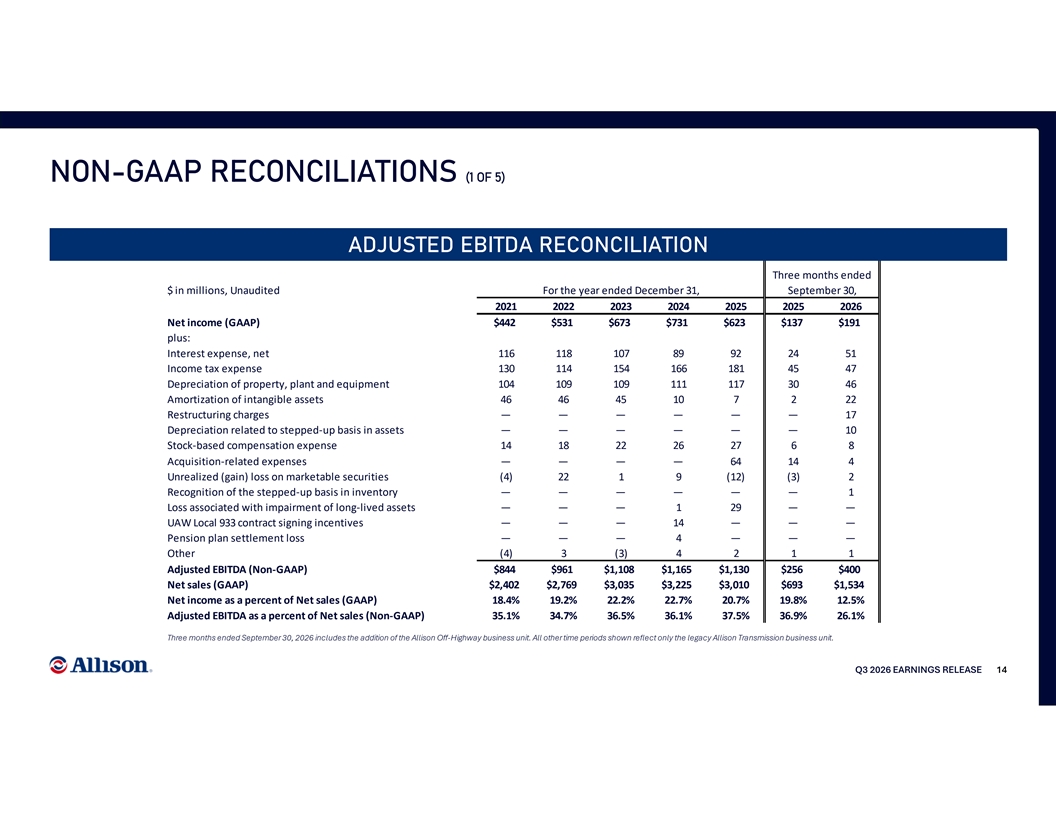
NON-GAAP RECONCILIATIONS (1 OF 5) ADJUSTED EBITDA RECONCILIATION Three months ended $ in millions, Unaudited For the year ended December 31, September 30, 2021 2022 2023 2024 2025 2025 2026 Net income (GAAP) $442 $531 $673 $731 $623 $137 $191 plus: Interest expense, net 116 118 107 89 92 24 51 Income tax expense 130 114 154 166 181 45 47 Depreciation of property, plant and equipment 104 109 109 111 117 30 46 Amortization of intangible assets 46 46 45 10 7 2 22 Restructuring charges ——— ———17 Depreciation related to stepped-up basis in assets ——— ———10 Stock-based compensation expense 14 18 22 26 27 6 8 Acquisition-related expenses — — — — 64 14 4 Unrealized (gain) loss on marketable securities (4) 22 1 9 (12) (3) 2 Recognition of the stepped-up basis in inventory — — — — — — 1 Loss associated with impairment of long-lived assets — — — 1 29 — — UAW Local 933 contract signing incentives — — — 14 — — — Pension plan settlement loss — — — 4 — — — Other (4) 3 (3) 4 2 1 1 Adjusted EBITDA (Non-GAAP) $844 $961 $1,108 $1,165 $1,130 $256 $400 Net sales (GAAP) $2,402 $2,769 $3,035 $3,225 $3,010 $693 $1,534 Net income as a percent of Net sales (GAAP) 18.4% 19.2% 22.2% 22.7% 20.7% 19.8% 12.5% Adjusted EBITDA as a percent of Net sales (Non-GAAP) 35.1% 34.7% 36.5% 36.1% 37.5% 36.9% 26.1% Three months ended September 30, 2026 includes the addition of the Allison Off-Highway business unit. All other time periods shown reflect only the legacy Allison Transmission business unit. Q3 2026 EARNINGS RELEASE 14
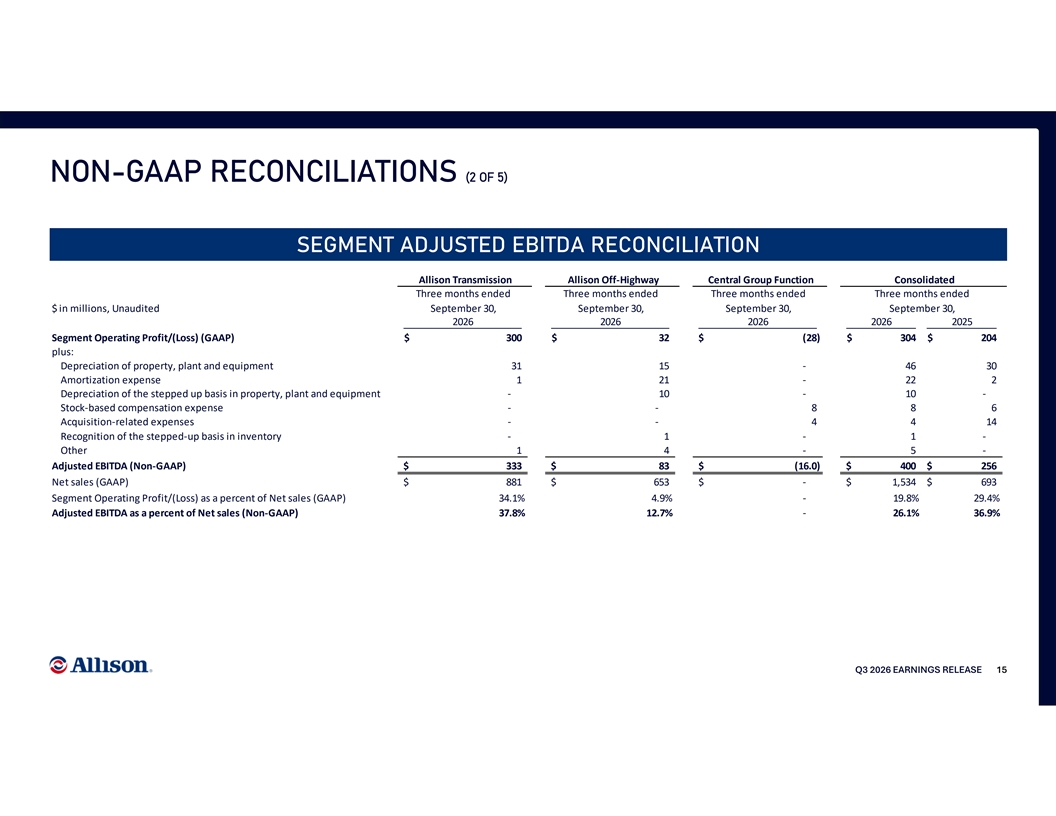
NON-GAAP RECONCILIATIONS (2 OF 5) SEGMENT ADJUSTED EBITDA RECONCILIATION Allison Transmission Allison Off-Highway Central Group Function Consolidated Three months ended Three months ended Three months ended Three months ended $ in millions, Unaudited September 30, September 30, September 30, September 30, 2026 2026 2026 2026 2025 Segment Operating Profit/(Loss) (GAAP) $ 300 $ 32 $ ( 28) $ 304 $ 204 plus: Depreciation of property, plant and equipment 31 15 - 46 3 0 Amortization expense 1 21 - 22 2 Depreciation of the stepped up basis in property, plant and equipment - 10 - 10 - Stock-based compensation expense - - 8 8 6 Acquisition-related expenses - - 4 4 1 4 Recognition of the stepped-up basis in inventory - 1 - 1 - Other 1 4 - 5 - Adjusted EBITDA (Non-GAAP) $ 333 $ 83 $ (16.0) $ 400 $ 256 Net sales (GAAP) $ 881 $ 653 $ - $ 1,534 $ 693 Segment Operating Profit/(Loss) as a percent of Net sales (GAAP) 34.1% 4.9% - 19.8% 29.4% Adjusted EBITDA as a percent of Net sales (Non-GAAP) 37.8% 12.7% - 26.1% 36.9% Q3 2026 EARNINGS RELEASE 15
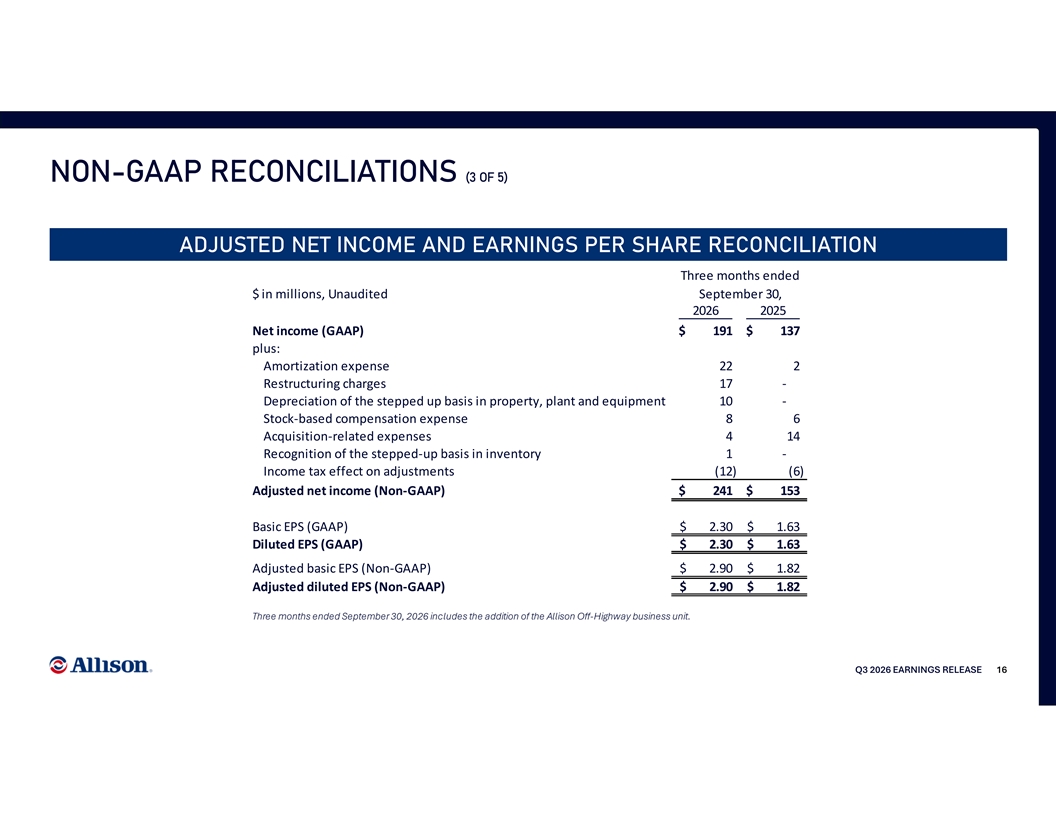
NON-GAAP RECONCILIATIONS (3 OF 5) ADJUSTED NET INCOME AND EARNINGS PER SHARE RECONCILIATION Three months ended $ in millions, Unaudited September 30, 2026 2025 Net income (GAAP) $ 191 $ 137 plus: Amortization expense 22 2 Restructuring charges 17 - Depreciation of the stepped up basis in property, plant and equipment 10 - Stock-based compensation expense 8 6 Acquisition-related expenses 4 14 Recognition of the stepped-up basis in inventory 1 - Income tax effect on adjustments ( 12) (6) Adjusted net income (Non-GAAP) $ 241 $ 153 Basic EPS (GAAP) $ 2.30 $ 1.63 Diluted EPS (GAAP) $ 2.30 $ 1.63 Adjusted basic EPS (Non-GAAP) $ 2.90 $ 1.82 Adjusted diluted EPS (Non-GAAP) $ 2.90 $ 1.82 Three months ended September 30, 2026 includes the addition of the Allison Off-Highway business unit. Q3 2026 EARNINGS RELEASE 16
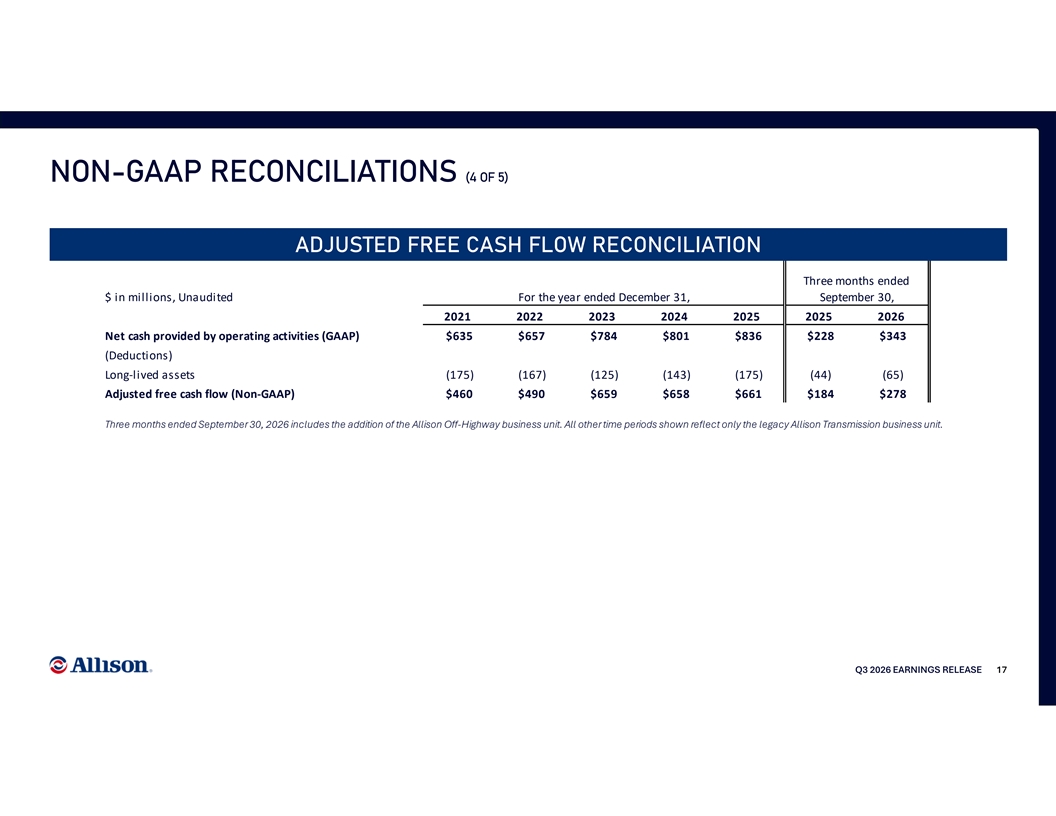
NON-GAAP RECONCILIATIONS (4 OF 5) ADJUSTED FREE CASH FLOW RECONCILIATION Three months ended $ in millions, Unaudited For the year ended December 31, September 30, 2021 2022 2023 2024 2025 2025 2026 Net cash provided by operating activities (GAAP) $635 $657 $784 $801 $836 $228 $343 (Deductions) Long-lived assets (175) (167) (125) (143) (175) (44) (65) Adjusted free cash flow (Non-GAAP) $460 $490 $659 $658 $661 $184 $278 Three months ended September 30, 2026 includes the addition of the Allison Off-Highway business unit. All other time periods shown reflect only the legacy Allison Transmission business unit. Q3 2026 EARNINGS RELEASE 17
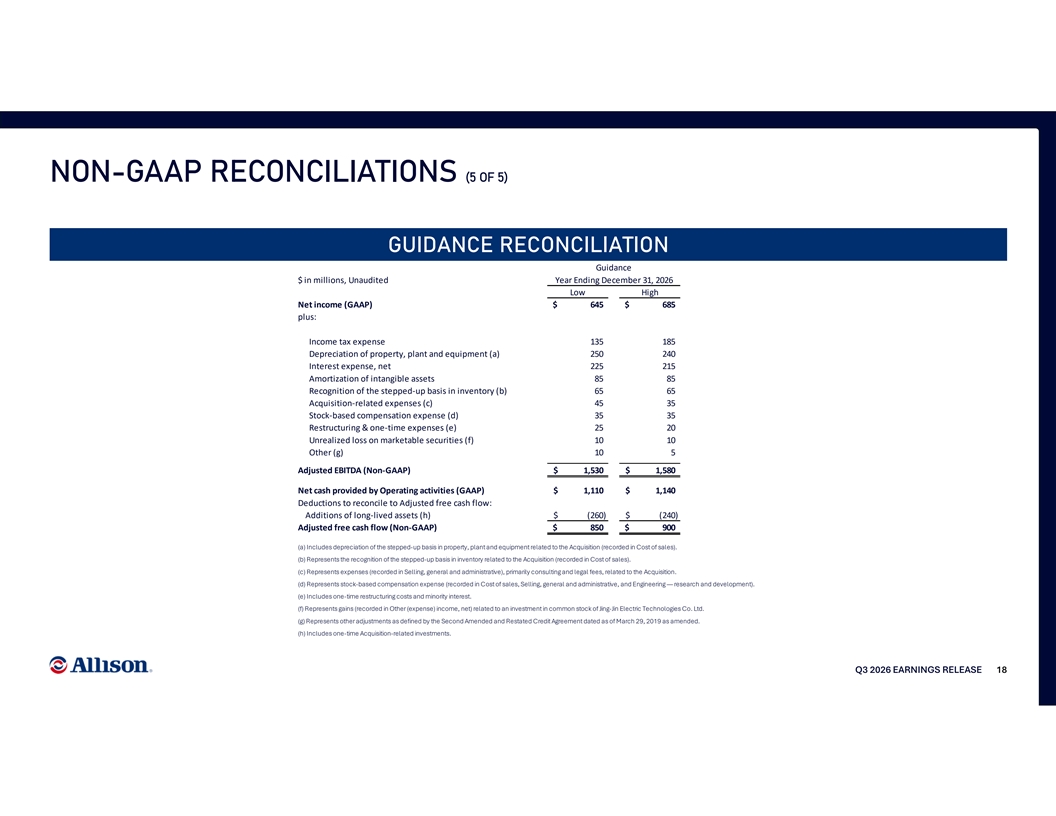
NON-GAAP RECONCILIATIONS (5 OF 5) GUIDANCE RECONCILIATION Guidance $ in millions, Unaudited Year Ending December 31, 2026 Low High Net income (GAAP) $ 645 $ 685 plus: Income tax expense 135 185 Depreciation of property, plant and equipment (a) 250 240 Interest expense, net 225 215 Amortization of intangible assets 85 8 5 Recognition of the stepped-up basis in inventory (b) 65 6 5 Acquisition-related expenses (c) 45 3 5 Stock-based compensation expense (d) 35 3 5 Restructuring & one-time expenses (e) 25 2 0 Unrealized loss on marketable securities (f) 10 1 0 Other (g) 10 5 Adjusted EBITDA (Non-GAAP) $ 1,530 $ 1,580 Net cash provided by Operating activities (GAAP) $ 1,110 $ 1,140 Deductions to reconcile to Adjusted free cash flow: Additions of long-lived assets (h) $ (260) $ (240) Adjusted free cash flow (Non-GAAP) $ 850 $ 900 (a) Includes depreciation of the stepped-up basis in property, plant and equipment related to the Acquisition (recorded in Cost of sales). (b) Represents the recognition of the stepped-up basis in inventory related to the Acquisition (recorded in Cost of sales). (c) Represents expenses (recorded in Selling, general and administrative), primarily consulting and legal fees, related to the Acquisition. (d) Represents stock-based compensation expense (recorded in Cost of sales, Selling, general and administrative, and Engineering — research and development). (e) Includes one-time restructuring costs and minority interest. (f) Represents gains (recorded in Other (expense) income, net) related to an investment in common stock of Jing-Jin Electric Technologies Co. Ltd. (g) Represents other adjustments as defined by the Second Amended and Restated Credit Agreement dated as of March 29, 2019 as amended. (h) Includes one-time Acquisition-related investments. Q3 2026 EARNINGS RELEASE 18