ADDITIONAL INFORMATION
This contains important information about the Sparrow Growth Fund – Class A - SGFFX (the “Fund”) for the period September 1, 2025 to August 31, 2026.
You can find additional information about the Fund at www.sparrowcapital.com. You can also request this information by contacting us at 888-727-3301.
expense Information
What were the Fund costs for the past year?
(based on a hypothetical $10,000 investment)
| Fund Name | Costs of a $10,000 investment | Costs paid as a percentage of a $10,000 investment |
| Sparrow Growth Fund – Class A | $181 | 1.76% |
managment’s discussion of fund performance
The Sparrow Growth Fund – Class A enjoyed positive returns for the year ended August 31, 2026, buoyed in part by favorable stock market conditions. These market conditions were supported by increased capital spending on Artificial Intelligence, including data centers and internet websites and software giants Microsoft and Google. The Fund increased +5.88% (without load) and decreased -0.20% (with load) while the S&P 500 Index increased +20.38%. The difference of returns was due to our allocation to financial services and consumer investments which presents a lower risk than other technology sectors faster paced hardware technology sectors.
Strategy
Our strategy of buying and holding profitable companies with growth potential included Nvidia, Google and Netflix, each of which had a strong, positive impact on Fund performance.
Techniques
Our security selection may lead to lower relative turnover and lower realized capital gains taxes because we tend to be long-term business owners. Our selection process includes companies with above average sales and earnings per share growth. We believe that companies that have sales and earnings growth rates that are above average may produce a return over long periods of time that exceed market averages.
Thank you for your confidence.
Gerry Sparrow
Performance graph
AVERAGE ANNUAL RETURNS
| 1 Year | 5 Years | 10 Years | |
| Sparrow Growth Fund – Class A (with load) | -0.20% | 3.53% | 15.32% |
| Sparrow Growth Fund – Class A (without load) | 5.88% | 4.76% | 16.01% |
| S&P 500 Index | 20.38% | 12.78% | 15.37% |
Total Return Based on a $10,000 Investment
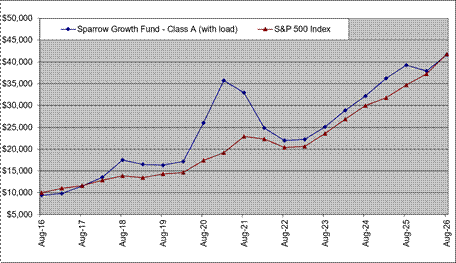
Past performance is not a good predictor of future performance. The returns shown do not reflect taxes that a shareholder would pay on Fund distributions or on the redemption of Fund shares. Updated performance data current to the most recent month-end can be obtained by calling 888-727-3301.
Fund statistics
| PORTFOLIO | PORTFOLIO | ADVISORY FEES | |
| NET ASSETS: | HOLDINGS: | TURNOVER: | PAID BY FUND: |
| $74,208,380 | 84 | 17.57% | $729,751 |
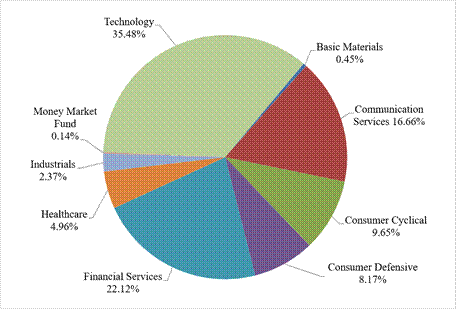
SECTOR WEIGHTINGS
The following chart gives a visual breakdown of the Fund by the sectors the underlying securities represent as a percentage of the portfolio of investments.
top ten holdings
(% OF NET ASSETS)
| 1. | Alphabet Inc. Class A | 8.98% |
| 2. | NVIDIA Corp. | 6.85% |
| 3. | Apple, Inc. | 5.70% |
| 4. | Amazon.com, Inc. | 5.42% |
| 5. | Walmart, Inc. | 5.18% |
| 6. | Microsoft Corp. | 5.06% |
| 7. | American Express Co. | 4.54% |
| 8. | Meta Platforms, Inc. Class A | 4.25% |
| 9. | Broadcom, Inc. | 3.79% |
| 10. | Visa, Inc. Class A | 3.74% |
| Total % of Net Assets | 53.51% |
ADDITIONAL INFORMATION
This annual shareholder report contains important information about the Sparrow Growth Fund – Class C - SGFCX (the “Fund”) for the period September 1, 2025 to August 31, 2026.
You can find additional information about the Fund at www.sparrowcapital.com. You can also request this information by contacting us at 888-727-3301.
expense Information
What were the Fund costs for the past year?
(based on a hypothetical $10,000 investment)
| Fund Name | Costs of a $10,000 investment | Costs paid as a percentage of a $10,000 investment |
| Sparrow Growth Fund – Class C | $232 | 2.26% |
managment’s discussion of fund performance
The Sparrow Growth Fund – Class C enjoyed positive returns for the year ended August 31, 2026, buoyed in part by favorable stock market conditions. These market conditions were supported by increased capital spending on Artificial Intelligence, including data centers and internet websites and software giants Microsoft and Google. The Fund increased +5.36% while the S&P 500 Index increased +20.38%. The difference of returns was due to our allocation to financial services and consumer investments which presents a lower risk than other technology sectors faster paced hardware technology sectors.
Strategy
Our strategy of buying and holding profitable companies with growth potential included Nvidia, Google and Netflix, each of which had a strong, positive impact on Fund performance.
Techniques
Our security selection may lead to lower relative turnover and lower realized capital gains taxes because we tend to be long-term business owners. Our selection process includes companies with above average sales and earnings per share growth. We believe that companies that have sales and earnings growth rates that are above average may produce a return over long periods of time that exceed market averages.
Thank you for your confidence.
Gerry Sparrow
Performance graph
AVERAGE ANNUAL RETURNS
| 1 Year | 5 Years | 10 Years | |
| Sparrow Growth Fund – Class C | 5.36% | 4.24% | 15.41% |
| S&P 500 Index | 20.38% | 12.78% | 15.37% |
Total Return Based on a $10,000 Investment
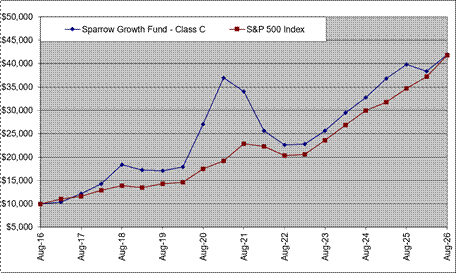
Past performance is not a good predictor of future performance. The returns shown do not reflect taxes that a shareholder would pay on Fund distributions or on the redemption of Fund shares. Updated performance data current to the most recent month-end can be obtained by calling 888-727-3301.
Fund statistics
| PORTFOLIO | PORTFOLIO | ADVISORY FEES | |
| NET ASSETS: | HOLDINGS: | TURNOVER: | PAID BY FUND: |
| $74,208,380 | 84 | 17.57% | $729,751 |
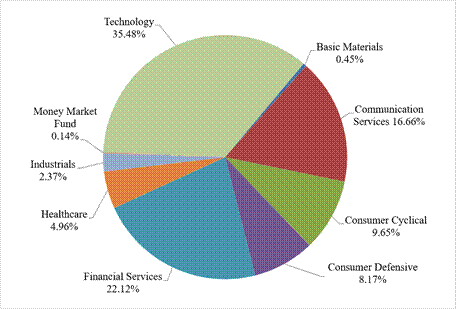
SECTOR WEIGHTINGS
The following chart gives a visual breakdown of the Fund by the sectors the underlying securities represent as a percentage of the portfolio of investments.
top ten holdings
(% OF NET ASSETS)
| 1. | Alphabet Inc. Class A | 8.98% |
| 2. | NVIDIA Corp. | 6.85% |
| 3. | Apple, Inc. | 5.70% |
| 4. | Amazon.com, Inc. | 5.42% |
| 5. | Walmart, Inc. | 5.18% |
| 6. | Microsoft Corp. | 5.06% |
| 7. | American Express Co. | 4.54% |
| 8. | Meta Platforms, Inc. Class A | 4.25% |
| 9. | Broadcom, Inc. | 3.79% |
| 10. | Visa, Inc. Class A | 3.74% |
| Total % of Net Assets | 53.51% |
ADDITIONAL INFORMATION
This contains important information about the Sparrow Growth Fund – No-Load Class - SGNFX (the “Fund”) for the period September 1, 2025 to August 31, 2026.
You can find additional information about the Fund at www.sparrowcapital.com. You can also request this information by contacting us at 888-727-3301.
expense Information
What were the Fund costs for the past year?
(based on a hypothetical $10,000 investment)
| Fund Name | Costs of a $10,000 investment | Costs paid as a percentage of a $10,000 investment |
| Sparrow Growth Fund – No-Load Class | $130 | 1.26% |
managment’s discussion of fund performance
The Sparrow Growth Fund – No-Load Class enjoyed positive returns for the year ended August 31, 2026, buoyed in part by favorable stock market conditions. These market conditions were supported by increased capital spending on Artificial Intelligence, including data centers and internet websites and software giants Microsoft and Google. The Fund increased +6.41% while the S&P 500 Index increased +20.38%. The difference of returns was due to our allocation to financial services and consumer investments which presents a lower risk than other technology sectors faster paced hardware technology sectors.
Strategy
Our strategy of buying and holding profitable companies with growth potential included Nvidia, Google and Netflix, each of which had a strong, positive impact on Fund performance.
Techniques
Our security selection may lead to lower relative turnover and lower realized capital gains taxes because we tend to be long-term business owners. Our selection process includes companies with above average sales and earnings per share growth. We believe that companies that have sales and earnings growth rates that are above average may produce a return over long periods of time that exceed market averages.
Thank you for your confidence.
Gerry Sparrow
Performance graph
AVERAGE ANNUAL RETURNS
| 1 Year | 5 Years | 10 Years | |
| Sparrow Growth Fund – No-Load Class | 6.41% | 5.29% | 16.48% |
| S&P 500 Index | 20.38% | 12.78% | 15.37% |
Total Return Based on $10,000 Investment
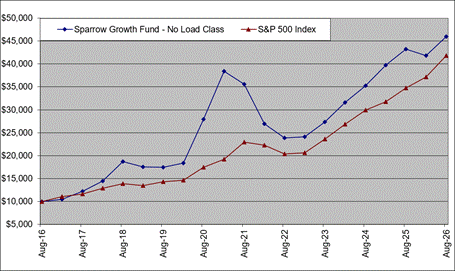
Past performance is not a good predictor of future performance. The returns shown do not reflect taxes that a shareholder would pay on Fund distributions or on the redemption of Fund shares. Updated performance data current to the most recent month-end can be obtained by calling 888-727-3301.
Fund statistics
| PORTFOLIO | PORTFOLIO | ADVISORY FEES | |
| NET ASSETS: | HOLDINGS: | TURNOVER: | PAID BY FUND: |
| $74,208,380 | 84 | 17.57% | $729,751 |
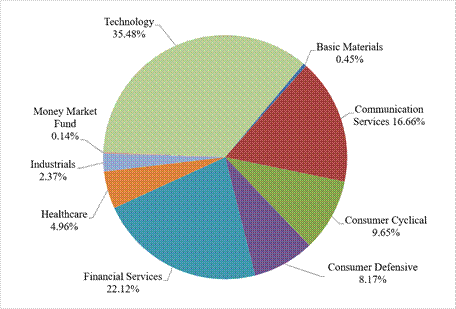
SECTOR WEIGHTINGS
The following chart gives a visual breakdown of the Fund by the sectors the underlying securities represent as a percentage of the portfolio of investments.
top ten holdings
(% OF NET ASSETS)
| 1. | Alphabet Inc. Class A | 8.98% |
| 2. | NVIDIA Corp. | 6.85% |
| 3. | Apple, Inc. | 5.70% |
| 4. | Amazon.com, Inc. | 5.42% |
| 5. | Walmart, Inc. | 5.18% |
| 6. | Microsoft Corp. | 5.06% |
| 7. | American Express Co. | 4.54% |
| 8. | Meta Platforms, Inc. Class A | 4.25% |
| 9. | Broadcom, Inc. | 3.79% |
| 10. | Visa, Inc. Class A | 3.74% |
| Total % of Net Assets | 53.51% |