Shareholder Report
|
|
12 Months Ended |
Sep. 01, 2025 |
Aug. 31, 2026
USD ($)
Holding
|
| Shareholder Report [Line Items] |
|
|
| Document Type |
|
N-CSR
|
| Amendment Flag |
|
false
|
| Registrant Name |
|
DEUTSCHE DWS ASSET ALLOCATION TRUST
|
| Entity Central Index Key |
|
0000926425
|
| Entity Investment Company Type |
|
N-1A
|
| Document Period End Date |
|
Aug. 31, 2026
|
| Shareholder Report Annual or Semi-Annual |
|
Annual Shareholder Report
|
| C000016765 |
|
|
| Shareholder Report [Line Items] |
|
|
| Fund Name |
|
DWS Multi-Asset Conservative Allocation Fund
|
| Class Name |
|
Class A
|
| Trading Symbol |
|
SPDAX
|
| Annual or Semi-Annual Statement [Text Block] |
|
This annual shareholder report contains important information about DWS Multi-Asset Conservative Allocation Fund (the "Fund") for the period September 1, 2025 to August 31, 2026.
|
| Additional Information [Text Block] |
|
You can find additional information about the Fund on the Fund's website at dws.com/mutualreports. You can also request this information by contacting us at (800) 728-3337.
|
| Additional Information Phone Number |
|
(800) 728-3337
|
| Additional Information Website |
|
<span style="box-sizing: border-box; color: rgb(0, 0, 0); display: inline; flex-wrap: nowrap; font-size: 14.6667px; font-weight: 300; grid-area: auto; line-height: 17.6px; margin: 0px; overflow: visible; text-align: left; text-align-last: auto; white-space-collapse: preserve-breaks;">dws.com/mutualreports</span>
|
| Expenses [Text Block] |
|
What were the Fund costs for the last year?(Based on a hypothetical $10,000 investment) Table SummaryFund | Costs of a $10,000 investment | Costs paid as a percentage of a $10,000 investment |
|---|
Class A | $74 | 0.72% |
|---|
Gross expense ratio as of the latest prospectus: 1.12%. See prospectus for any contractual or voluntary waivers; without a waiver, costs would have been higher. Fund costs do not reflect expenses of the underlying funds in which the Fund invests. |
| Expenses Paid, Amount |
|
$ 74
|
| Expense Ratio, Percent |
|
0.72%
|
| Factors Affecting Performance [Text Block] |
|
How did the Fund perform last year and what affected its performance? Class A shares of the Fund returned 6.70% (unadjusted for sales charges) for the period ended August 31, 2026. The Fund's broad-based indices, the MSCI ACWI All Cap Index and the Bloomberg Global Aggregate Index, returned 22.34% and 0.60%, respectively for the same period, while the Fund's additional, more narrowly based index, the S&P Target Risk Conservative Index, returned 8.14%. The Fund’s underweight in equities relative to fixed income was the largest detractor from relative performance versus the S& P Target Risk Conservative Index, reflecting stocks’ strong outperformance versus bonds in the annual period. Within equities, the Fund’s overweight in U.S. large caps contributed positively. However, underweights in developed-market international and emerging-market stocks detracted. In fixed income, allocations to categories that are not represented in the S&P Target Risk Conservative Index, including emerging-market debt, high yield bonds, investment-grade corporates, and securitized assets, contributed to relative performance. Credit-oriented market segments performed well in the period, reflecting investors’ strong appetite for risk. An overweight in developed-market international bonds detracted from relative performance, as yields climbed in the latter half of the period on growing concerns about stubborn inflation and rising government debt. The Fund’s allocation to real assets and alternatives—which includes commodity futures, U.S. REITs, global REITs, global infrastructure, and natural resources equities—was an additional contributor. Commodities performed particularly well due to the supply disruptions caused by the conflict in Iran, and natural resources stocks were boosted by both the strength in commodity prices and the rally in the broader equity market. The Fund used derivatives to adjust its positioning and take advantage of tactical opportunities. Derivatives made a positive net contribution. Equity-index futures were positive in aggregate, while interest-rate futures had only a minor effect. Currency futures had a modest negative impact overall. |
| Performance Past Does Not Indicate Future [Text] |
|
The Fund's past performance is not a good predictor or guarantee of the Fund's future performance.
|
| Line Graph [Table Text Block] |
|
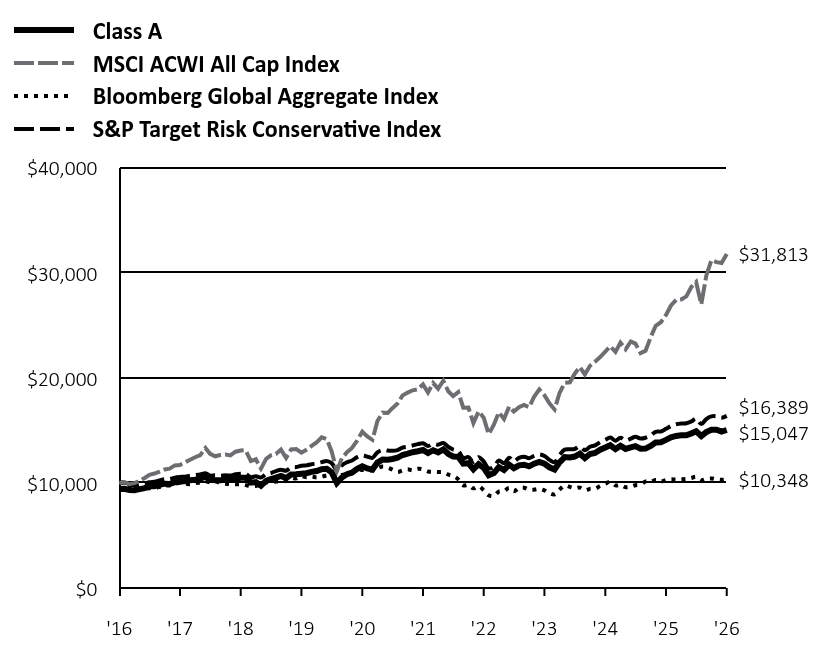 Table Summary | Class A | MSCI ACWI All Cap Index | Bloomberg Global Aggregate Index | S&P Target Risk Conservative Index |
|---|
'16 | $9,425 | $10,000 | $10,000 | $10,000 |
|---|
'16 | $9,447 | $10,077 | $10,055 | $10,023 |
|---|
'16 | $9,339 | $9,881 | $9,776 | $9,898 |
|---|
'16 | $9,300 | $9,988 | $9,388 | $9,770 |
|---|
'16 | $9,414 | $10,204 | $9,344 | $9,857 |
|---|
'17 | $9,515 | $10,482 | $9,450 | $9,931 |
|---|
'17 | $9,686 | $10,770 | $9,494 | $10,075 |
|---|
'17 | $9,697 | $10,898 | $9,509 | $10,126 |
|---|
'17 | $9,814 | $11,072 | $9,616 | $10,239 |
|---|
'17 | $9,931 | $11,293 | $9,765 | $10,357 |
|---|
'17 | $9,896 | $11,362 | $9,756 | $10,376 |
|---|
'17 | $10,076 | $11,673 | $9,920 | $10,495 |
|---|
'17 | $10,115 | $11,715 | $10,019 | $10,568 |
|---|
'17 | $10,188 | $11,968 | $9,929 | $10,606 |
|---|
'17 | $10,251 | $12,209 | $9,891 | $10,699 |
|---|
'17 | $10,322 | $12,448 | $10,001 | $10,745 |
|---|
'17 | $10,414 | $12,653 | $10,035 | $10,812 |
|---|
'18 | $10,603 | $13,335 | $10,155 | $10,934 |
|---|
'18 | $10,319 | $12,779 | $10,065 | $10,703 |
|---|
'18 | $10,270 | $12,541 | $10,172 | $10,724 |
|---|
'18 | $10,262 | $12,657 | $10,009 | $10,680 |
|---|
'18 | $10,310 | $12,708 | $9,933 | $10,725 |
|---|
'18 | $10,284 | $12,631 | $9,889 | $10,709 |
|---|
'18 | $10,395 | $12,976 | $9,873 | $10,826 |
|---|
'18 | $10,499 | $13,095 | $9,883 | $10,884 |
|---|
'18 | $10,496 | $13,115 | $9,798 | $10,863 |
|---|
'18 | $10,025 | $12,086 | $9,688 | $10,554 |
|---|
'18 | $10,080 | $12,254 | $9,719 | $10,640 |
|---|
'18 | $9,750 | $11,366 | $9,915 | $10,518 |
|---|
'19 | $10,208 | $12,290 | $10,066 | $10,848 |
|---|
'19 | $10,360 | $12,632 | $10,008 | $10,946 |
|---|
'19 | $10,502 | $12,760 | $10,133 | $11,132 |
|---|
'19 | $10,663 | $13,181 | $10,103 | $11,263 |
|---|
'19 | $10,462 | $12,394 | $10,240 | $11,166 |
|---|
'19 | $10,805 | $13,188 | $10,467 | $11,479 |
|---|
'19 | $10,838 | $13,227 | $10,438 | $11,513 |
|---|
'19 | $10,887 | $12,891 | $10,650 | $11,633 |
|---|
'19 | $10,932 | $13,161 | $10,542 | $11,677 |
|---|
'19 | $11,055 | $13,524 | $10,612 | $11,788 |
|---|
'19 | $11,136 | $13,861 | $10,532 | $11,858 |
|---|
'19 | $11,320 | $14,355 | $10,593 | $11,989 |
|---|
'20 | $11,345 | $14,163 | $10,728 | $12,081 |
|---|
'20 | $11,009 | $13,001 | $10,801 | $11,892 |
|---|
'20 | $9,998 | $11,125 | $10,559 | $11,241 |
|---|
'20 | $10,526 | $12,352 | $10,766 | $11,685 |
|---|
'20 | $10,830 | $12,923 | $10,813 | $11,972 |
|---|
'20 | $10,992 | $13,337 | $10,909 | $12,145 |
|---|
'20 | $11,357 | $14,028 | $11,257 | $12,458 |
|---|
'20 | $11,581 | $14,880 | $11,240 | $12,630 |
|---|
'20 | $11,386 | $14,422 | $11,200 | $12,507 |
|---|
'20 | $11,277 | $14,110 | $11,210 | $12,395 |
|---|
'20 | $11,944 | $15,901 | $11,414 | $12,921 |
|---|
'20 | $12,229 | $16,696 | $11,567 | $13,148 |
|---|
'21 | $12,212 | $16,674 | $11,466 | $13,082 |
|---|
'21 | $12,280 | $17,126 | $11,268 | $13,066 |
|---|
'21 | $12,400 | $17,568 | $11,051 | $13,133 |
|---|
'21 | $12,666 | $18,327 | $11,191 | $13,370 |
|---|
'21 | $12,795 | $18,603 | $11,296 | $13,457 |
|---|
'21 | $12,932 | $18,825 | $11,196 | $13,569 |
|---|
'21 | $13,019 | $18,915 | $11,345 | $13,702 |
|---|
'21 | $13,139 | $19,382 | $11,298 | $13,789 |
|---|
'21 | $12,851 | $18,614 | $11,098 | $13,523 |
|---|
'21 | $13,119 | $19,514 | $11,071 | $13,724 |
|---|
'21 | $12,920 | $18,985 | $11,038 | $13,650 |
|---|
'21 | $13,203 | $19,736 | $11,023 | $13,803 |
|---|
'22 | $12,753 | $18,708 | $10,797 | $13,425 |
|---|
'22 | $12,523 | $18,282 | $10,669 | $13,190 |
|---|
'22 | $12,501 | $18,654 | $10,344 | $13,032 |
|---|
'22 | $11,836 | $17,173 | $9,777 | $12,393 |
|---|
'22 | $11,882 | $17,181 | $9,804 | $12,459 |
|---|
'22 | $11,298 | $15,698 | $9,489 | $11,990 |
|---|
'22 | $11,789 | $16,816 | $9,691 | $12,459 |
|---|
'22 | $11,446 | $16,222 | $9,308 | $12,052 |
|---|
'22 | $10,728 | $14,653 | $8,830 | $11,387 |
|---|
'22 | $10,942 | $15,552 | $8,769 | $11,526 |
|---|
'22 | $11,521 | $16,733 | $9,182 | $12,149 |
|---|
'22 | $11,237 | $16,096 | $9,232 | $11,873 |
|---|
'23 | $11,744 | $17,282 | $9,535 | $12,407 |
|---|
'23 | $11,415 | $16,801 | $9,218 | $12,075 |
|---|
'23 | $11,684 | $17,208 | $9,509 | $12,395 |
|---|
'23 | $11,741 | $17,424 | $9,551 | $12,498 |
|---|
'23 | $11,590 | $17,211 | $9,365 | $12,365 |
|---|
'23 | $11,841 | $18,212 | $9,364 | $12,581 |
|---|
'23 | $12,012 | $18,909 | $9,429 | $12,716 |
|---|
'23 | $11,832 | $18,364 | $9,300 | $12,561 |
|---|
'23 | $11,492 | $17,591 | $9,028 | $12,201 |
|---|
'23 | $11,282 | $17,001 | $8,920 | $11,980 |
|---|
'23 | $11,968 | $18,570 | $9,370 | $12,656 |
|---|
'23 | $12,470 | $19,550 | $9,759 | $13,171 |
|---|
'24 | $12,421 | $19,591 | $9,625 | $13,206 |
|---|
'24 | $12,518 | $20,406 | $9,504 | $13,241 |
|---|
'24 | $12,790 | $21,050 | $9,556 | $13,466 |
|---|
'24 | $12,377 | $20,334 | $9,315 | $13,115 |
|---|
'24 | $12,760 | $21,158 | $9,437 | $13,444 |
|---|
'24 | $12,855 | $21,543 | $9,451 | $13,582 |
|---|
'24 | $13,161 | $21,993 | $9,712 | $13,880 |
|---|
'24 | $13,378 | $22,504 | $9,941 | $14,112 |
|---|
'24 | $13,587 | $23,020 | $10,111 | $14,334 |
|---|
'24 | $13,230 | $22,485 | $9,772 | $14,023 |
|---|
'24 | $13,548 | $23,360 | $9,805 | $14,296 |
|---|
'24 | $13,244 | $22,734 | $9,595 | $14,039 |
|---|
'25 | $13,398 | $23,475 | $9,649 | $14,222 |
|---|
'25 | $13,511 | $23,268 | $9,787 | $14,395 |
|---|
'25 | $13,268 | $22,369 | $9,847 | $14,233 |
|---|
'25 | $13,278 | $22,584 | $10,137 | $14,309 |
|---|
'25 | $13,526 | $23,890 | $10,101 | $14,521 |
|---|
'25 | $13,863 | $24,974 | $10,292 | $14,872 |
|---|
'25 | $13,884 | $25,307 | $10,139 | $14,905 |
|---|
'25 | $14,102 | $26,004 | $10,286 | $15,155 |
|---|
'25 | $14,342 | $26,899 | $10,354 | $15,420 |
|---|
'25 | $14,478 | $27,443 | $10,327 | $15,590 |
|---|
'25 | $14,551 | $27,478 | $10,351 | $15,667 |
|---|
'25 | $14,542 | $27,765 | $10,378 | $15,688 |
|---|
'26 | $14,725 | $28,680 | $10,475 | $15,871 |
|---|
'26 | $14,919 | $29,134 | $10,593 | $16,122 |
|---|
'26 | $14,467 | $27,006 | $10,267 | $15,608 |
|---|
'26 | $14,845 | $29,736 | $10,395 | $16,087 |
|---|
'26 | $15,075 | $31,221 | $10,430 | $16,342 |
|---|
'26 | $15,070 | $31,027 | $10,356 | $16,354 |
|---|
'26 | $14,885 | $30,946 | $10,301 | $16,215 |
|---|
'26 | $15,047 | $31,813 | $10,348 | $16,389 |
|---|
|
| Average Annual Return [Table Text Block] |
|
Table SummaryClass/Index
| 1-Year | 5-Year | 10-Year |
|---|
Class A Unadjusted for Sales Charge | 6.70% | 2.75% | 4.79% |
|---|
Class A Adjusted for the Maximum Sales Charge (max 5.75% load) | 0.56% | 1.54% | 4.17% |
|---|
MSCI ACWI All Cap Index | 22.34% | 10.42% | 12.27% |
|---|
Bloomberg Global Aggregate Index | 0.60% | -1.74% | 0.34% |
|---|
S&P Target Risk Conservative Index | 8.14% | 3.52% | 5.06% |
|---|
|
| No Deduction of Taxes [Text Block] |
|
The performance graph and returns table do not reflect the deduction of taxes that a shareholder would pay on Fund distributions or the redemption of Fund shares.
|
| Material Change Date |
Sep. 01, 2025
|
|
| AssetsNet |
|
$ 56,689,196
|
| Holdings Count | Holding |
|
23
|
| Advisory Fees Paid, Amount |
|
$ 40,494
|
| InvestmentCompanyPortfolioTurnover |
|
58.00%
|
| Additional Fund Statistics [Text Block] |
|
Table SummaryNet Assets ($) | 56,689,196 |
|---|
Number of Portfolio Holdings | 23 |
|---|
Portfolio Turnover Rate (%) | 58 |
|---|
Total Net Advisory Fees Paid ($) | 40,494 |
|---|
|
| Holdings [Text Block] |
|
Table SummaryAsset Type | % of Net Assets |
|---|
Fixed Income - Bond Funds | 19% |
|---|
| DWS High Income Fund | 10% |
|---|
| DWS Emerging Markets Fixed Income Fund | 8% |
|---|
| DWS Enhanced Commodity Strategy Fund | 1% |
|---|
Fixed Income - Exchange-Traded Funds | 51% |
|---|
| iShares GNMA Bond ETF | 15% |
|---|
| iShares iBoxx USD Investment Grade Corporate Bond ETF | 14% |
|---|
| iShares U.S. Treasury Bond ETF | 8% |
|---|
| VanEck JPMorgan EM Local Currency Bond ETF | 6% |
|---|
| Vanguard Total International Bond ETF | 5% |
|---|
| Vanguard Intermediate-Term Corporate Bond ETF | 3% |
|---|
Fixed Income - Money Market Funds | 3% |
|---|
| DWS Central Cash Management Government Fund | 3% |
|---|
Equity - Equity Funds | 23% |
|---|
| DWS Equity 500 Index Fund | 16% |
|---|
| DWS Emerging Markets Equity Fund | 3% |
|---|
| DWS Small Cap Core Fund | 1% |
|---|
| DWS RREEF Global Infrastructure Fund | 1% |
|---|
| DWS RREEF Real Estate Securities Fund | 1% |
|---|
| DWS Core Equity Fund | 1% |
|---|
| DWS Global Real Estate Securities Fund | 0% |
|---|
Equity - Exchange-Traded Funds | 4% |
|---|
| iShares MSCI Japan ETF | 1% |
|---|
| iShares Core MSCI Europe ETF | 1% |
|---|
| Vanguard S&P 500 ETF | 1% |
|---|
| Xtrackers RREEF Global Natural Resources ETF | 1% |
|---|
| iShares Russell 2000 ETF | 0% |
|---|
Government & Agency Obligations | 0% |
|---|
| U.S. Treasury Bills | 0% |
|---|
Other Assets and Liabilities, Net | 0% |
|---|
Total | 100% |
|---|
|
| Material Fund Change [Text Block] |
|
This is a summary of certain changes of the Fund since September 1, 2025. For more information, review the Fund's current prospectus at dws.com/mutualreports, or call (800) 728-3337. Effective October 1, 2025, the Fund’s contractual cap on total annual operating expense for Class A shares changed from 1.03% to 0.97%. The cap includes indirect expenses of underlying funds and excludes certain expenses such as extraordinary expenses, taxes, brokerage, and interest expense. |
| Material Fund Change Expenses [Text Block] |
|
Effective October 1, 2025, the Fund’s contractual cap on total annual operating expense for Class A shares changed from 1.03% to 0.97%. The cap includes indirect expenses of underlying funds and excludes certain expenses such as extraordinary expenses, taxes, brokerage, and interest expense.
|
| Summary of Change Legend [Text Block] |
|
This is a summary of certain changes of the Fund since September 1, 2025. For more information, review the Fund's current prospectus at dws.com/mutualreports, or call (800) 728-3337.
|
| C000016768 |
|
|
| Shareholder Report [Line Items] |
|
|
| Fund Name |
|
DWS Multi-Asset Conservative Allocation Fund
|
| Class Name |
|
Class C
|
| Trading Symbol |
|
SPDCX
|
| Annual or Semi-Annual Statement [Text Block] |
|
This annual shareholder report contains important information about DWS Multi-Asset Conservative Allocation Fund (the "Fund") for the period September 1, 2025 to August 31, 2026.
|
| Additional Information [Text Block] |
|
You can find additional information about the Fund on the Fund's website at dws.com/mutualreports. You can also request this information by contacting us at (800) 728-3337.
|
| Additional Information Phone Number |
|
(800) 728-3337
|
| Additional Information Website |
|
<span style="box-sizing: border-box; color: rgb(0, 0, 0); display: inline; flex-wrap: nowrap; font-size: 14.6667px; font-weight: 300; grid-area: auto; line-height: 17.6px; margin: 0px; overflow: visible; text-align: left; text-align-last: auto; white-space-collapse: preserve-breaks;">dws.com/mutualreports</span>
|
| Expenses [Text Block] |
|
What were the Fund costs for the last year?(Based on a hypothetical $10,000 investment) Table SummaryFund | Costs of a $10,000 investment | Costs paid as a percentage of a $10,000 investment |
|---|
Class C | $151 | 1.47% |
|---|
Gross expense ratio as of the latest prospectus: 1.97%. See prospectus for any contractual or voluntary waivers; without a waiver, costs would have been higher. Fund costs do not reflect expenses of the underlying funds in which the Fund invests. |
| Expenses Paid, Amount |
|
$ 151
|
| Expense Ratio, Percent |
|
1.47%
|
| Factors Affecting Performance [Text Block] |
|
How did the Fund perform last year and what affected its performance? Class C shares of the Fund returned 5.94% (unadjusted for sales charges) for the period ended August 31, 2026. The Fund's broad-based indices, the MSCI ACWI All Cap Index and the Bloomberg Global Aggregate Index, returned 22.34% and 0.60%, respectively for the same period, while the Fund's additional, more narrowly based index, the S&P Target Risk Conservative Index, returned 8.14%. The Fund’s underweight in equities relative to fixed income was the largest detractor from relative performance versus the S& P Target Risk Conservative Index, reflecting stocks’ strong outperformance versus bonds in the annual period. Within equities, the Fund’s overweight in U.S. large caps contributed positively. However, underweights in developed-market international and emerging-market stocks detracted. In fixed income, allocations to categories that are not represented in the S&P Target Risk Conservative Index, including emerging-market debt, high yield bonds, investment-grade corporates, and securitized assets, contributed to relative performance. Credit-oriented market segments performed well in the period, reflecting investors’ strong appetite for risk. An overweight in developed-market international bonds detracted from relative performance, as yields climbed in the latter half of the period on growing concerns about stubborn inflation and rising government debt. The Fund’s allocation to real assets and alternatives—which includes commodity futures, U.S. REITs, global REITs, global infrastructure, and natural resources equities—was an additional contributor. Commodities performed particularly well due to the supply disruptions caused by the conflict in Iran, and natural resources stocks were boosted by both the strength in commodity prices and the rally in the broader equity market. The Fund used derivatives to adjust its positioning and take advantage of tactical opportunities. Derivatives made a positive net contribution. Equity-index futures were positive in aggregate, while interest-rate futures had only a minor effect. Currency futures had a modest negative impact overall. |
| Performance Past Does Not Indicate Future [Text] |
|
The Fund's past performance is not a good predictor or guarantee of the Fund's future performance.
|
| Line Graph [Table Text Block] |
|
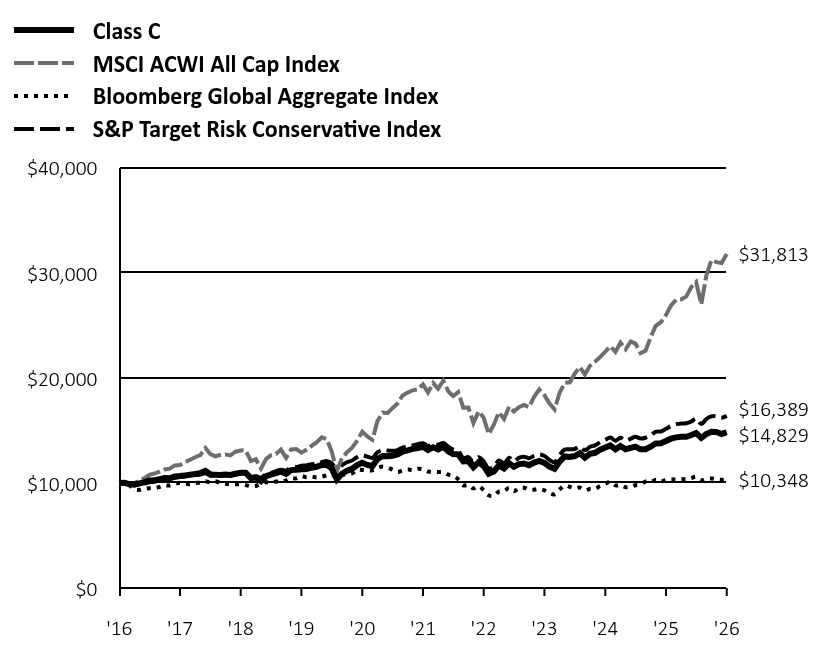 Table Summary | Class C | MSCI ACWI All Cap Index | Bloomberg Global Aggregate Index | S&P Target Risk Conservative Index |
|---|
'16 | $10,000 | $10,000 | $10,000 | $10,000 |
|---|
'16 | $10,020 | $10,077 | $10,055 | $10,023 |
|---|
'16 | $9,898 | $9,881 | $9,776 | $9,898 |
|---|
'16 | $9,857 | $9,988 | $9,388 | $9,770 |
|---|
'16 | $9,966 | $10,204 | $9,344 | $9,857 |
|---|
'17 | $10,073 | $10,482 | $9,450 | $9,931 |
|---|
'17 | $10,246 | $10,770 | $9,494 | $10,075 |
|---|
'17 | $10,255 | $10,898 | $9,509 | $10,126 |
|---|
'17 | $10,371 | $11,072 | $9,616 | $10,239 |
|---|
'17 | $10,478 | $11,293 | $9,765 | $10,357 |
|---|
'17 | $10,446 | $11,362 | $9,756 | $10,376 |
|---|
'17 | $10,628 | $11,673 | $9,920 | $10,495 |
|---|
'17 | $10,661 | $11,715 | $10,019 | $10,568 |
|---|
'17 | $10,726 | $11,968 | $9,929 | $10,606 |
|---|
'17 | $10,792 | $12,209 | $9,891 | $10,699 |
|---|
'17 | $10,850 | $12,448 | $10,001 | $10,745 |
|---|
'17 | $10,943 | $12,653 | $10,035 | $10,812 |
|---|
'18 | $11,142 | $13,335 | $10,155 | $10,934 |
|---|
'18 | $10,827 | $12,779 | $10,065 | $10,703 |
|---|
'18 | $10,772 | $12,541 | $10,172 | $10,724 |
|---|
'18 | $10,755 | $12,657 | $10,009 | $10,680 |
|---|
'18 | $10,805 | $12,708 | $9,933 | $10,725 |
|---|
'18 | $10,766 | $12,631 | $9,889 | $10,709 |
|---|
'18 | $10,875 | $12,976 | $9,873 | $10,826 |
|---|
'18 | $10,983 | $13,095 | $9,883 | $10,884 |
|---|
'18 | $10,967 | $13,115 | $9,798 | $10,863 |
|---|
'18 | $10,467 | $12,086 | $9,688 | $10,554 |
|---|
'18 | $10,517 | $12,254 | $9,719 | $10,640 |
|---|
'18 | $10,177 | $11,366 | $9,915 | $10,518 |
|---|
'19 | $10,646 | $12,290 | $10,066 | $10,848 |
|---|
'19 | $10,797 | $12,632 | $10,008 | $10,946 |
|---|
'19 | $10,933 | $12,760 | $10,133 | $11,132 |
|---|
'19 | $11,100 | $13,181 | $10,103 | $11,263 |
|---|
'19 | $10,874 | $12,394 | $10,240 | $11,166 |
|---|
'19 | $11,228 | $13,188 | $10,467 | $11,479 |
|---|
'19 | $11,253 | $13,227 | $10,438 | $11,513 |
|---|
'19 | $11,295 | $12,891 | $10,650 | $11,633 |
|---|
'19 | $11,338 | $13,161 | $10,542 | $11,677 |
|---|
'19 | $11,456 | $13,524 | $10,612 | $11,788 |
|---|
'19 | $11,541 | $13,861 | $10,532 | $11,858 |
|---|
'19 | $11,718 | $14,355 | $10,593 | $11,989 |
|---|
'20 | $11,735 | $14,163 | $10,728 | $12,081 |
|---|
'20 | $11,379 | $13,001 | $10,801 | $11,892 |
|---|
'20 | $10,339 | $11,125 | $10,559 | $11,241 |
|---|
'20 | $10,875 | $12,352 | $10,766 | $11,685 |
|---|
'20 | $11,173 | $12,923 | $10,813 | $11,972 |
|---|
'20 | $11,336 | $13,337 | $10,909 | $12,145 |
|---|
'20 | $11,712 | $14,028 | $11,257 | $12,458 |
|---|
'20 | $11,926 | $14,880 | $11,240 | $12,630 |
|---|
'20 | $11,720 | $14,422 | $11,200 | $12,507 |
|---|
'20 | $11,600 | $14,110 | $11,210 | $12,395 |
|---|
'20 | $12,286 | $15,901 | $11,414 | $12,921 |
|---|
'20 | $12,564 | $16,696 | $11,567 | $13,148 |
|---|
'21 | $12,546 | $16,674 | $11,466 | $13,082 |
|---|
'21 | $12,599 | $17,126 | $11,268 | $13,066 |
|---|
'21 | $12,716 | $17,568 | $11,051 | $13,133 |
|---|
'21 | $12,989 | $18,327 | $11,191 | $13,370 |
|---|
'21 | $13,112 | $18,603 | $11,296 | $13,457 |
|---|
'21 | $13,246 | $18,825 | $11,196 | $13,569 |
|---|
'21 | $13,317 | $18,915 | $11,345 | $13,702 |
|---|
'21 | $13,440 | $19,382 | $11,298 | $13,789 |
|---|
'21 | $13,129 | $18,614 | $11,098 | $13,523 |
|---|
'21 | $13,403 | $19,514 | $11,071 | $13,724 |
|---|
'21 | $13,191 | $18,985 | $11,038 | $13,650 |
|---|
'21 | $13,463 | $19,736 | $11,023 | $13,803 |
|---|
'22 | $13,004 | $18,708 | $10,797 | $13,425 |
|---|
'22 | $12,761 | $18,282 | $10,669 | $13,190 |
|---|
'22 | $12,723 | $18,654 | $10,344 | $13,032 |
|---|
'22 | $12,047 | $17,173 | $9,777 | $12,393 |
|---|
'22 | $12,084 | $17,181 | $9,804 | $12,459 |
|---|
'22 | $11,486 | $15,698 | $9,489 | $11,990 |
|---|
'22 | $11,976 | $16,816 | $9,691 | $12,459 |
|---|
'22 | $11,618 | $16,222 | $9,308 | $12,052 |
|---|
'22 | $10,887 | $14,653 | $8,830 | $11,387 |
|---|
'22 | $11,095 | $15,552 | $8,769 | $11,526 |
|---|
'22 | $11,672 | $16,733 | $9,182 | $12,149 |
|---|
'22 | $11,382 | $16,096 | $9,232 | $11,873 |
|---|
'23 | $11,885 | $17,282 | $9,535 | $12,407 |
|---|
'23 | $11,543 | $16,801 | $9,218 | $12,075 |
|---|
'23 | $11,803 | $17,208 | $9,509 | $12,395 |
|---|
'23 | $11,860 | $17,424 | $9,551 | $12,498 |
|---|
'23 | $11,698 | $17,211 | $9,365 | $12,365 |
|---|
'23 | $11,948 | $18,212 | $9,364 | $12,581 |
|---|
'23 | $12,101 | $18,909 | $9,429 | $12,716 |
|---|
'23 | $11,920 | $18,364 | $9,300 | $12,561 |
|---|
'23 | $11,565 | $17,591 | $9,028 | $12,201 |
|---|
'23 | $11,354 | $17,001 | $8,920 | $11,980 |
|---|
'23 | $12,034 | $18,570 | $9,370 | $12,656 |
|---|
'23 | $12,525 | $19,550 | $9,759 | $13,171 |
|---|
'24 | $12,476 | $19,591 | $9,625 | $13,206 |
|---|
'24 | $12,564 | $20,406 | $9,504 | $13,241 |
|---|
'24 | $12,833 | $21,050 | $9,556 | $13,466 |
|---|
'24 | $12,409 | $20,334 | $9,315 | $13,115 |
|---|
'24 | $12,783 | $21,158 | $9,437 | $13,444 |
|---|
'24 | $12,874 | $21,543 | $9,451 | $13,582 |
|---|
'24 | $13,170 | $21,993 | $9,712 | $13,880 |
|---|
'24 | $13,378 | $22,504 | $9,941 | $14,112 |
|---|
'24 | $13,581 | $23,020 | $10,111 | $14,334 |
|---|
'24 | $13,204 | $22,485 | $9,772 | $14,023 |
|---|
'24 | $13,522 | $23,360 | $9,805 | $14,296 |
|---|
'24 | $13,213 | $22,734 | $9,595 | $14,039 |
|---|
'25 | $13,346 | $23,475 | $9,649 | $14,222 |
|---|
'25 | $13,459 | $23,268 | $9,787 | $14,395 |
|---|
'25 | $13,203 | $22,369 | $9,847 | $14,233 |
|---|
'25 | $13,213 | $22,584 | $10,137 | $14,309 |
|---|
'25 | $13,449 | $23,890 | $10,101 | $14,521 |
|---|
'25 | $13,770 | $24,974 | $10,292 | $14,872 |
|---|
'25 | $13,781 | $25,307 | $10,139 | $14,905 |
|---|
'25 | $13,998 | $26,004 | $10,286 | $15,155 |
|---|
'25 | $14,220 | $26,899 | $10,354 | $15,420 |
|---|
'25 | $14,344 | $27,443 | $10,327 | $15,590 |
|---|
'25 | $14,406 | $27,478 | $10,351 | $15,667 |
|---|
'25 | $14,393 | $27,765 | $10,378 | $15,688 |
|---|
'26 | $14,562 | $28,680 | $10,475 | $15,871 |
|---|
'26 | $14,754 | $29,134 | $10,593 | $16,122 |
|---|
'26 | $14,295 | $27,006 | $10,267 | $15,608 |
|---|
'26 | $14,658 | $29,736 | $10,395 | $16,087 |
|---|
'26 | $14,885 | $31,221 | $10,430 | $16,342 |
|---|
'26 | $14,863 | $31,027 | $10,356 | $16,354 |
|---|
'26 | $14,669 | $30,946 | $10,301 | $16,215 |
|---|
'26 | $14,829 | $31,813 | $10,348 | $16,389 |
|---|
|
| Average Annual Return [Table Text Block] |
|
Table SummaryClass/Index
| 1-Year | 5-Year | 10-Year |
|---|
Class C Unadjusted for Sales Charge | 5.94% | 1.99% | 4.02% |
|---|
Class C Adjusted for the Maximum Sales Charge (max 1.00% CDSC) | 4.98% | 1.99% | 4.02% |
|---|
MSCI ACWI All Cap Index | 22.34% | 10.42% | 12.27% |
|---|
Bloomberg Global Aggregate Index | 0.60% | -1.74% | 0.34% |
|---|
S&P Target Risk Conservative Index | 8.14% | 3.52% | 5.06% |
|---|
|
| No Deduction of Taxes [Text Block] |
|
The performance graph and returns table do not reflect the deduction of taxes that a shareholder would pay on Fund distributions or the redemption of Fund shares.
|
| Material Change Date |
Sep. 01, 2025
|
|
| AssetsNet |
|
$ 56,689,196
|
| Holdings Count | Holding |
|
23
|
| Advisory Fees Paid, Amount |
|
$ 40,494
|
| InvestmentCompanyPortfolioTurnover |
|
58.00%
|
| Additional Fund Statistics [Text Block] |
|
Table SummaryNet Assets ($) | 56,689,196 |
|---|
Number of Portfolio Holdings | 23 |
|---|
Portfolio Turnover Rate (%) | 58 |
|---|
Total Net Advisory Fees Paid ($) | 40,494 |
|---|
|
| Holdings [Text Block] |
|
Table SummaryAsset Type | % of Net Assets |
|---|
Fixed Income - Bond Funds | 19% |
|---|
| DWS High Income Fund | 10% |
|---|
| DWS Emerging Markets Fixed Income Fund | 8% |
|---|
| DWS Enhanced Commodity Strategy Fund | 1% |
|---|
Fixed Income - Exchange-Traded Funds | 51% |
|---|
| iShares GNMA Bond ETF | 15% |
|---|
| iShares iBoxx USD Investment Grade Corporate Bond ETF | 14% |
|---|
| iShares U.S. Treasury Bond ETF | 8% |
|---|
| VanEck JPMorgan EM Local Currency Bond ETF | 6% |
|---|
| Vanguard Total International Bond ETF | 5% |
|---|
| Vanguard Intermediate-Term Corporate Bond ETF | 3% |
|---|
Fixed Income - Money Market Funds | 3% |
|---|
| DWS Central Cash Management Government Fund | 3% |
|---|
Equity - Equity Funds | 23% |
|---|
| DWS Equity 500 Index Fund | 16% |
|---|
| DWS Emerging Markets Equity Fund | 3% |
|---|
| DWS Small Cap Core Fund | 1% |
|---|
| DWS RREEF Global Infrastructure Fund | 1% |
|---|
| DWS RREEF Real Estate Securities Fund | 1% |
|---|
| DWS Core Equity Fund | 1% |
|---|
| DWS Global Real Estate Securities Fund | 0% |
|---|
Equity - Exchange-Traded Funds | 4% |
|---|
| iShares MSCI Japan ETF | 1% |
|---|
| iShares Core MSCI Europe ETF | 1% |
|---|
| Vanguard S&P 500 ETF | 1% |
|---|
| Xtrackers RREEF Global Natural Resources ETF | 1% |
|---|
| iShares Russell 2000 ETF | 0% |
|---|
Government & Agency Obligations | 0% |
|---|
| U.S. Treasury Bills | 0% |
|---|
Other Assets and Liabilities, Net | 0% |
|---|
Total | 100% |
|---|
|
| Material Fund Change [Text Block] |
|
This is a summary of certain changes of the Fund since September 1, 2025. For more information, review the Fund's current prospectus at dws.com/mutualreports, or call (800) 728-3337. Effective October 1, 2025, the Fund’s contractual cap on total annual operating expense for Class C shares changed from 1.78% to 1.72%. The cap includes indirect expenses of underlying funds and excludes certain expenses such as extraordinary expenses, taxes, brokerage, and interest expense. |
| Material Fund Change Expenses [Text Block] |
|
Effective October 1, 2025, the Fund’s contractual cap on total annual operating expense for Class C shares changed from 1.78% to 1.72%. The cap includes indirect expenses of underlying funds and excludes certain expenses such as extraordinary expenses, taxes, brokerage, and interest expense.
|
| Summary of Change Legend [Text Block] |
|
This is a summary of certain changes of the Fund since September 1, 2025. For more information, review the Fund's current prospectus at dws.com/mutualreports, or call (800) 728-3337.
|
| C000016769 |
|
|
| Shareholder Report [Line Items] |
|
|
| Fund Name |
|
DWS Multi-Asset Conservative Allocation Fund
|
| Class Name |
|
Class S
|
| Trading Symbol |
|
SPBAX
|
| Annual or Semi-Annual Statement [Text Block] |
|
This annual shareholder report contains important information about DWS Multi-Asset Conservative Allocation Fund (the "Fund") for the period September 1, 2025 to August 31, 2026.
|
| Additional Information [Text Block] |
|
You can find additional information about the Fund on the Fund's website at dws.com/mutualreports. You can also request this information by contacting us at (800) 728-3337.
|
| Additional Information Phone Number |
|
(800) 728-3337
|
| Additional Information Website |
|
<span style="box-sizing: border-box; color: rgb(0, 0, 0); display: inline; flex-wrap: nowrap; font-size: 14.6667px; font-weight: 300; grid-area: auto; line-height: 17.6px; margin: 0px; overflow: visible; text-align: left; text-align-last: auto; white-space-collapse: preserve-breaks;">dws.com/mutualreports</span>
|
| Expenses [Text Block] |
|
What were the Fund costs for the last year?(Based on a hypothetical $10,000 investment) Table SummaryFund | Costs of a $10,000 investment | Costs paid as a percentage of a $10,000 investment |
|---|
Class S | $49 | 0.47% |
|---|
Gross expense ratio as of the latest prospectus: 0.86%. See prospectus for any contractual or voluntary waivers; without a waiver, costs would have been higher. Fund costs do not reflect expenses of the underlying funds in which the Fund invests. |
| Expenses Paid, Amount |
|
$ 49
|
| Expense Ratio, Percent |
|
0.47%
|
| Factors Affecting Performance [Text Block] |
|
How did the Fund perform last year and what affected its performance? Class S shares of the Fund returned 7.00% for the period ended August 31, 2026. The Fund's broad-based indices, the MSCI ACWI All Cap Index and the Bloomberg Global Aggregate Index, returned 22.34% and 0.60%, respectively for the same period, while the Fund's additional, more narrowly based index, the S&P Target Risk Conservative Index, returned 8.14%. The Fund’s underweight in equities relative to fixed income was the largest detractor from relative performance versus the S& P Target Risk Conservative Index, reflecting stocks’ strong outperformance versus bonds in the annual period. Within equities, the Fund’s overweight in U.S. large caps contributed positively. However, underweights in developed-market international and emerging-market stocks detracted. In fixed income, allocations to categories that are not represented in the S&P Target Risk Conservative Index, including emerging-market debt, high yield bonds, investment-grade corporates, and securitized assets, contributed to relative performance. Credit-oriented market segments performed well in the period, reflecting investors’ strong appetite for risk. An overweight in developed-market international bonds detracted from relative performance, as yields climbed in the latter half of the period on growing concerns about stubborn inflation and rising government debt. The Fund’s allocation to real assets and alternatives—which includes commodity futures, U.S. REITs, global REITs, global infrastructure, and natural resources equities—was an additional contributor. Commodities performed particularly well due to the supply disruptions caused by the conflict in Iran, and natural resources stocks were boosted by both the strength in commodity prices and the rally in the broader equity market. The Fund used derivatives to adjust its positioning and take advantage of tactical opportunities. Derivatives made a positive net contribution. Equity-index futures were positive in aggregate, while interest-rate futures had only a minor effect. Currency futures had a modest negative impact overall. |
| Performance Past Does Not Indicate Future [Text] |
|
The Fund's past performance is not a good predictor or guarantee of the Fund's future performance.
|
| Line Graph [Table Text Block] |
|
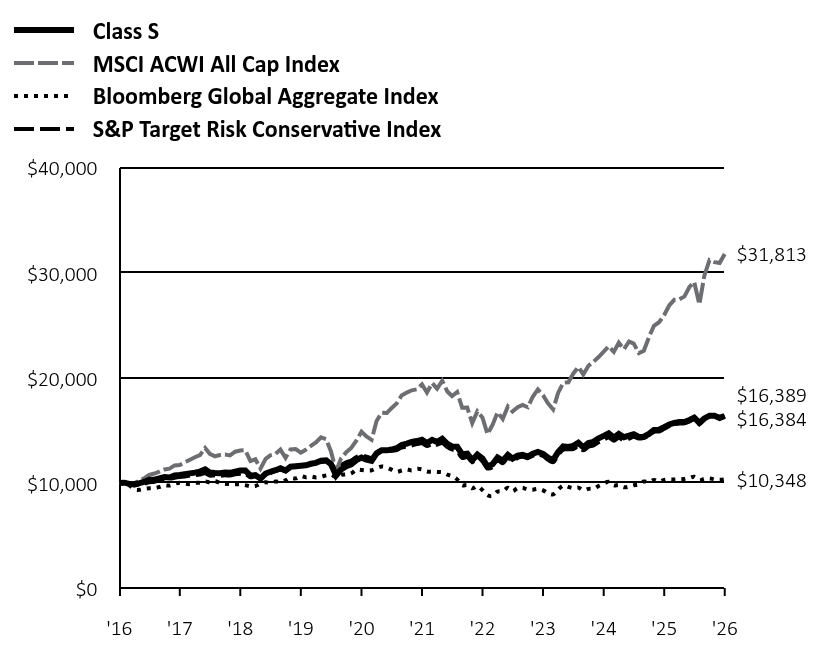 Table Summary | Class S | MSCI ACWI All Cap Index | Bloomberg Global Aggregate Index | S&P Target Risk Conservative Index |
|---|
'16 | $10,000 | $10,000 | $10,000 | $10,000 |
|---|
'16 | $10,030 | $10,077 | $10,055 | $10,023 |
|---|
'16 | $9,915 | $9,881 | $9,776 | $9,898 |
|---|
'16 | $9,882 | $9,988 | $9,388 | $9,770 |
|---|
'16 | $9,992 | $10,204 | $9,344 | $9,857 |
|---|
'17 | $10,116 | $10,482 | $9,450 | $9,931 |
|---|
'17 | $10,298 | $10,770 | $9,494 | $10,075 |
|---|
'17 | $10,308 | $10,898 | $9,509 | $10,126 |
|---|
'17 | $10,433 | $11,072 | $9,616 | $10,239 |
|---|
'17 | $10,558 | $11,293 | $9,765 | $10,357 |
|---|
'17 | $10,527 | $11,362 | $9,756 | $10,376 |
|---|
'17 | $10,718 | $11,673 | $9,920 | $10,495 |
|---|
'17 | $10,760 | $11,715 | $10,019 | $10,568 |
|---|
'17 | $10,845 | $11,968 | $9,929 | $10,606 |
|---|
'17 | $10,912 | $12,209 | $9,891 | $10,699 |
|---|
'17 | $10,987 | $12,448 | $10,001 | $10,745 |
|---|
'17 | $11,084 | $12,653 | $10,035 | $10,812 |
|---|
'18 | $11,295 | $13,335 | $10,155 | $10,934 |
|---|
'18 | $10,991 | $12,779 | $10,065 | $10,703 |
|---|
'18 | $10,946 | $12,541 | $10,172 | $10,724 |
|---|
'18 | $10,937 | $12,657 | $10,009 | $10,680 |
|---|
'18 | $10,997 | $12,708 | $9,933 | $10,725 |
|---|
'18 | $10,968 | $12,631 | $9,889 | $10,709 |
|---|
'18 | $11,087 | $12,976 | $9,873 | $10,826 |
|---|
'18 | $11,197 | $13,095 | $9,883 | $10,884 |
|---|
'18 | $11,192 | $13,115 | $9,798 | $10,863 |
|---|
'18 | $10,697 | $12,086 | $9,688 | $10,554 |
|---|
'18 | $10,757 | $12,254 | $9,719 | $10,640 |
|---|
'18 | $10,411 | $11,366 | $9,915 | $10,518 |
|---|
'19 | $10,900 | $12,290 | $10,066 | $10,848 |
|---|
'19 | $11,071 | $12,632 | $10,008 | $10,946 |
|---|
'19 | $11,213 | $12,760 | $10,133 | $11,132 |
|---|
'19 | $11,394 | $13,181 | $10,103 | $11,263 |
|---|
'19 | $11,178 | $12,394 | $10,240 | $11,166 |
|---|
'19 | $11,545 | $13,188 | $10,467 | $11,479 |
|---|
'19 | $11,588 | $13,227 | $10,438 | $11,513 |
|---|
'19 | $11,640 | $12,891 | $10,650 | $11,633 |
|---|
'19 | $11,687 | $13,161 | $10,542 | $11,677 |
|---|
'19 | $11,827 | $13,524 | $10,612 | $11,788 |
|---|
'19 | $11,915 | $13,861 | $10,532 | $11,858 |
|---|
'19 | $12,111 | $14,355 | $10,593 | $11,989 |
|---|
'20 | $12,146 | $14,163 | $10,728 | $12,081 |
|---|
'20 | $11,786 | $13,001 | $10,801 | $11,892 |
|---|
'20 | $10,709 | $11,125 | $10,559 | $11,241 |
|---|
'20 | $11,274 | $12,352 | $10,766 | $11,685 |
|---|
'20 | $11,601 | $12,923 | $10,813 | $11,972 |
|---|
'20 | $11,773 | $13,337 | $10,909 | $12,145 |
|---|
'20 | $12,174 | $14,028 | $11,257 | $12,458 |
|---|
'20 | $12,414 | $14,880 | $11,240 | $12,630 |
|---|
'20 | $12,212 | $14,422 | $11,200 | $12,507 |
|---|
'20 | $12,096 | $14,110 | $11,210 | $12,395 |
|---|
'20 | $12,812 | $15,901 | $11,414 | $12,921 |
|---|
'20 | $13,118 | $16,696 | $11,567 | $13,148 |
|---|
'21 | $13,108 | $16,674 | $11,466 | $13,082 |
|---|
'21 | $13,182 | $17,126 | $11,268 | $13,066 |
|---|
'21 | $13,309 | $17,568 | $11,051 | $13,133 |
|---|
'21 | $13,605 | $18,327 | $11,191 | $13,370 |
|---|
'21 | $13,743 | $18,603 | $11,296 | $13,457 |
|---|
'21 | $13,900 | $18,825 | $11,196 | $13,569 |
|---|
'21 | $13,993 | $18,915 | $11,345 | $13,702 |
|---|
'21 | $14,122 | $19,382 | $11,298 | $13,789 |
|---|
'21 | $13,812 | $18,614 | $11,098 | $13,523 |
|---|
'21 | $14,110 | $19,514 | $11,071 | $13,724 |
|---|
'21 | $13,896 | $18,985 | $11,038 | $13,650 |
|---|
'21 | $14,199 | $19,736 | $11,023 | $13,803 |
|---|
'22 | $13,724 | $18,708 | $10,797 | $13,425 |
|---|
'22 | $13,477 | $18,282 | $10,669 | $13,190 |
|---|
'22 | $13,451 | $18,654 | $10,344 | $13,032 |
|---|
'22 | $12,744 | $17,173 | $9,777 | $12,393 |
|---|
'22 | $12,794 | $17,181 | $9,804 | $12,459 |
|---|
'22 | $12,171 | $15,698 | $9,489 | $11,990 |
|---|
'22 | $12,701 | $16,816 | $9,691 | $12,459 |
|---|
'22 | $12,331 | $16,222 | $9,308 | $12,052 |
|---|
'22 | $11,563 | $14,653 | $8,830 | $11,387 |
|---|
'22 | $11,795 | $15,552 | $8,769 | $11,526 |
|---|
'22 | $12,420 | $16,733 | $9,182 | $12,149 |
|---|
'22 | $12,121 | $16,096 | $9,232 | $11,873 |
|---|
'23 | $12,668 | $17,282 | $9,535 | $12,407 |
|---|
'23 | $12,313 | $16,801 | $9,218 | $12,075 |
|---|
'23 | $12,601 | $17,208 | $9,509 | $12,395 |
|---|
'23 | $12,673 | $17,424 | $9,551 | $12,498 |
|---|
'23 | $12,520 | $17,211 | $9,365 | $12,365 |
|---|
'23 | $12,789 | $18,212 | $9,364 | $12,581 |
|---|
'23 | $12,963 | $18,909 | $9,429 | $12,716 |
|---|
'23 | $12,779 | $18,364 | $9,300 | $12,561 |
|---|
'23 | $12,408 | $17,591 | $9,028 | $12,201 |
|---|
'23 | $12,192 | $17,001 | $8,920 | $11,980 |
|---|
'23 | $12,944 | $18,570 | $9,370 | $12,656 |
|---|
'23 | $13,475 | $19,550 | $9,759 | $13,171 |
|---|
'24 | $13,433 | $19,591 | $9,625 | $13,206 |
|---|
'24 | $13,539 | $20,406 | $9,504 | $13,241 |
|---|
'24 | $13,830 | $21,050 | $9,556 | $13,466 |
|---|
'24 | $13,394 | $20,334 | $9,315 | $13,115 |
|---|
'24 | $13,809 | $21,158 | $9,437 | $13,444 |
|---|
'24 | $13,920 | $21,543 | $9,451 | $13,582 |
|---|
'24 | $14,252 | $21,993 | $9,712 | $13,880 |
|---|
'24 | $14,488 | $22,504 | $9,941 | $14,112 |
|---|
'24 | $14,724 | $23,020 | $10,111 | $14,334 |
|---|
'24 | $14,325 | $22,485 | $9,772 | $14,023 |
|---|
'24 | $14,681 | $23,360 | $9,805 | $14,296 |
|---|
'24 | $14,361 | $22,734 | $9,595 | $14,039 |
|---|
'25 | $14,517 | $23,475 | $9,649 | $14,222 |
|---|
'25 | $14,651 | $23,268 | $9,787 | $14,395 |
|---|
'25 | $14,385 | $22,369 | $9,847 | $14,233 |
|---|
'25 | $14,407 | $22,584 | $10,137 | $14,309 |
|---|
'25 | $14,677 | $23,890 | $10,101 | $14,521 |
|---|
'25 | $15,041 | $24,974 | $10,292 | $14,872 |
|---|
'25 | $15,064 | $25,307 | $10,139 | $14,905 |
|---|
'25 | $15,312 | $26,004 | $10,286 | $15,155 |
|---|
'25 | $15,571 | $26,899 | $10,354 | $15,420 |
|---|
'25 | $15,719 | $27,443 | $10,327 | $15,590 |
|---|
'25 | $15,799 | $27,478 | $10,351 | $15,667 |
|---|
'25 | $15,801 | $27,765 | $10,378 | $15,688 |
|---|
'26 | $15,999 | $28,680 | $10,475 | $15,871 |
|---|
'26 | $16,223 | $29,134 | $10,593 | $16,122 |
|---|
'26 | $15,729 | $27,006 | $10,267 | $15,608 |
|---|
'26 | $16,142 | $29,736 | $10,395 | $16,087 |
|---|
'26 | $16,404 | $31,221 | $10,430 | $16,342 |
|---|
'26 | $16,397 | $31,027 | $10,356 | $16,354 |
|---|
'26 | $16,195 | $30,946 | $10,301 | $16,215 |
|---|
'26 | $16,384 | $31,813 | $10,348 | $16,389 |
|---|
|
| Average Annual Return [Table Text Block] |
|
Table SummaryClass/Index
| 1-Year | 5-Year | 10-Year |
|---|
Class S No Sales Charge | 7.00% | 3.02% | 5.06% |
|---|
MSCI ACWI All Cap Index | 22.34% | 10.42% | 12.27% |
|---|
Bloomberg Global Aggregate Index | 0.60% | -1.74% | 0.34% |
|---|
S&P Target Risk Conservative Index | 8.14% | 3.52% | 5.06% |
|---|
|
| No Deduction of Taxes [Text Block] |
|
The performance graph and returns table do not reflect the deduction of taxes that a shareholder would pay on Fund distributions or the redemption of Fund shares.
|
| Material Change Date |
Sep. 01, 2025
|
|
| AssetsNet |
|
$ 56,689,196
|
| Holdings Count | Holding |
|
23
|
| Advisory Fees Paid, Amount |
|
$ 40,494
|
| InvestmentCompanyPortfolioTurnover |
|
58.00%
|
| Additional Fund Statistics [Text Block] |
|
Table SummaryNet Assets ($) | 56,689,196 |
|---|
Number of Portfolio Holdings | 23 |
|---|
Portfolio Turnover Rate (%) | 58 |
|---|
Total Net Advisory Fees Paid ($) | 40,494 |
|---|
|
| Holdings [Text Block] |
|
Table SummaryAsset Type | % of Net Assets |
|---|
Fixed Income - Bond Funds | 19% |
|---|
| DWS High Income Fund | 10% |
|---|
| DWS Emerging Markets Fixed Income Fund | 8% |
|---|
| DWS Enhanced Commodity Strategy Fund | 1% |
|---|
Fixed Income - Exchange-Traded Funds | 51% |
|---|
| iShares GNMA Bond ETF | 15% |
|---|
| iShares iBoxx USD Investment Grade Corporate Bond ETF | 14% |
|---|
| iShares U.S. Treasury Bond ETF | 8% |
|---|
| VanEck JPMorgan EM Local Currency Bond ETF | 6% |
|---|
| Vanguard Total International Bond ETF | 5% |
|---|
| Vanguard Intermediate-Term Corporate Bond ETF | 3% |
|---|
Fixed Income - Money Market Funds | 3% |
|---|
| DWS Central Cash Management Government Fund | 3% |
|---|
Equity - Equity Funds | 23% |
|---|
| DWS Equity 500 Index Fund | 16% |
|---|
| DWS Emerging Markets Equity Fund | 3% |
|---|
| DWS Small Cap Core Fund | 1% |
|---|
| DWS RREEF Global Infrastructure Fund | 1% |
|---|
| DWS RREEF Real Estate Securities Fund | 1% |
|---|
| DWS Core Equity Fund | 1% |
|---|
| DWS Global Real Estate Securities Fund | 0% |
|---|
Equity - Exchange-Traded Funds | 4% |
|---|
| iShares MSCI Japan ETF | 1% |
|---|
| iShares Core MSCI Europe ETF | 1% |
|---|
| Vanguard S&P 500 ETF | 1% |
|---|
| Xtrackers RREEF Global Natural Resources ETF | 1% |
|---|
| iShares Russell 2000 ETF | 0% |
|---|
Government & Agency Obligations | 0% |
|---|
| U.S. Treasury Bills | 0% |
|---|
Other Assets and Liabilities, Net | 0% |
|---|
Total | 100% |
|---|
|
| Material Fund Change [Text Block] |
|
This is a summary of certain changes of the Fund since September 1, 2025. For more information, review the Fund's current prospectus at dws.com/mutualreports, or call (800) 728-3337. Effective October 1, 2025, the Fund’s contractual cap on total annual operating expense for Class S shares changed from 0.78% to 0.72%. The cap includes indirect expenses of underlying funds and excludes certain expenses such as extraordinary expenses, taxes, brokerage, and interest expense. |
| Material Fund Change Expenses [Text Block] |
|
Effective October 1, 2025, the Fund’s contractual cap on total annual operating expense for Class S shares changed from 0.78% to 0.72%. The cap includes indirect expenses of underlying funds and excludes certain expenses such as extraordinary expenses, taxes, brokerage, and interest expense.
|
| Summary of Change Legend [Text Block] |
|
This is a summary of certain changes of the Fund since September 1, 2025. For more information, review the Fund's current prospectus at dws.com/mutualreports, or call (800) 728-3337.
|
| C000016756 |
|
|
| Shareholder Report [Line Items] |
|
|
| Fund Name |
|
DWS Multi-Asset Moderate Allocation Fund
|
| Class Name |
|
Class A
|
| Trading Symbol |
|
PLUSX
|
| Annual or Semi-Annual Statement [Text Block] |
|
This annual shareholder report contains important information about DWS Multi-Asset Moderate Allocation Fund (the "Fund") for the period September 1, 2025 to August 31, 2026.
|
| Additional Information [Text Block] |
|
You can find additional information about the Fund on the Fund's website at dws.com/mutualreports. You can also request this information by contacting us at (800) 728-3337.
|
| Additional Information Phone Number |
|
(800) 728-3337
|
| Additional Information Website |
|
<span style="box-sizing: border-box; color: rgb(0, 0, 0); display: inline; flex-wrap: nowrap; font-size: 14.6667px; font-weight: 300; grid-area: auto; line-height: 17.6px; margin: 0px; overflow: visible; text-align: left; text-align-last: auto; white-space-collapse: preserve-breaks;">dws.com/mutualreports</span>
|
| Expenses [Text Block] |
|
What were the Fund costs for the last year?(Based on a hypothetical $10,000 investment) Table SummaryFund | Costs of a $10,000 investment | Costs paid as a percentage of a $10,000 investment |
|---|
Class A | $74 | 0.69% |
|---|
Gross expense ratio as of the latest prospectus: 1.62%. See prospectus for any contractual or voluntary waivers; without a waiver, costs would have been higher. Fund costs do not reflect expenses of the underlying funds in which the Fund invests. |
| Expenses Paid, Amount |
|
$ 74
|
| Expense Ratio, Percent |
|
0.69%
|
| Factors Affecting Performance [Text Block] |
|
How did the Fund perform last year and what affected its performance? Class A shares of the Fund returned 13.91% (unadjusted for sales charges) for the period ended August 31, 2026. The Fund's broad-based indices, the MSCI ACWI All Cap Index and the Bloomberg Global Aggregate Index, returned 22.34% and 0.60%, respectively for the same period, while the Fund's additional, more narrowly based index, the S&P Target Risk Moderate Index, returned 10.16%. The Fund’s overweight in equities relative to fixed income was the largest contributor to relative performance versus the S&P Target Risk Moderate Index, reflecting stocks’ strong outperformance versus bonds in the annual period. Within equities, the Fund’s overweight in U.S. large caps contributed positively. Overweights in emerging-market stocks and U.S. small caps were also beneficial. In fixed income, allocations to categories that are not represented in the S&P Target Risk Moderate Index, including emerging-market debt, high yield bonds, investment-grade corporates, and securitized assets, contributed to relative performance. Credit-oriented market segments performed well in the period, reflecting investors’ strong appetite for risk. An underweight in developed-market international bonds detracted from relative performance, as yields climbed in the latter half of the period on growing concerns about stubborn inflation and rising government debt. The Fund’s allocation to real assets and alternatives — which includes commodity futures, U.S. REITs, global REITs, global infrastructure, and natural resources equities — was an additional contributor. Commodities performed particularly well due to the supply disruptions caused by the conflict in Iran, and natural resources stocks were boosted by both the strength in commodity prices and the rally in the broader equity market. The Fund used derivatives to adjust its positioning and take advantage of tactical opportunities. Derivatives made a positive net contribution. Equity-index futures were positive in aggregate, and interest-rate futures made a small contribution, as well. |
| Performance Past Does Not Indicate Future [Text] |
|
The Fund's past performance is not a good predictor or guarantee of the Fund's future performance.
|
| Line Graph [Table Text Block] |
|
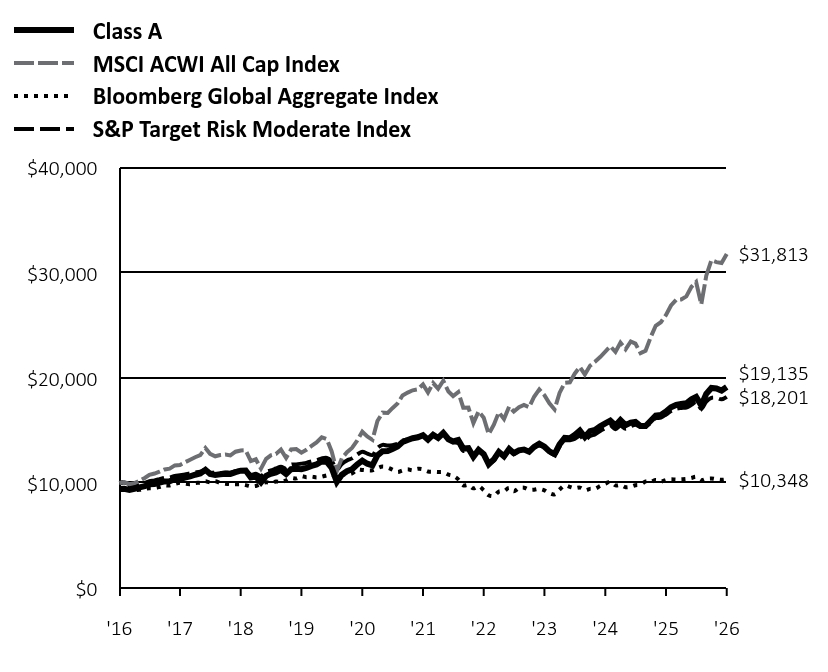 Table Summary | Class A | MSCI ACWI All Cap Index | Bloomberg Global Aggregate Index | S&P Target Risk Moderate Index |
|---|
'16 | $9,425 | $10,000 | $10,000 | $10,000 |
|---|
'16 | $9,445 | $10,077 | $10,055 | $10,033 |
|---|
'16 | $9,346 | $9,881 | $9,776 | $9,897 |
|---|
'16 | $9,455 | $9,988 | $9,388 | $9,805 |
|---|
'16 | $9,574 | $10,204 | $9,344 | $9,909 |
|---|
'17 | $9,690 | $10,482 | $9,450 | $10,012 |
|---|
'17 | $9,889 | $10,770 | $9,494 | $10,176 |
|---|
'17 | $9,900 | $10,898 | $9,509 | $10,243 |
|---|
'17 | $10,026 | $11,072 | $9,616 | $10,365 |
|---|
'17 | $10,152 | $11,293 | $9,765 | $10,501 |
|---|
'17 | $10,163 | $11,362 | $9,756 | $10,527 |
|---|
'17 | $10,373 | $11,673 | $9,920 | $10,672 |
|---|
'17 | $10,383 | $11,715 | $10,019 | $10,740 |
|---|
'17 | $10,520 | $11,968 | $9,929 | $10,808 |
|---|
'17 | $10,635 | $12,209 | $9,891 | $10,923 |
|---|
'17 | $10,783 | $12,448 | $10,001 | $10,992 |
|---|
'17 | $10,895 | $12,653 | $10,035 | $11,076 |
|---|
'18 | $11,250 | $13,335 | $10,155 | $11,270 |
|---|
'18 | $10,862 | $12,779 | $10,065 | $10,992 |
|---|
'18 | $10,773 | $12,541 | $10,172 | $10,992 |
|---|
'18 | $10,829 | $12,657 | $10,009 | $10,959 |
|---|
'18 | $10,884 | $12,708 | $9,933 | $11,005 |
|---|
'18 | $10,862 | $12,631 | $9,889 | $10,980 |
|---|
'18 | $11,040 | $12,976 | $9,873 | $11,132 |
|---|
'18 | $11,173 | $13,095 | $9,883 | $11,195 |
|---|
'18 | $11,184 | $13,115 | $9,798 | $11,181 |
|---|
'18 | $10,518 | $12,086 | $9,688 | $10,786 |
|---|
'18 | $10,607 | $12,254 | $9,719 | $10,884 |
|---|
'18 | $10,061 | $11,366 | $9,915 | $10,664 |
|---|
'19 | $10,682 | $12,290 | $10,066 | $11,068 |
|---|
'19 | $10,881 | $12,632 | $10,008 | $11,196 |
|---|
'19 | $10,998 | $12,760 | $10,133 | $11,379 |
|---|
'19 | $11,244 | $13,181 | $10,103 | $11,549 |
|---|
'19 | $10,846 | $12,394 | $10,240 | $11,366 |
|---|
'19 | $11,315 | $13,188 | $10,467 | $11,740 |
|---|
'19 | $11,350 | $13,227 | $10,438 | $11,768 |
|---|
'19 | $11,315 | $12,891 | $10,650 | $11,843 |
|---|
'19 | $11,443 | $13,161 | $10,542 | $11,919 |
|---|
'19 | $11,631 | $13,524 | $10,612 | $12,065 |
|---|
'19 | $11,771 | $13,861 | $10,532 | $12,163 |
|---|
'19 | $12,046 | $14,355 | $10,593 | $12,338 |
|---|
'20 | $12,009 | $14,163 | $10,728 | $12,388 |
|---|
'20 | $11,439 | $13,001 | $10,801 | $12,084 |
|---|
'20 | $10,113 | $11,125 | $10,559 | $11,276 |
|---|
'20 | $10,782 | $12,352 | $10,766 | $11,808 |
|---|
'20 | $11,117 | $12,923 | $10,813 | $12,142 |
|---|
'20 | $11,303 | $13,337 | $10,909 | $12,344 |
|---|
'20 | $11,761 | $14,028 | $11,257 | $12,705 |
|---|
'20 | $12,121 | $14,880 | $11,240 | $12,967 |
|---|
'20 | $11,835 | $14,422 | $11,200 | $12,801 |
|---|
'20 | $11,674 | $14,110 | $11,210 | $12,662 |
|---|
'20 | $12,629 | $15,901 | $11,414 | $13,332 |
|---|
'20 | $13,033 | $16,696 | $11,567 | $13,625 |
|---|
'21 | $13,046 | $16,674 | $11,466 | $13,561 |
|---|
'21 | $13,227 | $17,126 | $11,268 | $13,605 |
|---|
'21 | $13,473 | $17,568 | $11,051 | $13,733 |
|---|
'21 | $13,899 | $18,327 | $11,191 | $14,029 |
|---|
'21 | $14,093 | $18,603 | $11,296 | $14,144 |
|---|
'21 | $14,261 | $18,825 | $11,196 | $14,263 |
|---|
'21 | $14,351 | $18,915 | $11,345 | $14,401 |
|---|
'21 | $14,545 | $19,382 | $11,298 | $14,527 |
|---|
'21 | $14,118 | $18,614 | $11,098 | $14,201 |
|---|
'21 | $14,596 | $19,514 | $11,071 | $14,487 |
|---|
'21 | $14,286 | $18,985 | $11,038 | $14,371 |
|---|
'21 | $14,760 | $19,736 | $11,023 | $14,594 |
|---|
'22 | $14,165 | $18,708 | $10,797 | $14,159 |
|---|
'22 | $13,952 | $18,282 | $10,669 | $13,890 |
|---|
'22 | $14,094 | $18,654 | $10,344 | $13,786 |
|---|
'22 | $13,273 | $17,173 | $9,777 | $13,052 |
|---|
'22 | $13,315 | $17,181 | $9,804 | $13,126 |
|---|
'22 | $12,493 | $15,698 | $9,489 | $12,548 |
|---|
'22 | $13,145 | $16,816 | $9,691 | $13,093 |
|---|
'22 | $12,734 | $16,222 | $9,308 | $12,646 |
|---|
'22 | $11,785 | $14,653 | $8,830 | $11,879 |
|---|
'22 | $12,253 | $15,552 | $8,769 | $12,109 |
|---|
'22 | $12,961 | $16,733 | $9,182 | $12,819 |
|---|
'22 | $12,545 | $16,096 | $9,232 | $12,490 |
|---|
'23 | $13,230 | $17,282 | $9,535 | $13,108 |
|---|
'23 | $12,836 | $16,801 | $9,218 | $12,746 |
|---|
'23 | $13,113 | $17,208 | $9,509 | $13,088 |
|---|
'23 | $13,186 | $17,424 | $9,551 | $13,212 |
|---|
'23 | $12,982 | $17,211 | $9,365 | $13,065 |
|---|
'23 | $13,434 | $18,212 | $9,364 | $13,369 |
|---|
'23 | $13,741 | $18,909 | $9,429 | $13,561 |
|---|
'23 | $13,449 | $18,364 | $9,300 | $13,363 |
|---|
'23 | $13,011 | $17,591 | $9,028 | $12,952 |
|---|
'23 | $12,749 | $17,001 | $8,920 | $12,698 |
|---|
'23 | $13,668 | $18,570 | $9,370 | $13,472 |
|---|
'23 | $14,287 | $19,550 | $9,759 | $14,040 |
|---|
'24 | $14,256 | $19,591 | $9,625 | $14,074 |
|---|
'24 | $14,564 | $20,406 | $9,504 | $14,195 |
|---|
'24 | $14,981 | $21,050 | $9,556 | $14,472 |
|---|
'24 | $14,379 | $20,334 | $9,315 | $14,075 |
|---|
'24 | $14,935 | $21,158 | $9,437 | $14,472 |
|---|
'24 | $15,043 | $21,543 | $9,451 | $14,632 |
|---|
'24 | $15,398 | $21,993 | $9,712 | $14,948 |
|---|
'24 | $15,675 | $22,504 | $9,941 | $15,213 |
|---|
'24 | $15,938 | $23,020 | $10,111 | $15,466 |
|---|
'24 | $15,475 | $22,485 | $9,772 | $15,127 |
|---|
'24 | $15,984 | $23,360 | $9,805 | $15,460 |
|---|
'24 | $15,510 | $22,734 | $9,595 | $15,159 |
|---|
'25 | $15,750 | $23,475 | $9,649 | $15,395 |
|---|
'25 | $15,816 | $23,268 | $9,787 | $15,548 |
|---|
'25 | $15,423 | $22,369 | $9,847 | $15,324 |
|---|
'25 | $15,423 | $22,584 | $10,137 | $15,408 |
|---|
'25 | $15,925 | $23,890 | $10,101 | $15,729 |
|---|
'25 | $16,406 | $24,974 | $10,292 | $16,162 |
|---|
'25 | $16,471 | $25,307 | $10,139 | $16,218 |
|---|
'25 | $16,799 | $26,004 | $10,286 | $16,522 |
|---|
'25 | $17,214 | $26,899 | $10,354 | $16,853 |
|---|
'25 | $17,432 | $27,443 | $10,327 | $17,061 |
|---|
'25 | $17,520 | $27,478 | $10,351 | $17,143 |
|---|
'25 | $17,587 | $27,765 | $10,378 | $17,186 |
|---|
'26 | $17,969 | $28,680 | $10,475 | $17,437 |
|---|
'26 | $18,193 | $29,134 | $10,593 | $17,716 |
|---|
'26 | $17,385 | $27,006 | $10,267 | $17,072 |
|---|
'26 | $18,485 | $29,736 | $10,395 | $17,749 |
|---|
'26 | $19,045 | $31,221 | $10,430 | $18,102 |
|---|
'26 | $19,001 | $31,027 | $10,356 | $18,101 |
|---|
'26 | $18,799 | $30,946 | $10,301 | $17,963 |
|---|
'26 | $19,135 | $31,813 | $10,348 | $18,201 |
|---|
|
| Average Annual Return [Table Text Block] |
|
Table SummaryClass/Index
| 1-Year | 5-Year | 10-Year |
|---|
Class A Unadjusted for Sales Charge | 13.91% | 5.64% | 7.34% |
|---|
Class A Adjusted for the Maximum Sales Charge (max 5.75% load) | 7.36% | 4.40% | 6.70% |
|---|
MSCI ACWI All Cap Index | 22.34% | 10.42% | 12.27% |
|---|
Bloomberg Global Aggregate Index | 0.60% | -1.74% | 0.34% |
|---|
S&P Target Risk Moderate Index | 10.16% | 4.61% | 6.17% |
|---|
|
| No Deduction of Taxes [Text Block] |
|
The performance graph and returns table do not reflect the deduction of taxes that a shareholder would pay on Fund distributions or the redemption of Fund shares.
|
| Material Change Date |
Sep. 01, 2025
|
|
| AssetsNet |
|
$ 21,843,091
|
| Holdings Count | Holding |
|
21
|
| Advisory Fees Paid, Amount |
|
$ 0
|
| InvestmentCompanyPortfolioTurnover |
|
49.00%
|
| Additional Fund Statistics [Text Block] |
|
Table SummaryNet Assets ($) | 21,843,091 |
|---|
Number of Portfolio Holdings | 21 |
|---|
Portfolio Turnover Rate (%) | 49 |
|---|
Total Net Advisory Fees Paid ($) | 0 |
|---|
|
| Holdings [Text Block] |
|
Table SummaryAsset Type | % of Net Assets |
|---|
Fixed Income - Bond Funds | 11% |
|---|
| DWS High Income Fund | 6% |
|---|
| DWS Emerging Markets Fixed Income Fund | 4% |
|---|
| DWS Enhanced Commodity Strategy Fund | 1% |
|---|
Fixed Income - Exchange-Traded Funds | 22% |
|---|
| Vanguard Intermediate-Term Corporate Bond ETF | 7% |
|---|
| iShares GNMA Bond ETF | 6% |
|---|
| iShares U.S. Treasury Bond ETF | 4% |
|---|
| VanEck JPMorgan EM Local Currency Bond ETF | 3% |
|---|
| iShares Core International Aggregate Bond ETF | 2% |
|---|
Fixed Income - Money Market Funds | 3% |
|---|
| DWS Central Cash Management Government Fund | 3% |
|---|
Equity - Equity Funds | 55% |
|---|
| DWS Equity 500 Index Fund | 42% |
|---|
| DWS Emerging Markets Equity Fund | 5% |
|---|
| DWS Small Cap Core Fund | 4% |
|---|
| DWS RREEF Real Estate Securities Fund | 2% |
|---|
| DWS RREEF Global Infrastructure Fund | 2% |
|---|
| DWS Global Real Estate Securities Fund | 0% |
|---|
Equity - Exchange-Traded Funds | 9% |
|---|
| iShares Core MSCI Europe ETF | 3% |
|---|
| iShares MSCI Japan ETF | 3% |
|---|
| iShares Russell 2000 ETF | 1% |
|---|
| Xtrackers RREEF Global Natural Resources ETF | 1% |
|---|
| Vanguard S&P 500 ETF | 1% |
|---|
Government & Agency Obligations | 1% |
|---|
| U.S. Treasury Bills | 1% |
|---|
Other Assets and Liabilities, Net | (1%) |
|---|
Total | 100% |
|---|
|
| Material Fund Change [Text Block] |
|
This is a summary of certain changes of the Fund since September 1, 2025. For more information, review the Fund's current prospectus at dws.com/mutualreports, or call (800) 728-3337. Effective October 1, 2025, the Fund’s contractual cap on total annual operating expense for Class A shares changed from 1.03% to 0.99%. The cap includes indirect expenses of underlying funds and excludes certain expenses such as extraordinary expenses, taxes, brokerage, and interest expense. |
| Material Fund Change Expenses [Text Block] |
|
Effective October 1, 2025, the Fund’s contractual cap on total annual operating expense for Class A shares changed from 1.03% to 0.99%. The cap includes indirect expenses of underlying funds and excludes certain expenses such as extraordinary expenses, taxes, brokerage, and interest expense.
|
| Summary of Change Legend [Text Block] |
|
This is a summary of certain changes of the Fund since September 1, 2025. For more information, review the Fund's current prospectus at dws.com/mutualreports, or call (800) 728-3337.
|
| C000016758 |
|
|
| Shareholder Report [Line Items] |
|
|
| Fund Name |
|
DWS Multi-Asset Moderate Allocation Fund
|
| Class Name |
|
Class C
|
| Trading Symbol |
|
PLSCX
|
| Annual or Semi-Annual Statement [Text Block] |
|
This annual shareholder report contains important information about DWS Multi-Asset Moderate Allocation Fund (the "Fund") for the period September 1, 2025 to August 31, 2026.
|
| Additional Information [Text Block] |
|
You can find additional information about the Fund on the Fund's website at dws.com/mutualreports. You can also request this information by contacting us at (800) 728-3337.
|
| Additional Information Phone Number |
|
(800) 728-3337
|
| Additional Information Website |
|
<span style="box-sizing: border-box; color: rgb(0, 0, 0); display: inline; flex-wrap: nowrap; font-size: 14.6667px; font-weight: 300; grid-area: auto; line-height: 17.6px; margin: 0px; overflow: visible; text-align: left; text-align-last: auto; white-space-collapse: preserve-breaks;">dws.com/mutualreports</span>
|
| Expenses [Text Block] |
|
What were the Fund costs for the last year?(Based on a hypothetical $10,000 investment) Table SummaryFund | Costs of a $10,000 investment | Costs paid as a percentage of a $10,000 investment |
|---|
Class C | $154 | 1.44% |
|---|
Gross expense ratio as of the latest prospectus: 2.49%. See prospectus for any contractual or voluntary waivers; without a waiver, costs would have been higher. Fund costs do not reflect expenses of the underlying funds in which the Fund invests. |
| Expenses Paid, Amount |
|
$ 154
|
| Expense Ratio, Percent |
|
1.44%
|
| Factors Affecting Performance [Text Block] |
|
How did the Fund perform last year and what affected its performance? Class C shares of the Fund returned 13.20% (unadjusted for sales charges) for the period ended August 31, 2026. The Fund's broad-based indices, the MSCI ACWI All Cap Index and the Bloomberg Global Aggregate Index, returned 22.34% and 0.60%, respectively for the same period, while the Fund's additional, more narrowly based index, the S&P Target Risk Moderate Index, returned 10.16%. The Fund’s overweight in equities relative to fixed income was the largest contributor to relative performance versus the S&P Target Risk Moderate Index, reflecting stocks’ strong outperformance versus bonds in the annual period. Within equities, the Fund’s overweight in U.S. large caps contributed positively. Overweights in emerging-market stocks and U.S. small caps were also beneficial. In fixed income, allocations to categories that are not represented in the S&P Target Risk Moderate Index, including emerging-market debt, high yield bonds, investment-grade corporates, and securitized assets, contributed to relative performance. Credit-oriented market segments performed well in the period, reflecting investors’ strong appetite for risk. An underweight in developed-market international bonds detracted from relative performance, as yields climbed in the latter half of the period on growing concerns about stubborn inflation and rising government debt. The Fund’s allocation to real assets and alternatives — which includes commodity futures, U.S. REITs, global REITs, global infrastructure, and natural resources equities — was an additional contributor. Commodities performed particularly well due to the supply disruptions caused by the conflict in Iran, and natural resources stocks were boosted by both the strength in commodity prices and the rally in the broader equity market. The Fund used derivatives to adjust its positioning and take advantage of tactical opportunities. Derivatives made a positive net contribution. Equity-index futures were positive in aggregate, and interest-rate futures made a small contribution, as well. |
| Performance Past Does Not Indicate Future [Text] |
|
The Fund's past performance is not a good predictor or guarantee of the Fund's future performance.
|
| Line Graph [Table Text Block] |
|
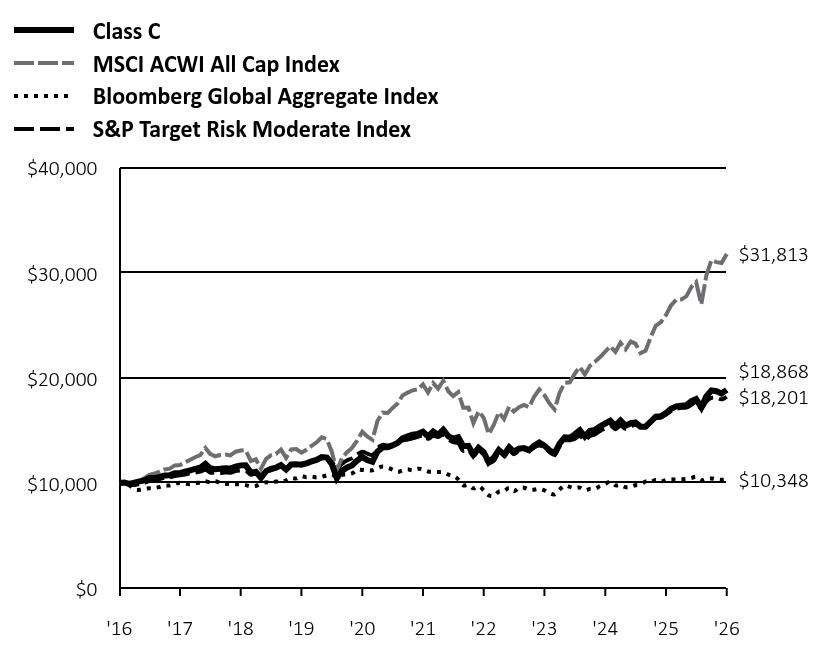 Table Summary | Class C | MSCI ACWI All Cap Index | Bloomberg Global Aggregate Index | S&P Target Risk Moderate Index |
|---|
'16 | $10,000 | $10,000 | $10,000 | $10,000 |
|---|
'16 | $10,032 | $10,077 | $10,055 | $10,033 |
|---|
'16 | $9,905 | $9,881 | $9,776 | $9,897 |
|---|
'16 | $10,021 | $9,988 | $9,388 | $9,805 |
|---|
'16 | $10,146 | $10,204 | $9,344 | $9,909 |
|---|
'17 | $10,257 | $10,482 | $9,450 | $10,012 |
|---|
'17 | $10,468 | $10,770 | $9,494 | $10,176 |
|---|
'17 | $10,468 | $10,898 | $9,509 | $10,243 |
|---|
'17 | $10,590 | $11,072 | $9,616 | $10,365 |
|---|
'17 | $10,713 | $11,293 | $9,765 | $10,501 |
|---|
'17 | $10,724 | $11,362 | $9,756 | $10,527 |
|---|
'17 | $10,935 | $11,673 | $9,920 | $10,672 |
|---|
'17 | $10,935 | $11,715 | $10,019 | $10,740 |
|---|
'17 | $11,079 | $11,968 | $9,929 | $10,808 |
|---|
'17 | $11,202 | $12,209 | $9,891 | $10,923 |
|---|
'17 | $11,346 | $12,448 | $10,001 | $10,992 |
|---|
'17 | $11,456 | $12,653 | $10,035 | $11,076 |
|---|
'18 | $11,817 | $13,335 | $10,155 | $11,270 |
|---|
'18 | $11,410 | $12,779 | $10,065 | $10,992 |
|---|
'18 | $11,305 | $12,541 | $10,172 | $10,992 |
|---|
'18 | $11,351 | $12,657 | $10,009 | $10,959 |
|---|
'18 | $11,410 | $12,708 | $9,933 | $11,005 |
|---|
'18 | $11,375 | $12,631 | $9,889 | $10,980 |
|---|
'18 | $11,561 | $12,976 | $9,873 | $11,132 |
|---|
'18 | $11,677 | $13,095 | $9,883 | $11,195 |
|---|
'18 | $11,689 | $13,115 | $9,798 | $11,181 |
|---|
'18 | $10,990 | $12,086 | $9,688 | $10,786 |
|---|
'18 | $11,072 | $12,254 | $9,719 | $10,884 |
|---|
'18 | $10,502 | $11,366 | $9,915 | $10,664 |
|---|
'19 | $11,136 | $12,290 | $10,066 | $11,068 |
|---|
'19 | $11,344 | $12,632 | $10,008 | $11,196 |
|---|
'19 | $11,454 | $12,760 | $10,133 | $11,379 |
|---|
'19 | $11,698 | $13,181 | $10,103 | $11,549 |
|---|
'19 | $11,283 | $12,394 | $10,240 | $11,366 |
|---|
'19 | $11,759 | $13,188 | $10,467 | $11,740 |
|---|
'19 | $11,783 | $13,227 | $10,438 | $11,768 |
|---|
'19 | $11,746 | $12,891 | $10,650 | $11,843 |
|---|
'19 | $11,868 | $13,161 | $10,542 | $11,919 |
|---|
'19 | $12,051 | $13,524 | $10,612 | $12,065 |
|---|
'19 | $12,198 | $13,861 | $10,532 | $12,163 |
|---|
'19 | $12,474 | $14,355 | $10,593 | $12,338 |
|---|
'20 | $12,423 | $14,163 | $10,728 | $12,388 |
|---|
'20 | $11,821 | $13,001 | $10,801 | $12,084 |
|---|
'20 | $10,450 | $11,125 | $10,559 | $11,276 |
|---|
'20 | $11,129 | $12,352 | $10,766 | $11,808 |
|---|
'20 | $11,475 | $12,923 | $10,813 | $12,142 |
|---|
'20 | $11,667 | $13,337 | $10,909 | $12,344 |
|---|
'20 | $12,128 | $14,028 | $11,257 | $12,705 |
|---|
'20 | $12,487 | $14,880 | $11,240 | $12,967 |
|---|
'20 | $12,192 | $14,422 | $11,200 | $12,801 |
|---|
'20 | $12,013 | $14,110 | $11,210 | $12,662 |
|---|
'20 | $12,986 | $15,901 | $11,414 | $13,332 |
|---|
'20 | $13,394 | $16,696 | $11,567 | $13,625 |
|---|
'21 | $13,394 | $16,674 | $11,466 | $13,561 |
|---|
'21 | $13,579 | $17,126 | $11,268 | $13,605 |
|---|
'21 | $13,817 | $17,568 | $11,051 | $13,733 |
|---|
'21 | $14,241 | $18,327 | $11,191 | $14,029 |
|---|
'21 | $14,440 | $18,603 | $11,296 | $14,144 |
|---|
'21 | $14,599 | $18,825 | $11,196 | $14,263 |
|---|
'21 | $14,679 | $18,915 | $11,345 | $14,401 |
|---|
'21 | $14,877 | $19,382 | $11,298 | $14,527 |
|---|
'21 | $14,440 | $18,614 | $11,098 | $14,201 |
|---|
'21 | $14,904 | $19,514 | $11,071 | $14,487 |
|---|
'21 | $14,586 | $18,985 | $11,038 | $14,371 |
|---|
'21 | $15,064 | $19,736 | $11,023 | $14,594 |
|---|
'22 | $14,445 | $18,708 | $10,797 | $14,159 |
|---|
'22 | $14,214 | $18,282 | $10,669 | $13,890 |
|---|
'22 | $14,344 | $18,654 | $10,344 | $13,786 |
|---|
'22 | $13,508 | $17,173 | $9,777 | $13,052 |
|---|
'22 | $13,536 | $17,181 | $9,804 | $13,126 |
|---|
'22 | $12,700 | $15,698 | $9,489 | $12,548 |
|---|
'22 | $13,349 | $16,816 | $9,691 | $13,093 |
|---|
'22 | $12,931 | $16,222 | $9,308 | $12,646 |
|---|
'22 | $11,965 | $14,653 | $8,830 | $11,879 |
|---|
'22 | $12,426 | $15,552 | $8,769 | $12,109 |
|---|
'22 | $13,133 | $16,733 | $9,182 | $12,819 |
|---|
'22 | $12,700 | $16,096 | $9,232 | $12,490 |
|---|
'23 | $13,392 | $17,282 | $9,535 | $13,108 |
|---|
'23 | $12,980 | $16,801 | $9,218 | $12,746 |
|---|
'23 | $13,260 | $17,208 | $9,509 | $13,088 |
|---|
'23 | $13,319 | $17,424 | $9,551 | $13,212 |
|---|
'23 | $13,113 | $17,211 | $9,365 | $13,065 |
|---|
'23 | $13,555 | $18,212 | $9,364 | $13,369 |
|---|
'23 | $13,849 | $18,909 | $9,429 | $13,561 |
|---|
'23 | $13,555 | $18,364 | $9,300 | $13,363 |
|---|
'23 | $13,113 | $17,591 | $9,028 | $12,952 |
|---|
'23 | $12,833 | $17,001 | $8,920 | $12,698 |
|---|
'23 | $13,746 | $18,570 | $9,370 | $13,472 |
|---|
'23 | $14,350 | $19,550 | $9,759 | $14,040 |
|---|
'24 | $14,319 | $19,591 | $9,625 | $14,074 |
|---|
'24 | $14,628 | $20,406 | $9,504 | $14,195 |
|---|
'24 | $15,030 | $21,050 | $9,556 | $14,472 |
|---|
'24 | $14,427 | $20,334 | $9,315 | $14,075 |
|---|
'24 | $14,969 | $21,158 | $9,437 | $14,472 |
|---|
'24 | $15,061 | $21,543 | $9,451 | $14,632 |
|---|
'24 | $15,402 | $21,993 | $9,712 | $14,948 |
|---|
'24 | $15,664 | $22,504 | $9,941 | $15,213 |
|---|
'24 | $15,927 | $23,020 | $10,111 | $15,466 |
|---|
'24 | $15,463 | $22,485 | $9,772 | $15,127 |
|---|
'24 | $15,943 | $23,360 | $9,805 | $15,460 |
|---|
'24 | $15,453 | $22,734 | $9,595 | $15,159 |
|---|
'25 | $15,692 | $23,475 | $9,649 | $15,395 |
|---|
'25 | $15,757 | $23,268 | $9,787 | $15,548 |
|---|
'25 | $15,366 | $22,369 | $9,847 | $15,324 |
|---|
'25 | $15,366 | $22,584 | $10,137 | $15,408 |
|---|
'25 | $15,844 | $23,890 | $10,101 | $15,729 |
|---|
'25 | $16,321 | $24,974 | $10,292 | $16,162 |
|---|
'25 | $16,343 | $25,307 | $10,139 | $16,218 |
|---|
'25 | $16,668 | $26,004 | $10,286 | $16,522 |
|---|
'25 | $17,059 | $26,899 | $10,354 | $16,853 |
|---|
'25 | $17,298 | $27,443 | $10,327 | $17,061 |
|---|
'25 | $17,363 | $27,478 | $10,351 | $17,143 |
|---|
'25 | $17,414 | $27,765 | $10,378 | $17,186 |
|---|
'26 | $17,788 | $28,680 | $10,475 | $17,437 |
|---|
'26 | $17,987 | $29,134 | $10,593 | $17,716 |
|---|
'26 | $17,193 | $27,006 | $10,267 | $17,072 |
|---|
'26 | $18,251 | $29,736 | $10,395 | $17,749 |
|---|
'26 | $18,802 | $31,221 | $10,430 | $18,102 |
|---|
'26 | $18,736 | $31,027 | $10,356 | $18,101 |
|---|
'26 | $18,516 | $30,946 | $10,301 | $17,963 |
|---|
'26 | $18,868 | $31,813 | $10,348 | $18,201 |
|---|
|
| Average Annual Return [Table Text Block] |
|
Table SummaryClass/Index
| 1-Year | 5-Year | 10-Year |
|---|
Class C Unadjusted for Sales Charge | 13.20% | 4.87% | 6.55% |
|---|
Class C Adjusted for the Maximum Sales Charge (max 1.00% CDSC) | 12.20% | 4.87% | 6.55% |
|---|
MSCI ACWI All Cap Index | 22.34% | 10.42% | 12.27% |
|---|
Bloomberg Global Aggregate Index | 0.60% | -1.74% | 0.34% |
|---|
S&P Target Risk Moderate Index | 10.16% | 4.61% | 6.17% |
|---|
|
| No Deduction of Taxes [Text Block] |
|
The performance graph and returns table do not reflect the deduction of taxes that a shareholder would pay on Fund distributions or the redemption of Fund shares.
|
| Material Change Date |
Sep. 01, 2025
|
|
| AssetsNet |
|
$ 21,843,091
|
| Holdings Count | Holding |
|
21
|
| Advisory Fees Paid, Amount |
|
$ 0
|
| InvestmentCompanyPortfolioTurnover |
|
49.00%
|
| Additional Fund Statistics [Text Block] |
|
Table SummaryNet Assets ($) | 21,843,091 |
|---|
Number of Portfolio Holdings | 21 |
|---|
Portfolio Turnover Rate (%) | 49 |
|---|
Total Net Advisory Fees Paid ($) | 0 |
|---|
|
| Holdings [Text Block] |
|
Table SummaryAsset Type | % of Net Assets |
|---|
Fixed Income - Bond Funds | 11% |
|---|
| DWS High Income Fund | 6% |
|---|
| DWS Emerging Markets Fixed Income Fund | 4% |
|---|
| DWS Enhanced Commodity Strategy Fund | 1% |
|---|
Fixed Income - Exchange-Traded Funds | 22% |
|---|
| Vanguard Intermediate-Term Corporate Bond ETF | 7% |
|---|
| iShares GNMA Bond ETF | 6% |
|---|
| iShares U.S. Treasury Bond ETF | 4% |
|---|
| VanEck JPMorgan EM Local Currency Bond ETF | 3% |
|---|
| iShares Core International Aggregate Bond ETF | 2% |
|---|
Fixed Income - Money Market Funds | 3% |
|---|
| DWS Central Cash Management Government Fund | 3% |
|---|
Equity - Equity Funds | 55% |
|---|
| DWS Equity 500 Index Fund | 42% |
|---|
| DWS Emerging Markets Equity Fund | 5% |
|---|
| DWS Small Cap Core Fund | 4% |
|---|
| DWS RREEF Real Estate Securities Fund | 2% |
|---|
| DWS RREEF Global Infrastructure Fund | 2% |
|---|
| DWS Global Real Estate Securities Fund | 0% |
|---|
Equity - Exchange-Traded Funds | 9% |
|---|
| iShares Core MSCI Europe ETF | 3% |
|---|
| iShares MSCI Japan ETF | 3% |
|---|
| iShares Russell 2000 ETF | 1% |
|---|
| Xtrackers RREEF Global Natural Resources ETF | 1% |
|---|
| Vanguard S&P 500 ETF | 1% |
|---|
Government & Agency Obligations | 1% |
|---|
| U.S. Treasury Bills | 1% |
|---|
Other Assets and Liabilities, Net | (1%) |
|---|
Total | 100% |
|---|
|
| Material Fund Change [Text Block] |
|
This is a summary of certain changes of the Fund since September 1, 2025. For more information, review the Fund's current prospectus at dws.com/mutualreports, or call (800) 728-3337. Effective October 1, 2025, the Fund’s contractual cap on total annual operating expense for Class C shares changed from 1.78% to 1.74%. The cap includes indirect expenses of underlying funds and excludes certain expenses such as extraordinary expenses, taxes, brokerage, and interest expense. |
| Material Fund Change Expenses [Text Block] |
|
Effective October 1, 2025, the Fund’s contractual cap on total annual operating expense for Class C shares changed from 1.78% to 1.74%. The cap includes indirect expenses of underlying funds and excludes certain expenses such as extraordinary expenses, taxes, brokerage, and interest expense.
|
| Summary of Change Legend [Text Block] |
|
This is a summary of certain changes of the Fund since September 1, 2025. For more information, review the Fund's current prospectus at dws.com/mutualreports, or call (800) 728-3337.
|
| C000016759 |
|
|
| Shareholder Report [Line Items] |
|
|
| Fund Name |
|
DWS Multi-Asset Moderate Allocation Fund
|
| Class Name |
|
Class S
|
| Trading Symbol |
|
PPLSX
|
| Annual or Semi-Annual Statement [Text Block] |
|
This annual shareholder report contains important information about DWS Multi-Asset Moderate Allocation Fund (the "Fund") for the period September 1, 2025 to August 31, 2026.
|
| Additional Information [Text Block] |
|
You can find additional information about the Fund on the Fund's website at dws.com/mutualreports. You can also request this information by contacting us at (800) 728-3337.
|
| Additional Information Phone Number |
|
(800) 728-3337
|
| Additional Information Website |
|
<span style="box-sizing: border-box; color: rgb(0, 0, 0); display: inline; flex-wrap: nowrap; font-size: 14.6667px; font-weight: 300; grid-area: auto; line-height: 17.6px; margin: 0px; overflow: visible; text-align: left; text-align-last: auto; white-space-collapse: preserve-breaks;">dws.com/mutualreports</span>
|
| Expenses [Text Block] |
|
What were the Fund costs for the last year?(Based on a hypothetical $10,000 investment) Table SummaryFund | Costs of a $10,000 investment | Costs paid as a percentage of a $10,000 investment |
|---|
Class S | $47 | 0.44% |
|---|
Gross expense ratio as of the latest prospectus: 1.35%. See prospectus for any contractual or voluntary waivers; without a waiver, costs would have been higher. Fund costs do not reflect expenses of the underlying funds in which the Fund invests. |
| Expenses Paid, Amount |
|
$ 47
|
| Expense Ratio, Percent |
|
0.44%
|
| Factors Affecting Performance [Text Block] |
|
How did the Fund perform last year and what affected its performance? Class S shares of the Fund returned 14.24% for the period ended August 31, 2026. The Fund's broad-based indices, the MSCI ACWI All Cap Index and the Bloomberg Global Aggregate Index, returned 22.34% and 0.60%, respectively for the same period, while the Fund's additional, more narrowly based index, the S&P Target Risk Moderate Index, returned 10.16%. The Fund’s overweight in equities relative to fixed income was the largest contributor to relative performance versus the S&P Target Risk Moderate Index, reflecting stocks’ strong outperformance versus bonds in the annual period. Within equities, the Fund’s overweight in U.S. large caps contributed positively. Overweights in emerging-market stocks and U.S. small caps were also beneficial. In fixed income, allocations to categories that are not represented in the S&P Target Risk Moderate Index, including emerging-market debt, high yield bonds, investment-grade corporates, and securitized assets, contributed to relative performance. Credit-oriented market segments performed well in the period, reflecting investors’ strong appetite for risk. An underweight in developed-market international bonds detracted from relative performance, as yields climbed in the latter half of the period on growing concerns about stubborn inflation and rising government debt. The Fund’s allocation to real assets and alternatives — which includes commodity futures, U.S. REITs, global REITs, global infrastructure, and natural resources equities — was an additional contributor. Commodities performed particularly well due to the supply disruptions caused by the conflict in Iran, and natural resources stocks were boosted by both the strength in commodity prices and the rally in the broader equity market. The Fund used derivatives to adjust its positioning and take advantage of tactical opportunities. Derivatives made a positive net contribution. Equity-index futures were positive in aggregate, and interest-rate futures made a small contribution, as well. |
| Performance Past Does Not Indicate Future [Text] |
|
The Fund's past performance is not a good predictor or guarantee of the Fund's future performance.
|
| Line Graph [Table Text Block] |
|
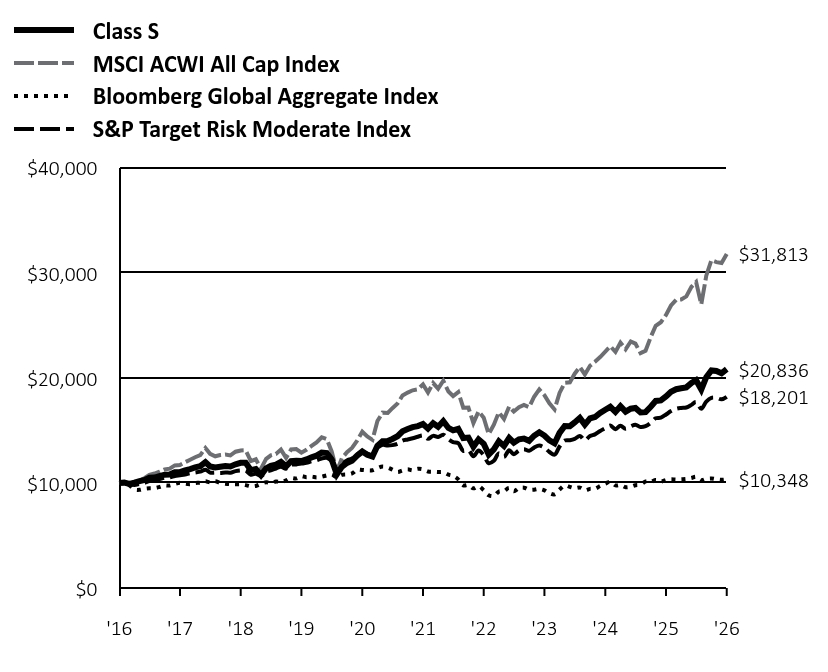 Table Summary | Class S | MSCI ACWI All Cap Index | Bloomberg Global Aggregate Index | S&P Target Risk Moderate Index |
|---|
'16 | $10,000 | $10,000 | $10,000 | $10,000 |
|---|
'16 | $10,032 | $10,077 | $10,055 | $10,033 |
|---|
'16 | $9,916 | $9,881 | $9,776 | $9,897 |
|---|
'16 | $10,032 | $9,988 | $9,388 | $9,805 |
|---|
'16 | $10,174 | $10,204 | $9,344 | $9,909 |
|---|
'17 | $10,297 | $10,482 | $9,450 | $10,012 |
|---|
'17 | $10,509 | $10,770 | $9,494 | $10,176 |
|---|
'17 | $10,520 | $10,898 | $9,509 | $10,243 |
|---|
'17 | $10,655 | $11,072 | $9,616 | $10,365 |
|---|
'17 | $10,789 | $11,293 | $9,765 | $10,501 |
|---|
'17 | $10,800 | $11,362 | $9,756 | $10,527 |
|---|
'17 | $11,023 | $11,673 | $9,920 | $10,672 |
|---|
'17 | $11,035 | $11,715 | $10,019 | $10,740 |
|---|
'17 | $11,191 | $11,968 | $9,929 | $10,808 |
|---|
'17 | $11,325 | $12,209 | $9,891 | $10,923 |
|---|
'17 | $11,482 | $12,448 | $10,001 | $10,992 |
|---|
'17 | $11,597 | $12,653 | $10,035 | $11,076 |
|---|
'18 | $11,976 | $13,335 | $10,155 | $11,270 |
|---|
'18 | $11,573 | $12,779 | $10,065 | $10,992 |
|---|
'18 | $11,479 | $12,541 | $10,172 | $10,992 |
|---|
'18 | $11,538 | $12,657 | $10,009 | $10,959 |
|---|
'18 | $11,609 | $12,708 | $9,933 | $11,005 |
|---|
'18 | $11,573 | $12,631 | $9,889 | $10,980 |
|---|
'18 | $11,775 | $12,976 | $9,873 | $11,132 |
|---|
'18 | $11,917 | $13,095 | $9,883 | $11,195 |
|---|
'18 | $11,928 | $13,115 | $9,798 | $11,181 |
|---|
'18 | $11,218 | $12,086 | $9,688 | $10,786 |
|---|
'18 | $11,325 | $12,254 | $9,719 | $10,884 |
|---|
'18 | $10,747 | $11,366 | $9,915 | $10,664 |
|---|
'19 | $11,398 | $12,290 | $10,066 | $11,068 |
|---|
'19 | $11,624 | $12,632 | $10,008 | $11,196 |
|---|
'19 | $11,749 | $12,760 | $10,133 | $11,379 |
|---|
'19 | $12,012 | $13,181 | $10,103 | $11,549 |
|---|
'19 | $11,586 | $12,394 | $10,240 | $11,366 |
|---|
'19 | $12,087 | $13,188 | $10,467 | $11,740 |
|---|
'19 | $12,125 | $13,227 | $10,438 | $11,768 |
|---|
'19 | $12,087 | $12,891 | $10,650 | $11,843 |
|---|
'19 | $12,238 | $13,161 | $10,542 | $11,919 |
|---|
'19 | $12,438 | $13,524 | $10,612 | $12,065 |
|---|
'19 | $12,601 | $13,861 | $10,532 | $12,163 |
|---|
'19 | $12,890 | $14,355 | $10,593 | $12,338 |
|---|
'20 | $12,850 | $14,163 | $10,728 | $12,388 |
|---|
'20 | $12,238 | $13,001 | $10,801 | $12,084 |
|---|
'20 | $10,830 | $11,125 | $10,559 | $11,276 |
|---|
'20 | $11,534 | $12,352 | $10,766 | $11,808 |
|---|
'20 | $11,906 | $12,923 | $10,813 | $12,142 |
|---|
'20 | $12,119 | $13,337 | $10,909 | $12,344 |
|---|
'20 | $12,611 | $14,028 | $11,257 | $12,705 |
|---|
'20 | $12,996 | $14,880 | $11,240 | $12,967 |
|---|
'20 | $12,690 | $14,422 | $11,200 | $12,801 |
|---|
'20 | $12,518 | $14,110 | $11,210 | $12,662 |
|---|
'20 | $13,541 | $15,901 | $11,414 | $13,332 |
|---|
'20 | $13,983 | $16,696 | $11,567 | $13,625 |
|---|
'21 | $13,997 | $16,674 | $11,466 | $13,561 |
|---|
'21 | $14,191 | $17,126 | $11,268 | $13,605 |
|---|
'21 | $14,455 | $17,568 | $11,051 | $13,733 |
|---|
'21 | $14,914 | $18,327 | $11,191 | $14,029 |
|---|
'21 | $15,136 | $18,603 | $11,296 | $14,144 |
|---|
'21 | $15,316 | $18,825 | $11,196 | $14,263 |
|---|
'21 | $15,413 | $18,915 | $11,345 | $14,401 |
|---|
'21 | $15,622 | $19,382 | $11,298 | $14,527 |
|---|
'21 | $15,177 | $18,614 | $11,098 | $14,201 |
|---|
'21 | $15,691 | $19,514 | $11,071 | $14,487 |
|---|
'21 | $15,358 | $18,985 | $11,038 | $14,371 |
|---|
'21 | $15,879 | $19,736 | $11,023 | $14,594 |
|---|
'22 | $15,238 | $18,708 | $10,797 | $14,159 |
|---|
'22 | $15,009 | $18,282 | $10,669 | $13,890 |
|---|
'22 | $15,162 | $18,654 | $10,344 | $13,786 |
|---|
'22 | $14,276 | $17,173 | $9,777 | $13,052 |
|---|
'22 | $14,322 | $17,181 | $9,804 | $13,126 |
|---|
'22 | $13,451 | $15,698 | $9,489 | $12,548 |
|---|
'22 | $14,154 | $16,816 | $9,691 | $13,093 |
|---|
'22 | $13,726 | $16,222 | $9,308 | $12,646 |
|---|
'22 | $12,703 | $14,653 | $8,830 | $11,879 |
|---|
'22 | $13,207 | $15,552 | $8,769 | $12,109 |
|---|
'22 | $13,971 | $16,733 | $9,182 | $12,819 |
|---|
'22 | $13,525 | $16,096 | $9,232 | $12,490 |
|---|
'23 | $14,282 | $17,282 | $9,535 | $13,108 |
|---|
'23 | $13,840 | $16,801 | $9,218 | $12,746 |
|---|
'23 | $14,155 | $17,208 | $9,509 | $13,088 |
|---|
'23 | $14,234 | $17,424 | $9,551 | $13,212 |
|---|
'23 | $14,014 | $17,211 | $9,365 | $13,065 |
|---|
'23 | $14,502 | $18,212 | $9,364 | $13,369 |
|---|
'23 | $14,833 | $18,909 | $9,429 | $13,561 |
|---|
'23 | $14,518 | $18,364 | $9,300 | $13,363 |
|---|
'23 | $14,061 | $17,591 | $9,028 | $12,952 |
|---|
'23 | $13,777 | $17,001 | $8,920 | $12,698 |
|---|
'23 | $14,770 | $18,570 | $9,370 | $13,472 |
|---|
'23 | $15,430 | $19,550 | $9,759 | $14,040 |
|---|
'24 | $15,413 | $19,591 | $9,625 | $14,074 |
|---|
'24 | $15,764 | $20,406 | $9,504 | $14,195 |
|---|
'24 | $16,199 | $21,050 | $9,556 | $14,472 |
|---|
'24 | $15,563 | $20,334 | $9,315 | $14,075 |
|---|
'24 | $16,148 | $21,158 | $9,437 | $14,472 |
|---|
'24 | $16,282 | $21,543 | $9,451 | $14,632 |
|---|
'24 | $16,667 | $21,993 | $9,712 | $14,948 |
|---|
'24 | $16,968 | $22,504 | $9,941 | $15,213 |
|---|
'24 | $17,252 | $23,020 | $10,111 | $15,466 |
|---|
'24 | $16,767 | $22,485 | $9,772 | $15,127 |
|---|
'24 | $17,302 | $23,360 | $9,805 | $15,460 |
|---|
'24 | $16,790 | $22,734 | $9,595 | $15,159 |
|---|
'25 | $17,075 | $23,475 | $9,649 | $15,395 |
|---|
'25 | $17,146 | $23,268 | $9,787 | $15,548 |
|---|
'25 | $16,719 | $22,369 | $9,847 | $15,324 |
|---|
'25 | $16,743 | $22,584 | $10,137 | $15,408 |
|---|
'25 | $17,265 | $23,890 | $10,101 | $15,729 |
|---|
'25 | $17,811 | $24,974 | $10,292 | $16,162 |
|---|
'25 | $17,859 | $25,307 | $10,139 | $16,218 |
|---|
'25 | $18,239 | $26,004 | $10,286 | $16,522 |
|---|
'25 | $18,690 | $26,899 | $10,354 | $16,853 |
|---|
'25 | $18,928 | $27,443 | $10,327 | $17,061 |
|---|
'25 | $19,023 | $27,478 | $10,351 | $17,143 |
|---|
'25 | $19,100 | $27,765 | $10,378 | $17,186 |
|---|
'26 | $19,516 | $28,680 | $10,475 | $17,437 |
|---|
'26 | $19,785 | $29,134 | $10,593 | $17,716 |
|---|
'26 | $18,904 | $27,006 | $10,267 | $17,072 |
|---|
'26 | $20,078 | $29,736 | $10,395 | $17,749 |
|---|
'26 | $20,714 | $31,221 | $10,430 | $18,102 |
|---|
'26 | $20,665 | $31,027 | $10,356 | $18,101 |
|---|
'26 | $20,445 | $30,946 | $10,301 | $17,963 |
|---|
'26 | $20,836 | $31,813 | $10,348 | $18,201 |
|---|
|
| Average Annual Return [Table Text Block] |
|
Table SummaryClass/Index
| 1-Year | 5-Year | 10-Year |
|---|
Class S No Sales Charge | 14.24% | 5.93% | 7.62% |
|---|
MSCI ACWI All Cap Index | 22.34% | 10.42% | 12.27% |
|---|
Bloomberg Global Aggregate Index | 0.60% | -1.74% | 0.34% |
|---|
S&P Target Risk Moderate Index | 10.16% | 4.61% | 6.17% |
|---|
|
| No Deduction of Taxes [Text Block] |
|
The performance graph and returns table do not reflect the deduction of taxes that a shareholder would pay on Fund distributions or the redemption of Fund shares.
|
| Material Change Date |
Sep. 01, 2025
|
|
| AssetsNet |
|
$ 21,843,091
|
| Holdings Count | Holding |
|
21
|
| Advisory Fees Paid, Amount |
|
$ 0
|
| InvestmentCompanyPortfolioTurnover |
|
49.00%
|
| Additional Fund Statistics [Text Block] |
|
Table SummaryNet Assets ($) | 21,843,091 |
|---|
Number of Portfolio Holdings | 21 |
|---|
Portfolio Turnover Rate (%) | 49 |
|---|
Total Net Advisory Fees Paid ($) | 0 |
|---|
|
| Holdings [Text Block] |
|
Table SummaryAsset Type | % of Net Assets |
|---|
Fixed Income - Bond Funds | 11% |
|---|
| DWS High Income Fund | 6% |
|---|
| DWS Emerging Markets Fixed Income Fund | 4% |
|---|
| DWS Enhanced Commodity Strategy Fund | 1% |
|---|
Fixed Income - Exchange-Traded Funds | 22% |
|---|
| Vanguard Intermediate-Term Corporate Bond ETF | 7% |
|---|
| iShares GNMA Bond ETF | 6% |
|---|
| iShares U.S. Treasury Bond ETF | 4% |
|---|
| VanEck JPMorgan EM Local Currency Bond ETF | 3% |
|---|
| iShares Core International Aggregate Bond ETF | 2% |
|---|
Fixed Income - Money Market Funds | 3% |
|---|
| DWS Central Cash Management Government Fund | 3% |
|---|
Equity - Equity Funds | 55% |
|---|
| DWS Equity 500 Index Fund | 42% |
|---|
| DWS Emerging Markets Equity Fund | 5% |
|---|
| DWS Small Cap Core Fund | 4% |
|---|
| DWS RREEF Real Estate Securities Fund | 2% |
|---|
| DWS RREEF Global Infrastructure Fund | 2% |
|---|
| DWS Global Real Estate Securities Fund | 0% |
|---|
Equity - Exchange-Traded Funds | 9% |
|---|
| iShares Core MSCI Europe ETF | 3% |
|---|
| iShares MSCI Japan ETF | 3% |
|---|
| iShares Russell 2000 ETF | 1% |
|---|
| Xtrackers RREEF Global Natural Resources ETF | 1% |
|---|
| Vanguard S&P 500 ETF | 1% |
|---|
Government & Agency Obligations | 1% |
|---|
| U.S. Treasury Bills | 1% |
|---|
Other Assets and Liabilities, Net | (1%) |
|---|
Total | 100% |
|---|
|
| Material Fund Change [Text Block] |
|
This is a summary of certain changes of the Fund since September 1, 2025. For more information, review the Fund's current prospectus at dws.com/mutualreports, or call (800) 728-3337. Effective October 1, 2025, the Fund’s contractual cap on total annual operating expense for Class S shares changed from 0.78% to 0.74%. The cap includes indirect expenses of underlying funds and excludes certain expenses such as extraordinary expenses, taxes, brokerage, and interest expense. |
| Material Fund Change Expenses [Text Block] |
|
Effective October 1, 2025, the Fund’s contractual cap on total annual operating expense for Class S shares changed from 0.78% to 0.74%. The cap includes indirect expenses of underlying funds and excludes certain expenses such as extraordinary expenses, taxes, brokerage, and interest expense.
|
| Summary of Change Legend [Text Block] |
|
This is a summary of certain changes of the Fund since September 1, 2025. For more information, review the Fund's current prospectus at dws.com/mutualreports, or call (800) 728-3337.
|