Shareholder Report
|
|
12 Months Ended |
Sep. 01, 2025 |
Aug. 31, 2026
USD ($)
Holding
|
| Shareholder Report [Line Items] |
|
|
| Document Type |
|
N-CSR
|
| Amendment Flag |
|
false
|
| Registrant Name |
|
DEUTSCHE DWS INTERNATIONAL FUND, INC.
|
| Entity Central Index Key |
|
0000088053
|
| Entity Investment Company Type |
|
N-1A
|
| Document Period End Date |
|
Aug. 31, 2026
|
| Shareholder Report Annual or Semi-Annual |
|
Annual Shareholder Report
|
| C000016568 |
|
|
| Shareholder Report [Line Items] |
|
|
| Fund Name |
|
DWS CROCI<sup style="inset: 1.5px 0px 4px; box-sizing: border-box; color: rgb(0, 0, 0); display: inline; flex-wrap: nowrap; font-size: 21px; font-weight: 400; grid-area: auto; line-height: 0px; margin: 0px; overflow: visible; position: relative; text-align: left; text-align-last: auto; white-space-collapse: preserve-breaks;">®</sup> International Fund
|
| Class Name |
|
Class A
|
| Trading Symbol |
|
SUIAX
|
| Annual or Semi-Annual Statement [Text Block] |
|
This annual shareholder report contains important information about DWS CROCI® International Fund (the "Fund") for the period September 1, 2025 to August 31, 2026.
|
| Additional Information [Text Block] |
|
You can find additional information about the Fund on the Fund's website at dws.com/mutualreports. You can also request this information by contacting us at (800) 728-3337.
|
| Additional Information Phone Number |
|
(800) 728-3337
|
| Additional Information Website |
|
<span style="box-sizing: border-box; color: rgb(0, 0, 0); display: inline; flex-wrap: nowrap; font-size: 14.6667px; font-weight: 300; grid-area: auto; line-height: 17.6px; margin: 0px; overflow: visible; text-align: left; text-align-last: auto; white-space-collapse: preserve-breaks;">dws.com/mutualreports</span>
|
| Expenses [Text Block] |
|
What were the Fund costs for the last year?(Based on a hypothetical $10,000 investment) Table SummaryFund | Costs of a $10,000 investment | Costs paid as a percentage of a $10,000 investment |
|---|
Class A | $130 | 1.13% |
|---|
Gross expense ratio as of the latest prospectus: 1.20%. See prospectus for any contractual or voluntary waivers; without a waiver, costs would have been higher. |
| Expenses Paid, Amount |
|
$ 130
|
| Expense Ratio, Percent |
|
1.13%
|
| Factors Affecting Performance [Text Block] |
|
How did the Fund perform last year and what affected its performance? Class A shares of the Fund returned 30.48% (unadjusted for sales charges) for the period ended August 31, 2026. The Fund's broad-based index, the MSCI EAFE Index, returned 21.62% for the same period, while the Fund's additional, more narrowly based index, the MSCI EAFE® Value Index, returned 28.49%. Stock selection was the primary driver of the Fund’s outperformance relative to the MSCI EAFE Value Index. The Fund’s holdings outpaced the corresponding index components in seven of the ten sectors in which it held a position, with the best results occurring in materials. The French steel producer ArcelorMittal SA,* whose shares rallied on the strength of improving profit margins and robust global industrial demand, was the top contributor in the sector. Positions in several mining stocks that were propelled by rising commodity prices, including BHP Group Ltd. (2.9%) and Rio Tinto PLC (2.1%), further supported results. The Fund also outperformed in financials, led by Oversea-China Banking Ltd.* and several European banks. Health care was an additional area of strength. The Japanese company Ono Pharmaceutical Co., Ltd. (2.3%), which reported better-than-expected earnings, was the top contributor in the sector. Teva Pharmaceutical Industries Ltd. (0.3%) and Astellas Pharma, Inc. (1.9%) were additional contributors of note. Tenaris SA (1.4%), a manufacturer of steel pipes used by energy producers, was the leading contributor in the portfolio as a whole. The company reported robust earnings and received a number of analyst upgrades, boosting its shares. On the other hand, the Fund was hurt by weaker selection in industrials. While its holdings in the sector posted a strong, double-digit gain, poor returns for certain individual stocks weighed on relative performance. Most notably, Central Japan Railway Co. (2.6%) lagged due to declining passenger demand and construction delays on a new rail line. Selection in utilities and information technology also detracted somewhat, as did positions in the French pharmaceutical giant Sanofi SA (3.8%) and the British tobacco company Imperial Brands PLC (1.9%). Sector allocation had a neutral impact overall. While a zero weighting in real estate and an overweight in information technology contributed, an underweight in the strong-performing financials sector was a notable detractor. Percentages in parentheses are based on the Fund’s net assets as of August 31, 2026. * Not held at August 31, 2026. |
| Performance Past Does Not Indicate Future [Text] |
|
The Fund's past performance is not a good predictor or guarantee of the Fund's future performance.
|
| Line Graph [Table Text Block] |
|
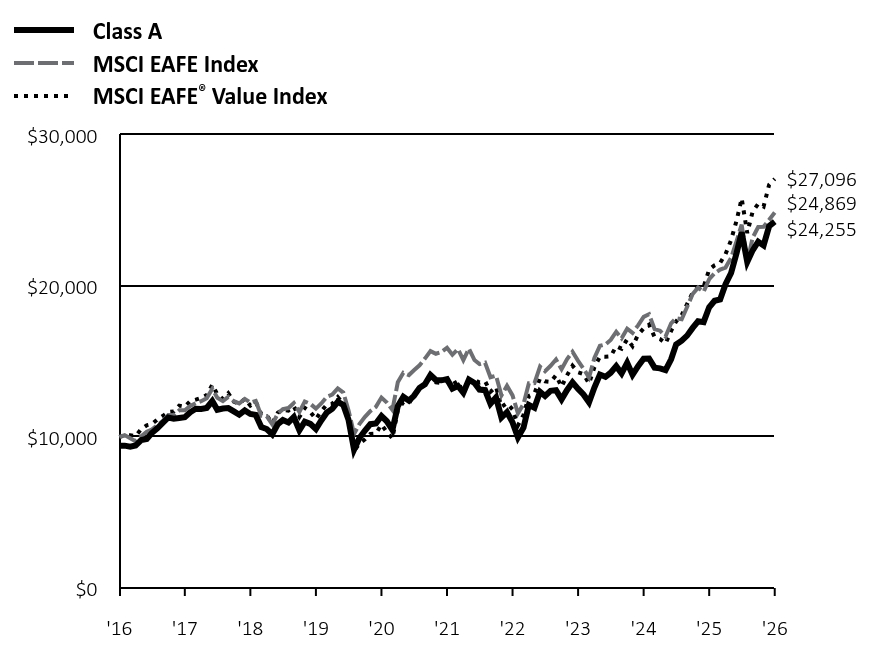 Table Summary | Class A | MSCI EAFE Index | MSCI EAFE® Value Index |
|---|
'16 | $9,425 | $10,000 | $10,000 |
|---|
'16 | $9,427 | $10,123 | $10,097 |
|---|
'16 | $9,360 | $9,916 | $10,120 |
|---|
'16 | $9,434 | $9,718 | $10,058 |
|---|
'16 | $9,795 | $10,051 | $10,518 |
|---|
'17 | $9,865 | $10,342 | $10,777 |
|---|
'17 | $10,261 | $10,490 | $10,851 |
|---|
'17 | $10,573 | $10,779 | $11,154 |
|---|
'17 | $10,930 | $11,053 | $11,388 |
|---|
'17 | $11,293 | $11,459 | $11,652 |
|---|
'17 | $11,216 | $11,439 | $11,687 |
|---|
'17 | $11,259 | $11,768 | $12,078 |
|---|
'17 | $11,307 | $11,764 | $12,003 |
|---|
'17 | $11,636 | $12,057 | $12,373 |
|---|
'17 | $11,866 | $12,240 | $12,469 |
|---|
'17 | $11,859 | $12,368 | $12,581 |
|---|
'17 | $11,924 | $12,567 | $12,773 |
|---|
'18 | $12,381 | $13,197 | $13,463 |
|---|
'18 | $11,801 | $12,601 | $12,823 |
|---|
'18 | $11,880 | $12,374 | $12,514 |
|---|
'18 | $11,914 | $12,657 | $12,900 |
|---|
'18 | $11,693 | $12,372 | $12,341 |
|---|
'18 | $11,475 | $12,221 | $12,184 |
|---|
'18 | $11,755 | $12,522 | $12,534 |
|---|
'18 | $11,526 | $12,280 | $12,078 |
|---|
'18 | $11,463 | $12,387 | $12,328 |
|---|
'18 | $10,660 | $11,401 | $11,509 |
|---|
'18 | $10,525 | $11,386 | $11,445 |
|---|
'18 | $10,178 | $10,834 | $10,886 |
|---|
'19 | $10,856 | $11,546 | $11,614 |
|---|
'19 | $11,120 | $11,840 | $11,808 |
|---|
'19 | $10,963 | $11,915 | $11,748 |
|---|
'19 | $11,318 | $12,250 | $12,021 |
|---|
'19 | $10,444 | $11,661 | $11,325 |
|---|
'19 | $11,011 | $12,353 | $11,929 |
|---|
'19 | $10,866 | $12,196 | $11,660 |
|---|
'19 | $10,518 | $11,880 | $11,181 |
|---|
'19 | $11,095 | $12,221 | $11,721 |
|---|
'19 | $11,621 | $12,660 | $12,144 |
|---|
'19 | $11,862 | $12,803 | $12,192 |
|---|
'19 | $12,329 | $13,219 | $12,637 |
|---|
'20 | $12,122 | $12,943 | $12,180 |
|---|
'20 | $11,147 | $11,773 | $11,028 |
|---|
'20 | $9,161 | $10,201 | $9,074 |
|---|
'20 | $9,929 | $10,860 | $9,559 |
|---|
'20 | $10,424 | $11,333 | $9,850 |
|---|
'20 | $10,848 | $11,719 | $10,201 |
|---|
'20 | $10,890 | $11,992 | $10,221 |
|---|
'20 | $11,388 | $12,609 | $10,820 |
|---|
'20 | $11,040 | $12,281 | $10,323 |
|---|
'20 | $10,471 | $11,791 | $9,907 |
|---|
'20 | $12,041 | $13,619 | $11,783 |
|---|
'20 | $12,661 | $14,252 | $12,305 |
|---|
'21 | $12,401 | $14,100 | $12,209 |
|---|
'21 | $12,728 | $14,416 | $12,791 |
|---|
'21 | $13,252 | $14,748 | $13,221 |
|---|
'21 | $13,489 | $15,192 | $13,474 |
|---|
'21 | $14,106 | $15,687 | $13,940 |
|---|
'21 | $13,776 | $15,510 | $13,619 |
|---|
'21 | $13,752 | $15,627 | $13,586 |
|---|
'21 | $13,829 | $15,903 | $13,740 |
|---|
'21 | $13,204 | $15,441 | $13,488 |
|---|
'21 | $13,377 | $15,821 | $13,703 |
|---|
'21 | $12,927 | $15,085 | $12,878 |
|---|
'21 | $13,796 | $15,857 | $13,645 |
|---|
'22 | $13,578 | $15,091 | $13,788 |
|---|
'22 | $13,140 | $14,824 | $13,600 |
|---|
'22 | $13,101 | $14,919 | $13,691 |
|---|
'22 | $12,203 | $13,954 | $12,998 |
|---|
'22 | $12,624 | $14,059 | $13,318 |
|---|
'22 | $11,287 | $12,754 | $11,992 |
|---|
'22 | $11,648 | $13,390 | $12,242 |
|---|
'22 | $10,965 | $12,754 | $11,829 |
|---|
'22 | $9,975 | $11,561 | $10,768 |
|---|
'22 | $10,620 | $12,182 | $11,463 |
|---|
'22 | $12,125 | $13,555 | $12,723 |
|---|
'22 | $11,931 | $13,566 | $12,883 |
|---|
'23 | $12,992 | $14,664 | $13,878 |
|---|
'23 | $12,711 | $14,358 | $13,683 |
|---|
'23 | $13,055 | $14,714 | $13,648 |
|---|
'23 | $13,101 | $15,129 | $14,088 |
|---|
'23 | $12,489 | $14,489 | $13,329 |
|---|
'23 | $13,095 | $15,148 | $14,079 |
|---|
'23 | $13,615 | $15,639 | $14,719 |
|---|
'23 | $13,183 | $15,039 | $14,282 |
|---|
'23 | $12,813 | $14,526 | $14,161 |
|---|
'23 | $12,293 | $13,937 | $13,538 |
|---|
'23 | $13,274 | $15,230 | $14,611 |
|---|
'23 | $14,132 | $16,040 | $15,325 |
|---|
'24 | $13,988 | $16,132 | $15,315 |
|---|
'24 | $14,253 | $16,427 | $15,342 |
|---|
'24 | $14,690 | $16,968 | $16,012 |
|---|
'24 | $14,206 | $16,533 | $15,848 |
|---|
'24 | $14,911 | $17,173 | $16,472 |
|---|
'24 | $14,120 | $16,896 | $16,014 |
|---|
'24 | $14,693 | $17,392 | $16,764 |
|---|
'24 | $15,181 | $17,957 | $17,194 |
|---|
'24 | $15,196 | $18,123 | $17,438 |
|---|
'24 | $14,590 | $17,138 | $16,619 |
|---|
'24 | $14,543 | $17,040 | $16,491 |
|---|
'24 | $14,428 | $16,653 | $16,196 |
|---|
'25 | $15,147 | $17,528 | $17,022 |
|---|
'25 | $16,130 | $17,868 | $17,657 |
|---|
'25 | $16,378 | $17,796 | $18,069 |
|---|
'25 | $16,711 | $18,611 | $18,801 |
|---|
'25 | $17,222 | $19,463 | $19,556 |
|---|
'25 | $17,660 | $19,891 | $19,896 |
|---|
'25 | $17,606 | $19,612 | $19,947 |
|---|
'25 | $18,589 | $20,448 | $21,089 |
|---|
'25 | $19,018 | $20,840 | $21,366 |
|---|
'25 | $19,100 | $21,085 | $21,529 |
|---|
'25 | $20,113 | $21,216 | $22,114 |
|---|
'25 | $20,855 | $21,852 | $23,039 |
|---|
'26 | $22,197 | $22,992 | $24,351 |
|---|
'26 | $23,554 | $24,056 | $25,795 |
|---|
'26 | $21,589 | $21,581 | $23,499 |
|---|
'26 | $22,358 | $23,189 | $24,923 |
|---|
'26 | $22,928 | $23,900 | $25,436 |
|---|
'26 | $22,683 | $23,916 | $25,258 |
|---|
'26 | $23,963 | $24,384 | $26,709 |
|---|
'26 | $24,255 | $24,869 | $27,096 |
|---|
|
| Average Annual Return [Table Text Block] |
|
Table SummaryClass/Index
| 1-Year | 5-Year | 10-Year |
|---|
Class A Unadjusted for Sales Charge | 30.48% | 11.89% | 9.91% |
|---|
Class A Adjusted for the Maximum Sales Charge (max 5.75% load) | 22.98% | 10.57% | 9.26% |
|---|
MSCI EAFE Index | 21.62% | 9.35% | 9.54% |
|---|
MSCI EAFE® Value Index | 28.49% | 14.55% | 10.48% |
|---|
|
| No Deduction of Taxes [Text Block] |
|
The performance graph and returns table do not reflect the deduction of taxes that a shareholder would pay on Fund distributions or the redemption of Fund shares.
|
| Material Change Date |
Sep. 01, 2025
|
|
| AssetsNet |
|
$ 613,204,878
|
| Holdings Count | Holding |
|
85
|
| Advisory Fees Paid, Amount |
|
$ 3,166,022
|
| InvestmentCompanyPortfolioTurnover |
|
63.00%
|
| Additional Fund Statistics [Text Block] |
|
Table SummaryNet Assets ($) | 613,204,878 |
|---|
Number of Portfolio Holdings | 85 |
|---|
Portfolio Turnover Rate (%) | 63 |
|---|
Total Net Advisory Fees Paid ($) | 3,166,022 |
|---|
|
| Holdings [Text Block] |
|
Table SummarySector | % of Net Assets |
|---|
Financials | 24% |
|---|
Health Care | 16% |
|---|
Consumer Staples | 12% |
|---|
Industrials | 11% |
|---|
Materials | 10% |
|---|
Energy | 7% |
|---|
Information Technology | 5% |
|---|
Utilities | 4% |
|---|
Communication Services | 4% |
|---|
Consumer Discretionary | 4% |
|---|
Geographical DiversificationTable SummaryCountry | % of Net Assets |
|---|
Japan | 25% |
|---|
France | 19% |
|---|
United Kingdom | 17% |
|---|
Italy | 6% |
|---|
Australia | 5% |
|---|
Singapore | 5% |
|---|
Germany | 4% |
|---|
Spain | 4% |
|---|
Switzerland | 4% |
|---|
Hong Kong | 3% |
|---|
Other | 6% |
|---|
Ten Largest Equity HoldingsTable SummaryHoldings | 29.3% of Net Assets |
|---|
TotalEnergies SE (France) | 4.3% | Sanofi SA (France) | 3.8% | UniCredit SpA (Italy) | 3.3% | BHP Group Ltd. (Australia) | 2.9% | Credit Agricole SA (France) | 2.8% | BNP Paribas SA (France) | 2.6% | Central Japan Railway Co. (Japan) | 2.6% | Venture Corp. Ltd. (Singapore) | 2.4% | Ono Pharmaceutical Co., Ltd. (Japan) | 2.3% | Hong Kong & China Gas Co., Ltd. (Hong Kong) | 2.3% | |
| Material Fund Change [Text Block] |
|
This is a summary of certain changes of the Fund since September 1, 2025. For more information, review the Fund's current prospectus at dws.com/mutualreports, or call (800) 728-3337. Effective October 1, 2025, the Fund’s contractual cap on total annual operating expense for Class A shares changed from 1.20% to 1.13%. The cap excludes certain expenses such as extraordinary expenses, taxes, brokerage, interest expense and acquired fund fees and expenses. |
| Material Fund Change Expenses [Text Block] |
|
Effective October 1, 2025, the Fund’s contractual cap on total annual operating expense for Class A shares changed from 1.20% to 1.13%. The cap excludes certain expenses such as extraordinary expenses, taxes, brokerage, interest expense and acquired fund fees and expenses.
|
| Summary of Change Legend [Text Block] |
|
This is a summary of certain changes of the Fund since September 1, 2025. For more information, review the Fund's current prospectus at dws.com/mutualreports, or call (800) 728-3337.
|
| C000016571 |
|
|
| Shareholder Report [Line Items] |
|
|
| Fund Name |
|
DWS CROCI<sup style="inset: 1.5px 0px 4px; box-sizing: border-box; color: rgb(0, 0, 0); display: inline; flex-wrap: nowrap; font-size: 21px; font-weight: 400; grid-area: auto; line-height: 0px; margin: 0px; overflow: visible; position: relative; text-align: left; text-align-last: auto; white-space-collapse: preserve-breaks;">®</sup> International Fund
|
| Class Name |
|
Class C
|
| Trading Symbol |
|
SUICX
|
| Annual or Semi-Annual Statement [Text Block] |
|
This annual shareholder report contains important information about DWS CROCI® International Fund (the "Fund") for the period September 1, 2025 to August 31, 2026.
|
| Additional Information [Text Block] |
|
You can find additional information about the Fund on the Fund's website at dws.com/mutualreports. You can also request this information by contacting us at (800) 728-3337.
|
| Additional Information Phone Number |
|
(800) 728-3337
|
| Additional Information Website |
|
<span style="box-sizing: border-box; color: rgb(0, 0, 0); display: inline; flex-wrap: nowrap; font-size: 14.6667px; font-weight: 300; grid-area: auto; line-height: 17.6px; margin: 0px; overflow: visible; text-align: left; text-align-last: auto; white-space-collapse: preserve-breaks;">dws.com/mutualreports</span>
|
| Expenses [Text Block] |
|
What were the Fund costs for the last year?(Based on a hypothetical $10,000 investment) Table SummaryFund | Costs of a $10,000 investment | Costs paid as a percentage of a $10,000 investment |
|---|
Class C | $217 | 1.89% |
|---|
Gross expense ratio as of the latest prospectus: 2.03%. See prospectus for any contractual or voluntary waivers; without a waiver, costs would have been higher. |
| Expenses Paid, Amount |
|
$ 217
|
| Expense Ratio, Percent |
|
1.89%
|
| Factors Affecting Performance [Text Block] |
|
How did the Fund perform last year and what affected its performance? Class C shares of the Fund returned 29.51% (unadjusted for sales charges) for the period ended August 31, 2026. The Fund's broad-based index, the MSCI EAFE Index, returned 21.62% for the same period, while the Fund's additional, more narrowly based index, the MSCI EAFE® Value Index, returned 28.49%. Stock selection was the primary driver of the Fund’s outperformance relative to the MSCI EAFE Value Index. The Fund’s holdings outpaced the corresponding index components in seven of the ten sectors in which it held a position, with the best results occurring in materials. The French steel producer ArcelorMittal SA,* whose shares rallied on the strength of improving profit margins and robust global industrial demand, was the top contributor in the sector. Positions in several mining stocks that were propelled by rising commodity prices, including BHP Group Ltd. (2.9%) and Rio Tinto PLC (2.1%), further supported results. The Fund also outperformed in financials, led by Oversea-China Banking Ltd.* and several European banks. Health care was an additional area of strength. The Japanese company Ono Pharmaceutical Co., Ltd. (2.3%), which reported better-than-expected earnings, was the top contributor in the sector. Teva Pharmaceutical Industries Ltd. (0.3%) and Astellas Pharma, Inc. (1.9%) were additional contributors of note. Tenaris SA (1.4%), a manufacturer of steel pipes used by energy producers, was the leading contributor in the portfolio as a whole. The company reported robust earnings and received a number of analyst upgrades, boosting its shares. On the other hand, the Fund was hurt by weaker selection in industrials. While its holdings in the sector posted a strong, double-digit gain, poor returns for certain individual stocks weighed on relative performance. Most notably, Central Japan Railway Co. (2.6%) lagged due to declining passenger demand and construction delays on a new rail line. Selection in utilities and information technology also detracted somewhat, as did positions in the French pharmaceutical giant Sanofi SA (3.8%) and the British tobacco company Imperial Brands PLC (1.9%). Sector allocation had a neutral impact overall. While a zero weighting in real estate and an overweight in information technology contributed, an underweight in the strong-performing financials sector was a notable detractor. Percentages in parentheses are based on the Fund’s net assets as of August 31, 2026. * Not held at August 31, 2026. |
| Performance Past Does Not Indicate Future [Text] |
|
The Fund's past performance is not a good predictor or guarantee of the Fund's future performance.
|
| Line Graph [Table Text Block] |
|
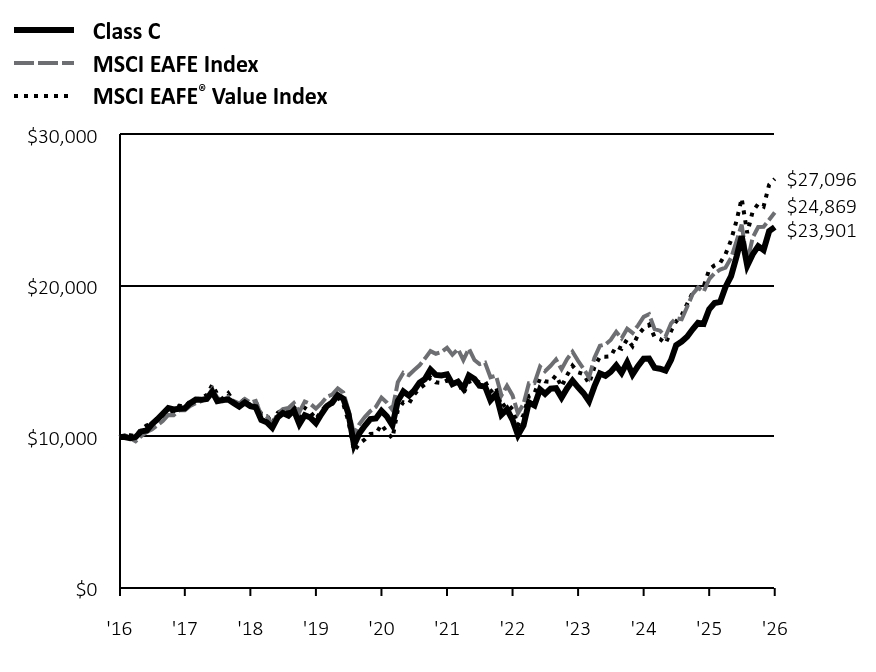 Table Summary | Class C | MSCI EAFE Index | MSCI EAFE® Value Index |
|---|
'16 | $10,000 | $10,000 | $10,000 |
|---|
'16 | $9,998 | $10,123 | $10,097 |
|---|
'16 | $9,920 | $9,916 | $10,120 |
|---|
'16 | $9,993 | $9,718 | $10,058 |
|---|
'16 | $10,369 | $10,051 | $10,518 |
|---|
'17 | $10,436 | $10,342 | $10,777 |
|---|
'17 | $10,844 | $10,490 | $10,851 |
|---|
'17 | $11,168 | $10,779 | $11,154 |
|---|
'17 | $11,539 | $11,053 | $11,388 |
|---|
'17 | $11,911 | $11,459 | $11,652 |
|---|
'17 | $11,825 | $11,439 | $11,687 |
|---|
'17 | $11,863 | $11,768 | $12,078 |
|---|
'17 | $11,901 | $11,764 | $12,003 |
|---|
'17 | $12,241 | $12,057 | $12,373 |
|---|
'17 | $12,473 | $12,240 | $12,469 |
|---|
'17 | $12,458 | $12,368 | $12,581 |
|---|
'17 | $12,519 | $12,567 | $12,773 |
|---|
'18 | $12,990 | $13,197 | $13,463 |
|---|
'18 | $12,376 | $12,601 | $12,823 |
|---|
'18 | $12,452 | $12,374 | $12,514 |
|---|
'18 | $12,480 | $12,657 | $12,900 |
|---|
'18 | $12,242 | $12,372 | $12,341 |
|---|
'18 | $12,006 | $12,221 | $12,184 |
|---|
'18 | $12,291 | $12,522 | $12,534 |
|---|
'18 | $12,047 | $12,280 | $12,078 |
|---|
'18 | $11,972 | $12,387 | $12,328 |
|---|
'18 | $11,128 | $11,401 | $11,509 |
|---|
'18 | $10,978 | $11,386 | $11,445 |
|---|
'18 | $10,608 | $10,834 | $10,886 |
|---|
'19 | $11,311 | $11,546 | $11,614 |
|---|
'19 | $11,580 | $11,840 | $11,808 |
|---|
'19 | $11,409 | $11,915 | $11,748 |
|---|
'19 | $11,774 | $12,250 | $12,021 |
|---|
'19 | $10,856 | $11,661 | $11,325 |
|---|
'19 | $11,439 | $12,353 | $11,929 |
|---|
'19 | $11,284 | $12,196 | $11,660 |
|---|
'19 | $10,914 | $11,880 | $11,181 |
|---|
'19 | $11,505 | $12,221 | $11,721 |
|---|
'19 | $12,045 | $12,660 | $12,144 |
|---|
'19 | $12,288 | $12,803 | $12,192 |
|---|
'19 | $12,762 | $13,219 | $12,637 |
|---|
'20 | $12,539 | $12,943 | $12,180 |
|---|
'20 | $11,525 | $11,773 | $11,028 |
|---|
'20 | $9,465 | $10,201 | $9,074 |
|---|
'20 | $10,253 | $10,860 | $9,559 |
|---|
'20 | $10,757 | $11,333 | $9,850 |
|---|
'20 | $11,190 | $11,719 | $10,201 |
|---|
'20 | $11,226 | $11,992 | $10,221 |
|---|
'20 | $11,732 | $12,609 | $10,820 |
|---|
'20 | $11,367 | $12,281 | $10,323 |
|---|
'20 | $10,776 | $11,791 | $9,907 |
|---|
'20 | $12,381 | $13,619 | $11,783 |
|---|
'20 | $13,013 | $14,252 | $12,305 |
|---|
'21 | $12,738 | $14,100 | $12,209 |
|---|
'21 | $13,065 | $14,416 | $12,791 |
|---|
'21 | $13,598 | $14,748 | $13,221 |
|---|
'21 | $13,831 | $15,192 | $13,474 |
|---|
'21 | $14,457 | $15,687 | $13,940 |
|---|
'21 | $14,109 | $15,510 | $13,619 |
|---|
'21 | $14,076 | $15,627 | $13,586 |
|---|
'21 | $14,147 | $15,903 | $13,740 |
|---|
'21 | $13,499 | $15,441 | $13,488 |
|---|
'21 | $13,666 | $15,821 | $13,703 |
|---|
'21 | $13,199 | $15,085 | $12,878 |
|---|
'21 | $14,077 | $15,857 | $13,645 |
|---|
'22 | $13,846 | $15,091 | $13,788 |
|---|
'22 | $13,394 | $14,824 | $13,600 |
|---|
'22 | $13,346 | $14,919 | $13,691 |
|---|
'22 | $12,422 | $13,954 | $12,998 |
|---|
'22 | $12,843 | $14,059 | $13,318 |
|---|
'22 | $11,475 | $12,754 | $11,992 |
|---|
'22 | $11,834 | $13,390 | $12,242 |
|---|
'22 | $11,134 | $12,754 | $11,829 |
|---|
'22 | $10,122 | $11,561 | $10,768 |
|---|
'22 | $10,772 | $12,182 | $11,463 |
|---|
'22 | $12,292 | $13,555 | $12,723 |
|---|
'22 | $12,085 | $13,566 | $12,883 |
|---|
'23 | $13,152 | $14,664 | $13,878 |
|---|
'23 | $12,857 | $14,358 | $13,683 |
|---|
'23 | $13,199 | $14,714 | $13,648 |
|---|
'23 | $13,236 | $15,129 | $14,088 |
|---|
'23 | $12,611 | $14,489 | $13,329 |
|---|
'23 | $13,213 | $15,148 | $14,079 |
|---|
'23 | $13,731 | $15,639 | $14,719 |
|---|
'23 | $13,285 | $15,039 | $14,282 |
|---|
'23 | $12,903 | $14,526 | $14,161 |
|---|
'23 | $12,371 | $13,937 | $13,538 |
|---|
'23 | $13,352 | $15,230 | $14,611 |
|---|
'23 | $14,207 | $16,040 | $15,325 |
|---|
'24 | $14,053 | $16,132 | $15,315 |
|---|
'24 | $14,311 | $16,427 | $15,342 |
|---|
'24 | $14,741 | $16,968 | $16,012 |
|---|
'24 | $14,246 | $16,533 | $15,848 |
|---|
'24 | $14,942 | $17,173 | $16,472 |
|---|
'24 | $14,142 | $16,896 | $16,014 |
|---|
'24 | $14,705 | $17,392 | $16,764 |
|---|
'24 | $15,186 | $17,957 | $17,194 |
|---|
'24 | $15,192 | $18,123 | $17,438 |
|---|
'24 | $14,578 | $17,138 | $16,619 |
|---|
'24 | $14,521 | $17,040 | $16,491 |
|---|
'24 | $14,398 | $16,653 | $16,196 |
|---|
'25 | $15,103 | $17,528 | $17,022 |
|---|
'25 | $16,075 | $17,868 | $17,657 |
|---|
'25 | $16,315 | $17,796 | $18,069 |
|---|
'25 | $16,633 | $18,611 | $18,801 |
|---|
'25 | $17,132 | $19,463 | $19,556 |
|---|
'25 | $17,556 | $19,891 | $19,896 |
|---|
'25 | $17,490 | $19,612 | $19,947 |
|---|
'25 | $18,456 | $20,448 | $21,089 |
|---|
'25 | $18,868 | $20,840 | $21,366 |
|---|
'25 | $18,940 | $21,085 | $21,529 |
|---|
'25 | $19,931 | $21,216 | $22,114 |
|---|
'25 | $20,654 | $21,852 | $23,039 |
|---|
'26 | $21,968 | $22,992 | $24,351 |
|---|
'26 | $23,298 | $24,056 | $25,795 |
|---|
'26 | $21,343 | $21,581 | $23,499 |
|---|
'26 | $22,088 | $23,189 | $24,923 |
|---|
'26 | $22,636 | $23,900 | $25,436 |
|---|
'26 | $22,379 | $23,916 | $25,258 |
|---|
'26 | $23,629 | $24,384 | $26,709 |
|---|
'26 | $23,901 | $24,869 | $27,096 |
|---|
|
| Average Annual Return [Table Text Block] |
|
Table SummaryClass/Index
| 1-Year | 5-Year | 10-Year |
|---|
Class C Unadjusted for Sales Charge | 29.51% | 11.06% | 9.10% |
|---|
Class C Adjusted for the Maximum Sales Charge (max 1.00% CDSC) | 28.51% | 11.06% | 9.10% |
|---|
MSCI EAFE Index | 21.62% | 9.35% | 9.54% |
|---|
MSCI EAFE® Value Index | 28.49% | 14.55% | 10.48% |
|---|
|
| No Deduction of Taxes [Text Block] |
|
The performance graph and returns table do not reflect the deduction of taxes that a shareholder would pay on Fund distributions or the redemption of Fund shares.
|
| Material Change Date |
Sep. 01, 2025
|
|
| AssetsNet |
|
$ 613,204,878
|
| Holdings Count | Holding |
|
85
|
| Advisory Fees Paid, Amount |
|
$ 3,166,022
|
| InvestmentCompanyPortfolioTurnover |
|
63.00%
|
| Additional Fund Statistics [Text Block] |
|
Table SummaryNet Assets ($) | 613,204,878 |
|---|
Number of Portfolio Holdings | 85 |
|---|
Portfolio Turnover Rate (%) | 63 |
|---|
Total Net Advisory Fees Paid ($) | 3,166,022 |
|---|
|
| Holdings [Text Block] |
|
Table SummarySector | % of Net Assets |
|---|
Financials | 24% |
|---|
Health Care | 16% |
|---|
Consumer Staples | 12% |
|---|
Industrials | 11% |
|---|
Materials | 10% |
|---|
Energy | 7% |
|---|
Information Technology | 5% |
|---|
Utilities | 4% |
|---|
Communication Services | 4% |
|---|
Consumer Discretionary | 4% |
|---|
Geographical DiversificationTable SummaryCountry | % of Net Assets |
|---|
Japan | 25% |
|---|
France | 19% |
|---|
United Kingdom | 17% |
|---|
Italy | 6% |
|---|
Australia | 5% |
|---|
Singapore | 5% |
|---|
Germany | 4% |
|---|
Spain | 4% |
|---|
Switzerland | 4% |
|---|
Hong Kong | 3% |
|---|
Other | 6% |
|---|
Ten Largest Equity HoldingsTable SummaryHoldings | 29.3% of Net Assets |
|---|
TotalEnergies SE (France) | 4.3% | Sanofi SA (France) | 3.8% | UniCredit SpA (Italy) | 3.3% | BHP Group Ltd. (Australia) | 2.9% | Credit Agricole SA (France) | 2.8% | BNP Paribas SA (France) | 2.6% | Central Japan Railway Co. (Japan) | 2.6% | Venture Corp. Ltd. (Singapore) | 2.4% | Ono Pharmaceutical Co., Ltd. (Japan) | 2.3% | Hong Kong & China Gas Co., Ltd. (Hong Kong) | 2.3% | |
| Material Fund Change [Text Block] |
|
This is a summary of certain changes of the Fund since September 1, 2025. For more information, review the Fund's current prospectus at dws.com/mutualreports, or call (800) 728-3337. Effective October 1, 2025, the Fund’s contractual cap on total annual operating expense for Class C shares changed from 1.95% to 1.88%. The cap excludes certain expenses such as extraordinary expenses, taxes, brokerage, interest expense and acquired fund fees and expenses. |
| Material Fund Change Expenses [Text Block] |
|
Effective October 1, 2025, the Fund’s contractual cap on total annual operating expense for Class C shares changed from 1.95% to 1.88%. The cap excludes certain expenses such as extraordinary expenses, taxes, brokerage, interest expense and acquired fund fees and expenses.
|
| Summary of Change Legend [Text Block] |
|
This is a summary of certain changes of the Fund since September 1, 2025. For more information, review the Fund's current prospectus at dws.com/mutualreports, or call (800) 728-3337.
|
| C000149477 |
|
|
| Shareholder Report [Line Items] |
|
|
| Fund Name |
|
DWS CROCI<sup style="inset: 1.5px 0px 4px; box-sizing: border-box; color: rgb(0, 0, 0); display: inline; flex-wrap: nowrap; font-size: 21px; font-weight: 400; grid-area: auto; line-height: 0px; margin: 0px; overflow: visible; position: relative; text-align: left; text-align-last: auto; white-space-collapse: preserve-breaks;">®</sup> International Fund
|
| Class Name |
|
Class R6
|
| Trading Symbol |
|
SUIRX
|
| Annual or Semi-Annual Statement [Text Block] |
|
This annual shareholder report contains important information about DWS CROCI® International Fund (the "Fund") for the period September 1, 2025 to August 31, 2026.
|
| Additional Information [Text Block] |
|
You can find additional information about the Fund on the Fund's website at dws.com/mutualreports. You can also request this information by contacting us at (800) 728-3337.
|
| Additional Information Phone Number |
|
(800) 728-3337
|
| Additional Information Website |
|
<span style="box-sizing: border-box; color: rgb(0, 0, 0); display: inline; flex-wrap: nowrap; font-size: 14.6667px; font-weight: 300; grid-area: auto; line-height: 17.6px; margin: 0px; overflow: visible; text-align: left; text-align-last: auto; white-space-collapse: preserve-breaks;">dws.com/mutualreports</span>
|
| Expenses [Text Block] |
|
What were the Fund costs for the last year?(Based on a hypothetical $10,000 investment) Table SummaryFund | Costs of a $10,000 investment | Costs paid as a percentage of a $10,000 investment |
|---|
Class R6 | $87 | 0.75% |
|---|
Gross expense ratio as of the latest prospectus: 0.79%. See prospectus for any contractual or voluntary waivers; without a waiver, costs would have been higher. |
| Expenses Paid, Amount |
|
$ 87
|
| Expense Ratio, Percent |
|
0.75%
|
| Factors Affecting Performance [Text Block] |
|
How did the Fund perform last year and what affected its performance? Class R6 shares of the Fund returned 30.99% for the period ended August 31, 2026. The Fund's broad-based index, the MSCI EAFE Index, returned 21.62% for the same period, while the Fund's additional, more narrowly based index, the MSCI EAFE® Value Index, returned 28.49%. Stock selection was the primary driver of the Fund’s outperformance relative to the MSCI EAFE Value Index. The Fund’s holdings outpaced the corresponding index components in seven of the ten sectors in which it held a position, with the best results occurring in materials. The French steel producer ArcelorMittal SA,* whose shares rallied on the strength of improving profit margins and robust global industrial demand, was the top contributor in the sector. Positions in several mining stocks that were propelled by rising commodity prices, including BHP Group Ltd. (2.9%) and Rio Tinto PLC (2.1%), further supported results. The Fund also outperformed in financials, led by Oversea-China Banking Ltd.* and several European banks. Health care was an additional area of strength. The Japanese company Ono Pharmaceutical Co., Ltd. (2.3%), which reported better-than-expected earnings, was the top contributor in the sector. Teva Pharmaceutical Industries Ltd. (0.3%) and Astellas Pharma, Inc. (1.9%) were additional contributors of note. Tenaris SA (1.4%), a manufacturer of steel pipes used by energy producers, was the leading contributor in the portfolio as a whole. The company reported robust earnings and received a number of analyst upgrades, boosting its shares. On the other hand, the Fund was hurt by weaker selection in industrials. While its holdings in the sector posted a strong, double-digit gain, poor returns for certain individual stocks weighed on relative performance. Most notably, Central Japan Railway Co. (2.6%) lagged due to declining passenger demand and construction delays on a new rail line. Selection in utilities and information technology also detracted somewhat, as did positions in the French pharmaceutical giant Sanofi SA (3.8%) and the British tobacco company Imperial Brands PLC (1.9%). Sector allocation had a neutral impact overall. While a zero weighting in real estate and an overweight in information technology contributed, an underweight in the strong-performing financials sector was a notable detractor. Percentages in parentheses are based on the Fund’s net assets as of August 31, 2026. * Not held at August 31, 2026. |
| Performance Past Does Not Indicate Future [Text] |
|
The Fund's past performance is not a good predictor or guarantee of the Fund's future performance.
|
| Line Graph [Table Text Block] |
|
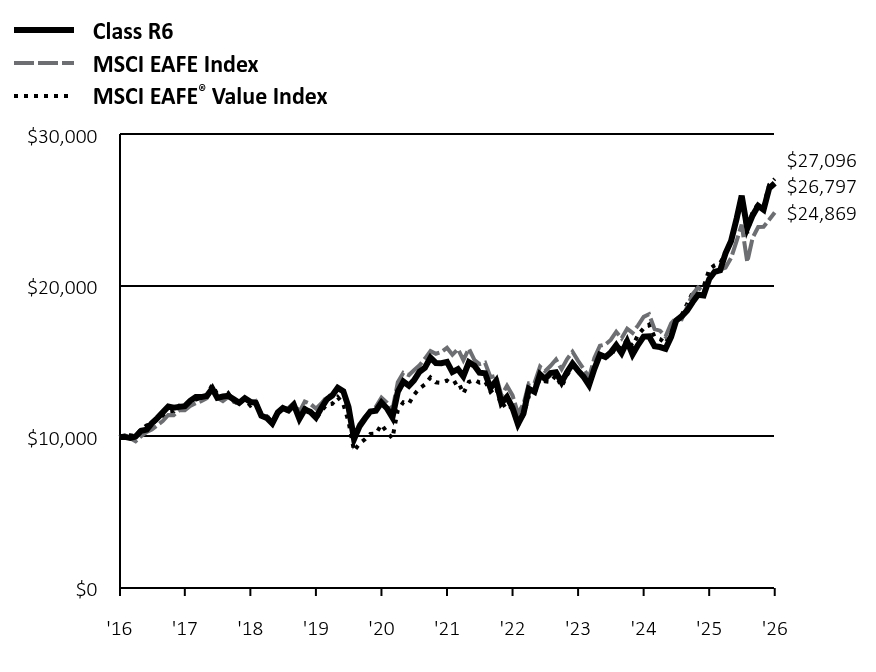 Table Summary | Class R6 | MSCI EAFE Index | MSCI EAFE® Value Index |
|---|
'16 | $10,000 | $10,000 | $10,000 |
|---|
'16 | $10,005 | $10,123 | $10,097 |
|---|
'16 | $9,938 | $9,916 | $10,120 |
|---|
'16 | $10,022 | $9,718 | $10,058 |
|---|
'16 | $10,409 | $10,051 | $10,518 |
|---|
'17 | $10,486 | $10,342 | $10,777 |
|---|
'17 | $10,908 | $10,490 | $10,851 |
|---|
'17 | $11,246 | $10,779 | $11,154 |
|---|
'17 | $11,630 | $11,053 | $11,388 |
|---|
'17 | $12,018 | $11,459 | $11,652 |
|---|
'17 | $11,942 | $11,439 | $11,687 |
|---|
'17 | $11,993 | $11,768 | $12,078 |
|---|
'17 | $12,041 | $11,764 | $12,003 |
|---|
'17 | $12,397 | $12,057 | $12,373 |
|---|
'17 | $12,645 | $12,240 | $12,469 |
|---|
'17 | $12,640 | $12,368 | $12,581 |
|---|
'17 | $12,717 | $12,567 | $12,773 |
|---|
'18 | $13,208 | $13,197 | $13,463 |
|---|
'18 | $12,593 | $12,601 | $12,823 |
|---|
'18 | $12,683 | $12,374 | $12,514 |
|---|
'18 | $12,722 | $12,657 | $12,900 |
|---|
'18 | $12,488 | $12,372 | $12,341 |
|---|
'18 | $12,262 | $12,221 | $12,184 |
|---|
'18 | $12,564 | $12,522 | $12,534 |
|---|
'18 | $12,325 | $12,280 | $12,078 |
|---|
'18 | $12,260 | $12,387 | $12,328 |
|---|
'18 | $11,409 | $11,401 | $11,509 |
|---|
'18 | $11,267 | $11,386 | $11,445 |
|---|
'18 | $10,899 | $10,834 | $10,886 |
|---|
'19 | $11,628 | $11,546 | $11,614 |
|---|
'19 | $11,914 | $11,840 | $11,808 |
|---|
'19 | $11,753 | $11,915 | $11,748 |
|---|
'19 | $12,138 | $12,250 | $12,021 |
|---|
'19 | $11,202 | $11,661 | $11,325 |
|---|
'19 | $11,813 | $12,353 | $11,929 |
|---|
'19 | $11,663 | $12,196 | $11,660 |
|---|
'19 | $11,292 | $11,880 | $11,181 |
|---|
'19 | $11,914 | $12,221 | $11,721 |
|---|
'19 | $12,485 | $12,660 | $12,144 |
|---|
'19 | $12,747 | $12,803 | $12,192 |
|---|
'19 | $13,254 | $13,219 | $12,637 |
|---|
'20 | $13,034 | $12,943 | $12,180 |
|---|
'20 | $11,993 | $11,773 | $11,028 |
|---|
'20 | $9,858 | $10,201 | $9,074 |
|---|
'20 | $10,690 | $10,860 | $9,559 |
|---|
'20 | $11,227 | $11,333 | $9,850 |
|---|
'20 | $11,688 | $11,719 | $10,201 |
|---|
'20 | $11,736 | $11,992 | $10,221 |
|---|
'20 | $12,276 | $12,609 | $10,820 |
|---|
'20 | $11,903 | $12,281 | $10,323 |
|---|
'20 | $11,295 | $11,791 | $9,907 |
|---|
'20 | $12,991 | $13,619 | $11,783 |
|---|
'20 | $13,667 | $14,252 | $12,305 |
|---|
'21 | $13,391 | $14,100 | $12,209 |
|---|
'21 | $13,748 | $14,416 | $12,791 |
|---|
'21 | $14,322 | $14,748 | $13,221 |
|---|
'21 | $14,582 | $15,192 | $13,474 |
|---|
'21 | $15,253 | $15,687 | $13,940 |
|---|
'21 | $14,902 | $15,510 | $13,619 |
|---|
'21 | $14,881 | $15,627 | $13,586 |
|---|
'21 | $14,971 | $15,903 | $13,740 |
|---|
'21 | $14,299 | $15,441 | $13,488 |
|---|
'21 | $14,492 | $15,821 | $13,703 |
|---|
'21 | $14,008 | $15,085 | $12,878 |
|---|
'21 | $14,957 | $15,857 | $13,645 |
|---|
'22 | $14,723 | $15,091 | $13,788 |
|---|
'22 | $14,255 | $14,824 | $13,600 |
|---|
'22 | $14,216 | $14,919 | $13,691 |
|---|
'22 | $13,246 | $13,954 | $12,998 |
|---|
'22 | $13,711 | $14,059 | $13,318 |
|---|
'22 | $12,262 | $12,754 | $11,992 |
|---|
'22 | $12,658 | $13,390 | $12,242 |
|---|
'22 | $11,920 | $12,754 | $11,829 |
|---|
'22 | $10,849 | $11,561 | $10,768 |
|---|
'22 | $11,554 | $12,182 | $11,463 |
|---|
'22 | $13,195 | $13,555 | $12,723 |
|---|
'22 | $12,988 | $13,566 | $12,883 |
|---|
'23 | $14,151 | $14,664 | $13,878 |
|---|
'23 | $13,846 | $14,358 | $13,683 |
|---|
'23 | $14,229 | $14,714 | $13,648 |
|---|
'23 | $14,282 | $15,129 | $14,088 |
|---|
'23 | $13,619 | $14,489 | $13,329 |
|---|
'23 | $14,285 | $15,148 | $14,079 |
|---|
'23 | $14,857 | $15,639 | $14,719 |
|---|
'23 | $14,391 | $15,039 | $14,282 |
|---|
'23 | $13,993 | $14,526 | $14,161 |
|---|
'23 | $13,430 | $13,937 | $13,538 |
|---|
'23 | $14,509 | $15,230 | $14,611 |
|---|
'23 | $15,452 | $16,040 | $15,325 |
|---|
'24 | $15,300 | $16,132 | $15,315 |
|---|
'24 | $15,590 | $16,427 | $15,342 |
|---|
'24 | $16,078 | $16,968 | $16,012 |
|---|
'24 | $15,555 | $16,533 | $15,848 |
|---|
'24 | $16,329 | $17,173 | $16,472 |
|---|
'24 | $15,468 | $16,896 | $16,014 |
|---|
'24 | $16,103 | $17,392 | $16,764 |
|---|
'24 | $16,645 | $17,957 | $17,194 |
|---|
'24 | $16,665 | $18,123 | $17,438 |
|---|
'24 | $16,007 | $17,138 | $16,619 |
|---|
'24 | $15,955 | $17,040 | $16,491 |
|---|
'24 | $15,834 | $16,653 | $16,196 |
|---|
'25 | $16,628 | $17,528 | $17,022 |
|---|
'25 | $17,712 | $17,868 | $17,657 |
|---|
'25 | $17,995 | $17,796 | $18,069 |
|---|
'25 | $18,365 | $18,611 | $18,801 |
|---|
'25 | $18,932 | $19,463 | $19,556 |
|---|
'25 | $19,422 | $19,891 | $19,896 |
|---|
'25 | $19,369 | $19,612 | $19,947 |
|---|
'25 | $20,456 | $20,448 | $21,089 |
|---|
'25 | $20,937 | $20,840 | $21,366 |
|---|
'25 | $21,033 | $21,085 | $21,529 |
|---|
'25 | $22,157 | $21,216 | $22,114 |
|---|
'25 | $22,981 | $21,852 | $23,039 |
|---|
'26 | $24,467 | $22,992 | $24,351 |
|---|
'26 | $25,974 | $24,056 | $25,795 |
|---|
'26 | $23,814 | $21,581 | $23,499 |
|---|
'26 | $24,671 | $23,189 | $24,923 |
|---|
'26 | $25,307 | $23,900 | $25,436 |
|---|
'26 | $25,044 | $23,916 | $25,258 |
|---|
'26 | $26,468 | $24,384 | $26,709 |
|---|
'26 | $26,797 | $24,869 | $27,096 |
|---|
|
| Average Annual Return [Table Text Block] |
|
Table SummaryClass/Index
| 1-Year | 5-Year | 10-Year |
|---|
Class R6 No Sales Charge | 30.99% | 12.35% | 10.36% |
|---|
MSCI EAFE Index | 21.62% | 9.35% | 9.54% |
|---|
MSCI EAFE® Value Index | 28.49% | 14.55% | 10.48% |
|---|
|
| No Deduction of Taxes [Text Block] |
|
The performance graph and returns table do not reflect the deduction of taxes that a shareholder would pay on Fund distributions or the redemption of Fund shares.
|
| Material Change Date |
Sep. 01, 2025
|
|
| AssetsNet |
|
$ 613,204,878
|
| Holdings Count | Holding |
|
85
|
| Advisory Fees Paid, Amount |
|
$ 3,166,022
|
| InvestmentCompanyPortfolioTurnover |
|
63.00%
|
| Additional Fund Statistics [Text Block] |
|
Table SummaryNet Assets ($) | 613,204,878 |
|---|
Number of Portfolio Holdings | 85 |
|---|
Portfolio Turnover Rate (%) | 63 |
|---|
Total Net Advisory Fees Paid ($) | 3,166,022 |
|---|
|
| Holdings [Text Block] |
|
Table SummarySector | % of Net Assets |
|---|
Financials | 24% |
|---|
Health Care | 16% |
|---|
Consumer Staples | 12% |
|---|
Industrials | 11% |
|---|
Materials | 10% |
|---|
Energy | 7% |
|---|
Information Technology | 5% |
|---|
Utilities | 4% |
|---|
Communication Services | 4% |
|---|
Consumer Discretionary | 4% |
|---|
Geographical DiversificationTable SummaryCountry | % of Net Assets |
|---|
Japan | 25% |
|---|
France | 19% |
|---|
United Kingdom | 17% |
|---|
Italy | 6% |
|---|
Australia | 5% |
|---|
Singapore | 5% |
|---|
Germany | 4% |
|---|
Spain | 4% |
|---|
Switzerland | 4% |
|---|
Hong Kong | 3% |
|---|
Other | 6% |
|---|
Ten Largest Equity HoldingsTable SummaryHoldings | 29.3% of Net Assets |
|---|
TotalEnergies SE (France) | 4.3% | Sanofi SA (France) | 3.8% | UniCredit SpA (Italy) | 3.3% | BHP Group Ltd. (Australia) | 2.9% | Credit Agricole SA (France) | 2.8% | BNP Paribas SA (France) | 2.6% | Central Japan Railway Co. (Japan) | 2.6% | Venture Corp. Ltd. (Singapore) | 2.4% | Ono Pharmaceutical Co., Ltd. (Japan) | 2.3% | Hong Kong & China Gas Co., Ltd. (Hong Kong) | 2.3% | |
| Material Fund Change [Text Block] |
|
This is a summary of certain changes of the Fund since September 1, 2025. For more information, review the Fund's current prospectus at dws.com/mutualreports, or call (800) 728-3337. Effective October 1, 2025, the Fund’s contractual cap on total annual operating expense for Class R6 shares changed from 0.95% to 0.88%. The cap excludes certain expenses such as extraordinary expenses, taxes, brokerage, interest expense and acquired fund fees and expenses. |
| Material Fund Change Expenses [Text Block] |
|
Effective October 1, 2025, the Fund’s contractual cap on total annual operating expense for Class R6 shares changed from 0.95% to 0.88%. The cap excludes certain expenses such as extraordinary expenses, taxes, brokerage, interest expense and acquired fund fees and expenses.
|
| Summary of Change Legend [Text Block] |
|
This is a summary of certain changes of the Fund since September 1, 2025. For more information, review the Fund's current prospectus at dws.com/mutualreports, or call (800) 728-3337.
|
| C000016572 |
|
|
| Shareholder Report [Line Items] |
|
|
| Fund Name |
|
DWS CROCI<sup style="inset: 1.5px 0px 4px; box-sizing: border-box; color: rgb(0, 0, 0); display: inline; flex-wrap: nowrap; font-size: 21px; font-weight: 400; grid-area: auto; line-height: 0px; margin: 0px; overflow: visible; position: relative; text-align: left; text-align-last: auto; white-space-collapse: preserve-breaks;">®</sup> International Fund
|
| Class Name |
|
Class S
|
| Trading Symbol |
|
SCINX
|
| Annual or Semi-Annual Statement [Text Block] |
|
This annual shareholder report contains important information about DWS CROCI® International Fund (the "Fund") for the period September 1, 2025 to August 31, 2026.
|
| Additional Information [Text Block] |
|
You can find additional information about the Fund on the Fund's website at dws.com/mutualreports. You can also request this information by contacting us at (800) 728-3337.
|
| Additional Information Phone Number |
|
(800) 728-3337
|
| Additional Information Website |
|
<span style="box-sizing: border-box; color: rgb(0, 0, 0); display: inline; flex-wrap: nowrap; font-size: 14.6667px; font-weight: 300; grid-area: auto; line-height: 17.6px; margin: 0px; overflow: visible; text-align: left; text-align-last: auto; white-space-collapse: preserve-breaks;">dws.com/mutualreports</span>
|
| Expenses [Text Block] |
|
What were the Fund costs for the last year?(Based on a hypothetical $10,000 investment) Table SummaryFund | Costs of a $10,000 investment | Costs paid as a percentage of a $10,000 investment |
|---|
Class S | $102 | 0.88% |
|---|
Gross expense ratio as of the latest prospectus: 0.91%. See prospectus for any contractual or voluntary waivers; without a waiver, costs would have been higher. |
| Expenses Paid, Amount |
|
$ 102
|
| Expense Ratio, Percent |
|
0.88%
|
| Factors Affecting Performance [Text Block] |
|
How did the Fund perform last year and what affected its performance? Class S shares of the Fund returned 30.82% for the period ended August 31, 2026. The Fund's broad-based index, the MSCI EAFE Index, returned 21.62% for the same period, while the Fund's additional, more narrowly based index, the MSCI EAFE® Value Index, returned 28.49%. Stock selection was the primary driver of the Fund’s outperformance relative to the MSCI EAFE Value Index. The Fund’s holdings outpaced the corresponding index components in seven of the ten sectors in which it held a position, with the best results occurring in materials. The French steel producer ArcelorMittal SA,* whose shares rallied on the strength of improving profit margins and robust global industrial demand, was the top contributor in the sector. Positions in several mining stocks that were propelled by rising commodity prices, including BHP Group Ltd. (2.9%) and Rio Tinto PLC (2.1%), further supported results. The Fund also outperformed in financials, led by Oversea-China Banking Ltd.* and several European banks. Health care was an additional area of strength. The Japanese company Ono Pharmaceutical Co., Ltd. (2.3%), which reported better-than-expected earnings, was the top contributor in the sector. Teva Pharmaceutical Industries Ltd. (0.3%) and Astellas Pharma, Inc. (1.9%) were additional contributors of note. Tenaris SA (1.4%), a manufacturer of steel pipes used by energy producers, was the leading contributor in the portfolio as a whole. The company reported robust earnings and received a number of analyst upgrades, boosting its shares. On the other hand, the Fund was hurt by weaker selection in industrials. While its holdings in the sector posted a strong, double-digit gain, poor returns for certain individual stocks weighed on relative performance. Most notably, Central Japan Railway Co. (2.6%) lagged due to declining passenger demand and construction delays on a new rail line. Selection in utilities and information technology also detracted somewhat, as did positions in the French pharmaceutical giant Sanofi SA (3.8%) and the British tobacco company Imperial Brands PLC (1.9%). Sector allocation had a neutral impact overall. While a zero weighting in real estate and an overweight in information technology contributed, an underweight in the strong-performing financials sector was a notable detractor. Percentages in parentheses are based on the Fund’s net assets as of August 31, 2026. * Not held at August 31, 2026. |
| Performance Past Does Not Indicate Future [Text] |
|
The Fund's past performance is not a good predictor or guarantee of the Fund's future performance.
|
| Line Graph [Table Text Block] |
|
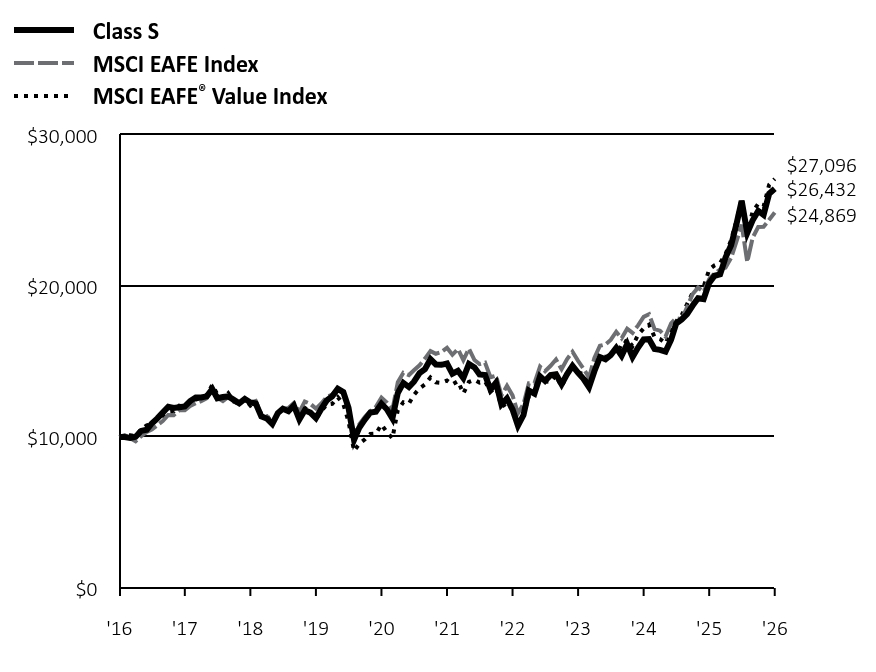 Table Summary | Class S | MSCI EAFE Index | MSCI EAFE® Value Index |
|---|
'16 | $10,000 | $10,000 | $10,000 |
|---|
'16 | $10,002 | $10,123 | $10,097 |
|---|
'16 | $9,934 | $9,916 | $10,120 |
|---|
'16 | $10,015 | $9,718 | $10,058 |
|---|
'16 | $10,401 | $10,051 | $10,518 |
|---|
'17 | $10,477 | $10,342 | $10,777 |
|---|
'17 | $10,896 | $10,490 | $10,851 |
|---|
'17 | $11,231 | $10,779 | $11,154 |
|---|
'17 | $11,615 | $11,053 | $11,388 |
|---|
'17 | $12,003 | $11,459 | $11,652 |
|---|
'17 | $11,924 | $11,439 | $11,687 |
|---|
'17 | $11,973 | $11,768 | $12,078 |
|---|
'17 | $12,021 | $11,764 | $12,003 |
|---|
'17 | $12,374 | $12,057 | $12,373 |
|---|
'17 | $12,620 | $12,240 | $12,469 |
|---|
'17 | $12,615 | $12,368 | $12,581 |
|---|
'17 | $12,689 | $12,567 | $12,773 |
|---|
'18 | $13,176 | $13,197 | $13,463 |
|---|
'18 | $12,564 | $12,601 | $12,823 |
|---|
'18 | $12,650 | $12,374 | $12,514 |
|---|
'18 | $12,686 | $12,657 | $12,900 |
|---|
'18 | $12,455 | $12,372 | $12,341 |
|---|
'18 | $12,226 | $12,221 | $12,184 |
|---|
'18 | $12,525 | $12,522 | $12,534 |
|---|
'18 | $12,286 | $12,280 | $12,078 |
|---|
'18 | $12,220 | $12,387 | $12,328 |
|---|
'18 | $11,367 | $11,401 | $11,509 |
|---|
'18 | $11,226 | $11,386 | $11,445 |
|---|
'18 | $10,859 | $10,834 | $10,886 |
|---|
'19 | $11,585 | $11,546 | $11,614 |
|---|
'19 | $11,869 | $11,840 | $11,808 |
|---|
'19 | $11,704 | $11,915 | $11,748 |
|---|
'19 | $12,088 | $12,250 | $12,021 |
|---|
'19 | $11,156 | $11,661 | $11,325 |
|---|
'19 | $11,764 | $12,353 | $11,929 |
|---|
'19 | $11,612 | $12,196 | $11,660 |
|---|
'19 | $11,242 | $11,880 | $11,181 |
|---|
'19 | $11,858 | $12,221 | $11,721 |
|---|
'19 | $12,426 | $12,660 | $12,144 |
|---|
'19 | $12,688 | $12,803 | $12,192 |
|---|
'19 | $13,188 | $13,219 | $12,637 |
|---|
'20 | $12,970 | $12,943 | $12,180 |
|---|
'20 | $11,931 | $11,773 | $11,028 |
|---|
'20 | $9,805 | $10,201 | $9,074 |
|---|
'20 | $10,632 | $10,860 | $9,559 |
|---|
'20 | $11,163 | $11,333 | $9,850 |
|---|
'20 | $11,621 | $11,719 | $10,201 |
|---|
'20 | $11,668 | $11,992 | $10,221 |
|---|
'20 | $12,205 | $12,609 | $10,820 |
|---|
'20 | $11,833 | $12,281 | $10,323 |
|---|
'20 | $11,227 | $11,791 | $9,907 |
|---|
'20 | $12,912 | $13,619 | $11,783 |
|---|
'20 | $13,582 | $14,252 | $12,305 |
|---|
'21 | $13,306 | $14,100 | $12,209 |
|---|
'21 | $13,659 | $14,416 | $12,791 |
|---|
'21 | $14,228 | $14,748 | $13,221 |
|---|
'21 | $14,484 | $15,192 | $13,474 |
|---|
'21 | $15,150 | $15,687 | $13,940 |
|---|
'21 | $14,800 | $15,510 | $13,619 |
|---|
'21 | $14,777 | $15,627 | $13,586 |
|---|
'21 | $14,865 | $15,903 | $13,740 |
|---|
'21 | $14,194 | $15,441 | $13,488 |
|---|
'21 | $14,384 | $15,821 | $13,703 |
|---|
'21 | $13,903 | $15,085 | $12,878 |
|---|
'21 | $14,842 | $15,857 | $13,645 |
|---|
'22 | $14,609 | $15,091 | $13,788 |
|---|
'22 | $14,142 | $14,824 | $13,600 |
|---|
'22 | $14,103 | $14,919 | $13,691 |
|---|
'22 | $13,139 | $13,954 | $12,998 |
|---|
'22 | $13,598 | $14,059 | $13,318 |
|---|
'22 | $12,158 | $12,754 | $11,992 |
|---|
'22 | $12,548 | $13,390 | $12,242 |
|---|
'22 | $11,818 | $12,754 | $11,829 |
|---|
'22 | $10,753 | $11,561 | $10,768 |
|---|
'22 | $11,451 | $12,182 | $11,463 |
|---|
'22 | $13,077 | $13,555 | $12,723 |
|---|
'22 | $12,872 | $13,566 | $12,883 |
|---|
'23 | $14,020 | $14,664 | $13,878 |
|---|
'23 | $13,717 | $14,358 | $13,683 |
|---|
'23 | $14,093 | $14,714 | $13,648 |
|---|
'23 | $14,145 | $15,129 | $14,088 |
|---|
'23 | $13,487 | $14,489 | $13,329 |
|---|
'23 | $14,145 | $15,148 | $14,079 |
|---|
'23 | $14,711 | $15,639 | $14,719 |
|---|
'23 | $14,246 | $15,039 | $14,282 |
|---|
'23 | $13,852 | $14,526 | $14,161 |
|---|
'23 | $13,292 | $13,937 | $13,538 |
|---|
'23 | $14,356 | $15,230 | $14,611 |
|---|
'23 | $15,291 | $16,040 | $15,325 |
|---|
'24 | $15,138 | $16,132 | $15,315 |
|---|
'24 | $15,424 | $16,427 | $15,342 |
|---|
'24 | $15,902 | $16,968 | $16,012 |
|---|
'24 | $15,383 | $16,533 | $15,848 |
|---|
'24 | $16,150 | $17,173 | $16,472 |
|---|
'24 | $15,297 | $16,896 | $16,014 |
|---|
'24 | $15,921 | $17,392 | $16,764 |
|---|
'24 | $16,454 | $17,957 | $17,194 |
|---|
'24 | $16,476 | $18,123 | $17,438 |
|---|
'24 | $15,823 | $17,138 | $16,619 |
|---|
'24 | $15,772 | $17,040 | $16,491 |
|---|
'24 | $15,651 | $16,653 | $16,196 |
|---|
'25 | $16,436 | $17,528 | $17,022 |
|---|
'25 | $17,506 | $17,868 | $17,657 |
|---|
'25 | $17,781 | $17,796 | $18,069 |
|---|
'25 | $18,144 | $18,611 | $18,801 |
|---|
'25 | $18,703 | $19,463 | $19,556 |
|---|
'25 | $19,187 | $19,891 | $19,896 |
|---|
'25 | $19,132 | $19,612 | $19,947 |
|---|
'25 | $20,205 | $20,448 | $21,089 |
|---|
'25 | $20,676 | $20,840 | $21,366 |
|---|
'25 | $20,771 | $21,085 | $21,529 |
|---|
'25 | $21,877 | $21,216 | $22,114 |
|---|
'25 | $22,688 | $21,852 | $23,039 |
|---|
'26 | $24,153 | $22,992 | $24,351 |
|---|
'26 | $25,636 | $24,056 | $25,795 |
|---|
'26 | $23,505 | $21,581 | $23,499 |
|---|
'26 | $24,345 | $23,189 | $24,923 |
|---|
'26 | $24,973 | $23,900 | $25,436 |
|---|
'26 | $24,708 | $23,916 | $25,258 |
|---|
'26 | $26,109 | $24,384 | $26,709 |
|---|
'26 | $26,432 | $24,869 | $27,096 |
|---|
|
| Average Annual Return [Table Text Block] |
|
Table SummaryClass/Index
| 1-Year | 5-Year | 10-Year |
|---|
Class S No Sales Charge | 30.82% | 12.20% | 10.21% |
|---|
MSCI EAFE Index | 21.62% | 9.35% | 9.54% |
|---|
MSCI EAFE® Value Index | 28.49% | 14.55% | 10.48% |
|---|
|
| No Deduction of Taxes [Text Block] |
|
The performance graph and returns table do not reflect the deduction of taxes that a shareholder would pay on Fund distributions or the redemption of Fund shares.
|
| Material Change Date |
Sep. 01, 2025
|
|
| AssetsNet |
|
$ 613,204,878
|
| Holdings Count | Holding |
|
85
|
| Advisory Fees Paid, Amount |
|
$ 3,166,022
|
| InvestmentCompanyPortfolioTurnover |
|
63.00%
|
| Additional Fund Statistics [Text Block] |
|
Table SummaryNet Assets ($) | 613,204,878 |
|---|
Number of Portfolio Holdings | 85 |
|---|
Portfolio Turnover Rate (%) | 63 |
|---|
Total Net Advisory Fees Paid ($) | 3,166,022 |
|---|
|
| Holdings [Text Block] |
|
Table SummarySector | % of Net Assets |
|---|
Financials | 24% |
|---|
Health Care | 16% |
|---|
Consumer Staples | 12% |
|---|
Industrials | 11% |
|---|
Materials | 10% |
|---|
Energy | 7% |
|---|
Information Technology | 5% |
|---|
Utilities | 4% |
|---|
Communication Services | 4% |
|---|
Consumer Discretionary | 4% |
|---|
Geographical DiversificationTable SummaryCountry | % of Net Assets |
|---|
Japan | 25% |
|---|
France | 19% |
|---|
United Kingdom | 17% |
|---|
Italy | 6% |
|---|
Australia | 5% |
|---|
Singapore | 5% |
|---|
Germany | 4% |
|---|
Spain | 4% |
|---|
Switzerland | 4% |
|---|
Hong Kong | 3% |
|---|
Other | 6% |
|---|
Ten Largest Equity HoldingsTable SummaryHoldings | 29.3% of Net Assets |
|---|
TotalEnergies SE (France) | 4.3% | Sanofi SA (France) | 3.8% | UniCredit SpA (Italy) | 3.3% | BHP Group Ltd. (Australia) | 2.9% | Credit Agricole SA (France) | 2.8% | BNP Paribas SA (France) | 2.6% | Central Japan Railway Co. (Japan) | 2.6% | Venture Corp. Ltd. (Singapore) | 2.4% | Ono Pharmaceutical Co., Ltd. (Japan) | 2.3% | Hong Kong & China Gas Co., Ltd. (Hong Kong) | 2.3% | |
| Material Fund Change [Text Block] |
|
This is a summary of certain changes of the Fund since September 1, 2025. For more information, review the Fund's current prospectus at dws.com/mutualreports, or call (800) 728-3337. Effective October 1, 2025, the Fund’s contractual cap on total annual operating expense for Class S shares changed from 0.95% to 0.88%. The cap excludes certain expenses such as extraordinary expenses, taxes, brokerage, interest expense and acquired fund fees and expenses. |
| Material Fund Change Expenses [Text Block] |
|
Effective October 1, 2025, the Fund’s contractual cap on total annual operating expense for Class S shares changed from 0.95% to 0.88%. The cap excludes certain expenses such as extraordinary expenses, taxes, brokerage, interest expense and acquired fund fees and expenses.
|
| Summary of Change Legend [Text Block] |
|
This is a summary of certain changes of the Fund since September 1, 2025. For more information, review the Fund's current prospectus at dws.com/mutualreports, or call (800) 728-3337.
|
| C000016573 |
|
|
| Shareholder Report [Line Items] |
|
|
| Fund Name |
|
DWS CROCI<sup style="inset: 1.5px 0px 4px; box-sizing: border-box; color: rgb(0, 0, 0); display: inline; flex-wrap: nowrap; font-size: 21px; font-weight: 400; grid-area: auto; line-height: 0px; margin: 0px; overflow: visible; position: relative; text-align: left; text-align-last: auto; white-space-collapse: preserve-breaks;">®</sup> International Fund
|
| Class Name |
|
Institutional Class
|
| Trading Symbol |
|
SUIIX
|
| Annual or Semi-Annual Statement [Text Block] |
|
This annual shareholder report contains important information about DWS CROCI® International Fund (the "Fund") for the period September 1, 2025 to August 31, 2026.
|
| Additional Information [Text Block] |
|
You can find additional information about the Fund on the Fund's website at dws.com/mutualreports. You can also request this information by contacting us at (800) 728-3337.
|
| Additional Information Phone Number |
|
(800) 728-3337
|
| Additional Information Website |
|
<span style="box-sizing: border-box; color: rgb(0, 0, 0); display: inline; flex-wrap: nowrap; font-size: 14.6667px; font-weight: 300; grid-area: auto; line-height: 17.6px; margin: 0px; overflow: visible; text-align: left; text-align-last: auto; white-space-collapse: preserve-breaks;">dws.com/mutualreports</span>
|
| Expenses [Text Block] |
|
What were the Fund costs for the last year?(Based on a hypothetical $10,000 investment) Table SummaryFund | Costs of a $10,000 investment | Costs paid as a percentage of a $10,000 investment |
|---|
Institutional Class | $99 | 0.86% |
|---|
Gross expense ratio as of the latest prospectus: 0.88%. See prospectus for any contractual or voluntary waivers; without a waiver, costs would have been higher. |
| Expenses Paid, Amount |
|
$ 99
|
| Expense Ratio, Percent |
|
0.86%
|
| Factors Affecting Performance [Text Block] |
|
How did the Fund perform last year and what affected its performance? Institutional Class shares of the Fund returned 30.82% for the period ended August 31, 2026. The Fund's broad-based index, the MSCI EAFE Index, returned 21.62% for the same period, while the Fund's additional, more narrowly based index, the MSCI EAFE® Value Index, returned 28.49%. Stock selection was the primary driver of the Fund’s outperformance relative to the MSCI EAFE Value Index. The Fund’s holdings outpaced the corresponding index components in seven of the ten sectors in which it held a position, with the best results occurring in materials. The French steel producer ArcelorMittal SA,* whose shares rallied on the strength of improving profit margins and robust global industrial demand, was the top contributor in the sector. Positions in several mining stocks that were propelled by rising commodity prices, including BHP Group Ltd. (2.9%) and Rio Tinto PLC (2.1%), further supported results. The Fund also outperformed in financials, led by Oversea-China Banking Ltd.* and several European banks. Health care was an additional area of strength. The Japanese company Ono Pharmaceutical Co., Ltd. (2.3%), which reported better-than-expected earnings, was the top contributor in the sector. Teva Pharmaceutical Industries Ltd. (0.3%) and Astellas Pharma, Inc. (1.9%) were additional contributors of note. Tenaris SA (1.4%), a manufacturer of steel pipes used by energy producers, was the leading contributor in the portfolio as a whole. The company reported robust earnings and received a number of analyst upgrades, boosting its shares. On the other hand, the Fund was hurt by weaker selection in industrials. While its holdings in the sector posted a strong, double-digit gain, poor returns for certain individual stocks weighed on relative performance. Most notably, Central Japan Railway Co. (2.6%) lagged due to declining passenger demand and construction delays on a new rail line. Selection in utilities and information technology also detracted somewhat, as did positions in the French pharmaceutical giant Sanofi SA (3.8%) and the British tobacco company Imperial Brands PLC (1.9%). Sector allocation had a neutral impact overall. While a zero weighting in real estate and an overweight in information technology contributed, an underweight in the strong-performing financials sector was a notable detractor. Percentages in parentheses are based on the Fund’s net assets as of August 31, 2026. * Not held at August 31, 2026. |
| Performance Past Does Not Indicate Future [Text] |
|
The Fund's past performance is not a good predictor or guarantee of the Fund's future performance.
|
| Line Graph [Table Text Block] |
|
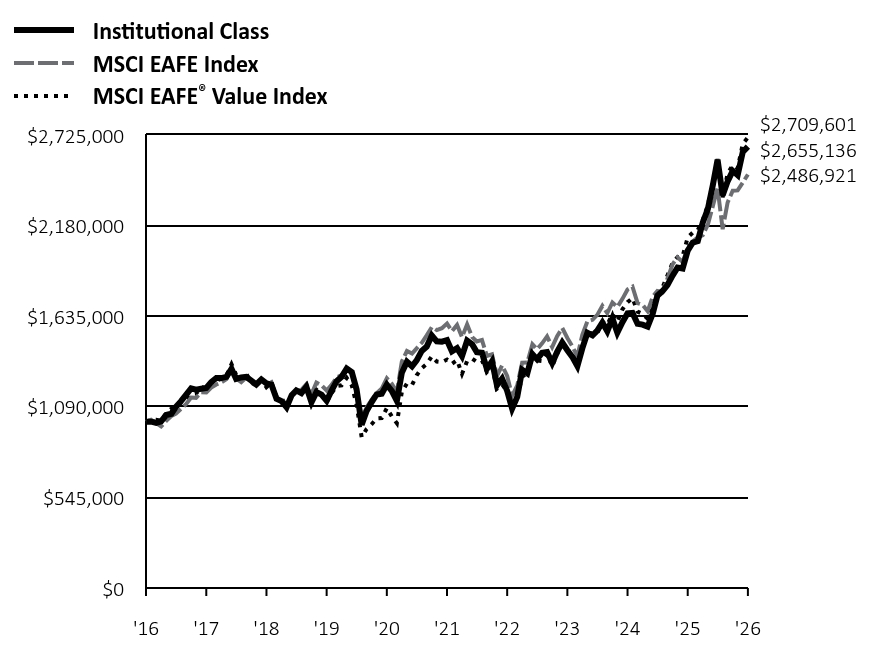 Table Summary | Institutional Class | MSCI EAFE Index | MSCI EAFE® Value Index |
|---|
'16 | $1,000,000 | $1,000,000 | $1,000,000 |
|---|
'16 | $1,000,492 | $1,012,284 | $1,009,667 |
|---|
'16 | $993,610 | $991,578 | $1,012,024 |
|---|
'16 | $1,001,966 | $971,830 | $1,005,777 |
|---|
'16 | $1,040,290 | $1,005,061 | $1,051,819 |
|---|
'17 | $1,047,946 | $1,034,216 | $1,077,718 |
|---|
'17 | $1,090,058 | $1,049,005 | $1,085,086 |
|---|
'17 | $1,123,748 | $1,077,883 | $1,115,434 |
|---|
'17 | $1,162,031 | $1,105,310 | $1,138,836 |
|---|
'17 | $1,200,825 | $1,145,879 | $1,165,210 |
|---|
'17 | $1,193,168 | $1,143,852 | $1,168,730 |
|---|
'17 | $1,198,273 | $1,176,847 | $1,207,823 |
|---|
'17 | $1,202,867 | $1,176,404 | $1,200,287 |
|---|
'17 | $1,238,343 | $1,205,674 | $1,237,305 |
|---|
'17 | $1,263,100 | $1,223,982 | $1,246,888 |
|---|
'17 | $1,262,589 | $1,236,821 | $1,258,064 |
|---|
'17 | $1,270,022 | $1,256,673 | $1,277,349 |
|---|
'18 | $1,318,979 | $1,319,707 | $1,346,319 |
|---|
'18 | $1,257,717 | $1,260,141 | $1,282,342 |
|---|
'18 | $1,266,356 | $1,237,429 | $1,251,446 |
|---|
'18 | $1,270,022 | $1,265,683 | $1,289,999 |
|---|
'18 | $1,246,721 | $1,237,233 | $1,234,089 |
|---|
'18 | $1,223,944 | $1,222,117 | $1,218,440 |
|---|
'18 | $1,254,051 | $1,252,200 | $1,253,418 |
|---|
'18 | $1,230,227 | $1,228,017 | $1,207,827 |
|---|
'18 | $1,223,682 | $1,238,675 | $1,232,797 |
|---|
'18 | $1,138,333 | $1,140,086 | $1,150,944 |
|---|
'18 | $1,124,196 | $1,138,649 | $1,144,540 |
|---|
'18 | $1,087,340 | $1,083,375 | $1,088,581 |
|---|
'19 | $1,160,210 | $1,154,575 | $1,161,439 |
|---|
'19 | $1,188,760 | $1,184,007 | $1,180,754 |
|---|
'19 | $1,172,446 | $1,191,473 | $1,174,750 |
|---|
'19 | $1,210,784 | $1,224,972 | $1,202,120 |
|---|
'19 | $1,117,521 | $1,166,142 | $1,132,534 |
|---|
'19 | $1,178,156 | $1,235,324 | $1,192,873 |
|---|
'19 | $1,162,929 | $1,219,639 | $1,166,046 |
|---|
'19 | $1,125,679 | $1,188,043 | $1,118,145 |
|---|
'19 | $1,187,401 | $1,222,088 | $1,172,102 |
|---|
'19 | $1,244,228 | $1,265,997 | $1,214,389 |
|---|
'19 | $1,270,331 | $1,280,269 | $1,219,194 |
|---|
'19 | $1,320,480 | $1,321,877 | $1,263,715 |
|---|
'20 | $1,298,542 | $1,294,266 | $1,218,019 |
|---|
'20 | $1,194,479 | $1,177,267 | $1,102,752 |
|---|
'20 | $981,852 | $1,020,139 | $907,373 |
|---|
'20 | $1,064,821 | $1,086,043 | $955,939 |
|---|
'20 | $1,118,259 | $1,133,335 | $985,017 |
|---|
'20 | $1,164,103 | $1,171,925 | $1,020,138 |
|---|
'20 | $1,168,885 | $1,199,241 | $1,022,118 |
|---|
'20 | $1,223,166 | $1,260,895 | $1,081,952 |
|---|
'20 | $1,186,041 | $1,228,133 | $1,032,270 |
|---|
'20 | $1,125,291 | $1,179,095 | $990,702 |
|---|
'20 | $1,294,042 | $1,361,871 | $1,178,315 |
|---|
'20 | $1,361,363 | $1,425,193 | $1,230,510 |
|---|
'21 | $1,333,569 | $1,410,009 | $1,220,916 |
|---|
'21 | $1,369,100 | $1,441,635 | $1,279,079 |
|---|
'21 | $1,426,122 | $1,474,783 | $1,322,122 |
|---|
'21 | $1,452,197 | $1,519,159 | $1,347,366 |
|---|
'21 | $1,518,962 | $1,568,700 | $1,394,028 |
|---|
'21 | $1,483,717 | $1,551,046 | $1,361,914 |
|---|
'21 | $1,481,711 | $1,562,725 | $1,358,589 |
|---|
'21 | $1,490,594 | $1,590,290 | $1,373,977 |
|---|
'21 | $1,423,543 | $1,544,138 | $1,348,758 |
|---|
'21 | $1,442,455 | $1,582,117 | $1,370,267 |
|---|
'21 | $1,394,316 | $1,508,479 | $1,287,825 |
|---|
'21 | $1,488,401 | $1,585,719 | $1,364,531 |
|---|
'22 | $1,465,457 | $1,509,091 | $1,378,751 |
|---|
'22 | $1,418,376 | $1,482,408 | $1,360,011 |
|---|
'22 | $1,414,502 | $1,491,936 | $1,369,084 |
|---|
'22 | $1,317,957 | $1,395,416 | $1,299,819 |
|---|
'22 | $1,363,846 | $1,405,877 | $1,331,817 |
|---|
'22 | $1,219,625 | $1,275,429 | $1,199,208 |
|---|
'22 | $1,258,958 | $1,338,984 | $1,224,184 |
|---|
'22 | $1,185,357 | $1,275,389 | $1,182,878 |
|---|
'22 | $1,078,681 | $1,156,080 | $1,076,829 |
|---|
'22 | $1,149,004 | $1,218,248 | $1,146,284 |
|---|
'22 | $1,311,998 | $1,355,466 | $1,272,275 |
|---|
'22 | $1,291,234 | $1,356,555 | $1,288,347 |
|---|
'23 | $1,406,600 | $1,466,405 | $1,387,794 |
|---|
'23 | $1,376,370 | $1,435,806 | $1,368,347 |
|---|
'23 | $1,414,311 | $1,471,391 | $1,364,806 |
|---|
'23 | $1,419,555 | $1,512,933 | $1,408,785 |
|---|
'23 | $1,353,544 | $1,448,909 | $1,332,920 |
|---|
'23 | $1,419,864 | $1,514,848 | $1,407,857 |
|---|
'23 | $1,476,621 | $1,563,863 | $1,471,875 |
|---|
'23 | $1,430,043 | $1,503,948 | $1,428,236 |
|---|
'23 | $1,390,251 | $1,452,577 | $1,416,118 |
|---|
'23 | $1,334,110 | $1,393,687 | $1,353,833 |
|---|
'23 | $1,441,148 | $1,523,046 | $1,461,119 |
|---|
'23 | $1,534,768 | $1,603,964 | $1,532,494 |
|---|
'24 | $1,519,740 | $1,613,195 | $1,531,464 |
|---|
'24 | $1,548,517 | $1,642,724 | $1,534,248 |
|---|
'24 | $1,596,798 | $1,696,753 | $1,601,161 |
|---|
'24 | $1,544,360 | $1,653,301 | $1,584,786 |
|---|
'24 | $1,621,418 | $1,717,342 | $1,647,228 |
|---|
'24 | $1,535,727 | $1,689,618 | $1,601,371 |
|---|
'24 | $1,598,717 | $1,739,186 | $1,676,440 |
|---|
'24 | $1,652,434 | $1,795,738 | $1,719,355 |
|---|
'24 | $1,654,672 | $1,812,321 | $1,743,756 |
|---|
'24 | $1,589,124 | $1,713,765 | $1,661,854 |
|---|
'24 | $1,584,008 | $1,704,042 | $1,649,054 |
|---|
'24 | $1,571,993 | $1,665,289 | $1,619,596 |
|---|
'25 | $1,650,576 | $1,752,803 | $1,702,223 |
|---|
'25 | $1,758,215 | $1,786,796 | $1,765,701 |
|---|
'25 | $1,785,950 | $1,779,587 | $1,806,868 |
|---|
'25 | $1,822,270 | $1,861,102 | $1,880,147 |
|---|
'25 | $1,878,731 | $1,946,253 | $1,955,613 |
|---|
'25 | $1,927,268 | $1,989,136 | $1,989,591 |
|---|
'25 | $1,921,655 | $1,961,215 | $1,994,703 |
|---|
'25 | $2,029,624 | $2,044,826 | $2,108,872 |
|---|
'25 | $2,076,840 | $2,083,961 | $2,136,612 |
|---|
'25 | $2,086,415 | $2,108,476 | $2,152,852 |
|---|
'25 | $2,197,686 | $2,121,568 | $2,211,401 |
|---|
'25 | $2,279,079 | $2,185,213 | $2,303,853 |
|---|
'26 | $2,426,379 | $2,299,247 | $2,435,130 |
|---|
'26 | $2,575,716 | $2,405,627 | $2,579,457 |
|---|
'26 | $2,361,554 | $2,158,088 | $2,349,861 |
|---|
'26 | $2,446,064 | $2,318,873 | $2,492,290 |
|---|
'26 | $2,509,193 | $2,389,991 | $2,543,640 |
|---|
'26 | $2,482,720 | $2,391,593 | $2,525,790 |
|---|
'26 | $2,623,232 | $2,438,399 | $2,670,948 |
|---|
'26 | $2,655,136 | $2,486,921 | $2,709,601 |
|---|
|
| Average Annual Return [Table Text Block] |
|
Table SummaryClass/Index
| 1-Year | 5-Year | 10-Year |
|---|
Institutional Class No Sales Charge | 30.82% | 12.24% | 10.26% |
|---|
MSCI EAFE Index | 21.62% | 9.35% | 9.54% |
|---|
MSCI EAFE® Value Index | 28.49% | 14.55% | 10.48% |
|---|
|
| No Deduction of Taxes [Text Block] |
|
The performance graph and returns table do not reflect the deduction of taxes that a shareholder would pay on Fund distributions or the redemption of Fund shares.
|
| Material Change Date |
Sep. 01, 2025
|
|
| AssetsNet |
|
$ 613,204,878
|
| Holdings Count | Holding |
|
85
|
| Advisory Fees Paid, Amount |
|
$ 3,166,022
|
| InvestmentCompanyPortfolioTurnover |
|
63.00%
|
| Additional Fund Statistics [Text Block] |
|
Table SummaryNet Assets ($) | 613,204,878 |
|---|
Number of Portfolio Holdings | 85 |
|---|
Portfolio Turnover Rate (%) | 63 |
|---|
Total Net Advisory Fees Paid ($) | 3,166,022 |
|---|
|
| Holdings [Text Block] |
|
Table SummarySector | % of Net Assets |
|---|
Financials | 24% |
|---|
Health Care | 16% |
|---|
Consumer Staples | 12% |
|---|
Industrials | 11% |
|---|
Materials | 10% |
|---|
Energy | 7% |
|---|
Information Technology | 5% |
|---|
Utilities | 4% |
|---|
Communication Services | 4% |
|---|
Consumer Discretionary | 4% |
|---|
Geographical DiversificationTable SummaryCountry | % of Net Assets |
|---|
Japan | 25% |
|---|
France | 19% |
|---|
United Kingdom | 17% |
|---|
Italy | 6% |
|---|
Australia | 5% |
|---|
Singapore | 5% |
|---|
Germany | 4% |
|---|
Spain | 4% |
|---|
Switzerland | 4% |
|---|
Hong Kong | 3% |
|---|
Other | 6% |
|---|
Ten Largest Equity HoldingsTable SummaryHoldings | 29.3% of Net Assets |
|---|
TotalEnergies SE (France) | 4.3% | Sanofi SA (France) | 3.8% | UniCredit SpA (Italy) | 3.3% | BHP Group Ltd. (Australia) | 2.9% | Credit Agricole SA (France) | 2.8% | BNP Paribas SA (France) | 2.6% | Central Japan Railway Co. (Japan) | 2.6% | Venture Corp. Ltd. (Singapore) | 2.4% | Ono Pharmaceutical Co., Ltd. (Japan) | 2.3% | Hong Kong & China Gas Co., Ltd. (Hong Kong) | 2.3% | |
| Material Fund Change [Text Block] |
|
This is a summary of certain changes of the Fund since September 1, 2025. For more information, review the Fund's current prospectus at dws.com/mutualreports, or call (800) 728-3337. Effective October 1, 2025, the Fund’s contractual cap on total annual operating expense for Institutional Class shares changed from 0.95% to 0.88%. The cap excludes certain expenses such as extraordinary expenses, taxes, brokerage, interest expense and acquired fund fees and expenses. |
| Material Fund Change Expenses [Text Block] |
|
Effective October 1, 2025, the Fund’s contractual cap on total annual operating expense for Institutional Class shares changed from 0.95% to 0.88%. The cap excludes certain expenses such as extraordinary expenses, taxes, brokerage, interest expense and acquired fund fees and expenses.
|
| Summary of Change Legend [Text Block] |
|
This is a summary of certain changes of the Fund since September 1, 2025. For more information, review the Fund's current prospectus at dws.com/mutualreports, or call (800) 728-3337.
|