Investor Update Q3 2026 © 2026 Kite Realty Group | kiterealty.com
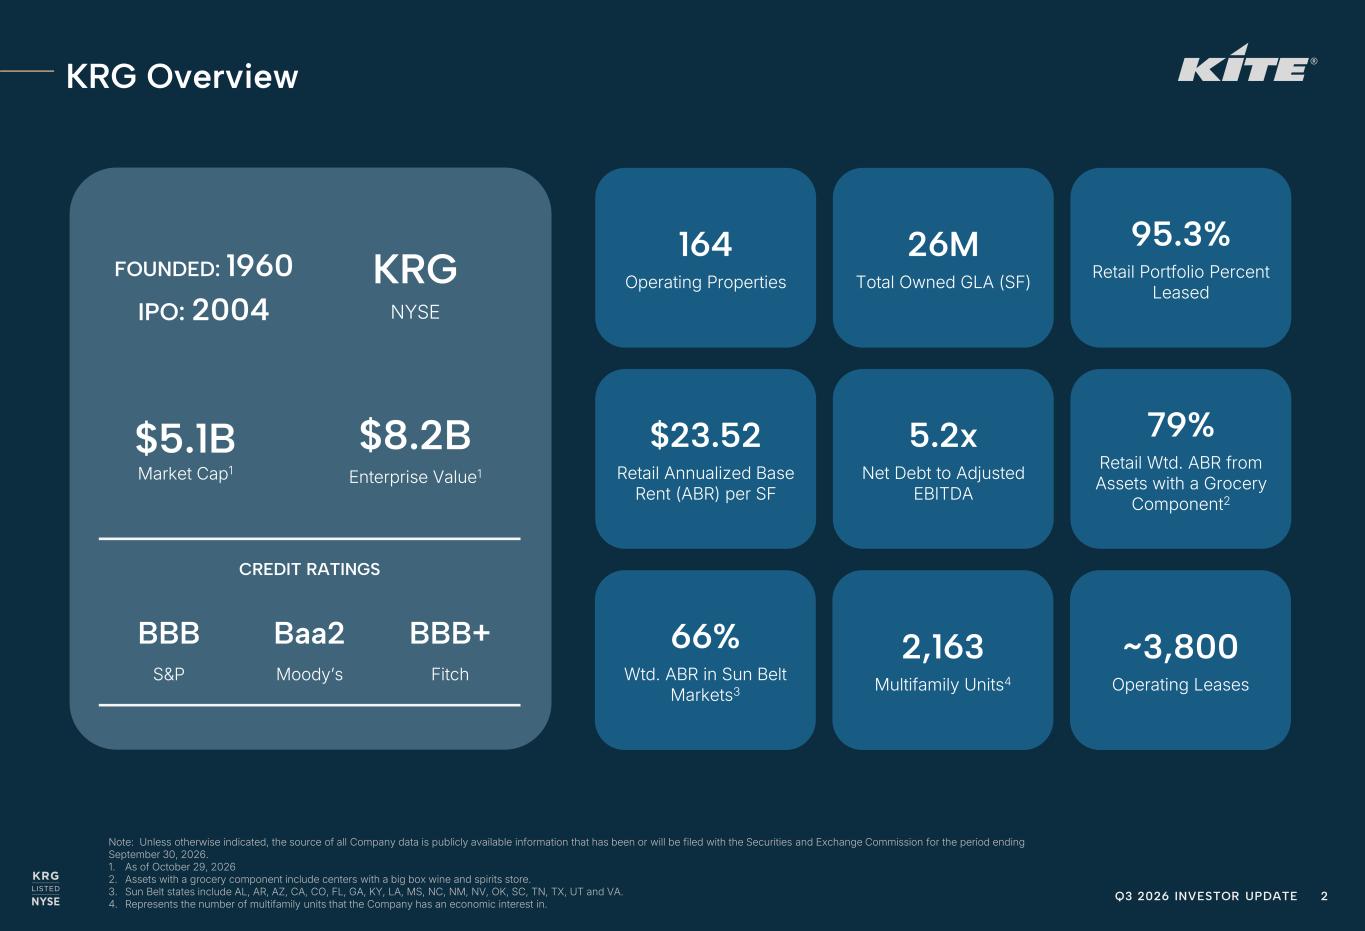
Q3 2026 INVESTOR UPDATE 2 Note: Unless otherwise indicated, the source of all Company data is publicly available information that has been or will be filed with the Securities and Exchange Commission for the period ending September 30, 2026. 1. As of October 29, 2026 2. Assets with a grocery component include centers with a big box wine and spirits store. 3. Sun Belt states include AL, AR, AZ, CA, CO, FL, GA, KY, LA, MS, NC, NM, NV, OK, SC, TN, TX, UT and VA. 4. Represents the number of multifamily units that the Company has an economic interest in. FOUNDED: 1960 IPO: 2004 KRG NYSE $5.1B Market Cap1 $8.2B Enterprise Value1 CREDIT RATINGS BBB Baa2 BBB+ S&P Moody’s Fitch KRG Overview 164 Operating Properties 26M Total Owned GLA (SF) 95.3% Retail Portfolio Percent Leased $23.52 Retail Annualized Base Rent (ABR) per SF 5.2x Net Debt to Adjusted EBITDA 79% Retail Wtd. ABR from Assets with a Grocery Component2 66% Wtd. ABR in Sun Belt Markets3 2,163 Multifamily Units4 ~3,800 Operating Leases
Q3 2026 INVESTOR UPDATE 3 KRG’s Strategic Advantages Best-in-Class Operating Platform Operating margins and metrics are among the best in the open-air retail sector Management team has deep experience operating open-air real estate High-Quality Sun Belt Portfolio Primarily concentrated in Sun Belt markets with select strategic gateway market presence Predominantly focused on grocery- anchored centers along with vibrant mixed-use and lifestyle assets Flexible and Durable Balance Sheet Low leverage with manageable near- term maturities Investment-grade balance sheet highlighted by recent upgrade by Fitch to BBB+ from BBB, along with a BBB rating from S&P and a Baa2 rating from Moody’s Approximately $1.1B of available liquidity and minimal near-term capital commitments
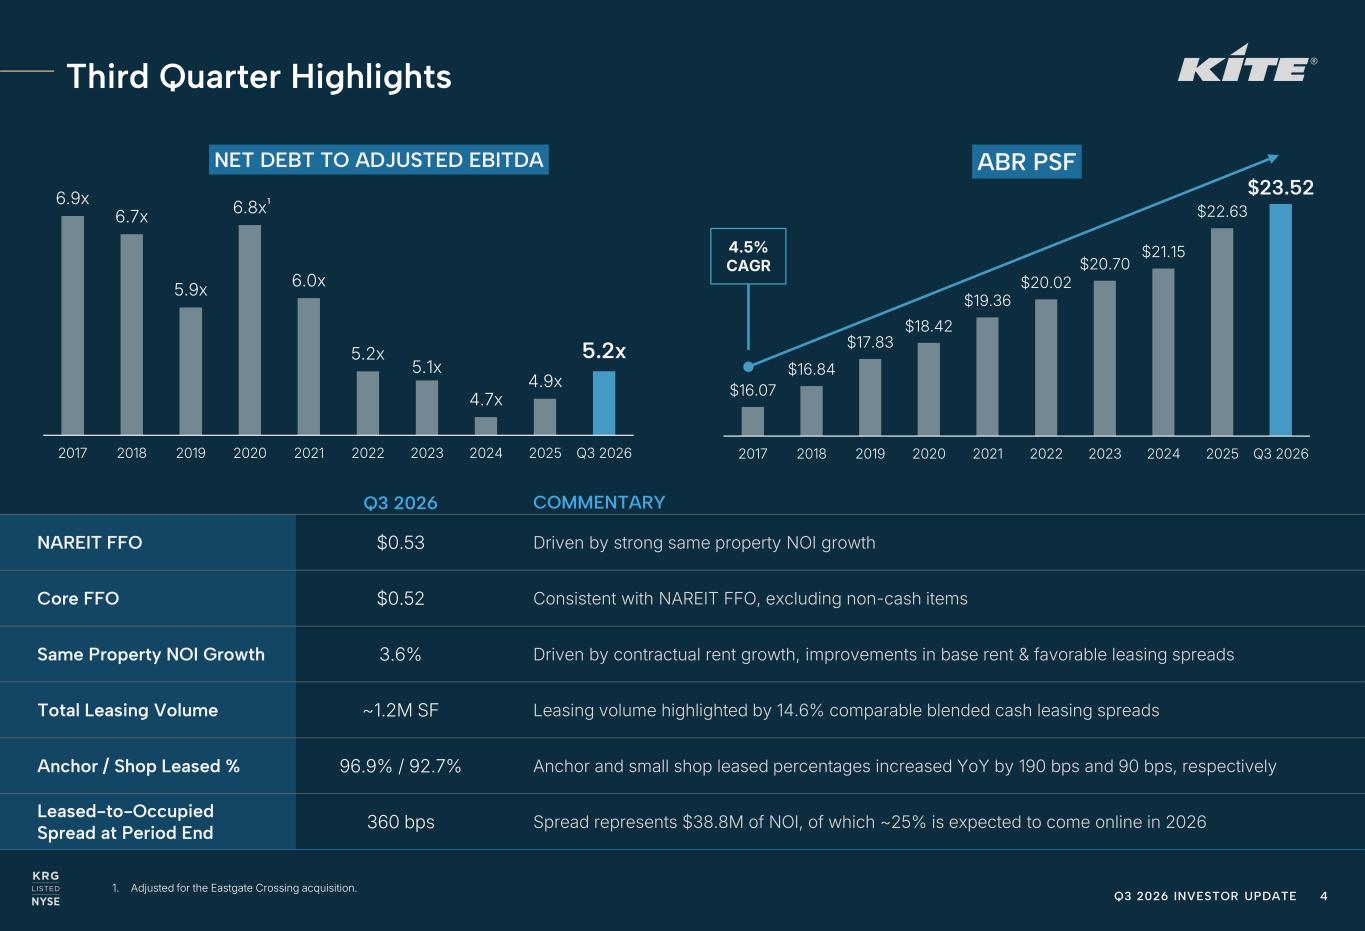
Q3 2026 INVESTOR UPDATE 4 Q3 2026 COMMENTARY NAREIT FFO $0.53 Driven by strong same property NOI growth Core FFO $0.52 Consistent with NAREIT FFO, excluding non-cash items Same Property NOI Growth 3.6% Driven by contractual rent growth, improvements in base rent & favorable leasing spreads Total Leasing Volume ~1.2M SF Leasing volume highlighted by 14.6% comparable blended cash leasing spreads Anchor / Shop Leased % 96.9% / 92.7% Anchor and small shop leased percentages increased YoY by 190 bps and 90 bps, respectively Leased-to-Occupied Spread at Period End 360 bps Spread represents $38.8M of NOI, of which ~25% is expected to come online in 2026 $16.07 $16.84 $17.83 $18.42 $19.36 $20.02 $20.70 $21.15 $22.63 $23.52 2017 2018 2019 2020 2021 2022 2023 2024 2025 Q3 2026 ABR PSF 6.9x 6.7x 5.9x 6.8x 6.0x 5.2x 5.1x 4.7x 4.9x 5.2x 2017 2018 2019 2020 2021 2022 2023 2024 2025 Q3 2026 NET DEBT TO ADJUSTED EBITDA 1. Adjusted for the Eastgate Crossing acquisition. 1 Third Quarter Highlights 4.5% CAGR
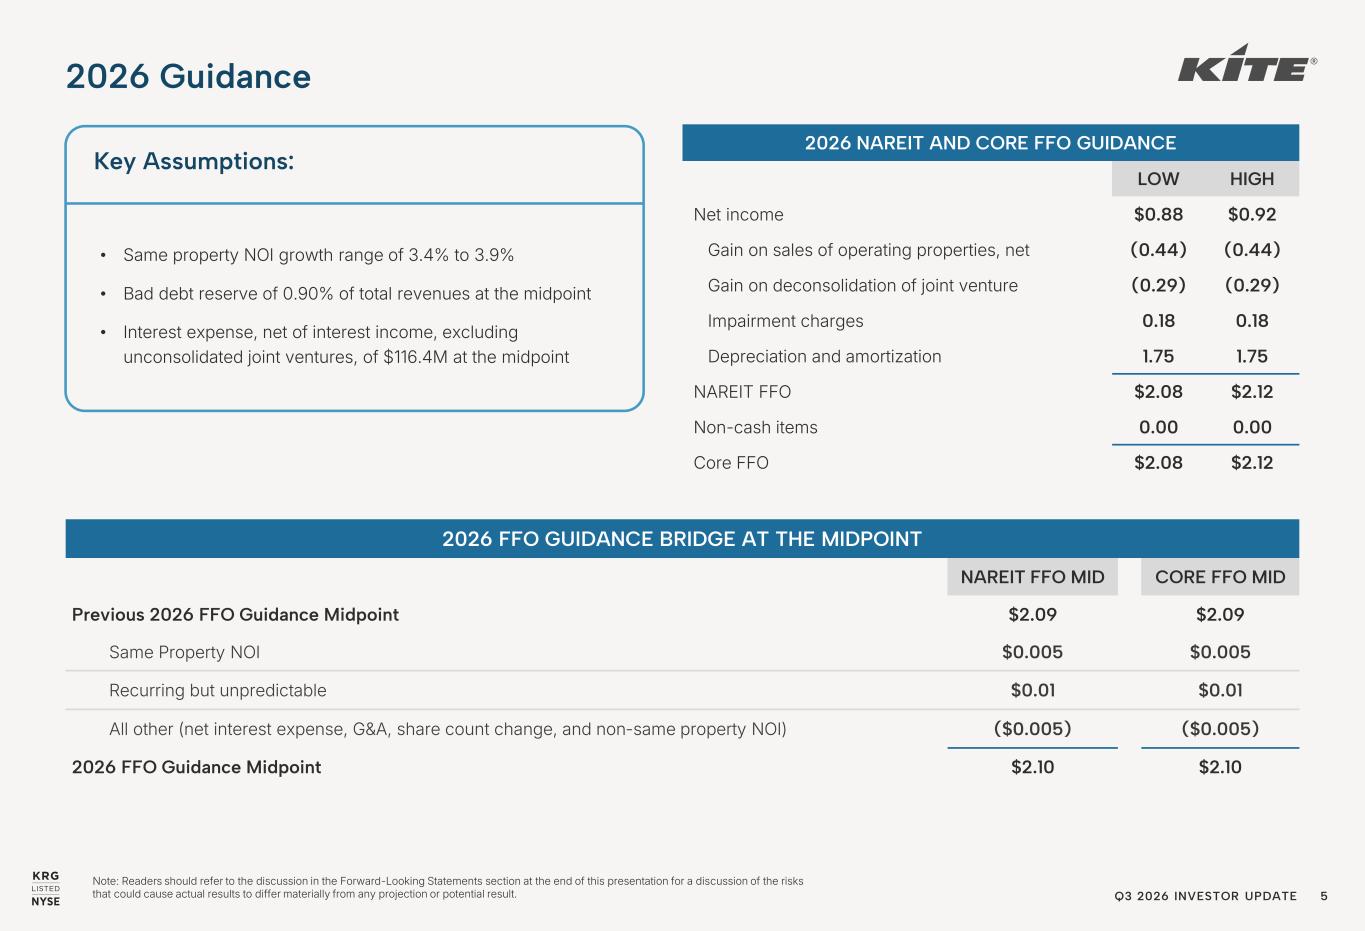
Q3 2026 INVESTOR UPDATE 5 2026 Guidance 2026 NAREIT AND CORE FFO GUIDANCE LOW HIGH Net income $0.88 $0.92 Gain on sales of operating properties, net (0.44) (0.44) Gain on deconsolidation of joint venture (0.29) (0.29) Impairment charges 0.18 0.18 Depreciation and amortization 1.75 1.75 NAREIT FFO $2.08 $2.12 Non-cash items 0.00 0.00 Core FFO $2.08 $2.12 2026 FFO GUIDANCE BRIDGE AT THE MIDPOINT NAREIT FFO MID CORE FFO MID Previous 2026 FFO Guidance Midpoint $2.09 $2.09 Same Property NOI $0.005 $0.005 Recurring but unpredictable $0.01 $0.01 All other (net interest expense, G&A, share count change, and non-same property NOI) ($0.005) ($0.005) 2026 FFO Guidance Midpoint $2.10 $2.10 Note: Readers should refer to the discussion in the Forward-Looking Statements section at the end of this presentation for a discussion of the risks that could cause actual results to differ materially from any projection or potential result. • Same property NOI growth range of 3.4% to 3.9% • Bad debt reserve of 0.90% of total revenues at the midpoint • Interest expense, net of interest income, excluding unconsolidated joint ventures, of $116.4M at the midpoint Key Assumptions:
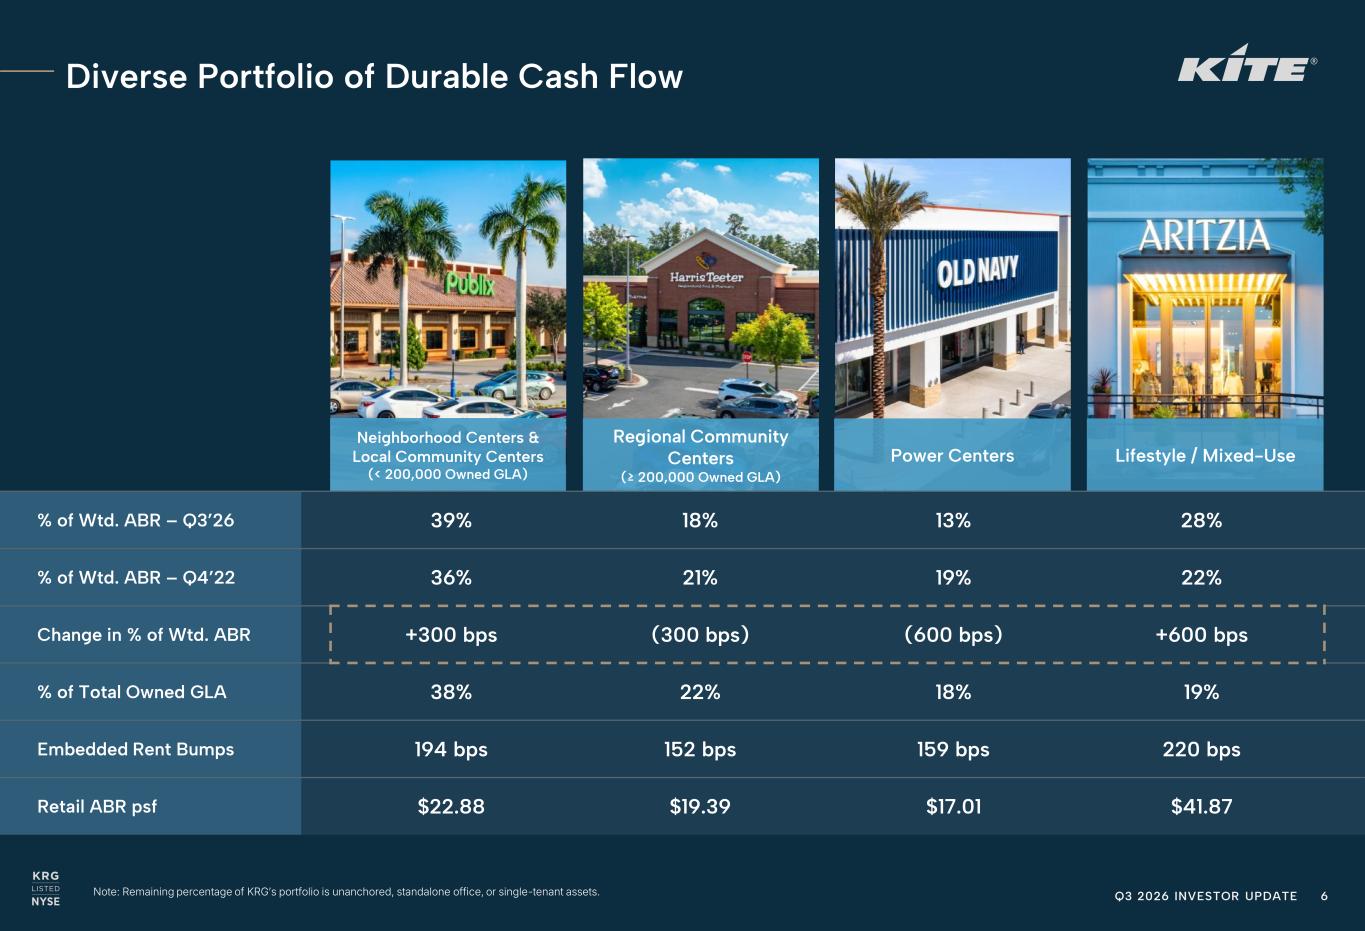
Q3 2026 INVESTOR UPDATE 6 Note: Remaining percentage of KRG’s portfolio is unanchored, standalone office, or single-tenant assets. Diverse Portfolio of Durable Cash Flow Lifestyle / Mixed-UsePower Centers Regional Community Centers (≥ 200,000 Owned GLA) Neighborhood Centers & Local Community Centers (< 200,000 Owned GLA) % of Wtd. ABR – Q3’26 39% 18% 13% 28% % of Wtd. ABR – Q4’22 36% 21% 19% 22% Change in % of Wtd. ABR +300 bps (300 bps) (600 bps) +600 bps % of Total Owned GLA 38% 22% 18% 19% Embedded Rent Bumps 194 bps 152 bps 159 bps 220 bps Retail ABR psf $22.88 $19.39 $17.01 $41.87
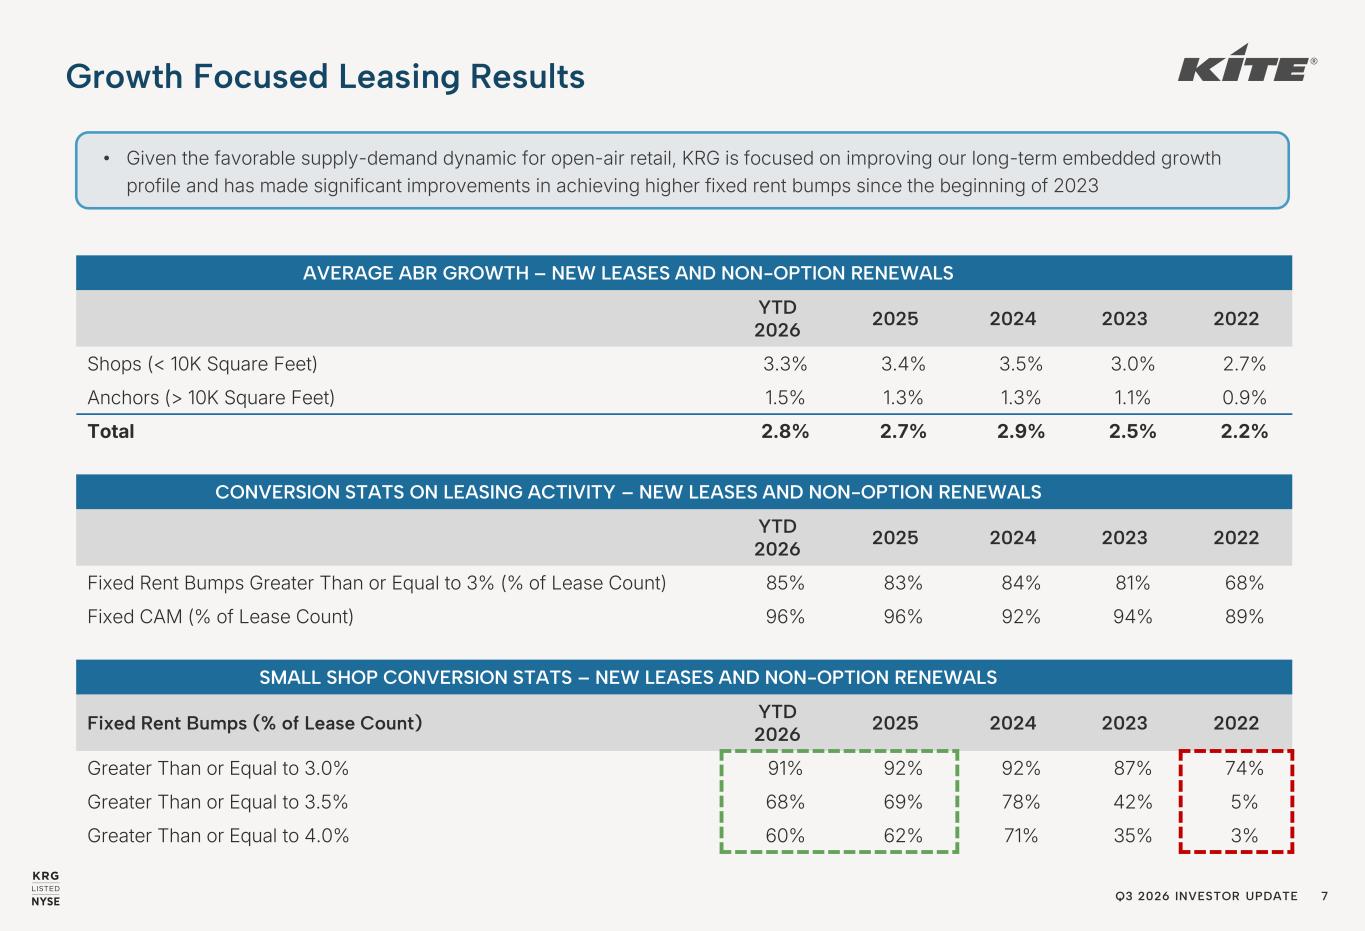
Q3 2026 INVESTOR UPDATE 7 AVERAGE ABR GROWTH – NEW LEASES AND NON-OPTION RENEWALS YTD 2026 2025 2024 2023 2022 Shops (< 10K Square Feet) 3.3% 3.4% 3.5% 3.0% 2.7% Anchors (> 10K Square Feet) 1.5% 1.3% 1.3% 1.1% 0.9% Total 2.8% 2.7% 2.9% 2.5% 2.2% CONVERSION STATS ON LEASING ACTIVITY – NEW LEASES AND NON-OPTION RENEWALS YTD 2026 2025 2024 2023 2022 Fixed Rent Bumps Greater Than or Equal to 3% (% of Lease Count) 85% 83% 84% 81% 68% Fixed CAM (% of Lease Count) 96% 96% 92% 94% 89% SMALL SHOP CONVERSION STATS – NEW LEASES AND NON-OPTION RENEWALS Fixed Rent Bumps (% of Lease Count) YTD 2026 2025 2024 2023 2022 Greater Than or Equal to 3.0% 91% 92% 92% 87% 74% Greater Than or Equal to 3.5% 68% 69% 78% 42% 5% Greater Than or Equal to 4.0% 60% 62% 71% 35% 3% • Given the favorable supply-demand dynamic for open-air retail, KRG is focused on improving our long-term embedded growth profile and has made significant improvements in achieving higher fixed rent bumps since the beginning of 2023 Growth Focused Leasing Results
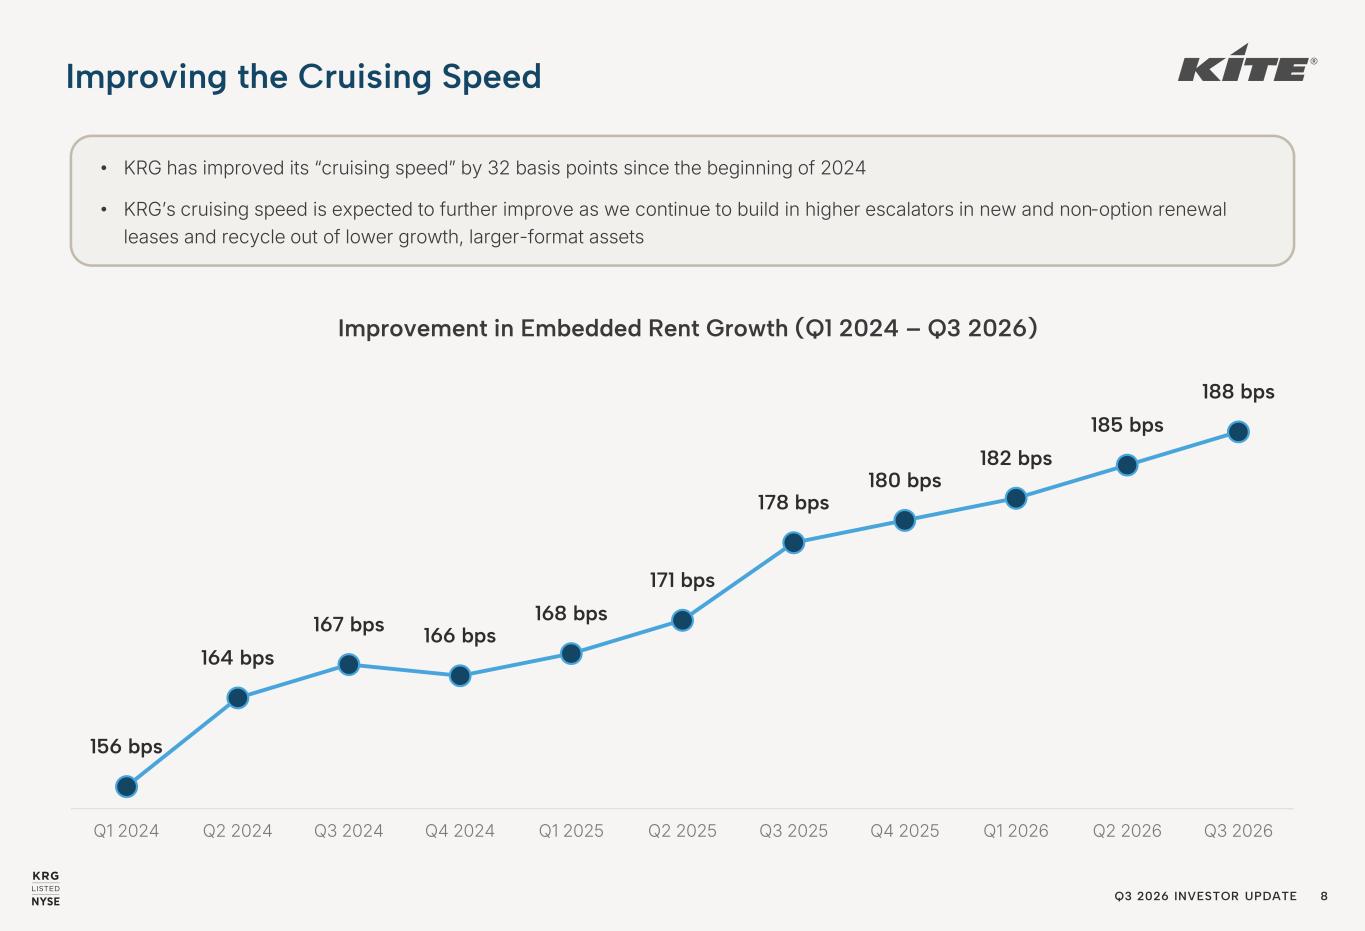
Q3 2026 INVESTOR UPDATE 8 156 bps 164 bps 167 bps 166 bps 168 bps 171 bps 178 bps 180 bps 182 bps 185 bps 188 bps Q1 2024 Q2 2024 Q3 2024 Q4 2024 Q1 2025 Q2 2025 Q3 2025 Q4 2025 Q1 2026 Q2 2026 Q3 2026 • KRG has improved its “cruising speed” by 32 basis points since the beginning of 2024 • KRG’s cruising speed is expected to further improve as we continue to build in higher escalators in new and non-option renewal leases and recycle out of lower growth, larger-format assets Improvement in Embedded Rent Growth (Q1 2024 – Q3 2026) Improving the Cruising Speed
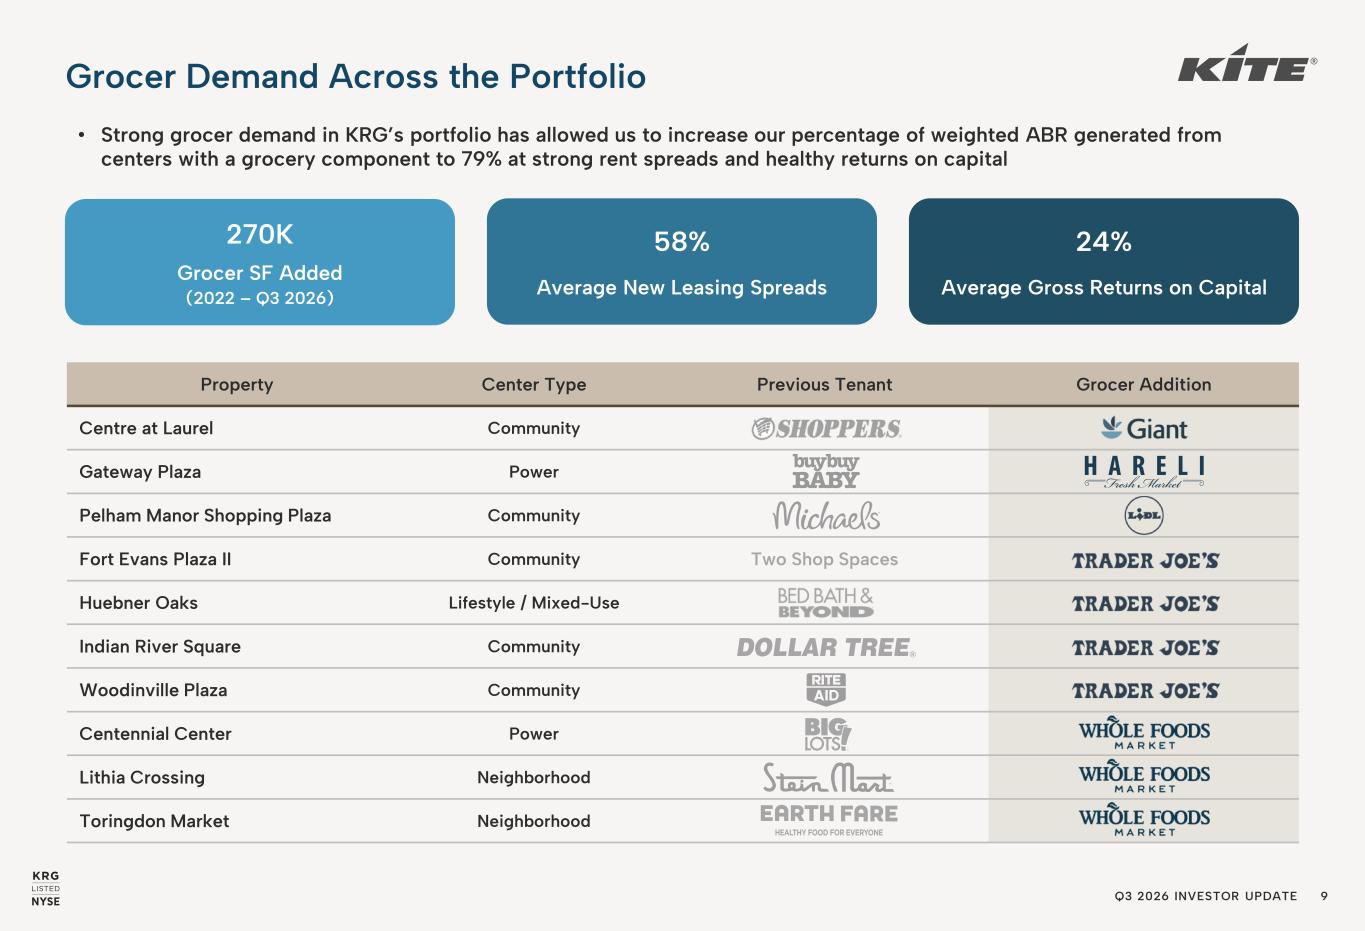
Q3 2026 INVESTOR UPDATE 9 Property Center Type Previous Tenant Grocer Addition Centre at Laurel Community Gateway Plaza Power Pelham Manor Shopping Plaza Community Fort Evans Plaza II Community Two Shop Spaces Huebner Oaks Lifestyle / Mixed-Use Indian River Square Community Woodinville Plaza Community Centennial Center Power Lithia Crossing Neighborhood Toringdon Market Neighborhood 270K Grocer SF Added (2022 – Q3 2026) 58% Average New Leasing Spreads 24% Average Gross Returns on Capital • Strong grocer demand in KRG’s portfolio has allowed us to increase our percentage of weighted ABR generated from centers with a grocery component to 79% at strong rent spreads and healthy returns on capital Grocer Demand Across the Portfolio
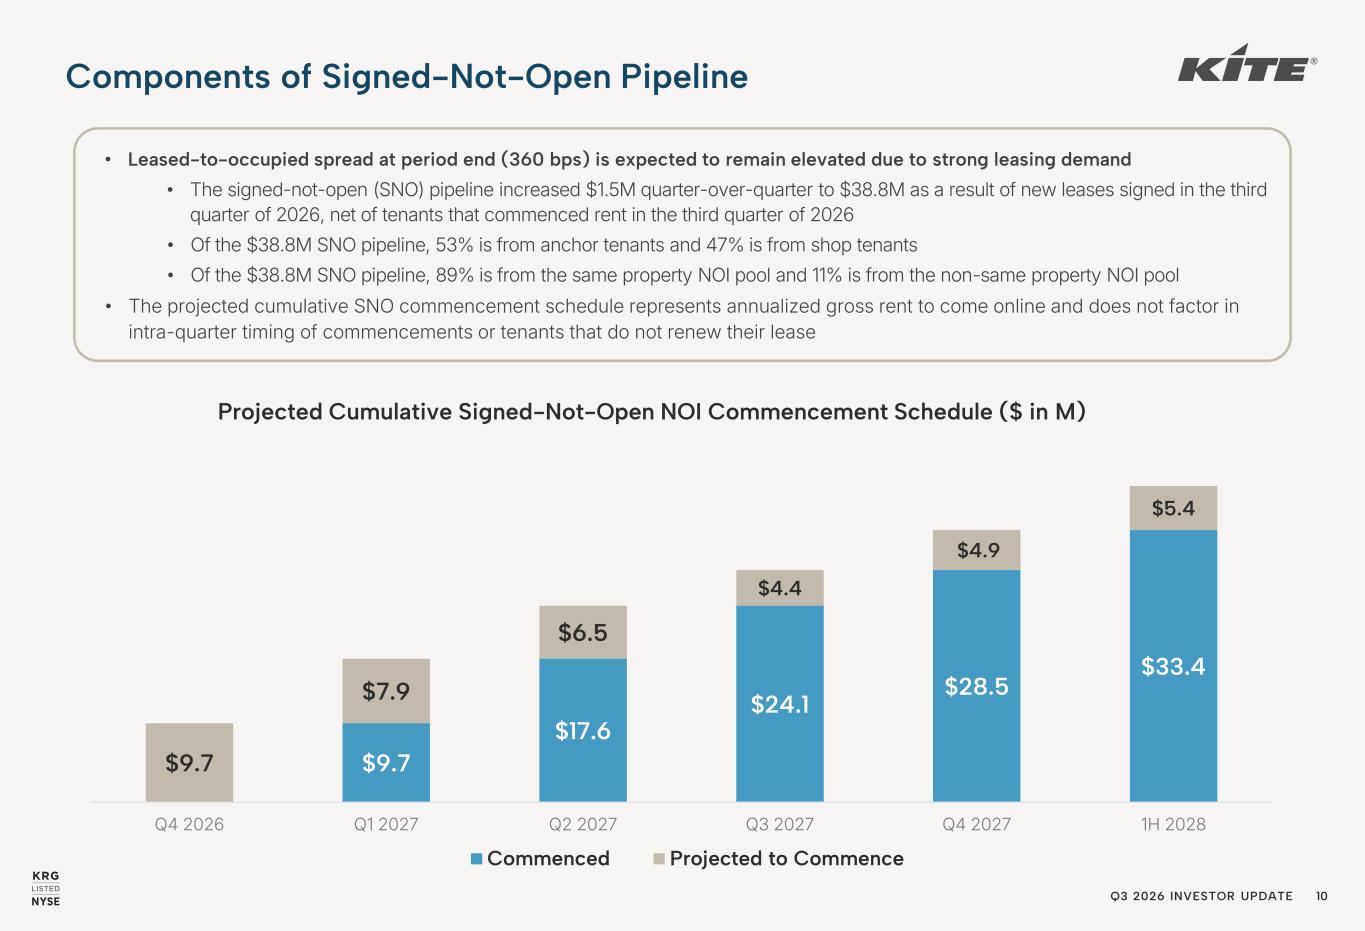
Q3 2026 INVESTOR UPDATE 10 Components of Signed-Not-Open Pipeline • Leased-to-occupied spread at period end (360 bps) is expected to remain elevated due to strong leasing demand • The signed-not-open (SNO) pipeline increased $1.5M quarter-over-quarter to $38.8M as a result of new leases signed in the third quarter of 2026, net of tenants that commenced rent in the third quarter of 2026 • Of the $38.8M SNO pipeline, 53% is from anchor tenants and 47% is from shop tenants • Of the $38.8M SNO pipeline, 89% is from the same property NOI pool and 11% is from the non-same property NOI pool • The projected cumulative SNO commencement schedule represents annualized gross rent to come online and does not factor in intra-quarter timing of commencements or tenants that do not renew their lease $9.7 $17.6 $24.1 $28.5 $33.4 $9.7 $7.9 $6.5 $4.4 $4.9 $5.4 Q4 2026 Q1 2027 Q2 2027 Q3 2027 Q4 2027 1H 2028 Projected Cumulative Signed-Not-Open NOI Commencement Schedule ($ in M) Commenced Projected to Commence
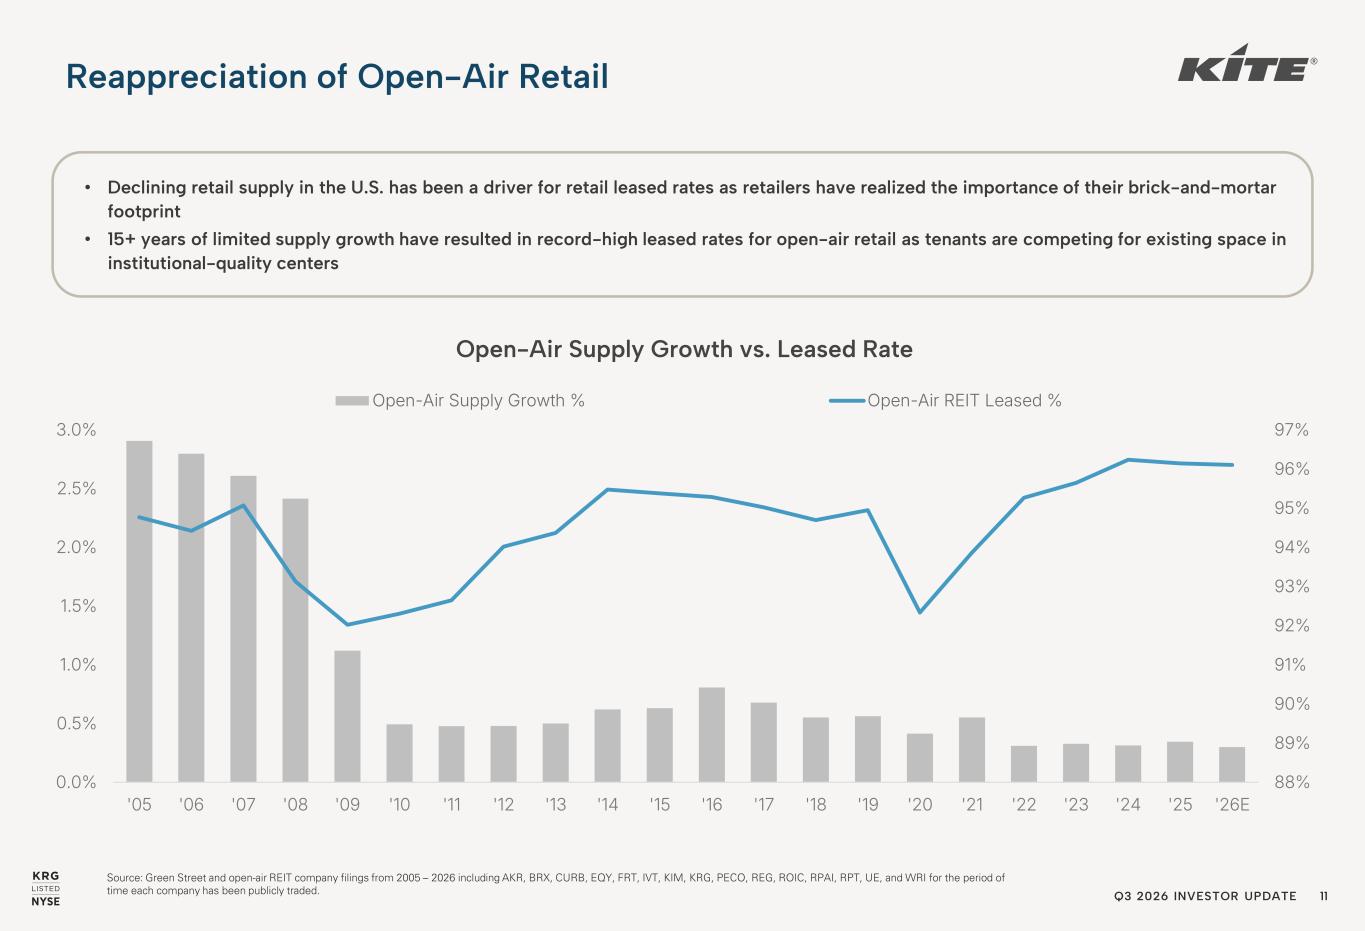
Q3 2026 INVESTOR UPDATE 11 Reappreciation of Open-Air Retail • Declining retail supply in the U.S. has been a driver for retail leased rates as retailers have realized the importance of their brick-and-mortar footprint • 15+ years of limited supply growth have resulted in record-high leased rates for open-air retail as tenants are competing for existing space in institutional-quality centers 88% 89% 90% 91% 92% 93% 94% 95% 96% 97% 0.0% 0.5% 1.0% 1.5% 2.0% 2.5% 3.0% '05 '06 '07 '08 '09 '10 '11 '12 '13 '14 '15 '16 '17 '18 '19 '20 '21 '22 '23 '24 '25 '26E Open-Air Supply Growth % Open-Air REIT Leased % Open-Air Supply Growth vs. Leased Rate Source: Green Street and open-air REIT company filings from 2005 – 2026 including AKR, BRX, CURB, EQY, FRT, IVT, KIM, KRG, PECO, REG, ROIC, RPAI, RPT, UE, and WRI for the period of time each company has been publicly traded.
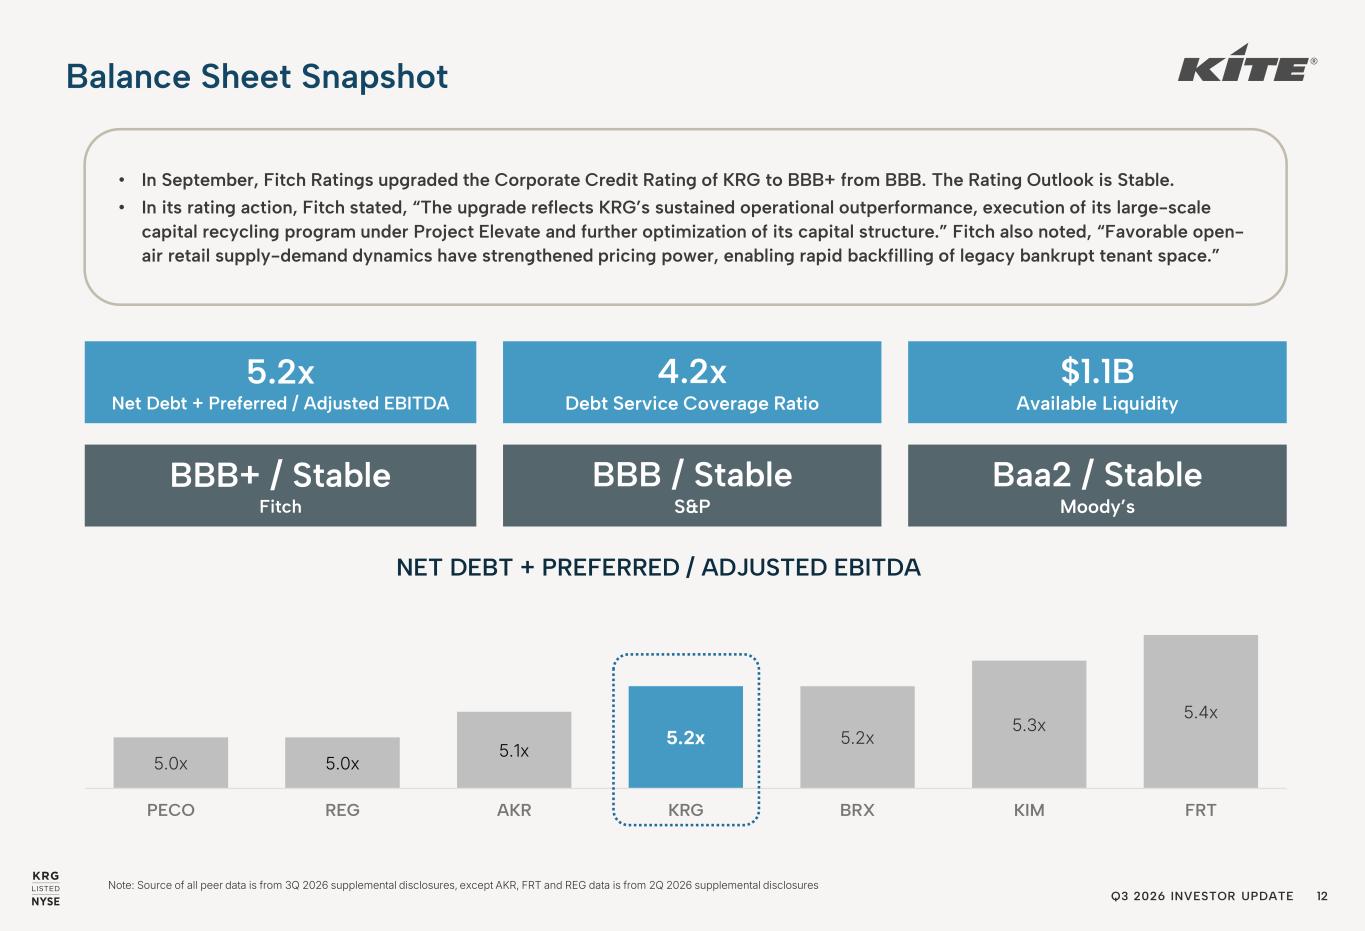
Q3 2026 INVESTOR UPDATE 12 Note: Source of all peer data is from 3Q 2026 supplemental disclosures, except AKR, FRT and REG data is from 2Q 2026 supplemental disclosures Balance Sheet Snapshot 5.2x Net Debt + Preferred / Adjusted EBITDA 4.2x Debt Service Coverage Ratio $1.1B Available Liquidity BBB+ / Stable Fitch BBB / Stable S&P Baa2 / Stable Moody’s 5.0x 5.0x 5.1x 5.2x 5.2x 5.3x 5.4x PECO REG AKR KRG BRX KIM FRT NET DEBT + PREFERRED / ADJUSTED EBITDA • In September, Fitch Ratings upgraded the Corporate Credit Rating of KRG to BBB+ from BBB. The Rating Outlook is Stable. • In its rating action, Fitch stated, “The upgrade reflects KRG’s sustained operational outperformance, execution of its large-scale capital recycling program under Project Elevate and further optimization of its capital structure.” Fitch also noted, “Favorable open- air retail supply-demand dynamics have strengthened pricing power, enabling rapid backfilling of legacy bankrupt tenant space.”
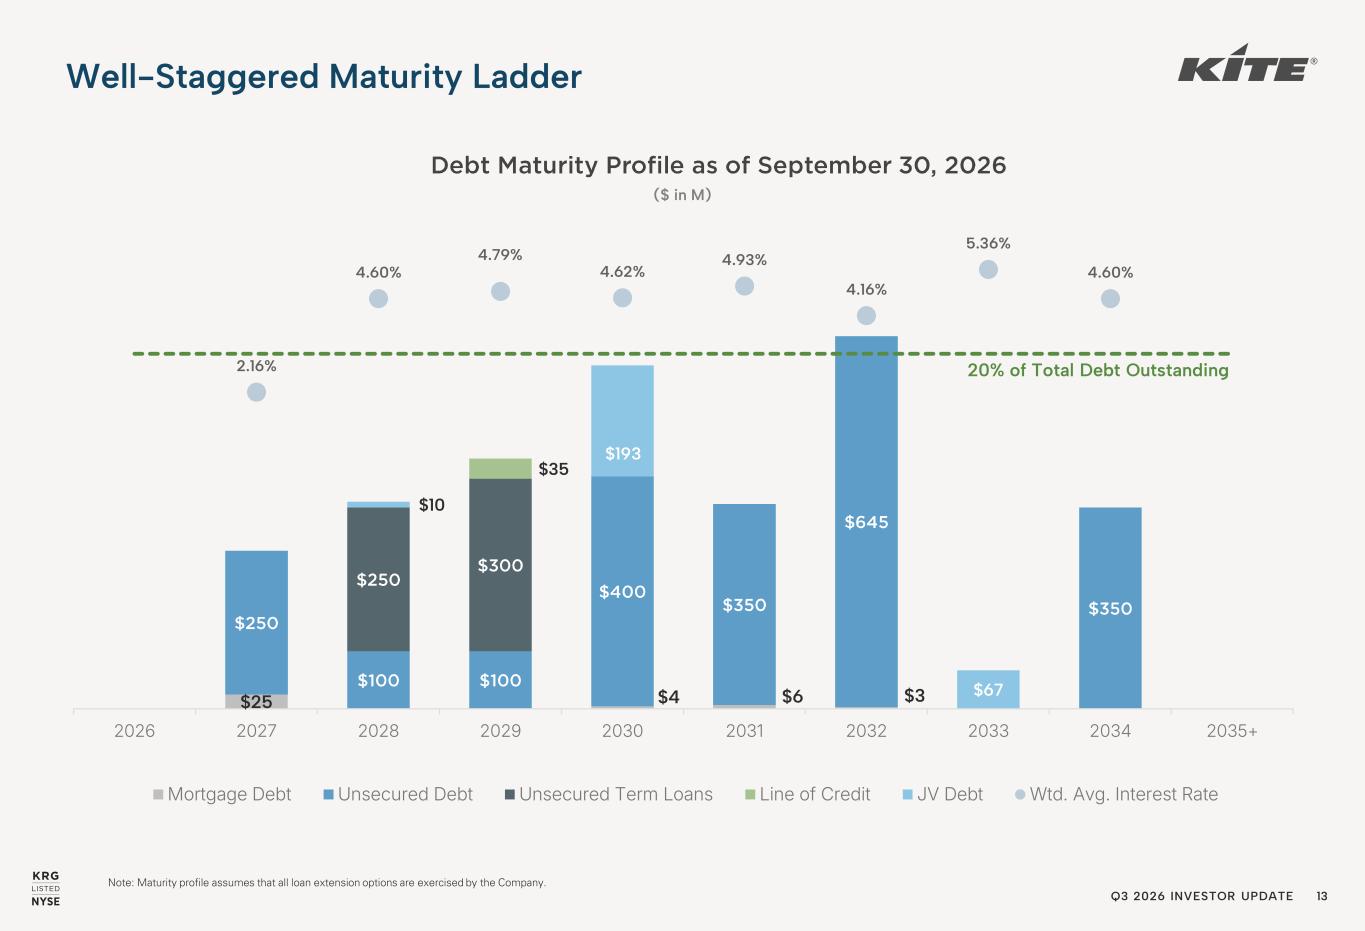
Q3 2026 INVESTOR UPDATE 13 Well-Staggered Maturity Ladder $25 $4 $6 $3 $250 $100 $100 $400 $350 $645 $350 $250 $300 $35 $10 $193 $67 2.16% 4.60% 4.79% 4.62% 4.93% 4.16% 5.36% 4.60% -0.061 -0.041 -0.021 -0.001 0.019 0.039 0.059 0.079 $- $200 $400 $600 $800 $1,000 2026 2027 2028 2029 2030 2031 2032 2033 2034 2035+ Debt Maturity Profile as of September 30, 2026 Mortgage Debt Unsecured Debt Unsecured Term Loans Line of Credit JV Debt Wtd. Avg. Interest Rate 20% of Total Debt Outstanding ($ in M) Note: Maturity profile assumes that all loan extension options are exercised by the Company.
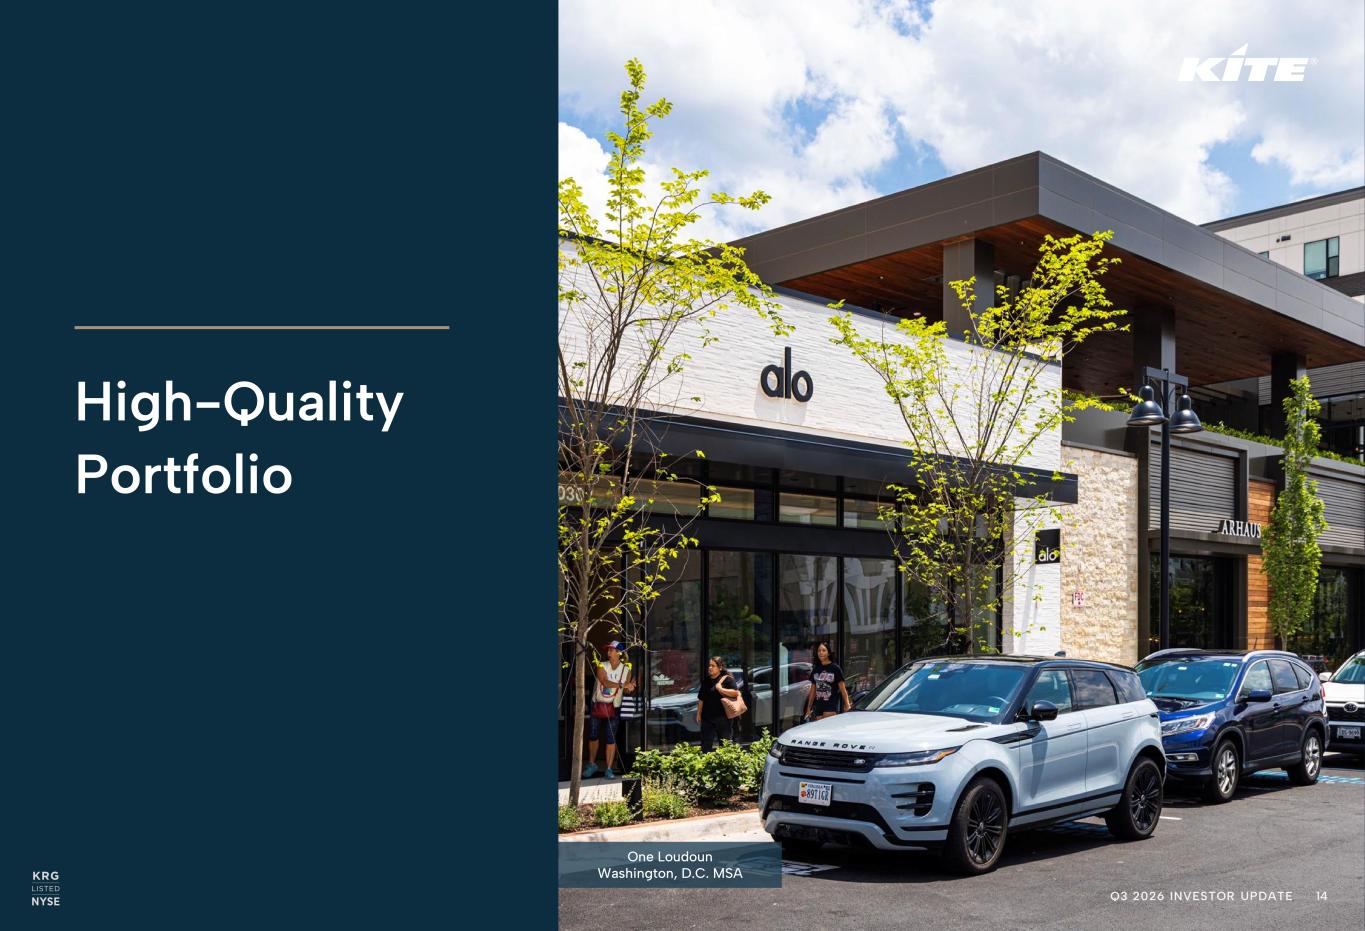
Q3 2026 INVESTOR UPDATE 14 High-Quality Portfolio One Loudoun Washington, D.C. MSA
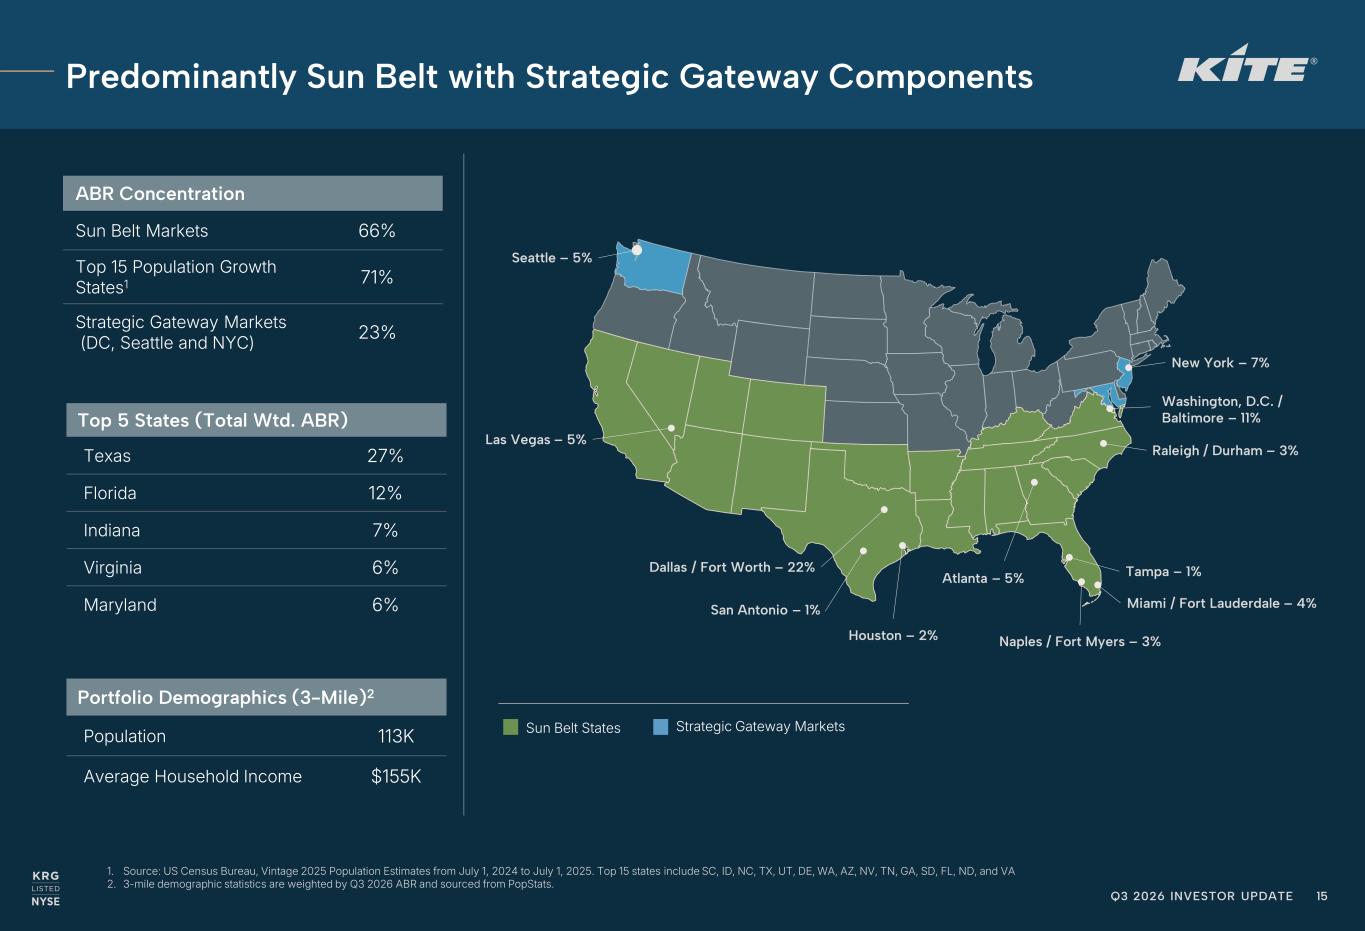
Q3 2026 INVESTOR UPDATE 15 1. Source: US Census Bureau, Vintage 2025 Population Estimates from July 1, 2024 to July 1, 2025. Top 15 states include SC, ID, NC, TX, UT, DE, WA, AZ, NV, TN, GA, SD, FL, ND, and VA 2. 3-mile demographic statistics are weighted by Q3 2026 ABR and sourced from PopStats. Top 5 States (Total Wtd. ABR) Texas 27% Florida 12% Indiana 7% Virginia 6% Maryland 6% ABR Concentration Sun Belt Markets 66% Top 15 Population Growth States1 71% Strategic Gateway Markets (DC, Seattle and NYC) 23% Portfolio Demographics (3-Mile)2 Population 113K Average Household Income $155K Predominantly Sun Belt with Strategic Gateway Components Dallas / Fort Worth – 22% Houston – 2% Naples / Fort Myers – 3% Miami / Fort Lauderdale – 4% Raleigh / Durham – 3% Washington, D.C. / Baltimore – 11% New York – 7% Atlanta – 5% Seattle – 5% Tampa – 1% Las Vegas – 5% San Antonio – 1% Sun Belt States Strategic Gateway Markets
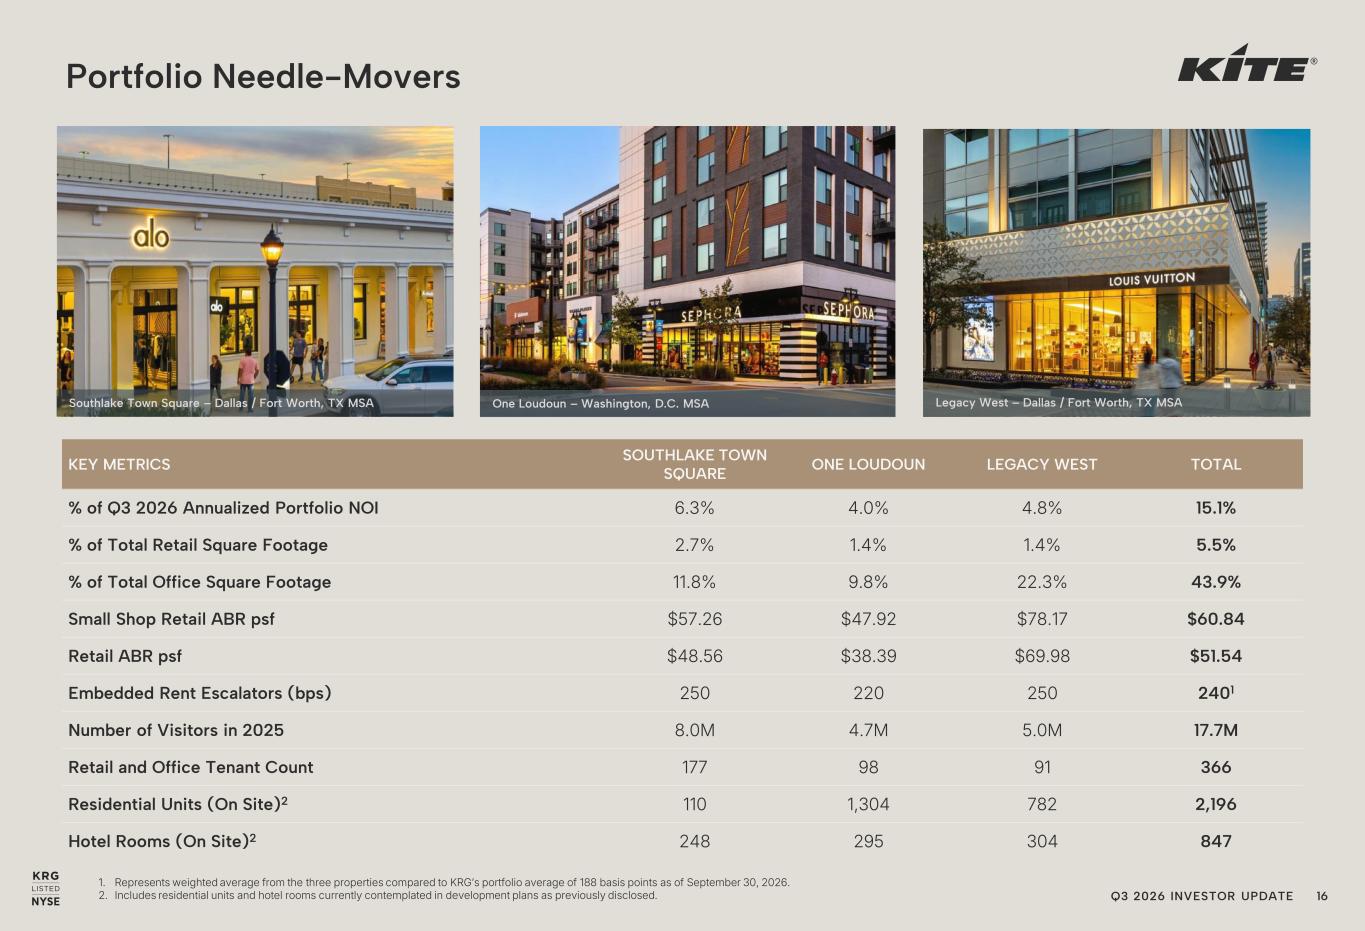
Q3 2026 INVESTOR UPDATE 16 Portfolio Needle-Movers 1. Represents weighted average from the three properties compared to KRG’s portfolio average of 188 basis points as of September 30, 2026. 2. Includes residential units and hotel rooms currently contemplated in development plans as previously disclosed. One Loudoun – Washington, D.C. MSASouthlake Town Square – Dallas / Fort Worth, TX MSA KEY METRICS SOUTHLAKE TOWN SQUARE ONE LOUDOUN LEGACY WEST TOTAL % of Q3 2026 Annualized Portfolio NOI 6.3% 4.0% 4.8% 15.1% % of Total Retail Square Footage 2.7% 1.4% 1.4% 5.5% % of Total Office Square Footage 11.8% 9.8% 22.3% 43.9% Small Shop Retail ABR psf $57.26 $47.92 $78.17 $60.84 Retail ABR psf $48.56 $38.39 $69.98 $51.54 Embedded Rent Escalators (bps) 250 220 250 2401 Number of Visitors in 2025 8.0M 4.7M 5.0M 17.7M Retail and Office Tenant Count 177 98 91 366 Residential Units (On Site)2 110 1,304 782 2,196 Hotel Rooms (On Site)2 248 295 304 847 Legacy West – Dallas / Fort Worth, TX MSA
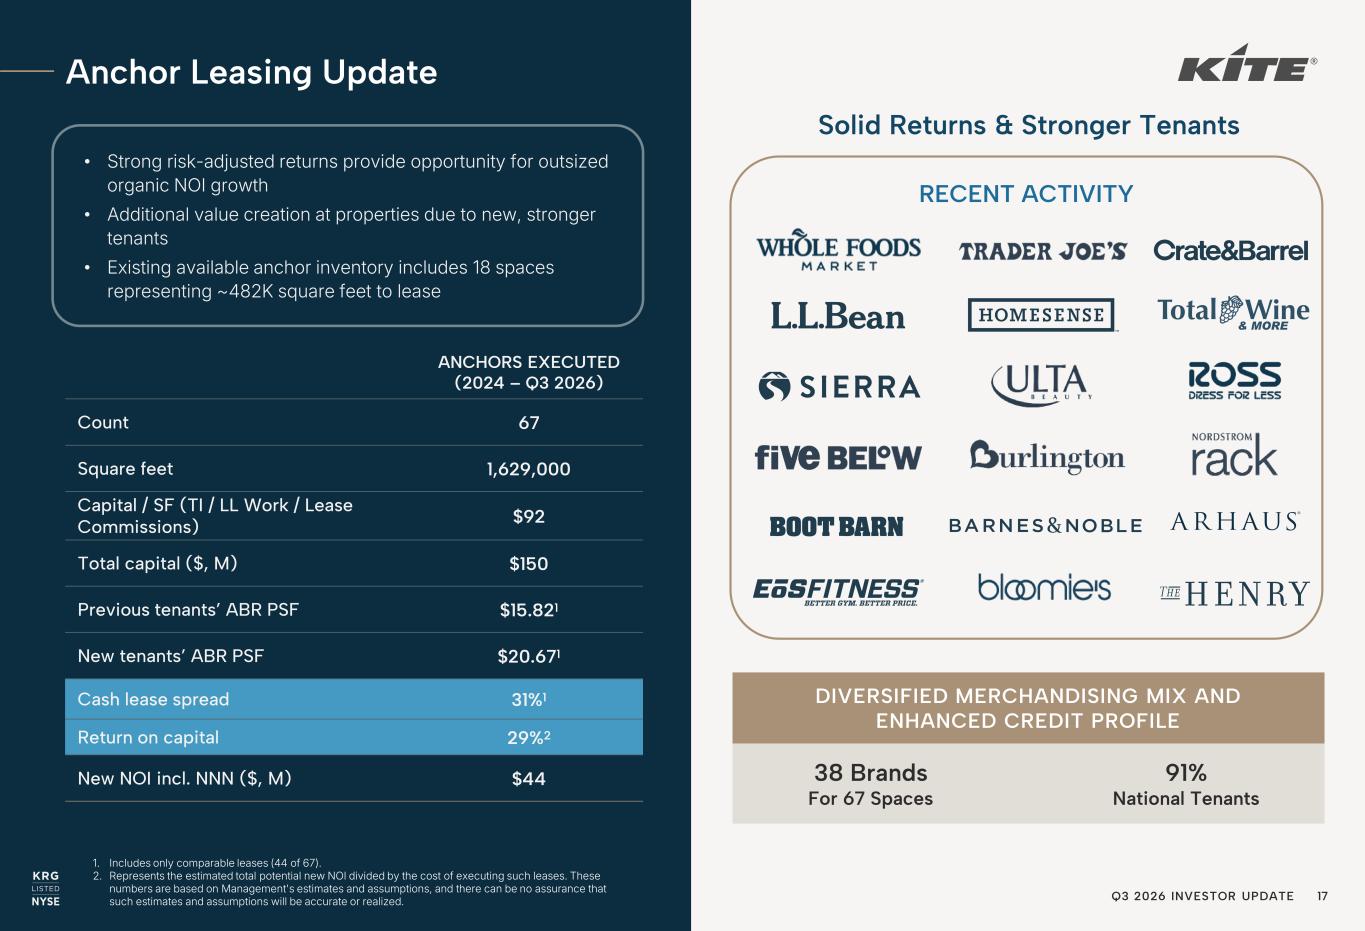
Q3 2026 INVESTOR UPDATE 17 Anchor Leasing Update Solid Returns & Stronger Tenants 1. Includes only comparable leases (44 of 67). 2. Represents the estimated total potential new NOI divided by the cost of executing such leases. These numbers are based on Management's estimates and assumptions, and there can be no assurance that such estimates and assumptions will be accurate or realized. ANCHORS EXECUTED (2024 – Q3 2026) Count 67 Square feet 1,629,000 Capital / SF (TI / LL Work / Lease Commissions) $92 Total capital ($, M) $150 Previous tenants’ ABR PSF $15.821 New tenants’ ABR PSF $20.671 Cash lease spread 31%1 Return on capital 29%2 New NOI incl. NNN ($, M) $44 RECENT ACTIVITY DIVERSIFIED MERCHANDISING MIX AND ENHANCED CREDIT PROFILE 38 Brands For 67 Spaces 91% National Tenants • Strong risk-adjusted returns provide opportunity for outsized organic NOI growth • Additional value creation at properties due to new, stronger tenants • Existing available anchor inventory includes 18 spaces representing ~482K square feet to lease
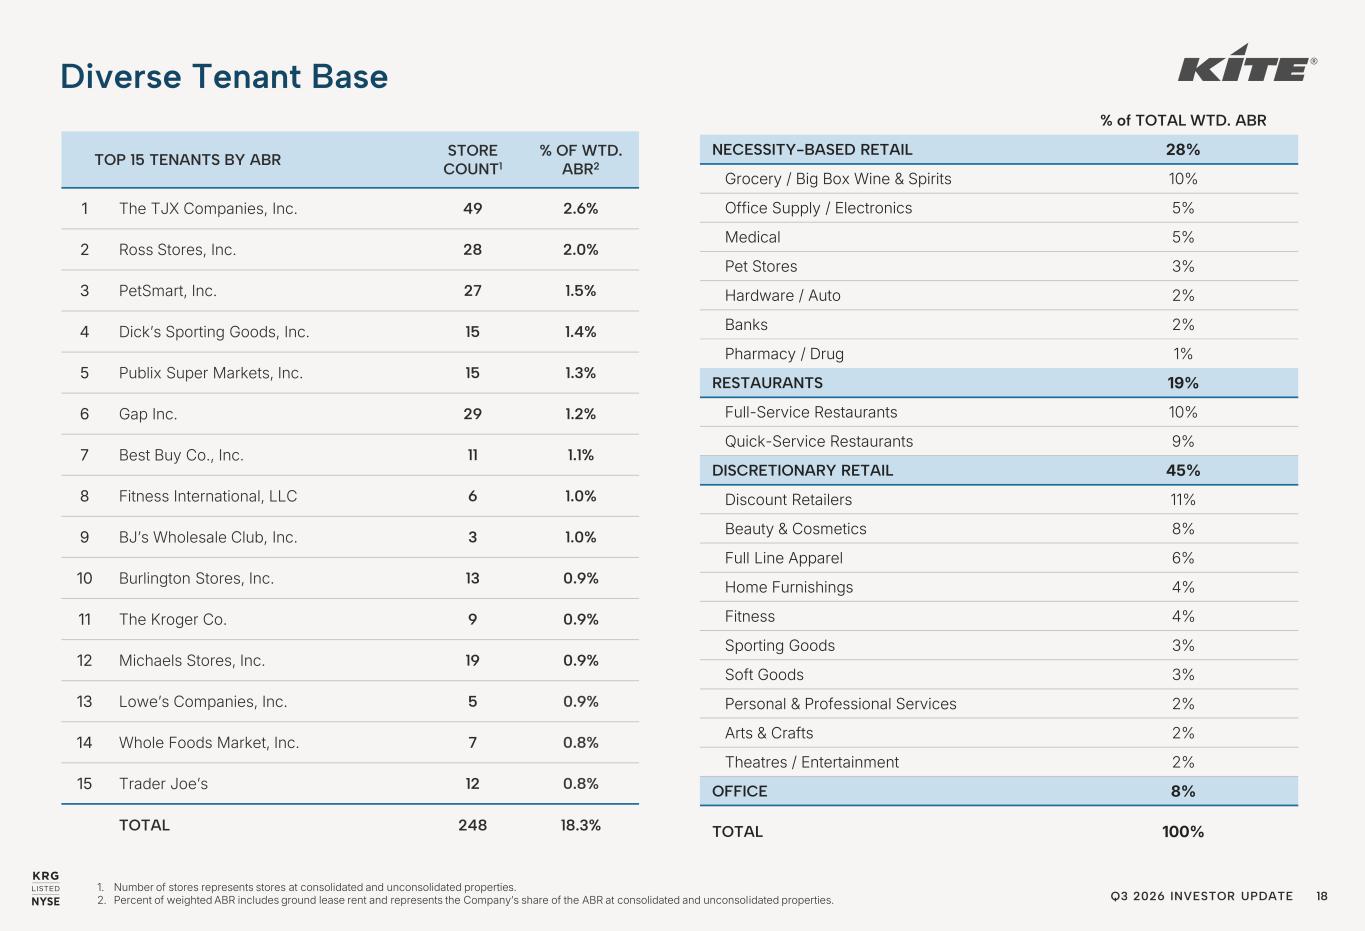
Q3 2026 INVESTOR UPDATE 18 1. Number of stores represents stores at consolidated and unconsolidated properties. 2. Percent of weighted ABR includes ground lease rent and represents the Company’s share of the ABR at consolidated and unconsolidated properties. TOP 15 TENANTS BY ABR STORE COUNT1 % OF WTD. ABR2 1 The TJX Companies, Inc. 49 2.6% 2 Ross Stores, Inc. 28 2.0% 3 PetSmart, Inc. 27 1.5% 4 Dick’s Sporting Goods, Inc. 15 1.4% 5 Publix Super Markets, Inc. 15 1.3% 6 Gap Inc. 29 1.2% 7 Best Buy Co., Inc. 11 1.1% 8 Fitness International, LLC 6 1.0% 9 BJ’s Wholesale Club, Inc. 3 1.0% 10 Burlington Stores, Inc. 13 0.9% 11 The Kroger Co. 9 0.9% 12 Michaels Stores, Inc. 19 0.9% 13 Lowe’s Companies, Inc. 5 0.9% 14 Whole Foods Market, Inc. 7 0.8% 15 Trader Joe’s 12 0.8% TOTAL 248 18.3% % of TOTAL WTD. ABR NECESSITY-BASED RETAIL 28% Grocery / Big Box Wine & Spirits 10% Office Supply / Electronics 5% Medical 5% Pet Stores 3% Hardware / Auto 2% Banks 2% Pharmacy / Drug 1% RESTAURANTS 19% Full-Service Restaurants 10% Quick-Service Restaurants 9% DISCRETIONARY RETAIL 45% Discount Retailers 11% Beauty & Cosmetics 8% Full Line Apparel 6% Home Furnishings 4% Fitness 4% Sporting Goods 3% Soft Goods 3% Personal & Professional Services 2% Arts & Crafts 2% Theatres / Entertainment 2% OFFICE 8% TOTAL 100% Diverse Tenant Base
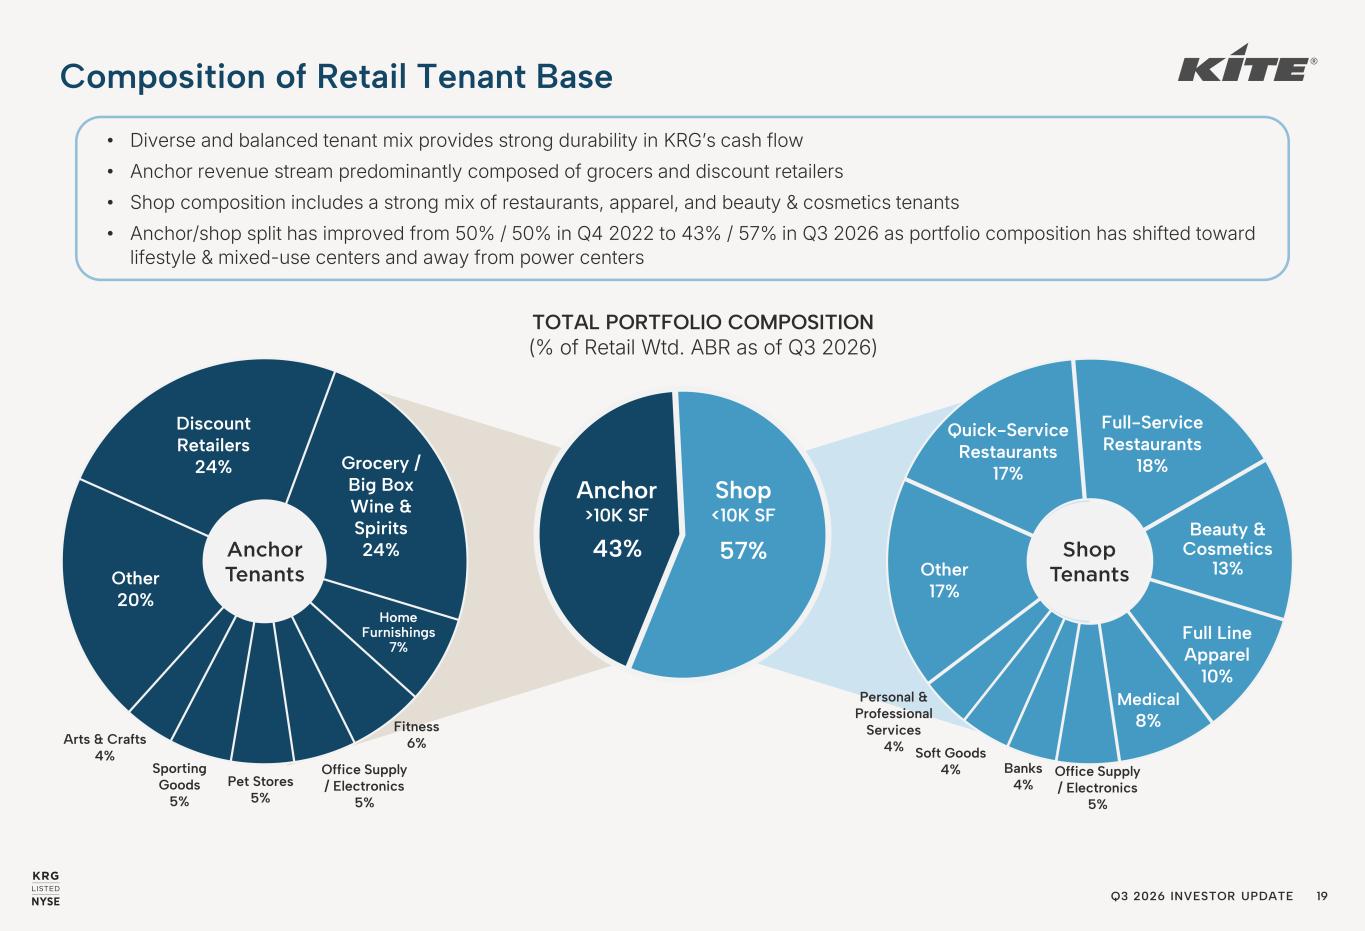
Q3 2026 INVESTOR UPDATE 19 57%43% TOTAL PORTFOLIO COMPOSITION (% of Retail Wtd. ABR as of Q3 2026) Discount Retailers 24% Grocery / Big Box Wine & Spirits 24% Home Furnishings 7% Fitness 6% Office Supply / Electronics 5% Pet Stores 5% Sporting Goods 5% Arts & Crafts 4% Other 20% Composition of Retail Tenant Base • Diverse and balanced tenant mix provides strong durability in KRG’s cash flow • Anchor revenue stream predominantly composed of grocers and discount retailers • Shop composition includes a strong mix of restaurants, apparel, and beauty & cosmetics tenants • Anchor/shop split has improved from 50% / 50% in Q4 2022 to 43% / 57% in Q3 2026 as portfolio composition has shifted toward lifestyle & mixed-use centers and away from power centers Quick-Service Restaurants 17% Full-Service Restaurants 18% Beauty & Cosmetics 13% Full Line Apparel 10% Medical 8% Office Supply / Electronics 5% Banks 4% Soft Goods 4% Personal & Professional Services 4% Other 17% Anchor >10K SF Shop <10K SF Anchor Tenants Shop Tenants
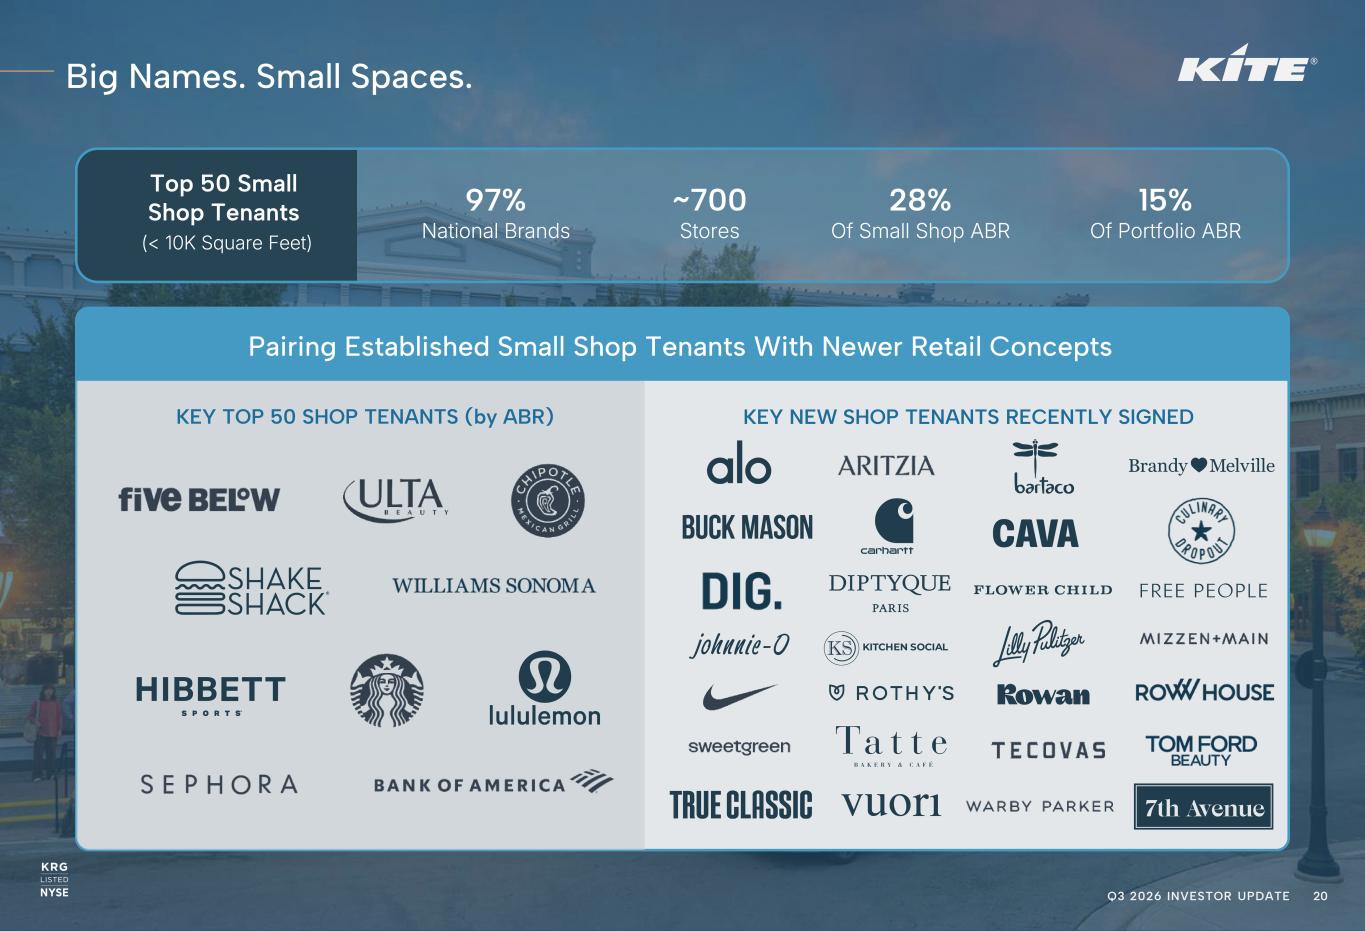
Q3 2026 INVESTOR UPDATE 20 Big Names. Small Spaces. KEY NEW SHOP TENANTS RECENTLY SIGNEDKEY TOP 50 SHOP TENANTS (by ABR) Pairing Established Small Shop Tenants With Newer Retail Concepts 97% National Brands ~700 Stores 28% Of Small Shop ABR 15% Of Portfolio ABR Top 50 Small Shop Tenants (< 10K Square Feet)
Q3 2026 INVESTOR UPDATE 21 Disclaimer Forward-Looking Statements This Investor Update, together with other statements and information publicly disseminated by us, contains certain forward-looking statements within the meaning of Section 27A of the Securities Act of 1933 and Section 21E of the Securities Exchange Act of 1934. Such statements are based on assumptions and expectations that may not be realized and are inherently subject to risks, uncertainties and other factors, many of which cannot be predicted with accuracy and some of which might not even be anticipated. Future events and actual results, performance, transactions or achievements, financial or otherwise, may differ materially from the results, performance, transactions or achievements, financial or otherwise, expressed or implied by the forward-looking statements. Risks, uncertainties and other factors that might cause such differences, some of which could be material, include but are not limited to: • economic, business, banking, real estate and other market conditions, particularly in connection with low or negative growth in the U.S. economy as well as economic uncertainty (including from an economic slowdown or recession, federal government shutdown, disruptions related to tariffs and other trade or sanction issues, geopolitical instability, rising interest rates, inflation, unemployment, or limited growth in consumer income or spending); • financing risks, including the availability of, and costs associated with, sources of liquidity; • the Company’s ability to refinance, or extend the maturity dates of, the Company’s indebtedness; • the level and volatility of interest rates; • the financial stability of the Company’s tenants; • the competitive environment in which the Company operates, including potential oversupplies of, or a reduction in demand for, rental space; • acquisition, disposition, development and joint venture risks, including the ability to complete them on the terms and timing anticipated; • property ownership and management risks, including the relative illiquidity of real estate investments, and expenses, vacancies or the inability to rent space on favorable terms or at all; • the risk that we will not be able to increase rents in our new and non-option renewal leases; • the Company’s ability to maintain the Company’s status as a real estate investment trust (“REIT”) for U.S. federal income tax purposes; • potential environmental and other liabilities; • impairment in the value of real estate property the Company owns; • the attractiveness of our properties to tenants, the actual and perceived impact of e-commerce on the value of shopping center assets and changing demographics and customer traffic patterns; • business continuity disruptions and a deterioration in our tenants’ ability to operate in affected areas or delays in the supply of products or services to us or our tenants from vendors that are needed to operate efficiently; • risks related to our current geographical concentration of properties in the states of Texas, Florida, and North Carolina and the metropolitan statistical areas of New York, Atlanta, Seattle, Chicago, and Washington, D.C.; • civil unrest, acts of violence, terrorism or war, acts of God, climate change, epidemics, pandemics, natural disasters and severe weather conditions, including such events that may result in underinsured or uninsured losses or other increased costs and expenses; • changes in laws and government regulations, including governmental orders affecting the use of the Company’s properties or the ability of its tenants to operate, and the costs of complying with such changed laws and government regulations; • possible changes in consumer behavior due to public health crises and the fear of future pandemics; • our ability to satisfy environmental, social, and governance standards set by various constituencies; • insurance costs and coverage, especially in Florida and Texas coastal areas and North Carolina; • risks associated with cyberattacks and the loss of confidential information and other business disruptions; • risks associated with the use of artificial intelligence and related tools; • whether the leased-to-occupied spread will remain elevated; • our ability to achieve the expected NOI from our signed-not-open pipeline; • other factors affecting the real estate industry generally; and • other risks identified in reports the Company files with the Securities and Exchange Commission or in other documents that it publicly disseminates, including, in particular, the section titled “Risk Factors” in the Company’s Annual Report on Form 10-K for the fiscal year ended December 31, 2025, and in the Company’s quarterly reports on Form 10-Q. The Company undertakes no obligation to publicly update or revise these forward-looking statements, whether as a result of new information, future events or otherwise. This Investor Update also includes certain forward-looking non-GAAP information. For certain definitions and reconciliations see pages 22 to 26.
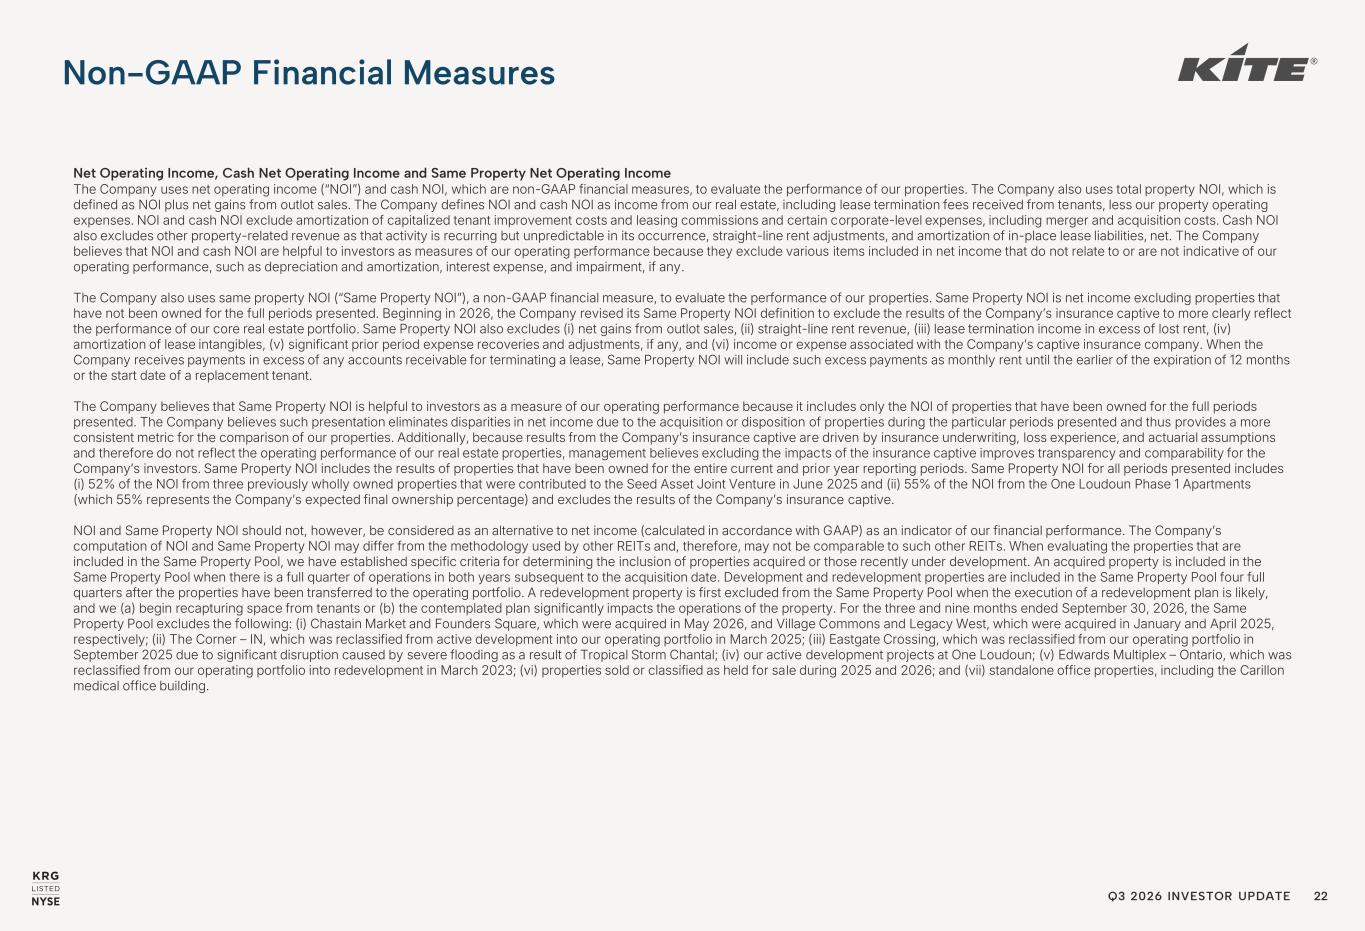
Q3 2026 INVESTOR UPDATE 22 Net Operating Income, Cash Net Operating Income and Same Property Net Operating Income The Company uses net operating income (“NOI”) and cash NOI, which are non-GAAP financial measures, to evaluate the performance of our properties. The Company also uses total property NOI, which is defined as NOI plus net gains from outlot sales. The Company defines NOI and cash NOI as income from our real estate, including lease termination fees received from tenants, less our property operating expenses. NOI and cash NOI exclude amortization of capitalized tenant improvement costs and leasing commissions and certain corporate-level expenses, including merger and acquisition costs. Cash NOI also excludes other property-related revenue as that activity is recurring but unpredictable in its occurrence, straight-line rent adjustments, and amortization of in-place lease liabilities, net. The Company believes that NOI and cash NOI are helpful to investors as measures of our operating performance because they exclude various items included in net income that do not relate to or are not indicative of our operating performance, such as depreciation and amortization, interest expense, and impairment, if any. The Company also uses same property NOI (“Same Property NOI”), a non-GAAP financial measure, to evaluate the performance of our properties. Same Property NOI is net income excluding properties that have not been owned for the full periods presented. Beginning in 2026, the Company revised its Same Property NOI definition to exclude the results of the Company’s insurance captive to more clearly reflect the performance of our core real estate portfolio. Same Property NOI also excludes (i) net gains from outlot sales, (ii) straight-line rent revenue, (iii) lease termination income in excess of lost rent, (iv) amortization of lease intangibles, (v) significant prior period expense recoveries and adjustments, if any, and (vi) income or expense associated with the Company’s captive insurance company. When the Company receives payments in excess of any accounts receivable for terminating a lease, Same Property NOI will include such excess payments as monthly rent until the earlier of the expiration of 12 months or the start date of a replacement tenant. The Company believes that Same Property NOI is helpful to investors as a measure of our operating performance because it includes only the NOI of properties that have been owned for the full periods presented. The Company believes such presentation eliminates disparities in net income due to the acquisition or disposition of properties during the particular periods presented and thus provides a more consistent metric for the comparison of our properties. Additionally, because results from the Company’s insurance captive are driven by insurance underwriting, loss experience, and actuarial assumptions and therefore do not reflect the operating performance of our real estate properties, management believes excluding the impacts of the insurance captive improves transparency and comparability for the Company’s investors. Same Property NOI includes the results of properties that have been owned for the entire current and prior year reporting periods. Same Property NOI for all periods presented includes (i) 52% of the NOI from three previously wholly owned properties that were contributed to the Seed Asset Joint Venture in June 2025 and (ii) 55% of the NOI from the One Loudoun Phase 1 Apartments (which 55% represents the Company’s expected final ownership percentage) and excludes the results of the Company’s insurance captive. NOI and Same Property NOI should not, however, be considered as an alternative to net income (calculated in accordance with GAAP) as an indicator of our financial performance. The Company’s computation of NOI and Same Property NOI may differ from the methodology used by other REITs and, therefore, may not be comparable to such other REITs. When evaluating the properties that are included in the Same Property Pool, we have established specific criteria for determining the inclusion of properties acquired or those recently under development. An acquired property is included in the Same Property Pool when there is a full quarter of operations in both years subsequent to the acquisition date. Development and redevelopment properties are included in the Same Property Pool four full quarters after the properties have been transferred to the operating portfolio. A redevelopment property is first excluded from the Same Property Pool when the execution of a redevelopment plan is likely, and we (a) begin recapturing space from tenants or (b) the contemplated plan significantly impacts the operations of the property. For the three and nine months ended September 30, 2026, the Same Property Pool excludes the following: (i) Chastain Market and Founders Square, which were acquired in May 2026, and Village Commons and Legacy West, which were acquired in January and April 2025, respectively; (ii) The Corner – IN, which was reclassified from active development into our operating portfolio in March 2025; (iii) Eastgate Crossing, which was reclassified from our operating portfolio in September 2025 due to significant disruption caused by severe flooding as a result of Tropical Storm Chantal; (iv) our active development projects at One Loudoun; (v) Edwards Multiplex – Ontario, which was reclassified from our operating portfolio into redevelopment in March 2023; (vi) properties sold or classified as held for sale during 2025 and 2026; and (vii) standalone office properties, including the Carillon medical office building. Non-GAAP Financial Measures
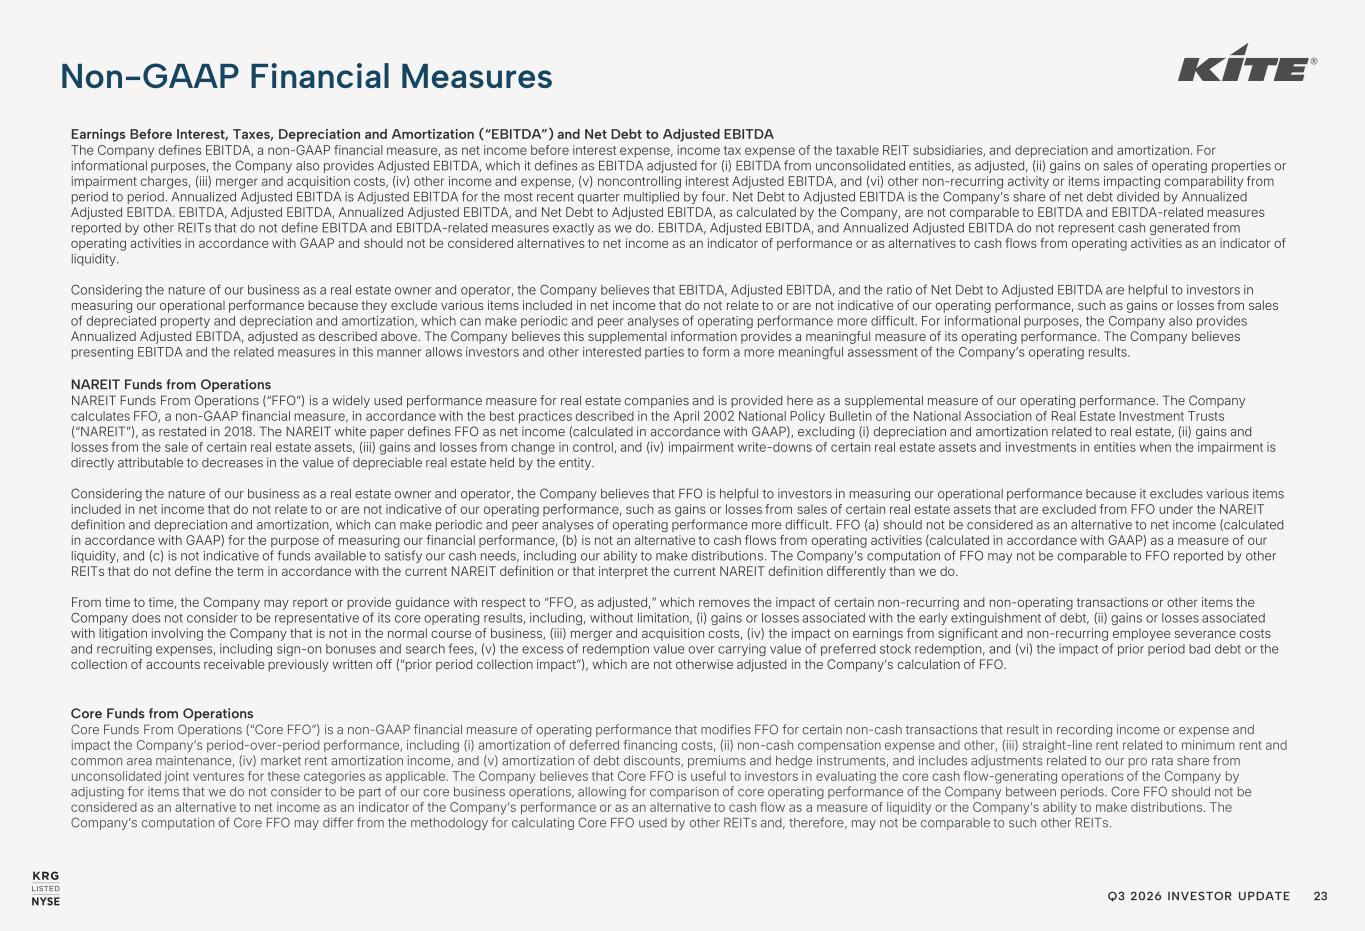
Q3 2026 INVESTOR UPDATE 23 Earnings Before Interest, Taxes, Depreciation and Amortization (“EBITDA”) and Net Debt to Adjusted EBITDA The Company defines EBITDA, a non-GAAP financial measure, as net income before interest expense, income tax expense of the taxable REIT subsidiaries, and depreciation and amortization. For informational purposes, the Company also provides Adjusted EBITDA, which it defines as EBITDA adjusted for (i) EBITDA from unconsolidated entities, as adjusted, (ii) gains on sales of operating properties or impairment charges, (iii) merger and acquisition costs, (iv) other income and expense, (v) noncontrolling interest Adjusted EBITDA, and (vi) other non-recurring activity or items impacting comparability from period to period. Annualized Adjusted EBITDA is Adjusted EBITDA for the most recent quarter multiplied by four. Net Debt to Adjusted EBITDA is the Company’s share of net debt divided by Annualized Adjusted EBITDA. EBITDA, Adjusted EBITDA, Annualized Adjusted EBITDA, and Net Debt to Adjusted EBITDA, as calculated by the Company, are not comparable to EBITDA and EBITDA-related measures reported by other REITs that do not define EBITDA and EBITDA-related measures exactly as we do. EBITDA, Adjusted EBITDA, and Annualized Adjusted EBITDA do not represent cash generated from operating activities in accordance with GAAP and should not be considered alternatives to net income as an indicator of performance or as alternatives to cash flows from operating activities as an indicator of liquidity. Considering the nature of our business as a real estate owner and operator, the Company believes that EBITDA, Adjusted EBITDA, and the ratio of Net Debt to Adjusted EBITDA are helpful to investors in measuring our operational performance because they exclude various items included in net income that do not relate to or are not indicative of our operating performance, such as gains or losses from sales of depreciated property and depreciation and amortization, which can make periodic and peer analyses of operating performance more difficult. For informational purposes, the Company also provides Annualized Adjusted EBITDA, adjusted as described above. The Company believes this supplemental information provides a meaningful measure of its operating performance. The Company believes presenting EBITDA and the related measures in this manner allows investors and other interested parties to form a more meaningful assessment of the Company’s operating results. NAREIT Funds from Operations NAREIT Funds From Operations (“FFO”) is a widely used performance measure for real estate companies and is provided here as a supplemental measure of our operating performance. The Company calculates FFO, a non-GAAP financial measure, in accordance with the best practices described in the April 2002 National Policy Bulletin of the National Association of Real Estate Investment Trusts (“NAREIT”), as restated in 2018. The NAREIT white paper defines FFO as net income (calculated in accordance with GAAP), excluding (i) depreciation and amortization related to real estate, (ii) gains and losses from the sale of certain real estate assets, (iii) gains and losses from change in control, and (iv) impairment write-downs of certain real estate assets and investments in entities when the impairment is directly attributable to decreases in the value of depreciable real estate held by the entity. Considering the nature of our business as a real estate owner and operator, the Company believes that FFO is helpful to investors in measuring our operational performance because it excludes various items included in net income that do not relate to or are not indicative of our operating performance, such as gains or losses from sales of certain real estate assets that are excluded from FFO under the NAREIT definition and depreciation and amortization, which can make periodic and peer analyses of operating performance more difficult. FFO (a) should not be considered as an alternative to net income (calculated in accordance with GAAP) for the purpose of measuring our financial performance, (b) is not an alternative to cash flows from operating activities (calculated in accordance with GAAP) as a measure of our liquidity, and (c) is not indicative of funds available to satisfy our cash needs, including our ability to make distributions. The Company’s computation of FFO may not be comparable to FFO reported by other REITs that do not define the term in accordance with the current NAREIT definition or that interpret the current NAREIT definition differently than we do. From time to time, the Company may report or provide guidance with respect to “FFO, as adjusted,” which removes the impact of certain non-recurring and non-operating transactions or other items the Company does not consider to be representative of its core operating results, including, without limitation, (i) gains or losses associated with the early extinguishment of debt, (ii) gains or losses associated with litigation involving the Company that is not in the normal course of business, (iii) merger and acquisition costs, (iv) the impact on earnings from significant and non-recurring employee severance costs and recruiting expenses, including sign-on bonuses and search fees, (v) the excess of redemption value over carrying value of preferred stock redemption, and (vi) the impact of prior period bad debt or the collection of accounts receivable previously written off (“prior period collection impact”), which are not otherwise adjusted in the Company’s calculation of FFO. Core Funds from Operations Core Funds From Operations (“Core FFO”) is a non-GAAP financial measure of operating performance that modifies FFO for certain non-cash transactions that result in recording income or expense and impact the Company’s period-over-period performance, including (i) amortization of deferred financing costs, (ii) non-cash compensation expense and other, (iii) straight-line rent related to minimum rent and common area maintenance, (iv) market rent amortization income, and (v) amortization of debt discounts, premiums and hedge instruments, and includes adjustments related to our pro rata share from unconsolidated joint ventures for these categories as applicable. The Company believes that Core FFO is useful to investors in evaluating the core cash flow-generating operations of the Company by adjusting for items that we do not consider to be part of our core business operations, allowing for comparison of core operating performance of the Company between periods. Core FFO should not be considered as an alternative to net income as an indicator of the Company’s performance or as an alternative to cash flow as a measure of liquidity or the Company’s ability to make distributions. The Company’s computation of Core FFO may differ from the methodology for calculating Core FFO used by other REITs and, therefore, may not be comparable to such other REITs. Non-GAAP Financial Measures
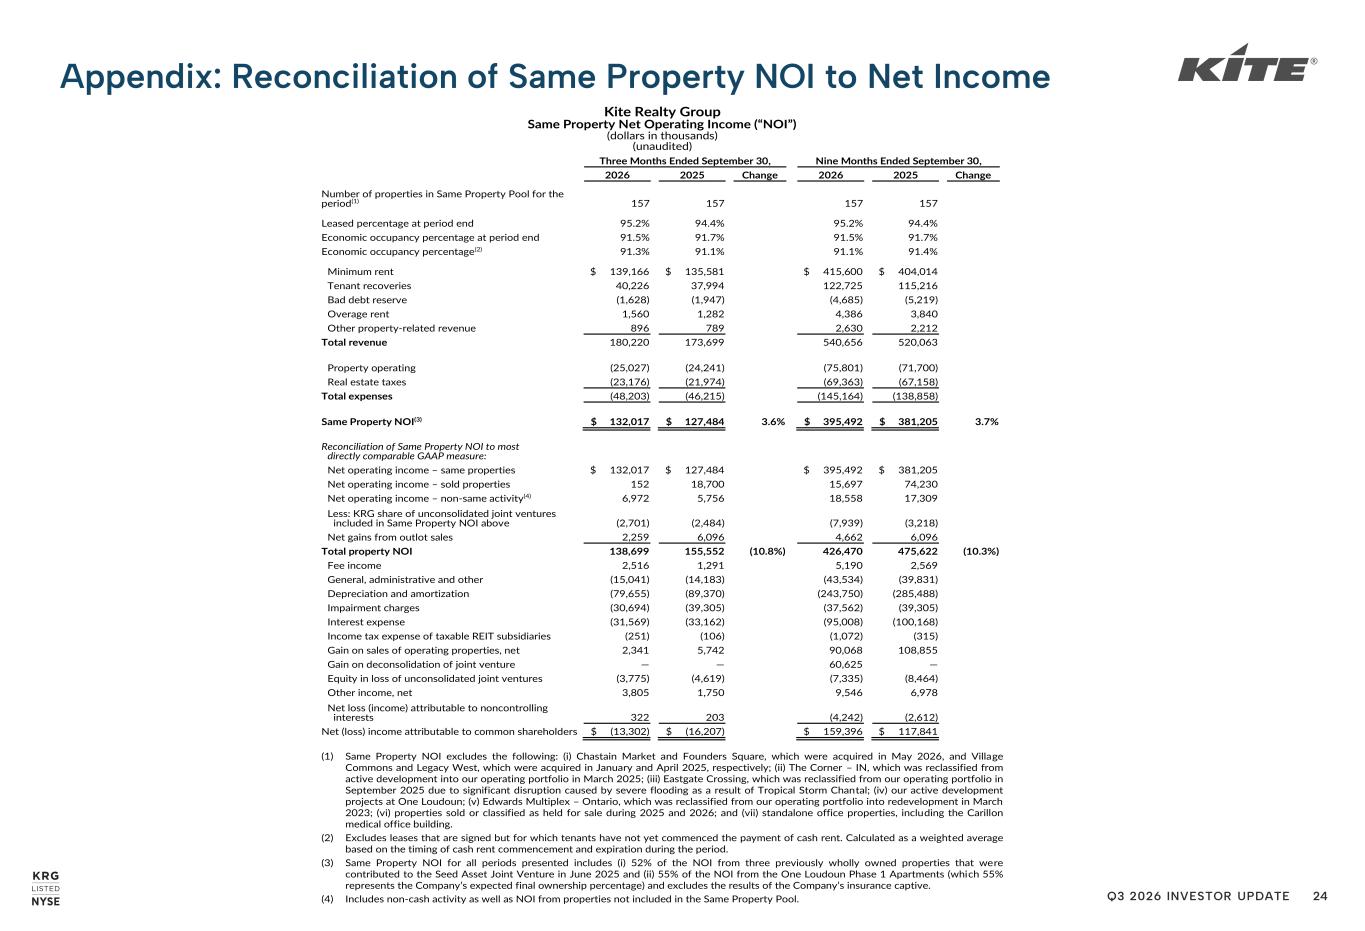
Q3 2026 INVESTOR UPDATE 24 Appendix: Reconciliation of Same Property NOI to Net Income Kite Realty Group Same Property Net Operating Income (“NOI”) (dollars in thousands) (unaudited) Three Months Ended September 30, Nine Months Ended September 30, 2026 2025 Change 2026 2025 Change Number of properties in Same Property Pool for the period(1) 157 157 157 157 Leased percentage at period end 95.2% 94.4% 95.2% 94.4% Economic occupancy percentage at period end 91.5% 91.7% 91.5% 91.7% Economic occupancy percentage(2) 91.3% 91.1% 91.1% 91.4% Minimum rent $ 139,166 $ 135,581 $ 415,600 $ 404,014 Tenant recoveries 40,226 37,994 122,725 115,216 Bad debt reserve (1,628) (1,947) (4,685) (5,219) Overage rent 1,560 1,282 4,386 3,840 Other property-related revenue 896 789 2,630 2,212 Total revenue 180,220 173,699 540,656 520,063 Property operating (25,027) (24,241) (75,801) (71,700) Real estate taxes (23,176) (21,974) (69,363) (67,158) Total expenses (48,203) (46,215) (145,164) (138,858) Same Property NOI(3) $ 132,017 $ 127,484 3.6% $ 395,492 $ 381,205 3.7% Reconciliation of Same Property NOI to most directly comparable GAAP measure: Net operating income – same properties $ 132,017 $ 127,484 $ 395,492 $ 381,205 Net operating income – sold properties 152 18,700 15,697 74,230 Net operating income – non-same activity(4) 6,972 5,756 18,558 17,309 Less: KRG share of unconsolidated joint ventures included in Same Property NOI above (2,701) (2,484) (7,939) (3,218) Net gains from outlot sales 2,259 6,096 4,662 6,096 Total property NOI 138,699 155,552 (10.8%) 426,470 475,622 (10.3%) Fee income 2,516 1,291 5,190 2,569 General, administrative and other (15,041) (14,183) (43,534) (39,831) Depreciation and amortization (79,655) (89,370) (243,750) (285,488) Impairment charges (30,694) (39,305) (37,562) (39,305) Interest expense (31,569) (33,162) (95,008) (100,168) Income tax expense of taxable REIT subsidiaries (251) (106) (1,072) (315) Gain on sales of operating properties, net 2,341 5,742 90,068 108,855 Gain on deconsolidation of joint venture — — 60,625 — Equity in loss of unconsolidated joint ventures (3,775) (4,619) (7,335) (8,464) Other income, net 3,805 1,750 9,546 6,978 Net loss (income) attributable to noncontrolling interests 322 203 (4,242) (2,612) Net (loss) income attributable to common shareholders $ (13,302) $ (16,207) $ 159,396 $ 117,841 (1) Same Property NOI excludes the following: (i) Chastain Market and Founders Square, which were acquired in May 2026, and Village Commons and Legacy West, which were acquired in January and April 2025, respectively; (ii) The Corner – IN, which was reclassified from active development into our operating portfolio in March 2025; (iii) Eastgate Crossing, which was reclassified from our operating portfolio in September 2025 due to significant disruption caused by severe flooding as a result of Tropical Storm Chantal; (iv) our active development projects at One Loudoun; (v) Edwards Multiplex – Ontario, which was reclassified from our operating portfolio into redevelopment in March 2023; (vi) properties sold or classified as held for sale during 2025 and 2026; and (vii) standalone office properties, including the Carillon medical office building. (2) Excludes leases that are signed but for which tenants have not yet commenced the payment of cash rent. Calculated as a weighted average based on the timing of cash rent commencement and expiration during the period. (3) Same Property NOI for all periods presented includes (i) 52% of the NOI from three previously wholly owned properties that were contributed to the Seed Asset Joint Venture in June 2025 and (ii) 55% of the NOI from the One Loudoun Phase 1 Apartments (which 55% represents the Company’s expected final ownership percentage) and excludes the results of the Company’s insurance captive. (4) Includes non-cash activity as well as NOI from properties not included in the Same Property Pool.
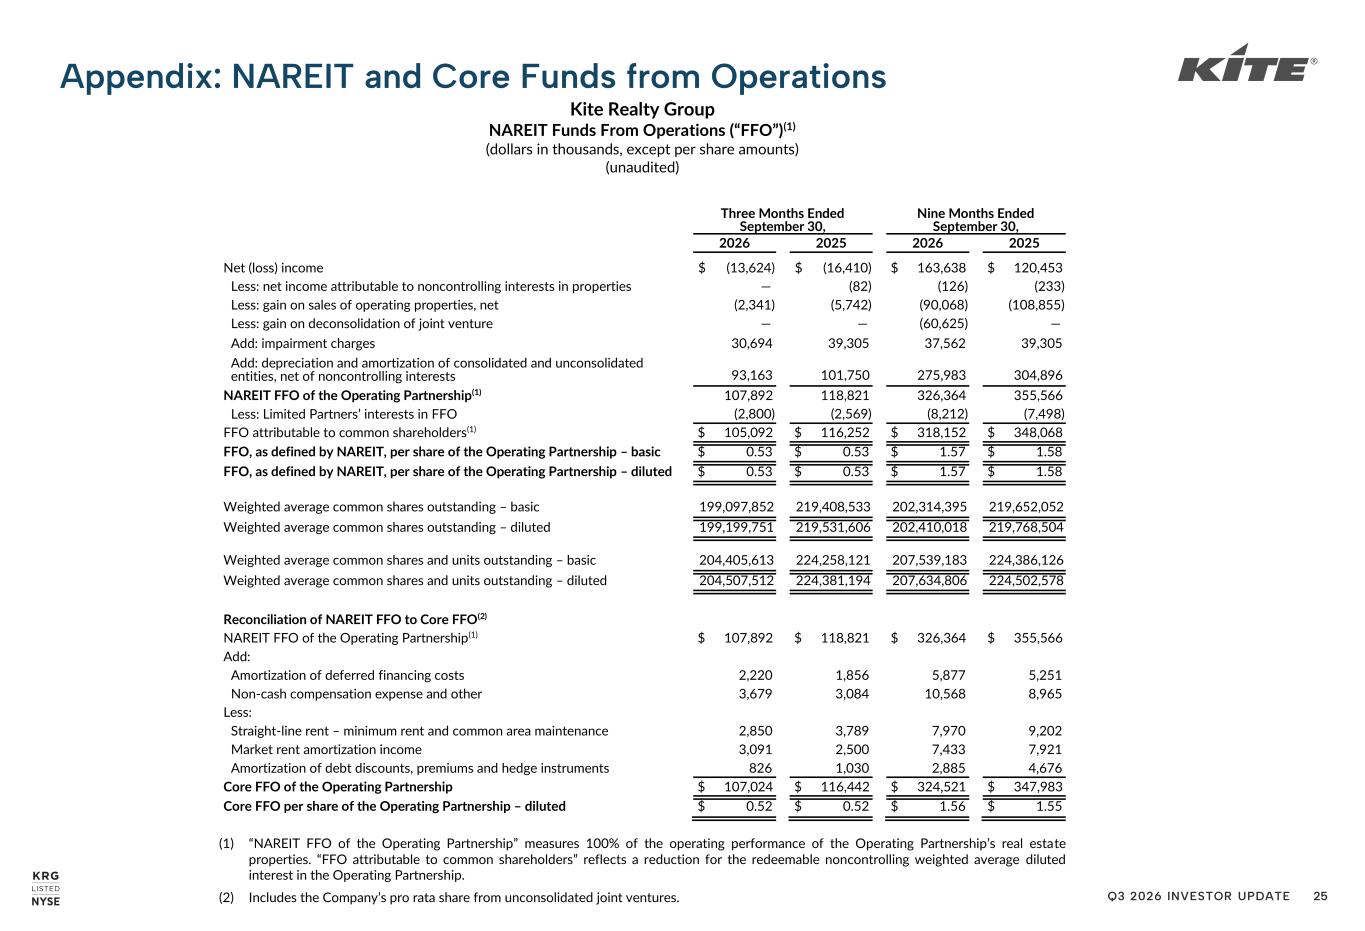
Q3 2026 INVESTOR UPDATE 25 Appendix: NAREIT and Core Funds from Operations Kite Realty Group NAREIT Funds From Operations (“FFO”)(1) (dollars in thousands, except per share amounts) (unaudited) Three Months Ended September 30, Nine Months Ended September 30, 2026 2025 2026 2025 Net (loss) income $ (13,624) $ (16,410) $ 163,638 $ 120,453 Less: net income attributable to noncontrolling interests in properties — (82) (126) (233) Less: gain on sales of operating properties, net (2,341) (5,742) (90,068) (108,855) Less: gain on deconsolidation of joint venture — — (60,625) — Add: impairment charges 30,694 39,305 37,562 39,305 Add: depreciation and amortization of consolidated and unconsolidated entities, net of noncontrolling interests 93,163 101,750 275,983 304,896 NAREIT FFO of the Operating Partnership(1) 107,892 118,821 326,364 355,566 Less: Limited Partners’ interests in FFO (2,800) (2,569) (8,212) (7,498) FFO attributable to common shareholders(1) $ 105,092 $ 116,252 $ 318,152 $ 348,068 FFO, as defined by NAREIT, per share of the Operating Partnership – basic $ 0.53 $ 0.53 $ 1.57 $ 1.58 FFO, as defined by NAREIT, per share of the Operating Partnership – diluted $ 0.53 $ 0.53 $ 1.57 $ 1.58 Weighted average common shares outstanding – basic 199,097,852 219,408,533 202,314,395 219,652,052 Weighted average common shares outstanding – diluted 199,199,751 219,531,606 202,410,018 219,768,504 Weighted average common shares and units outstanding – basic 204,405,613 224,258,121 207,539,183 224,386,126 Weighted average common shares and units outstanding – diluted 204,507,512 224,381,194 207,634,806 224,502,578 Reconciliation of NAREIT FFO to Core FFO(2) NAREIT FFO of the Operating Partnership(1) $ 107,892 $ 118,821 $ 326,364 $ 355,566 Add: Amortization of deferred financing costs 2,220 1,856 5,877 5,251 Non-cash compensation expense and other 3,679 3,084 10,568 8,965 Less: Straight-line rent – minimum rent and common area maintenance 2,850 3,789 7,970 9,202 Market rent amortization income 3,091 2,500 7,433 7,921 Amortization of debt discounts, premiums and hedge instruments 826 1,030 2,885 4,676 Core FFO of the Operating Partnership $ 107,024 $ 116,442 $ 324,521 $ 347,983 Core FFO per share of the Operating Partnership – diluted $ 0.52 $ 0.52 $ 1.56 $ 1.55 (1) “NAREIT FFO of the Operating Partnership” measures 100% of the operating performance of the Operating Partnership’s real estate properties. “FFO attributable to common shareholders” reflects a reduction for the redeemable noncontrolling weighted average diluted interest in the Operating Partnership. (2) Includes the Company’s pro rata share from unconsolidated joint ventures.
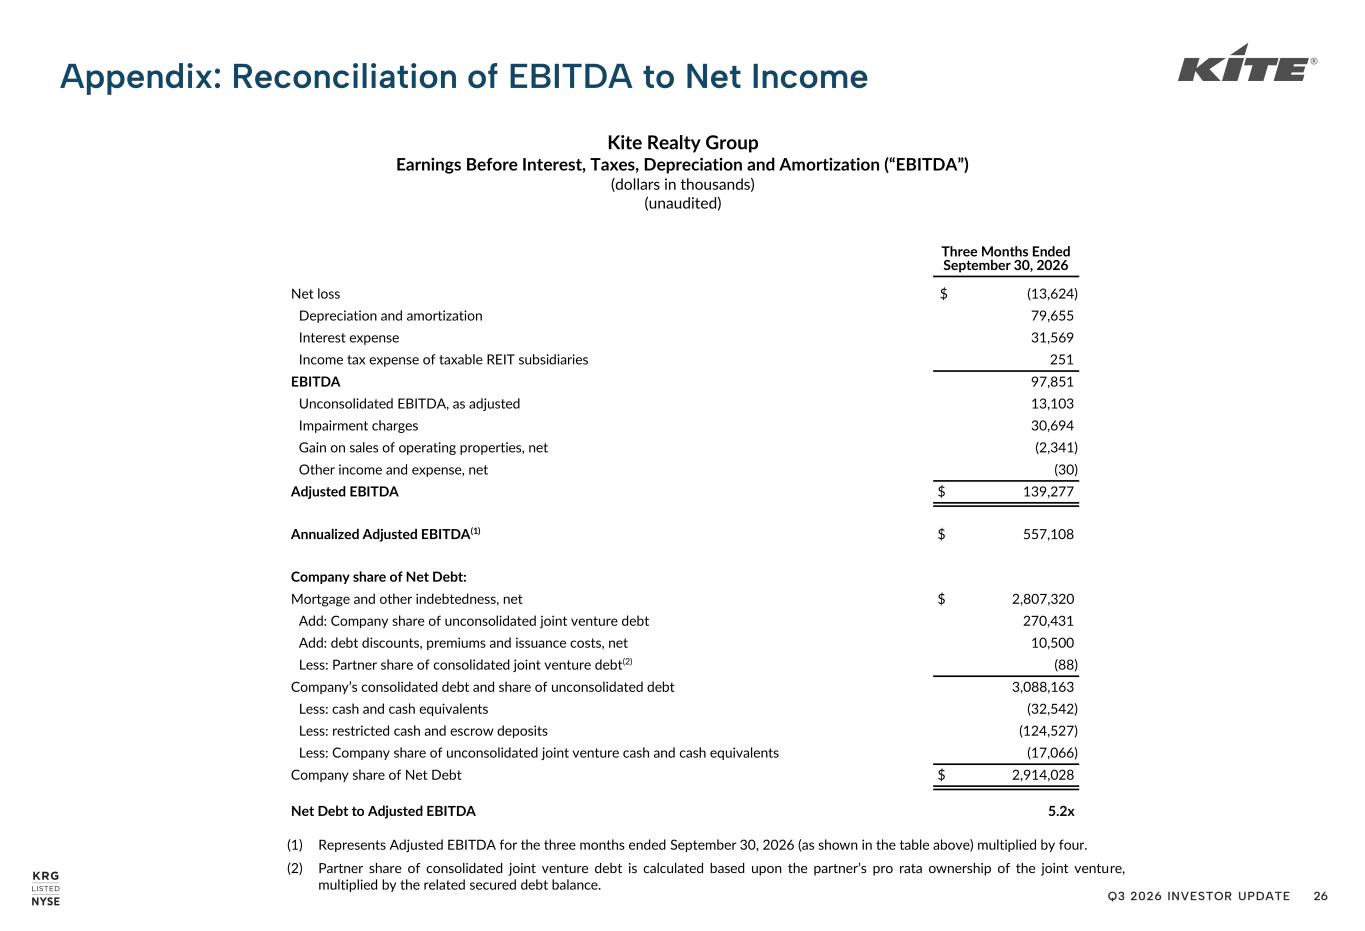
Q3 2026 INVESTOR UPDATE 26 Appendix: Reconciliation of EBITDA to Net Income Kite Realty Group Earnings Before Interest, Taxes, Depreciation and Amortization (“EBITDA”) (dollars in thousands) (unaudited) Three Months Ended September 30, 2026 Net loss $ (13,624) Depreciation and amortization 79,655 Interest expense 31,569 Income tax expense of taxable REIT subsidiaries 251 EBITDA 97,851 Unconsolidated EBITDA, as adjusted 13,103 Impairment charges 30,694 Gain on sales of operating properties, net (2,341) Other income and expense, net (30) Adjusted EBITDA $ 139,277 Annualized Adjusted EBITDA(1) $ 557,108 Company share of Net Debt: Mortgage and other indebtedness, net $ 2,807,320 Add: Company share of unconsolidated joint venture debt 270,431 Add: debt discounts, premiums and issuance costs, net 10,500 Less: Partner share of consolidated joint venture debt(2) (88) Company’s consolidated debt and share of unconsolidated debt 3,088,163 Less: cash and cash equivalents (32,542) Less: restricted cash and escrow deposits (124,527) Less: Company share of unconsolidated joint venture cash and cash equivalents (17,066) Company share of Net Debt $ 2,914,028 Net Debt to Adjusted EBITDA 5.2x (1) Represents Adjusted EBITDA for the three months ended September 30, 2026 (as shown in the table above) multiplied by four. (2) Partner share of consolidated joint venture debt is calculated based upon the partner’s pro rata ownership of the joint venture, multiplied by the related secured debt balance.