
Third Quarter 2026 NASDAQ: MRBK Earnings Supplement October 30, 2026
FORWARD-LOOKING STATEMENTS Meridian Corporation (the “Corporation”) may from time to time make written or oral “forward-looking statements” within the meaning of the “safe harbor” provisions of the Private Securities Litigation Reform Act of 1995. These forward-looking statements include statements with respect to Meridian Corporation’s strategies, goals, beliefs, expectations, estimates, intentions, capital raising efforts, financial condition and results of operations, future performance and business. Statements preceded by, followed by, or that include the words “may,” “could,” “should,” “pro forma,” “looking forward,” “would,” “believe,” “expect,” “anticipate,” “estimate,” “intend,” “plan,” "forecasted", or similar expressions generally indicate a forward-looking statement. These forward-looking statements involve risks and uncertainties that are subject to change based on various important factors (some of which, in whole or in part, are beyond Meridian Corporation’s control). Numerous competitive, economic, regulatory, legal and technological factors, risks and uncertainties that could cause actual results to differ materially include, without limitation, credit losses and the credit risk of our commercial and consumer loan products; changes in the level of charge-offs and changes in estimates of the adequacy of the allowance for credit losses, or ACL, including the timing of third-party appraisals and loan valuations from lead financial institutions in which we are a loan participant; cyber-security concerns; rapid technological developments and changes, including the development and use of artificial intelligence in business processes, services, and products; increased competitive pressures; changes in spreads on interest-earning assets and interest-bearing liabilities; changes in general economic conditions and conditions within the securities markets; escalating tariff and other trade policies and the resulting impacts on market volatility and global trade; the impact of uncertain or changing political conditions or any current or future federal government shutdown and uncertainty regarding the federal government's debt limit, geopolitical conditions, including acts or threats of terrorism, actions taken by the United States or other governments in response to acts or threats of terrorism and military conflicts, including the ongoing conflict in the Middle East, which could impact economic conditions in the United States; unanticipated changes in our liquidity position; unanticipated changes in regulatory and governmental policies impacting interest rates and financial markets; legislation affecting the financial services industry as a whole, and Meridian Corporation, in particular; changes in accounting policies, practices or guidance; developments affecting the industry and the soundness of financial institutions and further disruption to the economy and U.S. banking system; among others, could cause Meridian Corporation’s financial performance to differ materially from the goals, plans, objectives, intentions and expectations expressed in such forward-looking statements. Meridian Corporation cautions that the foregoing factors are not exclusive, and neither such factors nor any such forward-looking statement takes into account the impact of any future events. All forward-looking statements and information set forth herein are based on management’s current beliefs and assumptions as of the date hereof and speak only as of the date they are made. For a more complete discussion of the assumptions, risks and uncertainties related to our business, you are encouraged to review the Corporation’s filings with the Securities and Exchange Commission, including our Annual Report on Form 10-K for the year ended December 31, 2025 and subsequently filed quarterly reports on Form 10-Q and current reports on Form 8-K that update or provide information in addition to the information included in the Form 10-K and Form 10-Q filings, if any. The Corporation does not undertake to update any forward-looking statement whether written or oral, that may be made from time to time by the Corporation or by or on behalf of Meridian Bank, except as may be required under applicable laws. Meridian Corporation 2
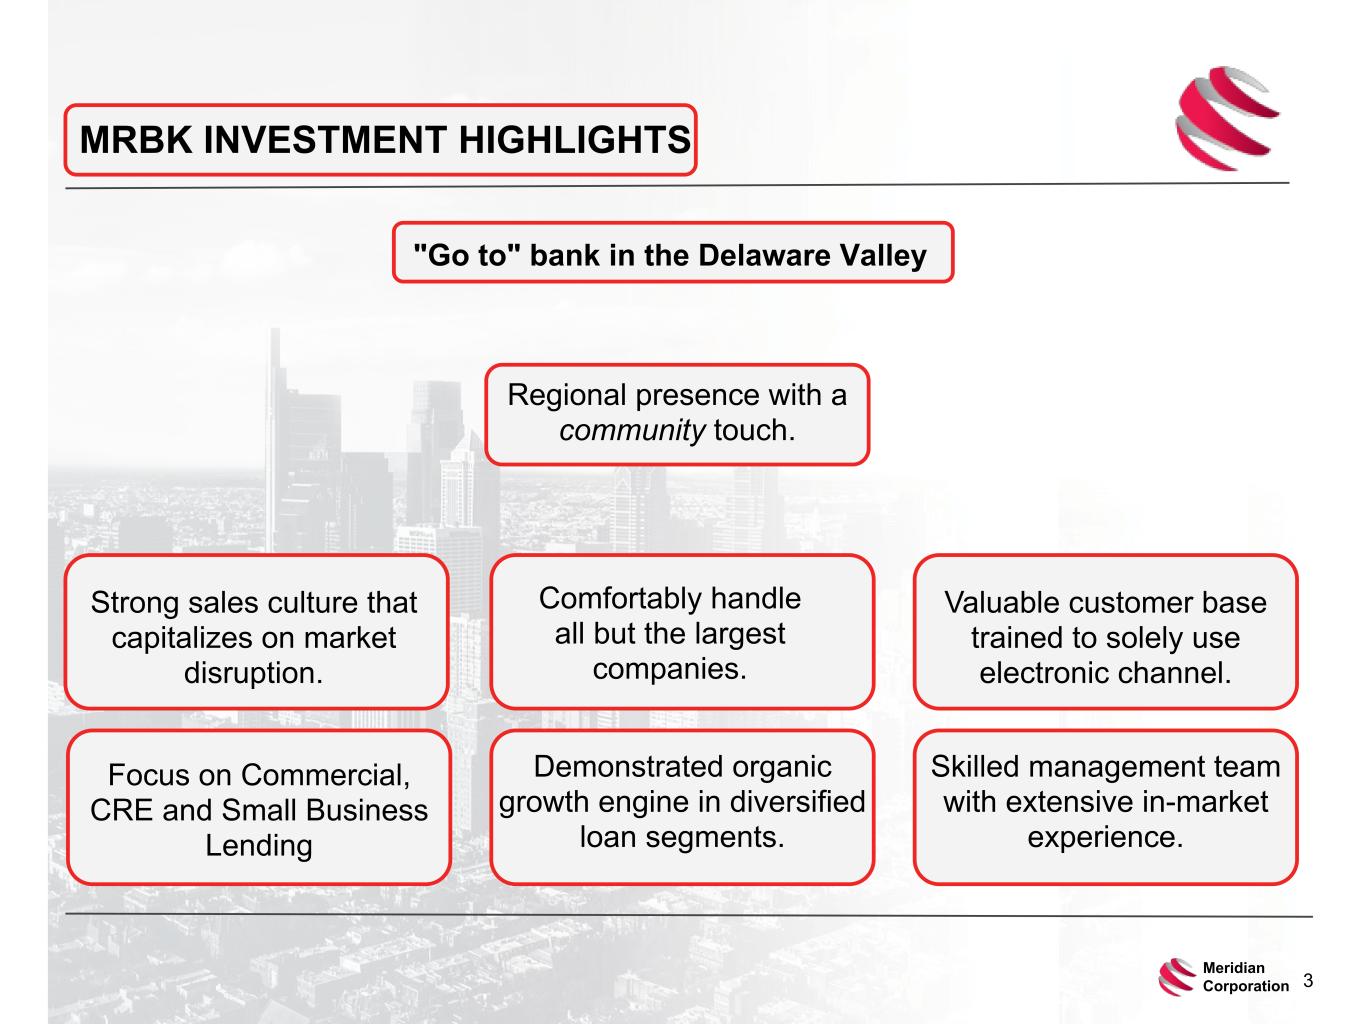
MRBK INVESTMENT HIGHLIGHTS Regional presence with a community touch. "Go to" bank in the Delaware Valley Demonstrated organic growth engine in diversified loan segments. Focus on Commercial, CRE and Small Business Lending Valuable customer base trained to solely use electronic channel. Strong sales culture that capitalizes on market disruption. Skilled management team with extensive in-market experience. Comfortably handle all but the largest companies. Meridian Corporation 3
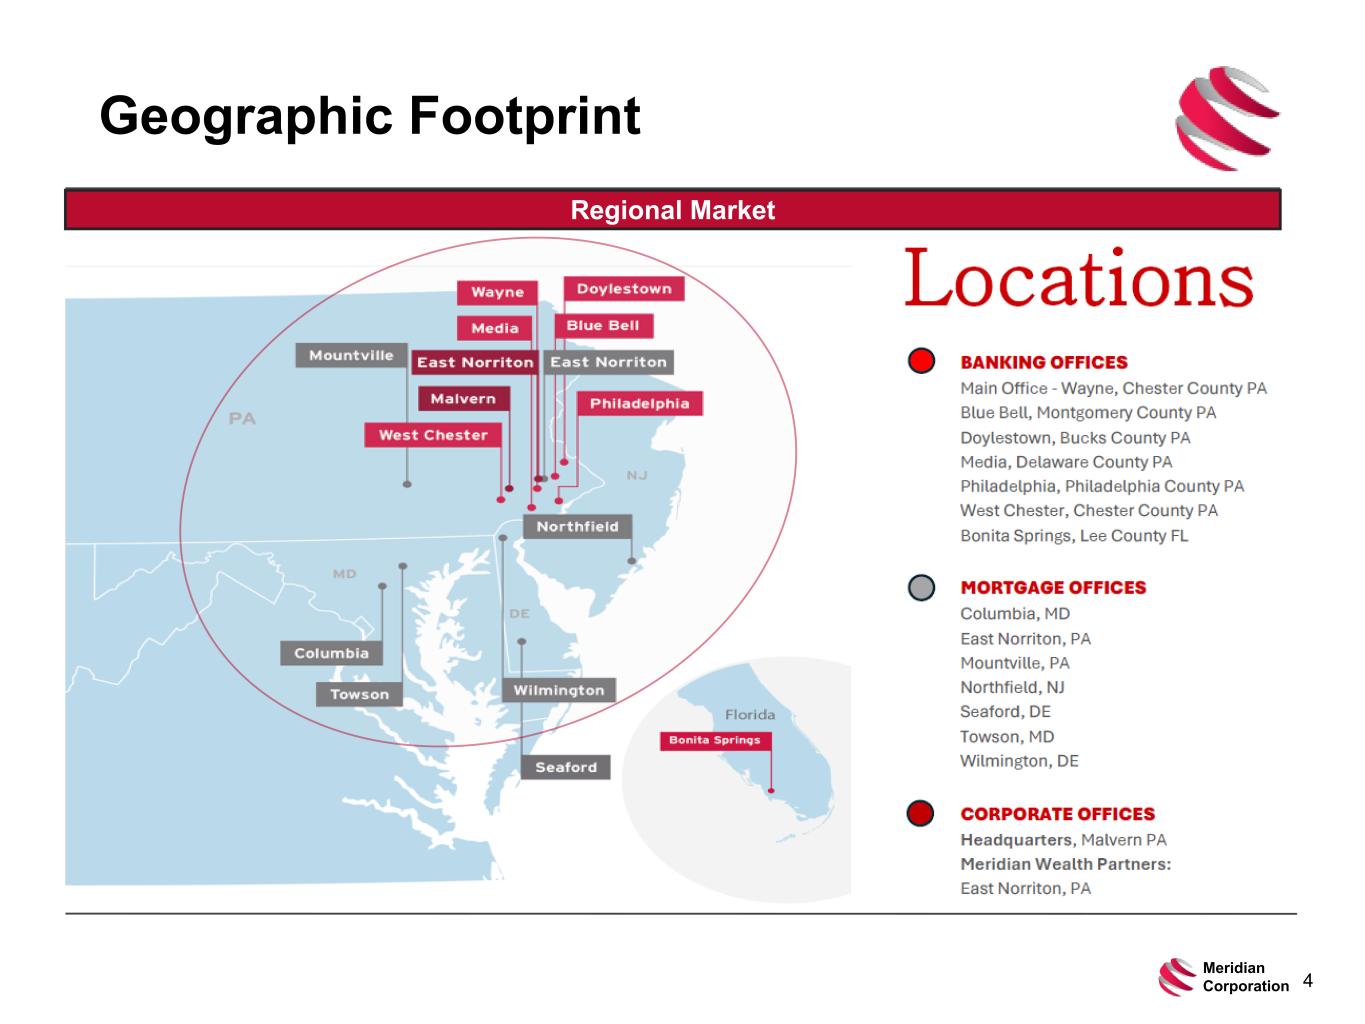
Geographic Footprint Regional Market Meridian Corporation 4
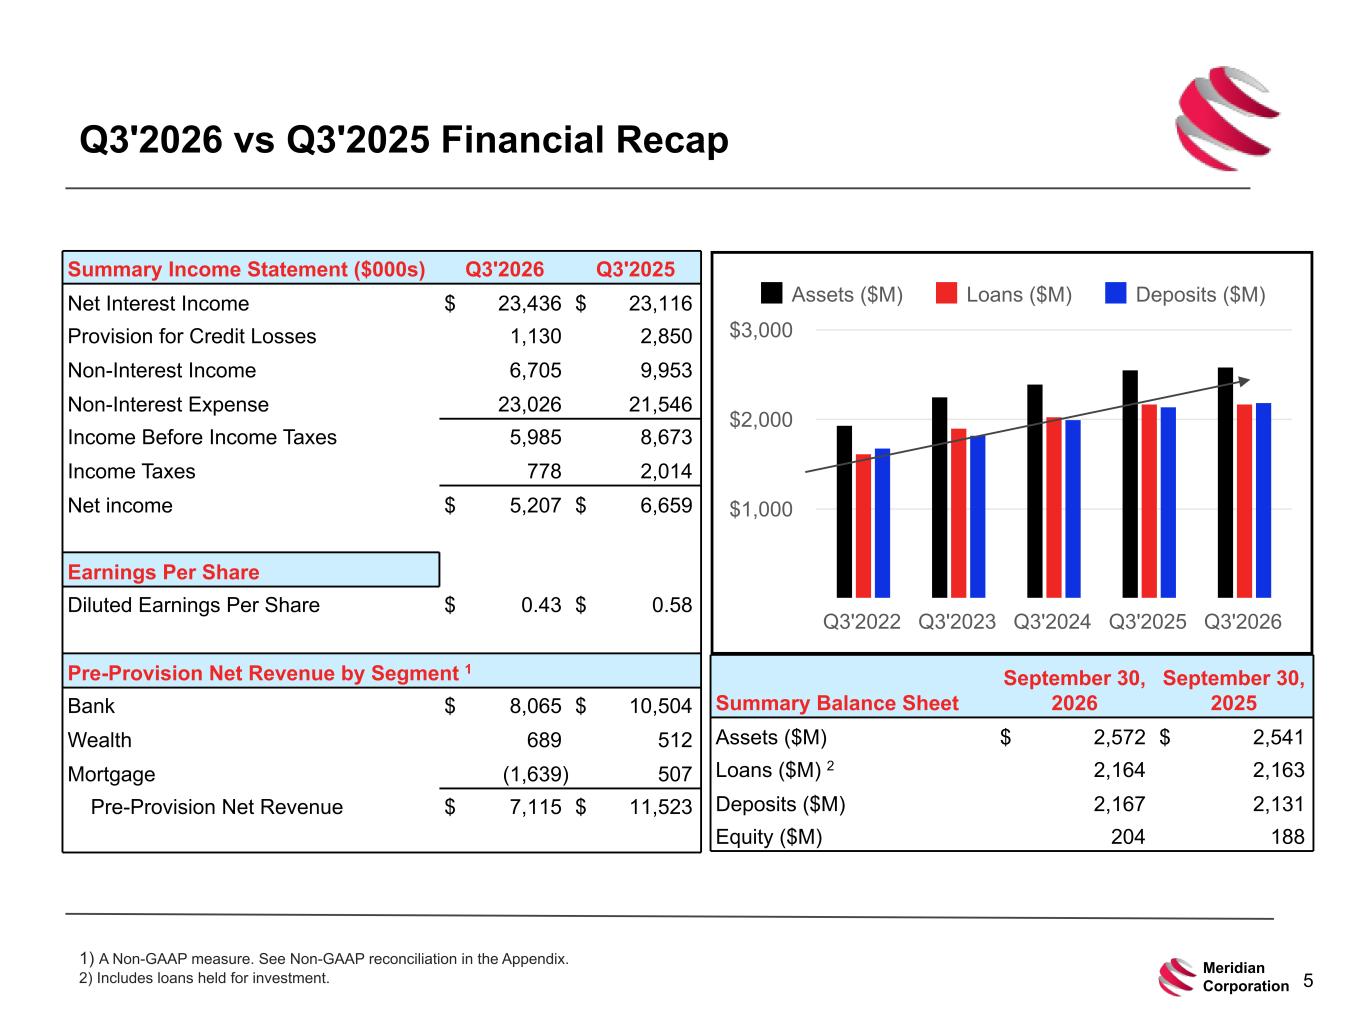
Q3'2026 vs Q3'2025 Financial Recap Summary Income Statement ($000s) Q3'2026 Q3'2025 Net Interest Income $ 23,436 $ 23,116 Provision for Credit Losses 1,130 2,850 Non-Interest Income 6,705 9,953 Non-Interest Expense 23,026 21,546 Income Before Income Taxes 5,985 8,673 Income Taxes 778 2,014 Net income $ 5,207 $ 6,659 Earnings Per Share Diluted Earnings Per Share $ 0.43 $ 0.58 Pre-Provision Net Revenue by Segment 1 Bank $ 8,065 $ 10,504 Wealth 689 512 Mortgage (1,639) 507 Pre-Provision Net Revenue $ 7,115 $ 11,523 Assets ($M) Loans ($M) Deposits ($M) Q3'2022 Q3'2023 Q3'2024 Q3'2025 Q3'2026 $1,000 $2,000 $3,000 Summary Balance Sheet September 30, 2026 September 30, 2025 Assets ($M) $ 2,572 $ 2,541 Loans ($M) 2 2,164 2,163 Deposits ($M) 2,167 2,131 Equity ($M) 204 188 1) A Non-GAAP measure. See Non-GAAP reconciliation in the Appendix. 2) Includes loans held for investment. Meridian Corporation 5
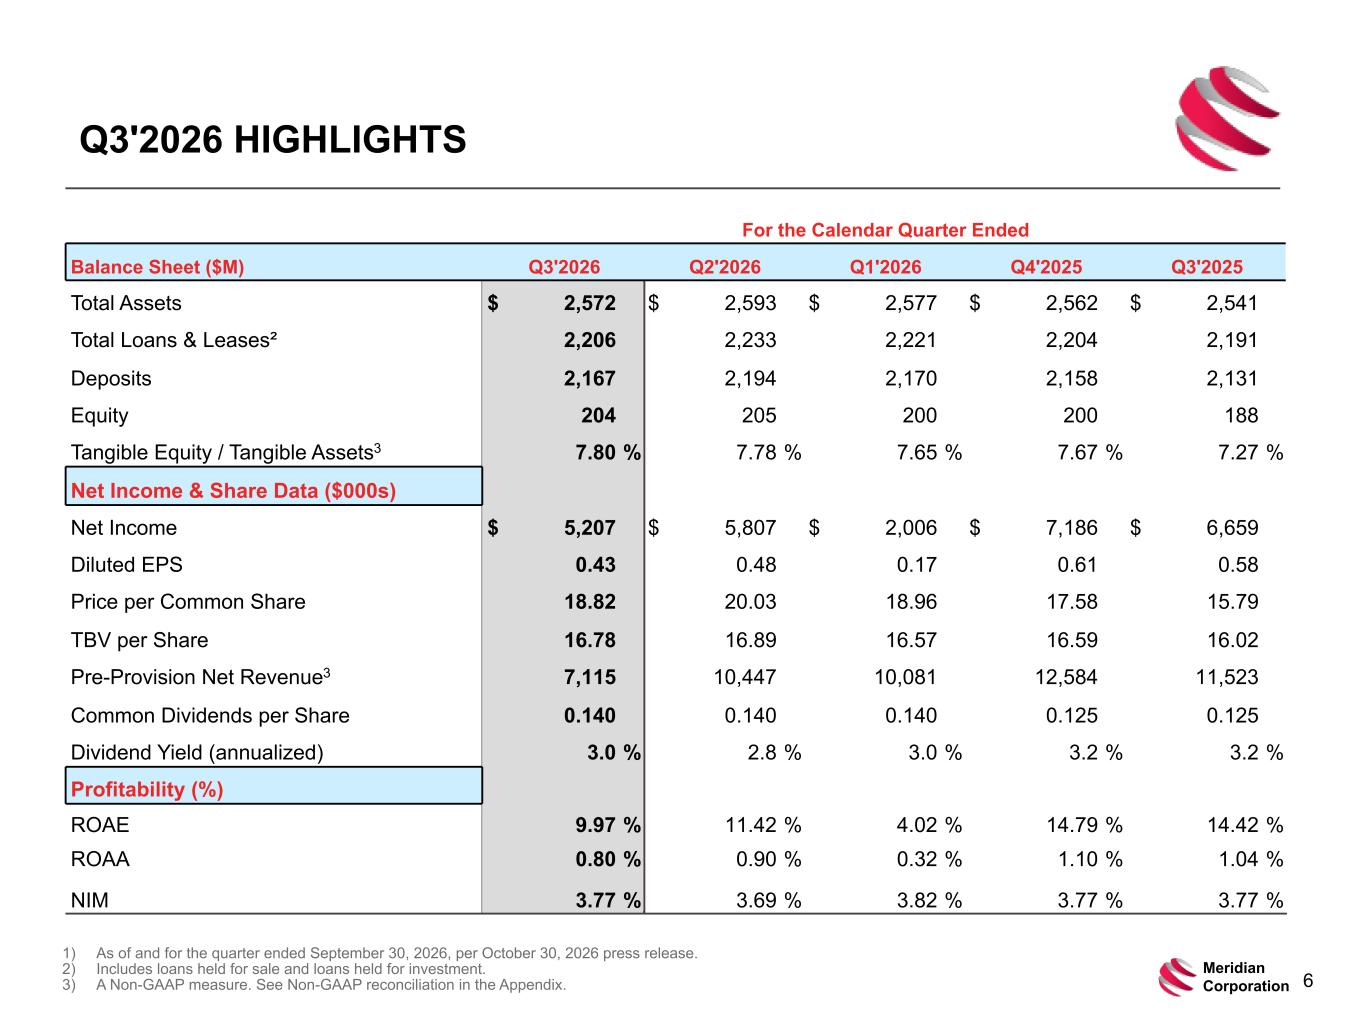
For the Calendar Quarter Ended Balance Sheet ($M) Q3'2026 Q2'2026 Q1'2026 Q4'2025 Q3'2025 Total Assets $ 2,572 $ 2,593 $ 2,577 $ 2,562 $ 2,541 Total Loans & Leases² 2,206 2,233 2,221 2,204 2,191 Deposits 2,167 2,194 2,170 2,158 2,131 Equity 204 205 200 200 188 Tangible Equity / Tangible Assets3 7.80 % 7.78 % 7.65 % 7.67 % 7.27 % Net Income & Share Data ($000s) Net Income $ 5,207 $ 5,807 $ 2,006 $ 7,186 $ 6,659 Diluted EPS 0.43 0.48 0.17 0.61 0.58 Price per Common Share 18.82 20.03 18.96 17.58 15.79 TBV per Share 16.78 16.89 16.57 16.59 16.02 Pre-Provision Net Revenue3 7,115 10,447 10,081 12,584 11,523 Common Dividends per Share 0.140 0.140 0.140 0.125 0.125 Dividend Yield (annualized) 3.0 % 2.8 % 3.0 % 3.2 % 3.2 % Profitability (%) ROAE 9.97 % 11.42 % 4.02 % 14.79 % 14.42 % ROAA 0.80 % 0.90 % 0.32 % 1.10 % 1.04 % NIM 3.77 % 3.69 % 3.82 % 3.77 % 3.77 % Q3'2026 HIGHLIGHTS 1) As of and for the quarter ended September 30, 2026, per October 30, 2026 press release. 2) Includes loans held for sale and loans held for investment. 3) A Non-GAAP measure. See Non-GAAP reconciliation in the Appendix. Meridian Corporation 6
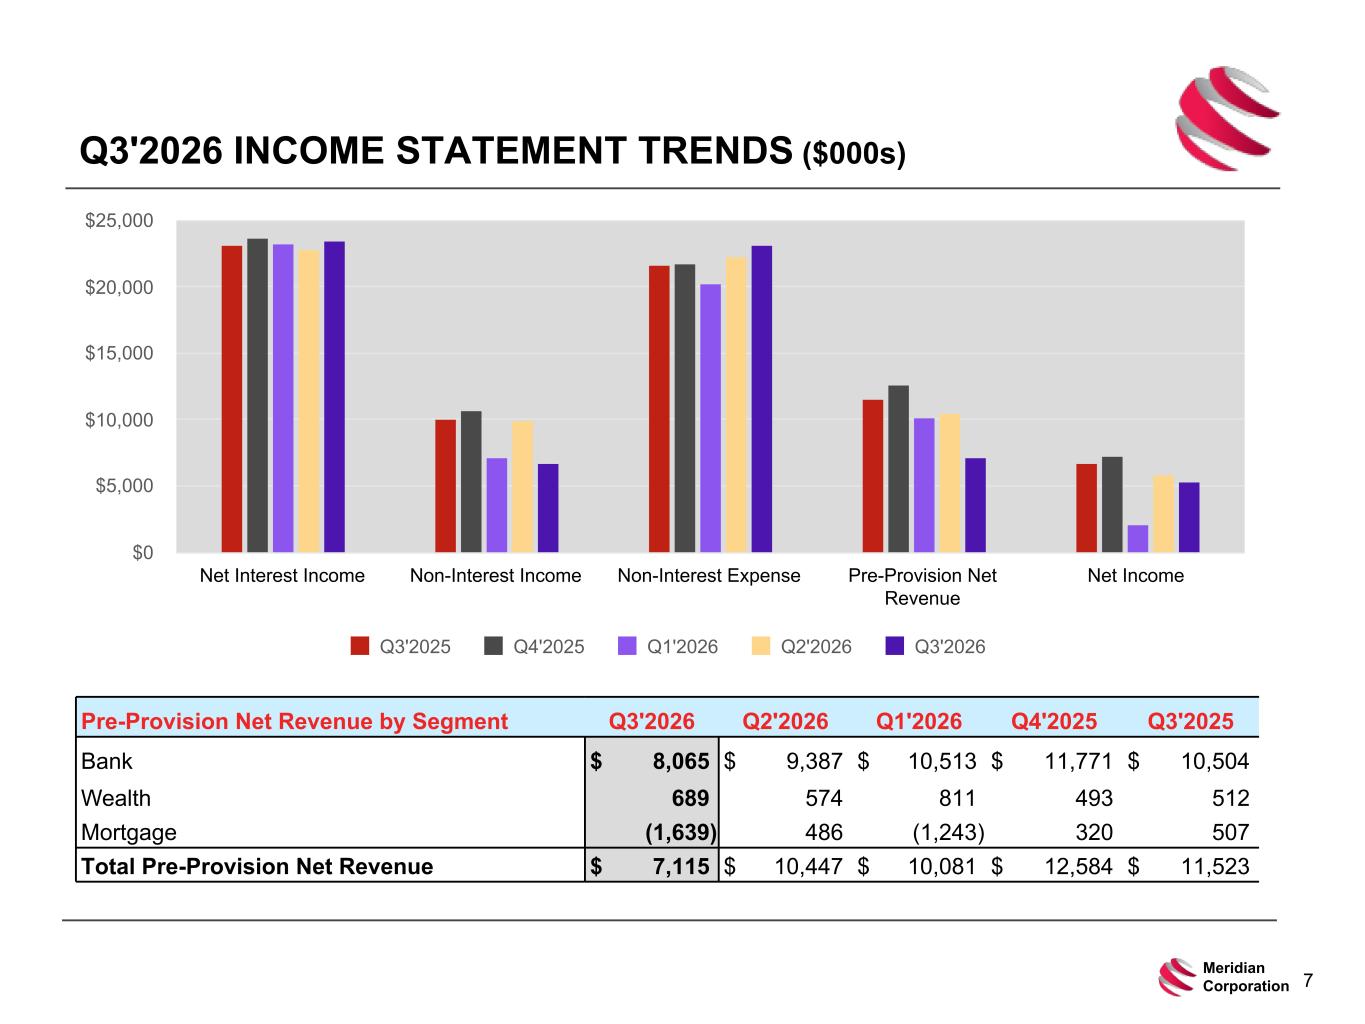
Q3'2026 INCOME STATEMENT TRENDS ($000s) Pre-Provision Net Revenue by Segment Q3'2026 Q2'2026 Q1'2026 Q4'2025 Q3'2025 Bank $ 8,065 $ 9,387 $ 10,513 $ 11,771 $ 10,504 Wealth 689 574 811 493 512 Mortgage (1,639) 486 (1,243) 320 507 Total Pre-Provision Net Revenue $ 7,115 $ 10,447 $ 10,081 $ 12,584 $ 11,523 Q3'2025 Q4'2025 Q1'2026 Q2'2026 Q3'2026 Net Interest Income Non-Interest Income Non-Interest Expense Pre-Provision Net Revenue Net Income $0 $5,000 $10,000 $15,000 $20,000 $25,000 Meridian Corporation 7
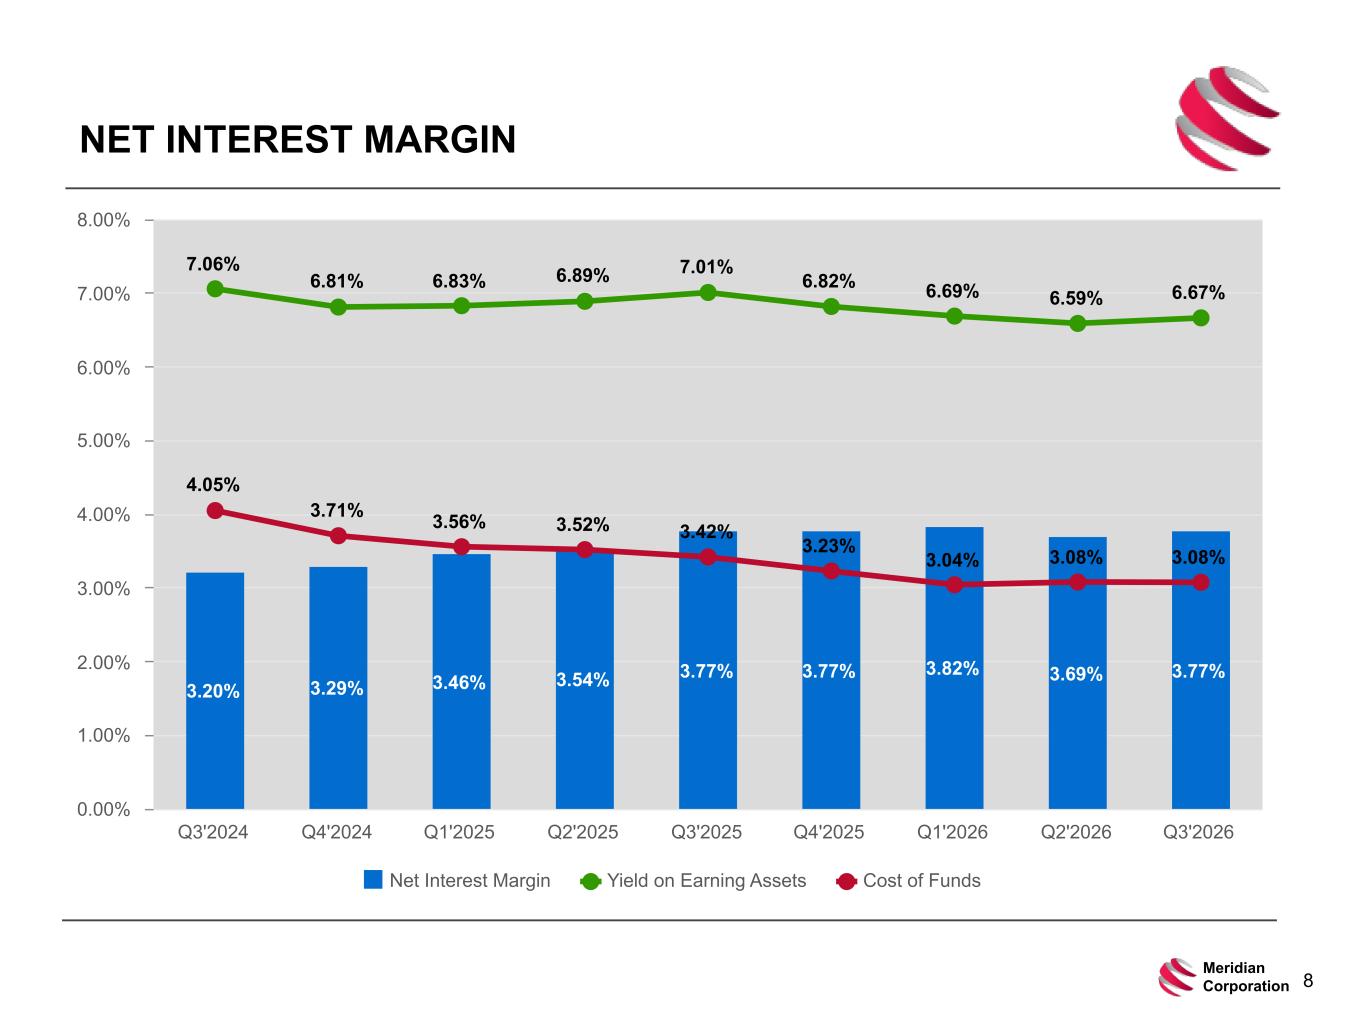
NET INTEREST MARGIN 3.20% 3.29% 3.46% 3.54% 3.77% 3.77% 3.82% 3.69% 3.77% 7.06% 6.81% 6.83% 6.89% 7.01% 6.82% 6.69% 6.59% 6.67% 4.05% 3.71% 3.56% 3.52% 3.42% 3.23% 3.04% 3.08% 3.08% Net Interest Margin Yield on Earning Assets Cost of Funds Q3'2024 Q4'2024 Q1'2025 Q2'2025 Q3'2025 Q4'2025 Q1'2026 Q2'2026 Q3'2026 0.00% 1.00% 2.00% 3.00% 4.00% 5.00% 6.00% 7.00% 8.00% Meridian Corporation 8
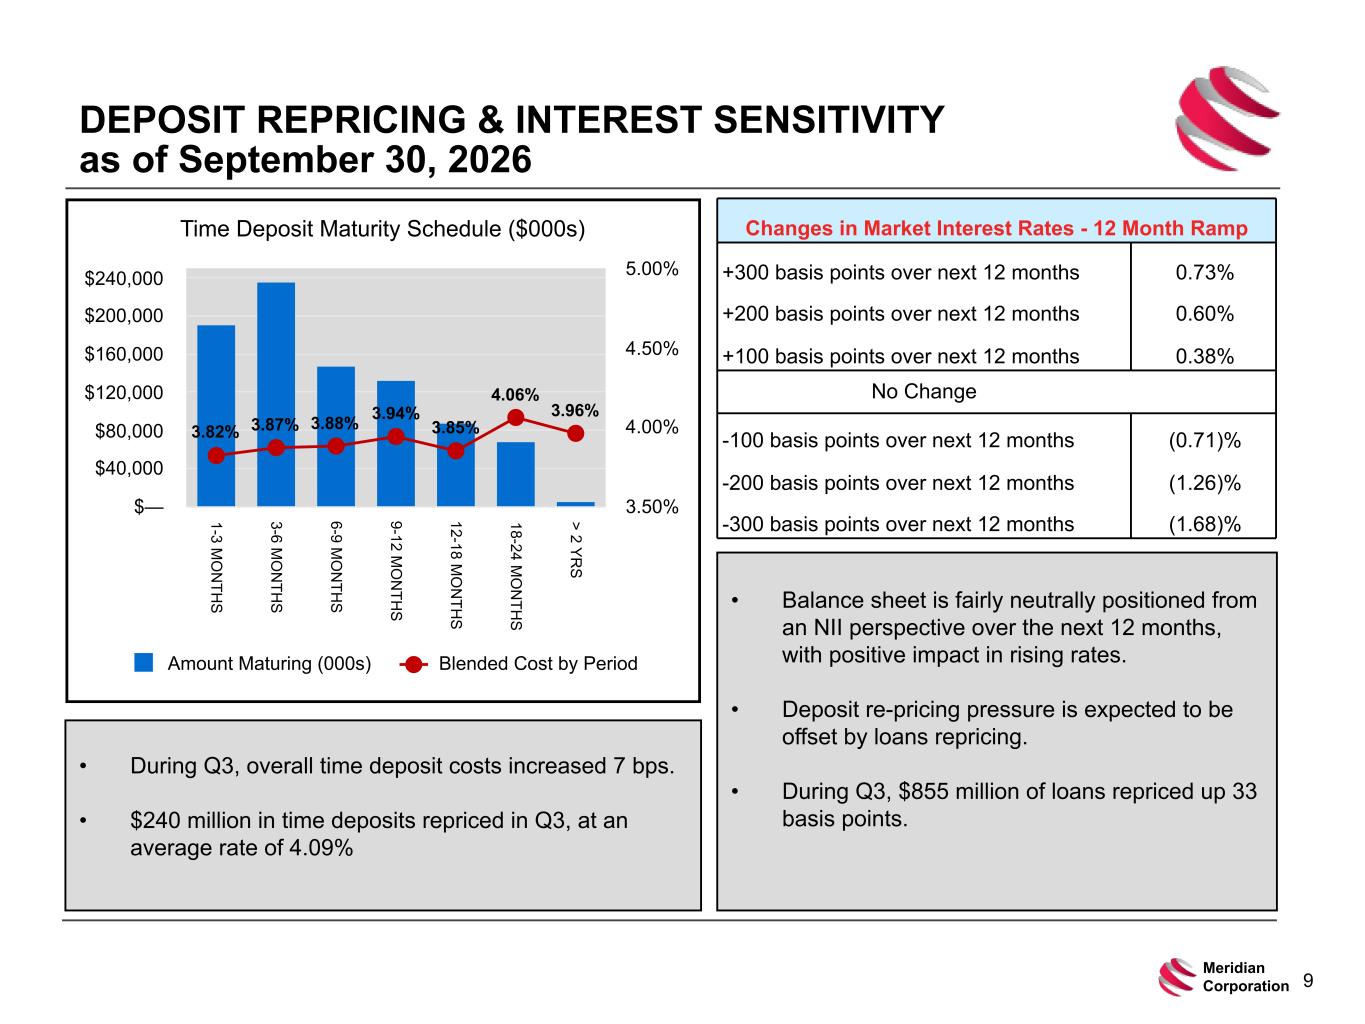
DEPOSIT REPRICING & INTEREST SENSITIVITY as of September 30, 2026 • During Q3, overall time deposit costs increased 7 bps. • $240 million in time deposits repriced in Q3, at an average rate of 4.09% Meridian Corporation 9 Time Deposit Maturity Schedule ($000s) 3.82% 3.87% 3.88% 3.94% 3.85% 4.06% 3.96% Amount Maturing (000s) Blended Cost by Period 1-3 M O N TH S 3-6 M O N TH S 6-9 M O N TH S 9-12 M O N TH S 12-18 M O N TH S 18-24 M O N TH S > 2 Y R S $— $40,000 $80,000 $120,000 $160,000 $200,000 $240,000 3.50% 4.00% 4.50% 5.00% Changes in Market Interest Rates - 12 Month Ramp +300 basis points over next 12 months 0.73% +200 basis points over next 12 months 0.60% +100 basis points over next 12 months 0.38% No Change -100 basis points over next 12 months (0.71)% -200 basis points over next 12 months (1.26)% -300 basis points over next 12 months (1.68)% • Balance sheet is fairly neutrally positioned from an NII perspective over the next 12 months, with positive impact in rising rates. • Deposit re-pricing pressure is expected to be offset by loans repricing. • During Q3, $855 million of loans repriced up 33 basis points.
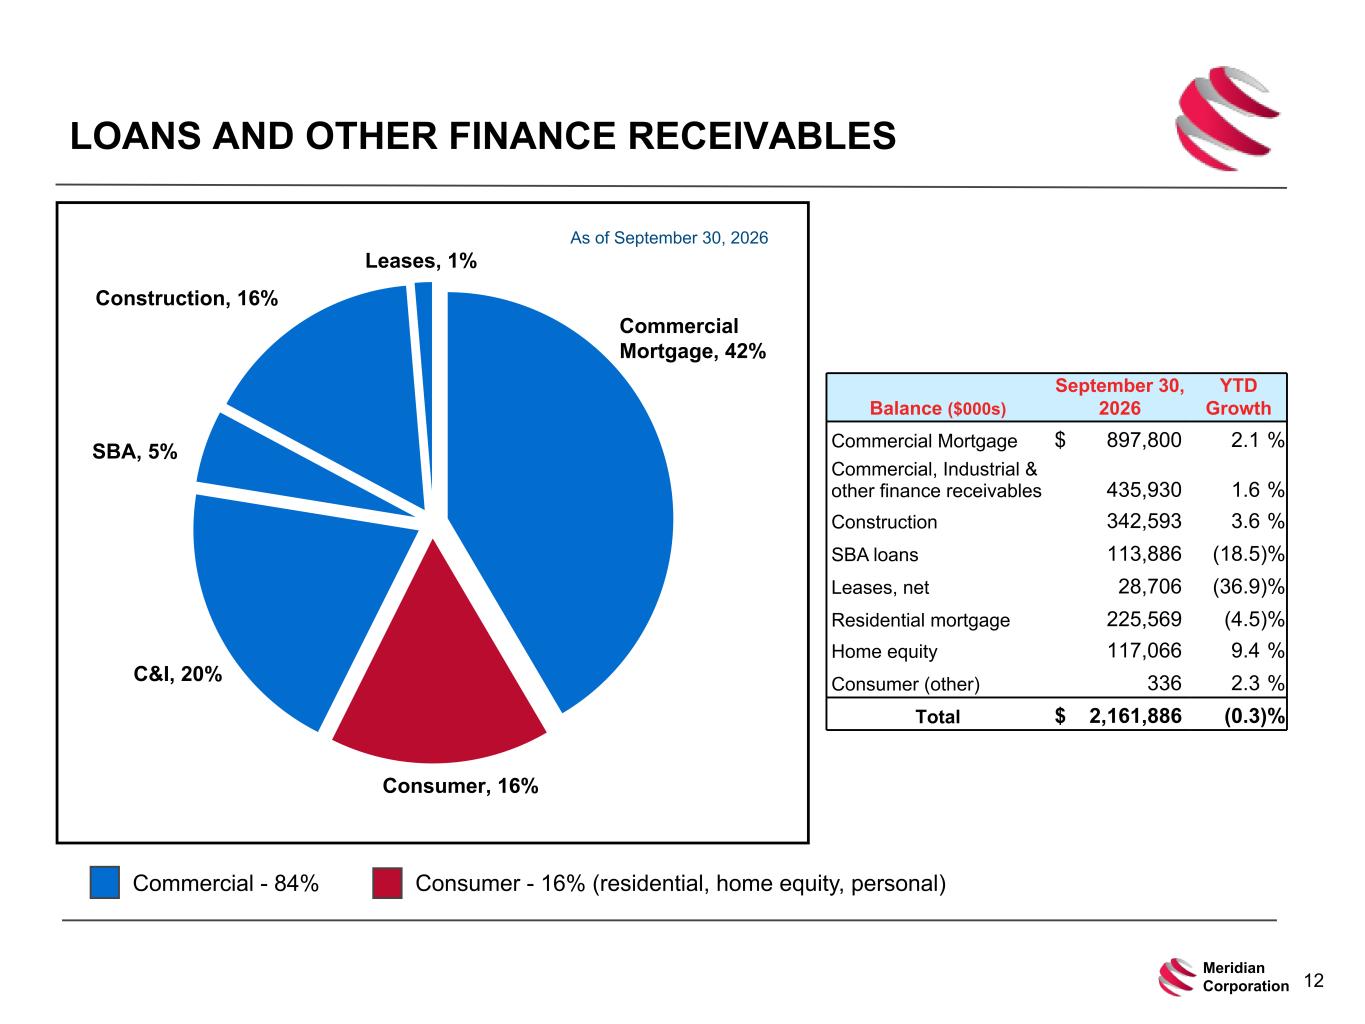
LOANS AND OTHER FINANCE RECEIVABLES Balance ($000s) September 30, 2026 YTD Growth Commercial Mortgage $ 897,800 2.1 % Commercial, Industrial & other finance receivables 435,930 1.6 % Construction 342,593 3.6 % SBA loans 113,886 (18.5) % Leases, net 28,706 (36.9) % Residential mortgage 225,569 (4.5) % Home equity 117,066 9.4 % Consumer (other) 336 2.3 % Total $ 2,161,886 (0.3) % Commercial Mortgage, 42% Consumer, 16% C&I, 20% SBA, 5% Construction, 16% Leases, 1% Commercial - 84% Consumer - 16% (residential, home equity, personal) Meridian Corporation 12 As of September 30, 2026
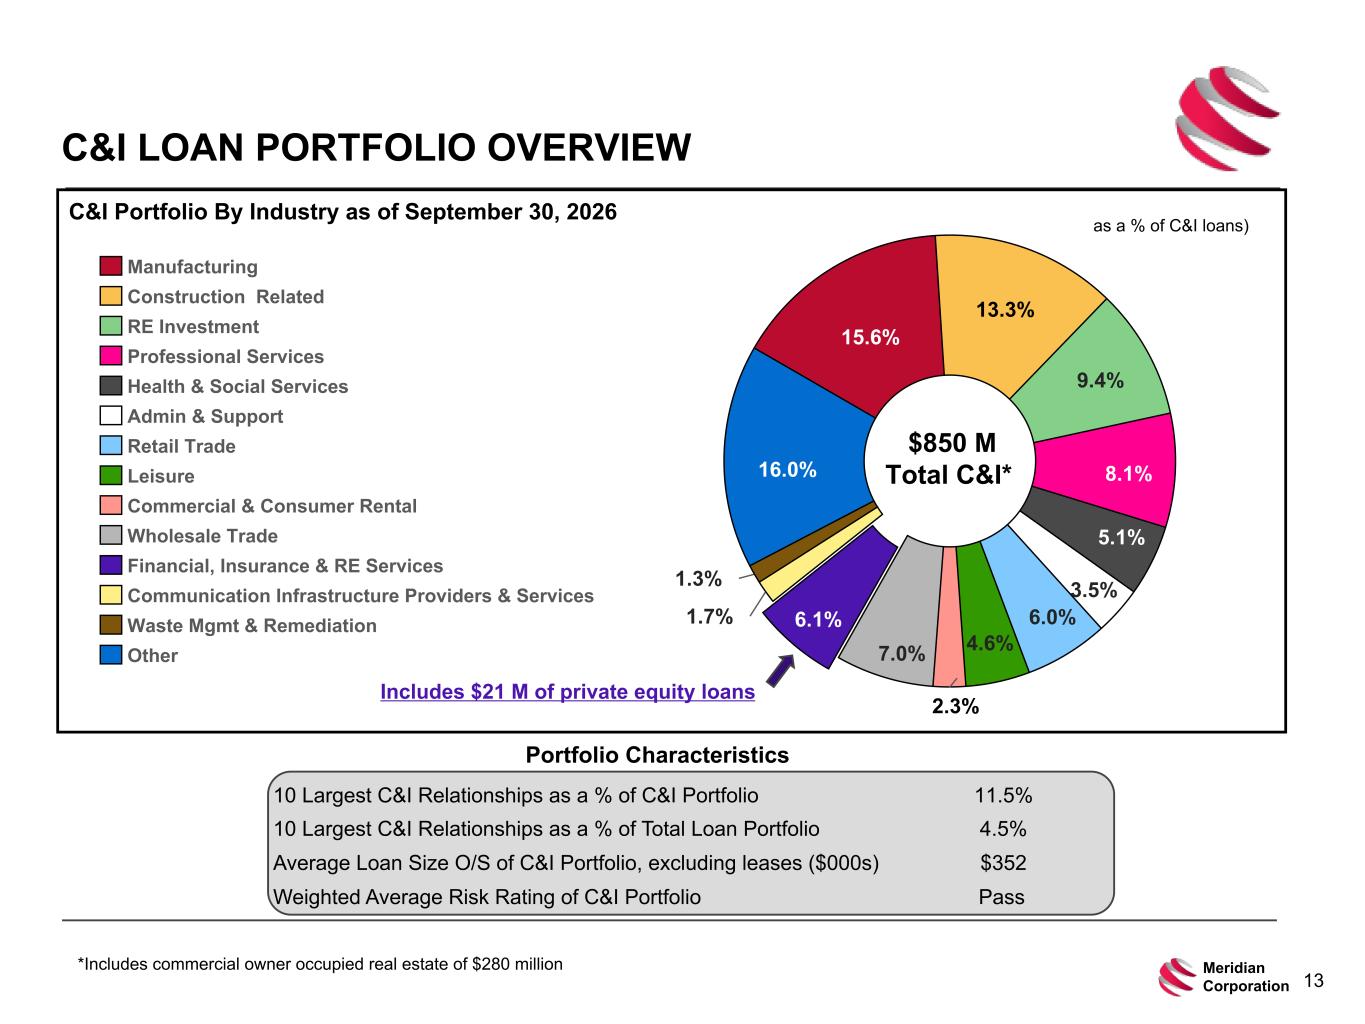
C&I LOAN PORTFOLIO OVERVIEW C&I Portfolio By Industry as of September 30, 2026 10 Largest C&I Relationships as a % of C&I Portfolio 11.5% 10 Largest C&I Relationships as a % of Total Loan Portfolio 4.5% Average Loan Size O/S of C&I Portfolio, excluding leases ($000s) $352 Weighted Average Risk Rating of C&I Portfolio Pass 15.6% 13.3% 9.4% 8.1% 5.1% 3.5% 6.0% 4.6% 2.3% 7.0% 6.1%1.7% 1.3% 16.0% Manufacturing Construction Related RE Investment Professional Services Health & Social Services Admin & Support Retail Trade Leisure Commercial & Consumer Rental Wholesale Trade Financial, Insurance & RE Services Communication Infrastructure Providers & Services Waste Mgmt & Remediation Other *Includes commercial owner occupied real estate of $280 million Meridian Corporation Portfolio Characteristics 13 $850 M Total C&I* Includes $21 M of private equity loans as a % of C&I loans)
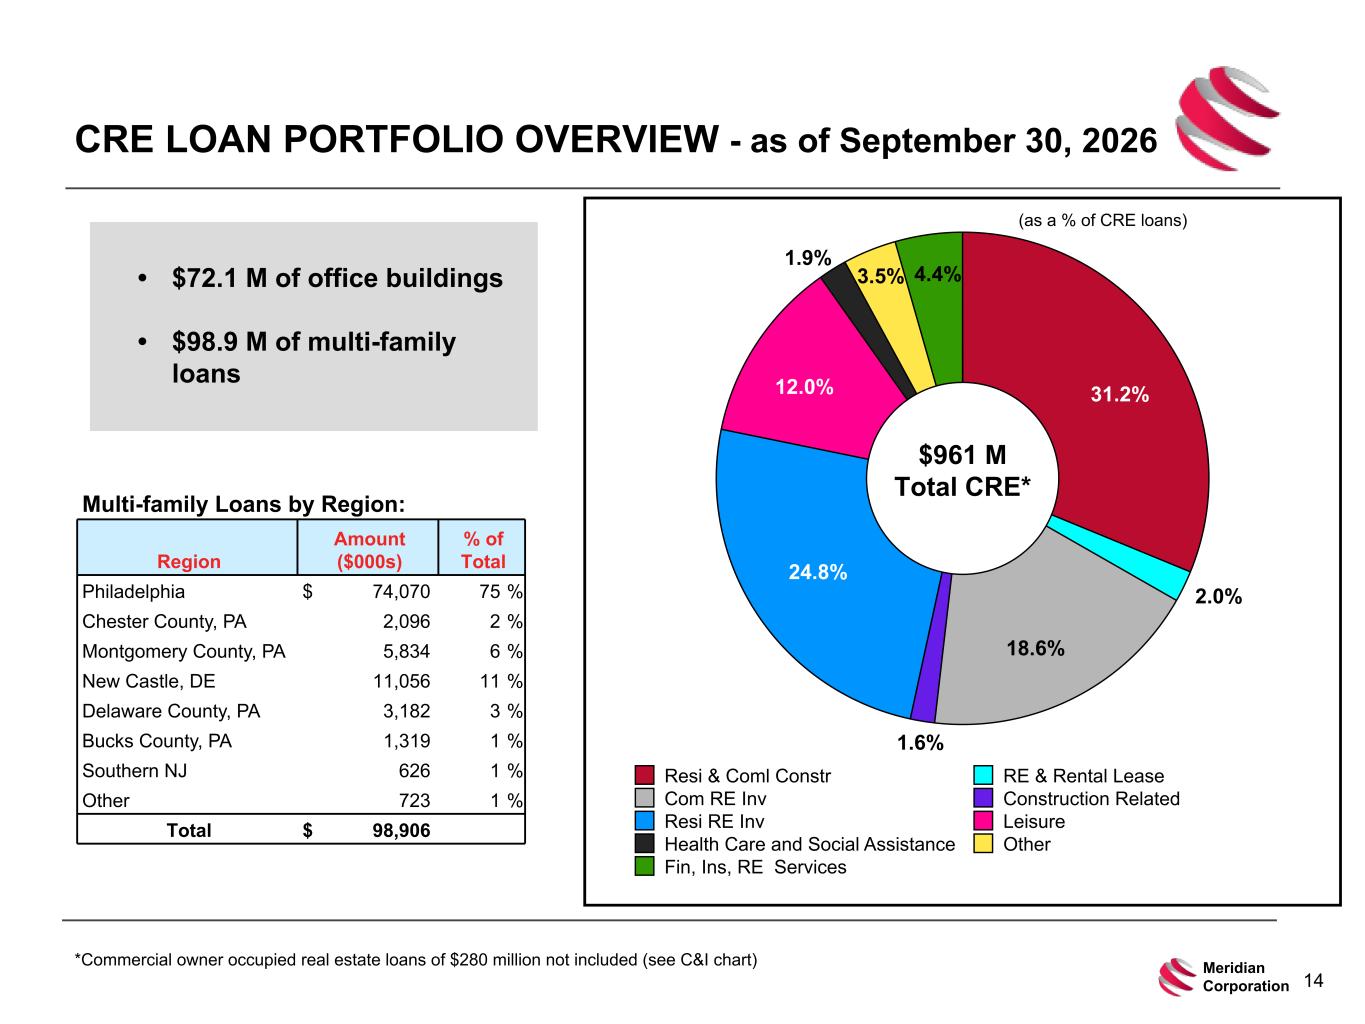
31.2% 2.0% 18.6% 1.6% 24.8% 12.0% 1.9% 3.5% 4.4% Resi & Coml Constr RE & Rental Lease Com RE Inv Construction Related Resi RE Inv Leisure Health Care and Social Assistance Other Fin, Ins, RE Services CRE LOAN PORTFOLIO OVERVIEW - as of September 30, 2026 $961 M Total CRE* (as a % of CRE loans) *Commercial owner occupied real estate loans of $280 million not included (see C&I chart) • $72.1 M of office buildings • $98.9 M of multi-family loans Meridian Corporation Multi-family Loans by Region: Region Amount ($000s) % of Total Philadelphia $ 74,070 75 % Chester County, PA 2,096 2 % Montgomery County, PA 5,834 6 % New Castle, DE 11,056 11 % Delaware County, PA 3,182 3 % Bucks County, PA 1,319 1 % Southern NJ 626 1 % Other 723 1 % Total $ 98,906 14
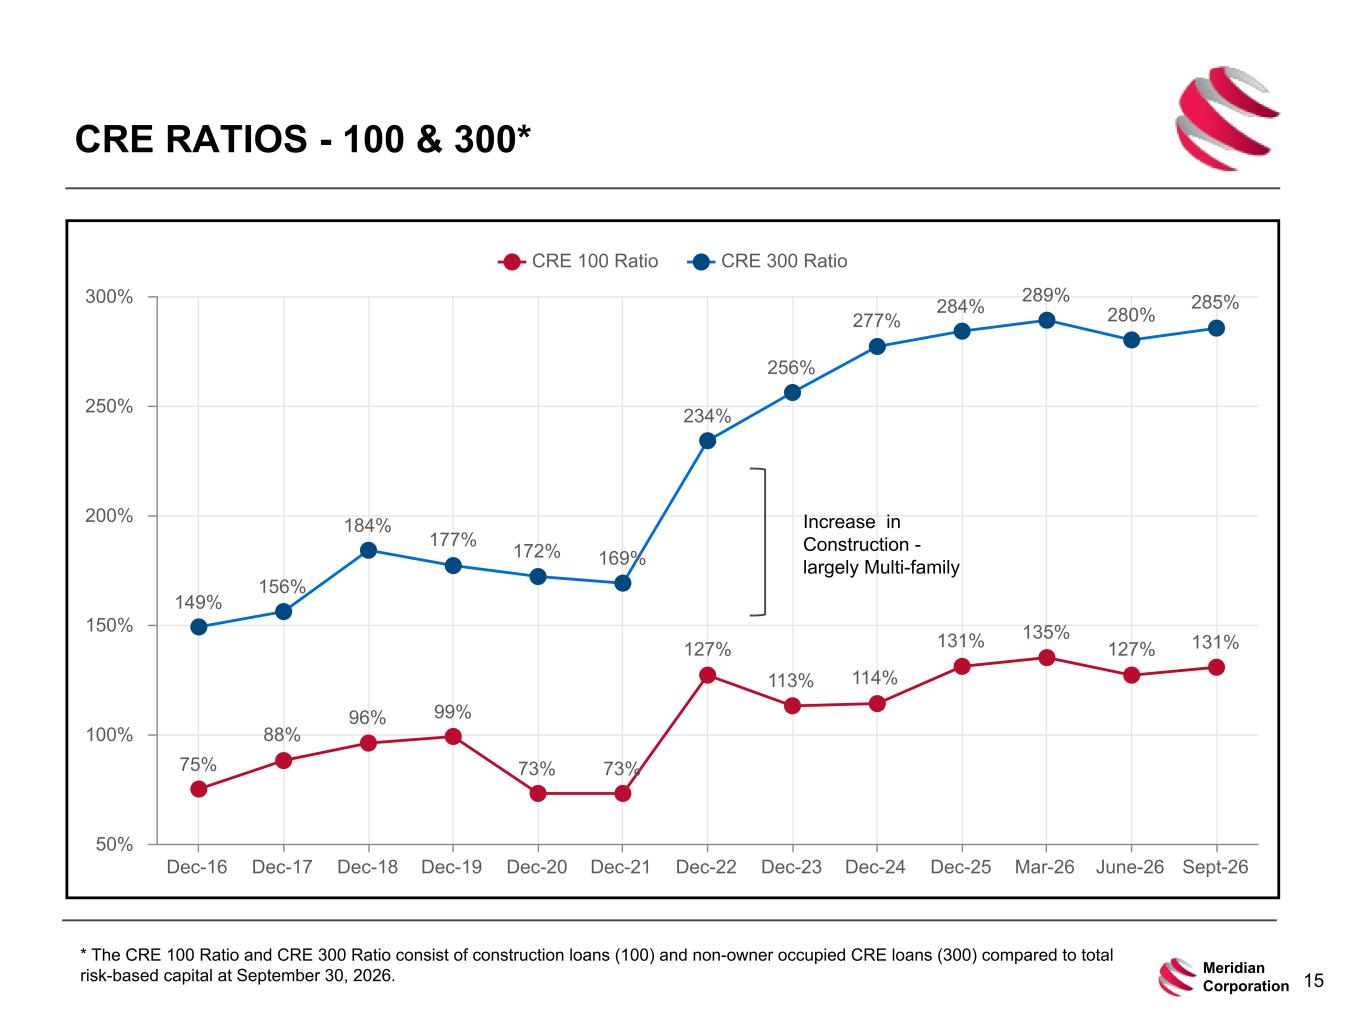
CRE RATIOS - 100 & 300* 75% 88% 96% 99% 73% 73% 127% 113% 114% 131% 135% 127% 131% 149% 156% 184% 177% 172% 169% 234% 256% 277% 284% 289% 280% 285% CRE 100 Ratio CRE 300 Ratio Dec-16 Dec-17 Dec-18 Dec-19 Dec-20 Dec-21 Dec-22 Dec-23 Dec-24 Dec-25 Mar-26 June-26 Sept-26 50% 100% 150% 200% 250% 300% Increase in Construction - largely Multi-family Meridian Corporation 15 * The CRE 100 Ratio and CRE 300 Ratio consist of construction loans (100) and non-owner occupied CRE loans (300) compared to total risk-based capital at September 30, 2026.
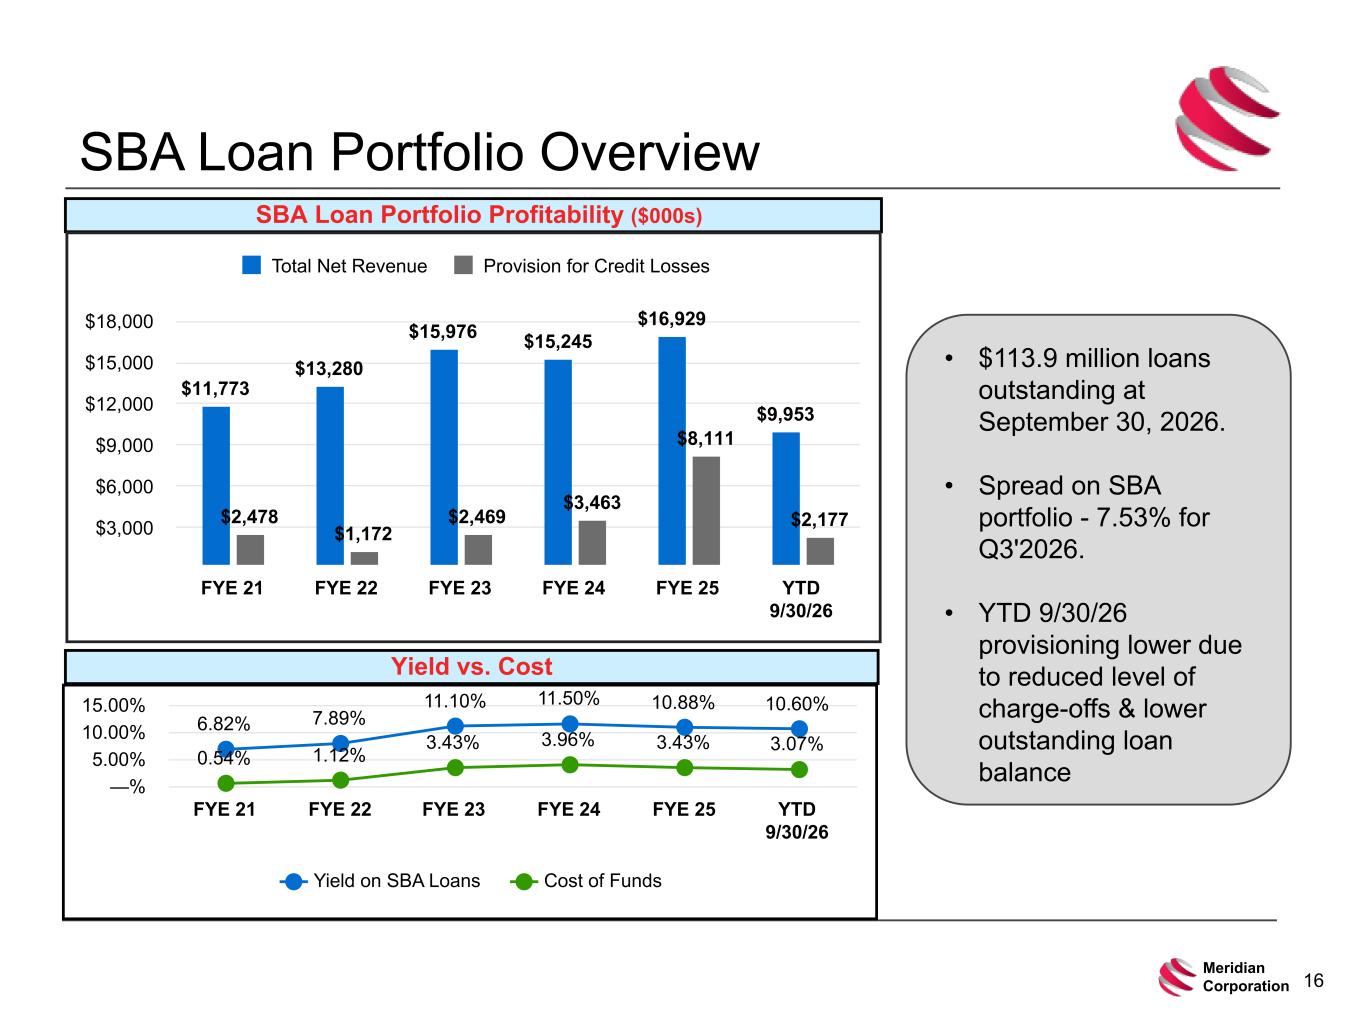
6.82% 7.89% 11.10% 11.50% 10.88% 10.60% 0.54% 1.12% 3.43% 3.96% 3.43% 3.07% Yield on SBA Loans Cost of Funds FYE 21 FYE 22 FYE 23 FYE 24 FYE 25 YTD 9/30/26 —% 5.00% 10.00% 15.00% SBA Loan Portfolio Overview SBA Loan Portfolio Profitability ($000s) Yield vs. Cost $11,773 $13,280 $15,976 $15,245 $16,929 $9,953 $2,478 $1,172 $2,469 $3,463 $8,111 $2,177 Total Net Revenue Provision for Credit Losses FYE 21 FYE 22 FYE 23 FYE 24 FYE 25 YTD 9/30/26 $3,000 $6,000 $9,000 $12,000 $15,000 $18,000 • $113.9 million loans outstanding at September 30, 2026. • Spread on SBA portfolio - 7.53% for Q3'2026. • YTD 9/30/26 provisioning lower due to reduced level of charge-offs & lower outstanding loan balance Meridian Corporation 16
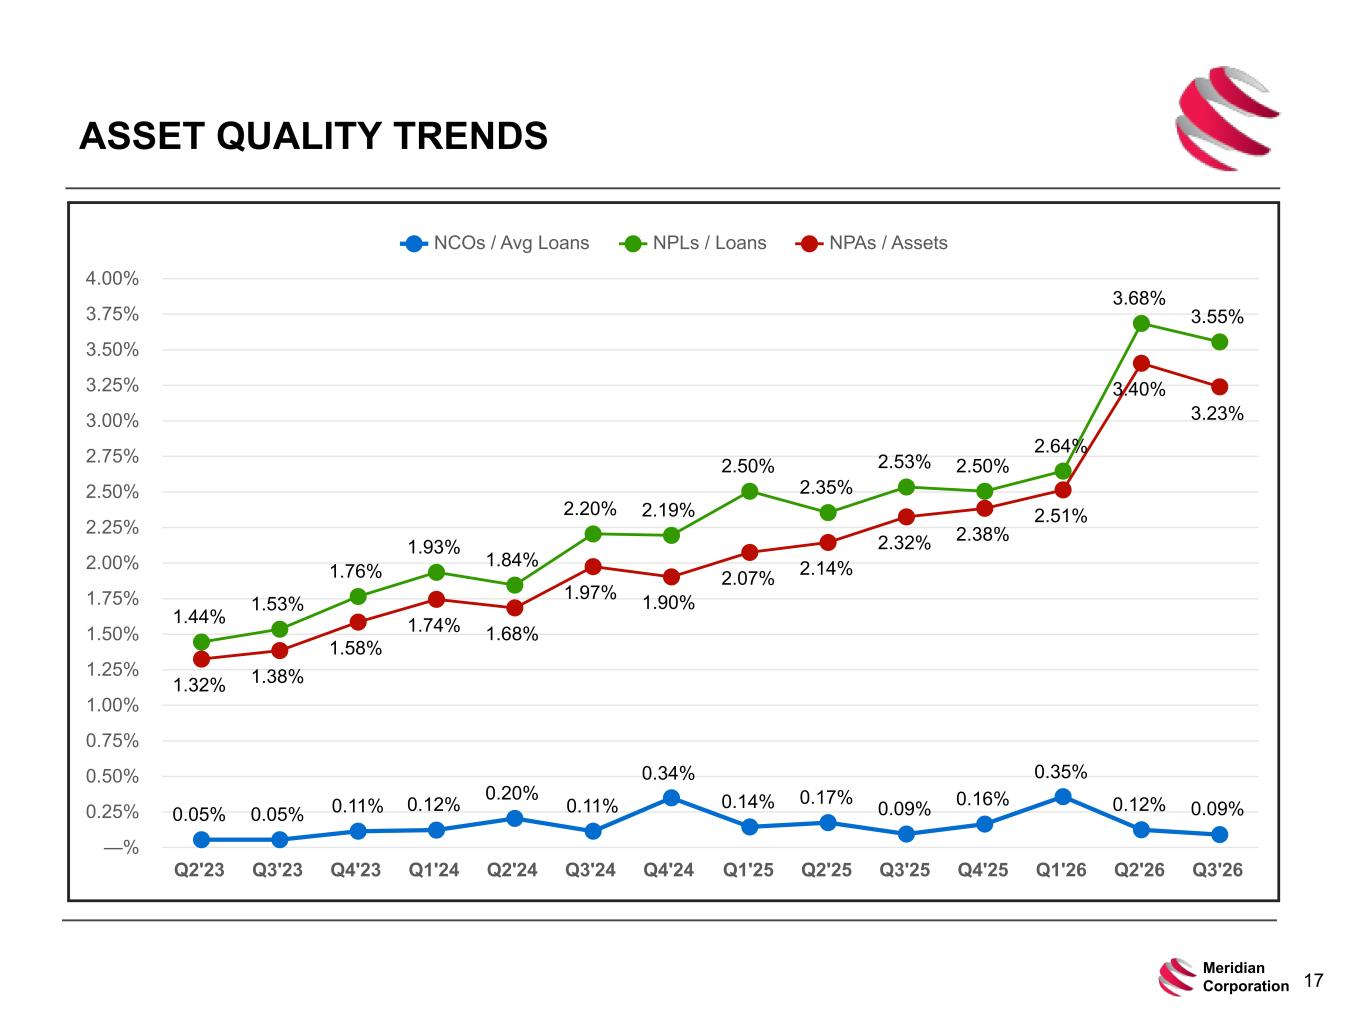
ASSET QUALITY TRENDS 0.05% 0.05% 0.11% 0.12% 0.20% 0.11% 0.34% 0.14% 0.17% 0.09% 0.16% 0.35% 0.12% 0.09% 1.44% 1.53% 1.76% 1.93% 1.84% 2.20% 2.19% 2.50% 2.35% 2.53% 2.50% 2.64% 3.68% 3.55% 1.32% 1.38% 1.58% 1.74% 1.68% 1.97% 1.90% 2.07% 2.14% 2.32% 2.38% 2.51% 3.40% 3.23% NCOs / Avg Loans NPLs / Loans NPAs / Assets Q2'23 Q3'23 Q4'23 Q1'24 Q2'24 Q3'24 Q4'24 Q1'25 Q2'25 Q3'25 Q4'25 Q1'26 Q2'26 Q3'26 —% 0.25% 0.50% 0.75% 1.00% 1.25% 1.50% 1.75% 2.00% 2.25% 2.50% 2.75% 3.00% 3.25% 3.50% 3.75% 4.00% Meridian Corporation 17
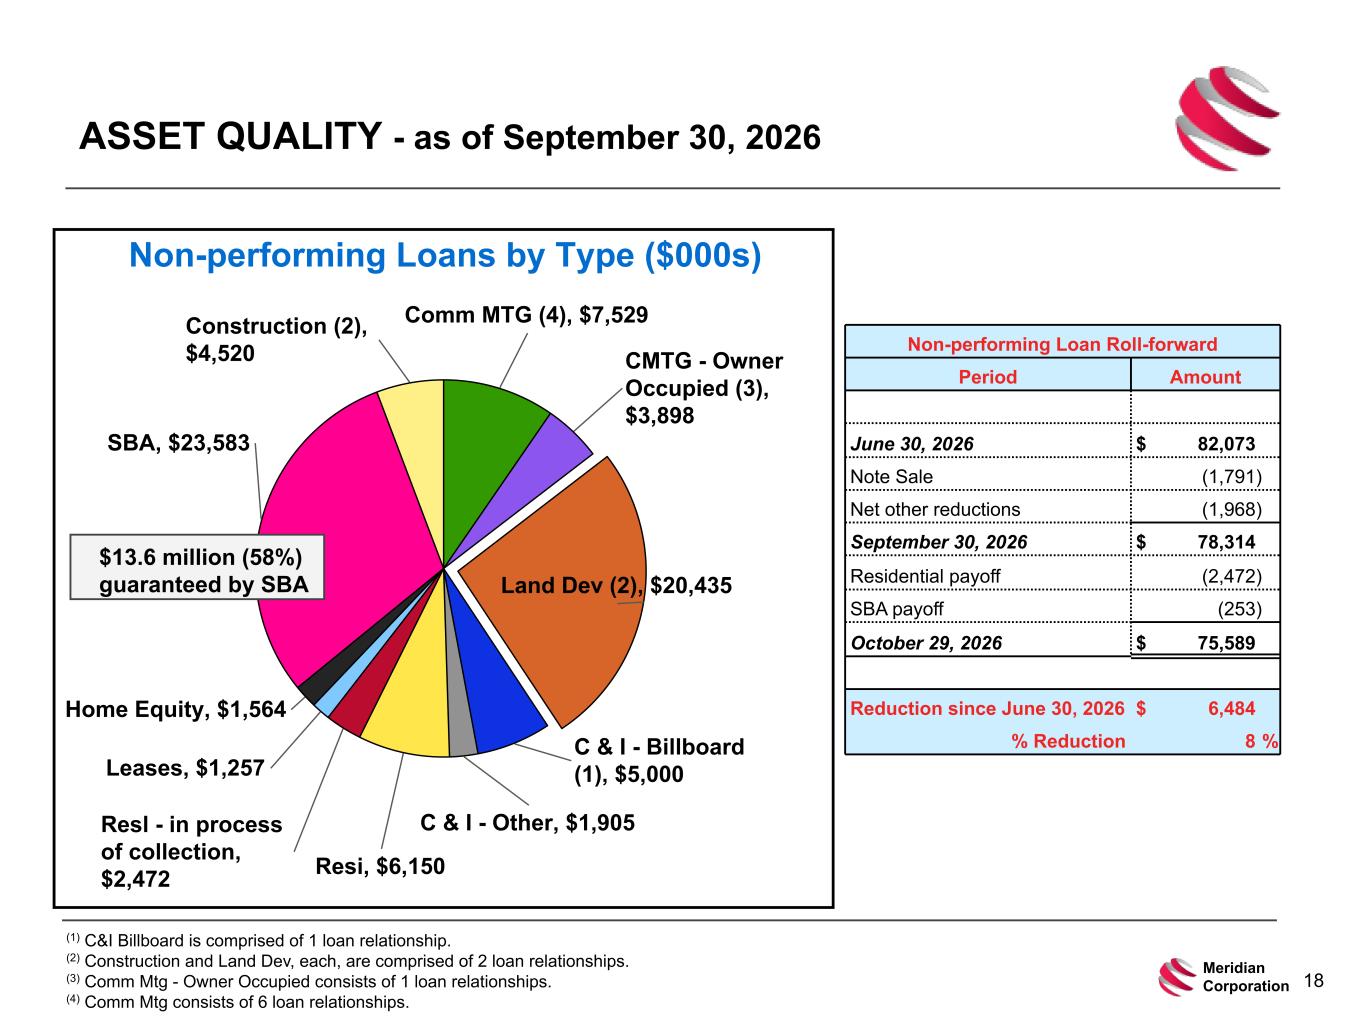
ASSET QUALITY - as of September 30, 2026 Comm MTG (4), $7,529 CMTG - Owner Occupied (3), $3,898 Land Dev (2), $20,435 C & I - Billboard (1), $5,000 C & I - Other, $1,905 Resi, $6,150 Resl - in process of collection, $2,472 Leases, $1,257 Home Equity, $1,564 SBA, $23,583 Construction (2), $4,520 Non-performing Loans by Type ($000s) $13.6 million (58%) guaranteed by SBA (1) C&I Billboard is comprised of 1 loan relationship. (2) Construction and Land Dev, each, are comprised of 2 loan relationships. (3) Comm Mtg - Owner Occupied consists of 1 loan relationships. (4) Comm Mtg consists of 6 loan relationships. Meridian Corporation 18 Non-performing Loan Roll-forward Period Amount June 30, 2026 $ 82,073 Note Sale (1,791) Net other reductions (1,968) September 30, 2026 $ 78,314 Residential payoff (2,472) SBA payoff (253) October 29, 2026 $ 75,589 Reduction since June 30, 2026 $ 6,484 % Reduction 8 %
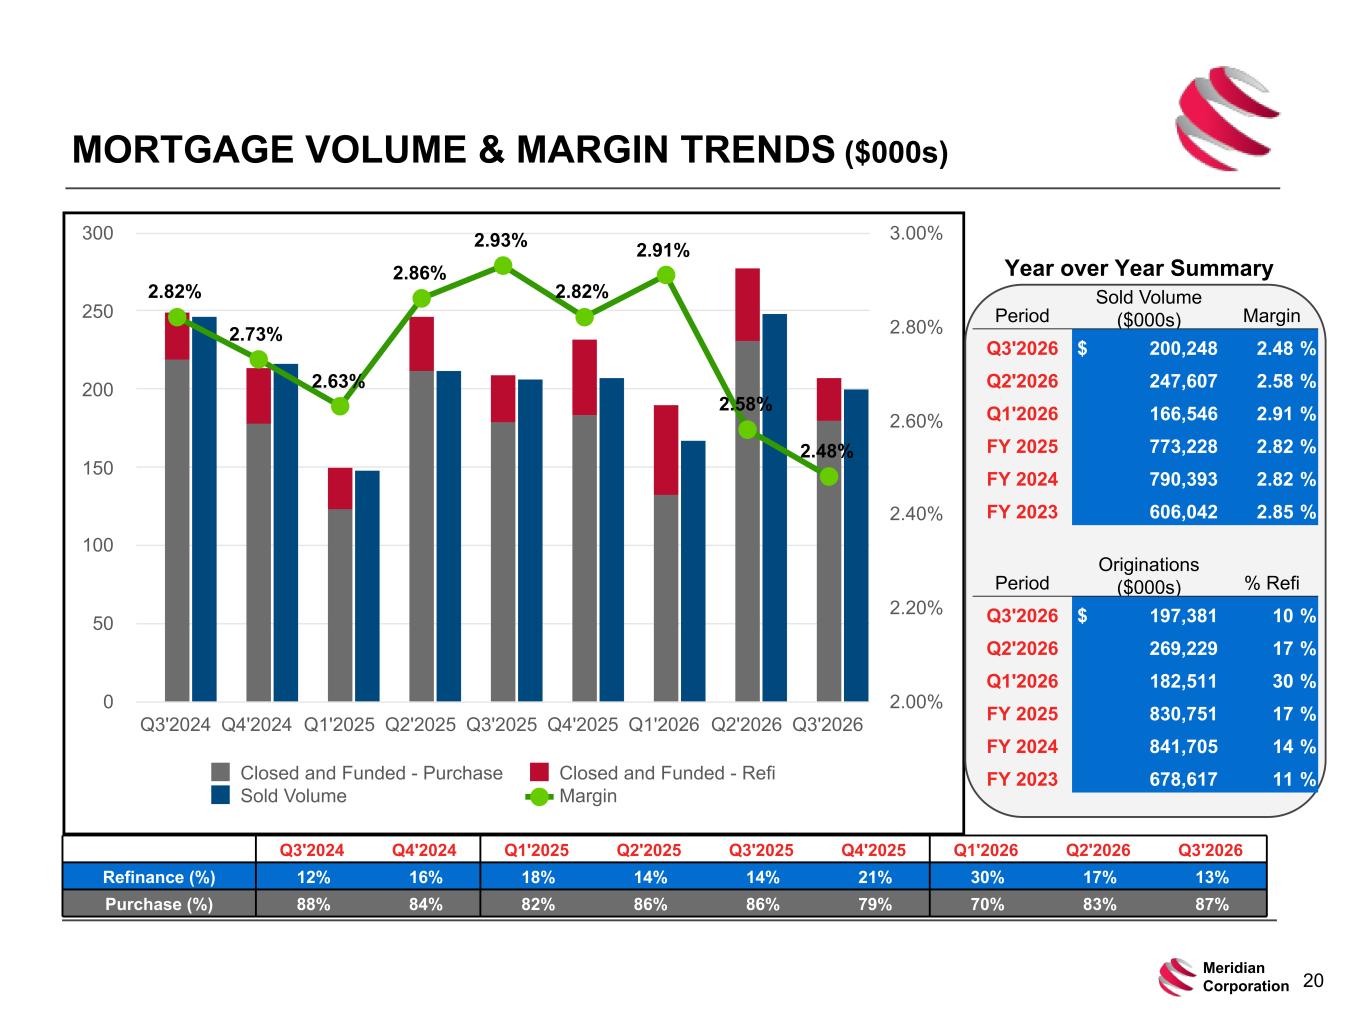
MORTGAGE VOLUME & MARGIN TRENDS ($000s) 2.82% 2.73% 2.63% 2.86% 2.93% 2.82% 2.91% 2.58% 2.48% Closed and Funded - Purchase Closed and Funded - Refi Sold Volume Margin Q3'2024 Q4'2024 Q1'2025 Q2'2025 Q3'2025 Q4'2025 Q1'2026 Q2'2026 Q3'2026 0 50 100 150 200 250 300 2.00% 2.20% 2.40% 2.60% 2.80% 3.00% Q3'2024 Q4'2024 Q1'2025 Q2'2025 Q3'2025 Q4'2025 Q1'2026 Q2'2026 Q3'2026 Refinance (%) 12% 16% 18% 14% 14% 21% 30% 17% 13% Purchase (%) 88% 84% 82% 86% 86% 79% 70% 83% 87% Meridian Corporation 20 Period Sold Volume ($000s) Margin Q3'2026 $ 200,248 2.48 % Q2'2026 247,607 2.58 % Q1'2026 166,546 2.91 % FY 2025 773,228 2.82 % FY 2024 790,393 2.82 % FY 2023 606,042 2.85 % Period Originations ($000s) % Refi Q3'2026 $ 197,381 10 % Q2'2026 269,229 17 % Q1'2026 182,511 30 % FY 2025 830,751 17 % FY 2024 841,705 14 % FY 2023 678,617 11 % Year over Year Summary
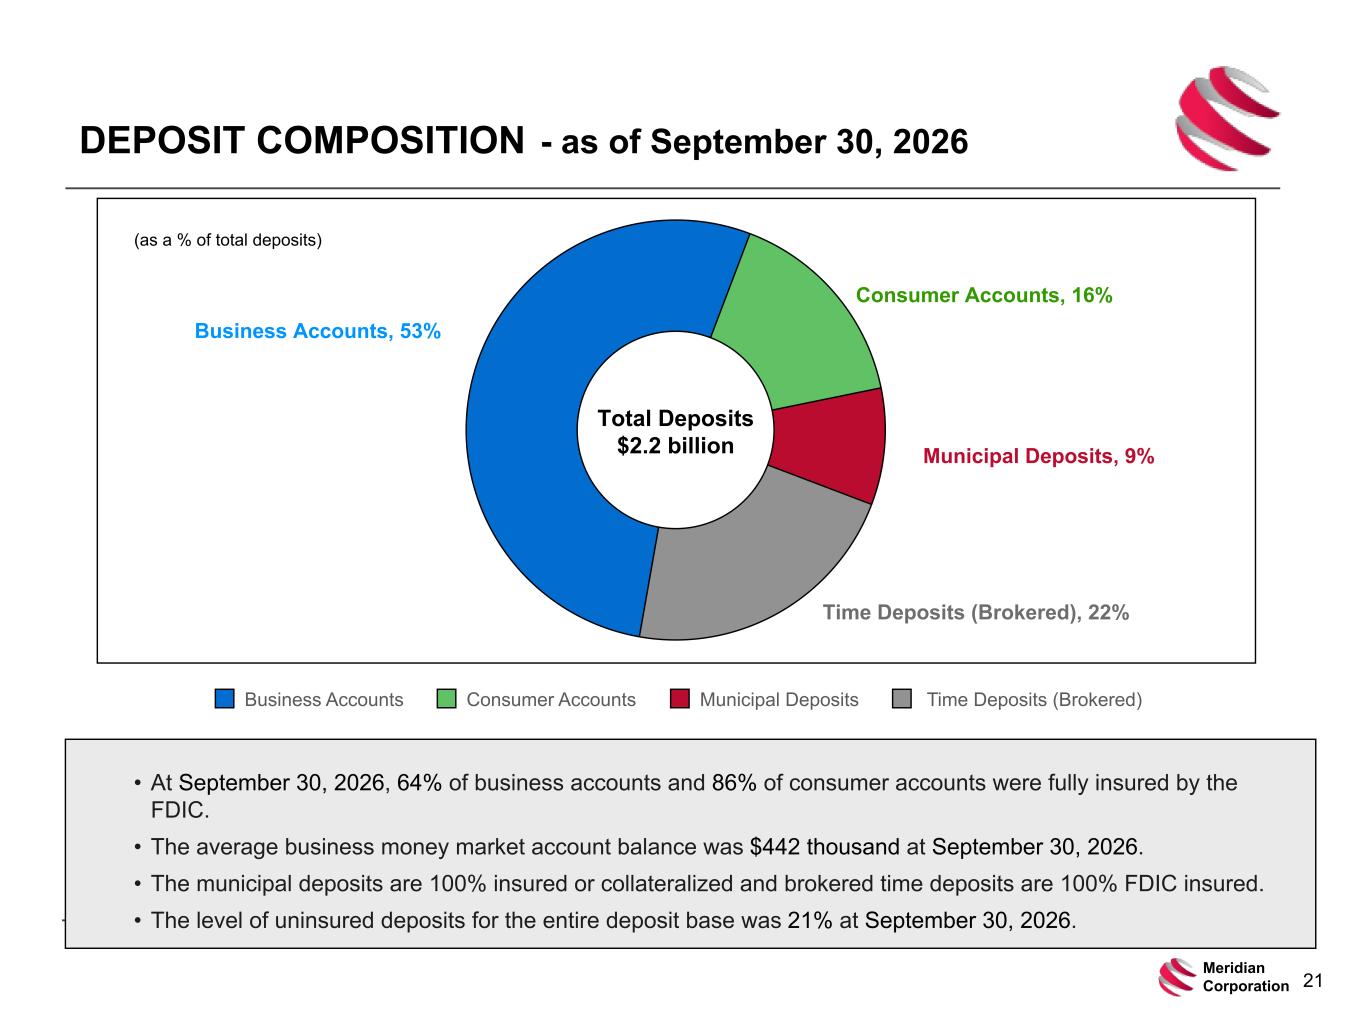
DEPOSIT COMPOSITION - as of September 30, 2026 Business Accounts, 53% Consumer Accounts, 16% Municipal Deposits, 9% Time Deposits (Brokered), 22% Business Accounts Consumer Accounts Municipal Deposits Time Deposits (Brokered) Total Deposits $2.2 billion • At September 30, 2026, 64% of business accounts and 86% of consumer accounts were fully insured by the FDIC. • The average business money market account balance was $442 thousand at September 30, 2026. • The municipal deposits are 100% insured or collateralized and brokered time deposits are 100% FDIC insured. • The level of uninsured deposits for the entire deposit base was 21% at September 30, 2026. (as a % of total deposits) Meridian Corporation 21
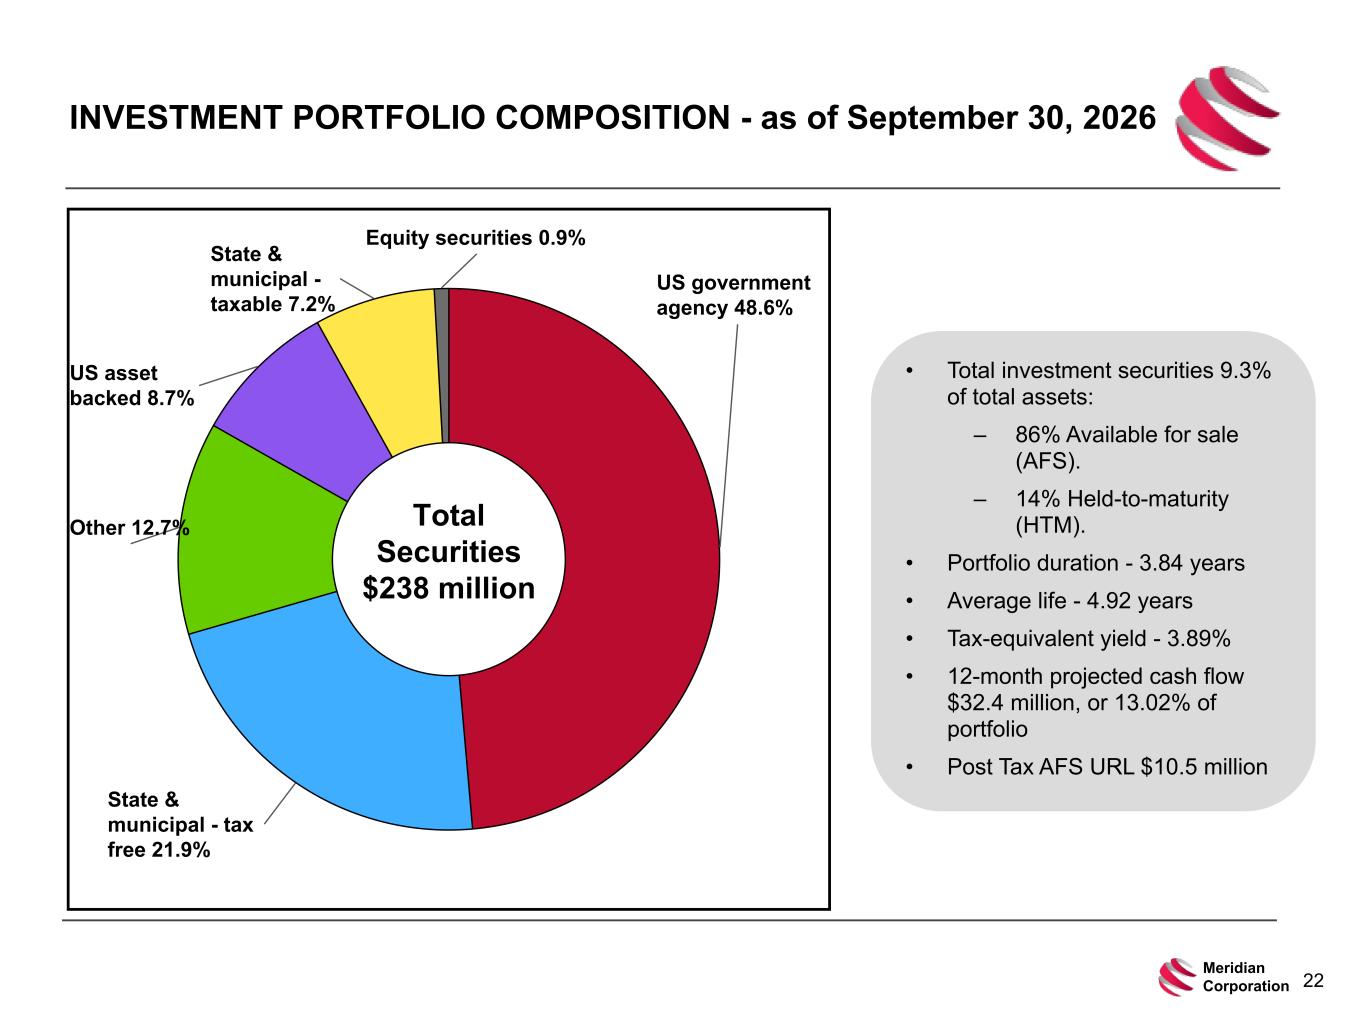
INVESTMENT PORTFOLIO COMPOSITION - as of September 30, 2026 • Total investment securities 9.3% of total assets: – 86% Available for sale (AFS). – 14% Held-to-maturity (HTM). • Portfolio duration - 3.84 years • Average life - 4.92 years • Tax-equivalent yield - 3.89% • 12-month projected cash flow $32.4 million, or 13.02% of portfolio • Post Tax AFS URL $10.5 million US government agency 48.6% State & municipal - tax free 21.9% Other 12.7% US asset backed 8.7% State & municipal - taxable 7.2% Equity securities 0.9% Total Securities $238 million Meridian Corporation 22
APPENDIX - HISTORICAL FINANCIAL HIGHLIGHTS AND RECONCILIATIONS OF NON-GAAP MEASURES Meridian Corporation 23
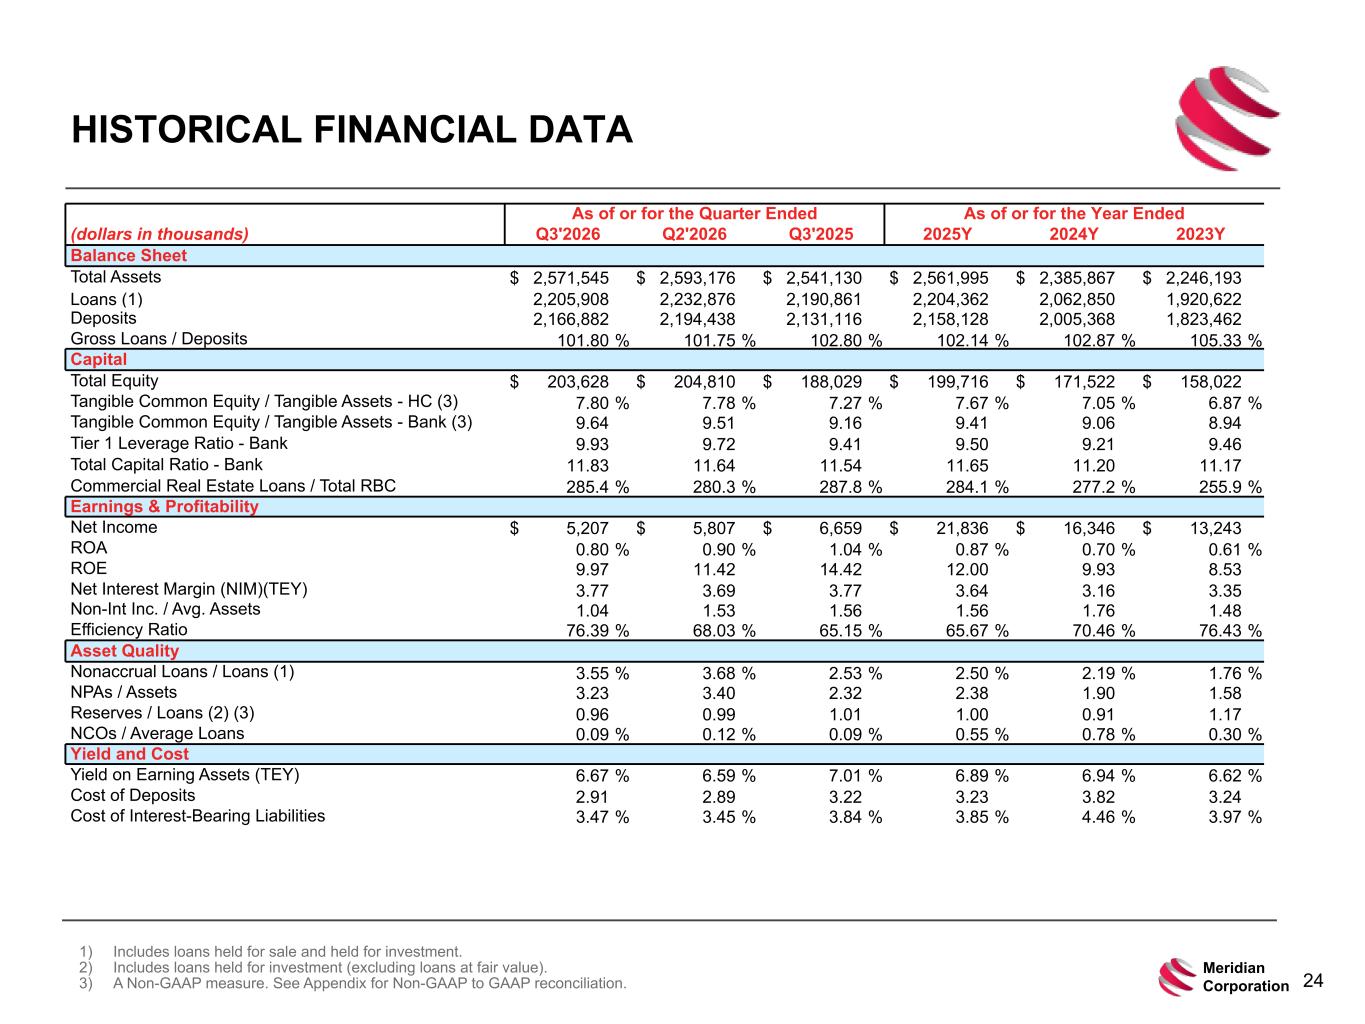
HISTORICAL FINANCIAL DATA 1) Includes loans held for sale and held for investment. 2) Includes loans held for investment (excluding loans at fair value). 3) A Non-GAAP measure. See Appendix for Non-GAAP to GAAP reconciliation. As of or for the Quarter Ended As of or for the Year Ended (dollars in thousands) Q3'2026 Q2'2026 Q3'2025 2025Y 2024Y 2023Y Balance Sheet Total Assets $ 2,571,545 $ 2,593,176 $ 2,541,130 $ 2,561,995 $ 2,385,867 $ 2,246,193 Loans (1) 2,205,908 2,232,876 2,190,861 2,204,362 2,062,850 1,920,622 Deposits 2,166,882 2,194,438 2,131,116 2,158,128 2,005,368 1,823,462 Gross Loans / Deposits 101.80 % 101.75 % 102.80 % 102.14 % 102.87 % 105.33 % Capital Total Equity $ 203,628 $ 204,810 $ 188,029 $ 199,716 $ 171,522 $ 158,022 Tangible Common Equity / Tangible Assets - HC (3) 7.80 % 7.78 % 7.27 % 7.67 % 7.05 % 6.87 % Tangible Common Equity / Tangible Assets - Bank (3) 9.64 9.51 9.16 9.41 9.06 8.94 Tier 1 Leverage Ratio - Bank 9.93 9.72 9.41 9.50 9.21 9.46 Total Capital Ratio - Bank 11.83 11.64 11.54 11.65 11.20 11.17 Commercial Real Estate Loans / Total RBC 285.4 % 280.3 % 287.8 % 284.1 % 277.2 % 255.9 % Earnings & Profitability Net Income $ 5,207 $ 5,807 $ 6,659 $ 21,836 $ 16,346 $ 13,243 ROA 0.80 % 0.90 % 1.04 % 0.87 % 0.70 % 0.61 % ROE 9.97 11.42 14.42 12.00 9.93 8.53 Net Interest Margin (NIM)(TEY) 3.77 3.69 3.77 3.64 3.16 3.35 Non-Int Inc. / Avg. Assets 1.04 1.53 1.56 1.56 1.76 1.48 Efficiency Ratio 76.39 % 68.03 % 65.15 % 65.67 % 70.46 % 76.43 % Asset Quality Nonaccrual Loans / Loans (1) 3.55 % 3.68 % 2.53 % 2.50 % 2.19 % 1.76 % NPAs / Assets 3.23 3.40 2.32 2.38 1.90 1.58 Reserves / Loans (2) (3) 0.96 0.99 1.01 1.00 0.91 1.17 NCOs / Average Loans 0.09 % 0.12 % 0.09 % 0.55 % 0.78 % 0.30 % Yield and Cost Yield on Earning Assets (TEY) 6.67 % 6.59 % 7.01 % 6.89 % 6.94 % 6.62 % Cost of Deposits 2.91 2.89 3.22 3.23 3.82 3.24 Cost of Interest-Bearing Liabilities 3.47 % 3.45 % 3.84 % 3.85 % 4.46 % 3.97 % Meridian Corporation 24
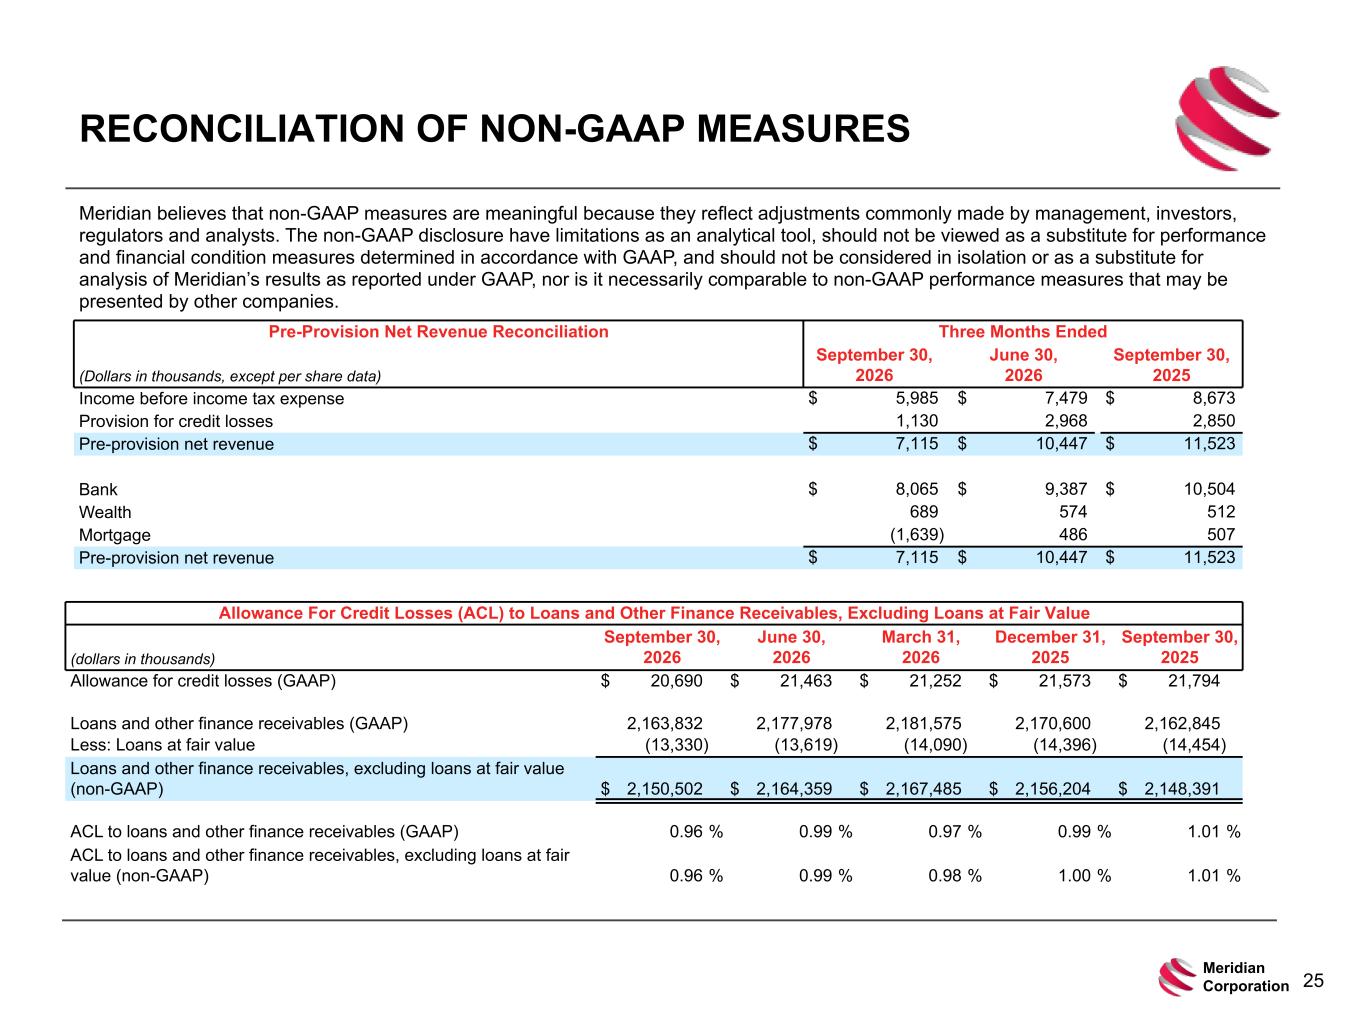
Allowance For Credit Losses (ACL) to Loans and Other Finance Receivables, Excluding Loans at Fair Value (dollars in thousands) September 30, 2026 June 30, 2026 March 31, 2026 December 31, 2025 September 30, 2025 Allowance for credit losses (GAAP) $ 20,690 $ 21,463 $ 21,252 $ 21,573 $ 21,794 Loans and other finance receivables (GAAP) 2,163,832 2,177,978 2,181,575 2,170,600 2,162,845 Less: Loans at fair value (13,330) (13,619) (14,090) (14,396) (14,454) Loans and other finance receivables, excluding loans at fair value (non-GAAP) $ 2,150,502 $ 2,164,359 $ 2,167,485 $ 2,156,204 $ 2,148,391 ACL to loans and other finance receivables (GAAP) 0.96 % 0.99 % 0.97 % 0.99 % 1.01 % ACL to loans and other finance receivables, excluding loans at fair value (non-GAAP) 0.96 % 0.99 % 0.98 % 1.00 % 1.01 % RECONCILIATION OF NON-GAAP MEASURES Meridian believes that non-GAAP measures are meaningful because they reflect adjustments commonly made by management, investors, regulators and analysts. The non-GAAP disclosure have limitations as an analytical tool, should not be viewed as a substitute for performance and financial condition measures determined in accordance with GAAP, and should not be considered in isolation or as a substitute for analysis of Meridian’s results as reported under GAAP, nor is it necessarily comparable to non-GAAP performance measures that may be presented by other companies. Pre-Provision Net Revenue Reconciliation Three Months Ended (Dollars in thousands, except per share data) September 30, 2026 June 30, 2026 September 30, 2025 Income before income tax expense $ 5,985 $ 7,479 $ 8,673 Provision for credit losses 1,130 2,968 2,850 Pre-provision net revenue $ 7,115 $ 10,447 $ 11,523 Bank $ 8,065 $ 9,387 $ 10,504 Wealth 689 574 512 Mortgage (1,639) 486 507 Pre-provision net revenue $ 7,115 $ 10,447 $ 11,523 Meridian Corporation 25
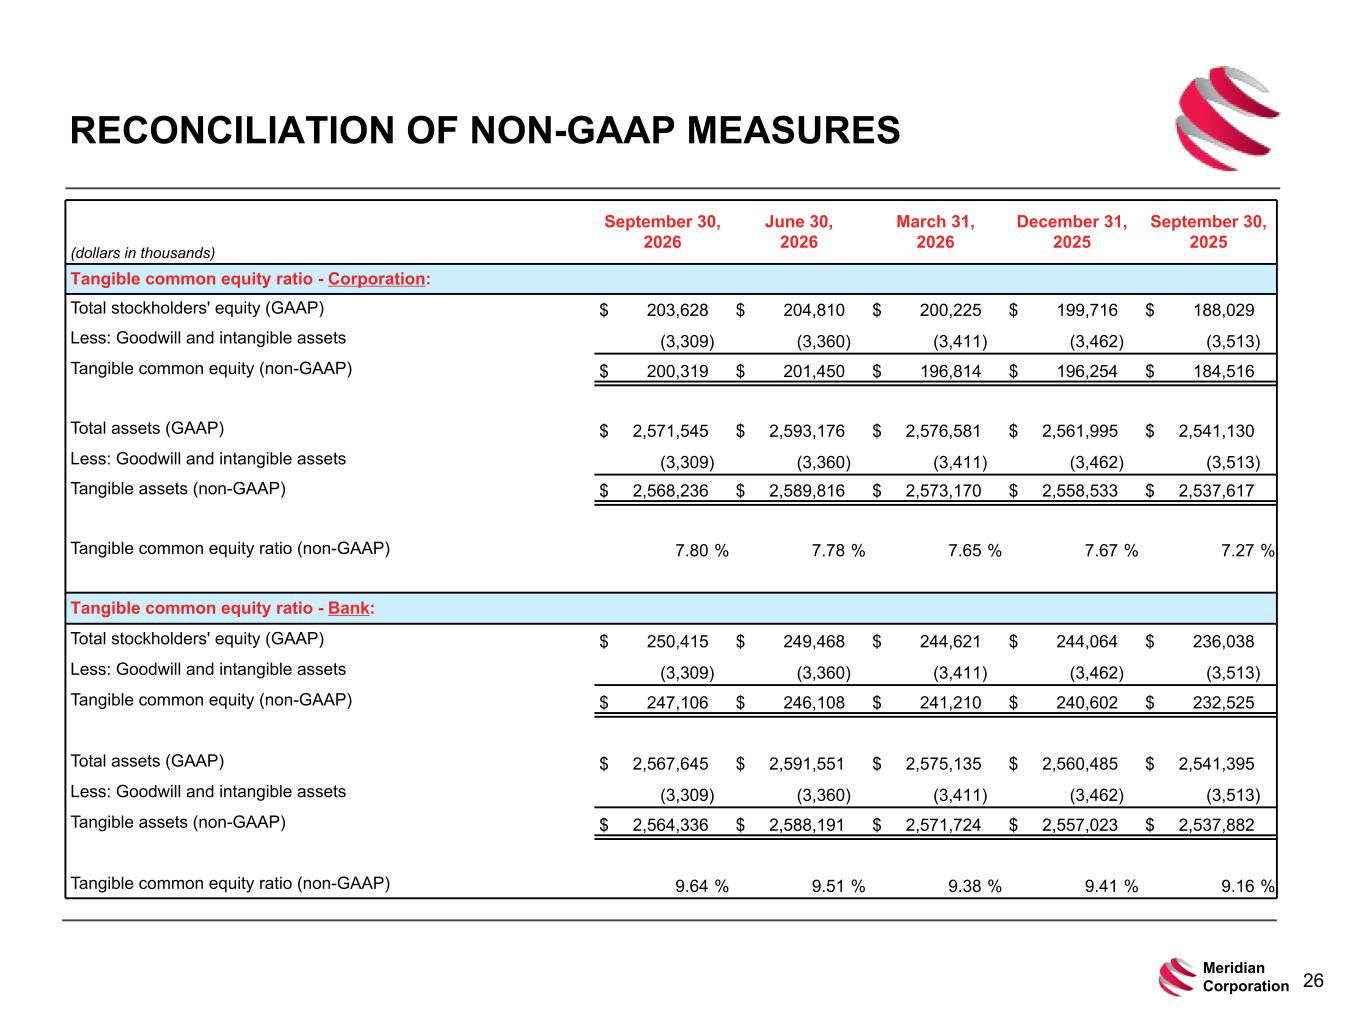
(dollars in thousands) September 30, 2026 June 30, 2026 March 31, 2026 December 31, 2025 September 30, 2025 Tangible common equity ratio - Corporation: Total stockholders' equity (GAAP) $ 203,628 $ 204,810 $ 200,225 $ 199,716 $ 188,029 Less: Goodwill and intangible assets (3,309) (3,360) (3,411) (3,462) (3,513) Tangible common equity (non-GAAP) $ 200,319 $ 201,450 $ 196,814 $ 196,254 $ 184,516 Total assets (GAAP) $ 2,571,545 $ 2,593,176 $ 2,576,581 $ 2,561,995 $ 2,541,130 Less: Goodwill and intangible assets (3,309) (3,360) (3,411) (3,462) (3,513) Tangible assets (non-GAAP) $ 2,568,236 $ 2,589,816 $ 2,573,170 $ 2,558,533 $ 2,537,617 Tangible common equity ratio (non-GAAP) 7.80 % 7.78 % 7.65 % 7.67 % 7.27 % Tangible common equity ratio - Bank: Total stockholders' equity (GAAP) $ 250,415 $ 249,468 $ 244,621 $ 244,064 $ 236,038 Less: Goodwill and intangible assets (3,309) (3,360) (3,411) (3,462) (3,513) Tangible common equity (non-GAAP) $ 247,106 $ 246,108 $ 241,210 $ 240,602 $ 232,525 Total assets (GAAP) $ 2,567,645 $ 2,591,551 $ 2,575,135 $ 2,560,485 $ 2,541,395 Less: Goodwill and intangible assets (3,309) (3,360) (3,411) (3,462) (3,513) Tangible assets (non-GAAP) $ 2,564,336 $ 2,588,191 $ 2,571,724 $ 2,557,023 $ 2,537,882 Tangible common equity ratio (non-GAAP) 9.64 % 9.51 % 9.38 % 9.41 % 9.16 % RECONCILIATION OF NON-GAAP MEASURES Meridian Corporation 26