| Fund | Costs of a $10,000 Investment | Costs Paid as a Percentage of a $10,000 Investment |
|---|---|---|
| IPS Strategic Capital Absolute Return Fund | $82 | 1.62%1 |
The Fund underperformed during the period. The shortfall was driven by positions held during the period, specifically China, Gold, and Silver, which underperformed relative to the S&P 500. The rest of the Fund's strategy has remained steady and unchanged. The Fund's investment framework, which combines high positive gamma with low net theta cost and manages vega exposure dynamically, remains in place. The Adviser believes the framework continues to be sound. The Fund's strategy depends on adjusting positions in a timely way. Gamma, theta, and vega exposures must be recalibrated as markets move and volatility regimes shift.
High Gamma, Low Theta: The Core Structural Advantage
Conventional options portfolios force a tradeoff. High positive gamma causes a portfolio's market sensitivity to rise in rallies and fall in drawdowns, but it typically comes at the cost of significant time decay. Owning gamma means paying theta. For most funds, that theta drag becomes a persistent headwind that erodes returns in quiet, range-bound markets.
The Adviser structures the portfolio to break this tradeoff. Long gamma exposure is financed through the strategic use of OCC-cleared box spreads, which monetize prevailing interest rates to fund synthetic long positions in calls and puts. This allows the portfolio to maintain robust positive gamma without bearing the full theta burden that would ordinarily accompany it. When operating as designed, the portfolio can participate in directional moves in either direction while incurring minimal time-decay cost during periods of low realized volatility.
One consequence of a high positive gamma portfolio is that beta management becomes largely self-executing. Gamma is the mechanism by which a portfolio's market sensitivity rises during uptrends and falls during downtrends, which is the behavior an active manager would otherwise engineer manually. The Adviser reinforces this by monitoring and rebalancing beta at key inflection points, increasing exposure during early-stage rebounds and reducing it as momentum matures.
Conclusion
The period's underperformance reflects the results of specific positions in China, Gold, and Silver rather than any change in the Fund's approach. The integration of high positive gamma, low net theta, and dynamically rebalanced vega remains the foundation of the Fund's strategy. That approach is designed to capture upside during rallies, limit drawdown exposure during dislocations, and maintain positive carry across volatility environments.
The Adviser remains committed to this framework and will continue to calibrate vega, gamma, and theta positioning to the prevailing opportunity set as volatility regimes evolve.
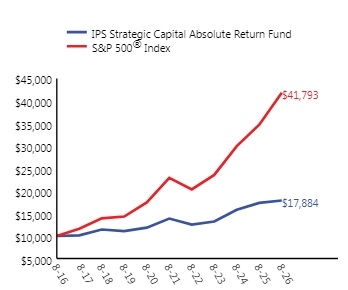
| One Year | Five Years | Ten Years | |
|---|---|---|---|
| IPS Strategic Capital Absolute Return Fund | 3.12% | 5.22% | 5.99% |
| S&P 500® Index | 20.38% | 12.79% | 15.37% |
| Net Assets ($) | $40,687,299 |
|---|---|
| Number of Portfolio Holdings | |
| Portfolio Turnover Rate (%) | 0% |
| Total Advisory Fees Paid ($) | $215,626 |
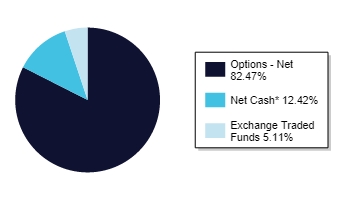
* Net Cash represents money market funds and other assets in excess of liabilities.