Harmony Australasia | CONFIDENTIALPage 1

Technical Report Summary of the CSA Copper Mine, New South Wales, Australia
TECHNICAL REPORT SUMMARY
CSA COPPER MINE
New South Wales – Australia
Report Type: | Technical Report Summary of the CSA Copper Mine, New South Wales, Australia |
Reporting Period: | June 2026 Mineral Reserve Report |
Registrant: | Harmony Gold Mining Company Limited ("Harmony") |
Operator: | Cobar Management Pty Limited ("CMPL") |
Owner: | Harmony Gold (Australia) Pty Limited ("HMY") |
Effective Date: | 30 June 2026 |
Report Date: | June 2026 |
Effective date: 30 June 2026
Technical Report Summary of the CSA Copper Mine, New South Wales, Australia
IMPORTANT NOTICE This Technical Report Summary ("TRS") has been prepared for Harmony Gold Mining Company Limited in support of disclosure and filing requirements with the United States Securities and Exchange Commission ("SEC") under Subpart 1300 of Regulation S-K and Section 229.601(b)(96) of Regulation S-K. The quality of information, estimates, and conclusions contained in this Technical Report Summary apply as of the effective date of this report. Subsequent events that may have occurred since that date may have resulted in material changes to such information, estimates and conclusions in this summary. |
Effective date: 30 June 2026
Technical Report Summary of the CSA Copper Mine, New South Wales, Australia
Qualified Person Consent and Sign-off
I have read and understood the requirements of:
•the South African Code for Reporting of Exploration Results, Mineral Resources and Mineral Reserves (The
SAMREC Code, 2016 edition)
•the Harmony Guidelines on the Reporting of Exploration Results, Mineral Resources and Mineral Reserves
•the Securities and Exchange Commission’s S-K 1300 guide
I am a Competent Person as defined by the above reporting codes, having more than five years' experience that is
relevant to the style of mineralisation and type of deposit described in the Report, and to all activities for which I am
accepting responsibility and have been appointed as a qualified person ("QP") for Mineral Resources and Mineral
Reserves.
I am a member (Fellow) of the Australasian Institute of Mining and Metallurgy (AusIMM) and my registration is as
follows:
Greg Job
Executive General Manager - Growth and Resource Development
FAusIMM No. 111561
I have reviewed the tables and graphs included for the Mineral Resource and Mineral Reserve which will be used in the
2026 Harmony Gold Mining Company Limited Mineral Resource and Mineral Reserve Report to which this Consent
Statement applies.
I acknowledge responsibility for all the Sections of the TRS report and as the principal QP and author I relied on
information provided by various subject experts.
At the effective date of the Report, to the best of my knowledge, information and belief, the Report contains all
scientific and technical information that is required to be disclosed to make the Report not misleading.
/s/ Greg Job
____________________________________
Mr Greg Job
BSc. MSc (Min Econ)
FAusIMM
Executive General Manager - Growth & Resource
Development
Harmony Australasia
Effective date: 30 June 2026
Technical Report Summary of the CSA Copper Mine, New South Wales, Australia
LIST OF CONTENTS
Effective date: 30 June 2026
Technical Report Summary of the CSA Copper Mine, New South Wales, Australia
Effective date: 30 June 2026
Technical Report Summary of the CSA Copper Mine, New South Wales, Australia
Effective date: 30 June 2026
Technical Report Summary of the CSA Copper Mine, New South Wales, Australia
Effective date: 30 June 2026
Technical Report Summary of the CSA Copper Mine, New South Wales, Australia
Effective date: 30 June 2026
Technical Report Summary of the CSA Copper Mine, New South Wales, Australia
Effective date: 30 June 2026
Technical Report Summary of the CSA Copper Mine, New South Wales, Australia
Effective date: 30 June 2026
Technical Report Summary of the CSA Copper Mine, New South Wales, Australia
LIST OF TABLES
Effective date: 30 June 2026
Technical Report Summary of the CSA Copper Mine, New South Wales, Australia
Effective date: 30 June 2026
Technical Report Summary of the CSA Copper Mine, New South Wales, Australia
LIST OF FIGURES
Effective date: 30 June 2026
Technical Report Summary of the CSA Copper Mine, New South Wales, Australia
GLOSSARY OF TERMS AND ABBREVIATIONS
Term / Abbreviation | Description |
2DIP | Two-Dimensional Induced Polarisation |
A$ | Australian Dollar |
AEM | Airborne Electromagnetics (survey) |
AEMR | Annual Environmental Management Report |
Ag | Silver |
ALS | Australian Laboratory Services |
AMC | AMC Consultants Pty Ltd |
AMR | Airborne Magnetics and Radiometrics (survey) |
ANCOLD | Australian National Committee on Large Dams |
ANFO | Ammonium Nitrate/Fuel Oil (explosive) |
ARD | Acid Rock Drainage |
Au | Gold |
AuriCula | AuriCula Mines Pty Limited |
Ausenco | Ausenco Pty Limited |
BBE | BBE Consulting (Australasia) |
BDA | Behre Dolbear Australia Pty Limited |
Behre Dolbear | Behre Dolbear & Company Inc. |
CAGR | Compound Annual Growth Rate |
CDA | Canadian Dam Association |
CDI | CHESS Depository Interests |
CHF | Cemented Hydraulic Fill |
CIK | Categorical Indicator Kriging |
CLM Act | Crown Land Management Act 2016 (in NSW) |
CML | Consolidated Mining Lease |
CMPL | Cobar Management Pty Limited |
CPF | Cemented Paste Fill |
CRA | Conzinc RioTinto Australia |
CRF | Cemented Rock Fill |
CSA | CSA Copper Mine |
CSC | Cobar Shire Council |
CTD | Central Tailings Discharge |
Cu | Copper |
Cube | Cube Consulting Pty Limited |
DCF | Discounted Cash Flow |
DHEM | Drill Hole Electromagnetic (Survey) |
DIDO | Drive-in Drive-out |
DPIE | Department of Planning Infrastructure and Environment (in NSW) |
EL | Exploration Licence |
EM | Electromagnetics (survey) |
EMP | Environmental Management Plan |
EMS | Environmental Management System |
EP&A Act | Environmental Planning and Assessment Act (in NSW) |
EPA | Environmental Protection Agency (in NSW) |
EPL | Exploration (Prospecting) Licence |
EPLs | Environmental Protection Licences |
FAR | Fresh Air Raise |
Effective date: 30 June 2026
Technical Report Summary of the CSA Copper Mine, New South Wales, Australia
Term / Abbreviation | Description |
FEL | Front End Loader |
FIFO | Fly-In Fly-Out |
FLEM | Fixed Loop Electromagnetics (survey) |
FOS | Factor of Safety |
FW | Footwall |
G&A | General and Administration |
g/t | Gram Per Tonne |
GAP | Gap Geophysics Australia Pty Ltd |
Glencore | Glencore Public Limited Company |
GRB | Glencore Geotechnical Review Board |
GRS | Geophysical Resources and Services Pty Ltd |
GSM | Golden Shamrock Mines Pty Limited |
ha | Hectare (10,000m2) |
Harmony | Harmony Gold Mining Company Limited |
Helix | Helix Resources Limited |
HMY | Harmony Gold (Australia) Pty Limited |
HPIFR | High Potential Injury Frequency Rate |
HW | Hangingwall |
ICP-AES | Inductively Coupled Plasma Atomic Emission Spectrometry |
IP | Induced Polarisation (survey) |
ITASCA | ITASCA Australia Pty Limited |
JK or JK Tech | JKTech Pty Ltd |
JORC Code | Joint Mineral Reserve Committee (Australasian Resource/Reserve Code) |
JV | Joint Venture |
km | Kilometre |
km2 | Square Kilometre |
KNA | Kriging Neighbourhood Analysis |
koz | Thousand Troy Ounces |
kt | Thousand Tonnes |
ktpa | Thousand Tonnes per Annum |
kV | Kilovolts |
lb | Pound |
LFB | Lachlan Fold Belt |
LHD | Load-Haul-Dump (Mining Units) |
LHOS | Long Hole Open Stope |
LOA | Life of Asset (Resource Estimate or Financial Model) |
LOM | Life of Mine |
LRF | Loose Rock Fill |
LTIFR | Lost Time Injury Frequency Rate |
m | Meter |
M | Million |
m3/s | Cubic Meters Per Second |
MAC | Metals Acquisition Corporation |
mbs | Meters Below Surface |
MII | Measured, Indicated and Inferred (Mineral Resources) |
MIMDAS | M.I.M Distributed Acquisition System |
ML | Mining Lease |
ML/day | Megalitres per Day |
Effective date: 30 June 2026
Technical Report Summary of the CSA Copper Mine, New South Wales, Australia
Term / Abbreviation | Description |
MLpa | Megalitres per annum |
mm | Micron |
MNE | May Not Exist (Material in Mining Inventory) |
Moz | Million Troy Ounces |
MPa | Mega Pascal |
MPL | Mining Purpose Lease |
MRE | Mineral Resource Estimate |
Mt | Million Tonnes |
MT | Magnetotelluric (survey) |
Mtpa | Million Tonnes Per Annum |
MVA | Megavolt Ampere |
MW | Megawatt |
MWBAC | Megawatt Bulk Air Cooling |
MWE | Megawatt Equivalent |
NAF | Non-Acid Forming |
NC | Non-Classified (Material in Mining Inventory) |
NIR | Not In Reserve (Material in Mining Inventory) |
NNE | North-Northeast |
NNW | North-Northwest |
NRAR | Natural Resource Access Regulator (in NSW) |
NSR | Net Smelter Return |
NSW | New South Wales |
NTSF | Northern Tailings Storage Facility |
OK | Ordinary Kriging |
OR | Mineral Reserves |
OSA | On-Stream Analyz |
Oxley | Oxley Exploration Pty Limited |
oz | Troy Ounce |
P80 | 80% Passing |
PAF | Potential Acid Forming |
POEO Act | Protection of the Environment Operations Act (in NSW) |
Q | Quarter (year) |
QA/QC | Quality Assurance/Quality Control |
QP | Qualified Person |
QPE | Quattro Project Engineering |
QTSC | QTS Central (Deposit) |
QTSN | QTS North (Deposit) |
QTSS | QTS South (Deposit) |
RAB | Rotary Air Blast (drilling) |
RAR | Return Air Raise |
RC | Reverse Circulation (drilling) |
Report or Technical Report | SEC Regulation S-K Technical Report Summary |
RL | Relative Level |
RMP | Rehabilitation Management Plan |
RQD | Rock Quality Designation |
S-K Report | SEC Regulation S-K Technical Report Summary |
SAG | Semi-Autogenous Grinding (Mill) |
SAP | SAP Business Management System |
Effective date: 30 June 2026
Technical Report Summary of the CSA Copper Mine, New South Wales, Australia
Term / Abbreviation | Description |
SEC | United States Securities and Exchange Commission |
SQUID | 3-component Supracon High-temperature Super-Conducting Quantum Interference Device (sensor) |
STSF | Southern Tailings Storage Facility |
t | Tonne (1,000 Kilograms) |
t/m3 | Tonnes per Cubic Meter |
TC | Smelter Treatment Charges |
TRIFR | Total Recordable Injury Frequency Rate |
TRS | SEC Regulation S-K Technical Report Summary |
TSF | Tailings Storage Facility |
US$ | US Dollar |
VDR | Virtual Dataroom |
WB | Wet Bulb (Temperature) |
wmt | Wet Metric Tonne |
XRF | X-Ray Fluorescence |
Harmony Australasia | CONFIDENTIAL1
Technical Report Summary of the CSA Copper Mine, New South Wales, Australia
1Executive Summary
Section 229.601(b)(96)(iii)(B)(1)
1.1Summary
The CSA Mine is located in western New South Wales, 11 kilometres (“km”) northwest of the town of Cobar,
Australia, and is wholly owned by HMY, a wholly-owned subsidiary of Harmony.
This Technical Report Summary conforms to United States Securities and Exchange Commission’s (“SEC”)
Modernised Property Disclosure Requirements for Mining Registrants as described in Subpart 229.1300 of
Regulation S-K (17 CFR Part 229), Disclosure by Registrants Engaged in Mining Operations and Item 601
(b)(96) Technical Report Summary (collectively “S-K 1300”).
The CSA June 2026 Mineral Reserve has been estimated at 17.7 million tonnes of ore, containing 0.6 million
tonnes of copper.
1.2Property Description, Ownership and Mineral Rights
CSA is located in western New South Wales, Australia, (latitude 31° 24’ 32.42°S, longitude 145° 48’ 0.20°E),
11km northwest of the town of Cobar and 600km west-northwest of Sydney.
Cobar Management Pty Ltd (“CMPL”) is an Australian legal entity and operator of CSA. CMPL is the registered
owner of all key assets of the mine including property, mineral, fixed and mobile assets used in the
operation. CMPL was previously owned by Metals Acquisition Corp. (Australia) Pty Ltd after acquisition from
Glencore Operations Australia Pty Limited on June 16, 2023. HMY subsequently acquired CMPL’s ultimate
parent company MAC Copper Limited on October 24, 2025.
CMPL holds a Mining Lease (CML5) over the CSA deposit, surrounded by three Exploration Licences (EL5693,
EL5983 and EL9587) (Figure 1-2). CML5 covers an area of approximately 24.7 square kilometres (“km2”),
while the surrounding EL5693, EL5983 and EL9587 cover approximately 504km2. Ore is produced principally
from two steeply dipping underground mineralised systems, QTS North (“QTSN”) and QTS Central (“QTSC”)
from depths generally between 1,500-1,800 meters (“m”) below surface. The current depth of the decline is
around 1,900m. CMPL mining operations have historically produced, on average, around 1.1 million tonnes
per annum (“Mtpa”) of ore. The underground mine is serviced by two hoisting shafts and a decline. The ore is
crushed underground, hoisted to surface, and milled and processed through the CSA concentrator.
1.3Accessibility, Climate, Local Resources, Infrastructure and Physiography
All-weather access to the CSA is provided via sealed highways and public roads, and the mine is linked by rail
to the ports of Newcastle and Port Kembla (a suburb of Wollongong) from where the copper concentrate
product is exported. Cobar is serviced by a sealed airstrip with commercial flights to and from Sydney.
The climate of Cobar is semi-arid with evaporation typically exceeding rainfall by a ratio of 6:1. The mean
annual rainfall for Cobar is approximately 400 millimetres (“mm”). During summer months, maximum
temperatures typically range between 28-39ºC and during the winter months, maximum temperatures
typically range between 13-20ºC. Minimum temperatures in the winter months typically range between
5-9ºC.
The project is well served by existing infrastructure which includes power supply, water supply, site buildings,
and service facilities. Power is supplied to the site from the state energy network via a 132 kilovolt (“kV”)
transmission line.
The bulk of the water supply for the operation is provided by the Cobar Water Board from a weir on the
Bogan River at Nyngan (Figure 1-1) through a network of pumps and pipelines. Additional water is available
from tailings water recycling, surface water capture, and an installed borefield.
Harmony Australasia | CONFIDENTIAL2
Technical Report Summary of the CSA Copper Mine, New South Wales, Australia
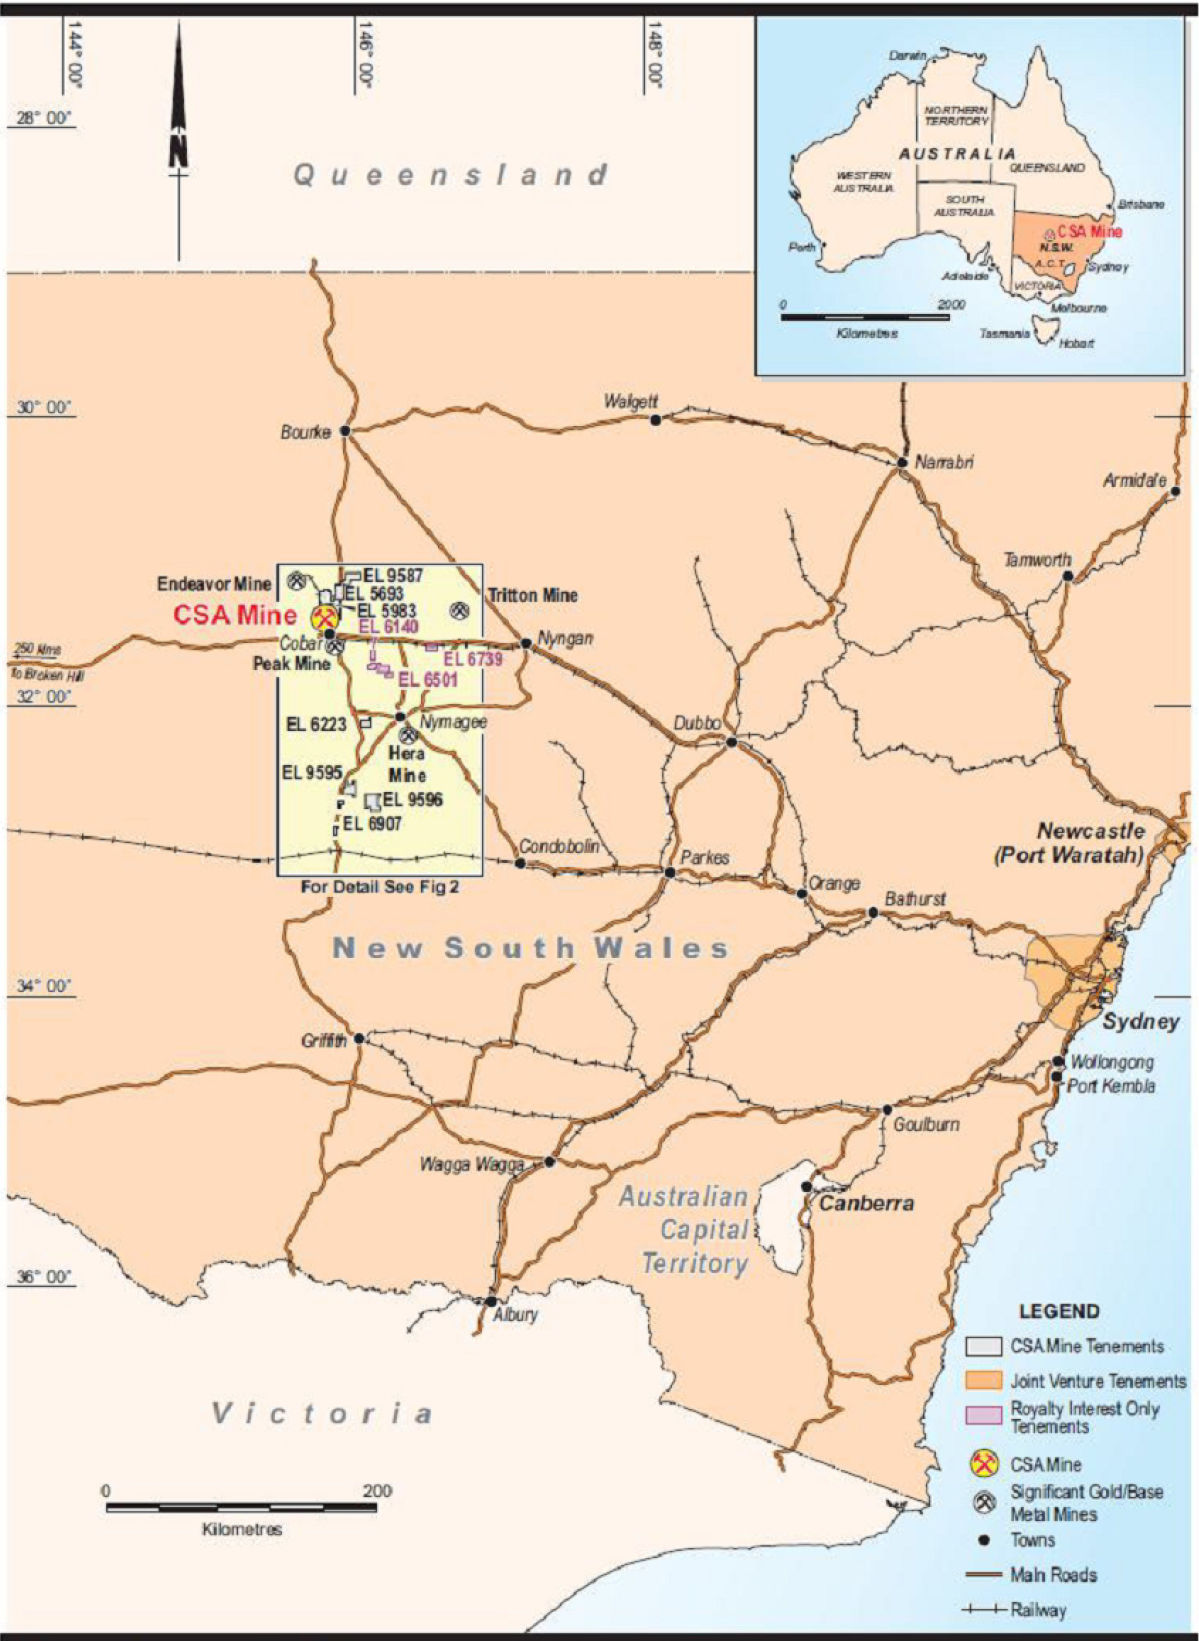
Figure 1-1 Location Plan
Harmony Australasia | CONFIDENTIAL3
Technical Report Summary of the CSA Copper Mine, New South Wales, Australia
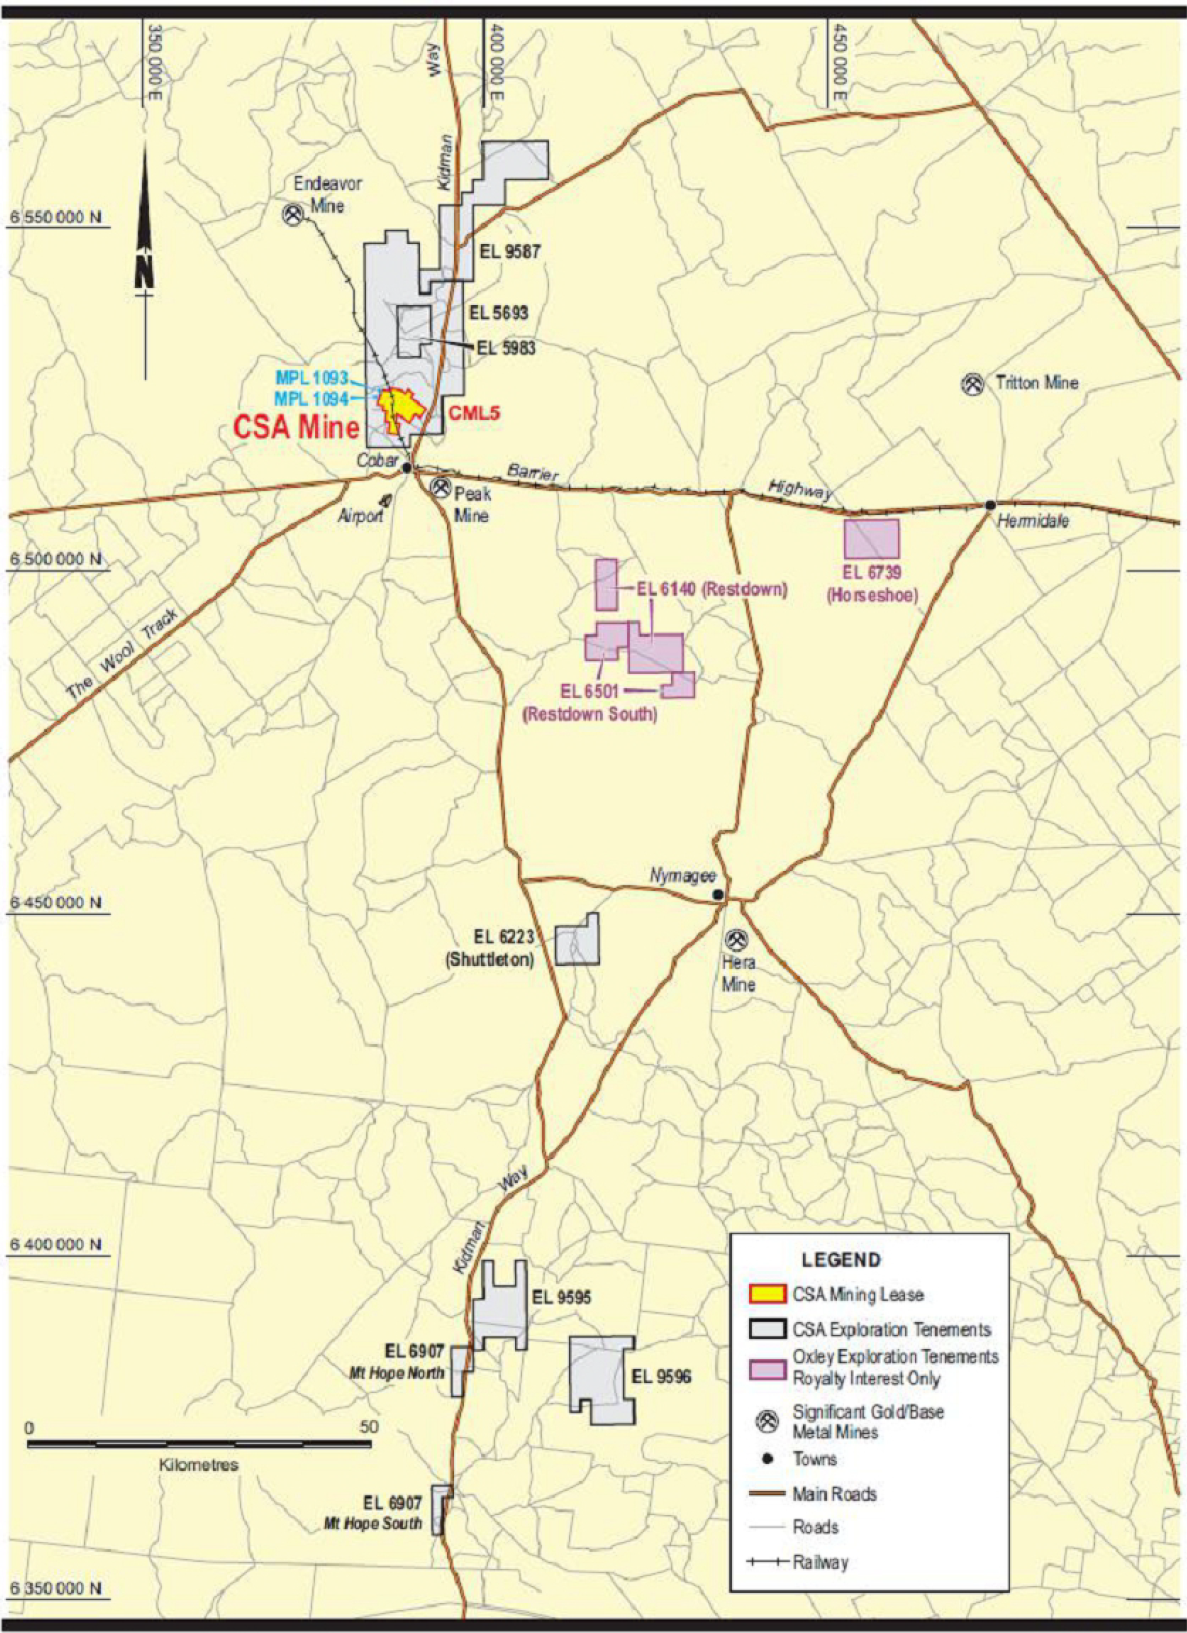
Figure 1-2 CSA Mine Tenements and JV Tenements
1.4History
CSA has a long operating history, with copper mineralisation first discovered in 1871. Early development
commenced in the early 1900s, focussing on near surface mineralisation. In 1965, Broken Hill South Limited
developed a new mechanised underground mining and processing operation, with new shafts, winders,
Harmony Australasia | CONFIDENTIAL4
Technical Report Summary of the CSA Copper Mine, New South Wales, Australia
concentrator, and infrastructure; subsequently, the mine was operated under several different owners, until
the property was acquired by GIAG in 1999. The direct owner and operator of the mine is CMPL, previously
owned by Glencore, MAC and acquired by HMY on October 24, 2025.
1.5Geological Setting, Mineralisation and Deposit
The CSA deposit is located within the Cobar mineral field in the Cobar Basin, a north-south mineralised belt
containing copper, gold, and lead-zinc mineralisation, with five currently operating mines within 80km of
Cobar (Figure 1-2). Mineralisation at CSA is hosted within the Silurian-age CSA Siltstone, a steeply dipping
sequence of interbedded siltstones and sandstones. Mineralisation is associated with north-south faulting
and northwest cross-cutting structures; studies indicate that reactivation of the faults played a significant
role in providing fluid pathways for mineralising fluids and dilational zones for the formation of the mineral
deposits.
The CSA mineralisation occurs in five known systems: Eastern, Western, QTS North (QTSN), QTS Central
(QTSC) and QTS South (“QTSS”) (Figure 1-3). Within these systems multiple lenses occur; lenses are typically
5-30m wide, with relatively short strike lengths (<300m) but significant down plunge extent of up to 1000m.
Not all the systems extend to surface; QTSN which accounts for the bulk of the current production tonnes is
developed from 600m depth while QTSC is developed from a depth of around 1,200m.
The dominant copper sulphide is chalcopyrite (CuFeS2); silver is also present as acanthite (Ag2S).
Harmony Australasia | CONFIDENTIAL5
Technical Report Summary of the CSA Copper Mine, New South Wales, Australia
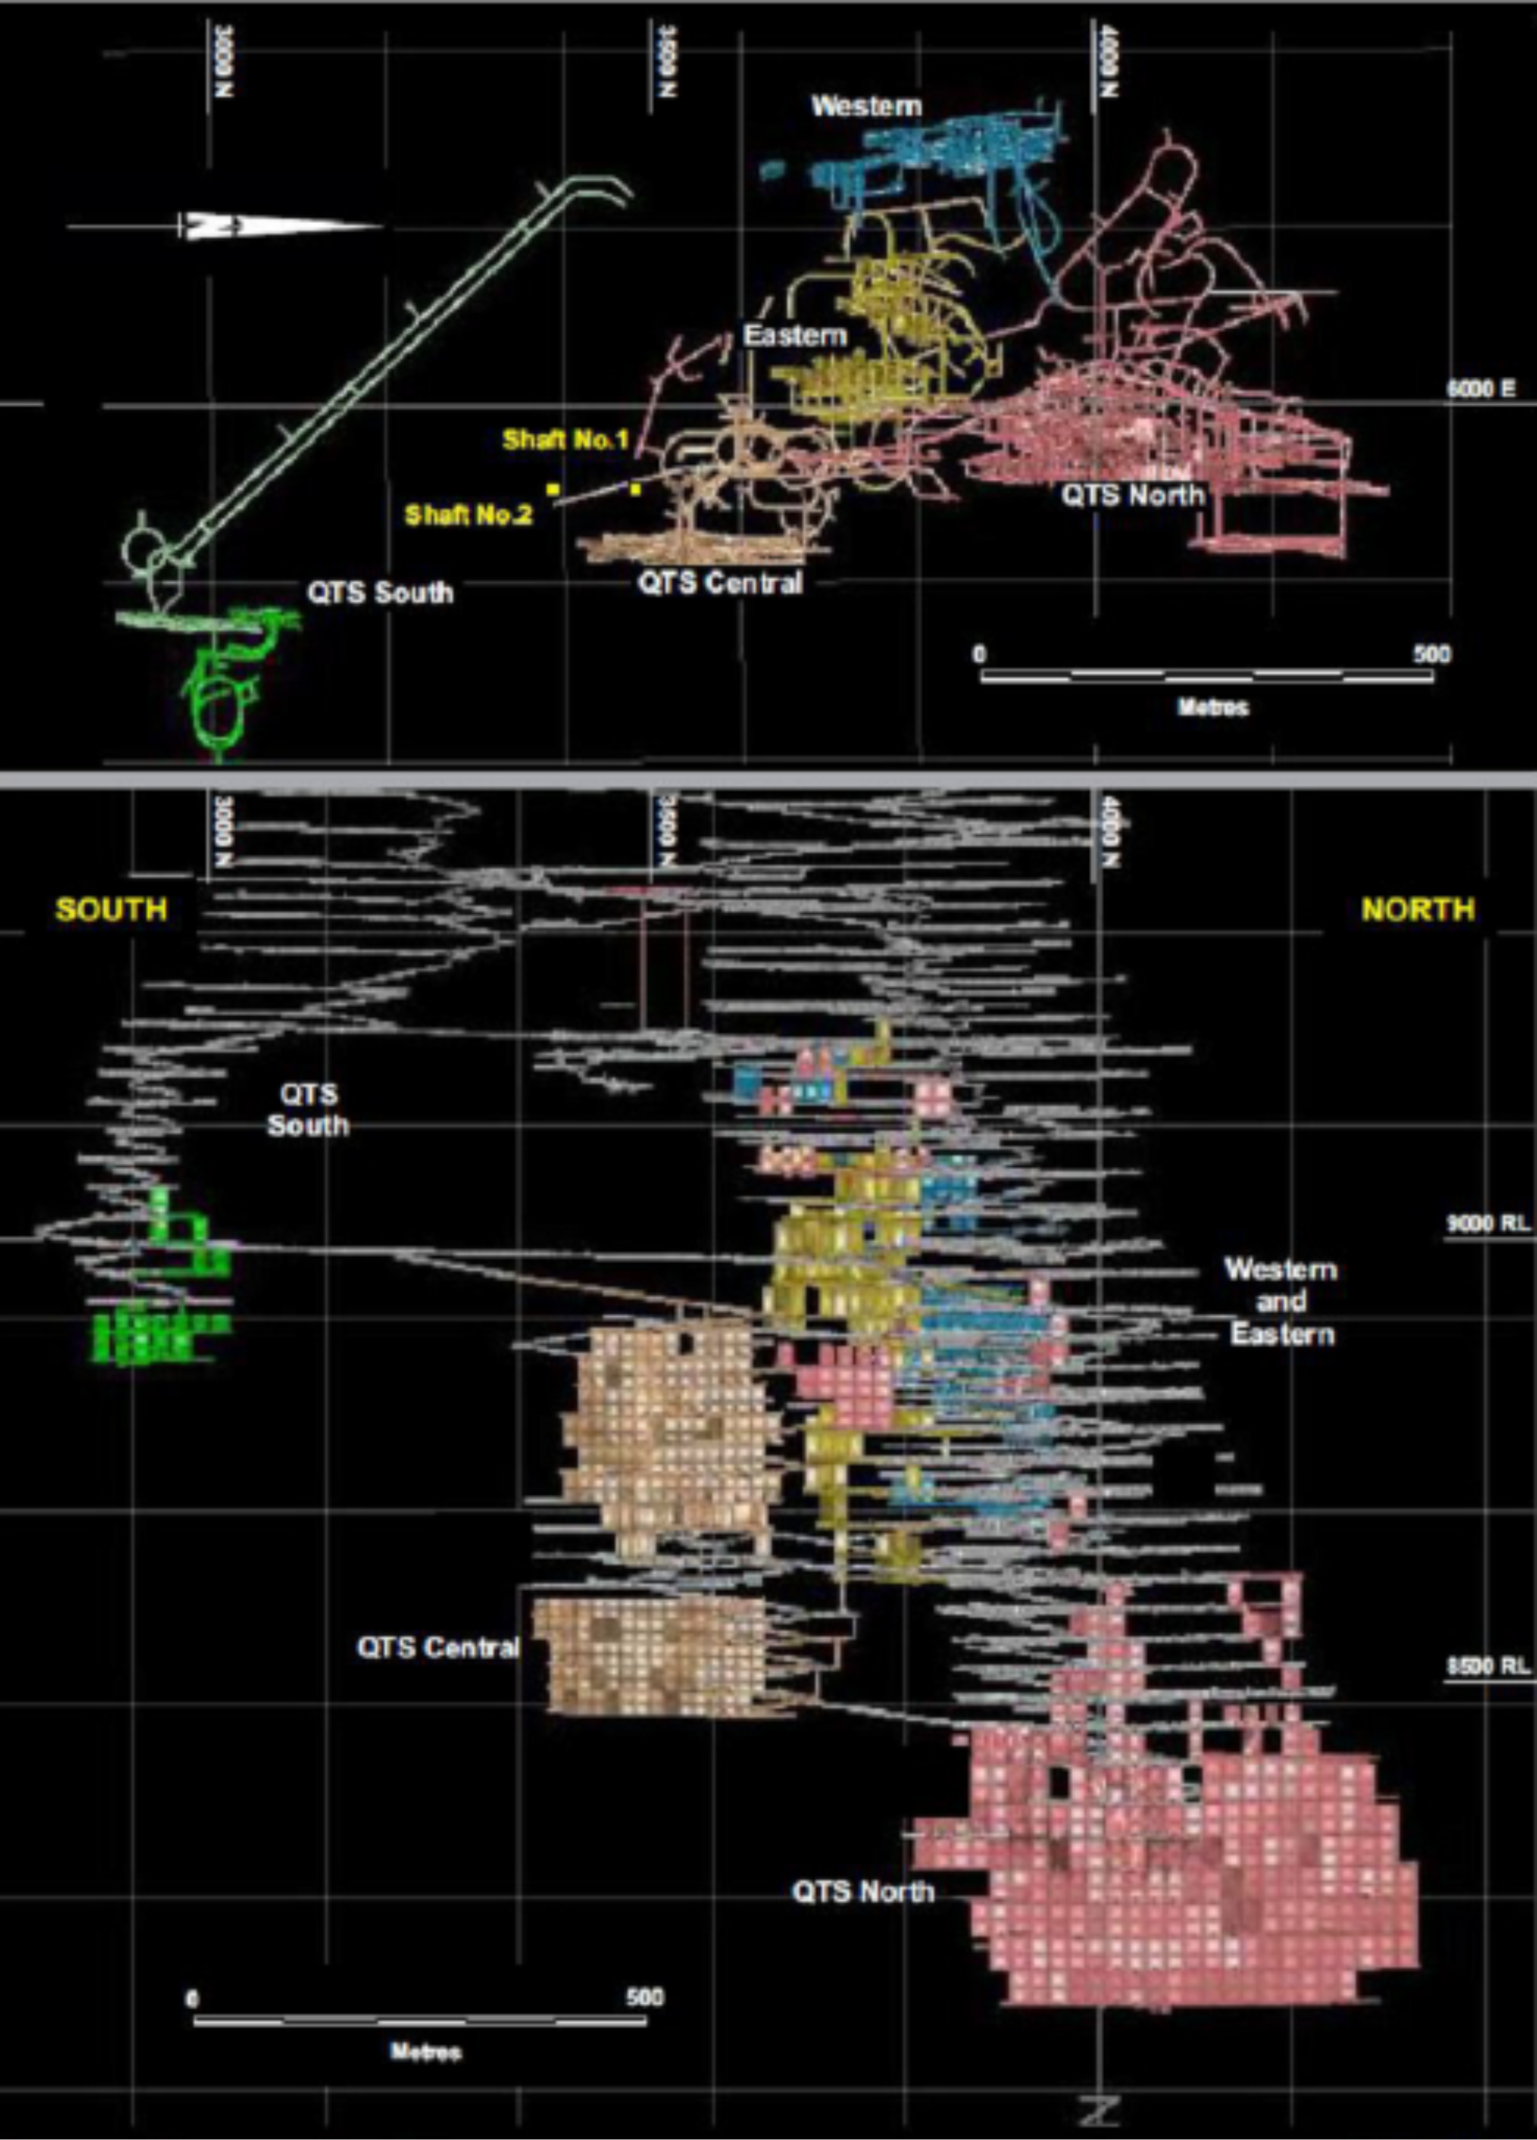
Figure 1-3 Plan and Long Section – Mineralised Systems
1.6Mineral Resource Estimates
The Mineral Resource estimate for CSA covers the whole mine and is reported here in accordance with the
SEC S-K 1300 regulations. The Mineral Resources presented in this section are not Mineral Reserves and do
not reflect demonstrated economic viability. The reported Inferred Mineral Resources are considered too
speculative geologically to have the economic considerations applied to them that would enable them to be
categorised as Mineral Reserves. There is no certainty that all or any part of this Mineral Resource will be
converted into Mineral Reserve. All figures are rounded to reflect the relative accuracy of the estimates and
totals may not add correctly. Mineral Resource estimates exclusive of Mineral Reserves are summarised in
Table 1-1 on a 100% ownership basis. The effective date of the Mineral Resource estimate is 30 June 2026.
Harmony Australasia | CONFIDENTIAL6
Technical Report Summary of the CSA Copper Mine, New South Wales, Australia
Table 1-1 Mineral Resource Estimation 30 June 2026.
Metal >> | Copper | Silver | |||
tonnes | grade | metal | grade | metal | |
kt | % | kt | g/t | koz | |
Measured Mineral Resource | 1,343 | 7.65 | 102.691 | 23.96 | 1,000.558 |
Indicated Mineral Resource | 1,479 | 4.90 | 72.490 | 13.91 | 639.696 |
Total Meas & Ind Resource | 2,822 | 6.21 | 175.181 | 18.69 | 1,640.254 |
Inferred Mineral Resource | 6,173 | 3.76 | 231.942 | 24.83 | 4,767.050 |
Metal >> | Zinc | ||||
tonnes | grade | metal | |||
kt | % | kt | |||
Measured Mineral Resource | 0 | 0.00 | 0 | ||
Indicated Mineral Resource | 280 | 3.64 | 10.187 | ||
Total Meas & Ind Resource | 2,373 | 7.31 | 173.503 | ||
Inferred Mineral Resource | 2,652 | 6.93 | 183.69 | ||
Notes:
•kt = thousand tonnes, g/t = grams per tonne, koz = thousand ounces, mlb = million pounds
•Mineral Resources are reported as at 30 June 2026 and are reported using the definitions in Item 1300 of Regulation S-K (17 CFR Part
229) (S-K 1300)
•Mineral Resources are reported exclusive of Mineral Reserves
•Price assumptions used in the estimation include US$11,900/t of copper and US$38.9/troy ounce (“oz”) of silver; in line with company
long term forecast guidance pricing
•Geological mineralisation boundaries defined at a nominal 2.5% Cu cut-off for high grade lenses, and 1.5% Cu for the lower-grade halo;
Mineral Resources reported above a 1.5% Cu cut-off grade
•Cost assumptions underlying cut-off grade calculation include AUD$109.30/t ore mined, AUD$41.20/t ore milled and AUD$48.50/t
G&A
•Metallurgical recovery assumptions used in the estimation were 97.5% copper recovery and 86.7% silver recovery
•Mineral Resources reported as dry, raw, undiluted, in-situ tonnes
•Zinc reported separately to copper and silver as it does not inform the Reserve.
•Figures are subject to rounding.
Approximately 73% of the current Mineral Resource tonnage and 78% of the contained copper lies within the
QTSN and QTSC systems.
1.7Mineral Reserve Estimate
CSA produces an annual Mineral Reserve estimate, based on actual stope designs incorporating mining losses
and mining dilution. The Mineral Reserve, in accordance with the Subpart 229.1300 of Regulation S-K (17 CFR
Part 229), is based on Measured and Indicated resources only. CSA’s Mineral Reserve estimate as at 30 June
2026 is shown in Table 1-2.
Table 1-2 Mineral Reserve Estimation 30 June 2026
Total Reserve – CSA | |||
Copper | |||
Tonnes | Cu | Cont. Cu | |
[Mt] | [%] | [kt] | |
Total Mineral Reserve | 17.691 | 3.26 | 576.868 |
Proved Mineral Reserve | 12.531 | 3.27 | 410.303 |
Probable Mineral Reserve | 5.161 | 3.23 | 166.565 |
Notes:
•Mineral Reserves are reported as at 30 June 2026 and are reported using the definitions in Item 1300 of Regulation S-K (17 CFR Part
229)(S-K 1300)
•Price assumptions used in the estimation include US$9,900/tonne (US$4.50/lb) of copper and US$38.9/troy ounce of silver; Company’s
internal market-guidance on long-term price estimate as at 30 June 2026
•Mineral Reserves reported tonnes using a Stope breakeven cut-off grade of 2.26% Cu for FY27 to FY28, a cut-off grade of 1.93% for the
remaining periods and a Development breakeven cut-off grade of 1.0% Cu
•Cost assumptions underlying cut-off grade calculation include AUD$109.30/t ore mined, AUD$41.20/t ore milled and AUD$48.50/t
G&A
Harmony Australasia | CONFIDENTIAL7
Technical Report Summary of the CSA Copper Mine, New South Wales, Australia
•Metallurgical recovery assumptions used in the estimation were 97.5% copper recovery and 86.7% silver recovery
•Figures are subject to rounding.
1.8Mining Methods
CSA uses mechanised long-hole open stoping (“LHOS”) with cemented paste fill (“CPF”) as the preferred
mining method. Both transverse and longitudinal retreat sequences are applied, adopting the LHOS method
to the QTSN, QTSC and Eastern orebodies. A modified Avoca stoping method using waste rock fill and
temporary rib pillars has been used successfully in the narrower lenses, principally in the Western orebody.
The future dominance of the QTSN orebody, representing approximately 67% of the copper metal currently
estimated in the Mineral Reserve, creates some concentration risk. Estimated Mineral Resources in the other
orebodies and remnant areas of the mine create contingent ore sources. One of the critical aspects to
achieving production objectives is prioritising and increasing the mine development advance as well as access
to drilling and extraction horizons.
Copper production at CSA is currently mining rate constrained. Considerable work in recent years, including
current capital-expenditure programmes has been directed toward relieving ventilation constraints and
maximising ore production as the mine gets deeper. HMY is targeting future ore production of approximately
1.2Mtpa; increasing depth introduces additional mining challenges, and with annually increasing mining costs
and lower delivered grades in some areas, the long-term business focus is on continuous improvement in
operating efficiencies to unlock additional value.
With the mine progressively becoming deeper, rock stresses are increasing, and more ventilation and cooling
is required. A significant capital works programme was completed in 2022 to increase both fresh air delivery
and cooling to accommodate the current LOM plan. Additional work is underway to provide suitable
underground ventilation connections to manage the current return air restrictions and limitations. The
current resource estimate demonstrates that mineralised tonnage per vertical meter is diminishing with
depth, although this is partially impacted by limited drilling at depth. Importantly, with increasing depth,
travel times for employees and equipment increase and issues around ore and waste movement from the
lower levels of the mine to the hoisting shaft or distant stope voids (in the case of waste rock) require more
closely coordinated planning and management.
Despite the combination of geotechnical stress increasing with depth and the cleaved and bedded siltstones,
ground conditions at the current base of the mine appear fair with the ground conditions risk being
appropriately managed.
1.9Processing and Recovery Methods
The CSA processing plant is a conventional underground crushing, surface grinding and flotation circuit.
Replacement of the two Semi Autogenous Grinding (“SAG”) mills, which were around 50 years old, was
completed in 2023 and has returned the grinding circuit overall utilisation to 91-97%, further supporting a
processing capacity in excess of 1.4Mtpa. The four coarse ore bins (which date from the 1960s) have
experienced downtime for ongoing maintenance and can only be partially filled in their current state. A
staged remediation programme has been capitalised and is being implemented as a priority. Any increase in
the mill throughput is still likely to be constrained by the ability of the mining operation to deliver increased
ore tonnage.
Normal continuous improvement practices are included in LOA planning. Reagent supply is currently steady,
air delivery is good, and the process control system is performing to standard. Metallurgical performance,
both historically and in recent years, has delivered consistently high copper recoveries and reasonable copper
concentrate grades as well as payable silver grades. Based on the consistency of ore feed and metallurgy over
the years and in the current LOM no changes to mill operating performance are foreseen.
1.10Infrastructure
Road access to the mine site from Sydney is via National Highway No. A32, the Barrier Highway, a high-
quality rural highway to Cobar and from there to the mine site on sealed urban roads.
Cobar is serviced by a sealed airstrip with commercial flights five times per week to and from Sydney.
The site is serviced by a rail line which allows transport of concentrate product to the Port of Newcastle for
export. Concentrate is loaded into rail wagons at the site and railed to Newcastle along the NSW rail network.
Railing to Port Kembla, south of Wollongong, is also an option.
Harmony Australasia | CONFIDENTIAL8
Technical Report Summary of the CSA Copper Mine, New South Wales, Australia
Power supply to the site is via a 132kV transmission line from Essential Energy’s western NSW network. The
Essential Energy network is supplied by a mix of conventional and renewable power generation. A 22kV line is
also connected to the site from Cobar and is available for limited supply in emergencies.
The majority of water supply for the operation is provided by the Cobar Water Board from a weir on the
Bogan River at Nyngan through a network of pumps and pipelines. Additional water is available from tailings
water recycling, surface water capture and a borefield installed in 2019. A contingency water line was
installed in 2026 linking CSA to neighbouring Endeavour mine with acquisition rights to the excess water
available. Water demand is around 3 megalitres per day (“ML/day”) in summer, with most water supplied by
the Cobar Water Board system. The Cobar Water Board system is adequate to supply the operation up to
around 1.4Mtpa; the borefield is only required during periods of drought or should a plant feed rate in excess
of 1.4Mtpa be considered for extended periods.
The majority of the workforce is accommodated in Cobar with some senior staff employed on a fly in/fly out
(“FIFO”) or drive in/drive out (“DIDO”) arrangement. No workforce accommodation is provided at the mine
site itself, however, the Company owns and leases various properties in Cobar, as well as ~150 rooms under
full-time contract at the local Village accommodation facility.
Site buildings comprise site offices, warehouses, and services buildings. Site services include power and water
reticulation facilities, communications systems and fuel storage and dispensing facilities.
1.10.1South Tailings Storage Facility (“STSF”)
The STSF average deposition rate is 55kt per month. Embankment raises, Stage 10 and Stage 11 are planned.
Stage 10 is designed and permitted with construction ongoing.
In 2023, CSA completed a study on the installation of buttressing in specific areas on the STSF wall. The
buttresses are designed to improve the Factor of Safety (“FOS”) to the Post Seismic (Liquified Strength), in
line with ANCOLD guidelines. Buttress construction works were completed in April 2024. There are several
viable TSF expansion options available to CSA, and work is ongoing to determine the preferred option. The
options include additional lifts, reclamation of the TSFN that was historically operated by CSA, or construction
of a new facility on one of several identified sites on the lease.
1.10.2Waste Rock
Waste rock from underground development is backfilled into mined-out stopes where possible. Excess waste
is hoisted typically via shaft 1 or trucked to surface for storage on waste dumps or used on TSF construction.
Most waste rock is classified as Non-Acid Forming (“NAF”) but around 30% of the waste material is classified
as Potential Acid Forming (“PAF”) rock. All waste rock materials are geochemically tested for issues related to
acid rock drainage (“ARD”) and potential for metal leaching. Only suitable, low risk waste rock material is
hoisted and stockpiled on the surface.
1.11Environmental Studies, Permitting and Plans, Negotiations or Agreements
CSA operates under a documented Environmental Management System (“EMS”) which forms the basis of
environmental management at CSA and includes appropriate procedures, standards, and Environmental
Management Plans (“EMP”) to ensure all regulatory requirements are met.
The planned future STSF containment raise Stage 10 has been approved, and Stage 11 has commenced early
phase planning to provide additional storage capacity. Regulatory standards that currently apply to the STSF
are Dam Safety NSW and Australian National Committee on Large Dams (“ANCOLD”).
There is strong community support for the CSA operation and CSA has a positive working relationship with
Cobar Shire Council (“CSC”). This is not unexpected given that CSA is the largest employer in the Cobar
region, with approximately 500 employees.
1.12Capital and Operating Costs
Capital and operating costs were developed based on historical cost performance and first principles
calculations using current commodity costs, labour rates and equipment costs. The costs are provided for
each major cost centre including mining, processing, G&A, off site costs, major capital works and fleet
replacement and closure costs.
Capital cost estimates generally include underground mining works such as ventilation upgrades,
maintenance of fixed and mobile equipment, exploration and resource drilling, and replacement of major
Harmony Australasia | CONFIDENTIAL9
Technical Report Summary of the CSA Copper Mine, New South Wales, Australia
equipment. They also cover sustaining capital for the concentrator and supporting infrastructure, capitalised
underground development, ongoing replacement of mobile equipment at the end of its service life, and
rehabilitation of project facilities at the end of mine life.
The HMY forecast of costs for capital works over the life of the mine are summarised in Section 18.1. For the
majority of the significant capital works in the early years, the estimates are based on feasibility study
standard engineering and unit costs from quotations from prospective suppliers and contractors or historical
cost records. The estimates for the later years will have a higher level of confidence as the projects move
forward in the LOM. Capital expenditure (including mine development) for 2025 was AUD$127M, with the
forecast for 2026 increasing to AUD$177M. This represents a significant increase in capital spending
commitment in line with Harmony’s long term vision for the CSA asset.
Due to the recent upgrade of the mining fleet (including the increased payload) and acceleration of shallower
mining fronts such as QTSC (mining up and down the orebody), Eastern orebody and lenses at shaft level in
QTSN, the ore cycle time and associated haulage requirements are expected to remain relatively consistent
over the next 5-6 years. As a result of the more recent steady production profile, fleet and labour
requirements are forecast to remain relatively steady and operating costs at CSA are expected to remain
substantially consistent throughout the Reserve LOM.
The HMY forecast operating costs are estimated using CMPL actual costs as the underlying basis. The split
between capitalised development and underground mining cost is calculated during the mine planning
process and based on the function of the underground development being established, with its respective
allocation to mining operations or capital infrastructure.
CSA has a relatively high proportion of fixed costs; any performance improvement will lead to reduced unit
operating costs. Mining is responsible for around 47% of site operating cash. Of the site mining costs, 44%
relates to labour and contractor costs.
The HMY ore mining rate is forecast to average AUD$118/t, processing costs to be around AUD$44/t milled
and G&A costs averaging approximately AUD$49/t milled, over the Reserve LOM. Overall, the unit costs
appear achievable provided the planned efficiencies are implemented and the mine and mill production
forecasts can be achieved.
Further details on capital and operating costs are outlined in Section 18.
1.13Economic Analysis
This section contains forward-looking information related to the economic analysis for the Project. The
material factors that could cause actual results to differ materially from the conclusions, estimates, designs,
forecasts or projections in the forward-looking information include any significant differences from one or
more of the material factors or assumptions that are set forth in this sub-section including estimated capital
and operating costs, project schedule and approvals timing, availability of funding, projected commodities
markets and prices.
All costs, prices, and monetary values are in Q1 2026 Australian Dollars (AUD$).
The economic analysis of CSA was conducted based on a mine design and schedule of the mined and
processed copper ore outlined in the Mineral Reserves. A discounted cash-flow (“DCF”) model was developed
for this Reserve Case using price assumptions in line with long-term, real, Harmony forecast copper and silver
product prices, being US$9,900/t and US$38.9/oz, respectively. Price assumptions are further outlined in
Section 16.4.
The QP is of the opinion that these prices reasonably reflect a conservative view of current market prices and
are reasonable to use as a forecast of future prices for the purpose of the economic analysis for this report.
The discounted cash-flow establishes that the Mineral Reserve estimates provided in this report are
economically viable. The base case after-tax NPV (7%) is estimated to be AUD$704M. The Net Present Value
determined from a discounted cash-flow analysis is most sensitive to copper price.
Given the extent of historical operations and operating knowledge at CSA, the Mineral Reserve QP considers
the accuracy and contingency of cost estimates used to be well within a feasibility study standard and
sufficient for the economic analysis supporting the Mineral Reserve estimate.
Harmony Australasia | CONFIDENTIAL10
Technical Report Summary of the CSA Copper Mine, New South Wales, Australia
1.14Conclusions and Recommendations
CSA is well established and has a long operating history with well understood and predictable mineralised
lodes leading to reliable Mineral Resource and Mineral Reserve estimation. Production reconciliation
continues to support these estimates. Similarly, operating costs have been consistent over recent years
providing confidence in the forecast operating costs.
HMY is forecasting a modest increase in annual ore mined over the LOM to better utilise the capacity of the
process plant; while this may lead to some reduction in unit costs, forecast operating costs have taken into
account the general increases in input costs experienced across the entire mining industry.
QP notes that a large proportion of the Mineral Resource lies in the deeper portions of CSA. However, the
Mineral Reserve is largely accessible from the existing mine development, and as such, should experience
mining conditions no worse than experienced today. HMY has experience in deep underground operations
with multiple assets in South Africa currently operating at depths in excess of 3,000m. CSA has an estimated
mine life of approximately 15 years based on the current Mineral Reserves (June 2026) and is considered
relatively low risk.
Overall, the QP considers that the current Mineral Resource estimate and the Mineral Reserve estimate
prepared by HMY provide a reasonable guide to the in situ and recoverable mineralisation respectively.
Significant exploration potential remains within the mine area, most notably the down dip extensions of
lodes which remain open at depth. HMY has initiated a deep drilling campaign from surface to target deep
Interpreted mineralisation that cannot currently be incorporated into Mineral Resources or Reserves. There
is reasonable expectation that the mine life will extend beyond the current Mineral Reserve limits, and the
mine has a long history of ongoing reserve replacement with the primary ore lenses still open at depth.
2Introduction
Section 229.601(b)(96)(iii)(B)(2) (i-v)
2.1Terms of Reference
Report Purpose
The purpose of this report is to support the Mineral Resource Estimate and Mineral Reserve Estimate for CSA,
both of which have an effective date of 30 June 2026.
Terms of Reference
This Technical Report Summary conforms to United States Securities and Exchange Commission’s ("SEC")
Modernized Property Disclosure Requirements for Mining Registrants as described in Subpart 1300 of
Regulation S-K (17 CFR Part 229), Disclosure by Registrants Engaged in Mining Operations (S-K 1300) and Item
601(b)(96) Technical Report Summary.
Unless otherwise indicated, all financial values are reported in Australian (AUD) currency (AUD$) including all
operating costs, capital costs, cash flows, taxes, revenues, expenses, and overhead distributions.
Unless otherwise indicated, the metric system is used in this Technical Report.
2.2 Qualified Persons
This TRS has been prepared following Harmony Gold Mining Company Limited's acquisition of CSA and
supports the disclosure of Mineral Resources and Mineral Reserves in the Company's Annual Report on Form
20-F. The effective date of this TRS is 30 June 2026. No material changes have occurred between the effective
date and the date of signing.
This TRS was prepared by Greg Job, the Qualified Person ("QP"), who is employed on a full-time basis by the
Registrant. The QP's qualifications, areas of responsibility and record of personal inspection of the property
are summarised in Table 2-1.
Qualified Person | Prof. Assoc. | Qualifications | TRS Section Responsibility | Personal Insp. |
Mr. G. Job | FAusIMM | BSc. MSc (Min Econ) | All information in the TRS | Regular site inspections, most recent Aug 2026 |
Harmony Australasia | CONFIDENTIAL11
Technical Report Summary of the CSA Copper Mine, New South Wales, Australia
In preparing this TRS, the Qualified Person ("QP") relied upon information, analyses and technical work
prepared by appropriately qualified subject matter experts in the disciplines of geology, mine planning,
geotechnical engineering, hydrogeology, tailings management, metallurgy, environmental management,
infrastructure and finance. These specialist contributions included information relating to mining rights,
surface rights, contractual agreements, historical operating expenditures, community relations and other
matters.
The QP reviewed and accepted the work of these specialists and considers it reasonable and suitable for use
in this TRS. Responsibility for the scientific and technical disclosure contained herein remains with the QP.
2.3.
2.4Information Sources
The reports and documents listed in Section 24 of this Report were used to support the Report preparation.
All plans for mining operations, future plans, potential, forecasts, projections, and estimates of Mineral
Resources, Mineral Reserves and LOM Mine Plans and Production Schedules are forward looking statements.
The QP considers this report and its conclusions provide a fair and reasonable assessment of the CSA
operations, future plans, and potential. However, any forecasts and projections cannot be assured and
factors both within and beyond the control of HMY could cause the actual results to be materially different
from the assessments and the projections contained in this report.
2.5Previous Reports on the Project
Metals Acquisition Limited has previously filed Technical Report Summaries for the Project with the United
States Securities and Exchange Commission. The last Technical Report Summary (“TRS”) for CSA filed was on
April 21, 2024 as Exhibit 96.1 to the Company’s Form F-4/A filing at the time by MAC. The TRS filed on April
24, 2024 reported Mineral Resource and Mineral Reserve Estimates as at December 31, 2023.
Additional previous Mineral Resource and Mineral Reserve estimates are known to have been reported to
other non-US regulatory bodies by Glencore Plc. and Metals Acquisition Limited CHESS Depository Interests
(“CDI”) under JORC Code 2012, however such works should not be considered in conformance with SEC's
Modernized Property Disclosure Requirements for Mining Registrants as described in Subpart 1300 of
Regulation S-K (17 CFR Part 229), Disclosure by Registrants Engaged in Mining Operations and Item 601
(b)(96) Technical Report Summary.
3Property Description
Section 229.601(b)(96)(iii)(B)(3) (i-vii)
3.1Property Location
The CSA Copper Mine (latitude 31° 24’ 32.42°S, longitude 145° 48’ 0.20°E) is located 11km northwest of the
town of Cobar, in western New South Wales, Australia (Figure 1), approximately 600km west-northwest of
Sydney.
CMPL is an Australian legal entity and operator of CSA. CMPL is the registered owner of all key assets of the
mine including property, mineral, fixed and mobile assets used in the operation. CMPL is ultimately owned by
HMY, which completed the purchase transaction from MAC on 24 October 2025.
3.2Property and Title in Australia
The forms of Australian land title relevant to CSA are listed below.
Crown Lands
Crown land is land that is owned and managed by the NSW Government. It accounts for approximately 42%
of all land in New South Wales and carries special provisions. Crown land includes a range of land types, such
as:
•Crown lands held under lease, licence or permit
•Community managed reserves
•Lands retained in public ownership for environmental purposes
Harmony Australasia | CONFIDENTIAL12
Technical Report Summary of the CSA Copper Mine, New South Wales, Australia
•Lands within the Crown public roads network
•Other unallocated lands.
•Many non-tidal waterways across the state also comprise Crown land as do most tidal waterway land.
•Western Lands Lease
Nearly all the land in the Western Division of NSW is held under Western Lands Leases granted under the
Western Lands Act 1901. From 1 July 2018, this legislation was replaced by the Crown Land Management Act
2016 (“CLM Act”). The 6,600 Western Lands Leases include: 4,300 for grazing; 573 for agriculture; 1,593 for
residence; 134 for mining and other specific purposes. Most leases are perpetual (ongoing) and can only be
used for a designated purpose. The State charges an annual rent for leases in accordance with the CLM Act;
grazing and agriculture lease rents are based on the total area of the property and on the environmental
impact of the land use, including a credit for managed conservation. Rents for residential and business leases
are 3% and 6% of the unimproved land value, respectively.
3.3Mineral Title in New South Wales
The types of NSW mineral titles relevant to CSA are listed below.
Exploration in NSW is regulated under the Mining Act 1992. The aim is to encourage and help in the discovery
and development of NSW’s mineral and coal resources and encourage ecologically sustainable development.
Before exploring for minerals in NSW, an explorer must obtain an exploration licence.
3.3.1Exploration Licence (“EL”)
This licence grants the title holder the exclusive rights to explore for a specific mineral or mineral group(s)
within a designated area. ELs are typically granted and renewed for periods of 2–6 years. An EL does not
permit mining, nor does it guarantee that a mining lease will be granted.
3.3.2Exploration (Prospecting) Licence (“EPL”)
These licences were granted under the Mining Act 1973 to allow a title holder to explore for minerals
(excluding coal) within a designated area. While EPLs are no longer granted, some remain active. Under the
Mining Act 1992, EPLs are deemed to be exploration licences, however they do not permit mining, nor
guarantee that a mining lease will be granted.
3.3.3Mining Lease (“ML”)
A mining (minerals) lease application is made when mining or production is economically, technically and
environmentally feasible. At this stage companies must specify exactly what mineral(s) they intend to extract.
Mining leases give the title holder the exclusive right to extract a specific resource over a selected area.
To be granted a mining lease companies must prove that there is an economically mineable mineral resource
within the area of the proposed mining lease, and that they have the financial and technical resources to
carry out any mining in a responsible way. A development consent must be granted by the relevant consent
authority, and an Environmental Protection Licence (EPL) must have been issued by the NSW Environmental
Protection Agency under the Protection of the Environment Operations Act 1997.
Title holders must comply with all conditions of title and all relevant requirements of the Mining Act 1992
and associated regulations for the life of the lease.
3.3.4Mining Purposes Lease (“MPL”)
These are leases granted for areas in mineral mining operations for purposes such as infrastructure where
resource extraction does not take place. Hence, they will appear as “nil mineral”. MPLs were granted under
the 1906 and 1973 Mining Acts. MPLs are no longer granted and leases for mining purposes are now
categorised as MLs under the Mining Act 1992.
3.3.5Consolidated Mining Lease (“CML”)
This is a mining lease which covers adjoining titles held by one title holder. On a CML, there is often a
common border between where mining takes place or additional areas shown as “'nil mineral” areas, which
is where production facilities and other infrastructure may be located.
3.4Mineral Titles, Claims, Rights, Leases and Options
Harmony Australasia | CONFIDENTIAL13
Technical Report Summary of the CSA Copper Mine, New South Wales, Australia
3.4.1Mineral Titles
CMPL has an extensive mineral tenement holding located in the prospective Cobar Basin comprising one
Mining Lease (CML5), two Mining Purposes Leases (MPL1093/1094), five wholly owned Exploration Licences
(EL5693, EL5983, EL9587, EL9595 and EL9596), two joint venture (“JV”) Exploration Licences (EL6223/6907)
and three ELs in which CMPL’s interest has recently been converted to a royalty interest (EL6140/6501/6739)
(Table 3-1) (Figure 1-2). CML5 and MPL1093/1094 will reach expiry within the Reserve life of mine period,
across 2028 and 2029. CMPL has begun preparations for the renewal application, well in advance of the
expiry, and expects the renewals to be granted in due course.
CML5 covers an area of approximately 24.7km2 (2,474 hectares (“ha”)), the MPLs total approximately 30ha,
while the surrounding exploration tenements (EL5693, 5983 and 9587) cover approximately 504km2. EL5693,
EL5983, EL9587, EL9595 and EL9596 are held by CMPL. CMPL has recently acquired the remaining joint
venture interest from AuriCula Mines Pty Limited (“AuriCula”) covering the Shuttleton and Mt Hope
Exploration Licence tenements south of Cobar (CMPL now 100% interest). CMPL previously held joint venture
interests with Oxley Exploration Pty Limited (“Oxley”) in the Restdown, Restdown South, and Horseshoe
tenements southeast of Cobar, but these interests have recently been reduced to a royalty-only interest,
being a 1% net smelter return interest on any mineral or metallic product.
3.4.2Land Tenure
CML5 occupies portions of five Western Land Leases (Nos. 9565, 731, 13844, 3667, 13844) and Crown Land
including parts of the Cobar Regeneration Belt. MPL1093 and MPL1094 occupy Crown Land.
3.4.3Native Title
CSA is located within an area where native title has been determined to exist in favour of the Ngemba
Ngiyampaa, Wangaaypuwan and Wayilwan People. The determination is relevant to parts of the mining and
exploration tenure associated with CSA, including CML 5 and EL 5693.
Native title compliance considerations will be managed through ongoing engagement with relevant
government agencies and native title representatives. These matters are expected to be addressed through
the applicable statutory processes and, where required, agreements or consents to support continued mining
and exploration activities.
Harmony Australasia | CONFIDENTIAL14
Technical Report Summary of the CSA Copper Mine, New South Wales, Australia
Table 3-1 CMPL Tenement Holding
Tenement | Area | Granted | Expiry | Status | Details | Holder |
CML5 | 2,474ha | 12/01/1993 | 24/06/2028 | Current | CSA Mine | CMPL |
MPL1093 | 16ha | 02/05/1947 | 02/05/2029 | Current | MPL for water harvesting | CMPL |
MPL1094 | 14ha | 02/05/1947 | 02/05/2029 | Current | MPL for water harvesting | CMPL |
EL5693 | 111 units | 02/08/2000 | 02/07/2027 | Current | EL (CSA Regional) | CMPL |
EL5983 | 11 units | 30/08/2002 | 30/06/2027 | Current | EL wholly within EL5693 | CMPL |
EL6223 | 13 units | 04/05/2004 | 04/05/2029 | Current | EL (Shuttleton) | CMPL |
EL6907 | 11 units | 10/11/2007 | 10/11/2027 | Current | EL (Mt Hope) | CMPL |
EL6140 | 24 units | 22/10/2003 | 22/10/2026 | Current | EL (Restdown) - royalty interest | Oxley Exploration Pty Ltd |
EL6501 | 15 units | 01/05/2006 | 01/01/2027 | Current | EL (Restdown South) - royalty interest | Oxley Exploration Pty Ltd |
EL6739 | 15 units | 27/03/2007 | 27/03/2024 | Pending* | EL (Horseshoe 2) - royalty interest | Oxley Exploration Pty Ltd |
EL9587 | 46 units | 20/07/2023 | 20/07/2029 | Current | EL (Tinderra) | CMPL |
EL9595 | 25 units | 18/08/2023 | 18/08/2029 | Current | EL (Sugarloaf) | CMPL |
EL9596 | 35 units | 18/08/2023 | 18/08/2029 | Current | EL (Ural) | CMPL |
Notes: CML = Consolidated Mining Lease; MPL = Mining Purpose Lease; EL = Exploration Licence; ELA = Exploration Licence Application;
ha = hectare; in NSW one EL map unit is one minute of latitude by one minute of longitude or approximately 3km2. * Oxley has
submitted a renewal application for a further three-year term for EL6739 to the Department of Regional NSW – Mining, Exploration &
Geoscience; this renewal application is currently being assessed.
3.4.4Joint Venture Interests
Joint venture interests held by CSA are outlined for completeness but are not considered material for the
purposes of this Report.
The ground within the Cobar Basin is tightly held with a number of active explorers. Operating and previously
operating mines in the vicinity of CSA’s copper mine include the Endeavor lead-zinc mine (CBH Resources),
Peak and Hera gold-copper mines (Aurelia Metals), and the Tritton copper mine (Aeris Resources) (Figure
1-2).
3.4.4.1Water Rights
At present, CMPL holds an entitlement of 1,356 megalitres per annum (“MLpa”) of high security water under
the Water Sharing Plan for the Macquarie and Cudgegong Regulated Rivers Water Source. These water
licences are issued under the NSW Water Management Act 2000.
CMPL also holds groundwater entitlements. However, river water is preferred due to the levels of sulphates
and the hardness of the ground water.
Two water storages that receive surface runoff from the catchments are located to the northwest of the
mine, named Old Mine Dam North and South and held under Mining Purpose Leases MPL1093 and MPL1094
respectively.
A summary of CSA’s mine water licences is provided in Table 3-2.
Table 3-2 CSA Mine Water Licences
License Number | Source | Category | Allocation |
WAL36335 | Macquarie and Cudgegong Regulated Rivers Water Source | Regulated River – High Security | 542.4 units |
Harmony Australasia | CONFIDENTIAL15
Technical Report Summary of the CSA Copper Mine, New South Wales, Australia
WAL36336 | Macquarie and Cudgegong Regulated Rivers Water Source | Regulated River – High Security | 813.6 units |
WAL28539 | Lachlan Fold Belt Groundwater Source | Aquifer | 300 units |
WAL28887 | Lachlan Fold Belt Groundwater Source | Aquifer | 210 units |
3.4.5Royalties
3.4.5.1State Royalty
In NSW, most minerals are owned by the state. Under the Mining Act 1992, royalties are payable on
extracted minerals and royalty payments are jointly managed by Mining, Exploration and Geoscience within
the Department of Regional NSW, and Revenue NSW. For copper and silver mined at CSA, an ad valorem
royalty is calculated at 4 per cent of the value of production less allowable deductions.
3.4.5.2Glencore 1.5% Cu NSR
As part of the sale consideration, HMY entered into a copper Net Smelter Royalty (“NSR”) in favour of
Glencore. This is at a rate of 1.5% for copper only based on the NSR received by CMPL for the life of the mine.
3.4.6Encumbrances
The QP is not aware of any material encumbrances that would impact the current resource or reserve
disclosures as presented herein.
Permitting and Development Consents
CSA operates under several authorisations including:
•Development Consents authorised by the CSC, under referral from other government departments
•Landowner’s Consent authorised by NSW Department of Planning Infrastructure and Environment
(“DPIE”)
•Mine Tenements authorised by the NSW DPIE
•Rehabilitation Management Plan (“RMP”) authorised by the NSW Resources Regulator
•Environmental Protection Licence (EPL1864) authorised by the NSW Environmental Protection Agency
(“EPA”)
•Water Licences issued under the NSW Water Management Act 2000; responsibilities for authorising
and managing water licences are shared between the Natural Resources Access Regulator (“NRAR”)
and Water NSW; NRAR is responsible for compliance and enforcement of NSW Water Law including
water access licence requirements
•NSW Western Lands Lease and Property Vegetation Plans authorised by the Western Catchment
Authority under the NSW Crown Land Management Act 2016.
Mining projects in NSW (including expansions or modifications of existing projects) require development
consent under the NSW Environmental Planning and Assessment Act 1979 (“EP&A Act”).
The earliest statutory development consent held by CMPL for CSA is Local Development Consent No. 31/95
and Amendment 97/98:33 approved by CSC in 1995 and 1998 which permits use of CSA site by CMPL.
Subsequent expansions and amendments of mining development at CSA mine have all been assessed and
administered by the CSC.
3.4.7Rehabilitation Management Plan (RMP)
Environmental aspects of mineral exploration and mining (including mine rehabilitation and closure) in New
South Wales are administered under the NSW Mining Act 1992.
The recent introduction of the Mining Amendment (Standard Conditions of Mining Leases – Rehabilitation)
Regulation 2021, requires large mines to have a Rehabilitation Management Plan (RMP). CSA Mine has
completed an RMP and has had its Rehabilitation Objectives Statement approved by the NSW Resources
Regulator. CSA, as the lease holder, will provide annual reporting and scheduling of rehabilitation via an
Harmony Australasia | CONFIDENTIAL16
Technical Report Summary of the CSA Copper Mine, New South Wales, Australia
Annual Report and Forward Programme (three-year period). This has replaced the previous requirement for
an Annual Environmental Management Report (“AEMR”).
3.4.8Environmental Protection License
The Protection of the Environment Operations Act (“POEO Act”) is the statutory instrument through which
certain specified activities are regulated by the NSW Environment Protection Authority (EPA). Activities are
administered by means of Environment Protection Licences (“EPLs”) issued to operators of the premises on
which the activities occur. CSA currently holds EPL1864 authorising mining of minerals to a maximum annual
production capacity of 2Mtpa. The EPL1864 has a current Environmental Risk Level of 1, with Level 1 being
the lowest risk score.
There are no additional required activities by CSA and given the historical operations of the mine and long-
standing, regular interactions with the regulator, no material changes are expected to occur as a result of
these reviews.
3.4.9Violations and Fines
The QP is not aware of any current material violations or fines imposed under the Regulations of the Mining
Act 1992 that apply to CSA.
3.5Significant Factors and Risks That May Affect Access, Title or Right to Perform Work
With respect to mining titles, the QP is not aware of any significant risks that may affect access, title, or the
right or ability to perform work in relation to CSA.
4Accessibility, climate, local resources, infrastructure, physiography
Section 229.601(b)(96)(iii)(B)(4) (i-iv)
4.1Topography, Elevation and Vegetation
CSA is approximately 260m above sea level and is located in an area of low undulating north-northwest
trending rises and is associated with a broad, prominent hill, Elouera Hill, which rises approximately 30m
above the surrounding landscape. The mine lies close to the local drainage divide between the catchments of
Sandy Creek in the southwest and Yanda Creek to the northeast.
The Cobar area has been impacted by mining and agricultural activities since the 1880s. The existing
landscape surrounding CSA is characterised by mining infrastructure, tailings storage facilities, shafts,
disturbed grasslands and soil and rock stockpiles. The native vegetation of the area has been impacted by
these activities with the historic removal of much of the native vegetation by clearing and over-grazing,
resulting in erosion and extensive colonisation of the native vegetation. This has created a dense regrowth,
referred to as ‘woody weeds’ or Invasive Native Species. The landscape has become highly modified and
vulnerable to wind and water erosion, particularly those areas devoid of vegetation ground cover protection.
The region surrounding CSA is dominated by rangeland agriculture.
4.2Accessibility
CSA is located 11km northwest of the town of Cobar, in western NSW, Australia (Figure 1-1), approximately
600km west-northwest of Sydney. The mine is accessed via sealed highways from Sydney to Cobar and sealed
urban roads from Cobar to the mine site.
Roads
Road access to the mine site from Sydney is via National Highway No. A32, the Barrier Highway, a high-
quality rural highway to Cobar and from there to the mine site on sealed urban roads.
4.2.1Airstrip
Cobar is serviced by a sealed airstrip with commercial flights five times per week to and from Sydney.
4.2.2Rail
The site is serviced by a rail line (Figure 1-1) which allows transport of concentrate product to the Port of
Newcastle for export. Concentrate is loaded into rail wagons at the site and railed to Newcastle along the
NSW rail network. Railing to Port Kembla, south of Wollongong, is also an option.
Harmony Australasia | CONFIDENTIAL17
Technical Report Summary of the CSA Copper Mine, New South Wales, Australia
4.3Climate
The climate of Cobar is semi-arid with evaporation typically exceeding rainfall by a ratio of 6:1. The mean
annual rainfall for Cobar is approximately 400mm. During summer months, maximum temperatures typically
range between 28-39ºC and during the winter months, maximum temperatures typically range between
13-20ºC. Minimum temperatures in the winter months typically range between 5-9ºC. Rainfall and
temperature records have been recorded from May 1962 and evaporation from November 1967.
4.4Infrastructure
4.4.1Power Supply
Power supply to the site is via a 132kV transmission line from Essential Energy’s western NSW network. The
Essential Energy network is supplied by a mix of conventional and renewable power generation, including the
102 megawatt (“MW”) and 132MW solar farms in the nearby towns of Nyngan and Nevertire. A 22kV line is
also connected to the site from Cobar and is available for limited supply in emergencies.
4.4.2Water Supply and Water Pipelines
The majority of water supply for the operation is provided by the Cobar Water Board from a weir on the
Bogan River at Nyngan (Figure 1-1) through a network of pumps and pipelines. Additional water is available
from tailings water recycling, surface water capture and a borefield installed in 2019. Water demand is
around 3 megalitres per day (ML/day) in summer, with most water supplied by the Cobar Water Board
system. The borefield has capacity for up to 1.3ML/day. The Cobar Water Board system is adequate to supply
the operation up to around 1.4Mtpa; the borefield is only required during periods of drought or should a
plant feed rate in excess of 1.4Mtpa be considered for extended periods.
Additional water can be secured by replacing the pipeline from the Cobar Water Board system to the mine
site that currently has approximately 20% transmission losses.
4.4.3Workforce Accommodation
The majority of the workforce is accommodated in Cobar with some senior staff employed on a fly in/fly out
(FIFO) or drive in/drive out (DIDO) arrangement. No workforce accommodation is provided at the mine site
itself, however, the Company owns and leases various properties in Cobar, including the reservation of 150
rooms at the local accommodation facility.
4.4.4Site Buildings and Services
Site buildings comprise site offices, warehouses, and services buildings. Site services include power and water
reticulation facilities, communications systems and fuel storage and dispensing facilities.
4.4.5Tailings Storage Facility
CSA mine currently operates one tailings storage facility, the South Tailings Storage Facility (STSF) (Figure
4-1), comprising the main STSF (approximately 63ha) and the STSF Extension (19ha). In 2010, the STSF was
upgraded to alter the deposition method to a central depositional system. This method provides substantial
water savings and will result in a final landform more amenable to rehabilitation. There will also be a
reduction in the requirement for suitable material for tailings dam wall lifts and final capping; final topsoil
requirements for rehabilitation will be lower than with the old multi-spigot perimeter depositional method
and there will be an increase in tailings dam integrity as the resultant solids will contain less moisture.
After several lifts of the perimeter embankment, the current wall lift (Stage 10) is expected to have
deposition capacity through to 2031. Further perimeter embankment raises (Stage 10 and 11) are scheduled
on the STSF, before establishing a new facility. Stage 10 (Development approval received) and 11 (pre-
planning underway) will provide storage capacity until approximately 2033 (at a nominal 1.2 Mtpa production
rate). Studies completed by CSA’s engineer of record have identified long term tailings storage options
(including the potential use of the North Tailings Storage Facility (NTSF)) to cater for an extended mine life
well beyond the current Reserve mine life. Works are underway to refine designs, estimates and determine
the preferred option.
Tailings from the process plant flotation circuit are thickened in a high-rate thickener, and the underflow is
sent to the paste fill plant or to the STSF. Supernatant water is collected in a dedicated decant dam for
recycling to the process plant circuit.
Harmony Australasia | CONFIDENTIAL18
Technical Report Summary of the CSA Copper Mine, New South Wales, Australia
The STSF is being operated proficiently, exhibiting no substantial concerns regarding the facility's structural
integrity. Recent stabilisation works were completed by installing buttressing at designated positions along
the STSF perimeter embankment. This is aimed at improving Factor of Safety (FOS) criteria under Post-
Seismic (Liquefied Strength) conditions. The NTSF (132.9ha) which lies adjacent to the northern boundary of
the STSF, has been decommissioned and has been excised from the CSA Mine Lease (CML5); NTSF is owned
by, and is the responsibility of, the New South Wales government. Initial discussions between the Company
and the applicable government agencies have indicated that the government would support reclamation of
the NTSF, should the Company decide that the NTSF was the preferred long-term tailings storage solution.
Harmony Australasia | CONFIDENTIAL19
Technical Report Summary of the CSA Copper Mine, New South Wales, Australia
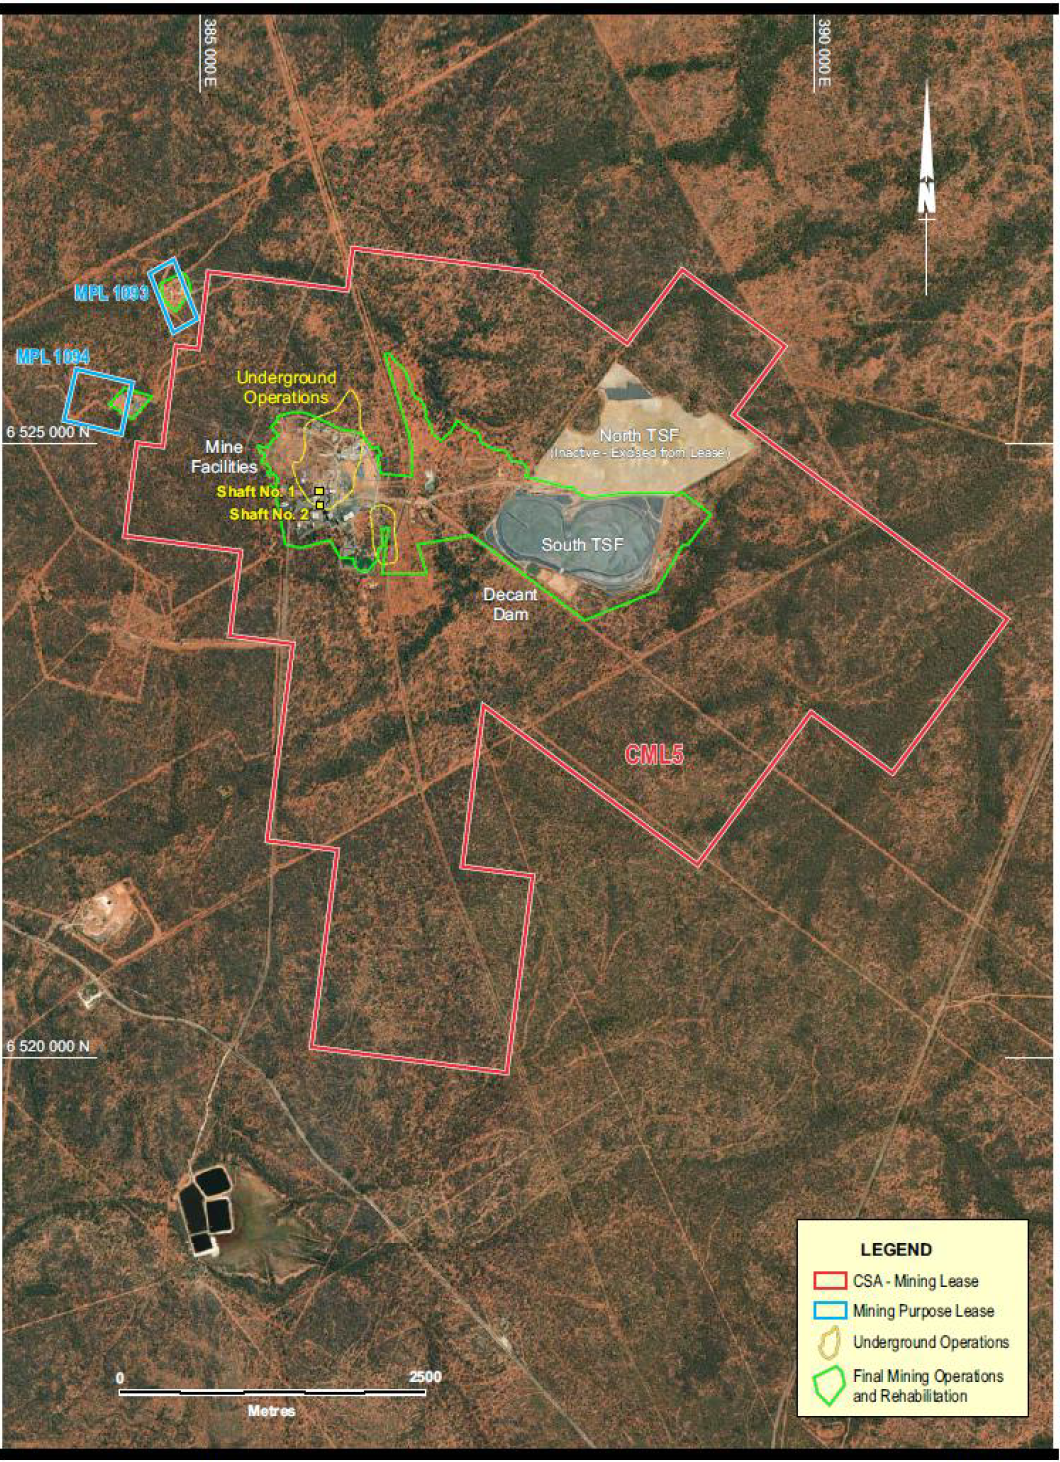
Figure 4-1 Site Facilities Layout Plan
Harmony Australasia | CONFIDENTIAL20
Technical Report Summary of the CSA Copper Mine, New South Wales, Australia
5History
Section 229.601(b)(96)(iii)(B)(5) (i-ii)
5.1Previous Operations
The CSA deposit was discovered in 1871 and named after the nationalities of its initial owners (a Cornishman,
a Scotsman and an Australian). Development began in the early 1900s, but it was not until 1961 that a
significant resource was proven up by Broken Hill South Pty Ltd. The site transitioned to an underground
operation in 1965 with first underground production in 1967.
The mine was acquired by Conzinc RioTinto Australia Pty Ltd in 1980 and sold to Golden Shamrock Mines Pty
Ltd (GSM) in 1993. GSM was subsequently acquired by Ashanti Gold Fields in the same year and the mine
continued to operate until 1997, when the operation ran into financial difficulties and was placed in
receivership.
The CSA mine was acquired by Glencore in 1999. CMPL, a wholly owned Australian subsidiary of Glencore
Operations Australia Pty Ltd, itself a wholly owned subsidiary of Glencore, was the direct owner and operator
of the mine (and is the entity acquired by HMY). As part of its acquisition in 1999, Glencore received a
number of concessions from the NSW government, whereby several components of the previous mining
operations were excised from the mining lease such that no liability arising from these components
transferred to CMPL. The excised components included the Northern Tailings Storage Facility (NTSF), a mine
subsidence area and adjacent waste rock dumps.
Underground operations were resumed, and the mine was operated under Glencore management for over
20 years until being acquired by MAC on 16 June 2023, and was subsequently acquired by HMY on 24
October 2025.
5.2Recent Production History
CSA is one of Australia’s deepest underground mines, extending to ~2km in depth and is one of Australia’s
highest grade copper operations. Mine production in FY26 totalled approximately 26kt of copper and 327koz
of silver (“Ag”) in copper concentrates. Table 5-1 shows the historical production over the last three years.
Mining and processing production in FY26 was significantly lower than CSA historical performance due to
planned site resets. HMY has committed to significant expansion and upgrade capital in the FY27 LOM plan to
return the asset to historical production and beyond.
Table 5-1 CSA Mine – Production History FY24-FY26
Description | Unit | FY24 | FY25 | FY26 |
Ore Mined | kt | 1,066 | 989 | 786 |
Ore Grade | % Cu | 3.67% | 4.02% | 3.44% |
Waste Mined | kt | 264 | 259 | 308 |
Total Material Moved | kt | 1,330 | 1,248 | 1,094 |
Ore Milled | kt | 1,061 | 1,018 | 791 |
Milled Grade | % Cu | 3.68 | 3.90 | 3.42 |
Contained Copper | kt | 39 | 40 | 27 |
Copper Concentrate Tonnes | kt | 144 | 146 | 100 |
Copper Concentrate Grade | % Cu | 26 | 26 | 26 |
Copper Recovery to Conc. | % Cu | 97.8 | 97.8 | 97.8 |
Cu Production | kt | 38 | 39 | 26 |
Ag Production | koz | 372 | 440 | 327 |
5.3Historical Exploration
After the initial discovery in 1871 a further discovery of copper-rich ore occurred in 1905, however, a slump
in metal prices and an underground fire led to the closure of the mine in 1920. Zinc Corp Ltd (through its
subsidiary Enterprise Exploration) explored the area from 1947 to 1957 and commenced re-development
Harmony Australasia | CONFIDENTIAL21
Technical Report Summary of the CSA Copper Mine, New South Wales, Australia
work in 1952. Cobar Mines Pty Ltd was created in 1956, mining recommenced in 1962 and production
commenced in 1965 from the Eastern (Cu-Zn) and Western (Pb-Zn-Ag) System lenses.
The QTS System was discovered in the mid-1970s with the QTS North lenses becoming the main source of the
copper ore. The previous owners of CSA, Conzinc RioTinto of Australia (CRA) in 1980, Golden Shamrock Mines
(GSM) in 1993 and Glencore in 1999, all undertook various exploration activities including geochemical and
geophysical data acquisition, shallow RC drilling and deeper diamond drilling.
Extensive geochemical soil sampling was undertaken across CML5 in the mid-1970s, 1993 to 1995, and from
2006 to 2008. Pulps from these campaigns have been re-assayed for multi-elements with current laboratory
methods in 2021.
Geophysical surveys across CML5 include early two-dimensional induced polarisation (“2DIP,”), ground
magnetics and gravity, airborne electromagnetics (“EM”), and more recent induced polarisation (“IP”) and
resistivity; magnetotelluric (“MT”) data was acquired by Geophysical Resources and Services Pty Ltd (“GRS”)
using the M.I.M Distributed Acquisition System (MIMDAS). Ongoing surveys include downhole
electromagnetics (“DHEM”) of diamond drill holes and fixed loop EM (“FLEM”) surveys in 2021 and 2022.
Refer to 7.2 for additional information on non-drilling related exploration.
The CSA deposit has been drilled using fully cored diamond drill holes drilled either from surface or
underground, primarily using NQ size core (47.6mm diameter). The deposits have been defined by total
drilling of over 6,800 holes totalling approximately 1,000km of core, although not all drilling, particularly data
from many of the historical drill holes, is not used for current resource estimation, being located in the upper
mined-out levels of the deposit. Drilling ranges from as far back as 1950 to the present; however, the bulk of
the drilling contributing to resource estimation has been completed since 2000. The diamond holes for
estimation prior to 2000 are located predominantly in the upper levels and represent around 51% of drill
meterage; diamond drilling post 2000 is focussed principally on the lower levels and represents
approximately 49% of drill meters. The average drillhole depth is approximately 160m (surface and
underground) with the maximum over 1,100m.
Relatively shallow RC drilling along strike of the mine to the north and south has delineated geochemically
anomalous zones from prospects such as Spotted Leopard and Pink Panther south of the mine to prospects
GSM and Kendi north of the mine, and Western Gossan and Block 19 immediately west of the mine.
Diamond drilling around the mine (such as at Western Gossan and QTS North), and at prospects such as
Tailings Dam and Stoney Tank on the eastern side of CML5, has continued to intersect base metal
mineralisation.
Table 5-2 summarises the various types of surface and underground drilling conducted at CSA over the last
ten years.
Table 5-2 Surface and Underground Drilling History
Drilling Type | 2013 | 2014 | 2015 | 2016 | 2017 | 2018 | 2019 | 2020 | 2021 | 2022 | 2023 | Total |
Diamond Drilling (Surface Exploration) | 396 | - | 1,972 | 9,540 | 13,158 | 27,114 | 15,001 | 7,285 | - | 5,268 | 9,922 | 89,656 |
RC Drilling (Surface Exploration) | - | - | - | - | 19,533 | 13,343 | 2,188 | 1,935 | - | - | 1,140 | 38,139 |
Infill/Extension/ Upgrading (Underground) | 18,439 | 15,020 | 9,991 | 12,864 | 17,592 | 23,706 | 13,023 | 23,832 | 22,151 | 26,645 | 28,029 | 211,292 |
Exploration (Pure) (Underground) | - | 578 | - | - | - | 692 | - | 300 | - | - | 700 | 2,270 |
Geotechnical (Underground) | - | 1,654 | 3,470 | 617 | 2,867 | 625 | 1,475 | 1,723 | 253 | - | 450 | 13,134 |
Infrastructure (Underground) | 1,085 | 265 | 597 | - | 1,130 | - | - | 37 | 889 | 761 | 397 | 5,161 |
Total (Surface + Underground) | 19,920 | 17,517 | 16,030 | 23,021 | 54,280 | 65,480 | 31,687 | 35,111 | 23,294 | 32,674 | 40,638 | 359,652 |
Harmony Australasia | CONFIDENTIAL22
Technical Report Summary of the CSA Copper Mine, New South Wales, Australia
6Geological Setting, Mineralisation and Deposit
Section 229.601(b)(96)(iii)(B)(6) (i-iii)
6.1Regional Geology and Mineral Deposits
CSA has a long history of exploration and operations and the geology is well documented and generally well
understood. The CSA deposit is located within the Cobar mineral field, in the Cobar Basin (Figure 7-1).
Mineralisation is hosted in the Silurian-age CSA Siltstone, a member of the Amphitheatre Group of the Cobar
Supergroup sequence of rocks and is associated with zones of deformation and shearing. The CSA Siltstone
consists of a sequence of rhythmic bedded siltstones and sandstones. The rock sequence was structurally
deformed during the development of the Cobar Basin in the early Devonian period.
The Cobar mineral field is a mineralised belt 80km north-south and up to 40km wide, containing copper, gold,
and lead-zinc mineralisation along the eastern margin of the Cobar Basin, one of many north-south grabens
that developed in the Lachlan Fold Belt (“LFB”) during the Siluro-Devonian period. The LFB is a complex
orogenic belt which developed at the margins of an evolving tectonic plate. Regional crustal extension of the
LFB in the late Silurian created a series of north-south trending deep water basins and troughs that, in the
Cobar region, included the Cobar Basin and further south the Raast and Mt Hope Troughs. The Cobar Basin is
fault bounded on all sides and studies indicate that reactivation of the faults played a significant role in
providing fluid pathways for mineralising fluids and dilational zones for the formation of the mineral deposits.
Rocks of volcanic derivation are rare, and igneous intrusions are limited to a few small porphyritic bodies at
the southern extremity of the field. Rocks in the Cobar Basin have undergone low grade regional
metamorphism to lower greenschist facies.
The Cobar Basin is a well-endowed metalliferous province with a diverse range of, predominantly sediment-
hosted, mineral deposits. Most of the known deposits are located adjacent to the eastern, fault-controlled,
basin margin. Significant deposits from north to south include the Endeavor silver-lead-zinc deposit, the CSA
copper deposit, The Peak, Perseverance, New Occidental and New Cobar gold-copper deposits, the Nymagee
copper-lead-zinc deposit, the Hera gold-copper-lead-zinc deposit, and the Mineral Hill gold-copper deposit.
The known mineral deposits are all structurally controlled and typically occur as narrow, short strike length
pipes, lenses and veins (i.e. a small surface area) but are notable for their considerable vertical extent. The
location of the deposits along or adjacent to the basin margin Rookery Fault and sub-parallel faults suggests
migration of fluids from basement sources up the basin margin fault.
6.2Stratigraphy
The principal operating mines in the area are CSA (Cu with minor Pb/Zn), Endeavor (Pb/Zn/Ag), The Peak (Au/
Cu), Hera (Au/Cu), and Tritton (Cu) (Figure 1-1 and Figure 1-2). The deposits of the Cobar field occur
exclusively within the Nurri and Amphitheatre Groups of the Cobar Supergroup (Figure 6-1 and Table 6-1).
The Nurri Group unconformably overlies, and is in faulted contact with, basement rocks of the Cambro-
Ordovician Girilambone Group, along the eastern margin of the Cobar Basin. The Nurri Group comprises the
basal Chesney Formation, consisting of a thick turbidite sequence with a coarse basal conglomerate, and the
Great Cobar Slate, consisting predominantly of mudstones, siltstones, and fine-grained sandstones. South of
Cobar, the contact between the Chesney Formation and the Great Cobar Slate is locally faulted, and this
contact hosts a number of gold deposits in a series of en-echelon sub-vertical shears.
The Amphitheatre Group, a deeper water facies to the west, partially interfingers with, and partially overlies,
the Nurri Group. At the base of the Amphitheatre Group is the CSA Siltstone, which consists of a thinly
bedded turbiditic sequence of carbonaceous siltstones and mudstones with fine-grained sandstones. The CSA
Siltstone is the only unit of known economic significance within the Amphitheatre Group and hosts the CSA
and Endeavor mineralisation.
Harmony Australasia | CONFIDENTIAL23
Technical Report Summary of the CSA Copper Mine, New South Wales, Australia
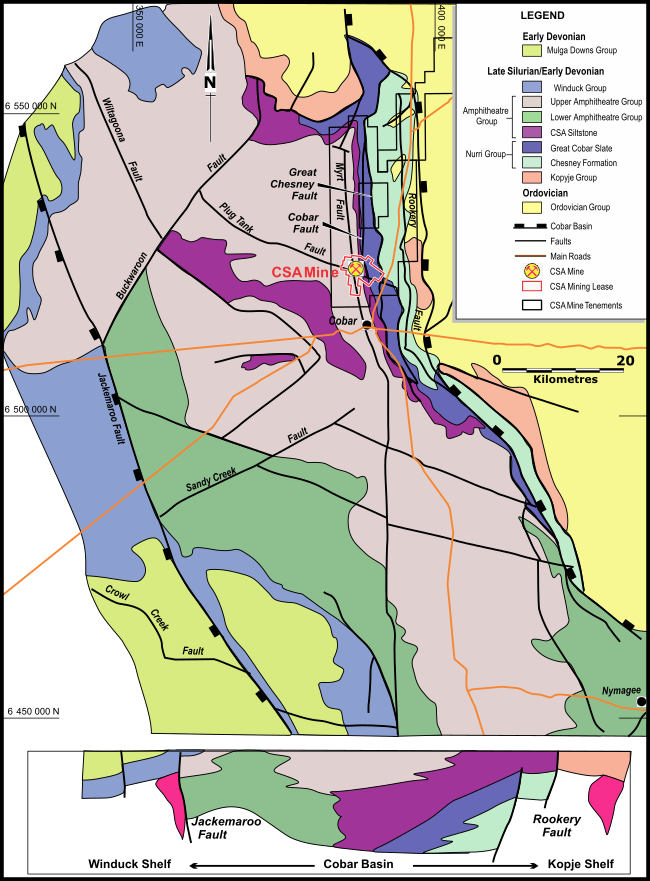
Figure 6-1 Cobar Regional Geology
Harmony Australasia | CONFIDENTIAL24
Technical Report Summary of the CSA Copper Mine, New South Wales, Australia
Table 6-1 Cobar Stratigraphic Column
Group | Formation | Age | Description |
Cobar Supergroup | Siluro- Devonian | ||
Winduck Group | Shallow marine shelf deposits. | ||
Amphitheatre Group | Upper Amphitheatre Group Biddibirra Formation CSA Siltstone | Turbidites, shales, siltstones, sandstones; CSA Siltstone is host to base metal mineralisation at CSA mine and Endeavour mine. | |
Nurri Group | Great Cobar Slate Chesney Formation | Turbidites, conglomerates, mudstone, siltstone, sandstone; host to gold mineralisation at The Peak, New Occidental and New Cobar. | |
Kopyje Group | Shallow marine shelf deposits and minor volcanics, predominantly along the eastern margin of the Cobar trough. | ||
Girilambone Group | Cambro- Ordovician | Turbidite sequence with minor volcanics, deformed and metamorphosed; Silurian granitoid intrusions. |
Note: marked unconformity between Cambro-Ordovician and Silurian sediments
6.3Local and Property Geology
CSA mineralisation occurs in five known systems: Eastern, Western, QTS North (QTSN), QTS Central (QTSC)
and QTS South (QTSS) (Figure 6-2). The mineralisation is structurally controlled, associated with fault/shear
zones and arranged in an en-echelon pattern. The Cobar Fault and the Chesney Fault are the major
controlling faults at CSA. The mineralised systems occur at the intersections of two sets of steeply dipping
(~85°) structures, a dominant north-northeast (“NNE”) trending set (S1) and a NNW trending set (S2). These
two structural trends formed due to east-west compression leading to a complex fault/shear system with
dilation zones (S3) at intersections. The NNE shears can be up to 100m wide and contain parallel quartz
veining of variable intensity.
Within the five mineralised systems, multiple lenses of mineralisation occur; lenses typically are 5-30m wide,
have short (<300m) strike lengths but long vertical continuity down plunge (>1,000m). The lenses are
interpreted by CMPL as discrete parallel to sub-parallel stacked lenses (Figure 6-2).
The host rock for the mineralisation, the CSA Siltstone, contains thinly bedded siltstones and mudstones with
fine to medium grained sandstones. Bedding strikes north-northwest and dips steeply west. Cleavage trends
north and dips steeply east.
QTSN is developed from 600m below surface and is the main mineralised system at CSA, currently containing
around 67% of the total copper metal in the estimated Mineral Resource and accounting for approximately
80% of current production tonnes. QTSN consists of around 30 separate lenses which trend north-south and
extend down plunge from 600m to >2,000m. To date, the deepest mineralised intercept at QTSN is at around
8,050m Relative Level (“RL”), 2,200m below surface with surface at 10,250mRL. The main lenses consist of
semi-massive to massive chalcopyrite bounded to the north and south by zones of chalcopyrite and quartz
veining.
QTSC was discovered in 2014; it is located 300m south of QTSN and is developed from a depth of around
1,200m below surface (Figure 7-2). The system consists of two principal lenses with strike lengths of 150m
and widths of 10m.
QTSS is located approximately 200m south of QTSC at a depth of around 700m below surface. QTSS is
essentially mined out except for the QR1 lens which was discovered in 2005. This lens lies below and to the
south of the mined-out area and has a down plunge extent in excess of 400m, a strike length of 90m and a
maximum width of 15m. The mineralisation consists of a zone of quartz-chalcopyrite-chlorite veining.
The Eastern system is located 100m west of QTSN, starting at 250m below surface and consisting of two
principal lenses with strike lengths of 50-80m and widths of 10m. Copper mineralisation occurs as quartz-
sulphide veining in chlorite-altered siltstone, with occasional pods of massive sulphide.
Harmony Australasia | CONFIDENTIAL25
Technical Report Summary of the CSA Copper Mine, New South Wales, Australia
The Western system outcrops at surface and approximately the upper 100m of the sulphide mineralisation
has been oxidised. The system is hosted in pervasively silicified and chloritized siltstone. Mineralisation
occurs as zones of quartz-sulphide veining with a number of small high-grade pods of copper or lead-zinc. The
lead-zinc mineralisation is concentrated in the upper portion of the system with copper dominant at depth.
There are four narrow, copper-rich lenses which have a strike length of around 45m, an average width of 7m
and extend down plunge up to 200m.
6.4Mineralisation and Alteration
Chalcopyrite (CuFeS2) is the dominant copper sulphide phase in all five systems. Copper mineralisation occurs
in three distinct forms: as massive sulphide with dominant chalcopyrite and minor pyrrhotite (iron sulphide)
and cubanite (CuFe2S3), as semi-massive sulphide with either quartz or chlorite alteration and associated with
quartz-sulphide veining of variable intensity. Massive sulphide contacts can be sharp, but the majority of
mineralised lenses have gradational contacts with a mineralisation envelope occurring around the more
massive mineralisation.
Cubanite is present as a minor copper species, mainly in QTSC. Sphalerite (zinc sulphide) and galena (lead
sulphide) are also present but principally only in the upper part of the Western system which is the only
system of the five that is exposed at surface. There are no lead-zinc lenses included in the CSA Mineral
Resources or the Cube re-stated Mineral Resource. Silver (Ag), grading 10-50 grams per tonne (“g/t”) is
present as acanthite (Ag2S) and shows a weak to moderate correlation with copper. Good metallurgical
recoveries are achieved, and a high-quality copper concentrate produced grading around 26-27% Cu with
silver credits.
Harmony Australasia | CONFIDENTIAL26
Technical Report Summary of the CSA Copper Mine, New South Wales, Australia
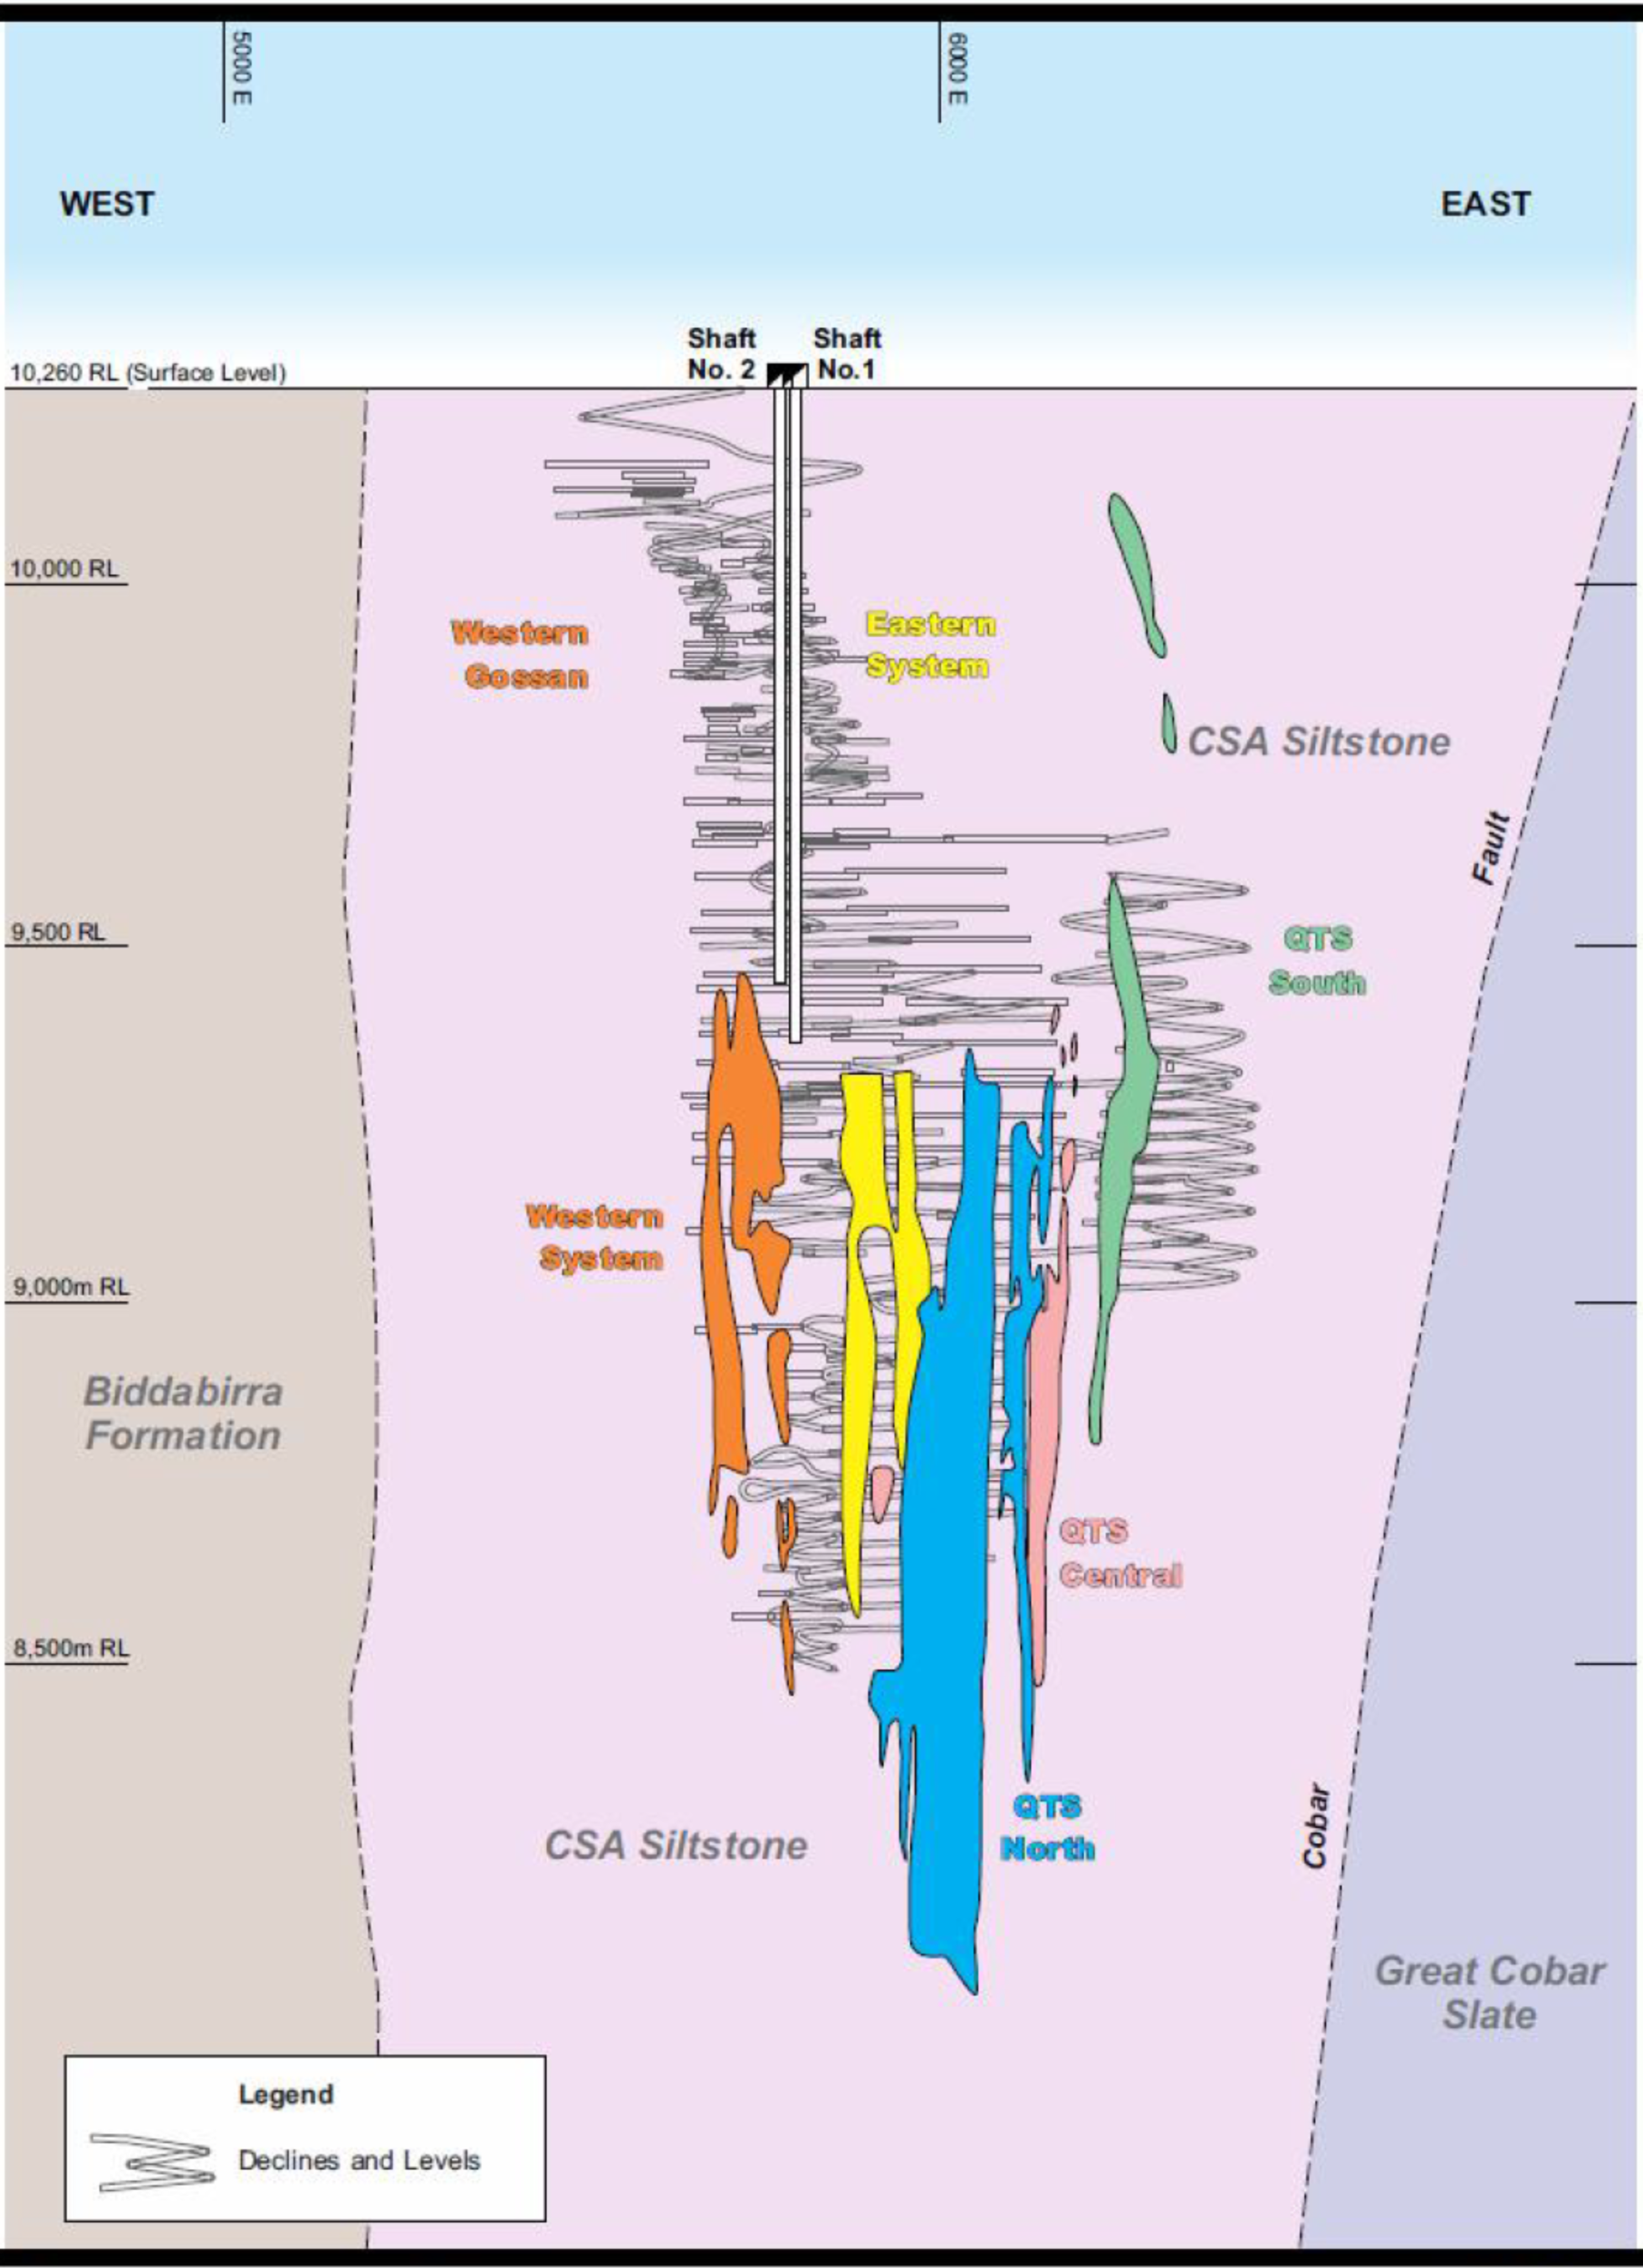
Figure 6-2 Geology Section Projection looking north
7Exploration
Section 229.601(b)(96)(iii)(B)(7) (i-vi)
Harmony Australasia | CONFIDENTIAL27
Technical Report Summary of the CSA Copper Mine, New South Wales, Australia
7.1Historical and Current Drilling
The CSA deposit was discovered in 1871 with a further discovery of copper-rich mineralisation in 1905,
however, a slump in metal prices and an underground fire led to the closure of the mine in 1920. Zinc Corp
Ltd (through its subsidiary Enterprise Exploration) explored the area from 1947 to 1957 and commenced re-
development work in 1952. Cobar Mines Pty Ltd was created in 1956, mining recommenced in 1962 and
production commenced in 1965 from the Eastern (Cu-Zn) and Western (Pb-Zn-Ag) System lenses.
The QTS System was discovered in the mid-1970s with the QTS North lenses being main source of the copper
ore at the time. CMPL came under the ownership of Conzinc RioTinto of Australia (CRA) in 1980, Golden
Shamrock Mines (GSM) in 1993 and Glencore in 1999. During this time, there have been ongoing periods of
geochemical and geophysical data acquisition, shallow RC drilling and deeper diamond drilling.
Extensive geochemical soil sampling was undertaken across CML5 in the mid-1970s, 1993 to 1995, and from
2006 to 2008. Pulps from these campaigns were re-assayed for multi-elements with current laboratory
methods in 2021.
Geophysical surveys across CML5 include early 2DIP, ground magnetics and gravity, airborne EM, more
recent IP/MT (MIMDAS), ongoing DHEM of diamond drill holes and fixed loop EM (FLEM) in 2021 and 2022.
Relatively shallow RC drilling along strike of the mine to the north and south has further delineated
geochemically anomalous zones from prospects such as Spotted Leopard and Pink Panther south of the mine
to prospects GSM and Kendi north of the mine, and Western Gossan and Block 19 immediately west of the
mine. (Figure 7-1). Diamond drilling around the mine (such as at Western Gossan and QTS North), and at
prospects such as Tailings Dam and Stoney Tank on the eastern side of CML5, has continued to intersect base
metal mineralisation.
The CSA deposit has been drilled using fully cored diamond drill holes drilled either from surface or
underground, primarily using NQ size (47.6mm diameter core). The deposits have been defined by over 6,800
holes totalling approximately 1,000km of core. Data from many of the historical drill holes is not used for
current resource estimation, being located in the upper mined out levels of the deposit; current resource
estimates are based on approximately 2,932 drill holes and more than 71,000 samples. Underground
diamond drilling over the last five years has averaged 23,000m per year, with an average rate of 27,700 m
per year achieved over the last two years.
7.2Exploration – Non-Drilling
7.2.1Geophysical Surveys
Airborne Electromagnetic Surveys
In 2001, the entire extent of CML5 was included within a much more extensive ‘HOISTEM’ survey, which
covered ~70% of surrounding tenement EL5693, for a total of 1,874line-km; the survey was carried out under
the direction of consultant geophysicist Steve Collins whose report on the results forms the basis of the
comments below. The Normandy HOISTEM helicopter-borne electromagnetic (EM) system comprised a single
wire 20m diameter transmitter loop with a centrally mounted receiver slung beneath a helicopter, as such
the system is symmetric with respect to flight direction. Survey parameters comprised 100m spaced east-
west lines flown with a nominal detector terrain clearance of 30m. The receiver recorded 112 channels of off-
time decay signal each of which is 112.7 microseconds in duration. The measured decay signals were binned
into 10 groups.
At the time of this survey, the HOISTEM system was still in development. A change was made to the
electronics of the system half-way through this survey, resulting in significantly lower noise levels which are
apparent in images of the data for the later time groups. The contractor carried out standard processing to
remove bird swing and system self-response, but grouped results were found to still contain some system
noise which manifested itself as a corrugation in the presentation images. The data were passed through a
decorrugation micro levelling process to produce shaded enhanced images for interpretation.
Harmony Australasia | CONFIDENTIAL28
Technical Report Summary of the CSA Copper Mine, New South Wales, Australia
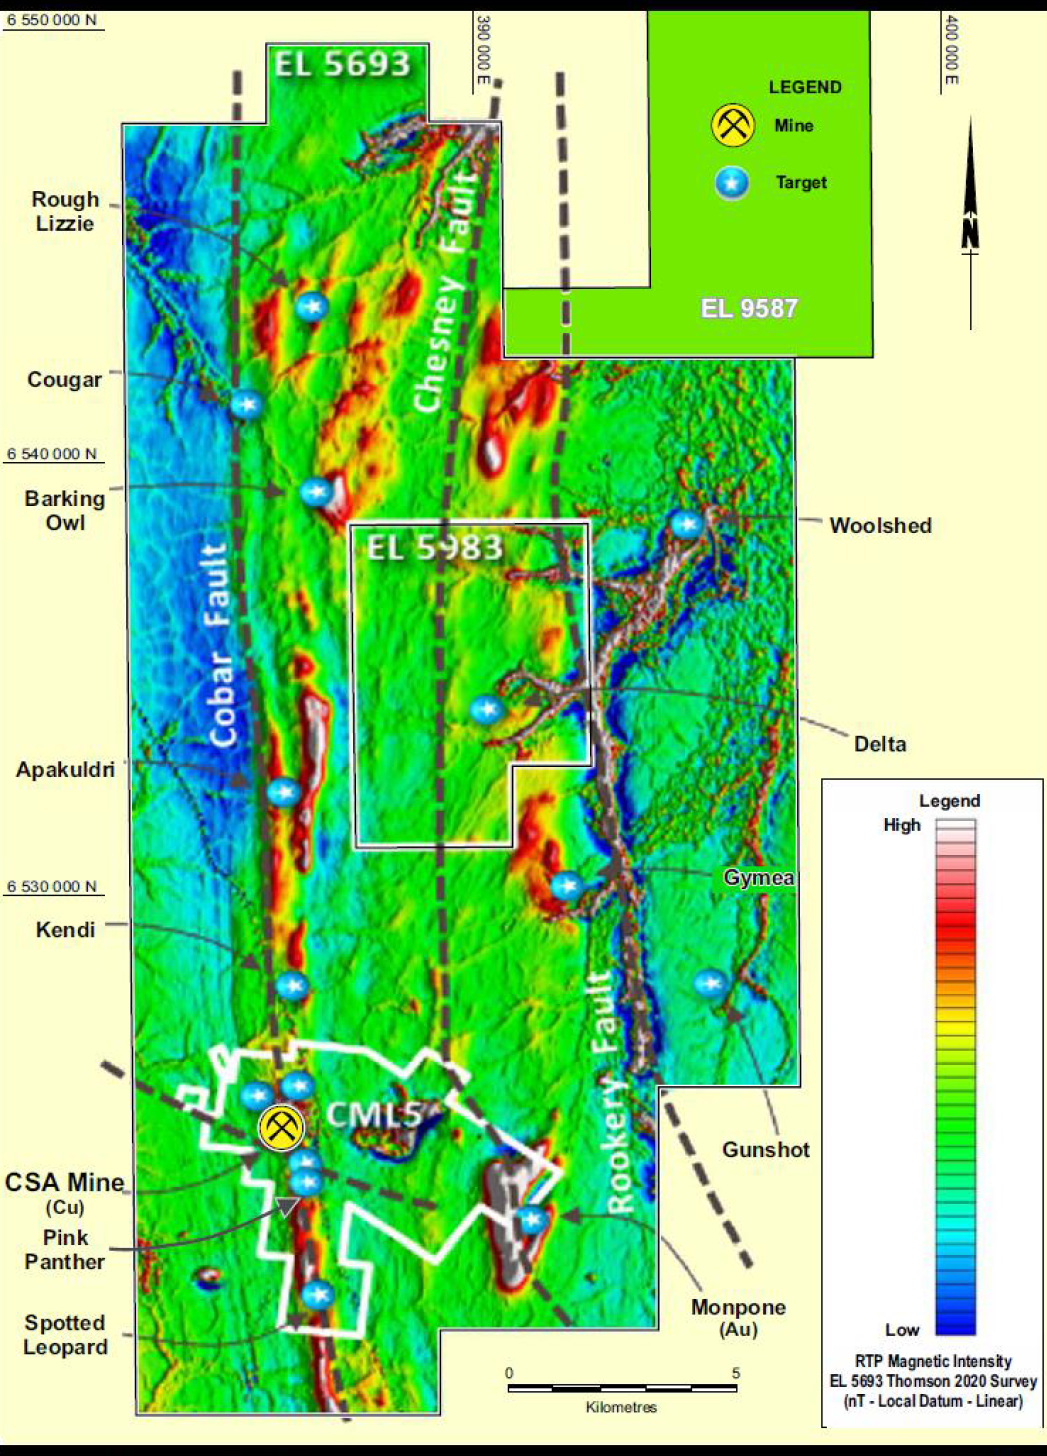
Figure 7-1 Near Mine Exploration Mineralisation
In 2019, the Government of NSW and Geoscience Australia flew an Xcite Airborne Electromagnetic (“AEM”)
survey at a height of 60m, with the sensor suspended 30m below, along 116 east–west lines. The lines were
typically about 55km long and between 2.5km and 5km apart. A total of 9-lines of the 2019 Xcite AEM survey
covered the area of the 2001 HOISTEM; comparison showed the 2001 HOISTEM and high quality 2019 AEM
data agree well in the early EM channels (0.4‐1.2ms). This upgraded the reliability and usefulness of the 2001
HOISTEM AEM data and has been reliably used to identify and interpret geophysical signatures that might be
associated with prospective structures and enhanced weathering due to sulphides at depth or lithological
variations.
7.2.22005 Mopone IP-Resistivity Survey
The eastern section of CML5 covers part of an extensive offset pole-dipole IP-resistivity survey undertaken by
Search Exploration Services Pty Ltd in March 2005 under the direction of consultant geophysicist Steve
Collins. The offset pole-dipole array comprises a central line of 100m transmitter electrodes (each in turn
connected to a single remote electrode) with a parallel line of receiver dipoles on either side. Line spacing for
this survey was 200m; transmitter electrode spacing and receiver dipole size was 100m. The data was
processed to 3D inversions on completion of the survey, but degraded by the effects of receiver cabling
problems, not all of which could be resolved. The data were further processed to 2D IP and resistivity offset
inversion sections in-house in 2020; some, but not all of the data problems were resolved. The inversions
were converted to a format suitable for importation into a 3D LeapFrog geological model.
Harmony Australasia | CONFIDENTIAL29
Technical Report Summary of the CSA Copper Mine, New South Wales, Australia
The Mopone magnetic anomaly coincides with a resistive zone at depth; no significant IP anomalism was
noted. The configuration of the offset pole-dipole array means that the shallowest sections of the area could
not be resolved in any detail.
7.2.32006 – 2007 MIMDAS Survey
Following a successful trial of 3D MIMDAS in early 2006, 2D MIMDAS surveys were conducted to the north
and south of CSA; principally targeting the Cobar Fault. IP, resistivity and MT data were acquired by
Geophysical Resources and Services Pty Ltd between the 4th of December 2006 and 14 November 2007 using
the M.I.M Distributed Acquisition System (“MIMDAS”). Approximately 22line-km of these surveys were
within CML5. A “standard” 2D MIMDAS pole-dipole/ dipole-pole IP configuration was used with dipole
spacing 100m and line spacing 400m. Initial inversion modelling of data from the North Block has been
completed with good indication of structure, although often poorly resolved.
MIMDAS IP and MT Data from CSA was inverted to return possible causative models. It is believed that the
MIMDAS survey has detected the ore package with the DC Resistivity and MT methods. The technique as
implemented at CSA would seem to be able to locate any similar deposit in a similar geological regime to
approximately 500m depth. If the survey area was centred over the known system proper, it is anticipated
that resolution of individual conductors might have been gleaned from the inversion results. The data,
particularly the chargeability data, although of very good quality in a repeatability sense, has proven difficult
to interpret due to contamination from EM effects. The mineralisation packages to the south of the survey
area are most likely responsible for this contamination. However, with the EM signature being so unique, it
may be able to be used in a comparative exploration sense. Less conductive deposits would lend themselves
to detection by the induced polarisation method as EM effects would not dominate the secondary voltage
decays as has been the case at CSA. A resistivity anomaly occurring on the south-eastern limits of the survey
area has been detected and noted.
7.2.42012 – 2019 Ground Gravity
CMPL commissioned Precision Exploration Services between 2012 – 2019 to collect ground gravity data
across CML5 and over the Cobar and Chesney Faults on EL5693. Gravity data was collected using a Lacoste &
Romberg Model “G” gravity meter, on 100m x 100m grids, with 50m x 50m grid infills to the north and south
of CSA and over the Mopone prospect on the eastern margin of CML5. The gravity data has proved useful for
mapping structures, particularly NNE and NNW crosscutting structures, which have a controlling factor on
mineralisation at CSA.
Between the 1970 – 1990 Cobar Mines and CRAE collected ground gravity data using a Lacoste and Romberg
(L & R) Model G Land Gravity Meter with data collected every 30m‐50m along east‐west lines 300m‐400m
apart, plus infill stations across CML5 and surrounding tenement EL5983. MIM Geophysicist, Terry Harvey,
reprocessed the 1970 – 1990 and recent CMPL gravity data to produce composite products,
7.2.52020 Airborne Magnetics and Radiometrics
Thomson Aviation Pty Ltd were engaged to undertake an Airborne Magnetics and Radiometrics (“AMR”)
survey covering EL5693, which encompasses CML5. The survey was completed on 50m spaced east-west
orientated lines, with 500m spaced north-south tie lines, at a nominal survey height (terrain clearance) of
35m.
The survey provided agreement with previously mapped regional structures, will deliver increased structural
understanding of the region surrounding CML5 and will form a basis for future planning of exploration
programs.
7.2.62021 – 2022 FLEM
Gap Geophysics Australia Pty Ltd (“GAP”) were commissioned to conduct a Fixed-Loop Electromagnetic
Survey (FLEM) encompassing CSA between May 2021 and February 2022. The survey employed one of GAP’s
high-power EM systems which consisted of a GeoPak HPTX-70 or HPTX-80 transmitter and two setups of an
EMIT SMARTem24 receiver coupled with a 3-component Supracon High-temperature Super-conducting
Quantum Interference Device (“SQUID”) sensor. The survey consisted of 24 loops (~1200m x 900m), 50m
east-west spaced stations on 100m north-south spaced lines, for approximately 11-lines per loop, in total the
survey covered approximately 26km2 of highly prospective ground encompassing CSA and along strike.
The survey was a technical success in its ability to detect previously known mineralisation at Pink Panther,
located 1km to the south of CSA. Subtle FLEM anomalies have been detected north along strike of CSA that
Harmony Australasia | CONFIDENTIAL30
Technical Report Summary of the CSA Copper Mine, New South Wales, Australia
coincide with geochemical anomalism suggestive of QTS-style sulphide mineralisation at depth; these
anomalies will be targeted in the 2024 Diamond Drilling Campaign.
7.2.7Down Hole Surveys
Down-hole electromagnetic surveys (DHEM) are proven to be an effective method for detecting Cobar-style
mineralisation, since 2016 DHEM surveys are conducted on completion of diamond drilling campaigns. DHEM
surveys post 2000 have been undertaken by Outer Rim Exploration Services Pty Ltd, GEM Geophysical
Surveys Pty Ltd and Gap Geophysics Australia Pty Ltd, all data is available and of moderate to very good
quality. Summary of recent DHEM surveys follow.
7.2.7.12018 CSA Mine DHEM Survey
Down-hole electromagnetic (DHEM) surveys were completed in August 2018 by Gap Geophysics Australia Pty
Limited (GAP), a total of 10,490m was logged on fourteen drillholes over five near-mine prospects (Kendi,
Pink Panther, Spotted Leopard, QTS North and QTS South). The survey utilised a Digi Atlantis DHEM sensor,
Smartem receiver and Gap Geopak HPTX-802 transmitter. The EM responses along three mutually orthogonal
vectors (A, U, V) were measured by the down‐hole probe.
The DHEM surveys have produced fair to good quality data. A total of fourteen holes were surveyed with
DHEM with six holes containing anomalies, three of which being off-hole anomalies at the QTS North
prospect that warranted drill testing. The conductors modelled at the QTS North prospect were diamond drill
tested in early 2023.
7.2.7.22020 QTS South DHEM Survey
Down‐hole electromagnetic (DHEM) surveying of nineteen holes at the QTS South (upper) deposit and one
historic hole (DDHSL7) at the Pink Panther prospect were carried out by Gem Geophysics in September 2020.
The survey utilised a Digi Atlantis DHEM sensor, Smartem receiver and Geonics TT100 transmitter. The EM
responses along three mutually orthogonal vectors (A, U, V) were measured by the down‐hole probe. A total
of 9,935m was surveyed at a station interval ranging from 2.5m‐15m. The surveys were designed to test for
off‐hole conductive mineralisation and for extensions to the known chalcopyrite mineralisation.
The DHEM surveys have produced fair to good quality data. The DHEM data collected from within and close
to the known mineralisation is consistent with the results from the 2018 DHEM surveys. A total of twenty
holes were surveyed with DHEM and seven of these holes contained anomalies that warranted modelling.
Data returned from seven holes contained anomalous electromagnetic (EM) responses that warranted
modelling. Six of these EM responses were modelled at QTS South Upper deposit and provided small
southern extensions to the mineralisation or occur in zones indicating greatest grade or thickest intervals,
however current drilling closes these zones, no further drilling is currently warranted. Modelled conductors
from drillhole QSDD040 returned a relatively high modelled conductance and could represent grade
mineralisation immediately south and east of the QTS South orebody, these conductors were drill tested in
2023.
7.2.8Geochemistry
Throughout the early 1970s, Rotary Air Blast (“RAB”) geochemical campaigns were conducted over CML5 and
the surrounding tenement EL5693. The programs were typically conducted on 30m spaced east-west by
300m spaced north-south grids, with infill lines at 150m north-south spacing. The 1970 campaigns proved
successful in identifying geochemically anomalous areas within CML5 such as the GSM, Stoney Tank, Falcon,
Block 19 and QTS South to Spotted Leopard trend. Other than the QTS South to Spotted Leopard trend, the
remaining prospects have received minimal attention and exploration since being identified.
Between 2003 – 2007, CMPL undertook power auger geochemical surveys on 50m x 50m sample grids in the
near-mine area and 100m x 100m grids on regional prospects within CML5. In total 2,032 power auger
samples were collected by CMPL and analysed by ME-MS43i (Three Acid Digest) for 21 elements, with
eastern CML5 pulps having been re-assayed in 2021 -2022 by ME-MS61 (Four Acid Digest) for 48 elements
plus Au by fire assay. The anomalies identified in the 1970s geochemical campaigns correlate well with early
2000 geochemical surveys; the multi-element data has proved useful in delineating new mineralisation on
CML5. Base metal mineralisation within the Cobar region typically has geochemical haloes that extend less
than 100m in residual soils. Soil sampling conducted around CSA shows a weak and sporadic Cu anomaly
100ppm – 550ppm and a more consistent Pb anomaly 100ppm – 2960ppm, which extends to a maximum of
200-250m from mineralisation, most notably around the Western Gossan. The 2023 diamond drilling
campaign represented the first phase of testing high priority geochemical anomalies adjacent to regional
Harmony Australasia | CONFIDENTIAL31
Technical Report Summary of the CSA Copper Mine, New South Wales, Australia
scale structures and in zones of structural complexity highlighted from the 2020 AMR survey. Geochemical
surveys have proved highly successful in the Cobar Basin at detecting blind orebodies.
7.3Exploration – Drilling
The CSA deposit has been drilled using fully cored diamond drill holes drilled either from surface or
underground, primarily using NQ size (47.6mm diameter core). The deposits have been defined by over 6,800
holes totalling approximately 1,000km of core. Data from many of the historical drill holes is not used for
current resource estimation, being located in the upper mined out levels of the deposit; current resource
estimates are based on approximately 7,393 drill holes and more than 104,110 samples. Underground
diamond drilling over the last five years has averaged 25,200m per year, with an average rate of 23,400m per
year achieved over the last two years (Figure 7-2).
Resource definition drilling in active mining areas at QTSN is carried out with a drill hole spacing of around
20m north-south by 37.5m vertical. At QTSC, QTSS, Western and Eastern mineralised systems, drill hole
spacing is nominally 20m north-south by 20m vertical due to the narrower mineralised lenses. Wider drill
hole spacing is used in exploration areas.
The mineralised host rocks are generally very competent below the weathered zone and core recovery
averages above 95%. All CSA drill holes are systematically surveyed (drill collars and down hole) and
geologically and geotechnically logged and photographed. Drill hole logging includes recording lithology,
structures, weathering, alteration, and rock quality designation (“RQD”). Drill core is nominally sampled at
one meter intervals, while honouring lithological contacts. Half-core samples are sent for sample preparation
and assaying.
7.3.1Surface Drilling
The current database of surface drilling lists some 412 RC drill holes totalling 52,818m with an average depth
of around 128m (Figure 7-3). RC holes have generally been drilled to 120m to 150m depth, being just past the
weathered zone and into fresh rock, although some RC holes have been drilled to as deep as 250m.
Historically, some 18 shallow RC holes were drilled in 1984 (under CRA ownership) into Block 19 which is a
NNW base metal (Pb-dominant) trend from CSA. A further 43 RC holes were drilled into Spotted Leopard (a
southern prospect in CML5 along strike of mine) in 1990-91.
There are also records for some 255 surface exploration diamond drill holes within CML5 totalling around
150,960m for an average hole depth of 592m. As part of the ongoing exploration appetite, in 2026, HMY has
engaged tier 1 drilling contractor Titeline to completed a 21.5km surface drilling campaign with 3 deep hole
surface rigs to explore and define the ore lens continuation at depth.
Harmony Australasia | CONFIDENTIAL32
Technical Report Summary of the CSA Copper Mine, New South Wales, Australia
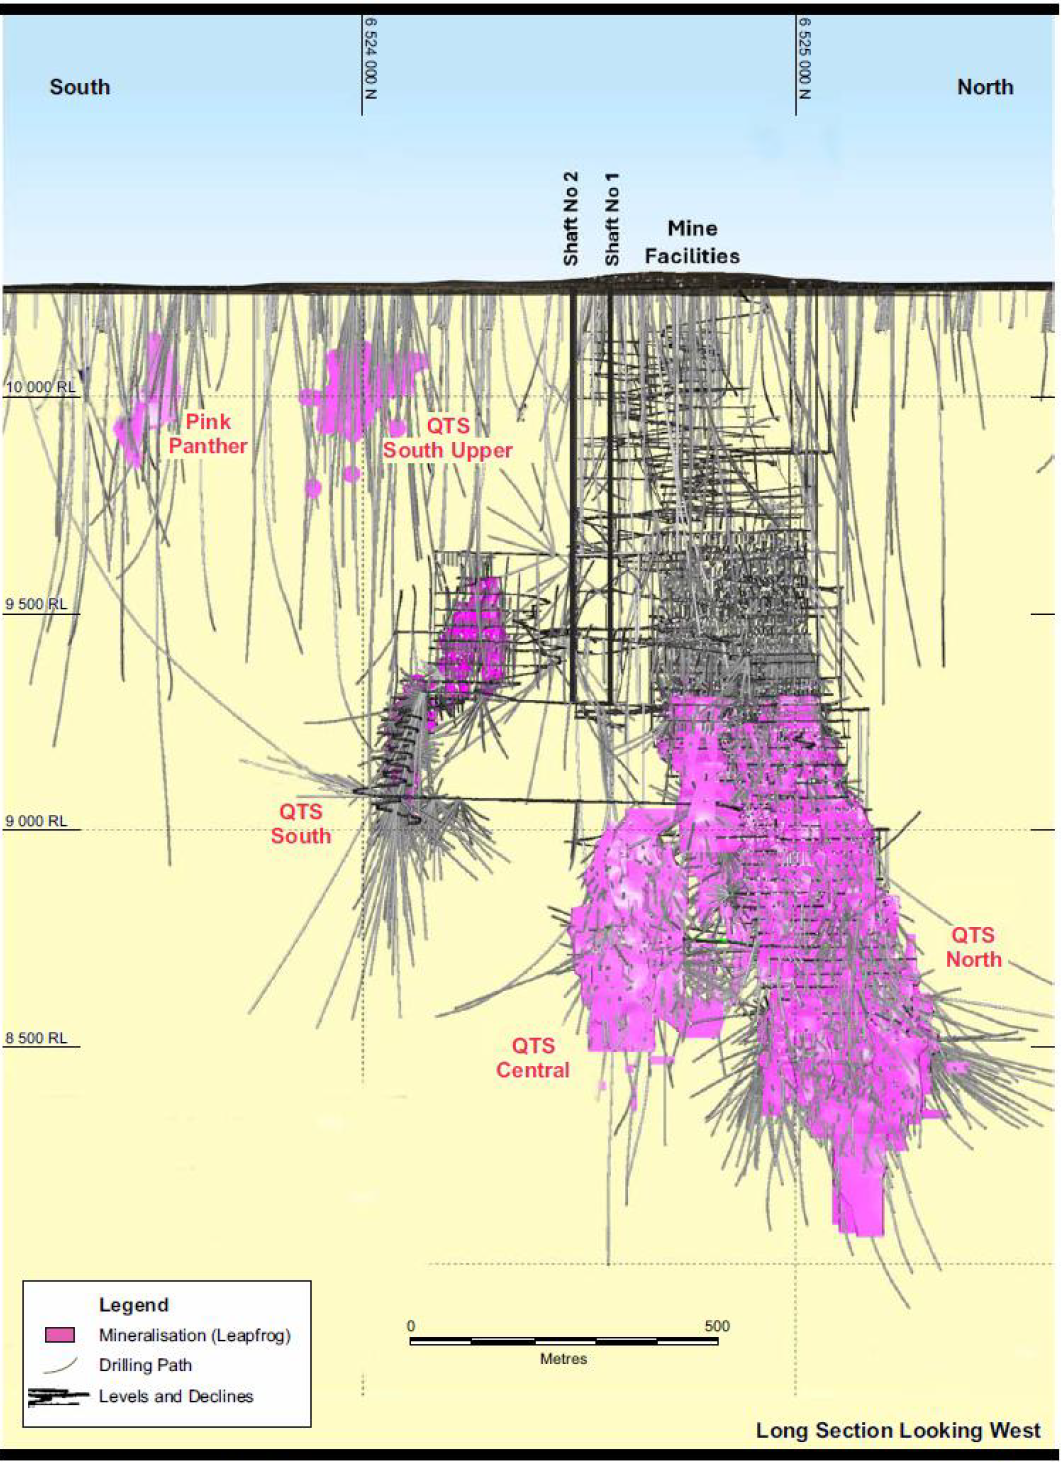
Figure 7-2 Historical Exploration Drilling – Long Section, the Merrin Mine not shown on this section but comprises the
upper levels of Eastern and Western systems above the North and Central orebodies.
Harmony Australasia | CONFIDENTIAL33
Technical Report Summary of the CSA Copper Mine, New South Wales, Australia
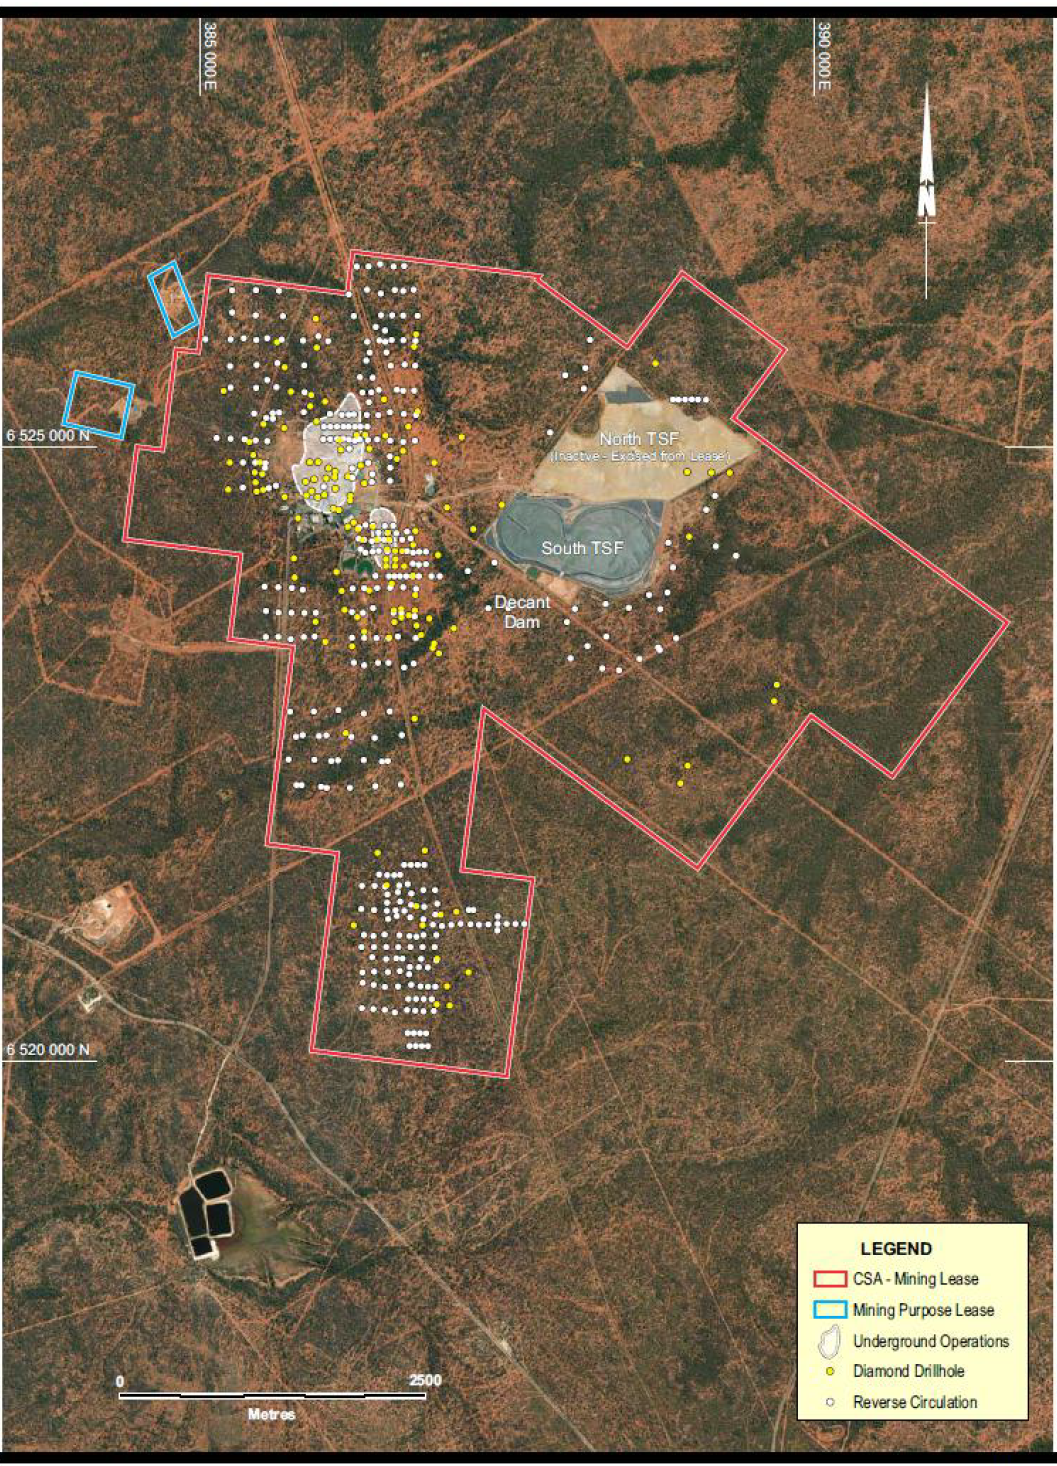
Figure 7-3 Surface Exploration Drill Collar Locations
Diamond drill holes have been drilled on a range of prospects including Western Gossan and Block 19 (west
of mine), GSM/Kendi (north of mine), Pink Panther and Spotted Leopard (south of mine) as well as targeting
extensions to the QTS North, South and Central mine systems. In 2023 diamond drilling tested the CSA-trend
at Kendi (3km north of mine; 1 hole) and Midnight (6km south of mine; 2 holes) prospects. In 2023 and 2024
Harmony Australasia | CONFIDENTIAL34
Technical Report Summary of the CSA Copper Mine, New South Wales, Australia
diamond drilling tested the Stoney Tank prospect (4km ESE of mine; 2 holes), and prospects along the Tailings
Dam Shear (3km east of mine) including Ringneck and Falcon prospects (2023; 5 holes) and Cherry and
Tailings Dam prospects (ongoing in 2024; 5 holes). During 2025 much of the surface exploration moved off
the mining lease, targeting Regional targets. During 2026, a programme of deep drilling targeting depth
extensions of the main QTS orebodies commenced, with drilling of the first holes ongoing at year end, June
2026.
As the Mineral Resources and Mineral Reserves presented in this report lie within CML5, exploration
activities on the remaining exploration tenements are largely excluded from this Report.
7.3.2Historical Drilling Campaigns 2000 – 2016
Surface diamond holes drilled within CML5 from 2000-2016 include:
•2003 – 2 holes at Tailings Dam
•2004 – 2 holes into the QTS System
•2005 – 1 hole near mine northeast, 7 holes at Tailings Dam
•2006 – 3 holes testing the QTS System, 3 holes at Tailings Dam
•2007 – 1 hole near mine northeast, 1 hole at Pink Panther and 1 hole at Tailings Dam
•2008 – 1 hole testing 1993 holes at GSM anomaly, 1 hole near mine south
•2009 – no holes identified as being drilled this year
•2010 – 2 holes in Western Gossan
•2011 – 2 holes testing mineralisation in CM30 at Western Gossan, 1 hole near mine south, 1 hole at
Pink Panther
•2012 – 1 hole near mine south
•2015 – 3 holes at Pink Panther
•2016 – some 7,500m at Pink Panther.
Surface exploration diamond drilling during this period was relatively minimal until copper intersections and
DHEM anomalies at Pink Panther resulted in increased drilling in 2016.
7.3.32017 – 2020 Near-Mine Reverse Circulation Drilling
A substantial amount of the total near-mine RC drilling occurred in the 2017 to 2018 period, with some
additional holes in 2019 and 2020.
A small subset of RC drilling, including 17 holes in 2010, 6 holes in 2018 and 1 hole in 2020, have been drilled
for the purpose of establishing water bores. A further nine holes were drilled in 2023 to the south and east of
the tailings dam. The water bore holes are also sampled and assayed.
Over the course of 2017 to 2018 a significant number of holes were drilled including:
•65 at Kendi (along strike of QTS North)
•62 at Spotted Leopard
•58 at Pink Panther (south of QTS South)
•32 at QTS North
•18 at QTS South
•12 at Western Gossan.
In 2019, a further 17 holes were drilled at QTS South and 8 holes were drilled at QTS Central in 2020.
In general, the multi-element geochemistry from the RC drilling confirmed the strength of the geochemical
anomaly along the eastern side of the mine corresponding to QTS-style (chalcopyrite) mineralisation. These
results provide additional support for the plan to progress further exploration diamond drilling on the
eastern side of the known QTS North lenses.
Harmony Australasia | CONFIDENTIAL35
Technical Report Summary of the CSA Copper Mine, New South Wales, Australia
7.3.42017 – 2026 Diamond Drilling Campaigns
Interest in Pink Panther and QTS South continued with some 11,091m of diamond drilling in 2017.
In 2018, a total of 24,107m of diamond drilling tested mineralisation at QTS South, QTS North, Kendi, Spotted
Leopard and Western Gossan.
In 2019 some diamond drilling was undertaken at QTS North, however the major emphasis of the 2019
programme was the delineation of Inferred resources at QTS South (discussed below).
2022 – 2023 Diamond Drilling Campaign
The 2022 campaign, consisting of 11 holes, was based on modelling from the 2015 DHEM surveys of previous
drill holes and targeted the QTS North, QTS South and Western Gossan areas. Five holes at Western Gossan
drilled between August and November 2022, successfully intersected modelled DHEM conductor plates and
two zones of pyrite-sphalerite-galena mineralisation. Four holes at the QN prospect (potential lens east of
QTS North) intersected the modelled DHEM conductor plates and assays confirmed mineralisation in all holes
with a best intercept of 4.3 m at 3.30% Cu and 12.10 g/t Ag from 596.6 m in QNDD009.
Western Gossan lies immediately west of the historical Western System. DHEM data from holes CM50
(drilled in 1993 under Golden Shamrock Mines ownership) and SRDD11002 (drilled in 2011) produced two
strong conductors that aligned with significant mineralisation in some historical drill holes (circa 1958).
As above, five holes drilled in 2022 (3,771m) at Western Gossan intersected two zones of massive sulphide
mineralisation with significant sphalerite and lesser galena and chalcopyrite. The zones matched the
modelled conductors; DHEM and assay results are confirmed significant Zn-Pb-Ag mineralisation.
The QTS North and South drill targets were based on DHEM data from holes drilled in 2018-19. Two modelled
conductors aligned with mineralisation in nearby holes. As of 24 February 2023, four holes had been
completed and intersected chalcopyrite mineralisation within Fe-chlorite alteration within the modelled
conductors.
At QTS South modelling from DHEM surveying in 2020 on some 19 DDHs indicated three potential
conductors. One hole was drilled from February to April 2023 but failed to intersect the modelled conductor
plate and did not intersect significant mineralisation.
The 2023 campaign, consisting of nine holes, targeted the strongest auger-soil Cu anomalies at the Stoney
Tank (2 holes), Falcon (3 holes), Ringneck (2 holes) and Midnight (2 holes) prospects. All holes intersected
alteration and minor mineralisation with STDD23001 producing the best intercept of 0.75 m at 7.8 % Cu and
35.9 g/t Ag from a down hole depth of 476.7 m.
A tenth hole was drilled into a late channel FLEM anomaly on the western margin of the Kendi prospect but
did not intersect alteration or mineralisation.
In 2024 five diamond drill holes are progressing at the Tailings Dam prospect (historical off hole conductor
and along strike of a historical Cu intercept) and Cherry prospect (geochemical target). Additional holes are
planned to test late channel FLEM anomalies south of the mine at the Outer Reef prospect and at the QTS
South and QTS Central systems at CSA.
In 2026 a campaign of deep drillholes commenced with the first drillholes still ongoing at end of June 2026.
7.4Underground Drilling
Underground drilling is directed at extending and defining mineralisation below the current working levels in
order to define reserves ahead of mining (Figure 7-4). During the year some holes may be drilled for purely
exploration purposes and some of the resource definition holes may be extended to test a nearby
exploration mineralisation. The aim of these drilling programs is to replace, as a minimum, the Reserve
material extracted each year.
In conjunction with continuous copper production over the past 10 years, CSA has successfully maintained
replenishment of Mineral Resources each year. Additional detail on the Mineral Resource Estimate is
outlined in Section 11.
Harmony Australasia | CONFIDENTIAL36
Technical Report Summary of the CSA Copper Mine, New South Wales, Australia
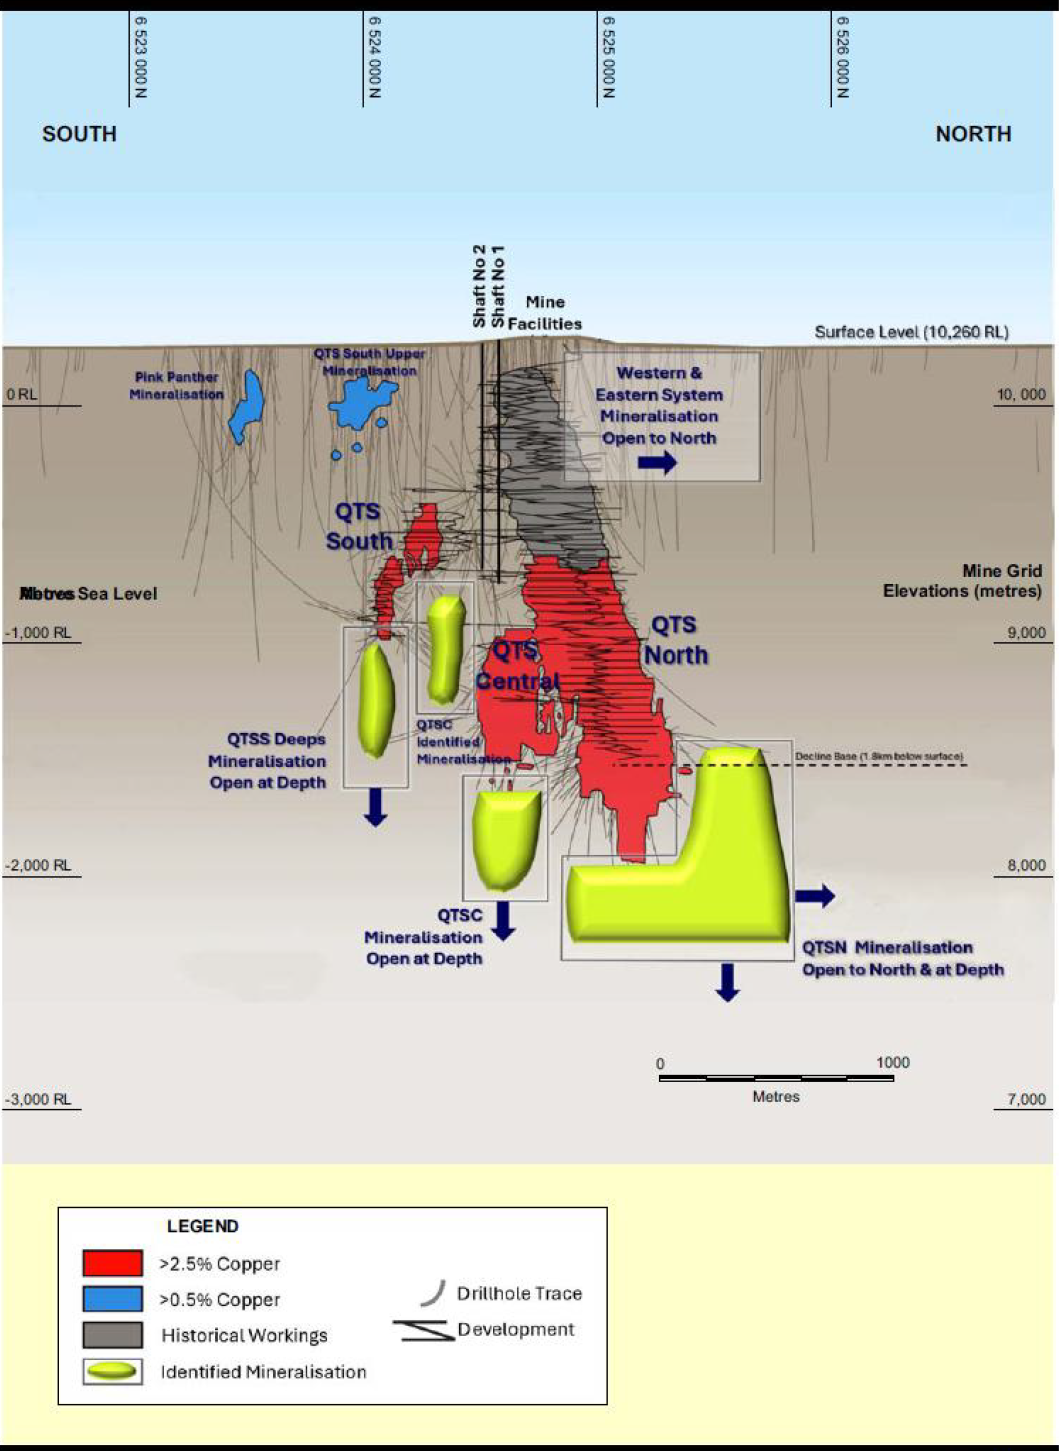
Figure 7-4 Long Section CSA Lodes – Potential Mine Life Extension, Merrin Mine comprises the Western and Eastern lodes
within the historical workings.
In addition to resource and exploration drilling as described above, drilling is also completed for geotechnical
purposes ahead of mine infrastructure programs (e.g. vent rises) and for other mine infrastructure such as
paste fill, electrical and water supply. All holes are geologically logged and sampled as required. Selected
holes are geotechnically logged as coverage requires.
Harmony Australasia | CONFIDENTIAL37
Technical Report Summary of the CSA Copper Mine, New South Wales, Australia
By the June 2026 there were approximately 3,700 diamond holes and 253,000 samples contributing to the
CSA Mineral Resource with hole information dating as far back as 1950.
7.5Geotechnical Data
Geotechnical information has been collected at CSA over more than 20 years as part of ongoing underground
resource definition, exploration and infrastructure drilling programmes. All drill core is routinely logged for
core recovery and Rock Quality Designation (RQD), while selected holes are additionally logged for
geotechnical purposes including rock strength, fracture frequency, number of joint sets, discontinuity
characteristics, roughness, infill material, orientation data and Q-system parameters. Geological and
geotechnical mapping is completed in active underground development areas, including face mapping, backs
mapping and structural mapping. The resulting information is captured within the CSA drillhole database and
forms the basis of geotechnical interpretation, mine design and ground support design.
The geotechnical database has been supplemented by laboratory testing programmes undertaken at various
times throughout the life of the operation. Historical laboratory testing comprised uniaxial compressive
strength (UCS), Brazilian tensile strength and point-load testing. A targeted rock-property testing programme
completed during 2025 significantly expanded the database and included testing of mineralised, altered and
unaltered host lithologies from active mining horizons. Testing demonstrated that competent mineralised
and quartz-altered units generally exhibit UCS values in the range of approximately 140 MPa to 200 MPa,
whereas chlorite-altered and shear-hosted lithologies may exhibit materially lower strengths ranging from
approximately 20 MPa to 60 MPa equivalent UCS. These results have been incorporated into the current
geotechnical model and numerical modelling studies used to support mine planning and Reserve estimation.
Geotechnical quality assurance and quality control procedures include standardised logging protocols,
routine review of logging practices by site geotechnical personnel, photographic core records, validation of
structural measurements, and periodic independent review of geotechnical models and assumptions. Ground
support QA/QC includes friction bolt pull-testing, fibrecrete strength testing, grout testing and routine
compliance audits undertaken by site geotechnical engineers. Ground conditions are continually monitored
through underground inspections, cavity monitoring surveys, LiDAR surveys, extensometers, seismic
monitoring systems and ground support performance reviews.
The currently adopted geotechnical assumptions used in mine planning and Reserve estimation are
supported by the available drilling, mapping, laboratory testing, monitoring systems and numerical modelling
studies. The Qualified Person considers the quantity and quality of geotechnical information available for CSA
to be sufficient to support the mining methods, excavation dimensions, extraction sequences, ground
support standards and modifying factors applied in the Mineral Reserve estimate.
7.6Hydrological Data
Hydrogeological information at CSA has been collected through operational monitoring programmes rather
than dedicated resource-definition drilling. The CSA operation is considered a relatively dry underground
mine and has historically experienced minimal groundwater inflow. Water entering the underground
workings is predominantly associated with operational activities including service water and paste-fill
operations rather than natural groundwater sources. Consequently, dedicated hydrogeological drilling and
aquifer testing programmes have not been required to support current mining operations or Mineral
Resource estimation.
Hydrogeological information relevant to the operation is obtained through mine dewatering records,
groundwater monitoring infrastructure associated with the Tailings Storage Facilities, water supply borefields
and site-wide environmental monitoring programmes. Current monitoring infrastructure includes standpipe
piezometers, vibrating wire piezometers, groundwater monitoring bores and production bores. Water levels
are routinely recorded and groundwater quality sampling is undertaken where required in accordance with
site environmental procedures and applicable Australian monitoring standards. Independent hydrogeological
investigations have previously been completed by specialist consultants to assess groundwater conditions,
aquifer characteristics and potential groundwater interactions associated with mine infrastructure and
tailings storage facilities.
Hydrogeological quality assurance procedures include routine calibration and maintenance of monitoring
equipment, verification of monitoring results, periodic review of monitoring data and independent specialist
review of hydrogeological conditions where required. Groundwater monitoring data indicate that
groundwater conditions have had minimal influence on underground mining operations and have not
Harmony Australasia | CONFIDENTIAL38
Technical Report Summary of the CSA Copper Mine, New South Wales, Australia
required significant dewatering activities. Available information indicates that groundwater inflows are low
and do not constitute a material risk to current or planned mining activities.
Because the Mineral Resource estimate is based on geological continuity, grade continuity, density and
economic factors, hydrogeological information is not directly used in grade estimation or resource
classification. Nevertheless, the available hydrogeological data and operational experience support the
conclusion that groundwater conditions do not materially affect the reasonable prospects for eventual
economic extraction of the reported Mineral Resources. The Qualified Person considers the available
hydrogeological information sufficient to support the current Mineral Resource and Mineral Reserve
estimates and notes that no material hydrogeological issues have been identified that would reasonably be
expected to impact planned mining activities.
7.7Qualified Person’s Opinion on Exploration Interpretations
The QP considers the drilling and exploration programmes completed at CSA to be appropriate for near-mine
exploration, geotechnical assessment and resource replacement. In-fill drilling is undertaken at an
appropriate rate to allow the steady conversion of resources to reserves as required and to provide the
necessary information for detailed mine planning.
Geotechnical parameters are collected in conjunction with underground diamond drilling and geotechnical
data is captured within the drill database for consideration during the estimation of Mineral Reserves and
Mineral Resources and in the detailed design of underground stopes and development. CSA maintains an
extensive database of geotechnical data, has a solid understanding of the geotechnical characteristics of the
mine and undertakes continuous improvement activities on a regular basis.
Results indicate that geotechnical and hydrogeological conditions are consistent with the assumptions used
for mine design and support the mining methods and excavation geometries adopted in the Technical Report
Summary.
8Sample preparation, analyses and security
Section 229.601(b)(96)(iii)(B)(8) (i-v)
8.1Assay Sample Preparation and Analysis
Core processing follows the standard sequence of meter mark-up, quantification of recovery, RQD
determination, geological logging, sample mark-up, core photography, bulk density determination and
sampling.
The sampling procedure includes interval checks, cutting intervals, sampling intervals, inserting standards,
sampling duplicates, weighing samples and dispatching samples. All parts of the core processing cycle are
tracked and recorded electronically.
Core yard technicians review the core and check the sample intervals as identified on the sampling sheet,
including checking to ensure that the sample intervals satisfy length requirements (0.4 – 1.1m for NQ core).
The geologist corrects any errors or discrepancies.
Core is cut according to the core cutting procedure with a CoreWise diamond core saw.
Once the entire hole is cut, trays are laid out in order on the racks or on pallets. Sample intervals are marked
onto the tray before sampling, allowing the correct sample intervals to be written onto the remaining half
core. The core is cut in half with one half submitted to the laboratory for analysis and the other half returned
to the tray. The half core to be analysed is sampled into pre-numbered calico bags with sample numbers
from the bags written on the sample sheet before sampling. Sticks of half core longer than approximately
8cm are broken in order to reduce the risk of sample bags tearing during transport.
Sample preparation and assaying is carried out by independent laboratory, Australian Laboratory Services
(ALS) in Orange, NSW, using an aqua regia digest and the Inductively Coupled Plasma Atomic Emission
Spectrometry (ICP-AES) analytical method, with analysis for a standard suite of elements including copper,
zinc, lead, and silver. Comprehensive Quality Assurance/Quality Control (QA/QC) protocols have been in
place since 2004 and include insertion of standards (supplied by Ore Research and Exploration Pty Limited),
blanks and duplicate samples at a frequency of approximately 1 in 30 samples. CSA monitors the QA/QC data
reports; the sampling and assaying data for the main elements are considered reliable and without material
Harmony Australasia | CONFIDENTIAL39
Technical Report Summary of the CSA Copper Mine, New South Wales, Australia
bias and sample security arrangements are appropriate and satisfactory. CSA’s relational drillhole database is
an acQuire database which is a site-managed system.
8.2Bulk Density Determinations
CSA has compiled a database of around 16,000 bulk density values by testing one sample from each core tray
(approximately one sample per 6.5m of core) and determining density using the water immersion method. A
regression formula based on the copper assay of the samples tested has been derived from this data. Since
2017, CSA has used ALS to carry out density measurements; CSA advises that the ALS data aligns well with the
site-developed regression formula.
8.3Quality Assurance and Quality Control
Regular analysis of CSA mine standards, inserted with each batch sent to the laboratory, commenced in 2007.
These are in addition to normal laboratory standards inserted in the process by ALS. All QA/QC data are
stored in the CSA acQuire database.
Sample weights are measured both before the samples leave CSA Mine site, and before the samples are
prepared for analysis at the ALS laboratory.
Standards and Blanks
External standards and blanks are inserted into the sampling sequence for each drill hole assay submission.
One blank and eleven standards derived from CSA mineralisation were prepared, supplied and certified by
Ore Research and Exploration Pty Ltd for use at CSA.
Standards to be inserted are specified by the logging geologist on the sampling sheet. The procedure requires
a minimum of one standard for every 30 samples, with the selected standard representing a copper grade
similar to the estimated copper grade in the surrounding samples. The core yard technician removes the label
from the standard so that it cannot be identified by the laboratory. It is placed in the appropriately numbered
sample bag and secured. Blanks are inserted periodically, principally following high grade samples to check
for contamination in the laboratory processing stream.
8.3.1Field Duplicates
Duplicate intervals are specified by the geologist on the sampling sheet and are collected approximately
every 30 samples. Duplicate samples are also inserted at the end of the hole. The core yard technician
removes the remaining half of the core from the selected interval and places it in the appropriately
numbered sample bag. For those intervals with duplicate samples, no core remains in the tray.
A separate dispatch is completed for each drill hole.
Comparison of original and duplicate (second half of drill core) assay results for the period 2002 to 2021
indicate good performance for copper, with a correlation coefficient of 0.98. Silver field duplicates are more
variable than copper with a correlation coefficient of 0.79.
8.3.2Laboratory QA/QC
ALS inserts standards into the sample stream as part of its internal QA/QC procedure. Assay results for these
standards are supplied with results for the samples submitted for analysis. Assay results for laboratory
standards are also stored in the acQuire database. Again, laboratory standards are checked on receipt and
incorporated in the QA/QC reports generated within the acQuire database and any issues are reported
immediately to the laboratory for resolution.
8.4Security and Storage
Geological records and assay data are stored in an acQuire database. Drill hole information is stored as collar,
down hole survey, assay, geology, specific gravity and geotechnical data.
Drill hole location data are entered manually, survey and assay data are uploaded from the survey tool and
laboratory downloads respectively. Geology data is entered manually from paper logs or logged directly into
acQuire via a laptop computer. A significant proportion of drill data in the database is derived from historic
hardcopy drill logs.
All data entered is tracked via various registers, including Diamond Drill Hole Register, Diamond Drilling
Spreadsheet, Core Processing Checklist and UG Sampling Register.
Harmony Australasia | CONFIDENTIAL40
Technical Report Summary of the CSA Copper Mine, New South Wales, Australia
There are four levels of access to the database. ‘Read only’ access is permitted for “public” users, ‘restricted
data entry’ access for “data entry” users and ‘write access’ to data tables for “acQuire user” users. This
hierarchical security structure allows only the database manager full access to the data.
8.5Qualified Person’s Opinion on Sample Preparation, Security and Analytical Procedures
External consultants have undertaken reviews of historic (2020 and 2021) and recent (2022 and 2023) CMPL
reports detailing the sample preparation, analysis and security and were satisfied that the current practices
undertaken by CMPL are to industry standard and provide assay data which are sufficient to support the
estimation of a Mineral Resource. The QP has reviewed the process and reports and is satisfied that the
practices meet current international standards and are sufficient to support the estimation of a Mineral
Resource.
9Data Verification
Section 229.601(b)(96)(iii)(B)(9) (i-iii)
9.1Internal Data Verification
Basic database validation checks are carried out by CMPL personnel. These include sample from and to
depths, geology depths, record duplication and missing collar duplication checks, as well as collar survey and
down hole survey checks. Assay certificates are verified against acQuire dispatch and laboratory job numbers.
Extensive random checks of the digital database are made against hardcopy/pdf format assay certificates and
geology logs.
Core recovery data has only been collected consistently at CSA since 2004. Data from 2004 shows an average
core recovery greater than 95%. Poor core recoveries are not considered to have a significant impact on the
CSA resource.
9.2Review of CMPL’s QA/QC
Cube undertook a desktop review of historic (2020 and 2021) and recent (2022 and 2023) CMPL Mineral
Resource reports containing control charts detailing the results of CSA QA/QC. The process of systematic QA/
QC monitoring has been in place since 2007. Cube’s review of standards and laboratory and field duplicate
results has identified no material issues, indicating the assay data used by CMPL is without material bias due
to laboratory processes and that results are repeatable with an appropriate level of precision and accuracy.
The QP is satisfied that the current practices undertaken by CMPL are to industry standard and provide assay
data which are sufficient to support the estimation of a Mineral Resource.
9.3Geological and Operation Reconciliation
Confidence in the geological interpretation and estimation at CSA is supported by a history of reconciliation
of mined tonnage and grade compared with the stope tonnes and grade depleted, the latter being based on
the resource and reserve estimates. CSA tracks the stope grades for the Undiluted Stope Design (resource
grade), the Diluted Stope Design (the reserve grade) and the actual mined grades as reconciled to the mill.
CSA uses a Cavity Monitoring System to obtain the final volume (tonnes) of each mined stope. The ore mined
tonnes and grade are reconciled against the reported ore milled tonnes and grade, allowing for opening and
closing stockpile figures.
Historically, CSA’s stope reconciliation reports show reasonably good agreement between the Reconciled Ore
Mined figures and the Diluted Stope Design (reserve) figures. Over a ten-year period to December 2025, the
annual stope production reconciliations showed tonnage reconciliations averaging 101%, copper grade
reconciliation averaging 102% and copper metal reconciliation averaging 103%. Reconciliation data for the
last five years covering the period 2021-2025 is shown in Table 9-1 and indicates a reconciliation of 92% for
tonnes, 97% for grade and 90% for contained copper metal.
The high-grade nature of the deposit means that any ore losses or excess dilution can have a meaningful
impact on ore tonnes and grade. The higher dilution seen in recent years, where level spacing was
temporarily increased, appears to have had a negative impact on reconciliation.
Harmony Australasia | CONFIDENTIAL41
Technical Report Summary of the CSA Copper Mine, New South Wales, Australia
Table 9-1 CSA Stope Reconciliation - Ore Mined vs Reserve – 2021 to 2025
Year | Category | Tonnage | Grade | Contained Copper |
Mt | % Cu | kt | ||
2021 | Reserve Depleted | 0.816 | 3.94 | 32.2 |
Ore Mined (Mill Reconciled) | 0.695 | 3.97 | 27.6 | |
Mined vs Reserve | 85% | 101% | 86% | |
2022 | Reserve Depleted | 0.576 | 3.69 | 21.2 |
Ore Mined (Mill Reconciled) | 0.538 | 3.44 | 18.5 | |
Mined vs Reserve | 93% | 93% | 87% | |
2023 | Reserve Depleted | 0.351 | 3.20 | 11.2 |
Ore Mined (Mill Reconciled) | 0.293 | 3.40 | 10.0 | |
Mined vs Reserve | 84% | 107% | 89% | |
2024 | Reserve Depleted | 1.070 | 3.93 | 42.1 |
Ore Mined (Mill Reconciled) | 1.070 | 3.39 | 36.3 | |
Mined vs Reserve | 100% | 86% | 86% | |
2025 | Reserve Depleted | 0.870 | 4.0% | 34.7 |
Ore Mined (Mill Reconciled) | 0.870 | 4.0% | 34.8 | |
Mined vs Reserve | 100% | 100% | 100% | |
Overall (Average) | 92% | 97% | 90% |
9.4Qualified Person’s Opinion on Data Adequacy
The QP is satisfied that the data on which the Mineral Resource has been based are of sufficient quality to
support the estimation of a Mineral Resource.
10Mineral Processing and Metallurgical Testing
Section 229.601(b)(96)(iii)(B)(10) (i-v)
With more than 50 years of operating history, the CSA orebody mineralogy is well understood with the
operating performance of the processing plant consistently achieving metallurgical recoveries in the order of
97-98% to produce a high-quality 26-27% Cu concentrate.
An overview of the standard metallurgical management activities performed during CSA operations along
with a selection of historical metallurgical studies are summarised in the following sections. Some of these
studies were investigative in nature and may not have resulted in significant modifications or adjustments to
the processing facility.
10.1Overview of Metallurgical Testing Practices
Being an operating mine, particularly one with such extensive operating history, CSA has established standard
operating procedures for metallurgical management of the processing facility.
The operation employs dedicated metallurgical staff and conducts regular operational test practices using a
combination of onsite and offsite laboratory testing.
The most comprehensive test regime employed by the metallurgical team on a regular basis is the Flotation
Plant Survey which takes multiple samples from across all key process streams throughout the plant to
establish a detailed mass balance and provide input into ongoing data analysis. The following outlines the key
procedures:
•Sample collection follows the internally developed Safe Work Instruction - Flotation Survey Procedure,
updated in November 2022, which is based on sample techniques reported in Wills’ Mineral
Processing Technology book from JKMRC Australia 7th Edition
•Metallurgical samples from across 22 locations within the processing streams are taken in various set
intervals and conducted in accordance with sample capture procedures
Harmony Australasia | CONFIDENTIAL42
Technical Report Summary of the CSA Copper Mine, New South Wales, Australia
•Standard onsite sampling and testing includes flotation, settling tests, On-stream Analyzer (“OSA”)
calibration samples, PSI flotation feed, Specific Gravity (SG) testing and moisture analysis
•X-ray fluorescence (“XRF”) analysis is conducted in the onsite laboratory to establish initial results
used for short-term operational decisions and internal reporting
•A selection of samples is then sent offsite to independent ALS Ltd. laboratory Service for assay using
Inductively Coupled Plasma Atomic Emission Spectroscopy (ICP-AES), an analytical method used to
detect and measure elements to analyse chemical samples
•Samples requiring comminution analysis are typically sent to JKTech Pty Ltd. (“JKTech” or “JK”)
laboratories at the University of Queensland
•Results received from onsite and offsite laboratories are then incorporated into a detailed data
analysis and regression modelling process outlined in Section 10.2
•Site samples for analysis are kept and stored in the onsite laboratory
•Offsite laboratory results are compared with onsite laboratory results to allow the metallurgical team
to calibrate internal metallurgical models, onsite laboratory equipment and plant equipment
•Results are regularly validated through repeat sampling, and statistical analysis; activities commonly
requiring validated results include those required for adjustments of SG gauges of the flotation feed
and concentrate thickener; in such cases, four samples are taken from each sample point to establish
the average and standard deviation of the results.
10.2Data Analysis and Regression Modelling
Testing procedures and results are supported by statistical analysis such as regression models, reproducibility
tests, and variability mapping. During individual operational trials, test work is usually supported by statistical
experimental design (t-tests) using the statistic computer package Minitab.
An End of Month Metal Reconciliation is based on a Matrix-mass balance approach, which involves data from
several sources including:
•offsite ALS Laboratory assay results
•onsite laboratory XRF
•site and port stockpile information from Alfred H Knight (independent laboratory service), Qube
Logistics (port operator), and Aurizon (rail operator)
•internal mining data.
The mass balance is established to identify actual from reconciled residuals through the adjustment of
standard deviations and Monte Carlo simulations. If the mass balance identifies discrepancies, data and
instrumentation are reviewed in detail for readjustments.
Key analysis within the mass balance process includes assays of feed, concentrate and tailings streams.
Composite samples are sent to ALS and for XRF in-house analysis.
10.3Planning and Forecasting
The Weekly, Monthly and Quarterly plans used in CSA’s operations employ in-house calculated regression
models to establish appropriate assumptions and forecasts. The regression model incorporates
geometallurgical results, elemental to mineral conversion calculations, back-calculations, and mining figures
(haulage and stope grades).
Two main components of the processing forecasts and their associated drivers are:
•Grinding Forecast
•Mill Power Assessment - based on the Mine Future Ores Program conducted in 2020 by JKTech and
based on comminution models reported by Napier Munn 1999, Mineral Comminution Circuits
•Modified Throughput Model - employs power parameters based on regression models and SAG and
ball mill powers and parameters.
•Flotation Forecast
Harmony Australasia | CONFIDENTIAL43
Technical Report Summary of the CSA Copper Mine, New South Wales, Australia
•Recovery and Concentrate Grade - regression models developed from geometallurgy, mineralogy and
flotation testwork database
•Tailings Grade Prediction - back-calculated from the calculated feed grade, milled tonnes, and copper
metal tonnes
•Anticipated Feed Grade - calculated from the mining figures, haulage tonnage and stope copper
grades.
CSA has maintained excellent consistency in copper and silver recovery, due largely to the continual
improvement on internal geometallurgical models. As CSA continues to develop existing orebodies at depth,
extend existing orebodies laterally, discover new orebodies and, potentially, treat third-party ore sources, the
metallurgical team will continue to undertake testwork and improve the accuracy of these models.
10.4Deleterious Elements
The influence of deleterious elements on CSA’s operations is low, however regular testing and analysis is
performed to ensure any elevated levels are managed effectively. Close attention is given to stopes
containing relatively high amounts of iron, zinc and lead (which may vary from 0.01 to 0.6%). Any elevated
levels are immediately communicated to mine geologists. Laboratory batch flotation selectivity, and mineral
liberation test work on future mineralisation are conducted to prepare planning inputs and minimise any
influence on product grades.
10.5Test Laboratories
CSA maintains an onsite laboratory capable of conducting flotation tests, settling tests, On-Stream Analyzer
(OSA) calibration samples, flotation feed slurry testing, specific gravity determinations, and moisture testing.
The onsite laboratory is used for operational support and process monitoring.
Metallurgical test samples utilised throughout the various testwork programs are considered representative
of the principal ore types and styles of mineralisation comprising the CSA Mineral Resource and Mineral
Reserve. Testwork has been conducted on samples collected across the operation over many years and has
demonstrated good agreement with actual processing plant performance.
Offsite laboratories are used for independent analytical work, metallurgical testwork and validation. ALS
Laboratory Services in Orange, New South Wales, and JKTech at The University of Queensland are the offsite
laboratories commonly utilised.
ALS Limited is an independent third-party laboratory services provider headquartered in Brisbane, Australia.
ALS provides testing, inspection, certification and verification services globally through a network of
laboratories and technical facilities. ALS operates accredited quality management systems and maintains ISO
9001 certification. Relevant ALS geochemistry laboratories utilised for CSA testwork operate under NATA
accreditation and ISO/IEC 17025 accreditation.
JKTech is a subsidiary of The University of Queensland and provides specialist consultancy and laboratory
services to the mining industry, including comminution, flotation, hydrocyclone and metallurgical testing and
assessment. JKTech is independent of the registrant and has no relationship to the registrant other than the
provision of commercial testing and consulting services.
10.6Comminution
Design and range values for CSA’s primary comminution properties are outlined in Table 10-1. These values
have been established through various testing campaigns conducted by CSA over the past 50+ years of
operation.
Table 10-1 Comminution Properties
Comminution Properties | Unit | Value |
Abrasion Index Range | 0.03 – 0.24 | |
Abrasion Index Design | 0.09 | |
Bond Impact Crushing Work Index – Design | kWh/t | 19.0 |
SMC Drop Weight Index – Range | kWh/m3 | 2.35 – 7.28 |
SMC Drop Weight Index – Design | kWh/m³ | 4.77 |
Bond Rod Mill Work Index – Range | kWh/t | 11.0 – 22.1 |
Harmony Australasia | CONFIDENTIAL44
Technical Report Summary of the CSA Copper Mine, New South Wales, Australia
Bond Rod Mill Work Index – Design | kWh/t | 16.7 |
Bond Ball Mill Work Index – Range | kWh/t | 7.8 – 17.0 |
Bond Ball Mill Work Index – Design | kWh/t | 15.3 |
Axb Range | 27 – 97 | |
Axb Design | 40.3 |
10.7Recovery and Concentrate Estimates
Design and range values for CSA’s primary recovery properties are outlined in Table 10-2.
Table 10-2 Copper Flotation Results
Cu Flotation Concentrate | Units | Result |
Cu Concentrate Grade (range) | % | 24.0 – 29.0 |
Cu Concentrate Grade (design) | % | 26.5 |
Cu Recovery (design) | % | 98.0 |
Cu Recovery (for resource and reserve estimation) | % | 97.5 |
10.8Qualified Person’s Opinion on Mineral Processing and Metallurgical Testing
Over the long operating history of the CSA Mine, the QP is satisfied that the metallurgical testwork
programmes undertaken have been comprehensive and extensive. The metallurgical testwork is considered
representative of the principal ore types comprising the Mineral Resource and Mineral Reserve, and the
results are supported by the long-term operating performance of the concentrator. The QP considers the
metallurgical understanding of the deposit to be robust and sufficient to support the conclusions presented
in this TRS.
11Mineral Resource Estimate
Section 229.601(b)(96)(iii)(B)(11) (i-vii)
This section contains forward-looking information related to tonnage and grade for the project. The material
factors that could cause actual results to differ materially from the conclusions, estimates, designs, forecasts
or projections in the forward-looking information include any significant differences from one or more of the
material factors or assumptions that are set forth in this sub-section including actual in-situ characteristics
that are different from the samples collected and tested to date, and equipment and operational
performance that yield different results from current test work results.
11.1Introduction
The Mineral Resource estimate for CSA Operations covers the QTS North, QTS Central, QTS South, Eastern
and Western mineralised systems, QTS South Upper and the Merrin mine (historically mined upper parts of
Eastern and Western lodes of the QTS system) as at June 2026. CSA is an established, long-life underground
copper-silver mining operation located near Cobar, New South Wales, Australia. Accordingly, the project is
not a preliminary sampling, early exploration, Scoping, Pre-Feasibility or Feasibility stage project; it is an
operating mine with ongoing resource definition, infill drilling, grade-control support, mine planning,
metallurgical monitoring and production reconciliation.
The report is to support statutory Mineral Resource reporting by summarising the geological setting, data
collection methods, sampling and QA/QC practices, geological interpretation, estimation methodology,
classification criteria, validation outcomes and reasonable prospects for eventual economic extraction. The
report is structured to address the relevant requirements of SAMREC 2016 and SK-1300 on an “if not, why
not” basis, and is intended to provide a traceable basis for the Mineral Resource statement and associated
technical disclosures.
The CSA Mineral Resource estimate is updated annually and consists of Measured, Indicated and Inferred
(“MII”) resources and was historically reported as at December of each year. The June 2026 Mineral Resource
Harmony Australasia | CONFIDENTIAL45
Technical Report Summary of the CSA Copper Mine, New South Wales, Australia
estimate was undertaken using all available drilling, geological and assay data as at 30 November 2025 and
depleted with strings and wireframes (Void Model) as at 30 April 2026.
Resource estimation at CSA is based on long-standing procedures, mostly dating from the mid-2000s, which
have been incrementally improved over the years. A void model is developed using the actual stope voids
mined plus an estimate of the stopes to be mined to the relevant cut-off date. The voids are deducted from
the resource model to obtain an estimate of the remaining in-situ resource. The new MRE is used by the
mining and technical services departments for mine planning for the following year and is used by the
company for the MRE statement.
CMPL defines resource wireframes for each mineralised lens in the seven systems – QTSN, QTSC, QTSS,
Eastern, Western, QTS South Upper and Merrin. Interpretation of the wireframes is based on geological
mapping in the mine, drill core logging, and the structural model that has been developed over time. The
wireframe contacts are interpolated between developed levels and then extrapolated beyond mine
development at 5m section increments using drill hole data, core photography and assay data. CMPL uses a
threshold value of 2.5% Cu from the assay database to guide the interpretation of the high-grade lenses. A
lower grade domain using a 1.5% Cu cut-off forms a lower grade halo around the high-grade lenses. An outer
mineralisation envelope is defined for each model using the regional S1 shear interpretations as boundaries.
Merrin and QTS South Upper both contain Zinc orebodies that are modelled using a zinc cut-off of 2.0% Zn
for the high-grade domain and 1.5% Zn for the low-grade domain.
Separate block models are established for each of the five systems. The parent block size of 5mE x 5mN x
10mRL is used for all models. Assay data is composited to 1m; no grade cuts are applied to the copper data
and only a few composite values are capped for silver. Variography is carried out for each mineralised lens if
there is sufficient data available. Grade estimation for copper and silver is carried out using Ordinary Kriging
(“OK”) in three passes with the first pass search ellipse based on the variogram range; the search ellipse
dimensions are doubled for the second pass and quadrupled for the third pass. Interpreted wireframe
boundaries are treated as hard boundaries for grade estimation. The density regression formula is applied
using the estimated block copper grade to determine the block bulk density value.
Resource classification of Measured, Indicated and Inferred is initially assigned to the blocks informed in Pass
1, 2 and 3 respectively. This initial classification is manually modified based primarily on the drilling density.
In general, areas with average drill hole spacing of 20 x 37.5m or less in QTSN and 20m x 20m for the other
orebodies are classified as Measured resources, with 40 x 70m or less as Indicated resources in QTSN and
40m x 40m in the other systems. Inferred resources are categorised in areas with a spacing exceeding that of
the upper limits on Indicated resources. CMPL separates Pass 3 blocks into Inferred resources and a fourth
category ‘Unclassified’ for areas of low confidence with sparse drilling; the Unclassified material is not
included in the reported MRE.
11.2Geological Database
In all, more than 253,000 samples from more than 3,700 diamond holes contribute to the CSA Mineral
Resources. This drilling ranges from as far back as 1950 to the present; however, the bulk of the drilling
contributing to the estimation is completed since 2000. The diamond holes used for estimation that were
drilled before 2000 are located predominantly in the upper levels and represent 47% of the total (1,770
holes); diamond holes drilled after 2000 primarily target lower levels and represent 53% of the total (2,007
holes (Table 11‑1). The average drillhole depth is approximately 170m with the maximum over 1,100m. In
general, drill spacing increases with distance from development with nominal 20m north-south by 20m
vertical spacing for 2 to 4 levels ahead of the mining front, expanding to 40m by 40m and greater below this.
For QTS North, the bulk of drilling prior to 2017 was at the above described spacing, but during 2017,
following an external analysis of the drill spacing, this was increased to 20m north-south by 37.5m vertical for
Measured and Indicated and double this for Inferred (Figure 11‑1).
Diamond holes are planned using a standard procedure. Core sizes vary, however the bulk of drilling used for
the current resource comprises NQ2 and NQ3 core sizes, with lesser contributions from HQ, NQ, BQ, LTK48
and LTK60. Since 2024, however, all underground drilling has used NQ3 core. Hole collars are marked up by
the mine surveyors and ‘picked up’ again by the mine surveyors on completion of drilling.
The database includes diamond holes used for Mineral Resource estimation, of which 1,698 pertain to QTS
North, 256 to QTS Central, 558 to QTS South, 367 to Eastern, 588 to Western and 310 to combinations of
these zones (Table 11‑2).
Harmony Australasia | CONFIDENTIAL46
Technical Report Summary of the CSA Copper Mine, New South Wales, Australia
Table 11‑1 Count of drilling types for CSA used in the Resource estimates
Drill Type | Count | Metres |
DD Prior 2000 | 1,770 | 193,660 |
DD Since 2000 | 2,007 | 449,409 |
Total | 3,777 | 643,069 |
Table 11‑2 Summary of DDH by CSA Mine Zones
Zone | No of Holes | DD (m) |
QTS North | 1,698 | 307,345 |
QTS Central | 256 | 62,467 |
QTS South | 558 | 74,526 |
Eastern | 367 | 37,342 |
Western | 588 | 80,167 |
Multiple Zones combined | 310 | 81,223 |
Total | 3,777 | 643,069 |
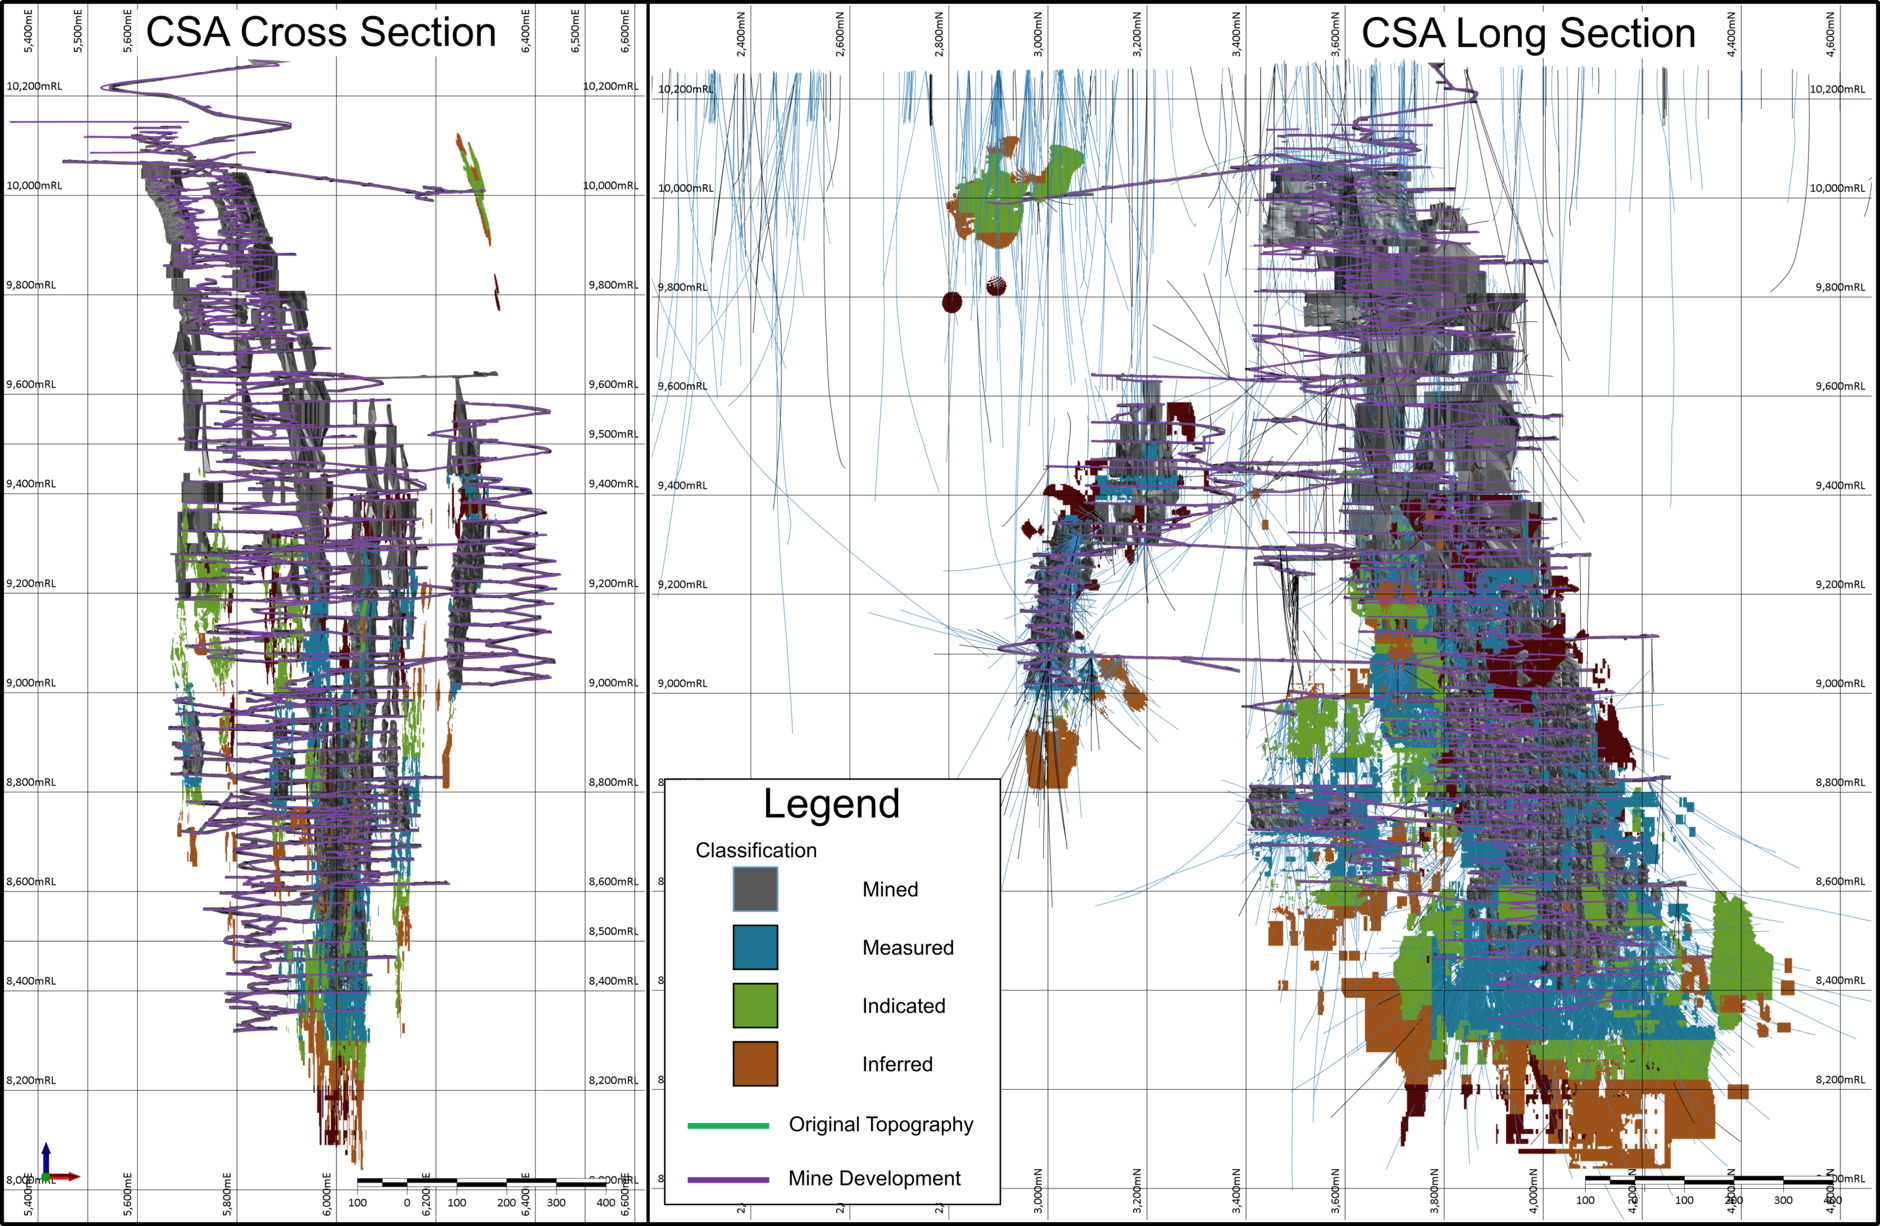
Figure 11‑1 Long Section showing drill density
A review of lens shape and the resource model revealed no obvious distortion that could be attributed to
incorrect location of drill intersections. Based on this, it is considered unlikely that actual drill collar locations
vary significantly from the planned locations.
The remaining unsurveyed holes in QTS North, QTS South, QTS Central, Eastern, Western, QTS South Upper
and Merrin have sufficient support from surveyed collars from the same drill pads, and a high enough density
of adjacent drill holes with surveyed collars to be confident in their use in the resource models.
As a minimum standard, down hole directional surveys are carried out at 15m, 30m and every 30m following.
Extra downhole surveys are conducted as deemed necessary. The azimuth of the 15m survey is at times
affected by the proximity of the drill rig or ferrous ground support and therefore is monitored closely.
Surveys that show significant deviation are checked and, if considered erroneous, are removed from the
Harmony Australasia | CONFIDENTIAL47
Technical Report Summary of the CSA Copper Mine, New South Wales, Australia
database. Since late 2016, multishot surveys, with surveys taken every 3m, are taken on completion of each
hole.
The data used to build the Mineral Resource model is sufficiently distributed to inform the estimate to a high
degree. In areas where data coverage is less dense, appropriate classification measures have been applied to
ensure that the associated risk is adequately conveyed.
The mineralisation demonstrates strong geological and grade continuity and is readily identifiable in drill core
and underground mapping, providing a high level of confidence in the position and grade of the ore. This
strong visual and geological continuity supports a high level of confidence in both the estimate and the
geological model.
11.3Geological Models
Mineralisation at CSA is largely controlled by major shears, and consists principally of massive, semi- massive,
and vein sulphides, with the dominant sulphide being chalcopyrite. Mineralisation away from the lenses is
narrow and discontinuous, occurring mainly in minor shears within barren altered sediments. Mapping and
core logging are the main sources of information, and greatly assist in interpretation of mineralisation.
Interpretation of lenses at CSA is based on geological mapping and diamond drilling data. Mineralised
boundaries are digitised from geological maps and the resulting strings are allocated to the appropriate RLs.
These boundaries are then interpolated between developed levels and extrapolated beyond development at
5m intervals and adjusted using diamond drill hole records, core photography and assay data. Boundary
strings are aligned to drill hole lithology/grade boundaries to ensure location accuracy. When the complete
set of bounding strings for an individual lens has been generated and checked, the strings are linked to
produce a solid lens wireframe.
High-grade lens interpretations are completed using a threshold value of 2.5% Cu, maximum internal
downhole waste of 3m and a minimum lens width of 3m. A lower grade halo domain has been constructed
around the high-grade lenses and is defined by Categorical Indicator Kriging (“CIK”) at a threshold of 1.5% Cu,
using an indicator probability value of 0.4.
The mineralised lenses for QTS South Upper and Merrin Mine have been compiled using implicit modelling
within Datamine. The copper dominant orebodies are modelled around the 2.5% Cu cut-off within a 1.5% Cu
CIK shell, while the zinc dominant lodes are modelled using a 2.0% Zn wireframe within a 1.5% Zn CIK shell.
No external dilution is added as lens block model margins are constrained by the geological interpretation
while overall models are constrained by regional shears.
11.4Mineralised Domain Coding
CMPL applies a systematic domain code to each lens wireframed within the five shear systems. The CSA
shear systems are Western, Eastern, QTS South, QTS Central and QTS North. The domain codes (ROCKZONE)
consist of three-digit codes for mineralised domains and two-digit codes for low grade/waste domains as
presented in Table 11-3.
Table 11-3 ROCKZONE codes
Mine Are | ROCKZONE |
Western – Low grade/waste | 80 / 10 |
Western – Mineralised | 100, 101,110,120,121,130, 140, 150, 160, 170, 180, 190, 200 |
Eastern – Low grade/waste | 80 / 30 |
Eastern – Mineralised | 700, 710, 720.to.810 |
QTS South – Low grade/waste | 80 / 70 |
QTS South – Mineralised | 600, 610, 620, 650, 670, 680 |
QTS Central – Low grade/waste | 80 / 40, 50, 60 |
QTS Central – Mineralised | 850, 860, 870, 880, 890, 900, 910, 920 |
QTS North – Low grade/waste | 80 / 20 |
QTS North – Mineralised | 300, 310, 320.to.50 |
QTS South Upper A – Waste | 85, 90 |
QTS South Upper A – Mineralised | 950, 960 |
Harmony Australasia | CONFIDENTIAL48
Technical Report Summary of the CSA Copper Mine, New South Wales, Australia
Merrin Mine HG Zinc | 201, 202, 203, 204, 205, 206, 207, 208, 210, 211, 212 |
Merrin Mine LG Zinc / Waste | 80, 81, 82 / 30 |
11.5Composites
Within the ROCKZONE wireframe domains the majority of sample intervals are 1m in length. CMPL has
determined that there is no correlation between sample length and copper grade. Sample intervals within
individual ROCKZONE wireframe domains are composited to 1m lengths for use in estimation.
11.6Exploration Data Analysis and Grade Capping/Outlier Restrictions
CMPL undertakes a statistical review of each ROCKZONE domain within the five shear systems to confirm
domain characteristics and identify outlier copper and silver grades. The copper statistics presented generally
confirm that the domain distributions are appropriate for a linear interpolation method such as Ordinary
Kriging. Silver distributions within ROCKZONE domains are shown to be more variable than copper indicating
a need for controlling the influence of outliers when using a linear interpolation method.
Within the copper grade populations, high grades are a feature, indicating the presence of massive copper
sulphide. Their occurrence is considered by CMPL to be acceptable in terms of geological continuity and
location within sulphide lodes, hence no grade capping is applied to the copper grades. While extreme
outliers are noted for silver, most are considered to be acceptable within the domain population. A small
number of silver grade caps have been used at QTS South and QTS Central. Grade capping replaces the
original grade with a selected maximum for interpolation. There is a minor level of correlation between
copper and silver at CSA, especially noted in the high-grade domains. The correlation is not strong enough to
support covariant modelling and copper and silver are estimated separately in the model. Stationarity tests
indicate there is very little variance across the deposit.
11.7Variography
Three-dimensional continuity analyses were conducted using Snowden Supervisor software. Traditional
variogram models were generated by ROCKZONE for copper and silver using the 1m composite data files. The
variogram models were updated for all systems, where copper and silver variables were transformed to
normal distribution (normal scores) before variogram calculation and back-transformed for estimation
purposes.
The downhole variogram was viewed for each ROCKZONE domain to determine the nugget effect as this
direction is the most informed to understand inherent variance. The nugget effect for copper and silver was
generally 10% to 35% of the total variability.
The copper and silver variogram models are often different. This is expected given the moderate correlation
between the data sets. Magnitudes and directions of the continuity ellipses match the steep plunge and sub-
vertical dip of the interpreted domains. The maximum copper ranges are generally longer than the silver
equivalents indicating the lower variance of the copper data.
11.8Block Model Definition
CMPL defines a three-dimensional block model for each of the mineralised systems using Datamine Studio
RM software. Block sub-division is not used for the bulk of the orebodies, however a sub-block of
1.25x1.25x2.5m (E,N,RL) is used for the QTS SU and Merrin mines.
11.8.1Block Size
A 5mE by 5mN by 10mRL block size is used for all mineralisation systems.
A 2005 KNA study (Eastern System) resolved that a block configuration of 5mE by 10mN by 10mRL was
appropriate but did not consider 5mE by 5mN by 10mRL block size as an option. Inspection of the block size
vs kriging efficiency and regression slope plot used in 2005 reveals that there is very little change in either
kriging efficiency or slope for smaller block sizes, up to the chosen configuration while both efficiency and
slope begin to deteriorate immediately past the chosen configuration. Given the proximity of this
deterioration to the chosen configuration, and the stability of smaller block sizes, it is considered that a
configuration of 5mE by 5mN by 10mRL is a more suitable configuration for the QTS orebodies.
Harmony Australasia | CONFIDENTIAL49
Technical Report Summary of the CSA Copper Mine, New South Wales, Australia
11.9Estimation/Interpolation Methods
Ordinary kriged grade estimation was performed using Datamine Studio RM software. The Datamine
Dynamic Anisotropy option was used for the first time in 2014 (Hosken, 2014), resulting in improved search
paths proximal to lens boundaries where a curved search is more appropriate.
Hard boundaries are applied using the ROCKZONE field and composited data. Copper and silver grades are
estimated using a three-pass search process. The first pass search is based on an optimal search derived from
Kriging Neighbourhood Analysis (“KNA”) studies completed for QTS North, QTS South, Eastern, Western and
QTS Central, the results were carried over to the Merrin mine and QTS SU. The first pass uses a search
distance equal to, or greater than variogram maximum ranges. The second pass typically uses double the
primary search range. A third pass is used to ensure each domain is fully populated with an estimated grade
using a search radius that is usually four times the range of the primary search, but up to 10 times for
sparsely populated domains. The same minimum and maximum number of samples is applied to the three
stages, with a maximum of four samples per borehole.
The KNA studies determined optimal block size, sample search radii, number of samples and discretisation.
Block size and discretisation parameters have been maintained for models produced since the KNA studies
were completed. Search sizes are updated each year based on updated variography.
11.9.1Discretisation
A 2006 KNA study determined an optimal discretisation for QTS North and QTS South of 4 by 4 by 4. Similarly,
the 2005 KNA study determined an optimal discretisation grid for Eastern of 2 by 4 by 4. These values are
considered still appropriate and were retained for the current estimation. The Western estimation uses a 4
by 4 by 4 discretisation grid and QTS Central 3 by 3 by 3.
11.9.2Number of Samples
The minimum and maximum numbers of informing samples used for the current estimation vary according to
lens, with an overall minimum of 5 to 10 and overall maximum of 20 to 30. A maximum of four samples were
allowed from any single drillhole. These numbers are based on the KNA studies.
11.10Density Assignment
In situ bulk density data consists of 16,000 records, collected at a frequency of one determination per core
tray (~6.5m for NQ core).
A regression equation is applied for block model density determinations. Block model in-situ density is
calculated using the estimated copper grade and the regression formula presented below, for all systems
except the Western System:
•In situ bulk density = 2.816 + 0.0406 x estimated copper grade (Cu %)
For the Western system, in situ bulk density is determined by:
•In situ bulk density = 2.780 + 0.0400 x estimated copper grade (Cu%)
For the Zinc systems, in situ bulk density is determined by:
•In situ bulk density = (Zn estimate + Pb estimate)*0.0326+2.884 for zinc orebodies
11.11Validation Visual Validation
Block models are validated visually by comparing the input data with the block estimates. Copper grade,
kriging efficiency and search pass are viewed in detail with drillhole data density to assess estimation quality.
In each case, there is a good correlation between data density and estimation quality (kriging efficiency).
11.11.1 Grade versus Elevation Plots
Grade versus elevation plots for each lens are reviewed. Each plot shows a good correlation between block
and sample grades where the number of drillhole samples is high. In all cases, the plots show that the block
grades represent a smoothed version of the sample grades, indicating the Ordinary Kriging ‘smoothing’
process has performed as expected. Modelled lenses are also reviewed against detailed underground face
mapping.
Harmony Australasia | CONFIDENTIAL50
Technical Report Summary of the CSA Copper Mine, New South Wales, Australia
11.11.2 Model versus Composite Statistics
Model and 1m composite grades for each system are compared against wireframes and block model
volumes. The sample and block grades are mostly within 10% of each other. In some cases, the sample
grades are higher than the model grades, which often indicate the drilling is clustered on high grade zones.
Ordinary kriging, in principle, is a least variance estimator and de-clusters the grades during the estimation
process.
The wireframe and block model volumes compare well in all cases, with the difference in most cases <1%.
11.12Confidence Classification of the Mineral Resource Estimate
Table 11-4 summarises the CSA Mineral Resource classification criteria with respect to kriging efficiency and
drill data density.
Table 11-4 CSA Mineral Resource Classification Criteria
Resource Category | General Description | Geostatistical Parameter |
Measured | The majority of mineralisation developed and mapped. Sufficient diamond drill data to define contacts, continuity, grade and density with a high level of confidence. Diamond drill spacing of approximately ≤ 20m north-south by 37.5m vertical for QTS North and 20m north- south by 20m vertical for other systems. | Majority search pass 1. Copper kriging efficiency > 40 RESCON=1 |
Indicated | Drill intersections are too widely spaced to ensure continuity, but adequate to assume continuity. Features as for Measured can be estimated with a reasonable level of confidence. Diamond drill spacing of approximately ≤ 40m north-south by 70m vertical (QTS North) and 40m north-south by 40m vertical (all other systems). | Majority search pass 1 and 2 Copper kriging efficiency > 20 < 40 where 1st pass is used. RESCON=2 |
Inferred | Not enough data to reliably predict contacts and grade continuity. Features as for Indicated can be estimated with a low level of confidence. Diamond drill spacing of approximately ≥ 40m north-south by 70m vertical (QTS North) and 40m north-south by 40m vertical (all other systems). Drill density is sufficient to give confidence that the lens persists down plunge/ dip | Majority search pass 2 and 3 Copper kriging efficiency < 20 where 1st pass is used. RESCON=3 |
Harmony Australasia | CONFIDENTIAL51
Technical Report Summary of the CSA Copper Mine, New South Wales, Australia
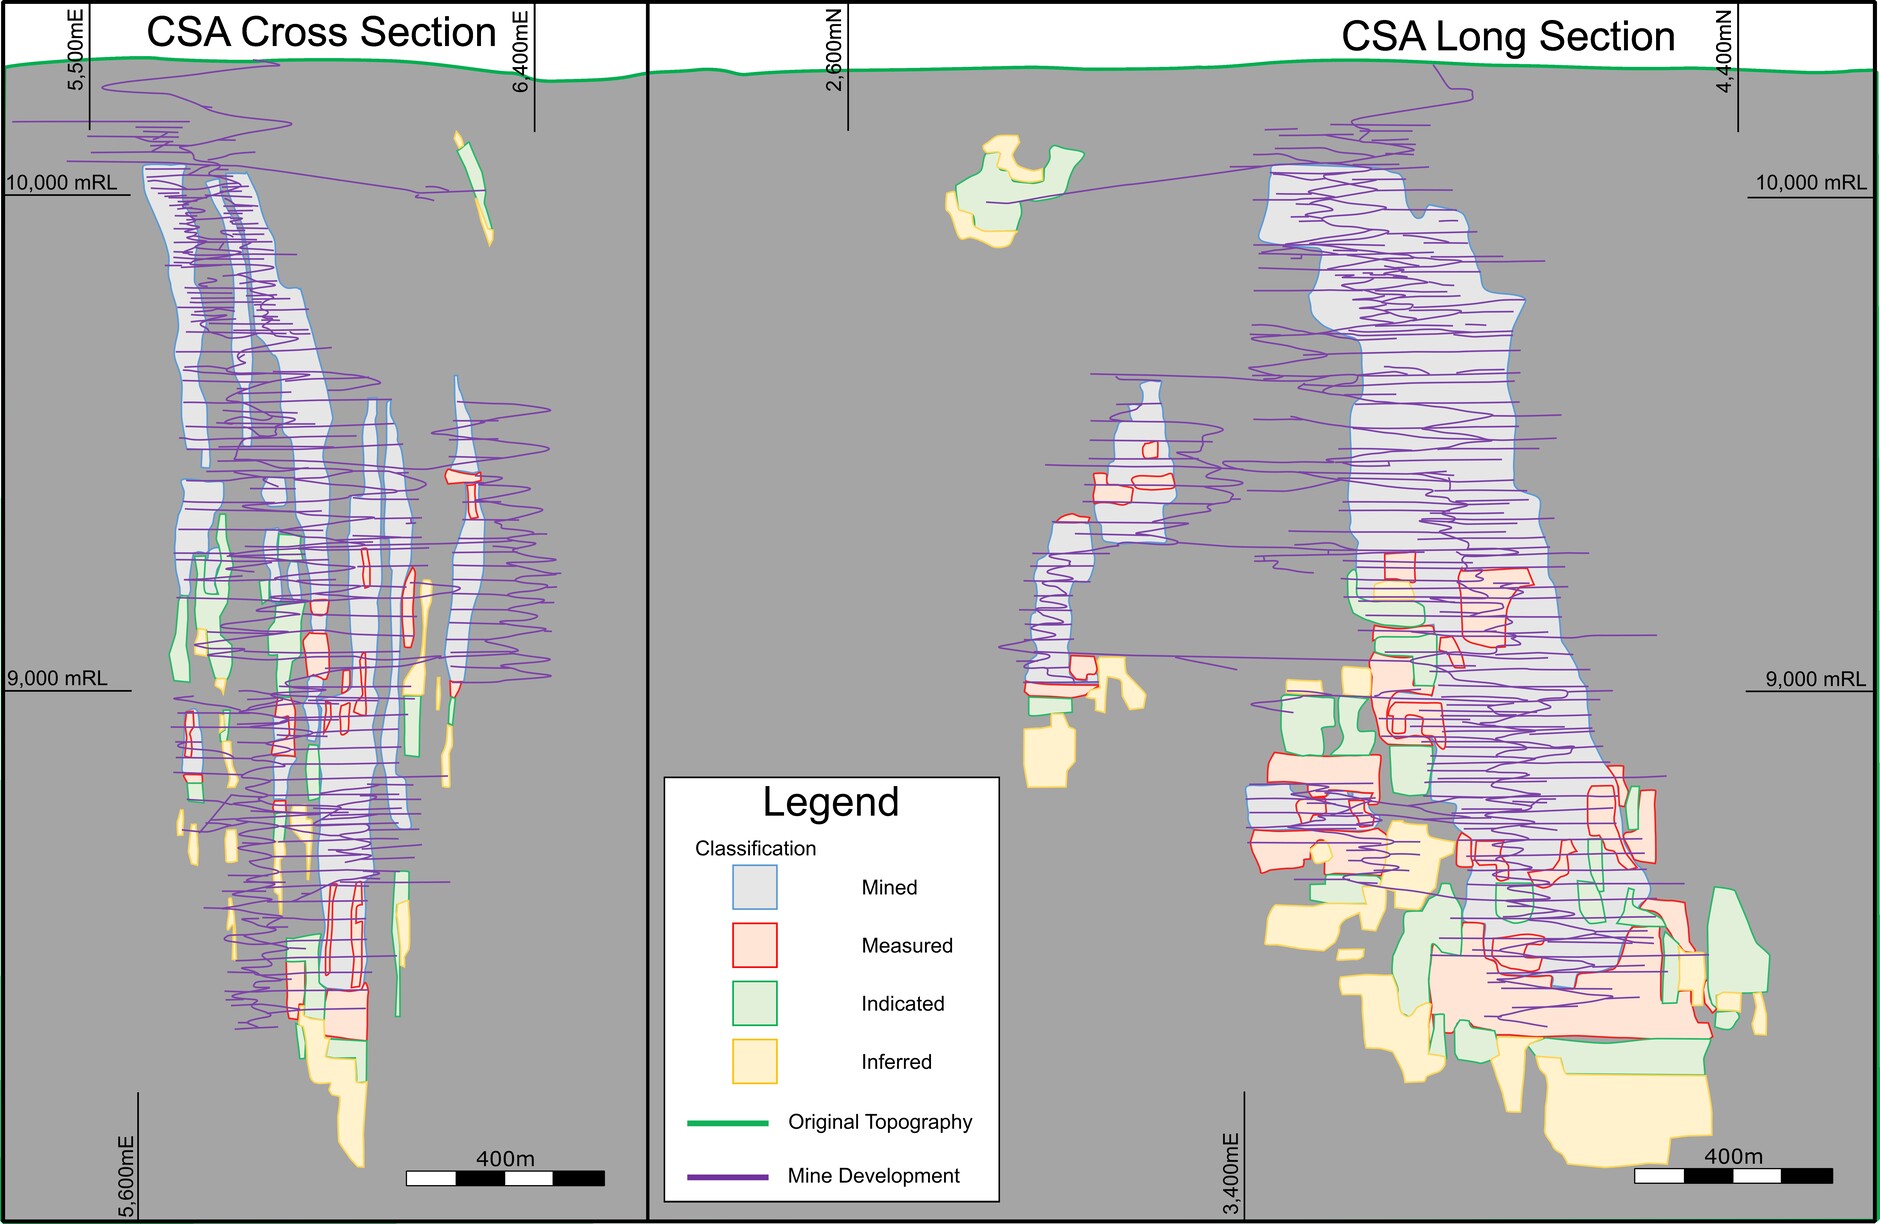
Figure 11-2 Distribution of classified material.
11.13Reasonable Prospects of Economic Extraction
The calculation of the stope break-even cut-off grade used in the assessment of economic viability of Mineral
Resources uses a mining cost of A$109.3/t moved, a processing cost of A$41/t milled, G&A costs of A$49/t
milled.
The Mineral Resource estimate has been reported within a potentially economic mining shape using
commodity price, metallurgical recovery, mining, processing, site general and administrative, treatment and
refining charge, and transport cost assumptions that reflect the QP's assessment of reasonable long-term
expectations. These assumptions were derived from a combination of historical operating performance at
CSA, current operating budgets, recent actual costs, life-of-mine planning assumptions, and prevailing market
conditions at the effective date of the Mineral Resource estimate.
The copper price assumption was selected as a long-term planning price considered reasonable for assessing
reasonable prospects for eventual economic extraction and is consistent with prices commonly adopted by
industry participants for long-life underground copper operations. Cost assumptions were based principally
on recent operating experience at the CSA Mine, adjusted where necessary to reflect anticipated future
operating conditions. The QP considers these assumptions reasonable and appropriate for demonstrating
reasonable prospects for eventual economic extraction.
11.13.1 Commodity Price
The calculation of the stope break even cut-off grade is based on a copper price of US$11,900/tonne. This
price aligns with the price used at CMPL for mine planning and is in line with the Company's long-term, real
copper-price forecast.
The commodity price and cost assumptions are intended to represent long-term planning parameters rather
than spot market conditions and are considered appropriate for Mineral Resource reporting purposes
11.13.2 Depletion
The reported Mineral Resources have been depleted using surveyed wireframe volumes to flag blocks within
each lode system. The QTS North, QTS Central, Eastern and Western block models were depleted with both
3D shapes related to development and depletion strings (“As-builts”). QTS South block model was depleted
with strings only. QTS SU has not been mined, thus has no depletion, and the Merrin mine, where possible,
has been depleted using wireframes, there is still some uncertainty around the historic stopes hence this
Harmony Australasia | CONFIDENTIAL52
Technical Report Summary of the CSA Copper Mine, New South Wales, Australia
orebody is classified as inferred until stop mapping has been completed. The 3D shapes and depletion strings
are supplied by on-site mining engineers. The resultant Mineral Resource is then assessed lens by lens, level
by level, in conjunction with the mining engineers. Non-mineable components are excluded in spreadsheet
format and the final resource tabulated.
11.13.3 Mineral Resource Reporting Cut Off
Interpretation of the high-grade mineralised lodes is consistent with that used historically at CSA (based on
an approximate 2.5% cut-off), which has proven to reconcile well with production. A lower-grade halo is
modelled around the high-grade zones based on an approximate 1.5% Cu cut-off and represents mineralised
material which is included during mine planning.
The Mineral Resource estimate is based on lode definition using geologically defined structures and
application of copper grade constraints in combination with an underground stope mining method
requirement of reasonable prospects of economic extraction.
11.14Mineral Resource Estimate
The Mineral Resource estimate for CSA is reported in accordance with Regulation S-K 1300 and the Mineral
Resources are considered to have reasonable prospects for eventual economic extraction. The Mineral
Resources presented in this section are not Mineral Reserves and do not demonstrate economic viability. The
reported Inferred Mineral Resources are considered too speculative geologically to have the economic
considerations applied to them that would enable them to be categorised as Mineral Reserves. There is no
certainty that all or any part of an Inferred Mineral Resource will be converted to a higher classification or to
a Mineral Reserve.
Mineral Resource classifications were assigned on the basis of geological confidence, drill spacing, data
quality, continuity of mineralisation, estimation performance, and confidence in the grade interpolation.
Measured Mineral Resources are supported by the highest level of confidence in geological continuity and
grade estimation. Indicated Mineral Resources are supported by sufficient confidence in geological
interpretation and estimation to support mine planning, but at a lower level than Measured Mineral
Resources. Inferred Mineral Resources are assigned where geological continuity is reasonably established,
but where additional drilling is required to increase confidence in the estimate. Accordingly, the level of
uncertainty increases from Measured to Indicated to Inferred Mineral Resources.
Mineral Resources are constrained and reported using economic and technical criteria, including geological
and grade-defined thresholds, mineable shapes, and proximity to existing mine infrastructure, such that the
Mineral Resources have reasonable prospects for eventual economic extraction. In the opinion of the QP,
there are no known material technical, environmental, permitting, legal, metallurgical, infrastructure, or
economic factors that would preclude eventual economic extraction of the reported Mineral Resources. Any
remaining uncertainties are typical of an operating underground mining operation and are expected to be
addressed through ongoing drilling, mine planning, and operational activities.
All figures are rounded to reflect the relative accuracy of the estimates and totals may not add correctly.
Mineral Resource estimates exclusive of Mineral Reserves are summarised in Table 11-5 on a 100%
ownership basis. Table 11-6 shows the total Mineral Resource inventory inclusive of all Mineral Reserves for
copper and silver. Table 11-7 shows the total Mineral Resource inventory for zinc. Zinc does not form part of
the Mineral Reserve estimate and is therefore reported only as a Mineral Resource. The effective date of the
Mineral Resource estimate is 30 June 2026.
Table 11-5 Copper and Silver Mineral Resources Exclusive of Mineral Reserves as at 30 June 2026 (Based on a Copper Price
of US$11,900/t at 1.5% Cu Cut-Off Grade)
System | Resource Category | Tonnes Mt | Cu % | Cu Metal Kt | Ag g/t | Ag Metal Moz |
All Systems | Measured | 1.343 | 7.65 | 102.691 | 23.2 | 1.001 |
Indicated | 1.479 | 4.90 | 72.490 | 13.5 | 0.640 | |
Meas + Ind | 2.822 | 6.21 | 175.181 | 18.1 | 1.641 | |
Inferred | 6.173 | 3.76 | 231.942 | 24.0 | 4.767 | |
Total | 8.994 | 4.53 | 407.123 | 22.2 | 6.407 |
Harmony Australasia | CONFIDENTIAL53
Technical Report Summary of the CSA Copper Mine, New South Wales, Australia
Notes:
1.Mineral Resources are reported as at 30 June 2026 and are reported using the definitions in Item 1300 of Regulation S-K (17 CFR Part
229)(S-K 1300)
2.Mineral resources are reported excluding Mineral Reserves
3.Price assumptions used in the estimation include US$11,900/tonne of copper and US$38.9/troy ounce of silver; in line with the Company's
long term forecast copper pricing.
4.Geological mineralisation boundaries defined at a nominal 2.5% Cu cut-off for high grade lenses, and 1.5% Cu for the lower-grade halo.
Resources reported above a 1.5% Cu cut-off grade
5.Cost assumptions underlying cut-off grade calculation include AUD$109.3/t ore mined, AUD$41.2/t ore milled and AUD$48.5/t G&A
6.Metallurgical recovery assumptions used in the estimation were 97.5% copper recovery and 86.7% silver recovery
7.Mineral Resources reported as dry, raw, undiluted, in-situ tonnes
8.Figures are subject to rounding.
Table 11-6 Copper and Silver Mineral Resource Inclusive of Mineral Reserves as at 30 June 2026
System | Resource Category | Tonnes Mt | Cu % | Cu Metal Kt | Ag g/t | Ag Metal Moz |
All Systems | Measured | 11.5 | 5.00 | 575 | 19 | 7.1 |
Indicated | 5.8 | 4.80 | 278 | 17 | 3.1 | |
Meas + Ind | 17.3 | 4.90 | 853 | 18 | 10.2 | |
Inferred | 6.2 | 3.80 | 232 | 23 | 4.5 | |
Total | 23.5 | 4.60 | 1,085 | 19 | 14.7 |
Notes:
1.Mineral Resources are reported as at 30 June 2026 and are reported using the definitions in Item 1300 of Regulation S-K (17 CFR Part
229)(S-K 1300)
2.Mineral resources are here reported inclusive of Mineral Reserves
3.Price assumptions used in the estimation include US$11,900/tonne of copper and US$38.9/troy ounce of silver; in line with the Company's
long-term forecast copper pricing.
4.Geological mineralisation boundaries defined at a nominal 2.5% Cu cut-off for high grade lenses, and 1.5% Cu for the lower-grade halo.
Resources reported above a 1.5% Cu cut-off grade
5.Cost assumptions underlying cut-off grade calculation include AUD$109.3/t ore mined, AUD$41.2/t ore milled and AUD$48.5/t G&A
6.Metallurgical recovery assumptions used in the estimation were 97.5% copper recovery and 86.7% silver recovery
7.Mineral Resources reported as dry, raw, undiluted, in-situ tonnes
8.Figures are subject to rounding.
Table 11-7 Zinc Mineral Resource as at 30 June 2026, Zinc does not inform the Reserve
System | Resource Category | Tonnes Mt | Zn % | Zn Metal Kt |
All Systems | Measured | 0 | 0 | 0 |
Indicated | 0.280 | 3.64 | 10.187 | |
Meas + Ind | 0.280 | 3.64 | 10.187 | |
Inferred | 2.373 | 7.31 | 173.503 | |
Total | 2.652 | 6.93 | 183.690 |
Notes:
1.Mineral Resources are reported as at 30 June 2026 and are reported using the definitions in Item 1300 of Regulation S-K (17 CFR Part
229)(S-K 1300)
2.Mineral resources are here reported inclusive of Mineral Reserves
3.Price assumptions used in the estimation include US$2,646/tonne for zinc and US$2,094/tonne for lead; in line with the Company's long-
term forecast zinc pricing.
4.Geological mineralisation boundaries defined at a nominal 2.0% Zn cut-off for high grade lenses, and 1.5% Zn for the lower-grade halo.
Resources reported above a 1.5% Zn cut-off grade
5.Cost assumptions underlying cut-off grade calculation include AUD$109.3/t ore mined, AUD$41.2/t ore milled and AUD$48.5/t G&A
6.Mineral Resources reported as dry, raw, undiluted, in-situ tonnes
7.Figures are subject to rounding.
11.15Factors that May Affect the Mineral Resource Estimate
Areas of uncertainty that may materially impact the Mineral Resource estimates include:
•Movement in long-term metal price and exchange rate assumptions based on market dynamics
outside the control of the Company
Harmony Australasia | CONFIDENTIAL54
Technical Report Summary of the CSA Copper Mine, New South Wales, Australia
•Changes in the local interpretations of mineralisation geometry may occur as CSA continues to
conduct exploration drilling, based on the results of such drilling; changes could include the presence
of mineralisation extensions, off-shoots, faults, dikes and other structures as well as changes to the
continuity of shear geology, the continuity of mineralised zones and grade continuity assumptions
•Changes to metallurgical recovery assumptions which may be driven by changes in mineralogy or
processing plant operation
•Changes to the grade threshold values applied to the lode definitions
•Changes to environmental, permitting and approvals for the ongoing operation of CSA.
11.16Qualified Person’s Opinion on the Mineral Resource Estimate Process
The QP is of the opinion that the Mineral Resource estimate is well-constrained by three-dimensional
wireframes representing geologically realistic volumes of mineralisation. Exploratory data analysis conducted
on assays and composites shows that the wireframes represent suitable domains for Mineral Resource
estimation. Grade estimation has been performed using an interpolation plan designed to minimise bias in
the estimated grade models.
Mineral Resources are constrained and reported using economic and technical criteria, including geological
and grade-defined thresholds, mineable shapes, and proximity to existing mine infrastructure, such that the
Mineral Resource has reasonable prospects for eventual economic extraction. Resource classifications reflect
the QP's assessment of geological confidence, data quality, drill spacing, continuity of mineralisation and
estimation confidence, with uncertainty increasing from Measured to Indicated to Inferred Mineral
Resources.
In the opinion of the QP, there are no known material technical, environmental, permitting, legal,
metallurgical, infrastructure or economic factors that would preclude eventual economic extraction of the
reported Mineral Resources. Any remaining uncertainties are typical of an operating underground mine and
are expected to be addressed through ongoing drilling, mine planning and operational activities.
12Mineral Reserve Estimate
Section 229.601(b)(96)(iii)(B)(12) (i-vi)
This section contains forward-looking information related to tonnage and grade for the project. The material
factors that could cause actual results to differ materially from the conclusions, estimates, designs, forecasts
or projections in the forward-looking information include any significant differences from one or more of the
material factors or assumptions that are set forth in this sub-section including actual in-situ characteristics
that are different from the samples collected and tested to date, equipment and operational performance
that yield different results from current test work results.
12.1Introduction
CMPL estimates Mineral Reserves annually using the most current Mineral Resource estimate and Void
Model to allow for mining depletion.
The mining method used at CSA is a combination of sublevel long-hole open stoping and Avoca stoping (for
narrow mineralised lenses) with either paste or rock fill (discussed in more detail in Section 13). CSA uses
Deswik® software (stope design and scheduling) for mine planning. The Mineral Reserve is the economically
mineable part of the Measured and/or Indicated Mineral Resource after application of the relevant modifying
factors.
The reference point for the Mineral Reserve estimate is the point of delivery to the processing plant.
The principal parameters used in the Mineral Reserve estimate for stope design and economic evaluation are
as follows:
•cut-off grades were estimated and applied as outlined in Section 12.5
•dilution and recovery factors include allowance for overbreak dilution, fill dilution, and ore losses; the
factors applied are based on historical stope performance and industry norms; waste dilution is
assumed to have zero copper and silver grade
Harmony Australasia | CONFIDENTIAL55
Technical Report Summary of the CSA Copper Mine, New South Wales, Australia
•the Mineral Reserve category is assigned based on contained Measured and Indicated Resource with
Measured Mineral Resource converted to Proven Mineral Reserve, and Indicated Mineral Resource
converted to Probable Mineral Reserve;
•A modifying-factor flag added to the Reserve Estimate block model used for interrogation identifies
any Inferred material as waste for both stopes and development.
•development, which must be mined to access the stopes, is treated as ore if ≥1% Cu.
12.2 Development of the Mining Case
Mineral Reserves are reported within mineable stope shapes designed using Deswik® Mining Stope Optimizer
software (“MSO”). MSO uses an algorithm to generate mineable shapes based on inputs specific to the
geology and mining methods utilised at a specified cut-off grade. Characteristics of material inside the design
wireframes, including tonnes and grades, are considered discretely.
Dilution factors are applied in addition to waste included within the design wireframes. The cut-off grade is
applied following the inclusion of waste dilution factors.
Conversion of Mineral Resource to Mineral Reserve includes the following steps:
•import resource block model
•generate MSO shapes at estimated Reserve Cu cut-off
•remove areas isolated from main operating areas, too close to existing excavations, areas near critical
infrastructure, and stopes with limited strike length
•add pillars as required in areas adjacent to existing excavations to suit backfill type
•design mine development to suit the remaining stopes
•generate altered block models with zero grades for any material other than Measured or Indicated
Resources
•re-evaluate stope and development wireframes using the altered block model
•apply Reserve stoping cut-off grade for Cu after the application of dilution factors in Deswik scheduling
software, and development cutoff grade of 1.00% Cu
•remove areas of the design which are not required for the extraction of Reserve material
•validate scheduled tonnes by comparing to manual batch interrogations against the block models
•validate the Mineral Reserve reported in Deswik.Schedule by using MS Excel to duplicate the
application of modifying factors, cut-off, and classification calculations
•generate a mining schedule
•confirm economics using a discounted cash flow model.
12.3Design Guidelines
CSA uses several variations of long-hole open stoping. The majority of production utilises underhand long-
hole open stoping, augmented by overhand long-hole open stoping and modified Avoca stoping. Ore is
hauled via truck to one of two hoisting shafts, referred to as No. 1 or No. 2 shafts.
There are several production areas as shown in Figure 7-2, each with its own block model. A block model cell size of 5m
x 5m x 10m is used for Mineral Reserve estimation. This block size is considered appropriate for the selectivity and
mining methods used.
12.4Modifying Factors
Modifying factors have been based on the historical stoping performance as captured in the CSA
reconciliation database and considering industry norms. A production reconciliation process is maintained at
CSA, the results of which have been used to analyse stoping performance and to determine usable modifying
factors for the 2026 Mineral Reserve.
During the reserve mine design process, all material within the design wireframes not classified as Measured
or Indicated Mineral Resource is considered to be internal waste or planned dilution. External or unplanned
Harmony Australasia | CONFIDENTIAL56
Technical Report Summary of the CSA Copper Mine, New South Wales, Australia
dilution is applied as a mining dilution factor in addition to the designed or planned dilution. The factor varies
based on mining method, historical performance, and comparable industry values. The external or unplanned
dilution is generally derived from overbreak in the hangingwall/footwall or failed backfill material.
Mining/Reserve recovery is a percentage factor applied to the diluted tonnage and represents ore which
cannot be recovered during mucking. The recovery factor is based on historical performance. Table 12-1
shows the historical actual dilution and recovery factors by stope type over the last three years. The average
sample for each of the stope types is 23 (Avoca), 15 (Longitudinal) and 51 (Transverse) in line with the
previous three years operating actuals.
Table 12-2 showing the factors applied to the Mineral Reserve Estimate, which are based on the P50 of the
three year historical average. It should be noted that historical dilution factors for longitudinal and modified
Avoca stope types are high by industry standards. The tonnes extracted using these stope types over the
previous three years were relatively small, and additional work on improvement methods is included as part
of the FY27 work plan to further extract value from the asset.
Table 12-1 Historical Average Dilution and Recovery Factors
Mining Method | # Stopes | Compliance Design & Mined (%) | Underbreak (%) | Overbreak (%) | Recovery (%) | |
Avoca | Average | 23 | 77% | 21% | 33% | 81% |
P50 | 82% | 15% | 37% | 87% | ||
Longitudinal | Average | 15 | 84% | 13% | 24% | 87% |
P50 | 86% | 13% | 19% | 89% | ||
Transversal | Average | 51 | 87% | 12% | 18% | 89% |
P50 | 89% | 10% | 14% | 90% | ||
Table 12-2 Selected Reserve Stope Factors
Mining Method | Overbreak (%) | Recovery (%) |
Avoca | 35% | 87% |
Longitudinal | 20% | 89% |
Transversal | 15% | 90% |
12.5 Cut-off Grade and Input Assumptions
The cut-off grades were determined based on the economic evaluation of historical cost and performance
data, estimated future operating and capital costs assumptions and global Macroeconomics, including
revenue factors and price assumptions. The cut-off grade is the grade above which the mineable shapes can
be mined profitably and therefore converted to Mineral Reserves.
The cut-off grades were calculated considering the value of the copper with silver value being excluded due
to current streaming arrangements. It is noted that copper represents 97% of the contained value even if Ag
were to be included. There are no other minerals of economic value included in the 2026 Reserve. Cut-off
grades were based on an analysis of 2024 and 2025 historical operating costs, and modelled costs for 2026 to
LOM. The cut-off determination considers a revenue factor of 90% of copper in concentrate at the mine gate,
averaged over the Mineral Reserve life, to account for logistics and realisation costs. For the purposes of cut-
off grade calculation, the revenue factor for silver is 0%, due to a streaming agreement that makes it
cashflow neutral within mine economic assessments and revenue generated.
Three cut-off grades were calculated:
•Development incremental cut-off
•Stoping incremental cut-off
•AISC (All in Sustaining Capital) cut-off
Harmony Australasia | CONFIDENTIAL57
Technical Report Summary of the CSA Copper Mine, New South Wales, Australia
The development incremental cut-off is the calculated grade for development material which is broken
during required development and therefore need only cover the incremental cost of hoisting, processing, and
smelting. Although this worked out to be less than 1.0% Cu, for practical reasons the cut-off was kept at 1.0%
Cu as this was considered to be the minimum grade that could practically be segregated.
The stoping incremental cut-off considers all operating costs except general and administrative and capital
development. A stoping cut-off grade of 2.26% Cu was estimated until the end of FY28, after which point a
stoping cut-off of 1.93% Cu is used. The higher cut-off is applied to manage metal production during a period
of increasing mining rate and lower ore tonnes while the mine is stabilised. The AISC cut-off considers all
operating and capital costs.
The increment cut-offs shown in Table 12-3 were applied to the Mineral Reserve estimate and are based on
the values seen during steady-state operation.
12.5.1Metal Price Assumptions
Price assumptions used in the Mineral Reserve estimate are applied as at 30 June 2026 and are summarised
as follows:
•Copper Price - US$9,900/t (US$4.50/lb) - Company’s internal market-guidance on long-term price
estimate
•Silver Price - US$38.90/oz - the Company’s internal market-guidance on long-term price estimate
•A$/US$ Exchange Rate - 0.68 - Company’s internal market-guidance on long-term exchange estimate
The commodity price applied in the estimation of the CSA Copper Mine Mineral Reserve has been estimated
by Harmony as a business-wide planning input. The reserve copper price of US$4.50/lb (US$9,900/t) is set
through the Company’s internal market-guidance and price-forecasting process and is issued as an approved,
Company-wide planning parameter.
The price reflects Harmony’s own long-term view of the copper market formed by its corporate market-
analysis and economics function and approved by executive management. In forming its long-term price
estimate the Company has had regard to a range of market information, including independent expert long-
term market analysis, current and forward market conditions, and the Company’s assessment of long-run
copper supply and demand fundamentals.
Consistent with a conservative Mineral Reserve basis, the reserve copper long-term cut-off-grade price of
US$4.50/lb is set at the Company’s long-term base-case price.
In support of, and as an independent benchmark for, the Company’s price estimate, Harmony has had regard
to the CRU Copper Long-Term Market Outlook (May 2026), prepared by CRU, an independent expert market-
intelligence provider.
CRU’s analysis identifies a structural, and widening, long-term copper supply gap driven by growth-market
demand (electric vehicles, data centres, renewables, electricity grid and battery storage, and defence), which
CRU expects to lift copper’s long-term incentive price and to structurally establish prices above US$10,000/t.
Harmony’s reserve copper price of US$9,900/t sits approximately 2.7% below CRU’s long-term incentive price
of US$10,174/t and below the US$10,000/t structural level identified by CRU. The Company therefore
considers its reserve price to be a reasonable and appropriately conservative long-term assumption, well
supported by independent market analysis while not relying on broker consensus.
12.5.2Input Parameters
The cost inputs for the June 2026 Mineral Reserve estimate are based on CSA’s internal budgeting process.
With its long operating history, CSA has a thorough understanding of the mining, processing, G&A, and other
costs associated with the operation. A discount rate of 7% has been applied for NPV calculations in line with
Harmony estimation for Australian assets.
Key input parameters used in the calculation of cut-off grades used for the estimation of Mineral Reserves
are summarised in Table 12-3
Table 12-3 Summary of Mineral Reserve Input Parameters
Parameter | Unit | Value |
Copper Price | US$/t Cu | 9,900 |
Harmony Australasia | CONFIDENTIAL58
Technical Report Summary of the CSA Copper Mine, New South Wales, Australia
Copper Revenue Factor | % | 90 |
Copper Recovery | % | 97.5 |
Silver Price | US$/oz | 38.9 |
Silver Revenue Factor | % | 0% |
Silver Recovery | % | 86.7 |
Mining Cost (excl. Capex) | AUD$/t mined | 118.0 |
Processing Cost | AUD$/t milled | 44.0 |
G&A Costs | AUD$/t milled | 49.0 |
Incremental Development Cut Off | % Cu | 1.0 |
Incremental Stoping Cut Off | % Cu | 1.93 |
AISC Cut Off | % Cu | 2.26 |
*Revenue factor accounts for all costs from mine gate (incl. freight, realisation charges and offtake costs)
**Resource price tests the longer-term prospects for eventual economic extraction and is set at the Company's long-term forecast
guidance price, whereas the Reserve price is deliberately set below it to provide a conservative basis on which economically mineable
material is declared, consistent with S-K 1300.
12.5.3Metallurgical Recoveries
Ore has been processed at an onsite conventional flotation concentrator since circa 1965. This produces a
concentrate which is sent off-site for smelting and refining to produce copper cathode.
The metallurgical performance of the CSA plant is well understood and has generally remained stable over
the past 5 years. Copper recovery to concentrates from 2019 to 2025 averaged 97.5%. Recovery of silver, the
only by-product, averages about 86.7%. Concentrate Cu grades averaged 26.1% Cu and contains
approximately 80g/t Ag.
Copper processing recoveries at the CSA concentrator are expected to average 97.5% over the life of the
Mineral Reserve. Silver recoveries are forecast at 86.7% over the same period.
12.6Mineral Reserve Schedule
The modifying factors as outlined have been applied to the available Mineral Resources and schedule then
subject to an economic assessment. The results of the developed Reserve schedule forming the basis of the
Reserve estimate are shown in Table 12-4.
Table 12-4 Reserve Schedule Summary
CSA Mine | ||
Total | ||
Total Material Mined | kt | 23408 |
Ore Mined | kt | 17691 |
Waste Mined | kt | 5716 |
Total Material Milled | kt | 17691 |
Feed Grade Cu | % | 3.26 |
Feed Grade Ag | g/t | 12.3 |
Contained Copper Tonnes | kt | 577 |
Cu Produced | kt | 562 |
Ag Produced | koz | 6079 |
Revenue | AUD$M | 8135 |
Total Direct Costs | AUD$M | -4422 |
Mining Costs | AUD$M | -2771 |
Processing Costs | AUD$M | -776 |
General Administration | AUD$M | -874 |
Total Direct Costs (Net Mine Development) | AUD$M | -3956 |
Indirect Costs (Royalties, Freight, tax other than income) | AUD$M | -610 |
Harmony Australasia | CONFIDENTIAL59
Technical Report Summary of the CSA Copper Mine, New South Wales, Australia
Total Capital | AUD$M | -1132 |
Mine Cashflow | AUD$M | 2437 |
Owners costs (inc Streams) | AUD$M | -716 |
Undiscounted Mine Cashflow | AUD$M | 1720 |
Undiscounted Post Tax Mine Cashflow | AUD$M | 1324 |
NPV (7%) After Tax | AUD$M | 704 |
12.7Key Modifying Factors
A summary of the key modifying factors as presented in Table 12-5. Assumptions are based on well-
understood historical mine performance and budget level scheduling and costing assumptions.
Table 12-5 Key Modifying Factors
Modifying Factor | Principal Assumption | Confidence |
Mining dilution (based on stope type) | 15-30% | High |
Mining recovery (based on stope type) | 87-90% | High |
Processing recovery | 97.50% | High |
Copper price | US$9,900/t | Medium |
Operating cost | A$224/t Milled (LOM) | High |
12.8Mineral Reserve Estimate
The Mineral Reserve estimate for CSA is reported here in accordance with the SEC S-K 1300 regulations and is
considered to be the economically mineable component of CSA’s Measured and Indicated Mineral Resources.
The reported Inferred Mineral Resources are considered too speculative geologically to have the economic
considerations applied to them that would enable them to be categorised as Mineral Reserves. All figures are
rounded to reflect the relative accuracy of the estimates and totals may not add due to this rounding. CSA
Mineral Reserves are summarised in Table 12-6, on a 100% ownership basis, and have an effective date of 30
June 2026.
Table 12-6 Copper Mineral Reserves as at 30 June 2026
Total Reserve – CSA | |||
Copper | |||
Tonnes | Cu | Cont. Cu | |
[Mt] | [%] | [kt] | |
Total Mineral Reserve | 17.691 | 3.26 | 576.868 |
Proved Mineral Reserve | 12.531 | 3.27 | 410.303 |
Probable Mineral Reserve | 5.161 | 3.23 | 166.565 |
Notes:
•Mineral Reserves are reported as at 30 June 2026 and are reported using the definitions in Item 1300 of Regulation S-K (17 CFR Part
229)(S-K 1300)
•Price assumptions used in the estimation include US$9,900/tonne (US$4.50/lb) of copper and US$38.9/troy ounce of silver; Company’s
internal market-guidance on long-term price estimate as at 30 June 2026
•The Cu Mineral Reserve tonnes using a Stope cut-off grade of 2.26% Cu for 2026 to 2028, a stope cut-off grade of 1.93% for the
remaining periods and a Development breakeven cut-off grade of 1.0% Cu
•Cost assumptions underlying cut-off grade calculation include AUD$109.3/t ore mined, AUD$41.2/t ore milled and AUD$48.5/t G&A
•Metallurgical recovery assumptions used in the estimation were 97.5% copper recovery and 86.7% silver recovery
•Figures are subject to rounding to reflect the accuracy of the estimate.
12.8.1Reserve Reconciliation
A reconciliation to the previously reported Mineral Reserve is presented in Table 12-7 and graphically in
Figure 12-1. Resource conversion from ongoing infill and exploration drilling has seen additional Reserve
stopes replace the depletion quantities.
Harmony Australasia | CONFIDENTIAL60
Technical Report Summary of the CSA Copper Mine, New South Wales, Australia
Table 12-7 Reserve Reconciliation
Total Reserve – CSA Operation | |||
Copper | |||
Tonnes | Cu | Cont. Cu | |
[Mt] | [%] | [kt] | |
Previously Reported | 15.9 | 3.4 | 545 |
New Figures | 17.7 | 3.26 | 577 |
Variance | 1.8 | -0.1 | 32 |
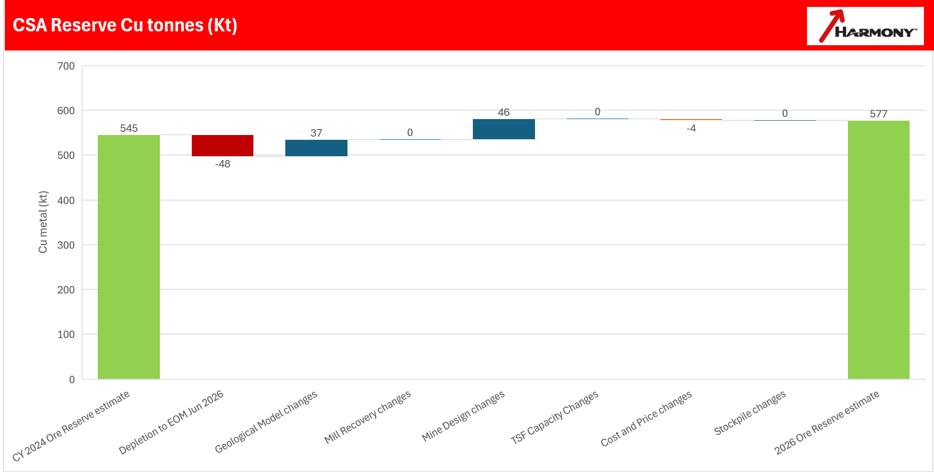
Figure 12-1 Reserve Reconciliation
12.9Factors that may affect the Mineral Reserve Estimate
With 50+ years of operating history and a detailed understanding of these factors, the QP considers that
essential controls are in place for CSA to effectively manage these factors, minimising the risk of significant
impact on the Mineral Reserve estimate.
In the QP’s opinion, the following factors may affect the Mineral Reserve estimates, including:
Metal Prices: the Mineral Reserve estimates are most sensitive to copper prices
Metallurgical Recovery: changes in metallurgical recovery for copper could have an impact on the Mineral
Reserve estimates.
Changes in Operating Costs: operating costs that are higher or lower than those assumed in the estimation
process could affect the Mineral Reserve estimates. Inflationary pressures within Australia could increase
operating costs over the life of mine leading to a reduced Mineral Reserve estimate (assuming other
assumptions such as copper price remained unchanged). Conversely, any reduction in operating costs could
lead to improved economic conditions and an increase in the mineral reserve estimate.
Increased Dilution and Ore Loss: dilution and ore loss form key components of the modifying factors used in
the determination of Mineral Reserves. Any unforeseen geotechnical issues could lead to additional dilution,
difficulty accessing portions of the orebody, or sterilisation of ore. CSA conducts continuous geotechnical
drilling and has extensive knowledge of the geotechnical conditions of the mine, both of which are taken into
consideration during mine design in order to effectively mitigate geotechnical risks. Preliminary designed
underground stopes have been evaluated for stability in several geotechnical studies and are regularly
evaluated by the engineering group at the mine.
Harmony Australasia | CONFIDENTIAL61
Technical Report Summary of the CSA Copper Mine, New South Wales, Australia
Permitting and Approvals: any inability to maintain, renew, or obtain environmental and other regulatory
permits, to retain mineral rights, extend tailings storage capacity or continue safe mining operations could
have a negative influence on Mineral Reserve estimates.
In-Mine Exploration Potential: as per requirements under Subpart 1300 of Regulation S-K (17 CFR Part 229),
the CSA estimated Mineral Reserve is limited to Measured and Indicated resource material only, that also
satisfies the Mineral Reserve economic criteria and modifying factors. However, due to the steeply dipping
nature of the mineralised lenses, detailed drilling (sufficient to classify the material as a Measured or
Indicated resource) is limited in depth extent to 100-200m below the nearest suitable underground
development horizon. Deeper drilling has commenced via an extensive surface drilling programme to confirm
that there is continuity of the mineralised lenses in depth. As the drill density at depth currently is only
sufficient to classify this material as Inferred, at best, it cannot be included in the Mineral Reserves.
In the QP’s opinion, the estimated Mineral Reserve thus represents a comparatively conservative guide to the
future mining potential.
12.10Qualified Person’s Opinion on the Mineral Reserve Estimation Process
The QP considers that the Mineral Reserve estimate for CSA mine and presented in this report is an
appropriate estimation of the diluted, in-situ, and economically viable Mineral Reserve based on the latest
Measured and Indicated Resource data available, and has been prepared using logical and industry standard
accepted practices conforming to the requirements of Regulation S-K. The QP is of the opinion that the
Resource block models used to determine the appropriate Reserve mine design provide a reasonable guide
to the in-situ mineralisation, and that the historically based modifying factors are consistent with actual
mining and processing experience at CSA. The LOM forecasts based on the Mineral Reserves are considered
to provide a conservative estimate of the likely life of mine, given the historical experience of regular reserve
replacement and the known down-dip extensions of the mineralised lodes.
External audits are regularly carried out on operations as a part of Harmony's annual audit rotation. CSA has
been added to the audit rotation with the CSA Mineral Resources and Mineral Reserves being audited by
Derisk in 2026 as part of the reporting cycle.
There were no material issues noted as a conclusion of the Audit review process.
13Mining Methods
Section 229.601(b)(96)(iii)(B)(13) (i-v)
13.1Introduction
CSA is an established underground mine which has been operating for +50 years using similar mining and
processing methods as those which are used in the operation today. CSA extracts approximately 1.1-1.4Mtpa
of copper ore each year from five en-echelon steeply dipping orebodies, with current mining focused on the
QTSN, QTSC and Western systems, with QTSN and QTSC supplying the bulk of the ore and representing 80%
of the contained copper in the current Mineral Reserves.
The mine uses mechanised long-hole open stoping (LHOS) with cemented paste fill (CPF) as the preferred
mining method. A modified Avoca stoping method has historically been used successfully in the narrower
lenses (principally QTSC, Eastern and Western). QTSC and Eastern orebodies have transitioned to LHOS with
CPF (driven by the introduction of paste reticulation to these areas), whilst a new temporary rib pillar mining
method (utilising wireless blasting) will be utilised in the Western orebody. The future dominance of the
QTSN orebody, representing approximately 66% of the currently estimated Mineral Reserve, creates some
concentration risk. Mineral Resources in the other orebodies and remnant areas of the mine create
contingent ore sources. One of the critical aspects to achieving production objectives is prioritising and
increasing the mine development, ventilation capacity in the lower mine levels and access to additional
drilling and extraction horizons.
Figure 13-1 shows a schematic diagram of a typical long-hole open stope that has been partially extracted
before filling, together with a general arrangement of long-hole open stopes on three levels that are in the
process of being extracted (brown coloured stopes) and then backfilled (white coloured stopes) with
cemented paste fill supplied from a surface borehole. Long-hole open stoping has been used extensively over
the life of CSA, and is mechanised, cost-effective, and well suited to the geometry and operating conditions in
the QTSN, QTSC and Eastern systems.
Harmony Australasia | CONFIDENTIAL62
Technical Report Summary of the CSA Copper Mine, New South Wales, Australia
In QTSN, sub-level intervals are 30m apart above 8580mRL, approximately 1,620m below surface (“mbs”).
Below 8580mRL, the sub-level interval was increased to 40m, leading to some negative impacts with
increased ground failures and higher levels of overbreak and stope dilution; sub-level intervals have more
recently been reduced to 35m. Stope dimensions are typically 20m long by 25m wide. Mining is non-entry
and ground support is employed to control dilution and overbreak prior to the placement of backfill and to
support extraction development.
Figure 13-2 shows a schematic cross section through a modified Avoca stoping sequence. This method is used
in narrower orebodies such as the Western lodes and relies on backfilling with waste rock to provide support
as the ore is progressively blasted and removed from the stope. While the Avoca method has proven an
effective mining method at CSA, benefiting from having a degree of passive wall support from the waste rock
(long-hole open stopes have to be completely extracted before filling can commence), the Avoca stopes can
suffer from higher ore losses, increased waste dilution, and backfilled waste rehandling.
The level interval in QTSC is a combination of 25m and 30m intervals, whilst the Western and Eastern systems
both use 30m intervals. Orebody widths for the three systems are between 6-10m. In the modified Avoca
method, mining begins in the central area of the ore zone and progresses towards both ends of the ore
drives. The stopes are drilled with either upholes or downholes. A slot is established to create the initial void
for subsequent stope firing. The rings are then fired in slices to a stope length as allowed by the stability
assessment and then bogged clean. The empty stope is then filled with waste rock from the upper sub-level.
The filled stope is then mucked out to a natural angle of repose and subsequent rings are blasted to a free
face.
The QTSC orebody is split into two zones, QTSC Lower and QTSC Upper. QTSC Lower extraction is based on
25m level intervals utilising blind uphole stoping with cemented pastefill. QTSC Upper extraction utilises 30m
level intervals, utilising a mix of uphole and downhole stoping, with a mix of pastefill and rockfill.
Harmony Australasia | CONFIDENTIAL63
Technical Report Summary of the CSA Copper Mine, New South Wales, Australia
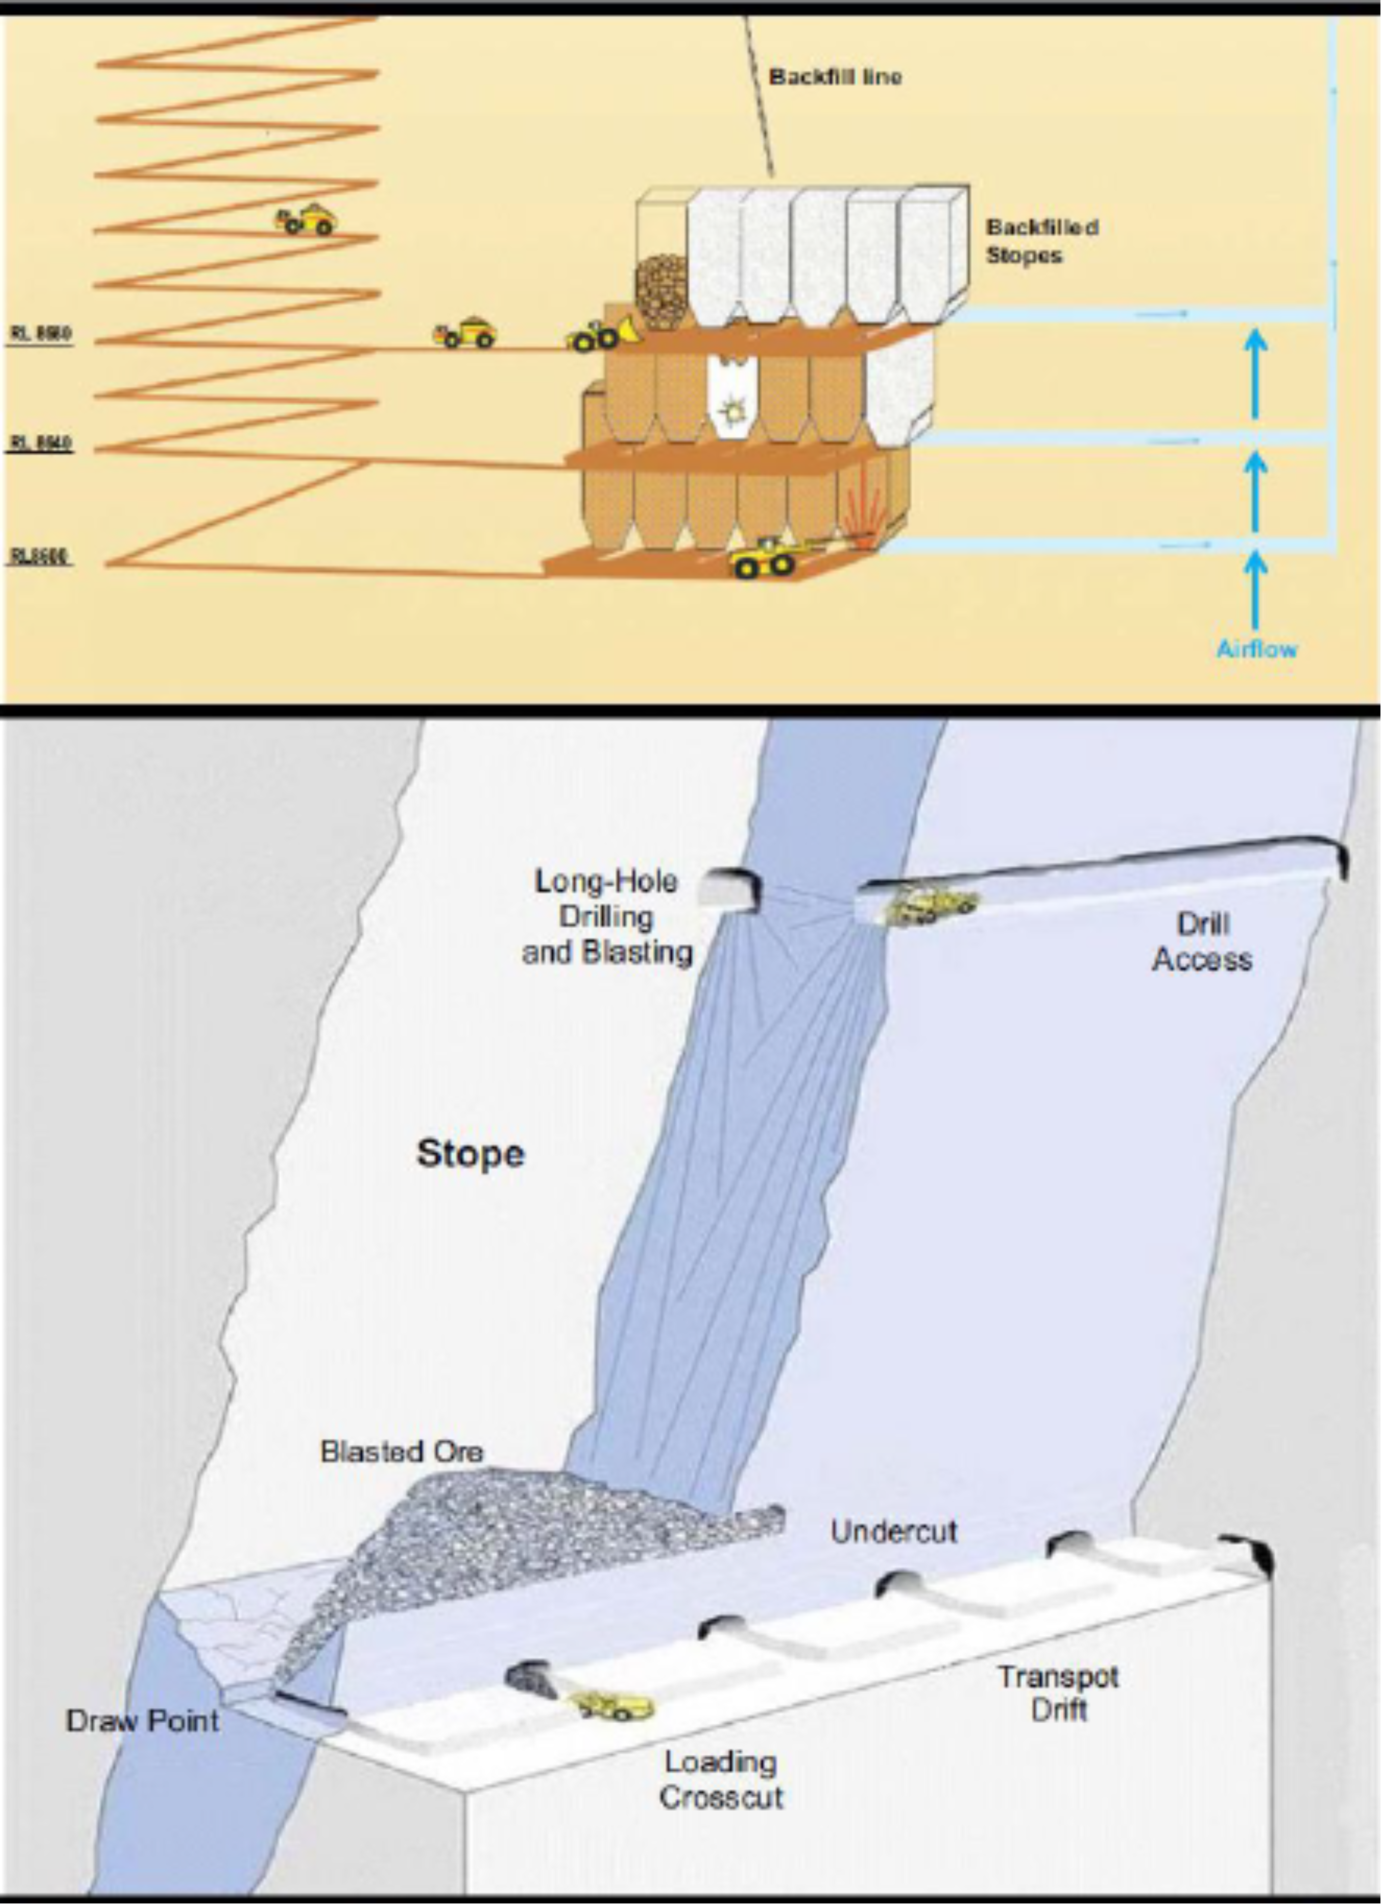
Figure 13-1 Schematic – Long Hole Open Stoping Mining Method
Harmony Australasia | CONFIDENTIAL64
Technical Report Summary of the CSA Copper Mine, New South Wales, Australia
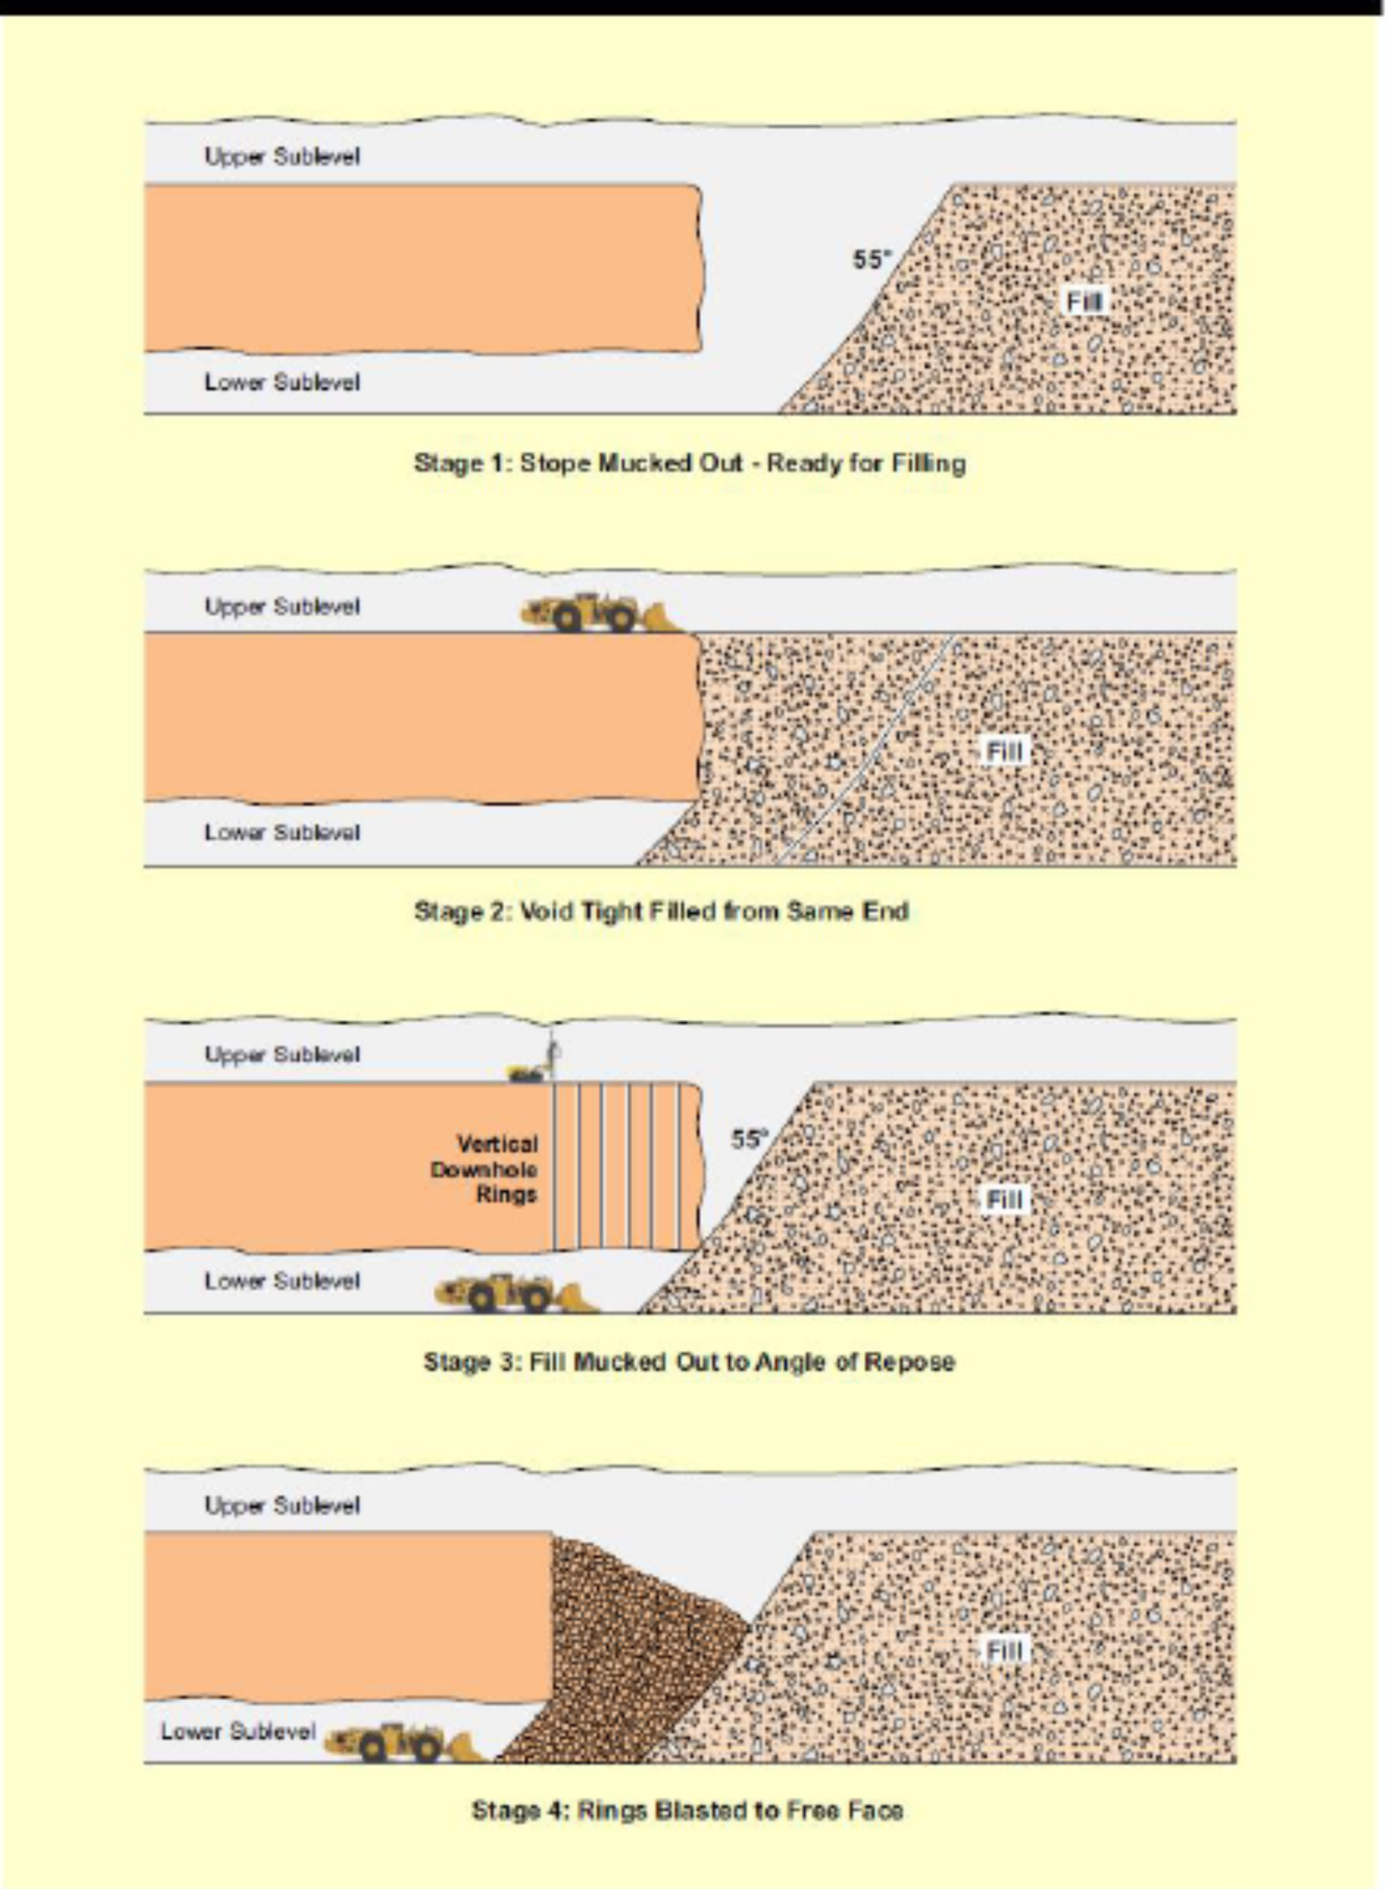
Figure 13-2 Schematic – Avoca Mining Method
Diesel load-haul-dump (“LHD”) units load broken ore from the stopes into diesel-operated trucks. The ore is
hauled from the stopes for up to 7-8km to the underground crushers located at the base of the two hoisting
shafts. Truck haulage distances to the underground crushers will increase as stoping gets deeper, adding to
truck cycle times, requiring more trucks, and adding to the ventilation requirements, all of which is
considered during the mine planning processes. Improving average payloads across the operation, along with
improved utilisation and cycle-time could assist in partially offsetting the increased haul distances at depth.
From the underground crusher, ore is hoisted to surface in the two hoisting shafts:
•No. 1 shaft hoists from 10 level (895m underground) to surface, has a capacity of 700kt per annum
(“ktpa”) and is used for ore and waste hoisting only; No. 1 shaft has previously been upgraded with a
new headframe and double-drum winder
•No. 2 shaft hoists from 9 level (810m underground) to surface, has a capacity of 1.5Mtpa and is used
for both men and material hoisting and ore hoisting; No. 2 shaft has previously been upgraded with a
new Koepe winder and control system.
The Reserve LOM extends a further 6 levels (6 x 35m) from the current deepest levels of stoping. The recent
upgrades in ventilation and cooling along with the new fleet and further planned ventilation upgrades will be
sufficient to mine the mine plan presented in this report.
Harmony Australasia | CONFIDENTIAL65
Technical Report Summary of the CSA Copper Mine, New South Wales, Australia
13.2Blasting
All stope blasting is conducted with emulsion or Ammonia Nitrate/Fuel Oil (“ANFO”) explosives, in 102mm
blast holes. For the main ore lenses, a raise bore slot is developed to create an opening from a crosscut drive
at the top of a stope, down to a strike drive on the extraction (bottom) level. The slot is opened in two shots.
The remainder of the stope is then drilled and fired as a number of rings that are fired into the void created
by the slot. Smaller lenses would generally be extracted in a similar manner, except that a longhole rise
pattern of drill holes may be used to create the slot rather than a raise bore.
13.3Geotechnical Parameters
13.3.1Overview
The CSA Copper Mine has more than sixty years of continuous underground operating history and one of the
most extensive geotechnical datasets of any operating base-metal mine in the Cobar Basin. The current
geotechnical understanding is documented in the site's Principal Hazard Management Plan for Ground or
Strata Failure and Subsidence (CSA-PHMP-1004, Revision 9, February 2026), which is the master reference
document for ground control at CSA and forms the technical basis for the geotechnical inputs to the Mineral
Reserve estimate.
CSA is an inherently anisotropic mining environment. Ore and waste are hosted in the Silurian-age CSA
Siltstone – a steeply dipping, thinly bedded turbiditic sequence with a pervasive north–south trending, sub-
vertical foliation. Rock mass behaviour is dominated by the interaction between this strong bedding/foliation
fabric, the local shear architecture, and the in-situ and mining-induced stress field. The rock mass is ductile
rather than brittle, dissipating stored energy through progressive buckling and shear along foliation planes
rather than through violent seismic release.
Active production is currently distributed across five ore systems (QTSN, QTSC, Eastern, Western and the
shallow QTSSU deposit brought online in 2026), with the base of QTSN production at approximately 1,850 m
below surface at the effective date of this report. The Life-of-Asset (LOA) drilling programme is now targeting
mineralised continuity beyond 2,000 m below surface, and the geotechnical management strategy has been
updated in 2025–2026 to reflect the transition into a genuinely deep mining environment.
The QP considers that CSA has the data, technical resources, monitoring systems, engineered controls and
governance frameworks required to manage ground control risk to a level consistent with the Modifying
Factors applied to the Mineral Reserve estimate reported in Section 12.
13.3.2Rock Mass Characterisation and Intact Rock Properties
The host rock mass at CSA comprises predominantly steeply-dipping, thinly bedded siltstone (SEDS) with
bedding striking north-northwest and dipping approximately 80° west. A parallel axial-planar cleavage (S2)
provides the dominant mechanical anisotropy. Alteration intensity increases towards mineralised shears,
with chlorite-altered sediments (CAS), silicified/quartz-altered sediments (SAS), and localised talc alteration
presenting the weakest and most anisotropic material behaviour. Lithological codes used in the CSA block
model are based on the intensity and type of alteration.
Prior to 2025, the site rock property database contained only approximately 90 legacy laboratory tests dating
from 1969 to 2019, none of which were taken from below 8990 mRL or from active stoping horizons. As a
result, a design uniaxial compressive strength (UCS) of approximately 120 MPa was historically adopted for all
unmineralised rock. A targeted rock property testing campaign completed in 2025 (UCS, Brazilian and Point
Load testing) has materially changed this understanding. The 2025 testing confirmed that whilst the
mineralised siltstone and quartz-veined sandstones are competent (UCS typically 140–200 MPa), the chlorite-
altered and shear-hosted rock types are significantly weaker, with point-load-derived UCS-equivalents
commonly in the range 20–60 MPa. Where samples are cut parallel to foliation, the intact strength can be
reduced by an anisotropy factor of up to 5. These revised strength values, held in the Master Lab Testing
Database, are now used to calibrate the LOA numerical model and to inform ground support and stope
stability design.
Rock mass classification at CSA uses the Barton Q-System. Based on the site-wide core logging review
completed in 2023 and updated with the 2024 transition to automated photo-logging (Datarock), the
sediments typically classify at the 50th percentile at Q′ ≈ 12, degrading to Q′ ≈ 0.2 at the 10th percentile in
shear-affected ground. The dominant control on Q at CSA is RQD, and RQD values are known to be sensitive
to bedding spacing, drill hole orientation, alteration intensity, drilling practice (pre-2016 holes drilled without
Harmony Australasia | CONFIDENTIAL66
Technical Report Summary of the CSA Copper Mine, New South Wales, Australia
triple-tube barrels) and logger subjectivity – all of which are considered when interpreting rock mass data for
design.
An Excavation Support Ratio (ESR) of 1.3 is adopted for lateral development supported with friction bolts and
for vertical shaft development, and 1.6 for lateral development supported with solid bar. A minimum overall
factor of safety (FoS) of 1.5 is required for the installed ground support system, with a first-pass turnout
design FoS of 1.3 excluding primary support, per memorandum GTM25-01 Ground Support Standards Review
& Update.
13.3.3In-Situ Stress Regime
The CSA in-situ stress regime has been the subject of numerous investigations since the 1970s. A
comprehensive re-evaluation was completed in 2024–2025 as part of the LOA numerical modelling
programme, driven by the observation that historical stress regimes were unable to reproduce observed
underground damage patterns in the lower mine. Two independent lines of evidence were brought together
in this work:
•A holistic review by Max Lee (mid-2024) which incorporated CSA's historical measurements together
with more reliable HI-cell measurements from the nearby Endeavour Mine, which shares comparable
geological and structural setting.
•A Seismic Moment Tensor Inversion (SMTI) analysis carried out in late 2024 on lower QTSN seismic
events south of 8465 mRL, which indicated that the major principal stress dips approximately 30° to
the east at depth.
The revised stress model is consistent with the observations of Kynes (2014) that the foliation dip direction
rotates from east to west somewhere between approximately 9200 mRL and 9000 mRL. Because principal
stress at CSA is broadly perpendicular to foliation, this rotation of foliation drives a corresponding rotation of
the stress tensor at depth. CSA now formally adopts two stress regimes:
Upper Stress Regime (above 9000 mRL)
Applicable to QTSSU, Merrin and remnant workings in the upper mine. Sigma-1 dips shallowly to the west
(10°/271°), sub-normal to the foliation-hosted lodes. Sigma-2 dips shallowly to the south and Sigma-3 is
largely sub-vertical. The upper stress regime is shown in Table 13-1
Table 13-1 Upper Stress regime
Principal Stress | Magnitude | Orientation (Dip/Direction) | Comments |
Sigma 1 | 0.058·D MPa | 10° / 271° | Shallow westerly, sub-normal to foliation |
Sigma 2 | 0.035·D MPa | 03° / 181° | Shallow southerly (can switch with Sigma 3) |
Sigma 3 | 0.021·D MPa | 80° / 028° | Largely sub-vertical |
Vertical | 0.027·D MPa | – | Assumes rock density SG 2.7 |
Lower Stress Regime (below 9000 mRL)
Applicable to all current mining below 9L (Eastern, Western, QTSC and QTSN). Confirmed by the 2024 SMTI
analysis and by the LOA FLAC model calibration completed by Cavroc in early 2025, where this regime best
reproduced observed damage. Sigma-1 dips shallowly east, Sigma-2 is horizontal to the south and Sigma-3
dips steeply west. The lower stress regime is shown in Table 13-2
Table 13-2 Lower Stress regime
Principal Stress | Magnitude | Orientation (Dip/Direction) | Comments |
Sigma 1 | 0.052·D MPa | 30° / 110° | Shallow dipping to the east |
Sigma 2 | 0.031·D MPa | 0° / 200° | Horizontal to the south |
Sigma 3 | 0.018·D MPa | 60° / 290° | Steeply to the west |
Vertical | 0.027·D MPa | – | Assumes rock density SG 2.7 |
Harmony Australasia | CONFIDENTIAL67
Technical Report Summary of the CSA Copper Mine, New South Wales, Australia
At the current deepest active mining horizon of approximately 1,850 m below surface, the estimated Sigma-1
magnitude is approximately 96 MPa. Extrapolated to the final Reserve mining depth of approximately 1,980
m below surface, Sigma-1 is expected to reach approximately 103 MPa. At 8205 mRL (~2,200 m below
surface), which lies within the Inferred LOA extension and beyond the current Reserve boundary, Sigma-1 is
projected to approach 115 MPa. The stress regime will continue to be verified through cleavage compass
readings, targeted in-situ stress measurements, and annual re-calibration of the LOA numerical model.
13.3.4Rock Mass Damage Modes and Mining Implications
The typical stress path for perimeter development at CSA (for example a footwall drive) begins with high
concentrations of the major horizontal stress in the excavation back and floor. As the abutment of the
advancing stoping front approaches, shear stress around the excavation rotates and increases, inducing shear
and tensile failure along bedding in the sidewalls and corners. This mining-induced stress path drives the four
dominant damage modes observed at CSA:
•Squeezing, buckling and wall convergence – strongest where development is aligned within 25° of the
foliation strike, where the stress-to-strength ratio exceeds 40–70%, or in altered/foliated rock. Off-
setting development to more than 25° from foliation strike is now specified by design under
GTM25-01 as the primary mitigation. Bearings between 330° and 020° are to be avoided in
development below 8700 mRL.
•Floor heave – increasingly frequent below 8610 mRL, and observed as floor and back stripping in the
QTSN southern footwall drives at 8500 mRL and 8395 mRL, cracking of the 8480 pump station slab and
vent shaft collars, and buckling of rigid vent walls. Standard practice is to bolt walls below gradeline
and to delay fibrecrete spraying to the walls until broken material has been mucked out.
•Brow failures – increasingly problematic as stress rises with depth, particularly at east-west oriented
brows where the geometry aligns unfavourably with the principal stress and with the weaker east-
west walls. Recent examples include drawpoint failures up to 10 m along development in QTSN.
Mitigation now includes designed brow cabling in accordance with GTM24-12 Intersection Support
Standards Review & Update R1, and a shift towards remote bogging where required.
•Stope overbreak – dominant on east and west stope exposures across all mining zones due to the
bedding orientation and east-west principal stress. West wall overbreak in QTSN stopes was the
subject of a dedicated 2025 back-analysis (GTM25-02) which confirmed that the empirical Mathews
stability chart does not adequately capture buckling as the dominant failure mode at CSA.
Beyond these four dominant modes, historic issues at CSA (kinematic wedge failure, strainburst/fault-slip
seismicity, and water-driven corrosion) have been assessed and are considered low residual risks. There have
been no confirmed cases of ground support damage caused by strainburst or seismic shakedown at CSA.
Deep-seated failures in the backs (greater than 2 m) are rare, with only two documented cases since 2015,
both in localised shear zones.
13.3.5Mining Method, Stope Geometry and Extraction Sequence
The mining methods and stope geometries applied at CSA have been progressively adapted to the changing
stress regime with depth. Long-hole open stoping with cemented paste backfill (CPB) is the dominant method
in the primary orebodies. A modified Avoca method is used in narrower lenses in the Western system, and
remote-detonation "reverse firings" using the WebGen system are now used for lenses less than 8 m wide,
allowing the slot to be positioned at the front of the stope and eliminating the need for personnel to work
adjacent to open stope voids. Cemented Hydraulic Fill (CHF) was retired in 2019 following commissioning of
the new paste plant; CPB is now the primary backfill material in all four active copper systems.
Sublevel spacing shown in Table 13-3 in the primary QTSN orebody has been progressively refined as stress
conditions have evolved with depth:
Harmony Australasia | CONFIDENTIAL68
Technical Report Summary of the CSA Copper Mine, New South Wales, Australia
Table 13-3 Sublevel Spacing
Elevation Zone | Sublevel Spacing | Rationale |
Above 8580 mRL | 30 m | Original design, performing well historically |
8580 – 8500 mRL | 40 m | Trialled to reduce development metres but produced excessive overbreak and stope dilution |
Below 8500 mRL | 35 m | Optimised in 2025 to balance stress management and productivity |
The most significant change to the QTSN extraction sequence is the transition to a top-down, centre-out
chevron sequence, recommended by numerical modelling and formally adopted in the 2026 mine plan. In
plan view, extraction begins at the central eastern stopes and progresses north and south. Extraction of the
first stope immediately to the west is only taken once a two-stope lag has been established. Primary–
secondary sequences are explicitly avoided, and lead–lag distances between adjacent lenses are maintained
to prevent problematic production drilling and excessive stress damage to strike development. The QTSC
extraction has similarly been reconfigured to a longitudinal retreat sequence following operational difficulties
encountered when attempting to mine towards a central closure pillar.
Backfilling practice supports the sequence: stopes are backfilled as soon as practicable, generally to maintain
a 45-degree mining front. Interim crown pillars are designed to a minimum width-to-height ratio of 1.0,
validated by the 2024 QTSN 8465 J2-412 extensometer campaign (GTM24-04) and by the 2025 back-analysis
of 17 QTSN interim crown pillars (GTM25-06).
13.3.6 Support Design and Standards
The CSA Minimum Ground Support Standards are the key engineering control for maintaining excavation
stability. The standards are designed to cover at least 95% of expected ground conditions and account for
natural rock mass variability, changing stress fields, and material and installation quality. The current
standards were formally re-issued under memoranda GTM25-01 Ground Support Standards Review &
Update and GTM24-12 Intersection Support Standards Review & Update R1, and are supported by CSA-MIN-
STD-2001 Ground Support Specification.
Key design principles adopted for the current Reserve LOM are:
•All development requires surface support to a maximum height of 2 m from floor.
•Fibrecrete is always overlain with weld mesh; unmeshed fibrecrete is only used where short design life
or misfire risk is present.
•Development face meshing (0.9 m friction bolts and mesh) has been mandatory across all faces since
2024.
•Friction bolts are permitted only where stress, convergence and corrosion risks are low; yielding bolts
(mechanically anchored bolts or grouted cables) are required in moderate-to-high convergence areas.
Stiff resin bolts are avoided.
•Wall cables are installed with a minimum three-cut delay to allow relaxation.
•Wide spans (>6.5 m) must be cable-supported using twin-strand grouted bulbed cables of minimum 6
m length with a minimum 1 m embedment, unless assessed under the wide-span assessment form.
•Galvanised support components are required to manage corrosion risk in areas of localised water
ingress.
•Where practicable, all development below 8700 mRL is offset more than 25° from the foliation strike;
bearings between 330° and 020° are avoided.
Ground support installation is subject to a formal Quality Assurance / Quality Control (QAQC) programme
managed by the site geotechnical engineers. Friction bolt pull-testing is conducted at a minimum rate of 1%
of all bolts installed, with jumbo operators installing pull-test rings every cut. Fibrecrete UCS testing targets
32 MPa at 28 days with a slump of 240 mm ± 10 mm. Cable grout targets 32 MPa at 28 days. Paste backfill
UCS is tested for every stope pour. A monthly geotechnical QAQC compliance report is issued site-wide.
Harmony Australasia | CONFIDENTIAL69
Technical Report Summary of the CSA Copper Mine, New South Wales, Australia
13.3.7Monitoring, Numerical Modelling and Instrumentation
CSA operates a multi-layered geotechnical monitoring programme comprising routine inspections, void
monitoring (CMS, LiDAR and CALS), damage mapping (S0–S5 scale), blast vibration monitoring by Orica,
ground instrumentation (MPX and digital extensometers, Thingwave instrumented bolts, sloughmeters and
bucket extensometers), and seismic monitoring. Photographic records, drone surveys and biannual survey-
prism monitoring of the Mt Brown surface subsidence zone complete the monitoring suite.
The IMS seismic monitoring system currently comprises seven geophones split across QTSC and QTSN, with
the deepest sensor at 8470 mRL. Recognising that production is now at 8395 mRL and continuing to deepen,
a seismic system upgrade was initiated in late 2025 and will add a further six sensors, split across lower QTSN
and QTSC, to improve event location accuracy and capture smaller magnitude events at depth. Events are
visualised live via the Ticker software and are monitored by Pitram and by the geotechnical engineers.
Monthly IMS reports summarise activity, blast response and system health. No separate seismic system is
required at QTSSU due to the shallow mining depth.
Numerical modelling has been substantially upgraded during 2025. An updated LOA FLAC model was
developed with Cavroc and delivered in early 2025, calibrated against damage mapping and stope overbreak
reconciliation using the revised lower stress regime and the 2025 rock property test results. The model is
refreshed annually as sequence, geometry, structural data and rock property information are updated. In
addition, RS2 2D plastic analysis is used for pillar and isolated-stope assessment, and Cavroc-supported back-
analysis work commenced in 2025 to develop raise-specific plastic modelling techniques. Independent raise-
scan validation has demonstrated good alignment with early model predictions.
13.3.8 Seismic Hazard Assessment
The seismic hazard at CSA is currently assessed as low. The site has not experienced any seismic events that
have caused notable damage to ground support or excavations. The primary seismic source mechanism at
CSA is intact rock fracturing rather than fault-slip. This is a direct consequence of the ductile, anisotropic
siltstone host rock and the presence of wide, foliated shear zones which dissipate stored strain energy
through progressive buckling and shearing along foliation planes rather than through sudden brittle release.
Whilst the frequency of seismic events increases with depth, event magnitudes have remained below
damaging thresholds. The current ground support regime is considered adequate for events below
approximately 1 ML. A formal review of ground support dynamic capacity and exclusion zone requirements
will be triggered by any of the following: (a) an upward trend in seismically induced damage to rock or ground
support; (b) numerical modelling forecasts of damaging seismic hazards; or (c) a sustained seismic hazard
above 1.2 ML, whether or not damage is observed. The Seismic Activity TARP (TAR-004, updated 2025)
prescribes operational responses based on event magnitude and proximity to accessible development.
13.3.9Deepening of the Mine and Forward Management Strategy
The management of increasing mining depth is the central geotechnical challenge over the Reserve LOM and
beyond. Current active production is at approximately 1,850 m below surface, the Reserve LOM extends to
approximately 1,980 m below surface, and the LOA drilling programme is targeting mineralisation continuity
beyond 2,000 m below surface, with the current deepest QTSN intercept at approximately 8,050 mRL (2,200
m below surface). The increase in depth introduces higher in-situ stress, higher rock temperature, longer
travel and haulage times, and greater ventilation and cooling demand. Whilst none of these are new
challenges for CSA, the pace at which they compound with depth requires a coordinated technical
management strategy. The site's forward strategy for managing depth is built around six pillars, each of
which is captured in the FY26 PHMP and reflected in the FY27 LOM plan:
•Improved characterisation of the rock mass. The 2025 rock property test campaign has replaced the
historical 120 MPa design assumption with a lithology-differentiated strength model. Additional
testing is planned in 2026, with a specific focus on chlorite-altered sediments where point-load-
derived strengths remain the primary data source.
•Adoption of dual stress regimes. The formal separation of upper (>9000 mRL) and lower (<9000 mRL)
stress regimes, validated by the 2024 SMTI and the 2025 Cavroc LOA FLAC model, provides the correct
stress boundary condition for design and back-analysis. Additional in-situ stress measurements will be
conducted as new deep development is established, with the intent of confirming the stress
magnitudes and orientations projected beyond current mining.
Harmony Australasia | CONFIDENTIAL70
Technical Report Summary of the CSA Copper Mine, New South Wales, Australia
•Optimised stope geometry and extraction sequence. The transition to 35 m sublevel spacing below
8500 mRL in QTSN, together with the QTSN top-down centre-out chevron sequence and the QTSC
longitudinal retreat sequence, are the principal design-level responses to the higher stress
environment at depth.
•Yielding ground support and rehabilitation planning. The current ground support standards specifically
deploy yielding elements (mechanically anchored bolts, grouted cables, mesh-covered fibrecrete,
cable-supported wide spans and brows) in areas of moderate-to-high convergence. Rehabilitation
frequency and scope are actively planned through the Geotechnical Rehab Register and the workplan
register, using damage mapping (S0–S5) and LiDAR-based convergence monitoring.
•Enhanced monitoring at depth. The 2025 seismic system upgrade extends microseismic coverage into
the lower QTSN and QTSC production areas. LiDAR-based convergence monitoring has replaced
convergence pins as the primary quantitative deformation monitoring tool, and Thingwave
instrumented bolts are now used routinely at critical excavations.
•Integration with mine-wide capital works. The ventilation and cooling upgrades captured in the Capital
Ventilation Project (CVP, Section 15.2), the paste reticulation extensions supporting cemented paste
backfill in QTSC and Eastern, and the WebGen remote-detonation programme for narrow lenses in the
Western system are all mine-wide capital investments that materially reduce residual geotechnical risk
over the Reserve LOM.
13.3.10 Governance, Assurance and Change Control
Geotechnical risk management is governed by CSA-PHMP-1004 (Revision 9, February 2026), which sits within
CSA's Safety Management System and complies with the NSW Work Health and Safety (Mines and Petroleum
Sites) Regulation 2022 (in particular Sections 47, 49, 55 and Schedule 1 Part 1). The PHMP is supported by the
site Risk Management Procedure (CSA-HSET-MP-1065), aligned to AS/NZS ISO 31000:2018.
The PHMP is internally reviewed annually and externally audited every three years. The most recent third-
party review was conducted by Professor Ernesto Villaescusa (Chair of Mining Rock Mechanics, Western
Australian School of Mines) in June 2023. Following the acquisition of CMPL by HMY in October 2025, the site
is progressively aligning ground control governance with the Harmony Group technical standards, and CSA
will be added to the Harmony Group Independent Technical Review Board (ITRB) cycle. The next external
PHMP audit is scheduled for 2026.
Seven Critical Control Verifications (CC1–CC7) are audited monthly by the geotechnical team: design for safe
remote bogging; ground support installation in active areas; barricading of unsupported ground; the formal
design process for mining excavations; seismic and instrumentation monitoring; installation of "No
Travelling" signage; and periodic geotechnical inspections. Any significant change to ground support
standards, components or practices is managed under the Management of Change procedure (CSA-HSET-
PRO-356).
13.3.11 Qualified Person's Opinion on Ground Conditions
The QP is of the opinion that the ground conditions at CSA are well understood, well characterised and
appropriately managed. The rock mass is inherently ductile, the seismic hazard is currently low, and the site's
technical response to increasing mining depth – encompassing refreshed rock property testing, dual stress
regimes, revised sublevel spacing, chevron sequencing, yielding ground support, expanded microseismic
coverage, and calibrated numerical modelling – is consistent with contemporary best practice for deep
underground base-metal mines.
The residual geotechnical risks over the Reserve LOM are considered manageable within CSA's existing
technical, monitoring and governance systems. The QP does not consider that any current geotechnical issue
would prevent achievement of the mine plan on which the Mineral Reserve declared in Section 12 is based,
provided that the FY26 PHMP is implemented as documented, the seismic system upgrade is delivered as
scheduled, and the QTSSU-specific surface monitoring programme is maintained through the mining of that
orebody.
13.4Backfill
The principal mining method, long-hole open stoping, requires cemented backfill to fill the stopes post
mining and prior to extracting adjacent stopes. Strength requirements are generally achieved by addition of
up to 3% Portland cement by weight, giving a fill strength of 4 MPa; selected areas such as crown pillar
Harmony Australasia | CONFIDENTIAL71
Technical Report Summary of the CSA Copper Mine, New South Wales, Australia
extractions may require stronger cemented fill of around 1 MPa, achieved with cement addition rates of
about 6%. Isolated stopes are filled with un-cemented bulk fill only, using development waste.
In certain locations cemented rock fill (“CRF”) is used; CRF is a blend of development waste rock, Portland
cement, and water, which is mixed in a dedicated mixing bay mined on each level where required. The CRF is
placed into the stope before filling with uncemented rock fill.
Paste Fill
The paste fill plant was built in 2018 by Quattro Project Engineering (“QPE”) and was initially operated on a
hire basis before the plant was purchased by CMPL in 2020. Paste fill is obtained by removal of water from
the full tailings stream through vacuum filters at the paste fill plant to produce filter cake and adding cement
as required. The paste fill plant runs as required when fill is required to fill stopes; at other times process
tailings are dewatered and stockpiled adjacent to the plant for future use. On average, 45% of the process
tailings are used as paste fill, with the remaining 55% pumped directly to the STSF. An ongoing improvement
process is underway that may result in reduction of cement usage, or use of alternative slag and lime blends
to reduce cement usage.
Paste Fill Reticulation
•The paste fill is delivered from surface to 9430RL underground via a single 835m long borehole with an
outer 250mm casing and inner replaceable casing of 110mm diameter.
•The underground reticulation system comprises steel pipe rated to 10MPa. These lines connect with
inter-level boreholes, three of which are cased with steel pipe; the remainder are unlined drill holes.
The reticulation system is currently around 1,850m in total length. An expansion of the reticulation
network has been completed to the southern section of QTSN at depth, into QTSC and Eastern.
•The elevation difference from the surface plant to the underground delivery points poses a risk of
over-pressurisation of the reticulation system, with potential for bursts, blockages, and hazards to
personnel. Consequently, a key facet of the system is automated control including pressure sensors.
The single delivery borehole poses some reliability risk and may warrant consideration of establishing
a second hole. CMPL considers blockages and pipe damage to be the main risks for the paste fill
system and has increased borehole monitoring and maintenance and is considering the potential
duplication of the delivery line to provide some redundancy to its operation.
Filling Status
•All modern allocated stope voids in the active mining areas have been successfully filled. There is
however some uncertainty regarding the extent of stope voids remaining in the old mining areas in
the upper levels of the mine, a major consideration for any plans to mine the remnant resources in the
upper levels. (No material from these areas is included in this Mineral Reserve estimate.)
13.5Hydrogeological Parameters
There is minimal ground water inflow into the mine and this condition is not expected to change with depth.
Groundwater has little impact on the geotechnical conditions in the mine and there is minimal need for mine
dewatering.
13.6Other Mine Design and Plan Parameters
For additional parameters used in CSA’s mine design and planning process such as orebody-specific design
guidelines, mining dilution and ore loss, reference should be made to Section 12 Mineral Reserve Estimate,
including Section 12.3 Design Guidelines and Section 12.4 Modifying Factors.
13.7Mine Schedule
As part of the Mineral Reserve estimation process, CSA establishes a detailed schedule of mining physicals in
which Mineral Reserves are mined, transported, hoisted, processed and sold as final concentrate product.
Scheduling of mining stopes is developed using Deswik Scheduler software which combines both automated
and manual scheduling processes to ensure that a practical, productive and profitable mining sequence
occurs. Iterative schedule smoothing is often required in order to deliver consistent ore tonnes and grade to
the processing plant whilst managing mobile fleet availability and maintenance outages across fixed and
mobile assets.
Harmony Australasia | CONFIDENTIAL72
Technical Report Summary of the CSA Copper Mine, New South Wales, Australia
CSA underground mining production is the primary driver to annual concentrate sales, due to the excess
capacity available in downstream infrastructure. With approximately 2.3Mtpa material hoisting capacity in
the shafts and 1.4Mtpa concentrate processing capacity in the processing plant, CSA scheduling is mining-
centred and is currently planned at 1.1-1.5Mt of ore per annum (1.1-1.5Mtpa) for the Reserve estimation
process.
Recovery assumptions used in the mine scheduling process are 97.5% for copper and 86.7% for silver.
Table 13-4 summarises key physicals for the CSA Reserve schedule, including ore/waste tonnes, grade,
recoveries and concentrate production.
Harmony Australasia | CONFIDENTIAL73
Technical Report Summary of the CSA Copper Mine, New
South Wales, Australia
Table 13-4 CSA Mine – Mineral Reserve Production Schedule
CSA Mine | FY27 LOM PLAN | ||||||||||||||||
2027 | 2028 | 2029 | 2030 | 2031 | 2032 | 2033 | 2034 | 2035 | 2036 | 2037 | 2038 | 2039 | 2040 | 2041 | Total | ||
Total Material Mined | kt | 1247 | 1466 | 1790 | 1718 | 1675 | 1609 | 1612 | 1589 | 1755 | 1980 | 1861 | 1671 | 1661 | 1215 | 558 | 23,408 |
Ore Mined | kt | 848 | 926 | 1133 | 1129 | 1155 | 1171 | 1285 | 1322 | 1302 | 1483 | 1454 | 1440 | 1395 | 1131 | 518 | 17,691 |
Waste Mined | kt | 399 | 540 | 658 | 589 | 520 | 439 | 327 | 267 | 453 | 497 | 407 | 231 | 265 | 84 | 40 | 5,716 |
Total Development Metres | m | 4051 | 7060 | 7032 | 5917 | 5761 | 5956 | 4496 | 4144 | 3633 | 5480 | 4542 | 2399 | 1985 | 868 | 824 | 64,148 |
Capital | m | 2942 | 4352 | 4154 | 3293 | 3146 | 2118 | 1481 | 734 | 566 | 930 | 516 | 392 | 140 | 0 | 50 | 24,815 |
Operating | m | 1037 | 2104 | 2483 | 2241 | 2261 | 3448 | 2651 | 3015 | 2193 | 3040 | 2289 | 1440 | 1079 | 451 | 578 | 30,311 |
Rehab | m | 72 | 604 | 395 | 383 | 354 | 390 | 364 | 394 | 874 | 1510 | 1737 | 566 | 766 | 417 | 196 | 9,023 |
Total Material Milled | kt | 848 | 926 | 1133 | 1129 | 1155 | 1171 | 1285 | 1322 | 1302 | 1483 | 1454 | 1440 | 1395 | 1131 | 518 | 17,691 |
Feed Grade Cu | % | 3.65 | 3.53 | 3.40 | 3.46 | 3.64 | 3.56 | 3.28 | 3.33 | 3.48 | 3.03 | 3.02 | 2.92 | 2.91 | 2.96 | 2.97 | 3.26 |
Feed Grade Ag | g/t | 15.5 | 14.7 | 13.5 | 12.8 | 15.4 | 15 | 12.7 | 11.9 | 12.1 | 9.5 | 10.3 | 10.3 | 10.8 | 11.4 | 12.2 | 12 |
Contained Copper Tonnes | kt | 31 | 32.7 | 38.5 | 39 | 42 | 41.7 | 42.1 | 44 | 45.3 | 45 | 44 | 42.1 | 40.6 | 33.5 | 15.4 | 577 |
Recovery Cu | % | 0.977 | 0.975 | 0.977 | 0.975 | 0.975 | 0.975 | 0.975 | 0.975 | 0.975 | 0.975 | 0.975 | 0.975 | 0.975 | 0.975 | 0.975 | 0.98 |
Recovery Ag | % | 0.869 | 0.868 | 0.869 | 0.868 | 0.868 | 0.868 | 0.868 | 0.868 | 0.868 | 0.868 | 0.868 | 0.868 | 0.868 | 0.868 | 0.868 | 0.87 |
Concentrate Produced | kdmt | 115 | 131 | 154 | 149 | 161 | 159 | 161 | 168 | 173 | 172 | 168 | 161 | 155 | 128 | 59 | 2,216 |
Cu Produced | kt | 30 | 32 | 38 | 38 | 41 | 41 | 41 | 43 | 44 | 44 | 43 | 41 | 40 | 33 | 15 | 562 |
Ag Produced | koz | 367 | 380 | 429 | 405 | 497 | 490 | 456 | 437 | 438 | 394 | 417 | 413 | 420 | 359 | 176 | 6,079 |
Harmony Australasia | CONFIDENTIAL74
Technical Report Summary of the CSA Copper Mine, New South Wales, Australia
13.8Mining Fleet Requirements
The existing underground mining fleet is industry standard, as summarised in the Table 13-5 below. Battery
electric LHDs and trucks are being trialled at CSA and are reported to demonstrate good productivity over a
6-7-hour period, requiring 2-3 hours to recharge.
Table 13-5 Primary CSA Underground Mining Equipment
Resource | Model | Units |
Hauling Trucks | TH663i | 10 |
Hauling Trucks | AD30 | 2 |
Loaders | LH517 | 6 |
Loaders | LH621 | 2 |
Simba | E70s | 2 |
Jumbo | DD421 | 5 |
Cable Bolter | DS421 | 2 |
Charge-up Rig | M360S | 1 |
Elphinstone Agitator | WR810 | 3 |
Normet Spraymec | SF050d | 2 |
IT Volvo | 90L | 2 |
IT Volvo | 120L | 4 |
Cat 938 | IT | 2 |
Cat 12H | grader | 3 |
Elphinstone Water Truck | WR810 | 2 |
Fuel Truck | 1 | |
Service Truck | 2 | |
LV | Toyota | 49 |
Harmony Australasia | CONFIDENTIAL75
Technical Report Summary of the CSA Copper Mine, New South Wales, Australia
13.8.1Equipment Productivity and Usage
Equipment performance differs between the fixed and mobile plant with availability and utilisation being
reported as shown in Table 13-6 for the 2025 calendar year. Maintenance of fixed and mobile equipment is
higher than benchmark due to the age of some of the equipment. Replacement strategies have been
implemented and are included in the capital allocations of the project.
Table 13-6 Plant and Equipment Availability and Utilisation
Equipment | Development Drills | Production Drills | Loaders | Trucks | Hoist | Mill/Plant |
Availability | 78% | 83% | 73% | 82% | 78% | 82% |
UoA | 36% | 28% | 47% | 48% | 45% | 80% |
Productivity | 130m/day | 510m/day | 1200t/day | 400t/day | 217t/ophr | 126t/ophr |
Note: UoA = Utilisation of Availability, ophr = Operating hour
A capital works programme of upgrading the ageing mobile equipment fleet is ongoing and should improve
availability. Issues affecting the utilisation of equipment include operator shortages, work site availability,
downtime due to shift changes, refuelling and tramming time to the work site and less than optimal planning.
Mitigation and improvement strategies are underway to improve the low utilisation of plant.
13.9Mine Personnel Requirements
Mining department headcount for FY27 is estimated at a total of 502 full time employees. The organisational
structure is reasonably typical, split into Production, Development, Services, Mobile Maintenance, and
Technical Services. Each department is the responsibility of a Superintendent who reports to the Mining
Manager. A combination of FIFO, DIDO and residential roles are utilised to maintain an appropriate level of
staffing and skill within the workforce.
The LOM remains at a steady state, with similar levels to be maintained for the remainder of the Reserve life of mine.
13.10Mine Map
Figure 13-3 shows a long section of the underground working illustrating the Final Mining Outline.
Harmony Australasia | CONFIDENTIAL76
Technical Report Summary of the CSA Copper Mine, New South Wales, Australia
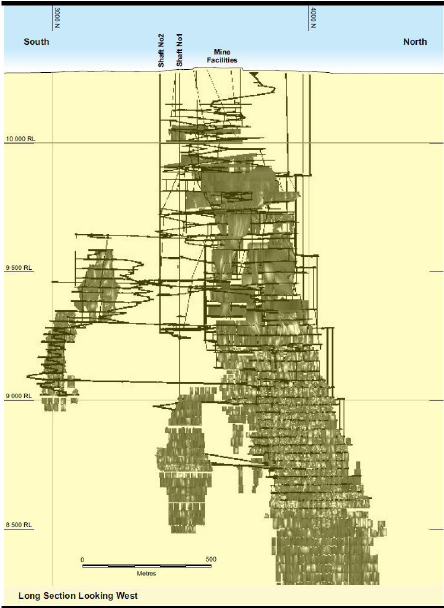
Figure 13-3 Mine Layout – Long Section
13.11Qualified Person’s Opinion on the Mining Method
The QP considers the application of both longhole open stoping and Avoca stoping to the various lodes at
CSA appropriate. Longhole open stoping with cemented paste fill is preferred in the deeper areas of the mine
where geotechnical conditions can be more challenging. Lessons have been learned with stope orientation
and ground control practices in recent years that are providing a beneficial input for the mine design,
especially for the lower mine levels.
The QP notes that most of the Mineral Reserve is located in and around the existing mine environment with a
commitment to return to an echelon extraction sequence to reduce ground stress. This should reduce both
risk and cost, and take some pressure off mining exclusively in the lower levels of the mine.
14Processing and Recovery Methods
Section 229.601(b)(96)(iii)(B)(14) (i-iv)
Harmony Australasia | CONFIDENTIAL77
Technical Report Summary of the CSA Copper Mine, New South Wales, Australia
14.1Introduction
The current CSA processing plant has been operating since 1967. It has operated well over the years and
metallurgical performance has been very good with copper recovery to flotation concentrate of around
97%-98%, producing concentrates averaging 26-27% Cu.
Design concentrator throughput is 1.4Mtpa, with design copper production of around 35-45ktpa.
Concentrator throughput is limited by ore availability linked to production capacity from underground. In
recent years this has averaged around 1.1Mtpa to 1.3Mtpa. With improvements in mining area availability,
ventilation upgrades and location, the Reserve plan estimates production at 1.1-1.4Mtpa over the course of
the Reserve life of mine. Mill production history is shown in Table 14-1.
Table 14-1 CSA Mill Production History
Description | Unit | FY24 | FY25 | FY26 |
Ore Milled | kt | 1,061 | 1,018 | 791 |
Milled Grade | % Cu | 3.67 | 4.01 | 3.71 |
Contained Copper | kt | 39.1 | 39.7 | 28.8 |
Copper Concentrate Tonnes | kt | 144 | 146 | 100 |
Copper Concentrate Grade | % Cu | 26 | 26 | 26 |
Copper Recovery to Conc. | % Cu | 98 | 98 | 98 |
Cu Production | kt | 38.2 | 38.9 | 26.5 |
Ag Production | koz | 372 | 440 | 327 |
14.2Comminution
Primary Crushing
Underground ore is crushed underground to a nominal size passing 250mm using two 1,500mm (60 inch) by
1,200mm (48 inch) jaw crushers, located at the base of Shafts 1 and 2 (Levels 9 and 10). The crushed ore is
hoisted to surface and conveyed to one of four 7,000t crushed ore bins on surface (Figure 14-1). Ore from
these bins is conveyed via apron feeders to the SAG mills at the concentrator.
14.2.1Concentrator Operations
The concentrator flowsheet Figure 14-1 comprises:
Two Metso 6.6m by 2.1m semi-autogenous grinding (SAG) mills with 1.6MW motors installed in 2022 and
2023, replacing two 900kW Hardinge Cascade SAG mills which had been operating for over 50-years. The
Metso mills are used for primary grinding. The secondary ball mill is a Hardinge Cascade grinding mill, 6.6m
by 2.1m, with a 1.1MW motor which was installed in the 1980s. The two SAG mills operate in either closed
circuit or open circuit with the secondary ball mill operating in closed circuit. There is flexibility to arrange the
three mills in different circuit configurations.
The ground product from the SAG mills passes via a series of hydrocyclones to the ball mill, with the oversize
returning to the SAG mills. The ground product from the ball mills also passes through a bank of
hydrocyclones to provide a particle size distribution of 80% passing 106 micron (“P80=106µm”) which is sent
to the copper flotation circuit; oversize material is returned to the ball mill.
The flotation circuit has a number of circuit options, but effectively the circuit comprises rougher copper
flotation followed by a scavenger recovery circuit. Scavenger concentrates are recycled to the rougher feed
while rougher concentrates are fed to a cleaner circuit. The cleaner circuit is made up of cleaners followed by
recleaners (Jameson cells). Cleaner tailings are returned to the scavenger circuit; scavenger tailings are
discarded as final tailings. The recleaner concentrates are sent as final concentrates.
Recleaner concentrates are first thickened and then filtered in two plate and frame filters. Final filter cake
moisture is about 9.5%. The concentrates are stored in two 12 kt capacity concentrate storage sheds awaiting
loading into containers and rail transport to the Port of Newcastle for export.
Tailings underflow from the tailings thickener, is either pumped to the paste fill plant and sent underground
to fill mining voids or pumped to the tailings storage facility (TSF).
Harmony Australasia | CONFIDENTIAL78
Technical Report Summary of the CSA Copper Mine, New South Wales, Australia
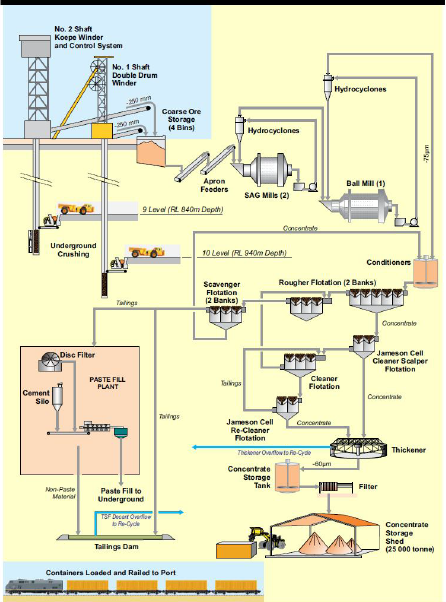
Figure 14-1 Process Plant Flowsheet
The metallurgical performance of the CSA plant is very good. Copper recovery to concentrates from 2018 to
2025 averaged 98%. Recovery of silver, the only by-product, averages about 86.7%. Concentrate Cu grades
average about 26.1% Cu and about 80g/t Ag.
Plant operating time during 2025 was quite variable and utilisation was comparatively low; primarily related
to ore feed supply from underground which is currently constrained by ventilation supply. Data for calendar
year 2025 is summarised in Table 14-2.
Harmony Australasia | CONFIDENTIAL79
Technical Report Summary of the CSA Copper Mine, New South Wales, Australia
Table 14-2 CSA Concentrator Performance January to December 2025
Item | Units | Jan | Feb | Mar | Apr | May | Jun | Jul | Aug | Sep | Oct | Nov | Dec | Total |
Mill throu ghpu t | kt | 90.7 | 62.6 | 87.4 | 80.3 | 78.3 | 95.7 | 117.6 | 101.3 | 81.4 | 79.8 | 91 | 95.2 | 1,061.5 |
Avail | % | 0.95 | 0.78 | 0.96 | 0.94 | 0.98 | 0.88 | 0.97 | 0.99 | 1 | 0.88 | 0.99 | 0.99 | 0.94 |
Util | % | 0.44 | 0.47 | 0.64 | 0.56 | 0.47 | 0.7 | 0.65 | 0.42 | 0.57 | 0.44 | 0.57 | 0.27 | 0.52 |
Run Time | hrs | 1165 | 1081 | 1618 | 1431 | 1235 | 1607 | 1652 | 1142 | 1491 | 1076 | 1392 | 789 | 15680 |
Over all Util | % | 0.42 | 0.49 | 0.64 | 0.44 | 0.24 | 0.84 | 0.83 | 0.68 | 0.55 | 0.48 | 0.59 | 0.55 | 0.59 |
CSA has completed the replacement of two Semi Autogenous Grinding (SAG) mills, which were around 50
years old, which has returned the grinding circuit overall utilisation to 91-97% and further supports a
processing capacity of +1.4Mtpa. At 8,000 plant operating hours (91.3%), the annual throughput capacity
should be about 1.45Mtpa, though actual mill throughput is likely to remain constrained by underground
mine production levels until new ore sources are developed.
CSA has limited expansion potential, a toll treating agreement is possible with neighbouring mine Endeavor
to allow the treatment of Zinc ores, however, this is not included in the FY26 LOM or Reserve estimate.
CSA has also reviewed water supply options to the mine. The current installed infrastructure is capable of
supplying sufficient water to allow treatment of approximately 1.4Mtpa. The major source of water for the
CSA operation is the Cobar Water Board supply, piped from Nyngan. This is supplemented by on-site
catchments and bore waters and water offtake from neighbouring mines.
The CSA operation at times experiences recruitment difficulties typical of remote sites. The site currently has
critical maintenance positions open which it has been unable to fill for an extended period. A number of
vacancies are being filled by technical service providers on contract.
14.3Concentrate Product
The copper concentrate produced by CSA is high-quality and acceptable to off-take smelters. The concentrate
grade averages about 26% Cu with payable silver at about 80g/t Ag. The concentrate contains no deleterious
elements that would incur a penalty. The shipped concentrate has moisture levels of around 9.5%, which
comply with the Transportable Moisture Limits for ocean freight. The particle size distribution for the shipped
concentrates average 80% passing 62 micron (P80=62µm).
Concentrates from the processing plant are stored on-site in two large storage sheds located next to the rail
siding and a loading station. Concentrate is loaded into special containers with removable covers and the
containers loaded by front end loader (“FEL”) onto the train. Each train typically comprises 54 wagons
carrying 108 containers containing approximately 2,900 wet metric tonnes (“wmt”) of concentrate. At
Newcastle Port the containers are offloaded using a forklift and placed into a tippler and emptied into a bulk
storage shed. Ships are loaded using a FEL, belt feeders and conveyors; each shipment is typically
10-12,000wmt.
14.4Tailings
Flotation tailings are either sent to the Paste Fill plant or the final tailings thickener depending on mining
backfill requirements. The Paste Fill Plant takes the full stream tailings and partially separates the water
through vacuum filters to produce filter cake. The filter cake is mixed with cement and sent underground as
paste fill.
Tailings product is thickened using a high-rate thickener before being pumped to the storage facility for
deposition.
CSA deposits thickened tailings within the South Tailings Storage Facility which is a licensed discharge point
for CSA.
Harmony Australasia | CONFIDENTIAL80
Technical Report Summary of the CSA Copper Mine, New South Wales, Australia
Although variable based on production sequencing, approximately 45% of the tailings is sent to the paste fill
plant and ends up as backfill with the remaining 55% of the tailings deposited in the Southern Tailings
Storage Facility.
For additional information on CSA’s Tailings Storage Facility, reference should be made to Section 15.5
14.5Other Processing Inputs
14.5.1Consumables
Due to the high-grade ore at CSA, the processing facility is not required to process a large volume of ore to
extract the copper, compared with many other copper mines in the industry. As a result of its comparatively
small size and efficient ore recovery performance, the plant requirement for consumables such as grinding
media, wear components or reagents is relatively modest.
The main consumables used in the processing operations are grinding media and mill liners which, combined,
represent a cost of approximately AUD$2M per annum. These consumables represent approximately 18% of
total processing costs and 3% of total mine site costs each year.
14.5.2Personnel
Approximately 100 employees work across the fixed plant areas of CSA including the concentrator,
concentrate handling and paste fill plant. The consistency of processing operations has led to greater stability
in the workforce, relative to the mining operations, and workforce numbers are expected to remain at similar
levels for the Reserve life. Labour costs represent approximately 50% of annual Processing costs, with
Contractors contributing a further 10%.
14.5.3Energy and Utilities
The third major processing cost component is power and utilities. As with process plant consumables, the
high-grade ore at CSA enables copper concentrate to be processed using a relatively low total grinding mill
power per tonne of copper produced. Power costs for the process plant average approximately AUD$4-5M
per year, which represents 10% of total milling costs.
Due to the high availability and near-continuous operation of the grinding mills during operation, annual
power demand is generally extremely consistent and not expected to vary throughout the Reserve life of
mine. Variances in power consumption may occur on a short-term basis during maintenance outages or
when ore supply from underground is not available.
Processing facilities require large volumes of water throughout most stages of the processing pathway;
however much of the process water is recovered and reused, significantly reducing the amount of fresh
water required.
Water loss in the process plant is predominantly through entrained water/moisture leaving the plant within
concentrate product (~9.5% moisture content per tonne of concentrate) or tailings (~70% water content per
tonne of tailings). Water from the tailings is recovered through a decant system at the tailings storage facility
or through the filtration process within the paste fill plant.
Water consumption within the process plant is well understood, stable and not expected to vary over the
Reserve life of mine. Power and water costs combined represent approximately 11% of annual processing
costs.
14.6Qualified Person’s Opinion on Processing and Recovery Methods
The QP is satisfied that the processing facilities at CSA are in good order and fit for purpose. Operating
performance has been good and consistent and the QP expects this to continue.
15Infrastructure
Section 229.601(b)(96)(iii)(B)(15)
15.1Access and Ports
Harmony Australasia | CONFIDENTIAL81
Technical Report Summary of the CSA Copper Mine, New South Wales, Australia
15.1.1Roads
Road access to the mine site from Sydney is via National Highway No. A32, the Barrier Highway, a high-
quality rural highway to Cobar and from there to the mine site on sealed urban roads.
15.1.2Airstrip
Cobar is serviced by a sealed airstrip with commercial flights five times per week to and from Sydney.
15.1.3Rail
The site is serviced by a rail line (Figure 1-1) which allows transport of concentrate product to the Port of
Newcastle for export. Concentrate is loaded into rail wagons at the site and railed to Newcastle along the
NSW rail network. Railing to Port Kembla, south of Wollongong, is also an option.
15.1.4Port Facilities
Concentrate product is unloaded from rail wagons and stored at the Port of Newcastle before being loaded
onto ships for export. The port facilities are owned and operated by a private company, Port of Newcastle
Operations Ltd, with the unloading, storage and ship-loading services being provided to the project in
accordance with a services contract.
15.2Ventilation Infrastructure
The ventilation system is based on four primary exhaust fans. The surface fans can extract a volumetric flow
rate of 1,000m3 per second (“m3/s”) of air out of the mine via a dedicated series of ventilation raises from
the bottom of the mine to surface.
No. 1 Shaft, No. 2 Shaft, Fresh Air Raise 1 (“FAR1”), Fresh Air Rise 2 (“FAR2”) and the main decline from the
surface are the primary fresh air intakes. The No. 2 Shaft accounts for about 20% of the total mine fresh air,
FAR1 33%, FAR2 28%, No. 1 Shaft 17% and the decline 2%.
Underground auxiliary fans force-ventilate working areas with fresh air from a series of dedicated fresh air
raises connected directly to the cooling plants atop FAR1 and FAR2.
The mine’s geothermal gradient is 2ºC per 100m; the air is chilled by surface refrigeration plants at No. 2
shaft, No. 1 Shaft, FAR1 and FAR2 (3.5MW, 2MW, 10MW and 12MW respectively), down to 4-8ºC wet bulb
(“WB”) to target a 24ºC WB fresh air temperature at 8430RL. With the current ventilation system, WB
temperatures in the working areas of 8430RL are up to 27°C WB, which is considered to be within industry
safe working limits.
As mining gets deeper, sustained production will depend on developing sufficient mining fronts, and the
associated level ventilation, to support the production output. An extensive capital ventilation project (CVP)
is underway to relieve the mine's current ventilation constraints. Raise boring of new RARs is underway to
support the continued lower mine extension. Production is supplemented from QTSC and Western stopes.
The ventilation and cooling demands are driven by the increase in mining depth, number of mining areas and
the increasing mining fleet required to support the targeted production.
15.2.1Ventilation Upgrade Projects
The Capital Ventilation Project (CVP) at CSA Mine comprises a portfolio of capital works designed to upgrade
the underground ventilation system to support planned production from deeper mining areas, primarily the
QTSN and QTSC orebodies.
The project integrates ventilation infrastructure including return air rises, fresh air rises, booster fan
installations, and associated electrical and civil works.
The CVP scope is designed to:
•Increase total airflow available to the lower mining areas
•Enable safe and compliant working conditions at depth
•Support development, stoping, and haulage activities required under the LoM plan
Ventilation modelling indicates that the proposed upgrade will increase airflow in the lower mine from
approximately 381 m³/s to 713 m³/s. 1
Harmony Australasia | CONFIDENTIAL82
Technical Report Summary of the CSA Copper Mine, New South Wales, Australia
The CVP consists of the following principal workstreams:
•Underground Ventilation Infrastructure
•Development of exhaust raise bores to establish additional return air capacity
•Associated lateral development linking new ventilation circuits
•Installation of supporting ventilation infrastructure within the mine
Installation of underground booster fans to increase airflow through lower mine horizons as well as upgrades
to surface fans, including operation at full design capacity where practicable is being targeted.
Supporting Systems
•Installation of high-voltage electrical reticulation (11 kV) and associated switchgear
•Fan chambers and civil infrastructure for ventilation equipment 4
•Spray lining and ground support within raise bores to ensure long-term stability
•Geotechnical investigations and design validation supporting raise development
The project design allows for potential integration with:
•Additional ventilation raises (e.g. FAR developments and future return air capacity expansions)
•Cooling system upgrades and bulk air cooling infrastructure
The total capital cost for the CVP is estimated at approximately A$65 million which is included in the current
LOM and Reserve cost estimates. Capital estimates are based on budget-level (Class 3–5) definitions with
progressive installation works planned over 3 years to FY29. Major ventilation capacity increases are planned
to be realised progressively through the implementation period.
The major components of capital expenditure include:
•Ventilation-related mine development (lateral and vertical)
•Raise boring activities
•Booster fan systems and associated infrastructure
•Electrical reticulation and distribution
•Civil works and geotechnical support
15.3Power Supply
Power supply to the site is via a 132kV transmission line from Essential Energy’s western NSW network. The
Essential Energy network is supplied by a mix of conventional and renewable power generation, including the
102MW and 132MW solar farms in the nearby towns of Nyngan and Nevertire. The current available capacity
of the supply facilities is around 26 mega volt amperes (“MVA”). The average power demand is around
36MVA following the completion of the ventilation upgrade project. A new 40MVA transformer has been
installed to handle the demand. A 22kV line is also connected to the site from Cobar and is available for
limited supply in emergencies.
15.4Water Supply and Water Pipelines
The majority of water supply for the operation is provided by the Cobar Water Board from a weir on the
Bogan River at Nyngan (Figure 1-1) through a network of pumps and pipelines. Additional water is available
from tailings water recycling, surface water capture and a borefield installed in 2019. Water demand is
around 3 megalitres per day (ML/day) in summer, with most water supplied by the Cobar Water Board
system. The borefield has capacity for up to 1.3ML/day. The Cobar Water Board system is adequate to supply
the operation up to around 1.4Mtpa; the borefield is only required during periods of drought or should a
plant feed rate in excess of 1.4Mtpa be considered for extended periods. In addition, a water offtake
agreement is in place with neighbouring mines to allow a cheaper surge alternative during times of low water
availability.
15.5Tailings Storage Facility
Harmony Australasia | CONFIDENTIAL83
Technical Report Summary of the CSA Copper Mine, New South Wales, Australia
15.5.1Overview and Current Configuration
The CSA Copper Mine produces flotation tailings from the on-site concentrator that are managed via two
complementary disposal pathways: (i) underground deposition as cemented paste fill (CPF) for stope backfill,
and (ii) surface deposition into the Southern Tailings Storage Facility (STSF). Over the most recent five-year
period, approximately 45–50% of treated ore tonnage has been routed to the Paste Fill Plant as backfill, with
the balance of approximately 50–55% deposited as final tailings to the STSF. This split provides material
flexibility for tailings management and reduces overall surface storage demand.
The STSF is currently the only operating tailings facility on the CSA Mining Lease (CML). It comprises the main
STSF impoundment of approximately 63 ha and an adjacent STSF Extension of approximately 19 ha, located
approximately 1.5km east of the processing plant. The STSF is a perimeter-embankment, upstream-raised
facility that was converted to a central thickened discharge (CTD) deposition method in 2010. The CTD
method delivers measurable water savings, reduces the volume of construction borrow required for
successive lifts, lowers final capping and topsoil requirements at closure, and improves embankment integrity
through higher solids density at point of deposition.
A second, historical facility — the Northern Tailings Storage Facility (NTSF) — sits immediately adjacent to the
STSF, sharing a dividing embankment. The NTSF accepted tailings between 1971 and 1997, was excised from
the Consolidated Mining Lease (CML) in 1998 under Dealing T91-0618 (gazetted 19 March 1999) and has
been on care and maintenance under NSW Government oversight since that date. Recommissioning of the
NTSF is the leading option for life-of-mine (LOM) capacity beyond Stage 11 of the STSF and is described in
Section 15.5.7.
15.5.2Regulatory Framework, Standards and Permits
Tailings deposition is licensed under Environment Protection Licence EPL 1864, issued by the NSW
Environment Protection Authority (EPA), with the STSF identified as a licensed discharge point. The STSF is a
‘Declared Dam’ (Dam ID 497) under the Dams Safety Act 2015 (NSW) and is regulated by Dam Safety NSW
(DSNSW). The current consequence category for the STSF, as documented by the Engineer of Record, is
‘Significant’, in accordance with the ANCOLD Guidelines on Consequence Categories for Dams (2012,
reaffirmed 2022).
Design, construction, operation and surveillance are undertaken in accordance with:
•ANCOLD Guidelines on Tailings Dams – Planning, Design, Construction, Operation and Closure (2019,
Revision 1).
•Dams Safety NSW Regulation 2019, including periodic Dam Safety Review (DSR) every 15 years.
•Global Industry Standard on Tailings Management (GISTM, ICMM 2020) — currently being
incorporated through governance alignment with Harmony corporate standards following the October
2025 acquisition.
•NSW Mining Act 1992, NSW Environmental Planning and Assessment Act 1979, NSW Protection of the
Environment Operations Act 1997 and applicable Development Consent conditions (granted 15
September 1995, as amended).
The most recent Dam Safety Review was undertaken by Coffey Geotechnics in 2019. A further DSR is due
under the 15-year DSNSW interval; CSA has scheduled this review for completion within the 2026 calendar
year and CSA is concurrently being added to the Harmony Group annual Independent Technical Review Board
(ITRB) cycle. WSP (formerly WSP Golder) is engaged as Engineer of Record (EoR) for the STSF and undertakes
annual surveillance audits and quarterly performance reporting.
15.5.3 STSF Design Basis and Current Stage Configuration
The STSF was originally constructed in 1965 and has been progressively raised over its operating life. No
critical dam safety defects have been identified by the EoR or by DSNSW in the current monitoring record.
Design parameters underpinning the current STSF configuration and the planned Stage 11 raise are
summarised in Table 15-1
Harmony Australasia | CONFIDENTIAL84
Technical Report Summary of the CSA Copper Mine, New South Wales, Australia
Table 15-1 STSF Design Basis (Stage 10 / Stage 11)
Parameter | Adopted Value / Description |
Facility type | Perimeter embankment, upstream raised, single impoundment with adjacent STSF Extension |
Deposition method | Central Thickened Discharge (CTD) from elevated causeways, multi-spigot rotation |
Stage 9 maximum embankment height | ~22 m (RL 272 m crest, pre Stage 10 raise) |
Stage 10 raise height | ~5 m (upstream raise with top-hat configuration adjacent to decant area) |
Stage 10 maximum embankment height | ~27 m |
Stage 11 raise height | ~5 m (upstream raise) |
Stage 11 maximum embankment height | ~32 m |
Embankment crest width | 5 m (STSF perimeter) / 6 m (causeway) |
Upstream / downstream slopes | 2H:1V upstream (progressively buried by tailings) / 3H:1V downstream |
Minimum freeboard above design tailings surface | 0.5 m perimeter; +2.0 m additional in decant area (Stage 10); +1.8 m additional (Stage 11) |
Construction material (raise) | Compacted tailings from impoundment for primary fill; compacted rockfill (NAF mine waste rock and/or borrow) for buttressing |
Adopted long-term dry density (LoA modelling) | 1.6 t/m³ |
Average annual rate of rise | 0.9 m/yr (overall STSF); 2.5 m/yr (local, western mound); 1.4–1.5 m/yr (local, eastern mound) |
Consequence category | Significant (ANCOLD 2012/2022) |
Design seismic loading (current) | Safety Evaluation Earthquake (SEE) consistent with ANCOLD Significant category; reassessment forms part of 2026 DSR scope |
Decant / water management | Gravity decant chute to lined Decant Dam; emergency spillway sized for the design rainfall event (under reassessment in the Stage 11 design) |
Engineer of Record | WSP (formerly WSP Golder); previously Golder Associates |
15.5.4Operating Performance and Tailings Deposition
Average monthly deposition to the STSF over the most recent operating year has been approximately 55,000
t/month (~660,000 dmtpa), consistent with current mill throughput of 1.2–1.4 Mtpa of ore and the prevailing
CPF backfill split. Tailings are thickened upstream of deposition; flotation tails are routed either to the Paste
Fill Plant filter cake circuit or to the final tailings thickener depending on real-time underground backfill
demand. The Paste Fill Plant produces filter cake which is blended with cement to produce CPF for
underground stope backfill.
Operational performance metrics are tracked monthly and reported to the EoR and to the Accountable
Executive. Routine monitoring includes:
•Monthly deposition reconciliation against the Operating Manual and the LoA deposition model;
•Quarterly beach survey of the STSF impoundment to confirm available freeboard, beach geometry,
and remaining storage life;
•Vibrating wire piezometers (VWPs) for foundation and embankment phreatic conditions, currently
reported through the Gaudi data platform with monthly export to site spreadsheets;
•Monthly contractor-surveyed deformation surveys during the Stage 10 construction window (live
GNSS beacon monitoring proposed for FY26, ~A$600k capex, to align with the Harmony Group
Hexagon GeoMonitoring Hub);
•Annual independent surveillance inspection by the EoR (currently WSP), submitted to DSNSW;
•Trigger Action Response Plan (TARP) thresholds for all monitored instrumentation, reviewed annually.
Cumulative life-to-date copper losses to tailings have been estimated by HMY using the FY26 LoA
reconciliation and 2022–2023 University of Queensland geochemical and mineralogical characterisation work
Harmony Australasia | CONFIDENTIAL85
Technical Report Summary of the CSA Copper Mine, New South Wales, Australia
on 61 cross-facility samples. The work indicates approximately 23,000 t of contained copper is held within the
historical and current tailings storage, with elevated Zn, Ag, Sb and Bi enrichment in localised hotspots. While
these inventories are noted, they have not been included in the Mineral Reserve declared in Section 12 of
this Technical Report Summary.
15.5.5 Governance, Engineer of Record and Accountability
Following HMY's acquisition of CMPL on 24 October 2025, tailings governance has been transitioned into the
HMY operating framework. CSA continues to operate under its site-level Dam Safety Management System
(DSMS), aligned with ANCOLD positions (Responsible Site Person, Engineer of Record and Accountable
Executive Officer), with the corporate framework now being formalised to align with GISTM principles.
Site-level documentation under formal control includes the Dam Safety Emergency Plan (DSEP), Operations,
Maintenance and Surveillance (OMS) Manual, and the DSMS. The DSEP was updated in November 2025 and
is in final sign-off; the next mock emergency exercise is scheduled for 2026.
15.5.6Geochemistry, Closure and Environmental Considerations
Geochemical characterisation work undertaken by Golder Associates (2008) and confirmed by University of
Queensland (2022–2023) classifies the historical NTSF tailings as Acid Forming (AF) or Potentially Acid
Forming (PAF), with potential for metal leaching at concentrations of environmental concern. The upper 2 m
of historic NTSF tailings is oxidised. By contrast, current STSF tailings are predominantly Non-Acid Forming
(NAF), have a higher acid neutralising capacity, and present a lower metal leaching potential. Surrounding
groundwater is generally saline and of poor quality; historical investigations indicate limited migration of
heavy metals from the STSF footprint to groundwater under current management practice.
The current STSF Closure Plan was updated by WSP Golder in June 2022 based on the Stage 11 final
landform. Closure design assumes:
•Final landform reshaping with a 3H:1V downstream slope to manage erosion and limit slope length;
•Capping of the tailings surface with compacted growth medium and / or rock armour over a sealing
layer to manage net percolation;
•Re-establishment of native vegetation consistent with the surrounding Cobar woodland ecosystem;
•Surface water diversion to limit erosion and recontouring of the decant area;
•Long-term groundwater monitoring around the integrated NTSF / STSF footprint.
Estimated direct construction closure costs for the STSF (Stage 10 or Stage 11 final landform) are
approximately A$18.1M, with preliminaries, engineering services, post-closure monitoring and contingency
of approximately A$12.9M. Closure cost provisions are incorporated into Harmony's group rehabilitation
provision and form part of the financial assurance lodged with NSW. The Cobar local airshed and the semi-
arid climate (mean annual rainfall ~400 mm, evaporation:rainfall ratio of approximately 6:1) materially favour
passive closure outcomes.
15.5.7Life-of-Mine Tailings Storage Capacity and Future Options
The June 2026 LOM tailings deposition schedule (refer Section 13) requires approximately 6.1 Mm³ of
additional tailings storage to surface from late 2026 through to the end of the Mineral Reserve mine life and
into the Inferred LOM extension. At an adopted long-term dry density of 1.6 t/m³, the in-place tailings
storage capacities of the STSF lifts and the two prospective new facilities are summarised in Table 15-2
Harmony Australasia | CONFIDENTIAL86
Technical Report Summary of the CSA Copper Mine, New South Wales, Australia
Table 15-2 Tailings Storage Capacity by Layout
Item | STSF Stage 10 | STSF Stage 11 | NTSF (recommissioned) | WTSF (new) |
Storage volume (Mm³) | 2.1 | 2.1 | 3.2 – 6.5 | 3.2 |
Storage capacity (Mdmt, ρ=1.6 t/m³) | 3.36 | 3.36 | 5.12 – 10.4 | 5.12 |
Maximum embankment height (m) | ~27 | ~32 | ~14.5 (new perimeter only) | ~12–15 |
Tailings surface area (ha) | 46.6 | 43.0 | 63.6 | 66.8 |
Indicative operating life (current 60 ktpm) | ~5.0 years from May 2026 | ~5.0 years (cumulative) | 10–13 years | ~7 years |
15.5.7.1STSF Stage 10 (Active Construction)
The Stage 10 lift is the active deposition stage at the effective date of this Technical Report Summary. Stage
10 construction was approximately 80% complete in November 2025, with final crest works targeted for May
2026. The project capital cost is approximately A$18.9M, marginally above the original estimate of A$17.8M
(variance of approximately A$1.1M). At the average forecast deposition rate of approximately 60 kt/month,
Stage 10 will provide tailings storage to approximately September 2031, with an operational buffer of
approximately 12 months (to approximately October 2032) if mill throughput tracks below 60 kt/month over
the first five to six years of LOM (as currently scheduled).
15.5.7.2 STSF Stage 11 (Planned)
Stage 11 is a permitted-in-principle, designed-to-concept ~5 m perimeter raise to the STSF that would extend
deposition to approximately late 2032. Detailed design and execution have not been progressed because the
Stage 11 raise has a higher unit cost than the equivalent storage at the recommissioned NTSF and would lock
CSA into the existing facility footprint at a point where the LOM is expected to require materially more
storage than Stage 11 alone can provide. Stage 11 is retained as a contingency case and as a potential
operational buffer to bridge the new-facility execution window if the NTSF or WTSF schedule slips.
15.5.7.3 NTSF Recommissioning (Preferred LOM Option)
The recommissioning of the NTSF is the preferred LOM capacity option and provides the basis for the storage
capacity assumption in the Mineral Reserve declaration. The NTSF concept and deposition modelling work
supporting this assessment includes:
•WSP Golder Life of Asset Tailings Storage Assessment design and cost estimates;
•MineBridge / TSFRPL LOM Deposition Modelling (1 December 2023) — 13-year conceptual deposition
plan for ~6.1 Mm³ stored in the NTSF using a perimeter spigotted discharge berm in the elevated
western end of the facility;
•PSM CSA Mine NTSF Inspection Report (15 June 2023) — site walk-down, condition assessment,
embankment static and seismic stability commentary;
•WSP CSA NTSF Design Report for Recommissioning and Closure — current design supporting
Harmony / CSA;
•CSA TSF Integration Workshop Summary (12 November 2025) — Harmony governance, regulatory and
bond-transfer pathway.
The principal physical and stability features of the NTSF concept are:
•Semi-enclosed perimeter embankment constructed over the existing tailings surface, with a maximum
new embankment height of approximately 14.5 m;
•Dual deposition causeways constructed from the elevated western end allowing east-flowing tailings
deposition;
•Decant Dam excavated into the south-west, geomembrane lined; stormwater collection dam in the
north-west, geomembrane lined; small stormwater ponds on the eastern and south-eastern sides;
•Adoption of dry density of 1.6 t/m³ (consistent with current STSF operating performance);
Harmony Australasia | CONFIDENTIAL87
Technical Report Summary of the CSA Copper Mine, New South Wales, Australia
•Estimated rate of rise of approximately 1.1 m/year averaged across the deposition area;
•Preliminary hazard classification of ‘Significant’ retained (consistent with the existing pre-1997
facility);
•Pre-recommissioning works including buttressing / flattening of the existing 1990s upstream-raised
perimeter embankments (currently assessed at a static FoS of ~1.2 against an ANCOLD target of ≥1.5),
seismic stability re-assessment using post-liquefied strength, and confirmation of foundation
conditions through additional CPT and laboratory testing.
15.5.7.4 WTSF (Greenfield Alternative)
Site 1 to the north-west of the existing TSFs was selected as the screened-preferred greenfield Western
Tailings Storage Facility (WTSF) location in the August 2022 WSP Golder New Tailings Storage Facility Siting
Assessment. The WTSF is sized at 3.2 Mm³ (~5.12 Mdmt) and includes a fully lined impoundment and Decant
Dam. The WTSF is the highest-cost option and carries a materially longer regulatory approval timeline
(estimated 2–3 years of ESIA studies plus approvals) compared with the NTSF; it is retained as a contingency
option in the event the NTSF tenure or approvals pathway cannot be closed within the required execution
window.
15.5.8 Capital Cost Estimate Summary
Capital cost estimates for the STSF raises and the two new facility options were prepared by WSP Golder as
part of the Life of Asset Tailings Storage Assessment (December 2022) and have been retained as the base
estimate for this Technical Report Summary. The Stage 10 actual cost (~A$18.9M) is broadly consistent with
the WSP Golder estimate. The base date for all other estimates is December 2022; for the Mineral Reserve
cash flow these estimates have been escalated to the effective date of this Technical Report Summary in
accordance with the cost escalation factors set out in Section 19.
Table 15-3 — Indicative Construction and Closure Cost Summary (A$, Dec-2022 base)
Cost Element | STSF Stage 10 | STSF Stage 11 | NTSF | WTSF |
Direct construction (operation) | $18.0M | $22.3M | $9.4M | $32.6M |
Preliminaries, engineering and contingency (construction) | $7.2M | $8.9M | $3.7M | $13.0M |
Direct construction (closure) | $18.1M | $18.1M | $20.9M | $14.6M |
Preliminaries, post-closure monitoring and contingency (closure) | $12.9M | $12.9M | $14.6M | $10.8M |
Total (construction + closure) | $56.2M | $62.2M | $48.6M | $71.0M |
Table 15-4 — LoA Tailings Storage Scenarios (A$, Dec-2022 base)
Scenario | Design & Construction | Closure | Total |
Scenario A — STSF Stages 10 and 11 only (1.6 Mdmt shortfall vs LoA) | $56.4M | $31.0M | $87.4M |
Scenario B — STSF Stage 10 + NTSF recommissioning | $38.3M | $66.5M | $104.8M |
Scenario C — STSF Stage 10 + new WTSF | $70.9M | $41.8M | $112.6M |
Scenario B (STSF Stage 10 plus recommissioning of the NTSF) is the base case adopted for the Mineral
Reserve LOM cash flow. Additionally, a bond transfer of approximately A$18–25M is currently being
negotiated with NSW Government as part of the NTSF tenure reinstatement, and is provisioned within the
Reserve cash flow.
15.5.9Risks, Modifying Factors and Reserve Sensitivity
The adequacy of tailings storage capacity is a material modifying factor under Item 1300 of Regulation S-K.
The QP has reviewed the supporting documentation, the EoR's surveillance reports, the Integration
Workshop outcomes and the indicative execution schedule, and considers the principal risks and mitigations
well understood and well developed.
Harmony Australasia | CONFIDENTIAL88
Technical Report Summary of the CSA Copper Mine, New South Wales, Australia
Sensitivity to the tailings storage solution has been tested in the Reserve cash flow. The Mineral Reserve is
robust under Scenario B (STSF Stage 10 + NTSF), which is the base case. Under Scenario A (Stages 10 and 11
only) there is a residual storage shortfall of approximately 1.6 Mdmt against the LOM tailings schedule, which
would constrain the LOM to approximately 2032; this scenario has therefore not been adopted for the
Reserve. Under Scenario C (Stage 10 + WTSF), the Reserve remains intact but the LOM cash flow carries a
materially higher capital cost (~+A$7.8M total cost over the Scenario B case) and a longer permitting risk
window.
15.5.10 Qualified Person’s Statement
The QP is satisfied that:
•The active STSF (Stage 10) is permitted, designed, constructed by competent contractors under the
supervision of WSP as Engineer of Record, and is being operated in accordance with ANCOLD (2019)
and Dam Safety NSW Regulation requirements;
•No critical dam-safety defects have been identified in the STSF surveillance record;
•The Stage 10 storage capacity is sufficient to support tailings deposition from the LOM mine plan
through approximately September 2031, with operational buffer to approximately October 2032;
•The NTSF recommissioning option (Scenario B) is technically viable at concept-design level, is
supported by independent geotechnical and deposition modelling, and is the most cost-effective
solution to provide the additional ~6.1 Mm³ of LOM storage required beyond Stage 10;
•The principal modifying factors related to tailings storage are tenure reinstatement, bond transfer and
regulatory approval for the NTSF — these are non-technical matters being progressively closed out
through an established work programme;
•Stage 11 of the STSF, and the WTSF greenfield option, provide credible contingency pathways should
the NTSF approval timeline slip;
•Closure costs for the integrated STSF / NTSF landform are included in the rehabilitation provision in
the Mineral Reserve cash flow.
On the basis of the above, the QP considers that there is a reasonable prospect that sufficient permitted
tailings storage capacity will be available to support extraction of the declared Mineral Reserve.
15.6Workforce Accommodation
The majority of the workforce is accommodated in Cobar with some senior staff employed on a fly in/fly out
(FIFO) or drive in/drive out (DIDO) arrangement. No workforce accommodation is provided at the mine site
itself, however, the Company owns and leases various properties in Cobar.
15.7Site Buildings and Services
Site buildings comprise site offices, warehouses, and services buildings. Site services include power and water
reticulation facilities, communications systems and fuel storage and dispensing facilities.
15.8Qualified Person’s Opinion on Infrastructure
CSA is well established with all infrastructure and services in place to sustain the current level of operation
for the remainder of the Reserve mine life. Further lifts of the STSF are required and planning for these are
well progressed with expansion options being traded off on cost, risk and timing.
16Market Studies
Section 229.601(b)(96)(iii)(B)(16) (i-ii)
This section contains forward-looking information related to commodity demand and prices for the Project.
The material factors that could cause actual results to differ materially from the conclusions, estimates,
designs, forecasts or projections in the forward-looking information include any significant differences from
one or more of the material factors or assumptions that are set forth in this section including prevailing
economic conditions, commodity demand and prices as forecast over the reserve mine life period.
The analysis is based primarily on the CRU Copper Long-Term Market Outlook (May 2026) and associated
data.
Harmony Australasia | CONFIDENTIAL89
Technical Report Summary of the CSA Copper Mine, New South Wales, Australia
16.1Copper Demand
Copper is a critical industrial metal with broad application in electrical, construction, transport, and emerging
energy transition sectors. Demand continues to be underpinned by both traditional uses and accelerated
growth from electrification and decarbonisation trends.
Global copper consumption is forecast to increase from approximately 33.8 Mt in 2026 to ~42.4 Mt by 2036,
representing a long-term growth rate of ~2.2% per annum.
Refined copper demand is projected to grow from 28.3 Mt in 2026 to ~35.0 Mt by 2036.
Demand growth is increasingly driven by “growth markets” including:
•electric vehicles and charging infrastructure
•renewable generation and storage (BESS)
•grid expansion and modernisation
•data centres and digital infrastructure
These emerging sectors have increased their share of total copper demand from approximately 17% in 2015
to ~28% in 2025, and are forecast to reach ~36% by 2036.
China remains the dominant consumer, with total copper demand forecast to peak at approximately 21.9 Mt
by 2037, with refined consumption peaking earlier at ~19.3 Mt.
16.2Supply Outlook
Global copper supply is expected to face increasing structural constraints over the medium to long term.
•Forecast primary copper production from operating and committed mines increases from
approximately 24.3 Mt in 2026, before declining after 2028 due to depletion of existing assets.
•While production additions from committed projects partially offset declines, growth is insufficient to
match demand beyond the medium term.
16.2.1Supply Gap
A structural supply deficit emerges during the late 2020s and expands thereafter:
•~0.5 Mt by 2027
•~2.9 Mt by 2030
•~8.17 Mt by 2036
Even when including probable and possible projects, significant additional investment is required:
•Approximately 76 uncommitted projects and
•~US$169 billion of capital investment are required to close the projected supply gap by 2036.
Key constraints to supply growth include:
•declining ore grades at mature operations
•extended permitting and ESG approval timelines
•increasing reliance on higher-risk jurisdictions
•long development timelines (average ~3.5 years from FID to production)
16.3Market Balance
The copper market is forecast to transition through three distinct phases:
•Short-term (2025–2027): broadly balanced, with modest surpluses possible due to ramp-up of
committed projects
•Medium-term (2028–2030): tightening market conditions as demand growth outpaces supply
Harmony Australasia | CONFIDENTIAL90
Technical Report Summary of the CSA Copper Mine, New South Wales, Australia
•Long-term (post-2030): sustained structural deficit, with progressively widening supply gap
This structural tightening underpins long-term price support and incentivises new project development.
Copper Price Outlook
16.3.1 Historical and Forecast Pricing
•The LME 3-month copper price averages approximately US$11,750/t (real 2026) in 2026.
•Forecast real prices remain elevated, gradually moderating to approximately US$10,163/t by 2036.
16.3.2Incentive Price
The long-term copper incentive price (required to sustain new project development) is forecast at
approximately:
•US$10,174/t (real 2026)
•with relatively limited year-on-year movement (-0.5% in latest update)
Notably, this price remains elevated despite an increasing supply gap, reflecting:
•upward revisions in demand forecasts
•increased expected supply from existing operations
•improved visibility of supply from previously under-recognised regions
16.3.3Smelter Terms (TC/RCs)
Treatment and refining charges (TC/RCs) are a key component of concentrate pricing.
•TC/RCs have declined significantly due to persistent concentrate deficits
•Long-term benchmark levels are forecast at approximately US$61–62/t (real 2026)
Structural shifts in smelter economics are also evident:
•Sulphuric acid is forecast to become the primary revenue stream (~36%)
•TC/RCs reduce to ~34–35% of smelter revenue
•Precious metals contribute ~19%
This reflects tight concentrate markets combined with strong by-product pricing.
16.4Product Quality and Marketability
CSA produces a high-quality copper concentrate:
•low deleterious elements
•strong market acceptance
•suitable for blending across a range of smelters
These attributes enhance commercial flexibility and reduce penalty risk.
16.5Offtake Arrangements
CSA production is sold under a binding life-of-mine offtake agreement:
•100% of concentrate production is sold to GIAG
•pricing terms are linked to internationally recognised annual benchmark TC/RCs
•terms are considered consistent with market standards
This arrangement provides:
•revenue certainty
•reduced marketing risk
•alignment with prevailing market pricing mechanisms
Harmony Australasia | CONFIDENTIAL91
Technical Report Summary of the CSA Copper Mine, New South Wales, Australia
The QP is satisfied that the commercial terms are consistent with prevailing market practice and provide an
established route to market for CSA concentrate.
16.6Material Contracts
The CSA Mine operates under a number of commercial agreements supporting mining, processing, power
supply, transportation, explosives supply and equipment procurement. The QP is of the opinion that these
agreements are typical of those used in the Australian mining industry and are consistent with arm's-length
commercial arrangements. Based on a review of the operation, no single contract, other than the
concentrate offtake arrangements, is considered unusual or contains terms that materially constrain the
current or planned operation of the mine. The principal contracts supporting the operation are summarised
in Table 16-1
Counterparty | Purpose |
Glencore | Copper concentrate offtake and marketing |
DRC Drilling Pty Ltd | Underground diamond drilling services |
AGL | Electricity supply |
Sandvik | Supply of mobile mining equipment, parts, drilling consumables and rock tools, together with associated hire purchase agreements |
Qube | Rail transport and logistics services |
Jennmar | Ground support products and services |
Orica | Explosives and blasting products and services* |
* Current supply arrangements are being transitioned to a new contract effective 1 November 2026.
16.7Summary
The copper market is forecast to enter a period of structural undersupply from the late 2020s, driven by
strong demand growth and constrained mine supply. The resulting supply deficit, projected to reach
approximately 8.2 Mt by 2036, supports long-term price strength and elevated incentive pricing.
Within this context, CSA is positioned as a:
•mature, high-grade underground producer
•supplier of clean, high-quality concentrate
•participant in a tightening global concentrate market
This market outlook supports the long-term economic viability of the CSA operation, subject to the
assumptions and risks outlined above.
17Environmental Studies, Permitting and Plans, Negotiations, or Agreements
with Local Individuals or Groups
Section 229.601(b)(96)(iii)(B)(17) (i-vii)
17.1Introduction
The Cobar area has been impacted by mining and agricultural activities since the 1880s. The existing
landscape surrounding CSA is characterised by mining infrastructure, tailings storage facilities, shafts,
disturbed grasslands and soil and rock stockpiles. The native vegetation of the area has been impacted by
clearing and overgrazing with the historic removal of much of the native vegetation resulting in erosion and
extensive colonisation by invasive species. This has created a dense regrowth, referred to as ‘woody weeds’
or Invasive Native Species. The landscape has become highly modified and vulnerable to wind and water
erosion, particularly those areas devoid of vegetation ground cover protection. The region surrounding CSA is
dominated by rangeland agriculture.
Conditions for reopening the mine in 1999 included concessions obtained from the New South Wales
government, including the excision of three areas from the Mining Lease: the North Tailings Storage Facility
(NTSF), an area of subsidence and adjacent waste rock dumps.
Harmony Australasia | CONFIDENTIAL92
Technical Report Summary of the CSA Copper Mine, New South Wales, Australia
CSA is located in an area of low undulating NNW trending rises and is associated with a broad, prominent hill,
Elouera Hill, which rises approximately 30m above the surrounding landscape. The mine lies close to the local
drainage divide between the catchments of Sandy Creek in the southwest and Yanda Creek to the northeast.
The climate of Cobar is semi-arid with evaporation typically exceeding rainfall by a ratio of 6:1. The mean
annual rainfall for Cobar is approximately 400mm. During summer months, maximum temperatures typically
range between 28-39ºC and during the winter months, maximum temperatures typically range between
13-20ºC. Rainfall and temperature records have been recorded from May 1962 and evaporation from
November 1967.
CSA is located in a non-environmentally sensitive Area of State Significance; as such, mining activities are
subject to Part 4 of the Environmental Planning and Assessment Act 1979. However, because CMPL’s
Development Consent was granted in 1995 before the State Environmental Planning Policy (State and
Regional Development) 2011 came into force, its activities are classified as Non-State Significant
Development based on the prior existing consent. The Cobar Shire Council is the approval authority for the
site development approvals.
17.2Baseline and Supporting Studies - Environmental Management and Reporting System
CSA mine operates under a documented Environmental Management System (EMS) that forms the basis of
environmental management at CSA and includes procedures, standards and environmental management
plans (EMPs) to ensure all regulatory requirements are met.
Statutory condition (R1.1) of CMPL’s environmental licence (EPL1864) requires it to submit annual
statements of compliance for its Environmental Management System and practices. CMPL submits an Annual
Return comprising a Statement of Compliance and a Monitoring and Complaints Summary to the NSW EPA in
August each year. An Annual Report is compiled for the mine to fulfil the reporting requirements of the NSW
Mining Act 1992.
For completeness, as CSA has been an operating mine for the past 56 years, no ongoing baseline studies are
required for normal mining operations under CML5. CSA does however conduct scheduled environmental
monitoring and undertakes heritage surveys when seeking approval for works outside the already approved
operating areas. The CSA environmental team, along with independent consultants, have extensive
experience in conducting appropriate studies and ensuring compliance with state and federal regulations.
17.3Permitting
CSA operates under a number of different approvals, including:
•Development Consents issued by Cobar Shire Council (CSC)
•Landowner’s Consent issued by NSW Department of Planning, Industry and Environment-Lands
•Mining tenements issued by the NSW Department of Planning, Industry and Environment – under
Housing and Property
•Rehabilitation Management Plan (RMP) authorised by the NSW Resources Regulator
•EPL1864 issued by the Environmental Protection Authority (EPA)
•Water licenses issued by the NSW Office of Water (NoW)
•Dangerous Goods licenses issued by WorkCover NSW.
17.4Rehabilitation Management Plan (RMP)
Environmental aspects of mineral exploration and mining (including mine rehabilitation and closure) in New
South Wales are administered under the NSW Mining Act 1992.
The recent introduction of the Mining Amendment (Standard Conditions of Mining Leases – Rehabilitation)
Regulation 2021, requires large mines to have a Rehabilitation Management Plan (RMP). CSA Mine has
completed an RMP and has had its Rehabilitation Objectives Statement approved by the NSW Resources
Regulator. CSA, as the lease holder, will provide annual reporting and scheduling of rehabilitation via an
Annual Report and Forward Program (three-year period). This has replaced the previous requirement for an
Annual Environmental Management Report (AEMR).
Harmony Australasia | CONFIDENTIAL93
Technical Report Summary of the CSA Copper Mine, New South Wales, Australia
17.5Mine Waste Management
Waste rock from underground development is backfilled into mined out stopes where possible, but any
excess is hoisted or trucked to surface for storage on temporary waste stockpiles for use in tailings facility
construction projects or for end of mine life rehabilitation. Most waste rock is classified as Non-Acid Forming
(NAF) but around 30% of the waste material is classified as Potential Acid Forming (PAF) rock.
All waste rock materials are geochemically tested for issues related to acid rock drainage (ARD) and potential
for metal leaching. Only suitable, low risk waste rock material is hoisted and stockpiled on the surface. Any
geochemically unsuitable materials are integrated into the underground mining activities. The selection of
appropriate ARD controls depends on several factors including the type and severity of expected
environmental impacts and the opportunities available. Waste rock material is included in cemented rock fill
(CRF) when available or backfilled into stopes to be filled with cemented paste fill (CPF).
17.6Tailings Disposal
CSA deposits thickened tailings within the South Tailings Storage Facility which is a licensed discharge point
for CSA as approved in EPL1684.
The tailings deposited are monitored monthly and the dam is surveyed quarterly. Annual surveillance audits
are conducted by qualified external dam engineers (Engineer of Record). Approximately 45% of the treated
ore ends up as backfill and 55% of the treated ore ends up as final tailings deposited in the STSF.
Flotation tailings are either sent to the Paste Fill plant or the final tailings thickener depending on mining
backfill requirements. The Paste Fill Plant takes the full stream tailings and partially separates the water
through vacuum filters to produce filter cake. The filter cake is mixed with cement and sent underground as
paste fill.
To monitor operational freeboard within the STSF and ensure there is always sufficient capacity, quarterly
surveys are conducted to track the available freeboard remaining within the dam. The results of these
surveys are communicated back to the tailings engineers to allow for performance to be tracked and to
initiate approvals and construction activities, should the surveys identify the STSF is reaching the end of its
projected life sooner than scheduled.
Global engineering firm WSP is engaged by CSA as the Engineer of Record for tailings monitoring, engineering
and design activities.
17.7Water Management
CMPL operates CSA Mine in accordance with the conditions stipulated in Environmental Protection License
(EPL) 1864. No detailed requirements are made of CMPL regarding water management. Specifically, EPL1864
states that no water pollution may occur, and licensed activities including the processing, handling,
movement and storage of materials and substances used to carry out the activity; and the treatment,
storage, processing, reprocessing, transport and disposal of waste generated by the activity, must be carried
out in a competent manner. Further, all plant and equipment installed at the premises or used in connection
with the licensed activity must be maintained in a proper and efficient condition and operated in a proper
and efficient manner.
In lieu of site-specific water management conditions, CMPL has adopted the following principles stipulated in
Australia’s Department of Industry, Innovation and Science Water Stewardship handbook:
•prevent discharges of dirty water
•reduce the importation of water from external water sources
•Minimise the occurrence of water losses through evaporation and seepage and maximise water use
efficiency
•Maximise water recycling and reuse on site, separate water streams where practicable and minimise
disturbance to existing drainage pathways.
17.7.1Water Balance
CSA is a historically "dry" mine with limited water inflow from surface or ground water sources. As such CMPL
maintains several water agreements to ensure enough water is available for full scale mining operations.
Water recovery, bore fields and off take agreements are set up with both neighbouring mines and
Harmony Australasia | CONFIDENTIAL94
Technical Report Summary of the CSA Copper Mine, New South Wales, Australia
government water sources to ensure supply. HMY is completing a full update to the water balance modelling
to assist future planning of water resource and the guarantee of supply. Currently, reticulation volumes are
measured with mechanical flow meters located at inflows and outflows of interest. Water consumption and
basic reticulation data are reported internally in monthly operational reports.
17.7.2Recycling and Water Saving Measures
An extensive water recycling programme is employed at CSA Mine to supplement process water
requirements. Concentrate and tailings filtration, underground dewatering, and TSF decant have historically
returned in excess of 250ML of water annually. All recycled water is transferred to the settling ponds for
basic suspension treatment to reduce suspended solids before being pumped to Pork Pie dam. Recirculation
of process water has been demonstrated by CSA metallurgists to be of no determinable detriment to ore
processing performance indicators and may therefore be recycled indefinitely. The volume of water recycled
through the ore processing and backfill circuit is expected to increase as paste continues to replace CHF as
the primary means of underground void backfilling. Short term monitoring of water reticulation at the Paste
Fill Plant has indicated that approximately 300kL may be returned daily.
All CSA employees and contractors are informed of the scarcity and importance of water as a resource in the
site induction. All personnel on site are responsible for partaking in water conservation practices and
reporting incidents of excess water usage through the internal hazard reporting system.
17.7.3Surface Water Monitoring
CSA undertakes routine surface water monitoring to demonstrate compliance with the conditions of EPL1864
and to provide data to assess the efficacy of site water management practices. Surface water bodies in CML5
do not extend into adjacent land parcels and do not supply a purpose outside of the mining and milling
activities at CSA. As CSA does not discharge contaminated water offsite, a number of surface water bodies
serve as contaminated water receptacles. The nearest neighbouring water bodies are Yanda Creek 15km east
of the TSF, and Buckwaroon Creek 40km south-west of CML5. Both of these water bodies are ephemeral in
nature.
Surface water sampling is conducted as per the principles enunciated in the Standards Association of
Australia AS/NZS 5667:1:1998. In lieu of baseline data or a reference water body, monitoring analytes are
compared against the short-term trigger values for general water use stipulated in the Australian and New
Zealand Environment and Conservation Council (ANZECC) Guidelines for Fresh and Marine Water Quality.
17.7.4Ground Water Monitoring
CSA maintains and monitors 26 active standpipe piezometers, 9 vibrating wire piezometers, 20 monitoring
bores and 5 production bores at the STSF and an additional 12 standpipe piezometers at the NTSF (excised
from CML5 lease). Routine data collection from these sites is used to assess the integrity of the STSF wall, and
to determine whether any underground seepage of contaminated water into natural areas and/or aquifers
has occurred. Water levels are recorded monthly and water quality samples are taken by the Environment
Department when required and/or available.
Groundwater sampling is conducted as per the principles enunciated in the Standards Association of Australia
AS/NZS 5667:1:1998. Baseline groundwater quality data has not been recorded and is difficult to determine
given the long history of tailings deposition and uncertainty regarding groundwater flow direction. CSA has
commissioned GHD and Golder to conduct independent hydrogeological investigations of the CML5 property.
Both studies reported the occurrence of aquifers within adjacent geological features from 12m to 75m below
the surface. Groundwater resources were described as being generally acidic to neutral, brackish to saline
and characterised by high iron and sulphate concentrations unsuitable for use (without intensive processing)
outside of industrial and some agricultural purposes.
Underlying fault sequences occurring in the proximity of the STSF pose a potential pathway for fluid
migration over time. Contemporary seepage has been minimal and confined to the southeast corner of the
STSF. Geochemical work indicates that historic tailings deposited in the STSF were potentially acid-forming
(PAF) with elevated concentrations of leachable metals (Cu, Pb, Zn, Cd) and sulphate which may be a source
of contamination. Contemporary tailings deposition is generally found to be non-acid forming (NAF) with
lower potential to leach metals.
17.8Social Considerations, Plans, Negotiations and Agreements
Harmony Australasia | CONFIDENTIAL95
Technical Report Summary of the CSA Copper Mine, New South Wales, Australia
17.8.1Native Title
CSA is located within an area where native title has been determined to exist in favour of the Ngemba
Ngiyampaa, Wangaaypuwan and Wayilwan People. The determination is relevant to parts of the mining and
exploration tenure associated with CSA, including CML 5 and EL 5693.
Native title compliance considerations will be managed through ongoing engagement with relevant
government agencies and native title representatives. These matters are expected to be addressed through
the applicable statutory processes and, where required, agreements or consents to support continued mining
and exploration activities.
17.8.2Community
There is strong community support for the CSA operation and CMPL has a positive working relationship with
CSC. This is not unexpected given that CSA is the largest employer in the Cobar region, with over 500
employees and contractors.
CMPL is involved with a number of community projects including:
•assistance with the establishment of regular air services between Sydney and Cobar
•regular donations to local community initiatives
•scholarships to students entering their final year of university.
Overall, there is strong local and state government support for the continuation of mining within the Cobar
region.
17.9Cultural Heritage
17.9.1Aboriginal Heritage
Aboriginal people lived within the Cobar region over a long period of time and this would have resulted in the
deposition of a variety of evidence of past occupation. In general terms, the region was suitable for
Aboriginal occupation at a low density.
Aboriginal cultural heritage is managed through CMPL’s Environmental Management Standard EMS 08
Heritage and Cultural Awareness, which includes protection measures specified in the following plans:
•Exploration Environmental Management Plan (PLN-016)
•Cultural Heritage and Archaeological Assessment of CML5 – Consultant Report (PLN-032).
A Cultural Heritage Survey conducted by external consultants in 2007 (CEC 2007) did not identify any
significant Aboriginal heritage at CSA.
Notwithstanding, CMPL is committed to maintaining good relationships with the traditional owners of the
land (the Ngiyampaa people). Staff undertaking surface exploration activities are provided with information
to allow them to recognise Aboriginal heritage sites or artefacts. All locations where surface disturbance or
exploration activities are planned e.g., proposed drill sites, roads and tracks, are checked prior to any
disturbance activity for potential Aboriginal heritage sites. In accordance with CMPL’s Site Disturbance
Permit-Pre-disturbance Baseline Study and Permit requirements, all disturbance permits include the
condition that if any items of cultural heritage significance are found, all work must stop immediately and
DECCW consulted to determine if an investigation is required.
CMPL employees and contractors are instructed to notify the presence of sites of potential importance so
that they may be further examined, and appropriate actions taken as a result of any findings. Sites are then
documented and identified, with the appropriate department notified for confirmation of status and
management advice.
Any Aboriginal archaeological finds, artefacts or information concerning Aboriginal sites that are passed on to
CMPL are appropriately handled and reported to the NSW OEH within reasonable time of being aware of the
location or discovery. No Aboriginal place, object or relic is to be disturbed or damaged without consent or
authorisation.
The Due Diligence Code of Practice for the Protection of the Aboriginal Objects (DECCW 2010) is utilised by
CSA in the assessment of new projects and in all exploration activities undertaken on the mining and
Harmony Australasia | CONFIDENTIAL96
Technical Report Summary of the CSA Copper Mine, New South Wales, Australia
exploration leases. The code outlines a ‘Due Diligence’ process to ensure there is no unintended harm to
Aboriginal artefacts.
No items of aboriginal cultural heritage occur within the CSA mining disturbance zone.
17.9.2European Heritage
European mining history dates back to the 1870s when copper was discovered in Cobar. By 1872 a shaft had
been sunk at CSA and copper was being extracted.
Heritage items within CML5 are managed according to the relevant legislation and guidelines, namely the
National Parks and Wildlife Act 1974, the Heritage Act 1977 and the Environmental Planning and Assessment
Act 1979. Any heritage assessment required is also conducted in accordance with the Cobar Local
Environmental Plan 2012 (LEP) (CSC 2012).
The identified European heritage sites of interest on CML 5 include:
•Mining Quarters – the site of a miners’ quarters erected in the 1960’s; the site once contained five
houses and one swimming pool; these were removed after mine closure in 1998
•“Eloura” – located 1.5km from CSA site; this area shows remnants of old rock gardens and buildings
•CSA Power House – contains five HSF8 Mirrlees diesel engines, manufactured in 1951 by Mirrlees,
Bickerton and Day in Stockport, England.
17.10Mine Rehabilitation and Closure Costs
It is a statutory requirement in New South Wales for operating mines to implement rehabilitation
management plans. Both the plans, the Rehabilitation Objectives and the Forward Program are legally
binding on the approved holder. The rehabilitation plan and the closure objectives and post-closure land uses
outlined in the plan are linked to a rehabilitation cost estimate. The rehabilitation cost estimate is used as the
basis for the financial assurance which holders are required to lodge with the government.
A rehabilitation cost estimate for CSA mine was updated in 2023 and formally approved by the NSW
Resources Regulator on 9 October 2023, at an estimate of A$47M. In BDA’s opinion, given recent changes in
government policy and requirements, this estimate is likely a minimum figure for the closure and
rehabilitation costs. HMY reviews and updates rehabilitation/closure estimates annually for inclusion in
economic assessments, a review of the current provision is currently underway as part of integration
activities.
Rehabilitation activities at CSA Mine are conducted in accordance with the following documents:
•Rehabilitation Management Plan
•CSA Mine South Tailings Storage Facility – Closure Plan
The rehabilitation objectives for the primary domains of CSA are summarised and presented in Table 17-1
Table 17-1 Primary Domains Rehabilitation Objectives
Domain | Rehabilitation Objective |
Infrastructure Area | Mining infrastructure within the mining lease area will be removed if no longer required as part of the approved final land use, and the affected lands rehabilitated. Some infrastructure may be retained on site as tourist attractions and for heritage uses, such as the headframe and decline, following further community consultation and any required development approvals. |
Water Management Area | The drainage pattern of the final landform will be designed to integrate with the surrounding catchments and will be revegetated to achieve long term stability and erosion control and to harmonise with more general rehabilitation and revegetation strategies. All Water Management Areas are planned to be retained on site until at least 3 – 5 years post mine closure to collect any sediment that may run off the disturbed areas of the mine prior to achieving a successful revegetation cover. Once the closure criteria for runoff water quality have been met, these facilities may be removed if required. |
Harmony Australasia | CONFIDENTIAL97
Technical Report Summary of the CSA Copper Mine, New South Wales, Australia
Domain | Rehabilitation Objective |
Tailings Storage Facility | Rehabilitated TSFs will be integrated into the final landscape and revegetated to meet the following objectives: tidy and safe with public safety risks reduced to acceptable levels stable and resistant to erosion meets agreed criteria for land or water contamination suitable for the agreed post-mining land use. |
Rock Emplacement | Areas of rock emplacement at STSF will be rehabilitated and integrated into the final landscape and revegetation strategy. |
Topsoil Stockpile | Areas of topsoil stockpiles will be rehabilitated and integrated into the final landscape and revegetation strategy. |
Exploration Site | All exploration sites will be rehabilitated to a stable and permanent form so that: there is no adverse environmental effect outside the disturbed area and that the land is properly drained and protected from soil erosion the state of the land is compatible with the surrounding land and land use requirements that if landforms, soils, hydrology and native vegetation have been removed or damaged, the original species must be re-established with close reference to the analogue sites; if the original vegetation was not native, any re- established vegetation must be appropriate to the area and at an acceptable density the land does not pose a threat to public safety. |
17.10.1STSF Closure
The operation of the STSF is undertaken in accordance with the STSF Operating Manual (2015), and its
rehabilitation will be as per the STSF Closure Plan update (2022). Documentation is updated as required and
governed by operational strategy.
Periodic analysis of the tailings is undertaken to confirm the geochemical characteristics of this material.
Rehabilitation trials for capping design will be implemented during the MOP and throughout the life of the
mine.
The primary objectives of the closure strategy for the TSF are to control rainfall runoff and limit seepage from
the facility, with the following outcomes:
•a progressive reduction in the phreatic surface within the TSF
•construction of a drainage system enabling incident rainfall to shed from the landform with limited
consequential erosion
•establishment of a functional ecosystem with the potential to support a self -sustaining vegetative
cover on the outer slopes.
17.10.2 Rehabilitation Monitoring
Successful rehabilitation of a mine site is conceptually described in terms of logical steps or phases which can
be made applicable to each of the similar land management units or domains within the mine site.
Since its inception, the CSA monitoring programme has adopted this process of comparing rehabilitation
areas against reference analogue sites and has adapted the methodology with the various revisions of the
NSW Department of Trade & Investment regulatory guidelines.
CSA aims to create stable rehabilitated landforms in areas disturbed by mining. The final landforms would be
constructed to be stable in the long-term and integrate with the surrounding landscape. The new landforms
will be revegetated with selected species of native and/or endemic vegetation that are both suitable to the
physiographic and hydrological features of each landform.
Harmony Australasia | CONFIDENTIAL98
Technical Report Summary of the CSA Copper Mine, New South Wales, Australia
As the current proposed long-term land use is a Native Ecosystem with light intensity rangeland grazing, local
grazing areas situated on the lower slopes which contain a sparse to moderate cover of endemic trees and
shrubs are used as part of the analogue monitoring site as a reference point for rehabilitation targets of the
current rehabilitation areas.
17.11Qualified Person’s Opinion on the Permits, Approvals, Tenements and ESG Aspects
The QP considers that CMPL has comprehensive permits, approvals, tenements and environmental
management plans and systems in place. CMPL advises that all permits and approvals are in place and that its
tenements are in good standing to maintain current operations. The QP is not aware of any material legal,
title, permitting, environmental or social issues that would reasonably be expected to materially affect the
current Mineral Reserve Estimate.
18Capital and Operating Costs
Section 229.601(b)(96)(iii)(B)(18) (i-ii)
This section contains forward-looking information related to capital and operating cost estimates for the
Project.
The material factors that could cause actual results to differ materially from the conclusions, estimates,
designs, forecasts or projections in the forward-looking information include any significant differences from
one or more of the material factors or assumptions that are set forth in this section including prevailing
economic conditions projected labour and equipment productivity levels and that contingency is sufficient to
account for changes in material factors or assumptions.
All capital and operating costs have been estimated in Australian dollars (A$) as this is the currency most
costs are incurred in.
18.1Capital Costs
Capital cost estimates were assembled based on developed FY27 budget that is the basis of the Reserve
Estimate. All capital costs are expressed in Q1 2026 Australian dollars.
The principal capital works for CSA for which capital costs have been estimated generally comprise:
•underground mining capital works including upgrading of the substation, maintenance of fixed and
mobile plant, exploration and resource drilling and replacement of major equipment
•general sustaining capital for the concentrator
•capitalised underground development
•rehabilitation of project facilities at the end of the mine life.
The forecast costs for capital works over the initial three years capturing the required ventilation upgrades in
detail as well as the LOM Capital cost estimate is summarised in Table 18-1
Table 18-1 CSA Capital Cost Summary
CSA Mine | ||
Total | ||
Sustaining | excl. def. strip. / cap. dev. | AUD$M | -365 |
Expansionary | AUD$M | -94 |
Mine Development (capitalised development + other) | AUD$M | -673 |
Total Capital | AUD$M | -1132 |
The major Capital components HMY have committed to over the next three operational years to unlock asset
value are as follows:
•Mine Development (significant increases in capital development metres to repair schedule) AUD75M
•QTSSU Uppers AUD 17.1M
•Fixed Cooling Plant AUD28M
•CVP Development and Booster Fans AUD65M
Harmony Australasia | CONFIDENTIAL99
Technical Report Summary of the CSA Copper Mine, New South Wales, Australia
•Equipment rebuilds and purchases AUD10M, majority or replacements occur in FY28 and FY29
•Sewerage Treatment plant AUD3M
•Northern TSF Design 3.5M
The capital costs were estimated by HMY as part of studies into the necessity for, and the feasibility of, the
upgrade works and as part of the CMPL LOM planning. LOM planning is used for decision making in order to
direct study efforts only.
Capitalised Maintenance Costs for mobile and fixed plant have been estimated from historical maintenance
costs.
The estimates of Geological Drilling costs have been determined from the meters of drilling planned for each
year, applied to historical costs per meter.
Sustaining Costs, which are included in the cost model as part of the Mining Capital total include costs for
underground and above ground services to support the mining operation. The major components of
sustaining costs comprise the costs for:
•mining projects including underground paste fill reticulation, a diamond drilling workshop, subsidence
area fencing, and refuge chambers
•pumps and pipework for underground water supply and removal
•electrical equipment required for underground infrastructure.
The estimates of these Other Costs were determined by HMY on the basis of quotations from prospective
suppliers and contractors and the experience and expertise of HMY management.
The Major Equipment capital costs are the costs for replacing equipment which has reached the end of its
useful operating life. The numbers of each type of equipment have been taken from the mining equipment
schedules described in Section 13. Unit costs for equipment items have been determined from historical
costs and current budget prices from equipment suppliers.
Capitalised Development costs have been estimated by HMY based on historical costs and performance.
The HMY Rehabilitation Costs include the costs of rehabilitating the TSFs and, as noted in Section 17.10 of
this report, are based on the estimate of costs determined in a rehabilitation closure review conducted in
2023 which was based on the costs and capping requirements as per the NSW Resource Regulator –
Rehabilitation Cost Estimate Spreadsheet.
18.1.1Maintenance of Fixed and Mobile plant
The Fixed and Mobile Plant Maintenance capital programme is being carried out in accordance with the
maintenance plans for the mining and processing facilities. The status of the maintenance is reported to be
satisfactory as described in Section 13.
18.1.2Geological Drilling
Geological Drilling for resource definition is being carried out by CMPL in accordance with the CSA geological
work plan and budget. An extensive deep drilling campaign is being undertaken from surface to target the
ore body extensions that are currently open at depth. 21,200m of drilling is planned by three surface rigs to
execute this programme with the intention of unlocking further Resource potential.
18.1.3Replacement of Major Equipment
Major Equipment Replacement is being carried out as equipment items reach the end of their useful life. The
load-and-haul fleet is currently reaching the end of its useful life. Costs associated with the future
replacement of the LHD and haul truck fleet are allocated to both capital and operating costs with a
replacement strategy consisting of both the purchase of new machines and the continuation of the current
Sandvik leasing arrangement.
18.1.4Process Sustaining Capital
The concentrator grinding circuit upgrade commenced in 2020 and was complete in 2023.
Process sustaining capital includes incremental replacement of processing equipment and supporting
infrastructure commensurate with ongoing maintenance of the plant. Process plant capital also includes
Harmony Australasia | CONFIDENTIAL100
Technical Report Summary of the CSA Copper Mine, New South Wales, Australia
replacement and upgrade works for equipment such as ore bins, flotation circuit modifications, concentrate
train container replacement, process plant general structural repairs, rail line maintenance, surface services
upgrades and general site maintenance and upgrades.
18.1.5Tailings Storage Facility
Capital cost estimates for the STSF raises and the two new facility options were prepared by WSP Golder as
part of the Life of Asset Tailings Storage Assessment and have been retained as the base estimate for this
Technical Report Summary. The capital cost for the preferred Option B scenario included in the Mineral
Reserve estimate is ~$104M as reported in Section 15.5.8
18.1.6Capitalised Underground Development
The capitalised underground development is proceeding as part of overall underground development in
accordance with the mine plan as described in Section 13 – Mining Methods.
18.1.6.1Rehabilitation of Project Facilities
No action has been taken in relation to the rehabilitation of project facilities apart from on-going
rehabilitation of waste dumps and TSF facilities which form part of normal operations. Rehabilitation of
mining, processing and infrastructure facilities will be undertaken at the end of the mine life.
18.2 Operating Costs
Table 18-2 provides a site operating cost summary showing forecast operating cost estimates proposed by
HMY for LOM Schedule. The mining unit costs are presented as mining cost per total material mined, with
Processing costs, G&A and Total operating costs presented as cost per tonne milled.
Harmony Australasia | CONFIDENTIAL101
Technical Report Summary of the CSA Copper Mine, New
South Wales, Australia
Table 18-2 Mining, Processing and G&A Operating Cost Summary
CSA Mine | FY27 LOM PLAN | ||||||||||||||||
2027 | 2028 | 2029 | 2030 | 2031 | 2032 | 2033 | 2034 | 2035 | 2036 | 2037 | 2038 | 2039 | 2040 | 2041 | Total | ||
Total Direct Costs | AUD$M | -304 | -292 | -341 | -343 | -320 | -314 | -317 | -318 | -315 | -316 | -312 | -311 | -303 | -219 | -96 | -4422 |
Mining Costs | AUD$M | -187 | -178 | -222 | -224 | -199 | -196 | -199 | -200 | -196 | -198 | -194 | -193 | -189 | -136 | -59 | -2771 |
Processing Costs | AUD$M | -54 | -53 | -56 | -56 | -58 | -55 | -56 | -56 | -56 | -55 | -55 | -55 | -54 | -39 | -18 | -776 |
General Administration | AUD$M | -62 | -62 | -63 | -63 | -63 | -63 | -63 | -63 | -63 | -63 | -63 | -62 | -61 | -44 | -19 | -874 |
Total Direct Costs (Net Mine Development) | AUD$M | -245 | -241 | -264 | -268 | -263 | -280 | -290 | -304 | -299 | -297 | -299 | -297 | -296 | -219 | -95 | -3956 |
Indirect Costs (Royalties, Freight, tax other than income) | AUD$M | -33 | -38 | -44 | -22 | -47 | -45 | -45 | -48 | -48 | -48 | -48 | -45 | -43 | -37 | -18 | -610 |
Unit Costs | |||||||||||||||||
Mining cost /t mined | AUD/t | 150 | 121 | 124 | 131 | 119 | 122 | 123 | 126 | 112 | 100 | 104 | 116 | 114 | 112 | 105 | 118 |
Processing cost / t milled | AUD/t | 64 | 57 | 49 | 50 | 50 | 47 | 43 | 42 | 43 | 37 | 38 | 38 | 39 | 35 | 35 | 44 |
G&A cost / t milled | AUD/t | 74 | 67 | 55 | 56 | 54 | 54 | 49 | 47 | 48 | 42 | 43 | 43 | 43 | 39 | 37 | 49 |
Total operating costs / t milled | AUD/t | 289 | 260 | 233 | 238 | 228 | 239 | 225 | 230 | 230 | 200 | 206 | 207 | 212 | 194 | 182 | 224 |
Harmony Australasia | CONFIDENTIAL102
Technical Report Summary of the CSA Copper Mine, New South Wales, Australia
The HMY forecast operating costs are estimated using CMPL actual costs as the underlying basis. The split
between capitalised development and underground mining cost is calculated during the mine planning
process and based on the function of the underground development being established, with its respective
allocation to mining operations or capital infrastructure. HMY typically forecasts total site costs for mining,
processing, G&A and capitalised development combined (reported in A$) to determine the appropriate cost
estimates.
CSA has a relatively high proportion of fixed costs; any performance improvement will lead to reduced unit
operating costs. Mining is responsible for around 49% of site operating costs. Of the site mining costs, 44%
relates to labour and contractor costs. The mine operating costs are split by cost category and displayed in
Figure 18-1.
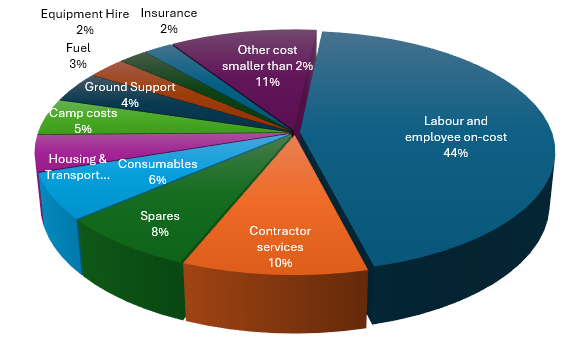
Figure 18-1 Mine Operating Cost Split by Category
Mine operating costs in Australia have seen substantial increases over the last few years due to labour
shortages and material and logistic cost increases. Skilled labour shortages remain acute at all mine sites,
pushing up costs and impacting productivity.
The HMY ore mining rate is forecast to increase from 2028 onwards to around 1.5Mtpa, with the unit ore
mining cost decreasing from around AUD$132/t ore (first three years) to around AUD$115/t ore, averaging
AUD$118/t over the LOM. Higher unit costs are seen at the start of the LOM schedule in line with the
reduced production rate that is constrained by the ventilation circuit. Capital is budgeted to rectify the
ventilation constraint returning the LOM to a lower more stable unit rate for the remainder of the LOM.
The HMY estimate assumes similar Processing and G&A unit costs compared with existing actuals, averaging
approximately AUD$44/t milled and AUD$49/t milled respectively. Overall, the unit costs appear achievable
provided the planned efficiencies are implemented and the mine and mill production forecasts can be
achieved.
Harmony Australasia | CONFIDENTIAL103
Technical Report Summary of the CSA Copper Mine, New South Wales, Australia
18.2.1Realisation Costs and Offsite Costs
Realisation and offsite costs comprise rail freight to Newcastle Port, concentrate storage at Newcastle, ship
loading costs, sea freight, Treatment Charges and Refining Charges (“TCs and RCs”). Contracts are in place
with Aurizon for train freight and Wemco and Port of Newcastle for wharfage and shipping management.
18.2.2Treatment and Refining Charges
HMY continues to work with offtake partners to remain in line with industry best practice and benchmark
costing. For the reserve estimation and financial model, a LOM TC/RC of USD$0.023/lb Copper RC and $USD
23/dmt Copper TC has been assumed based on management’s assessment of possible forward benchmark
terms.
18.2.3Basis of Estimate
Capital and operating costs were developed based on historical cost performance and first principles
calculations based on current commodity costs, labour rates and equipment costs. The costs are provided for
each major cost centre including mining, processing, G&A, off site costs, major capital works and fleet
replacement and closure costs.
18.3Qualified Person’s Opinion on the Adequacy of Capital and Operating Costs
The QP is satisfied that the capital and operating cost estimates used in this TRS are appropriate for an
established operating mine with a long production history and extensive actual cost records. The estimates
are based on recent operating performance, approved budgets, life-of-mine planning assumptions,
contractor quotations and historical expenditure records. The QP considers the level of detail and accuracy of
the capital and operating cost estimates to be sufficient to support the Mineral Reserve estimate and
associated economic analysis presented in this TRS.
19Economic Analysis
Section 229.601(b)(96)(iii)(B)(19) (i-iv)
19.1Forward-looking Information Caution
This section contains forward-looking information related to economic analysis for the Project. The material
factors that could cause actual results to differ materially from the conclusions, estimates, designs, forecasts
or projections in the forward-looking information include any significant differences from one or more of the
material factors or assumptions that are set forth in this sub-section including estimated capital and
operating costs, project schedule and approvals timing, availability of funding, projected commodities
markets and prices.
All costs, prices, and monetary values are in Q1 2026 Australian Dollars (AUD$).
19.2Principal Assumptions
19.2.1Production:
The schedule for CSA with a 15-year mine life entails approximately:
•17.7Mt of ore
•5.7Mt of waste
•23.4Mt of total material mined.
19.2.2Commodity Pricing
The commodity prices considered for the economic analysis to support the Reserve are as shown below in
Table 19-1.
Table 19-1 Copper Price Scenarios
Copper Scenarios | FY27 | FY28 | FY29 | FY30 | FY31 | FY32 onward |
Copper Base = Reserve | 4.64 | 4.8 | 4.86 | 4.74 | 4.74 | 4.5 |
Harmony Australasia | CONFIDENTIAL104
Technical Report Summary of the CSA Copper Mine, New South Wales, Australia
Copper High | 5.43 | 5.16 | 5.59 | 5.54 | 5.52 | 5.15 |
Copper Low | 3.85 | 4.44 | 4.13 | 3.94 | 3.96 | 3.85 |
•Copper pricing is based on the Company’s internal market-guidance on near and long-term price
estimate. The "Copper Base" pricing has been used for the economic analysis for the basis of the
Reserve.
•Silver Price - US$38.90/oz - the Company’s internal market-guidance on long-term price estimate
•A$/US$ Exchange Rate - 0.68 - Company’s internal market-guidance on long-term exchange estimate
19.2.3Discount Rate
A discount rate of 7% was used in this economic analysis, being Harmony's approved "Medium" risk +
weighted average cost of capital for its Australian operations. This is considered reasonable, for CSA,
considering it is an operating mine with a long history, cash-flow producing and has a thorough
understanding of the costs and risks associated with the operation.
19.2.4Exchange Rate
Costs are predominantly incurred in A$ with any cost in US$ converted to A$ at a flat rate of 0.68. The
discounted cashflow basis is on an A$ basis.
19.2.5Taxation and Depreciation
The economic analysis is prepared on an unlevered, 100% equity basis in real Q1 2026 Australian dollars. The
Post-Tax Mine Cash Flow shown in Table 19-2 is derived from the Pre-Tax Mine Cash Flow by deducting
Australian corporate income tax, calculated in accordance with the Australian Income Tax Assessment Act
1997 at the company tax rate of 30%.
Taxable income in each year of the life of mine is determined as gross revenue less deductible operating
costs (mining, processing, general and administration), royalties (the New South Wales State ad valorem
royalty and the private Glencore net smelter royalty), and tax depreciation of qualifying capital expenditure.
Capital expenditure is depreciated for tax purposes using the diminishing value (declining balance) method
over the life of mine. Income tax is applied to the resulting taxable income in each year (nil where taxable
income is negative), with available tax losses carried forward and offset against taxable income in subsequent
years. Depreciation is a non-cash item and is deducted only for the purpose of calculating taxable income; it
is not deducted in arriving at the cash flow itself.
19.3Results of Economic Analysis
As shown in Table 19-2, the following parameters were estimated:
•Net Revenue: sales revenue less TCRC costs of AUD$8.13 billion (B), includes copper and silver sales
(NB Silver is currently subject to a streaming arrangement whereby it generates a neutral net value to
HMY (deductions shown in Owners costs) – as such silver is not included as a reportable Reserve of
the asset)
•Total Direct Costs net of mine development is estimated to be AUD$3.96 billion (B)
•Capital Expenditures: the total capital expenditure, including capitalised development, is AUD$1,132M
•Tax calculation based on diminishing value over the life of the mine
•Net Present Value: After tax NPV is AUD$704M at a discount rate of 7.0%.
•IRR and Payback Period: Not reported. The CSA Mine is an existing operating mine and the economic
analysis commences with positive cash flow. As there is no initial negative cash flow requiring
recovery, IRR and payback period cannot be calculated
Harmony Australasia | CONFIDENTIAL105
Technical Report Summary of the CSA Copper Mine, New
South Wales, Australia
Table 19-2 Economic Analysis of CSA Reserve LOM
CSA Mine | FY27 LOM PLAN | ||||||||||||||||
2027 | 2028 | 2029 | 2030 | 2031 | 2032 | 2033 | 2034 | 2035 | 2036 | 2037 | 2038 | 2039 | 2040 | 2041 | Total | ||
Total Material Mined | kt | 1247 | 1466 | 1790 | 1718 | 1675 | 1609 | 1612 | 1589 | 1755 | 1980 | 1861 | 1671 | 1661 | 1215 | 558 | 23408 |
Ore Mined | kt | 848 | 926 | 1133 | 1129 | 1155 | 1171 | 1285 | 1322 | 1302 | 1483 | 1454 | 1440 | 1395 | 1131 | 518 | 17691 |
Waste Mined | kt | 399 | 540 | 658 | 589 | 520 | 439 | 327 | 267 | 453 | 497 | 407 | 231 | 265 | 84 | 40 | 5716 |
Total Development Metres | m | 4051 | 7060 | 7032 | 5917 | 5761 | 5956 | 4496 | 4144 | 3633 | 5480 | 4542 | 2399 | 1985 | 868 | 824 | 64148 |
Capital | m | 2942 | 4352 | 4154 | 3293 | 3146 | 2118 | 1481 | 734 | 566 | 930 | 516 | 392 | 140 | 0 | 50 | 24815 |
Operating | m | 1037 | 2104 | 2483 | 2241 | 2261 | 3448 | 2651 | 3015 | 2193 | 3040 | 2289 | 1440 | 1079 | 451 | 578 | 30311 |
Rehab | m | 72 | 604 | 395 | 383 | 354 | 390 | 364 | 394 | 874 | 1510 | 1737 | 566 | 766 | 417 | 196 | 9023 |
Total Material Milled | kt | 848 | 926 | 1133 | 1129 | 1155 | 1171 | 1285 | 1322 | 1302 | 1483 | 1454 | 1440 | 1395 | 1131 | 518 | 17691 |
Feed Grade Cu | % | 3.65 | 3.53 | 3.4 | 3.46 | 3.64 | 3.56 | 3.28 | 3.33 | 3.48 | 3.03 | 3.02 | 2.92 | 2.91 | 2.96 | 2.97 | 3.26 |
Feed Grade Ag | g/t | 15.5 | 14.7 | 13.5 | 12.8 | 15.4 | 15 | 12.7 | 11.9 | 12.1 | 9.5 | 10.3 | 10.3 | 10.8 | 11.4 | 12.2 | 12.3 |
Contained Copper Tonnes | kt | 31 | 32.7 | 38.5 | 39 | 42 | 41.7 | 42.1 | 44 | 45.3 | 45 | 44 | 42.1 | 40.6 | 33.5 | 15.4 | 576.9 |
Recovery Cu | % | 0.977 | 0.975 | 0.977 | 0.975 | 0.975 | 0.975 | 0.975 | 0.975 | 0.975 | 0.975 | 0.975 | 0.975 | 0.975 | 0.975 | 0.975 | 0.975 |
Recovery Ag | % | 0.869 | 0.868 | 0.869 | 0.868 | 0.868 | 0.868 | 0.868 | 0.868 | 0.868 | 0.868 | 0.868 | 0.868 | 0.868 | 0.868 | 0.868 | 0.868 |
Concentrate Produced | kdmt | 115 | 131 | 154 | 149 | 161 | 159 | 161 | 168 | 173 | 172 | 168 | 161 | 155 | 128 | 59 | 2216 |
Cu Produced | kt | 30 | 32 | 38 | 38 | 41 | 41 | 41 | 43 | 44 | 44 | 43 | 41 | 40 | 33 | 15 | 562 |
Ag Produced | koz | 367 | 380 | 429 | 405 | 497 | 490 | 456 | 437 | 438 | 394 | 417 | 413 | 420 | 359 | 176 | 6079 |
Net Revenue | AUD$M | 429 | 491 | 566 | 575 | 618 | 585 | 582 | 619 | 620 | 617 | 615 | 582 | 544 | 471 | 220 | 8135 |
Total Direct Costs | AUD$M | -304 | -292 | -341 | -343 | -320 | -314 | -317 | -318 | -315 | -316 | -312 | -311 | -303 | -219 | -96 | -4422 |
Mining Costs | AUD$M | -187 | -178 | -222 | -224 | -199 | -196 | -199 | -200 | -196 | -198 | -194 | -193 | -189 | -136 | -59 | -2771 |
Processing Costs | AUD$M | -54 | -53 | -56 | -56 | -58 | -55 | -56 | -56 | -56 | -55 | -55 | -55 | -54 | -39 | -18 | -776 |
Harmony Australasia | CONFIDENTIAL106
Technical Report Summary of the CSA Copper Mine, New
South Wales, Australia
CSA Mine | FY27 LOM PLAN | ||||||||||||||||
2027 | 2028 | 2029 | 2030 | 2031 | 2032 | 2033 | 2034 | 2035 | 2036 | 2037 | 2038 | 2039 | 2040 | 2041 | Total | ||
General Administration | AUD$M | -62 | -62 | -63 | -63 | -63 | -63 | -63 | -63 | -63 | -63 | -63 | -62 | -61 | -44 | -19 | -874 |
Total Direct Costs (Net Mine Development) | AUD$M | -245 | -241 | -264 | -268 | -263 | -280 | -290 | -304 | -299 | -297 | -299 | -297 | -296 | -219 | -95 | -3956 |
Indirect Costs (Royalties, Freight, tax other than income) | AUD$M | -33 | -38 | -44 | -22 | -47 | -45 | -45 | -48 | -48 | -48 | -48 | -45 | -43 | -37 | -18 | -610 |
Total Capital | AUD$M | -176 | -161 | -137 | -107 | -69 | -71 | -57 | -64 | -61 | -54 | -50 | -30 | -25 | -40 | -29 | -1132 |
Mine Cashflow | AUD$M | -25 | 51 | 121 | 178 | 240 | 189 | 190 | 203 | 211 | 218 | 219 | 209 | 181 | 174 | 78 | 2437 |
Owners costs (inc Streams) | AUD$M | -41 | -48 | -58 | -58 | -60 | -52 | -48 | -52 | -53 | -50 | -48 | -48 | -44 | -37 | -19 | -716 |
Undiscounted Mine Cashflow | AUD$M | -66 | 3 | 63 | 119 | 179 | 137 | 142 | 151 | 159 | 168 | 171 | 161 | 137 | 138 | 59 | 1720 |
Undiscounted Post Tax Mine Cashflow | AUD$M | -70 | -17 | 38 | 92 | 143 | 112 | 118 | 121 | 126 | 134 | 136 | 133 | 115 | 111 | 32 | 1324 |
Total C1 Cost | AUD$M | -243 | -241 | -273 | -278 | -267 | -290 | -300 | -314 | -309 | -311 | -314 | -309 | -308 | -231 | -99 | -4085 |
C1 | $/lb | 3.7 | 3.4 | 3.3 | 3.3 | 3 | 3.2 | 3.3 | 3.3 | 3.2 | 3.2 | 3.3 | 3.4 | 3.5 | 3.2 | 3 | 3.3 |
Total Cash Cost | AUD$M | -379 | -401 | -443 | -384 | -360 | -381 | -379 | -402 | -394 | -387 | -386 | -360 | -353 | -288 | -136 | -5432 |
Total Cash Cost | $/lb | 5.8 | 5.7 | 5.3 | 4.6 | 4 | 4.2 | 4.2 | 4.2 | 4 | 4 | 4.1 | 4 | 4 | 4 | 4.1 | 4.4 |
NPV (7%) After Tax | AUD$M | 704 | |||||||||||||||
Harmony Australasia | CONFIDENTIAL107
Technical Report Summary of the CSA Copper Mine, New South Wales, Australia
19.4Sensitivity Analysis
A sensitivity assessment on the Reserve was completed on the Mineral Reserve schedule by flexing the
contributing modifying factors impacting the economics, by independently varying the copper price,
operating cost, and recovery. The results of the sensitivity analysis are presented in Table 19-3.
Table 19-3 Value Sensitivity Analysis
Case | NPV | |
HMY Base (Reserve) | AUD$M | 704 |
Base + 10% | AUD$M | 1014 |
Base - 10% | AUD$M | 393 |
HMY Low CU | AUD$M | 253 |
HMY High CU | AUD$M | 1155 |
Opex +10% | AUD$M | 569 |
Opex +20% | AUD$M | 435 |
Recovery -5% | AUD$M | 595 |
The project NPV is most sensitive to copper price, followed by a 20% rise in operating costs and least
sensitive to recovery.
19.5Qualified Person’s Opinion on the Economic Analysis
Given the long operating history of the CSA Mine and the extensive actual operating, capital, and
development cost data available, the QP considers the cost estimates used in the economic analysis to be
sufficiently detailed and reliable to support the Mineral Reserve estimate. The QP is of the opinion that the
economic analysis demonstrates the economic viability of the Mineral Reserves reported for CSA.
20Adjacent Properties
Section 229.601(b)(96)(iii)(B)(20) (i-iv)
CSA is wholly contained within CML5, which is surrounded by a network of Exploration Licences also wholly
owned by CMPL. For all practical purposes, CSA has no adjacent properties that are likely to have any
influence on its operations. In the broader region, other resource companies hold exploration tenements;
most are considered to be at an early stage of evaluation.
21Other Relevant Data and Information
21 Other Relevant Data and Information
Section 229.601(b)(96)(iii)(B)(21)
The QP considers that all relevant data and information is contained within the body of this Technical Report
Summary.
22Interpretation and Conclusions
Section 229.601(b)(96)(iii)(B)(22)
22.1Conclusions
The CSA Copper Mine is an established, high-grade underground copper operation located approximately
11km northwest of Cobar, New South Wales, and has been in continuous operation since 1965. The
operation was acquired by HMY on 24 October 2025 and is operated through its wholly-owned subsidiary
CMPL. This TRS has been prepared in accordance with the requirements S-K 1300 and Item 601(b)(96) of
Regulation S-K, and supports the Mineral Resource and Mineral Reserve estimates for the CSA Copper Mine
with an effective date of 30 June 2026.
Harmony Australasia | CONFIDENTIAL108
Technical Report Summary of the CSA Copper Mine, New South Wales, Australia
Based on the data, analyses and modifying factors discussed throughout this Report, the QP concludes that
the CSA Copper Mine is a technically viable, economically robust and appropriately governed underground
mining operation, and that the Mineral Reserve estimate declared in Section 12 is supported by feasibility-
study-level engineering and economic analysis.
22.1.1Mineral Resource
The Mineral Resource estimate has been prepared in accordance with the definitions of Item 1300 of
Regulation S-K. The estimate is based on approximately 2,932 diamond drill holes and more than 71,000
samples, with resource definition drilling completed at 20 m north-south by 37.5 m vertical spacing in QTSN
and 20 m north-south by 20 m vertical spacing in the other four systems (QTSC, QTSS, Eastern and Western).
The Mineral Resource, exclusive of Mineral Reserves and reported on a 100% ownership basis at a 1.5% Cu
cut-off, is summarised in Table 22-1.
Table 22-1 CSA Mineral Resource, exclusive of Mineral Reserves, effective 30 June 2026
Metal >> | Copper | Silver | |||
tonnes | grade | metal | grade | metal | |
kt | % | kt | g/t | koz | |
Measured Mineral Resource | 1,343 | 7.65 | 102.691 | 23.96 | 1,000.558 |
Indicated Mineral Resource | 1,479 | 4.90 | 72.490 | 13.91 | 639.696 |
Total Meas & Ind Resource | 2,822 | 6.21 | 175.181 | 18.69 | 1,640.254 |
Inferred Mineral Resource | 6,173 | 3.76 | 231.942 | 24.83 | 4,767.050 |
Approximately 73% of the Mineral Resource tonnage and 78% of the contained copper metal lies within the
QTSN and QTSC systems, which are the current dominant sources of production. Resource price assumptions
used in the estimation were US$11,900/t Cu and US$38.9/oz Ag, with metallurgical recovery assumptions of
97.5% Cu and 86.7% Ag.
22.1.2Mineral Reserve
The Mineral Reserve estimate is the economically mineable portion of the Measured and Indicated Mineral
Resource and has been derived using detailed stope designs, modifying factors calibrated against ten years of
reconciliation history, and a Discounted Cash Flow ("DCF") economic evaluation using company market-
guidance long-term real commodity price forecasts. The Mineral Reserve declared as at 30 June 2026 is
summarised in Table 22-2.
Table 22-2 CSA Mineral Reserve, effective 30 June 2026
Total Reserve – CSA | |||
Copper | |||
Tonnes | Cu | Cont. Cu | |
[Mt] | [%] | [kt] | |
Total Mineral Reserve | 17.691 | 3.26 | 576.868 |
Proved Mineral Reserve | 12.531 | 3.27 | 410.303 |
Probable Mineral Reserve | 5.161 | 3.23 | 166.565 |
The Mineral Reserve estimate is based on a copper price of US$9,900/t (US$4.50/lb), a silver price of
US$38.90/oz, an A$/US$ exchange rate of 0.68, a stope cut-off grade of 2.26% Cu (FY26–FY28) reducing to
1.93% Cu thereafter, and a development cut-off grade of 1.0% Cu. Modifying factors, including dilution and
mining recovery, are based on stope-type-specific historical reconciliation performance and are considered
by the QP to be appropriately conservative. The Reserve supports an estimated Life-of-Mine ("LOM") of
approximately 15 years.
22.1.3Economic Analysis and Viability
The economic analysis, presented in Section 19, demonstrates that the Mineral Reserve is economically
viable. The base case after-tax NPV, discounted at 7% and expressed in Q1 2026 real Australian dollars, is
Harmony Australasia | CONFIDENTIAL109
Technical Report Summary of the CSA Copper Mine, New South Wales, Australia
estimated at A$704 million. The DCF is most sensitive to copper price, followed by operating costs and
metallurgical recovery. The DCF is based on site budget-level cost and revenue estimates derived from an
established operating mine with a long production history. Given the extensive operating, capital and
development cost data available, the QP considers the cost and revenue estimates to be sufficiently detailed
and reliable to support the Mineral Reserve declaration.
22.1.4Technical Foundations
The QP concludes that the technical foundations of the Reserve are sound and consistent with SK-1300
requirements:
•Geological confidence – the CSA orebody is well understood after more than 50 years of continuous
operation, with 6,800 drill holes totalling approximately 1,000km of core defining the deposit.
•Reconciliation performance – over the ten-year period to December 2025, annual stope production
reconciliations averaged 101% for tonnes, 102% for grade and 103% for contained copper metal,
providing strong empirical support for the block model and mining factors.
•Metallurgical performance – copper recovery has averaged approximately 98% since 2018, with
concentrate grades of 26–27% Cu and payable silver credits of ~80 g/t; there are no deleterious
elements that attract penalties.
•Geotechnical management – the FY26 Ground or Strata Failure PHMP (CSA-PHMP-1004 Revision 9,
February 2026) captures the updated dual stress regimes, the 2025 rock property test results, the
2025 Cavroc LOA FLAC model, and the FY26 chevron centre-out extraction sequence, providing a
comprehensive engineered basis for continued mining at depth.
•Backfill and TSF – the Stage 10 STSF raise is under construction and, together with the
recommissioning of the North Tailings Storage Facility ("NTSF") under Scenario B, provides tailings
storage capacity for the full Reserve LOM; the paste fill plant supports approximately 45–50% of the
current tailings production as cemented paste backfill.
•Infrastructure – the Capital Ventilation Project ("CVP", A$65M) is expected to increase lower-mine
airflow from approximately 381 m³/s to 713 m³/s and is scheduled for progressive commissioning
through FY29.
•Regulatory and legal standing – CML5 and MPL1093/1094 expire in 2028–2029 and renewal
applications are in progress; the QP is not aware of any material legal, permitting, environmental or
title issue that would reasonably be expected to materially affect the Mineral Reserve declaration.
22.1.5Overall Conclusion
The QP concludes that the CSA Copper Mine, on the basis of the technical work presented in this Report, has
the geological, engineering, environmental, permitting, community and financial characteristics required to
support the Mineral Reserve declared as at 30 June 2026. The Reserve LOM is expected to deliver
approximately 577 kt of contained copper from a total ore tonnage of 17.7 Mt processed at an average feed
grade of 3.26% Cu over approximately 15 years.
22.2Significant Risks and Uncertainties
This section discusses the significant risks and uncertainties that may reasonably be expected to affect the
reliability or confidence in the Mineral Reserve estimate, in accordance with Item 601(b)(96)(iii)(B)(22) of
Regulation S-K. Risks have been assessed qualitatively in terms of likelihood and consequence to the Mineral
Reserve declaration and mine plan over the Reserve LOM. Residual risks after implementation of the controls
documented in this Report are presented in Table 22-3.
Harmony Australasia | CONFIDENTIAL110
Technical Report Summary of the CSA Copper Mine, New South Wales, Australia
22.2.1Risk Register
Table 22-3 CSA Copper Mine – Significant Risks and Uncertainties (residual, post-mitigation)
# | Risk | Discipline | Residual Rating | Principal Mitigations |
1 | Copper price falls materially below the US$9,900/t Reserve price | Economic | High | Company long-term price estimate; high-margin operation with an average stope cut-off of 1.93– 2.26% Cu against Reserve grade of 3.26% Cu; NPV remains positive under a 10% Cu price reduction sensitivity. |
2 | Reserve replacement below historical rate due to unsuccessful deep exploration | Resource / Geology | Medium | Titeline 21.5km deep-surface drilling campaign in progress targeting QTSN down-plunge; underground infill drilling averaging 27,700 m/year over the past two years; 15-year Reserve LOM. |
3 | Increasing geotechnical stress and ground control complexity with depth (below 8500 mRL) | Geotechnical | Medium | Dual stress regimes formally adopted (2024 SMTI + 2025 Cavroc calibration); sublevel spacing revised to 35 m below 8500 mRL; top-down centre-out chevron sequence; yielding ground support; FY26 PHMP; seismic sensor upgrade (7→13) in late 2025. |
4 | Ventilation constraints limit ore production during CVP implementation | Infrastructure | Medium | CVP (A$65M) programmed for progressive commissioning to FY29; airflow to lower mine to increase from 381 m³/s to 713 m³/s; interim ventilation upgrades staged to protect the mine plan; battery-electric fleet trial reduces heat and diesel emissions at source. |
5 | Tailings storage capacity constrained by NTSF approval / bond transfer timeline | Environmental / TSF | Medium | Stage 10 STSF provides capacity to Sep 2031; Stage 11 permitted-in-principle as contingency; NTSF Scenario B is the base-case LOM solution; WTSF greenfield alternative retained; Dam Safety Review scheduled for 2026. |
6 | Concentration of Reserve in QTSN (~67% of Reserve Cu metal) | Mining | Medium | Contingent Resource in QTSC, Eastern, Western and QTSSU; paste reticulation extended to QTSC and Eastern; QTSSU production commencing in 2026; WebGen remote firing enables narrow-lens Western mining. |
7 | Operating cost inflation exceeds forecast (labour, energy, consumables) | Economic | Medium | ~50 years of operating cost history; A$118/t mining and A$44/t milling forecasts benchmarked against Cobar labour market; 44% of mining cost is labour/ contractor; FIFO/DIDO flexibility; battery-electric fleet reduces diesel/power exposure. |
8 | Metallurgical recovery declines with depth or feed variability | Processing | Low | 98% average Cu recovery since 2018; onsite geometallurgical modelling and Flotation Plant Survey program; consistent mineralogy; upgraded SAG mills provide 91–97% grinding utilisation. |
9 | Renewal of CML5 and MPL1093/1094 (expiring 2028–2029) not granted | Legal / Permitting | Low | Renewal applications underway well in advance of expiry; long compliance history; strong community support; no material legal, permitting or Native Title impediments identified. |
10 | Water supply constrained (drought / Cobar Water Board capacity limits) | Environmental | Low | Cobar Water Board pipeline supports up to 1.4 Mtpa; on-site borefield (1.3 ML/day); 2026 contingency water line installed to Endeavor Mine; 1,356 MLpa of high-security water entitlements. |
11 | Paste fill reticulation single-point-of-failure at the surface delivery borehole | Backfill | Low | Enhanced borehole monitoring and maintenance program; consideration of duplicate delivery line; paste plant runs on demand; 45–50% of tailings currently used as backfill. |
Harmony Australasia | CONFIDENTIAL111
Technical Report Summary of the CSA Copper Mine, New South Wales, Australia
# | Risk | Discipline | Residual Rating | Principal Mitigations |
12 | Seismic hazard increases beyond current low level as mine deepens | Geotechnical | Low | IMS microseismic system upgrade (13 sensors) in late 2025; ductile rock mass dissipates energy without brittle release; TARP-004 (2025) with 1.2 ML review trigger; formal ground support dynamic capacity review in place. |
13 | QTSSU surface subsidence or blast vibration impacts Pork Pie Dam | Geotechnical / TSF | Low | GTM24-13 RS2 modelling predicts <5 mm surface subsidence; surface vibration monitoring programme in place; survey prism monitoring at Pork Pie Dam; monitoring to continue until residual risk assessed as negligible. |
14 | Coarse ore bins (1960s vintage) fail before staged remediation is complete | Processing | Low | Staged remediation programme capitalised and underway; bins currently operated at partial fill; mill throughput currently constrained by underground production, not by ore bin capacity. |
15 | Skilled labour shortages at remote site (Cobar) | Operational | Low | ~500 FTE workforce; 150 rooms under contract at local village; senior FIFO/DIDO arrangements; critical maintenance vacancies filled by technical service providers. |
22.2.2Discussion of Key Risks
Copper price is the single most material sensitivity in the DCF and, in the QP's opinion, represents the highest
residual risk to the Mineral Reserve declaration. However, the CSA cut-off grade (1.93–2.26% Cu) is
substantially lower than the average Reserve feed grade (3.26% Cu), and the operation retains a positive
after-tax NPV under a Cu price reduction of 10%. The Company long-term real price estimate of US$9,900/t
adopted for the 2026 Reserve is considered by the QP to be a reasonable and defensible view of future
prices.
Increasing geotechnical stress with depth is a real but well-managed technical challenge. The formal adoption
of dual stress regimes (Upper and Lower), calibrated against underground damage observations and the 2024
seismic moment tensor inversion, together with the transition to a 35 m sublevel spacing and a chevron
centre-out extraction sequence below 8500 mRL, has aligned the mine plan with the observed rock mass
behaviour. The FY26 PHMP (Rev 9) is compliant with the NSW Work Health and Safety (Mines and Petroleum
Sites) Regulation 2022 and integrates the 2025 Cavroc LOA FLAC numerical model.
Tailings storage over the Reserve LOM requires the recommissioning of the NTSF (Scenario B, base case). This
is a modifying factor of material importance under Item 1300 of Regulation S-K. The NTSF concept has been
supported by independent geotechnical and deposition modelling by WSP, MineBridge/TSFRPL and PSM, and
the tenure reinstatement and bond transfer with NSW Government are being progressed under a defined
workstream. Stage 11 of the STSF and the greenfield WTSF are retained as credible contingency pathways.
The QP considers that tailings storage risk to the Reserve is appropriately managed.
The concentration of the Reserve in QTSN is intrinsic to the geology of the CSA deposit and has been the case
throughout the mine's operating history. The current Mineral Reserve draws contingent ore sources from
QTSC, Eastern and Western, and the 2026 start-up of the QTSSU introduces a new production area at shallow
depth. The QP considers that the diversity of ore sources within the current Mineral Reserve is adequate.
22.3Opportunities
In addition to the risks discussed above, the QP has identified a number of opportunities that could enhance
the value or extend the LOM of the CSA Copper Mine beyond the Reserve currently declared. These
opportunities are not included in the Mineral Reserve estimate and their realisation is not required to
support the Reserve declaration; they are, however, considered credible and worthy of note under S-K 1300.
22.3.1 Deep Resource Extensions
The mineralised systems at CSA remain open at depth. The deepest QTSN mineralised intercept is currently
at approximately 8,050 mRL (~2,200 m below surface), and the LOA drilling programme continues to intersect
chalcopyrite mineralisation below the current Reserve horizon. The 21.5km Titeline surface diamond drilling
Harmony Australasia | CONFIDENTIAL112
Technical Report Summary of the CSA Copper Mine, New South Wales, Australia
campaign is specifically targeting deep continuity of the QTSN and QTSC lodes and provides the principal
upside pathway. The QP notes that Harmony's operating experience at depths in excess of 3,000 m in its
South African assets provides direct organisational capability for deeper CSA extensions.
22.3.2 Near-Mine Exploration
Extensive geochemically and geophysically anomalous ground surrounds the current mining footprint.
Prospects including Kendi, Pink Panther, Spotted Leopard, Tailings Dam, Stoney Tank, Falcon, Ringneck,
Cherry and Midnight have been drill-tested with encouraging intersections, and the 2020 airborne magnetics
and radiometrics survey together with the 2021–2022 FLEM survey have identified additional targets. In
addition, CMPL has recently consolidated 100% ownership of the AuriCula tenements (Shuttleton and Mt
Hope), which contain historically productive copper prospects along the John Owen Fault trend.
22.3.3 Toll Treatment of Neighbouring Zinc Ores
CSA has excess processing plant capacity above underground mining rates (design 1.4 Mtpa mill throughput
vs 1.1–1.3 Mtpa Reserve mining rate). A toll treating opportunity exists with the neighbouring Endeavor mine
to process zinc ores, and this option remains under commercial consideration. It is not included in the FY26
LOM or Reserve estimate.
22.3.4 Battery-Electric Underground Fleet
A trial of battery-electric LHD and truck units is underway at CSA and is reported to demonstrate good
productivity over 6–7 hour operating windows. Full-scale adoption of battery-electric fleet would materially
reduce diesel emissions, cooling load and ventilation demand at depth, and represents both an
environmental and economic opportunity to be assessed.
23Recommendations
Section 229.601(b)(96)(iii)(B)(23)
The QP considers that the ongoing technical, economic and regulatory integrity of the CSA Mineral Resource
and Mineral Reserve estimates is supported by the established work programmes, governance processes and
capital plans described in this Report. These activities address the principal risks and opportunities associated
with resource definition, mine planning, geotechnical management, processing infrastructure, tailings
storage, environmental management, permitting and corporate governance.
The work programmes described in this Report form part of CSA's normal operating, sustaining capital,
exploration and life-of-mine planning activities and have already been incorporated into Harmony's approved
operating and capital planning framework. The QP is not recommending any additional studies, work
programmes or expenditures beyond those already contemplated and incorporated within the operation's
existing business plans and budgets. Accordingly, no separate recommendation costs, phased work
programmes or associated decision points are presented in this section.
24References
Section 229.601(b)(96)(iii)(B)(24)
The following references comprise the principal reports, studies, technical memoranda, databases, plans,
regulatory approvals and external publications specifically cited in this Technical Report Summary.
•United States Securities and Exchange Commission (SEC), 2020. Modernization of Property Disclosures
for Mining Registrants, Subpart 1300 of Regulation S-K (17 CFR Part 229) and Item 601(b)(96)
Technical Report Summary.
•Metals Acquisition Limited, 2024. Technical Report Summary - CSA Copper Mine, New South Wales,
Australia. Effective Date 31 December 2023. Filed as Exhibit 96.1 to Form F-4/A with the U.S. Securities
and Exchange Commission.
•Cobar Management Pty Limited. AcQuire Geological Database. Site-managed geological, geotechnical,
assay, density and QA/QC database supporting Mineral Resource estimation and Mineral Reserve
conversion.
Harmony Australasia | CONFIDENTIAL113
Technical Report Summary of the CSA Copper Mine, New South Wales, Australia
•Cobar Management Pty Limited / Harmony Gold Mining Company Limited, 2019-2025. CSA Stope
Reconciliation Register. Rolling reconciliation of mined tonnes and grade against Resource and
Reserve estimates.
•Australian Laboratory Services (ALS), Orange NSW. Analytical and Metallurgical Testing Services. ISO/
IEC 17025 and ISO 9001 accredited laboratory.
•Cube Consulting Pty Ltd, 2020-2023. Independent QA/QC Reviews of CSA Sampling, Assaying and
Database Practices.
•HMY / Cobar Management Pty Limited, February 2026. CSA-PHMP-1004 Principal Hazard
Management Plan for Ground or Strata Failure and Subsidence, Revision 9.
•Cavroc Consulting Pty Ltd, 2025. CSA Life-of-Asset FLAC Numerical Model. Geotechnical numerical
modelling study and stress model calibration.
•Lee, M., 2024. CSA Mine In-Situ Stress Regime - Holistic Review.
•Villaescusa, E., 2023. Independent Review of Ground Control and Principal Hazard Management Plan,
CSA Mine.
•Outotec Pty Ltd, 2021. CSA Mine Paste Backfill Exposure Stability Analysis.
•WSP Golder, December 2022. CSA Life of Asset Tailings Storage Assessment.
•WSP. Southern Tailings Storage Facility Engineer of Record Reports, including annual surveillance
inspections, quarterly performance reviews and Stage 10 design documentation.
•WSP. CSA North Tailings Storage Facility Recommissioning and Closure Design Report.
•Coffey Geotechnics Pty Ltd, 2019. Dam Safety Review - Southern Tailings Storage Facility.
•PSM, June 2023. CSA Mine North Tailings Storage Facility Inspection Report.
•MineBridge Pty Ltd / TSFRPL, December 2023. CSA Life-of-Mine Tailings Deposition Modelling Study.
•NSW Environment Protection Authority. Environmental Protection Licence EPL1864.
•NSW Resources Regulator. CSA Rehabilitation Management Plan.
•NSW Resources Regulator. CSA Rehabilitation Objectives Statement.
•Cobar Management Pty Limited. Environmental Management System (EMS), Environmental
Management Plans (EMPs) and Annual Environmental Reporting Records.
•JKTech Pty Ltd, 2020. Mine Future Ores Program - Comminution and Processing Assessment.
•Wills, B.A. and Napier-Munn, T.J., 2016. Wills' Mineral Processing Technology: An Introduction to the
Practical Aspects of Ore Treatment and Mineral Recovery, 8th Edition, Elsevier.
•Harmony Gold Mining Company Limited / Cobar Management Pty Limited, 2025-2026. Capital
Ventilation Project (CVP) Design Package and Ventilation Modelling Studies.
•Cobar Management Pty Limited. Life-of-Mine Mine Planning and Reserve Scheduling Files (Deswik®)
supporting the June 2026 Mineral Reserve estimate.
•Cobar Management Pty Limited. Copper Concentrate Offtake Agreement.
•Cobar Management Pty Limited. Copper Streaming Agreement.
•Cobar Management Pty Limited. Silver Streaming Agreement.
25Reliance on Information Provided by the Registrant
Section 229.601(b)(96)(iii)(B)(25)
In preparing this TRS, the QP relied upon information, analyses and technical work prepared by appropriately
qualified subject matter experts in the disciplines of geology, mine planning, geotechnical engineering,
hydrogeology, tailings management, metallurgy, environmental management, infrastructure and finance.
These specialist contributions included information relating to mining rights, surface rights, contractual
agreements, historical operating expenditures, community relations and other matters.
Harmony Australasia | CONFIDENTIAL114
Technical Report Summary of the CSA Copper Mine, New South Wales, Australia
The QP reviewed and accepted the work of these specialists and considers it reasonable and suitable for use
in this TRS. Responsibility for the scientific and technical disclosure contained herein remains with the QP.