Banco Santander Chile Management Commentary As of September 30, 2026
Important information Banco Santander Chile (“Santander”) cautions that this presentation may contain forward-looking statements and estimates within the meaning of the U.S. Private Securities Litigation Reform Act of 1995. Such forward-looking statements and estimates appear in various places throughout this presentation and include, among other things, comments regarding future business development and profitability. These forward-looking statements and estimates represent our current judgments about future business expectations, but certain risks, uncertainties, and other relevant factors may cause actual results to differ materially from those expected. These factors include: (1) market conditions, macroeconomic factors, regulatory and governmental guidelines; (2) movements in domestic and international stock markets, exchange rates, and interest rates; (3) competitive pressures; (4) technological developments; and (5) changes in the financial position or goodwill of our customers, borrowers, or counterparties. Risk factors and other fundamental factors that we have discussed in our past reports or in future reports, including those filed with regulatory and supervisory bodies, including the U.S. Securities and Exchange Commission (the "SEC"), could materially affect our business and the performance and results described. Other unknown or unforeseeable factors could cause results to differ materially from those described in the forecasts and estimates. Note: This Management Commentary of Banco Santander-Chile and affiliates, for the period ended September 30, 2026, has been prepared in accordance with the requirements of IFRS Practice Statement 1 Management Commentary issued by the IASB. This document was approved by the Board of Directors at its meeting held on October 27, 2026. The information is presented under the accounting standards and instructions issued by the Chilean Financial Market Commission (CMF) for banks in Chile, which are similar to IFRS, but with some differences. Please refer to our 2025 Form 20-F filed with the SEC for an explanation of the main differences between the accounting standards and instructions issued by the CMF and IFRS. However, the consolidated financial statements are prepared based on accounting principles generally accepted in Chile. All figures presented are in nominal terms. Historical figures are not adjusted for inflation. Please note that this information, which is provided for comparative purposes only, may undergo further changes during the year and, therefore, the historical figures, including financial ratios, presented in this report may not be fully comparable with future figures presented by the Bank. Use of materiality The information contained in this report has been selected and presented in accordance with the principle of materiality, with the purpose of providing a clear and understandable view of the matters that Management considers most relevant for evaluating the Bank's performance, financial position, strategy, and outlook. In determining material matters, the nature and relevance of the information was considered within the context of the business model, strategic objectives, and economic decisions that the primary users of this report might make. This process involves evaluating aspects that significantly influence value creation, resource allocation, competitive position, and the Bank's ability to execute its strategy, allowing the disclosure to focus on those matters that contribute most significantly to a comprehensive understanding of the business and its evolution.
Contents Important information 2 Use of materiality 2 Section 1: Highlights 4 Section 2: Key Metrics 7 Section 3: Business environment 10 Section 4: Strategy 18 Section 5: Segment information 25 Section 6: Financial Performance 30 Section 7: Management Perspectives 44 Section 8: Risks 46 Section 9: Credit Risk Classifications 54 Section 10: Share Performance 55 Appendix 1: Balance sheet 56 Appendix 2: Income statement YTD 57 Appendix 3: Quarterly income statement 58 Appendix 4: Key quarterly ratios and other relevant information 59 3
Section 1: Highlights Solid financial performance with a ROAE1 of 24.5% in 9M262 and profit growth of 11.9% YoY3. As of September 30, 2026, net income attributable to the Bank's owners totaled $893 billion (US$4.74 per share and US$1.94 per ADR). Compared to the same period of the previous year, net income increased by 11.9%, reaching a ROAE of 24.5% in 9M26 versus 24.0% in 9M254. This is mainly due to higher net interest income resulting from higher inflation in the readjustment income line, as the UF variation was 3.3% in 9M26 compared to 2.8% in 9M25. Higher results from financial transactions and lower operating expenses also contributed to this improvement. Furthermore, at the shareholders' meeting in April 2026, it was agreed to distribute dividends of 60% of the profits from the 2025 fiscal year. This is a dividend of $3.35 per share and a yield of 4.5%. In the third quarter of 2026, net income attributable to the Bank's owners totaled $237 billion ($1.30 per share and US$0.50 per ADR). Compared to the previous quarter (2Q26), it decreased 38.0% QoQ5 and 4.2% compared to 3Q256, primarily due to lower net income from readjustments in a quarter with lower inflation (0.6% in 3Q26 vs. 2.5% in 2Q26 and 0.6% in 3Q25), as well as lower fee income and higher provisions during the quarter. Despite these factors, ROAE reached 19.1% in 3Q26. Total equity increased 5.7% during the year, including a dividend distribution provision of 70%. Total equity reached $5,114,925 million as of September 30, 2026, a 5.7% increase compared to December 31, 2025. This growth is primarily due to reserves resulting from higher profits in fiscal year 2025. Additionally, as of September 2026, the Bank increased its dividend provision from 60% to 70% of 2026 profits. The Bank maintains a stable CET17 ratio of 10.9% with a capital adequacy ratio8 of 16.3% as of September 2026. Customer funds grow 3.7% in the quarter. The Bank's total deposits increased by 9.0% as of December 31, 2025, driven by an 18.1% growth in time deposits. This was partially offset by a slight contraction in demand deposits, associated with the usual seasonality compared to the previous year-end; however, demand deposits have increased by 5.5% compared to September 2025. We have also seen increased demand for mutual funds, which grew by 15.5% YTD9. Overall, client funds have grown by 11.1% as of December 31, 2025. 4 1Net profit attributable to owners of the Bank annualized divided by the average equity attributable to equity holders. 2The nine months ending September 30, 2026. 3Year on year. 4The nine months ending on September 30, 2025. 5Quarter versus quarter. 6Third quarter of 2025. 7Common Equity Tier 1 divided by risk-weighted assets, under Chilean regulation. 8Tier 1 + Tier 2 capital divided by risk-weighted assets, under Chilean regulation. 9 Year-to-date
In the third quarter (3Q26), total deposits increased by 2.8% QoQ. With lower expectations of cuts to the Monetary Policy Rate, time deposits grew by 5.6%, while demand deposits decreased slightly by 0.8% QoQ. Meanwhile, mutual funds increased by 5.5% QoQ. Overall, customer funds grew by 3.7% QoQ. Total loans grew 1.8% QoQ, driven by higher demand for loans from large companies Total loans at amortized cost increased by 3.0% compared to December 31, 2025 and by 1.8% QoQ, driven by growth in commercial, mortgage, and auto loans. During the second and third quarters, incipient signs of recovery in commercial loans began to appear, with growth of 5.5% since December 31, 2025, and 4.0% QoQ. This trend was primarily driven by increased demand for financing for foreign trade loans and the depreciation of the Chilean peso against the US dollar since December 2025. Secondly, it was also influenced by improved growth in non-trade-export commercial loans to large companies. Within consumer loans is the auto financing business, Santander Consumer, which has maintained positive trends with an increase of 6.3% since December 31, 2025 and an increase of 2.1% QoQ thanks to greater commercial agreements with car dealerships. Best-in-Class in the industry, with an efficiency10 of 33.0% in 9M26 with operating expenses contracting YoY. The Bank's efficiency ratio reached 33.0% as of September 30, 2026, an improvement over the 35.9% recorded in the same period of the previous year, and the efficiency ratio stood at 36.1% in 3Q26. In line with this, the cost- to-asset ratio decreased to 1.4% in the first nine months of 2026. Operating expenses (which include other expenses) decreased by 4.2% compared to 9M25, primarily due to lower administrative costs. It's worth noting that during the first quarter of 2025, the Bank completed a significant milestone with Project Gravity, which involved migrating from the mainframe to the cloud. During that period, both systems operated in parallel, resulting in higher costs. Furthermore, the transition to the new cloud infrastructure generated higher amortization and depreciation expenses associated with legacy systems. During 3Q26, operating expenses decreased by 1.4% compared to 2Q26 and by 4.0% compared to 3Q25, explained by lower other operating expenses in the quarter. 5 10Operating expenses including impairment and other operating expenses/ margin+commissions+ financial transactions and other net operating income.
Net interest income and readjustments increased 7.0% YoY with a NIM11 of 4.1% in 9M26. Net interest and readjustment income accumulated to September 30, 2026 increased by 7.0% compared to the same period in 2025. This growth was driven by a 21.8% increase in readjustment income, favored by a UF variation of 3.3% in 9M26 compared to 2.8% in the same period in 2025. In 3Q26, total net interest and readjustment income decreased by 18.1% compared to 2Q26, mainly due to a sharp contraction in readjustment income of 64.6% in 3Q26, where the variation of the UF decreased from 2.5% in 2Q26 to 0.6% in 3Q26. Meanwhile, interest income in the quarter remained stable compared to the previous quarter. As a result of these inflationary dynamics, the net interest margin (NIM) reached 3.8% in 3Q25, 4.7% in 2Q26 and 3.8% in 3Q26. In cumulative terms, the NIM increased from 4.0% in 9M25 to 4.1% in 9M26. Customer base expansion continues, with total customers increasing by 7.5% YoY. The strategy of strengthening digital products has led to continued growth in our customer base, reaching over 4.9 million customers, of which 2.7 million are active. The Bank's market share in current accounts remained strong, reaching 20.4% as of July 2026. Likewise, the increased use of digital platforms continued to drive fee income, with YoY growth of 13% in mutual fund brokerage and insurance. As a result, the recurrence ratio (total net fees divided by structural support expenses) reached 60.8% YTD as of September 2026, demonstrating that almost two-thirds of the Bank's expenses are financed by fees generated by customers. 6 11NIM: Net interest margin. Annualized accumulative net interest income and readjustments divided by the average of interest-earning assets.
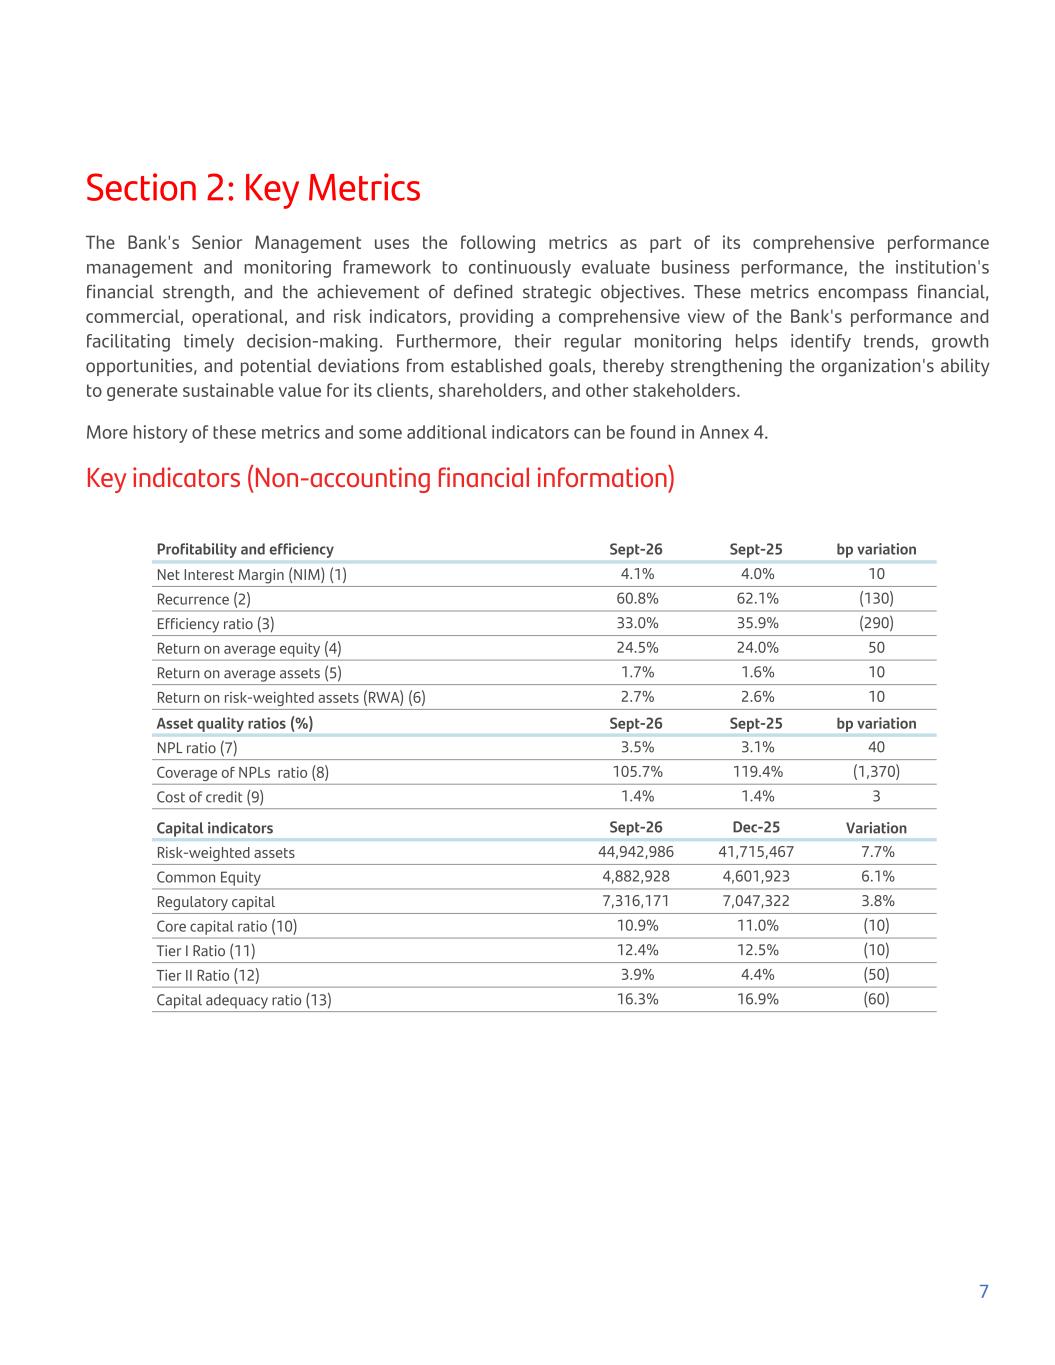
Section 2: Key Metrics The Bank's Senior Management uses the following metrics as part of its comprehensive performance management and monitoring framework to continuously evaluate business performance, the institution's financial strength, and the achievement of defined strategic objectives. These metrics encompass financial, commercial, operational, and risk indicators, providing a comprehensive view of the Bank's performance and facilitating timely decision-making. Furthermore, their regular monitoring helps identify trends, growth opportunities, and potential deviations from established goals, thereby strengthening the organization's ability to generate sustainable value for its clients, shareholders, and other stakeholders. More history of these metrics and some additional indicators can be found in Annex 4. Key indicators (Non-accounting financial information) Profitability and efficiency Sept-26 Sept-25 bp variation Net Interest Margin (NIM) (1) 4.1% 4.0% 10 Recurrence (2) 60.8% 62.1% (130) Efficiency ratio (3) 33.0% 35.9% (290) Return on average equity (4) 24.5% 24.0% 50 Return on average assets (5) 1.7% 1.6% 10 Return on risk-weighted assets (RWA) (6) 2.7% 2.6% 10 Asset quality ratios (%) Sept-26 Sept-25 bp variation NPL ratio (7) 3.5% 3.1% 40 Coverage of NPLs ratio (8) 105.7% 119.4% (1,370) Cost of credit (9) 1.4% 1.4% 3 Capital indicators Sept-26 Dec-25 Variation Risk-weighted assets 44,942,986 41,715,467 7.7% Common Equity 4,882,928 4,601,923 6.1% Regulatory capital 7,316,171 7,047,322 3.8% Core capital ratio (10) 10.9% 11.0% (10) Tier I Ratio (11) 12.4% 12.5% (10) Tier II Ratio (12) 3.9% 4.4% (50) Capital adequacy ratio (13) 16.3% 16.9% (60) 7
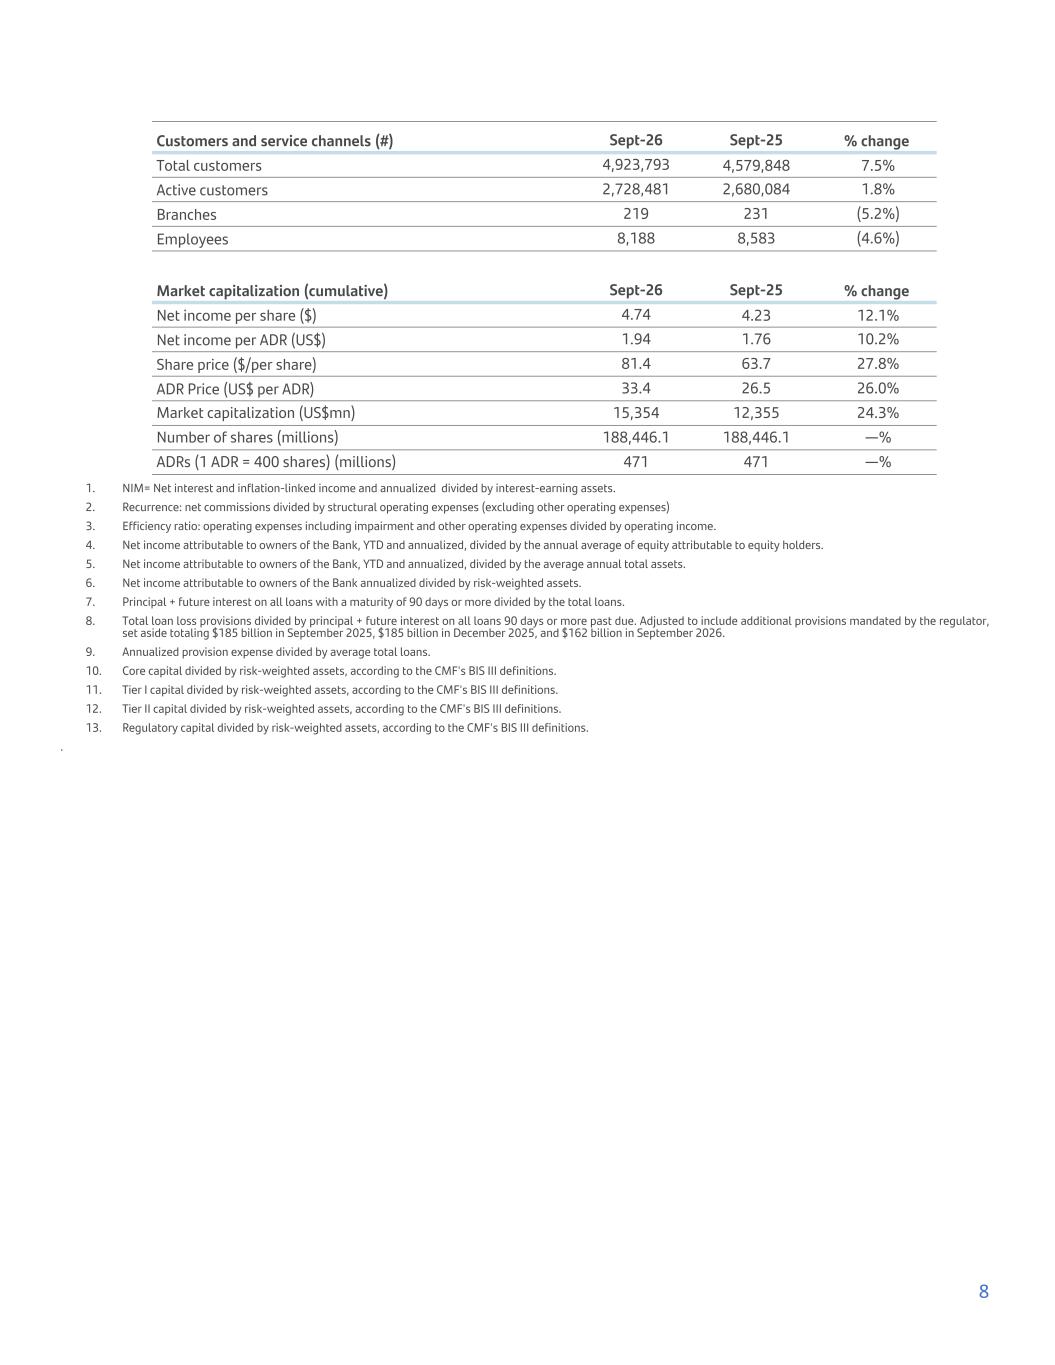
Customers and service channels (#) Sept-26 Sept-25 % change Total customers 4,923,793 4,579,848 7.5% Active customers 2,728,481 2,680,084 1.8% Branches 219 231 (5.2%) Employees 8,188 8,583 (4.6%) Market capitalization (cumulative) Sept-26 Sept-25 % change Net income per share ($) 4.74 4.23 12.1% Net income per ADR (US$) 1.94 1.76 10.2% Share price ($/per share) 81.4 63.7 27.8% ADR Price (US$ per ADR) 33.4 26.5 26.0% Market capitalization (US$mn) 15,354 12,355 24.3% Number of shares (millions) 188,446.1 188,446.1 —% ADRs (1 ADR = 400 shares) (millions) 471 471 —% 1. NIM= Net interest and inflation-linked income and annualized divided by interest-earning assets. 2. Recurrence: net commissions divided by structural operating expenses (excluding other operating expenses) 3. Efficiency ratio: operating expenses including impairment and other operating expenses divided by operating income. 4. Net income attributable to owners of the Bank, YTD and annualized, divided by the annual average of equity attributable to equity holders. 5. Net income attributable to owners of the Bank, YTD and annualized, divided by the average annual total assets. 6. Net income attributable to owners of the Bank annualized divided by risk-weighted assets. 7. Principal + future interest on all loans with a maturity of 90 days or more divided by the total loans. 8. Total loan loss provisions divided by principal + future interest on all loans 90 days or more past due. Adjusted to include additional provisions mandated by the regulator, set aside totaling $185 billion in September 2025, $185 billion in December 2025, and $162 billion in September 2026. 9. Annualized provision expense divided by average total loans. 10. Core capital divided by risk-weighted assets, according to the CMF's BIS III definitions. 11. Tier I capital divided by risk-weighted assets, according to the CMF's BIS III definitions. 12. Tier II capital divided by risk-weighted assets, according to the CMF's BIS III definitions. 13. Regulatory capital divided by risk-weighted assets, according to the CMF's BIS III definitions. . 8
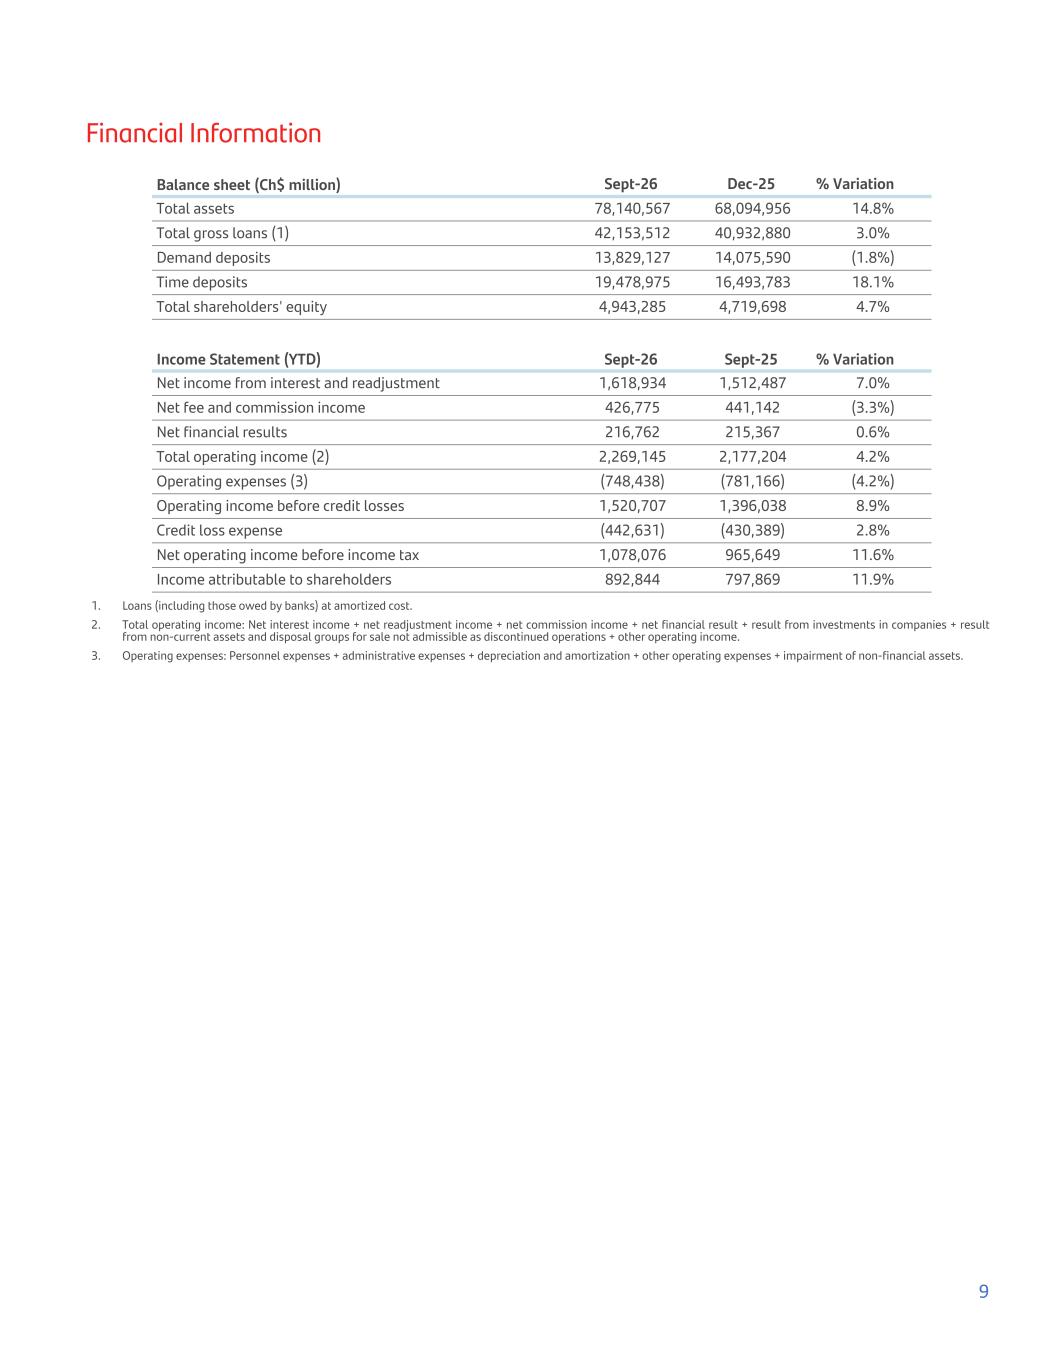
Financial Information Balance sheet (Ch$ million) Sept-26 Dec-25 % Variation Total assets 78,140,567 68,094,956 14.8% Total gross loans (1) 42,153,512 40,932,880 3.0% Demand deposits 13,829,127 14,075,590 (1.8%) Time deposits 19,478,975 16,493,783 18.1% Total shareholders' equity 4,943,285 4,719,698 4.7% Income Statement (YTD) Sept-26 Sept-25 % Variation Net income from interest and readjustment 1,618,934 1,512,487 7.0% Net fee and commission income 426,775 441,142 (3.3%) Net financial results 216,762 215,367 0.6% Total operating income (2) 2,269,145 2,177,204 4.2% Operating expenses (3) (748,438) (781,166) (4.2%) Operating income before credit losses 1,520,707 1,396,038 8.9% Credit loss expense (442,631) (430,389) 2.8% Net operating income before income tax 1,078,076 965,649 11.6% Income attributable to shareholders 892,844 797,869 11.9% 1. Loans (including those owed by banks) at amortized cost. 2. Total operating income: Net interest income + net readjustment income + net commission income + net financial result + result from investments in companies + result from non-current assets and disposal groups for sale not admissible as discontinued operations + other operating income. 3. Operating expenses: Personnel expenses + administrative expenses + depreciation and amortization + other operating expenses + impairment of non-financial assets. 9
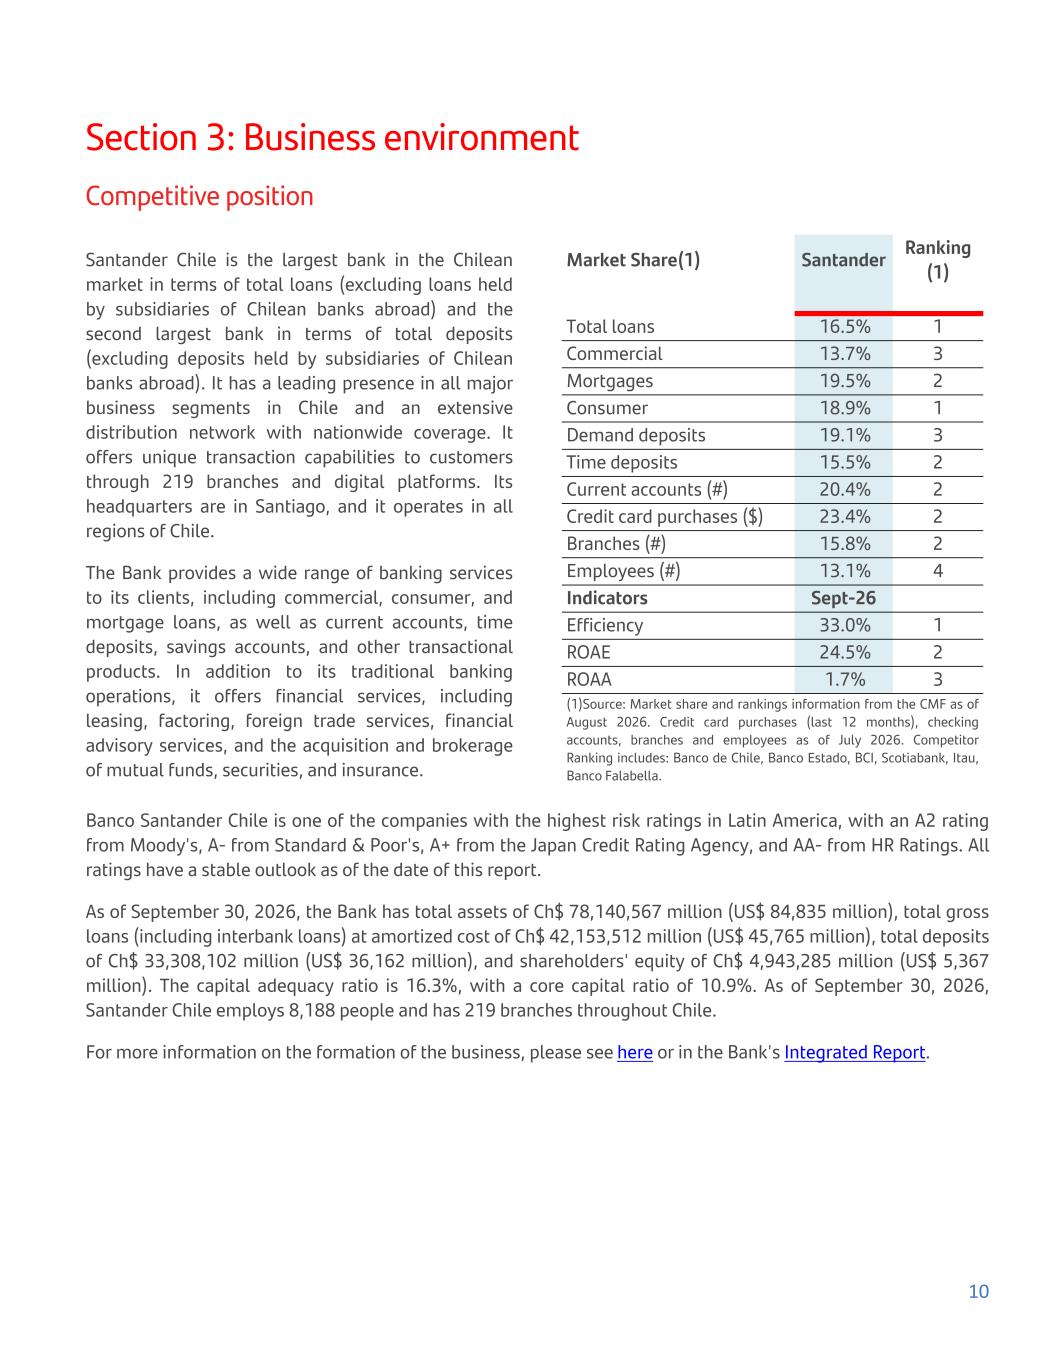
Section 3: Business environment Competitive position Santander Chile is the largest bank in the Chilean market in terms of total loans (excluding loans held by subsidiaries of Chilean banks abroad) and the second largest bank in terms of total deposits (excluding deposits held by subsidiaries of Chilean banks abroad). It has a leading presence in all major business segments in Chile and an extensive distribution network with nationwide coverage. It offers unique transaction capabilities to customers through 219 branches and digital platforms. Its headquarters are in Santiago, and it operates in all regions of Chile. The Bank provides a wide range of banking services to its clients, including commercial, consumer, and mortgage loans, as well as current accounts, time deposits, savings accounts, and other transactional products. In addition to its traditional banking operations, it offers financial services, including leasing, factoring, foreign trade services, financial advisory services, and the acquisition and brokerage of mutual funds, securities, and insurance. Market Share(1) Santander Ranking (1) Total loans 16.5% 1 Commercial 13.7% 3 Mortgages 19.5% 2 Consumer 18.9% 1 Demand deposits 19.1% 3 Time deposits 15.5% 2 Current accounts (#) 20.4% 2 Credit card purchases ($) 23.4% 2 Branches (#) 15.8% 2 Employees (#) 13.1% 4 Indicators Sept-26 Efficiency 33.0% 1 ROAE 24.5% 2 ROAA 1.7% 3 (1)Source: Market share and rankings information from the CMF as of August 2026. Credit card purchases (last 12 months), checking accounts, branches and employees as of July 2026. Competitor Ranking includes: Banco de Chile, Banco Estado, BCI, Scotiabank, Itau, Banco Falabella. Banco Santander Chile is one of the companies with the highest risk ratings in Latin America, with an A2 rating from Moody's, A- from Standard & Poor's, A+ from the Japan Credit Rating Agency, and AA- from HR Ratings. All ratings have a stable outlook as of the date of this report. As of September 30, 2026, the Bank has total assets of Ch$ 78,140,567 million (US$ 84,835 million), total gross loans (including interbank loans) at amortized cost of Ch$ 42,153,512 million (US$ 45,765 million), total deposits of Ch$ 33,308,102 million (US$ 36,162 million), and shareholders' equity of Ch$ 4,943,285 million (US$ 5,367 million). The capital adequacy ratio is 16.3%, with a core capital ratio of 10.9%. As of September 30, 2026, Santander Chile employs 8,188 people and has 219 branches throughout Chile. For more information on the formation of the business, please see here or in the Bank's Integrated Report. 10
Macroeconomic Environment During the third quarter of 2026, the Chilean economy operated in a challenging external environment. The conflict in the Middle East kept fuel prices high, especially for refined products, while higher food and freight costs put pressure on the prices of imported goods. Major central banks reinforced their restrictive stance in the face of resilient global activity and the risk of the energy shock being passed on to underlying inflation. In this context, local long-term interest rates rose in line with those in the United States. Even so, the sovereign spread remained narrow, and copper continued to be a significant support for the external accounts. Domestically, activity remained weak. The Imacec (Monthly Index of Economic Activity) fell 1.0% YoY and 0.7% month-on-month in August, seasonally adjusted, mainly due to a 17.4% YoY contraction in mining, which reached its lowest level since 1996. The non-mining component rebounded 0.7% month-on-month, but only reversed the decline of July and remained practically stagnant compared to the end of 2015. In this context, we project zero growth for 2026, with risks still skewed to the downside by potential climate disruptions and transitory shocks that continue to affect mining production. For 2027, we anticipate an expansion of 3.5%, supported by the normalization of the mining sector, a low base of comparison, and greater implementation of large investment projects, mainly in mining and energy. This is further bolstered by the effect that the Reconstruction Law is expected to begin to take hold. Currently, some leading indicators, such as non- energy imports and perceived demand for credit, are beginning to show early signs of increased dynamism, although still insufficient to confirm a widespread recovery in domestic demand. The labor market showed a deterioration during 2026, in line with the weakness in economic activity. Slower formal job creation and low wage growth limited household spending. We expect the job recovery to be gradual and to lag behind the increased dynamism of economic activity, supported by project implementation. In terms of prices, the CPI rose 0.4% month-on-month in September, one-tenth of a percentage point below expectations, and annual inflation remained at 4.1%. Pressures continued to be concentrated in volatile components, especially energy and food, while the CPI excluding volatile items fell to 3.2% annually, consistent with weak domestic demand. Nevertheless, high international fuel prices and the depreciation of the peso are expected to push inflation up to 5.5% by the end of 2026, before converging back toward the target during the following year. The divergence between higher headline inflation and contained core inflation reduces the need to respond to the shock with an immediate rate hike. We therefore maintain our policy rate projection at 4.5% through 2027. The balance of risks, however, is tilted toward a more restrictive path if the energy shock is prolonged, if the exchange rate remains depreciated, or if two-year inflation expectations begin to deviate from 3%. 11
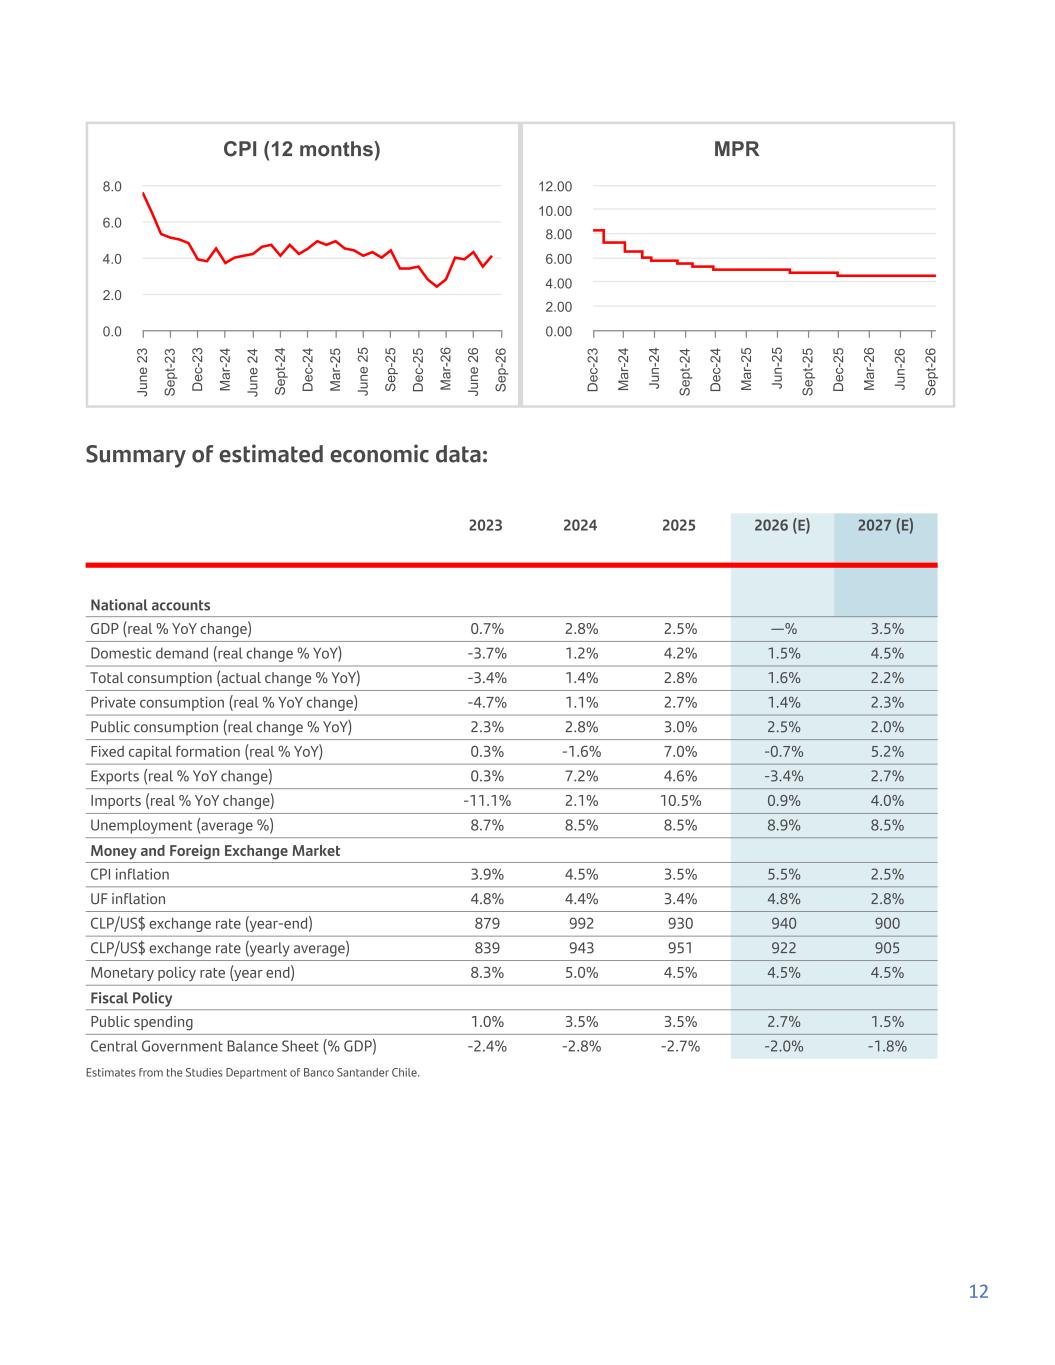
CPI (12 months) Ju ne 2 3 S ep t-2 3 D ec -2 3 M ar -2 4 Ju ne 2 4 S ep t-2 4 D ec -2 4 M ar -2 5 Ju ne 2 5 S ep -2 5 D ec -2 5 M ar -2 6 Ju ne 2 6 S ep -2 6 0.0 2.0 4.0 6.0 8.0 MPR D ec -2 3 M ar -2 4 Ju n- 24 S ep t-2 4 D ec -2 4 M ar -2 5 Ju n- 25 S ep t-2 5 D ec -2 5 M ar -2 6 Ju n- 26 S ep t-2 6 0.00 2.00 4.00 6.00 8.00 10.00 12.00 Summary of estimated economic data: 2023 2024 2025 2026 (E) 2027 (E) National accounts GDP (real % YoY change) 0.7% 2.8% 2.5% —% 3.5% Domestic demand (real change % YoY) -3.7% 1.2% 4.2% 1.5% 4.5% Total consumption (actual change % YoY) -3.4% 1.4% 2.8% 1.6% 2.2% Private consumption (real % YoY change) -4.7% 1.1% 2.7% 1.4% 2.3% Public consumption (real change % YoY) 2.3% 2.8% 3.0% 2.5% 2.0% Fixed capital formation (real % YoY) 0.3% -1.6% 7.0% -0.7% 5.2% Exports (real % YoY change) 0.3% 7.2% 4.6% -3.4% 2.7% Imports (real % YoY change) -11.1% 2.1% 10.5% 0.9% 4.0% Unemployment (average %) 8.7% 8.5% 8.5% 8.9% 8.5% Money and Foreign Exchange Market CPI inflation 3.9% 4.5% 3.5% 5.5% 2.5% UF inflation 4.8% 4.4% 3.4% 4.8% 2.8% CLP/US$ exchange rate (year-end) 879 992 930 940 900 CLP/US$ exchange rate (yearly average) 839 943 951 922 905 Monetary policy rate (year end) 8.3% 5.0% 4.5% 4.5% 4.5% Fiscal Policy Public spending 1.0% 3.5% 3.5% 2.7% 1.5% Central Government Balance Sheet (% GDP) -2.4% -2.8% -2.7% -2.0% -1.8% Estimates from the Studies Department of Banco Santander Chile. 12
Advances in Risk-Weighted Asset (RWA) models The implementation of Basel III in Chile continues to progress through adjustments to Risk-Weighted Asset (RWA) models, focusing on market risk and credit risk. These changes aim to ensure that capital requirements more accurately reflect the risks assumed by banks, bringing local regulations closer to international standards and improving comparability with other jurisdictions. Regarding market risk, on September 11, 2026, the CMF published the final regulation incorporating the duration method as an alternative for measuring overall interest rate risk in determining Market Risk-Weighted Assets (MRWA). This approach allows for a more accurate capture of the sensitivity of positions to interest rate movements. Its adoption is voluntary and requires CMF approval, for which entities must demonstrate proper implementation through methodological, control, and internal validation documentation. According to previous CMF estimates, this modification would reduce the system's MRWA by approximately 36%. Additionally, the regulation continues to advance in defining criteria for the exclusion and offsetting of derivatives positions, with the aim of better reflecting the effects of hedging in the calculation of MRWA. Regarding credit risk, in August the CMF launched a public consultation on a new regulatory framework that consolidates and refines the requirements for adopting internal models for calculating provisions and risk- weighted assets. The proposal includes foundational and advanced methodologies. It also requires that the initial application cover at least 20% of modelable exposures and establishes a five-year timeframe for achieving full coverage, meaning its implementation would be phased in. Law of National Reconstruction and Economic and Social Development On October 17, 2026, Law No. 21,850 on National Reconstruction and Economic and Social Development was published, with measures to be implemented gradually between November 2026 and 2029. Among its main components is a tax agenda aimed at strengthening investment, improving competitiveness, and supporting economic recovery. The law includes a gradual reduction of the First Category Tax rate from 27% to 25.5% in 2027, 24% in 2028, and 23% from 2029 onward. Furthermore, starting in 2027, the tax system will be fully restructured, simplifying the tax structure, reducing the cost of capital, and increasing incentives for private investment. Furthermore, starting December 1, 2026, and for a period of twelve months, the first sale of new homes with final municipal approval will be exempt from VAT. This measure aims to accelerate the absorption of available housing stock, stimulate the real estate and construction sectors, and facilitate access to housing. Additionally, the law includes incentives for formal employment, investment benefits, property tax exemptions for senior citizens, and the creation of a special fund for the reconstruction of areas affected by wildfires. Mortgage Subsidy Law On May 20, 2025, Congress approved the Mortgage Subsidy Law to facilitate access to homeownership and revitalize the real estate market. This initiative includes a subsidy of up to 60 basis points on mortgage interest rates. Furthermore, it is backed by a state guarantee from the Special Guarantee Fund (FOGAES) that covers up to 60% of the property value, which could further reduce the total interest rate by up to 100 basis points. 13
The project aimed to provide 50,000 subsidies, 10% of which were earmarked for first-time homebuyers valued up to 3,000 UF (Unidades de Fomento, a Chilean unit of account) and the remaining percentage for new homes valued up to 4,000 UF. In 2026, the program was expanded, increasing the number of available subsidies from 50,000 to 80,000 and raising the maximum value of eligible homes from 4,000 UF to 6,000 UF. To date, this program has been a significant factor in supporting the demand for mortgage loans. According to ABIF (Chilean Banking Association), as of September 25, 2026, 113,781 eligible applications had been received and commercially approved, and more than 33,033 mortgages had been processed. Pension Reform On January 29, 2025, Congress approved the pension reform after a lengthy process of considering various proposals. The main objective is to increase future and current pensions, taking into account the following changes. Pension contributions will increase by 7%, paid by employers, starting at 1% in August 2025 and gradually increasing over a period of 9 to 11 years. Of the total percentage, 6% will go to direct, deferred individual capitalization, and 1% to the new Social Security system, which will also include the current 1.5% allocated to Disability and Survivors' Insurance. These resources will allow for equal pensions for men and women in similar circumstances at the time of retirement. The reform also includes changes to the pension fund structure. The multi-fund system will be replaced by generational funds, and new administrators will be allowed to enter the system. A 10% share of the existing pension fund will be put out to tender every two years to increase competition. In addition, the reform proposes increasing the Guaranteed Universal Pension (PGU) to $250,000 pesos for the 90% of the most vulnerable population. More than a year after the law's enactment, the implementation of the pension reform continues to progress gradually according to the legal timeline. Significant milestones have been reached during 2026, such as the launch of the Single Contribution Collection System (SUCC), the commencement of pre-litigation collection by the General Treasury of the Republic, and the implementation of the new Social Security contributions. Furthermore, a new phase of increased employer contributions began in August, while in September the Guaranteed Universal Pension (PGU) for individuals aged 75 and over increased. Several operational measures have already been implemented. Among these, mandates have already been awarded for the administration of the autonomous pension protection funds (FAPP), and the publication of the Investment Regime for Generational Funds defines the investment structure, risk limits, and benchmark portfolios of the funds that will replace the multi-funds starting in April 2027. Beyond the details, it is commendable that the reform allows for a gradual recovery of pension savings levels. This is beneficial not only for financing future pensions but also for the capital market, even though the final impact will depend on the implementation of the new investment rules of the new system. 14
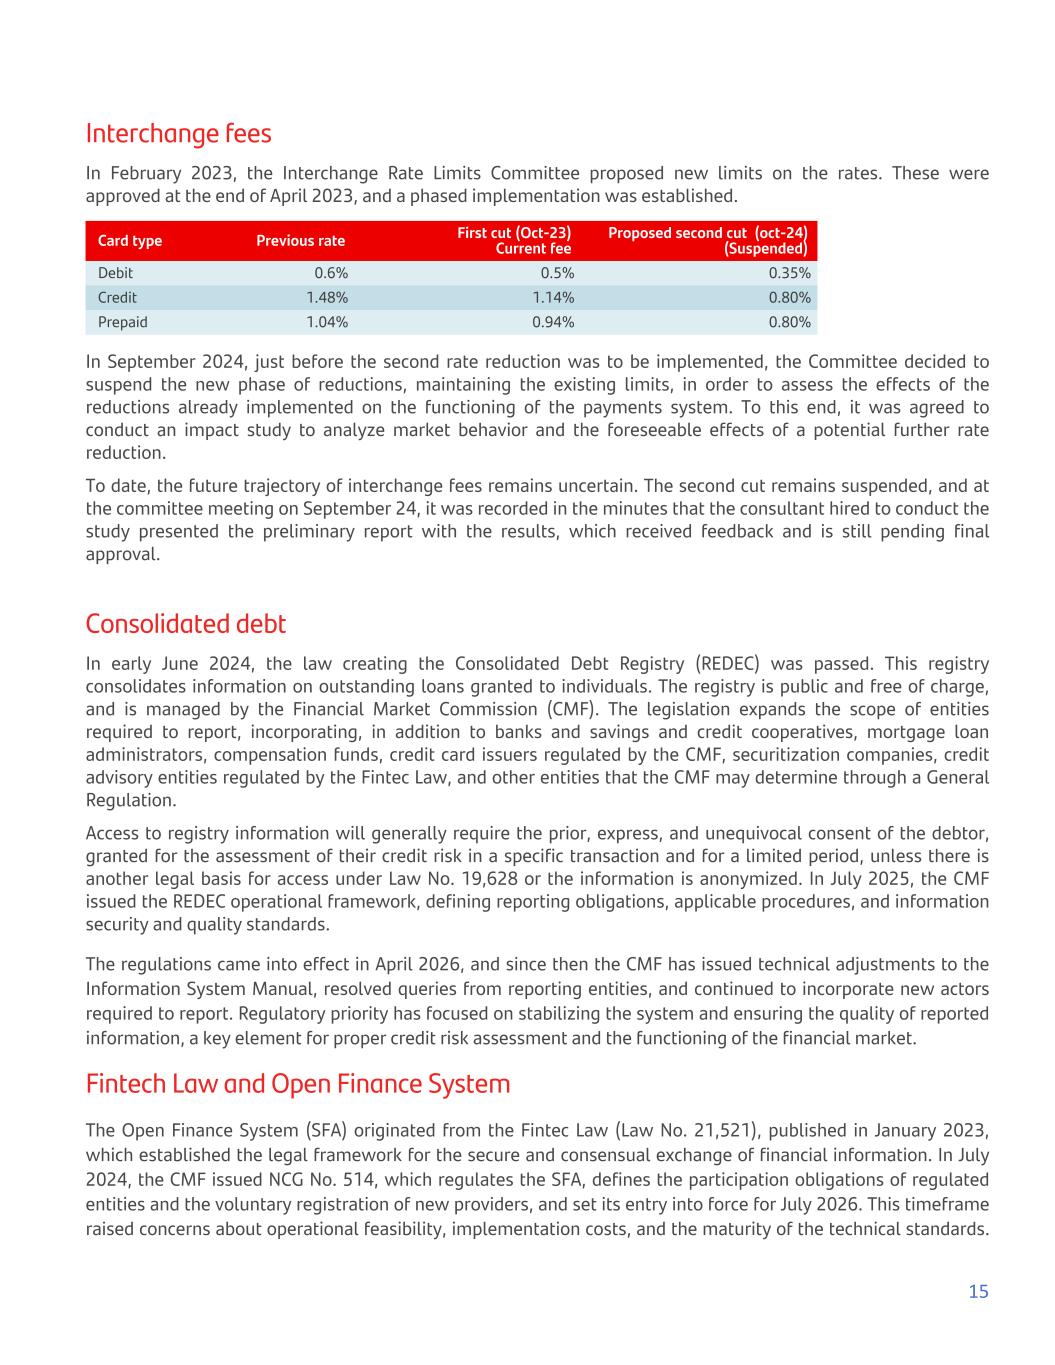
Interchange fees In February 2023, the Interchange Rate Limits Committee proposed new limits on the rates. These were approved at the end of April 2023, and a phased implementation was established. Card type Previous rate First cut (Oct-23) Current fee Proposed second cut (oct-24) (Suspended) Debit 0.6% 0.5% 0.35% Credit 1.48% 1.14% 0.80% Prepaid 1.04% 0.94% 0.80% In September 2024, just before the second rate reduction was to be implemented, the Committee decided to suspend the new phase of reductions, maintaining the existing limits, in order to assess the effects of the reductions already implemented on the functioning of the payments system. To this end, it was agreed to conduct an impact study to analyze market behavior and the foreseeable effects of a potential further rate reduction. To date, the future trajectory of interchange fees remains uncertain. The second cut remains suspended, and at the committee meeting on September 24, it was recorded in the minutes that the consultant hired to conduct the study presented the preliminary report with the results, which received feedback and is still pending final approval. Consolidated debt In early June 2024, the law creating the Consolidated Debt Registry (REDEC) was passed. This registry consolidates information on outstanding loans granted to individuals. The registry is public and free of charge, and is managed by the Financial Market Commission (CMF). The legislation expands the scope of entities required to report, incorporating, in addition to banks and savings and credit cooperatives, mortgage loan administrators, compensation funds, credit card issuers regulated by the CMF, securitization companies, credit advisory entities regulated by the Fintec Law, and other entities that the CMF may determine through a General Regulation. Access to registry information will generally require the prior, express, and unequivocal consent of the debtor, granted for the assessment of their credit risk in a specific transaction and for a limited period, unless there is another legal basis for access under Law No. 19,628 or the information is anonymized. In July 2025, the CMF issued the REDEC operational framework, defining reporting obligations, applicable procedures, and information security and quality standards. The regulations came into effect in April 2026, and since then the CMF has issued technical adjustments to the Information System Manual, resolved queries from reporting entities, and continued to incorporate new actors required to report. Regulatory priority has focused on stabilizing the system and ensuring the quality of reported information, a key element for proper credit risk assessment and the functioning of the financial market. Fintech Law and Open Finance System The Open Finance System (SFA) originated from the Fintec Law (Law No. 21,521), published in January 2023, which established the legal framework for the secure and consensual exchange of financial information. In July 2024, the CMF issued NCG No. 514, which regulates the SFA, defines the participation obligations of regulated entities and the voluntary registration of new providers, and set its entry into force for July 2026. This timeframe raised concerns about operational feasibility, implementation costs, and the maturity of the technical standards. 15
Therefore, between July 2025 and February 2026, the CMF conducted three public consultations to adjust the schedule and detail the system's technological standards, including payment initiation. The main recent milestone was the issuance of the final standard NCG No. 569, which contains the technical specifications for system interoperability and introduces a series of adjustments aimed at facilitating a gradual and secure implementation of the SFA. These include postponing the effective date until July 2027, incorporating a pilot period for controlled testing among participants, establishing a technological sandbox managed by the CMF, creating simplified participation mechanisms for smaller entities, and standardizing procedures to reduce operational friction. Despite these advances, key regulatory aspects remain to be defined, including the cost-sharing model between entities that provide information and those that consume it. In this context, the SFA remains a regulatory project under development, and its final design will be crucial in assessing its impact on competition, innovation, and compliance costs for financial institutions in Chile. In this context, in December 2025, the Central Bank authorized a local fintech company to operate a low-value payment clearinghouse, enabling potential future changes in the functioning of the payments market. Personal Data Protection Law In December 2024, a law was published modernizing the protection and processing of personal data in Chile, establishing a regulatory framework aligned with international standards such as those of the European Union. The legislation creates the Personal Data Protection Agency, the body responsible for overseeing compliance with the law, imposing sanctions, issuing guidelines, and promoting best practices in data processing. The law recognizes new rights for data subjects—access, rectification, erasure, objection, and portability—and establishes relevant obligations for organizations, such as implementing compliance programs, adopting security measures, managing incidents, and appointing a Data Protection Officer. Currently, the law is still scheduled to come into effect on December 1, 2026. However, in September 2026, the Government submitted a bill proposing to postpone its entry into force to December 1, 2027, and strengthen the structure of the Data Protection Agency. As of October 19, 2026, this amendment is still under legislative review, so the current legal date remains December 2026. Guarantee management as credit risk mitigators In July 2026, the Financial Market Commission published Circular No. 2,373, which establishes a new prudential framework for the management, valuation, and recognition of collateral used by banks as credit risk mitigators. The regulation incorporates Chapter 21-10 of the Updated Compilation of Regulations and reinforces the responsibility of the Board of Directors and senior management regarding the policies, controls, and procedures applicable throughout the collateral lifecycle. The circular requires that guarantees be legally valid, enforceable, properly documented, and prudently valued, taking into account their liquidity, execution costs and timeframes, asset volatility, and market conditions. It also establishes obligations for periodic revaluation, traceability, safekeeping, independent monitoring, and recording of amounts actually recovered. Guarantees that do not meet these conditions may be withdrawn to reduce credit exposure, leading to higher provisions and potentially greater capital consumption. 16
Most of the provisions will come into effect on January 1, 2028. However, the changes related to the assessment of the quality of guarantee management by the CMF are effective immediately, so banks must begin adapting their policies, valuation methodologies, information systems, controls and execution processes in advance. Capital Markets Reform On September 9, 2026, the Executive Branch submitted to Congress the Capital Market Reform and Homeownership Financing Bill, which includes more than 30 measures organized into four pillars: access to housing and promotion of savings; financing for companies of different sizes; modernization of financial market regulations and processes; and strengthening Chile as a regional financial center. Among its main measures are the creation of the National Housing Fund (FONAVI), with government contributions of up to US$2 billion, intended to finance mortgage loans for first-time homebuyers up to 6,000 UF (Unidades de Fomento). The bill also includes Voluntary Housing Savings (AVV), which supplements down payment savings with a government subsidy; the creation of a Junior Segment on the Stock Exchange for emerging and mining exploration companies; and tax adjustments to financial instruments. On October 27, the Chamber of Deputies approved the bill, which now begins its second constitutional review in the Senate. Regulation and supervision In Chile, only banks can maintain checking accounts for their clients, conduct foreign trade operations, and, along with regulated non-bank financial institutions such as cooperatives, accept time deposits. The main authorities regulating financial institutions in Chile are the Financial Market Commission (CMF) and the Central Bank. Chilean banks are primarily subject to the General Banking Law and, secondarily, to the extent that it is not incompatible with this law, to the provisions of the Chilean Corporations Law governing corporations, except for certain provisions that expressly exclude them. For more information on the regulation and supervision of our Bank, please see Item 4. Information on the Company, Regulation and Supervision in our 20F here. For more information on the General Banking Law, click here. For more information about the CMF, please visit the following website: www.cmfchile.cl For more information about the Central Bank, please visit the following website: www.bcentral.cl 17
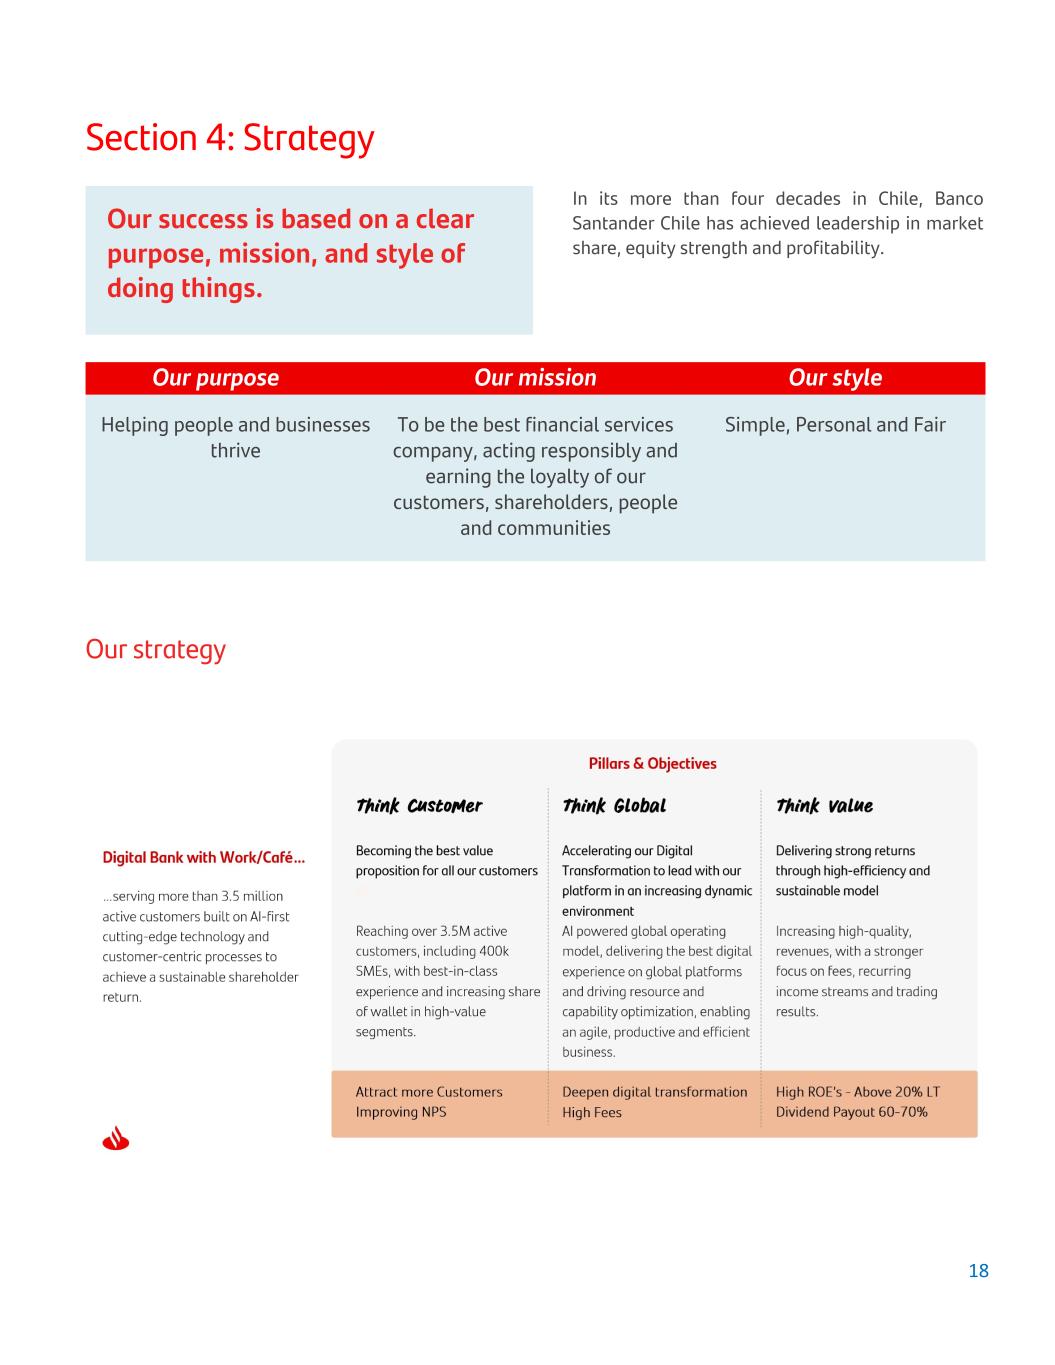
Section 4: Strategy In its more than four decades in Chile, Banco Santander Chile has achieved leadership in market share, equity strength and profitability. Our success is based on a clear purpose, mission, and style of doing things. Our purpose Our mission Our style Helping people and businesses thrive To be the best financial services company, acting responsibly and earning the loyalty of our customers, shareholders, people and communities Simple, Personal and Fair Our strategy 18
Responsible banking Santander's Responsible Banking and Sustainability approach seeks to create long-term value for all its stakeholders. To achieve this, it identifies and manages the impacts, risks, and opportunities associated with its activities, strengthening positive contributions and business opportunities while reducing negative impacts and potential risks. This approach encompasses environmental, social, and corporate governance matters related to employees, customers, suppliers, shareholders, investors, communities, and other stakeholders. It is based on Santander Chile's internal governance, its risk management framework, and its corporate policies. Principles of Responsible Banking Santander's Responsible Banking and Sustainability Policy principles are aligned with international standards and agreements, including the Equator Principles, the United Nations Global Compact, and the Sustainable Development Goals. These principles are as follows: • Customer focus • Contribution to global challenges • Coordinated approach to Responsible Banking and Sustainability • Board Participation • Employee participation • Dialogue with stakeholders • Monitoring and transparency. Sustainability-related objectives The commitment to sustainability is represented through the following objectives set out in the organization's 2025–2030 roadmap, deepening its commitment to decarbonizing the portfolio by 2030 and evolving the measurement of community investment towards a social impact model based on the pillars of Education, Employability and Entrepreneurship. In this way, the value creation model integrates financial, operational and human capabilities with the management of risks and opportunities in the current environment, supporting profitable growth and fostering lasting trust among its stakeholders. More information about our progress in sustainability can be found in our annual integrated report. 19
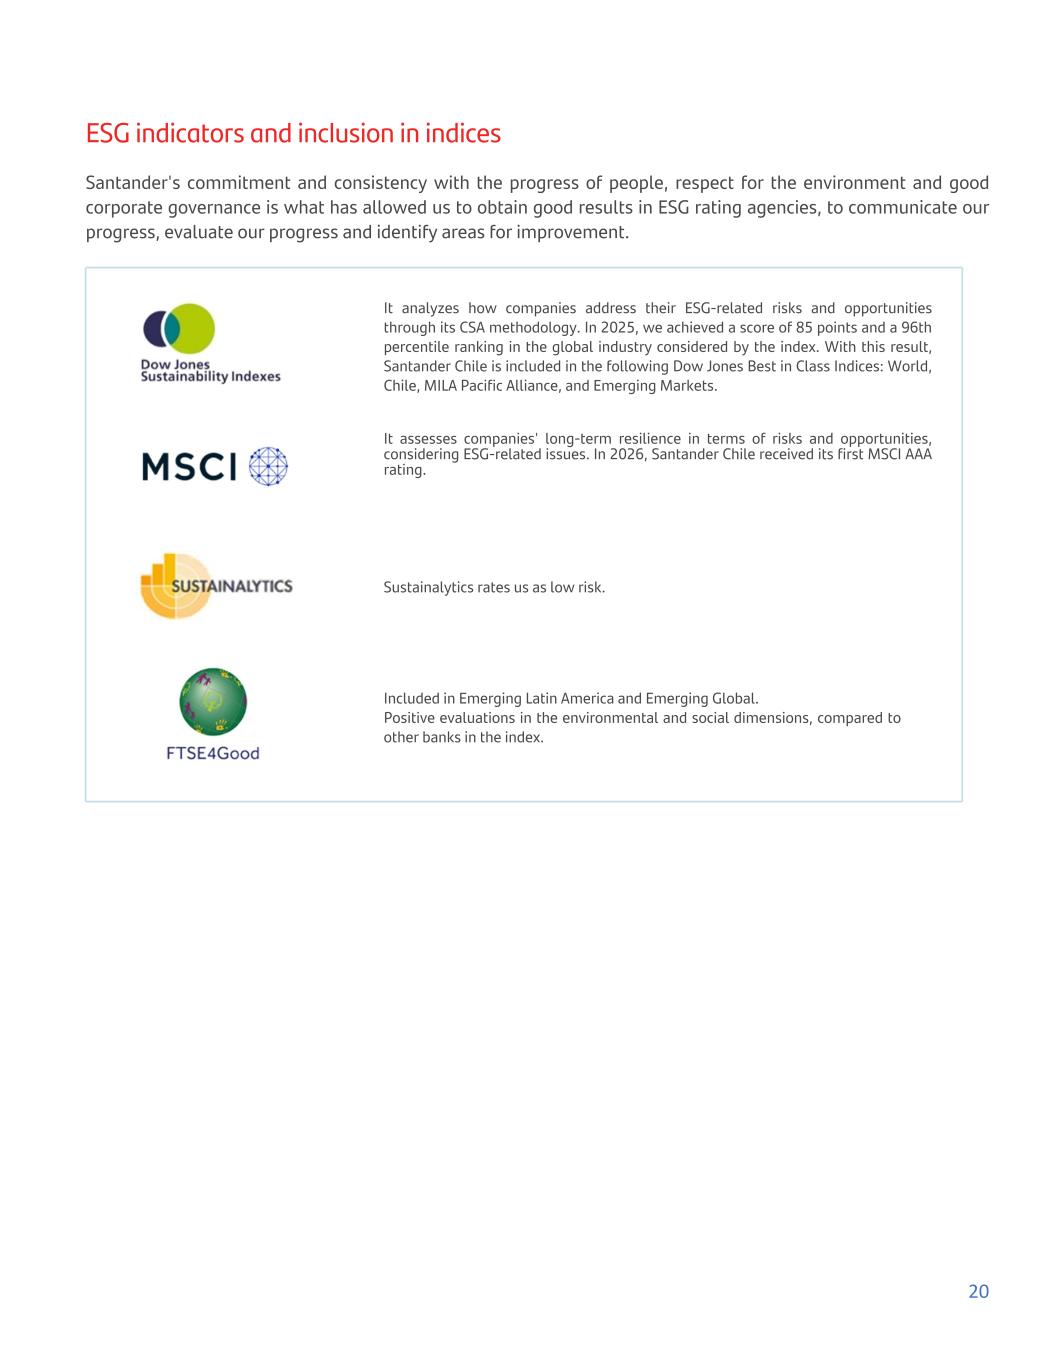
ESG indicators and inclusion in indices Santander's commitment and consistency with the progress of people, respect for the environment and good corporate governance is what has allowed us to obtain good results in ESG rating agencies, to communicate our progress, evaluate our progress and identify areas for improvement. It analyzes how companies address their ESG-related risks and opportunities through its CSA methodology. In 2025, we achieved a score of 85 points and a 96th percentile ranking in the global industry considered by the index. With this result, Santander Chile is included in the following Dow Jones Best in Class Indices: World, Chile, MILA Pacific Alliance, and Emerging Markets. It assesses companies' long-term resilience in terms of risks and opportunities, considering ESG-related issues. In 2026, Santander Chile received its first MSCI AAA rating. Sustainalytics rates us as low risk. Included in Emerging Latin America and Emerging Global. Positive evaluations in the environmental and social dimensions, compared to other banks in the index. 20
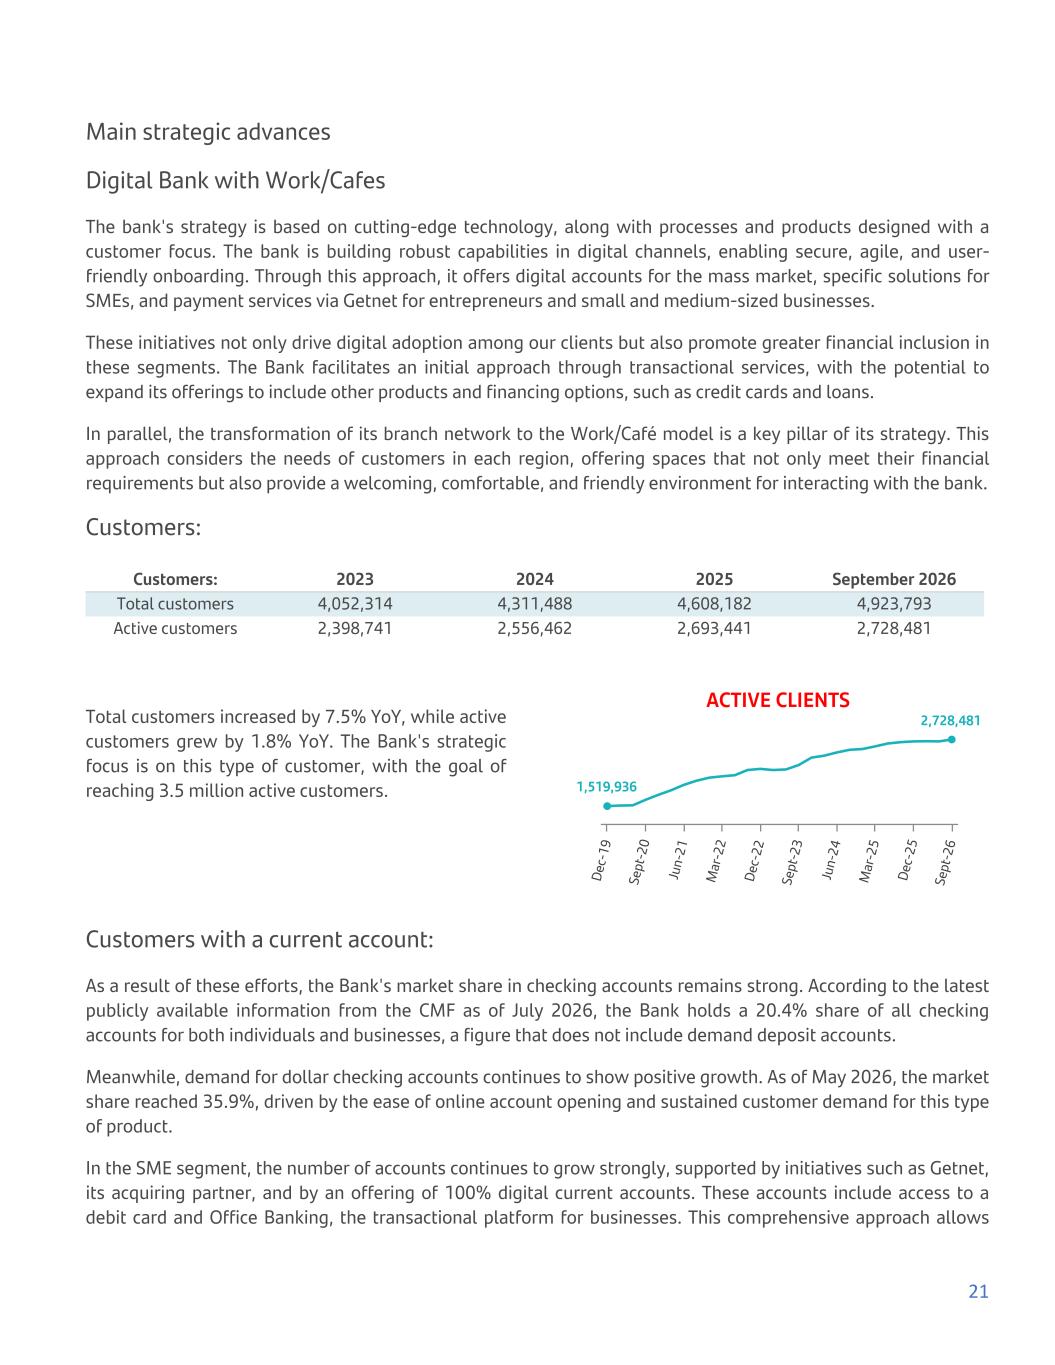
Main strategic advances Digital Bank with Work/Cafes The bank's strategy is based on cutting-edge technology, along with processes and products designed with a customer focus. The bank is building robust capabilities in digital channels, enabling secure, agile, and user- friendly onboarding. Through this approach, it offers digital accounts for the mass market, specific solutions for SMEs, and payment services via Getnet for entrepreneurs and small and medium-sized businesses. These initiatives not only drive digital adoption among our clients but also promote greater financial inclusion in these segments. The Bank facilitates an initial approach through transactional services, with the potential to expand its offerings to include other products and financing options, such as credit cards and loans. In parallel, the transformation of its branch network to the Work/Café model is a key pillar of its strategy. This approach considers the needs of customers in each region, offering spaces that not only meet their financial requirements but also provide a welcoming, comfortable, and friendly environment for interacting with the bank. Customers: Customers: 2023 2024 2025 September 2026 Total customers 4,052,314 4,311,488 4,608,182 4,923,793 Active customers 2,398,741 2,556,462 2,693,441 2,728,481 Total customers increased by 7.5% YoY, while active customers grew by 1.8% YoY. The Bank's strategic focus is on this type of customer, with the goal of reaching 3.5 million active customers. ACTIVE CLIENTS 1,519,936 2,728,481 De c- 19 Se pt -2 0 Ju n- 21 M ar -2 2 De c- 22 Se pt -2 3 Ju n- 24 M ar -2 5 De c- 25 Se pt -2 6 Customers with a current account: As a result of these efforts, the Bank's market share in checking accounts remains strong. According to the latest publicly available information from the CMF as of July 2026, the Bank holds a 20.4% share of all checking accounts for both individuals and businesses, a figure that does not include demand deposit accounts. Meanwhile, demand for dollar checking accounts continues to show positive growth. As of May 2026, the market share reached 35.9%, driven by the ease of online account opening and sustained customer demand for this type of product. In the SME segment, the number of accounts continues to grow strongly, supported by initiatives such as Getnet, its acquiring partner, and by an offering of 100% digital current accounts. These accounts include access to a debit card and Office Banking, the transactional platform for businesses. This comprehensive approach allows 21
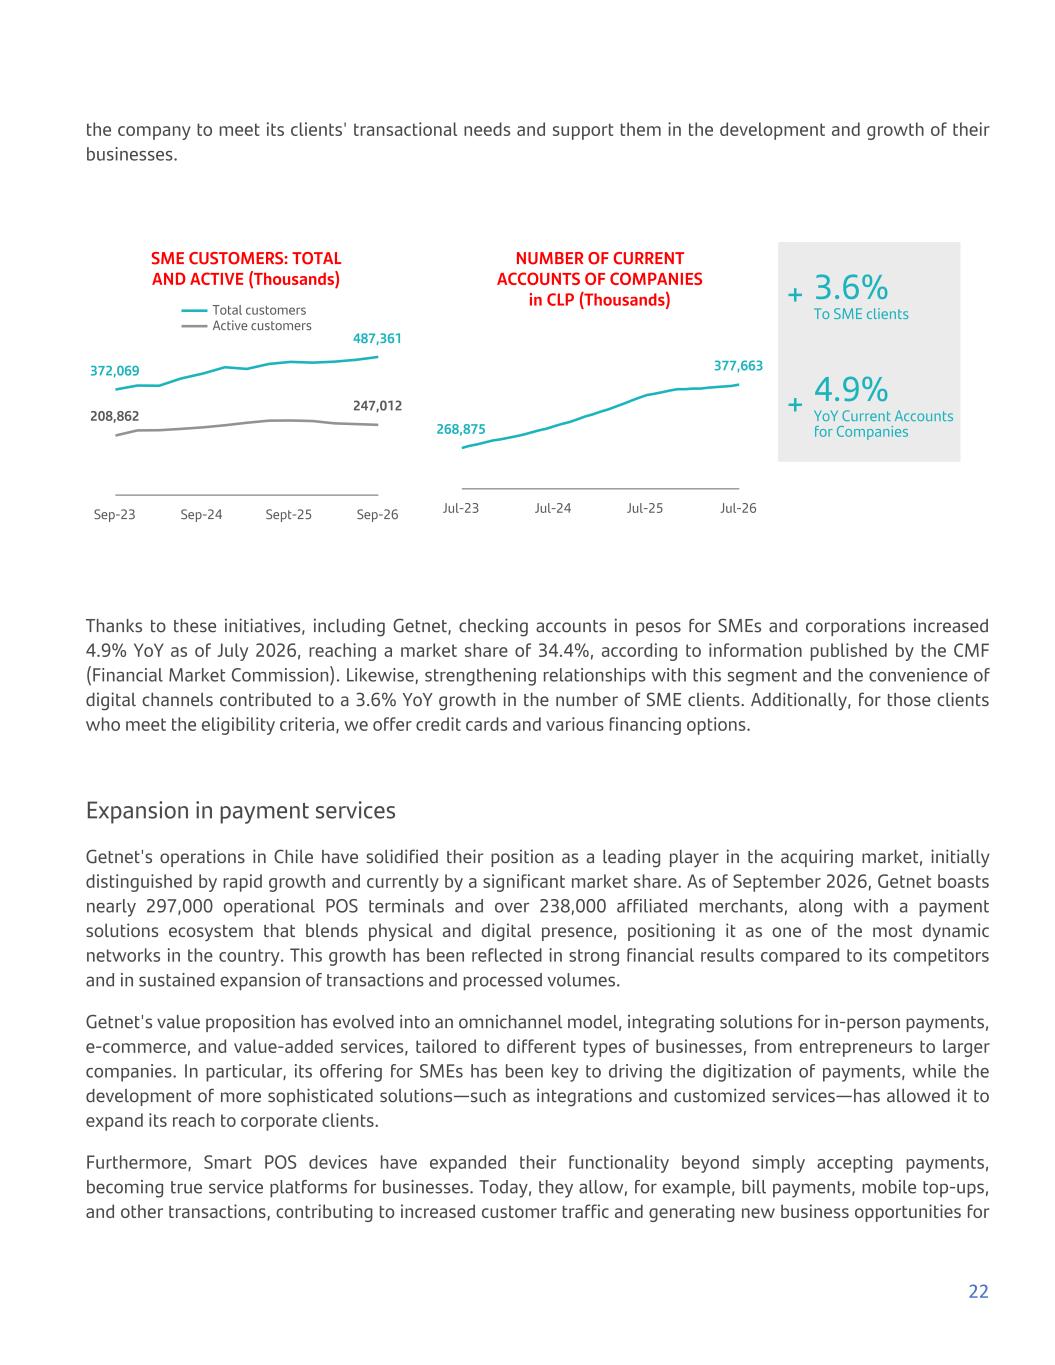
the company to meet its clients' transactional needs and support them in the development and growth of their businesses. SME CUSTOMERS: TOTAL AND ACTIVE (Thousands) 372,069 487,361 208,862 247,012 Total customers Active customers Sep-23 Sep-24 Sept-25 Sep-26 NUMBER OF CURRENT ACCOUNTS OF COMPANIES in CLP (Thousands) 268,875 377,663 Jul-23 Jul-24 Jul-25 Jul-26 + 3.6% To SME clients + 4.9% YoY Current Accounts for Companies Thanks to these initiatives, including Getnet, checking accounts in pesos for SMEs and corporations increased 4.9% YoY as of July 2026, reaching a market share of 34.4%, according to information published by the CMF (Financial Market Commission). Likewise, strengthening relationships with this segment and the convenience of digital channels contributed to a 3.6% YoY growth in the number of SME clients. Additionally, for those clients who meet the eligibility criteria, we offer credit cards and various financing options. Expansion in payment services Getnet's operations in Chile have solidified their position as a leading player in the acquiring market, initially distinguished by rapid growth and currently by a significant market share. As of September 2026, Getnet boasts nearly 297,000 operational POS terminals and over 238,000 affiliated merchants, along with a payment solutions ecosystem that blends physical and digital presence, positioning it as one of the most dynamic networks in the country. This growth has been reflected in strong financial results compared to its competitors and in sustained expansion of transactions and processed volumes. Getnet's value proposition has evolved into an omnichannel model, integrating solutions for in-person payments, e-commerce, and value-added services, tailored to different types of businesses, from entrepreneurs to larger companies. In particular, its offering for SMEs has been key to driving the digitization of payments, while the development of more sophisticated solutions—such as integrations and customized services—has allowed it to expand its reach to corporate clients. Furthermore, Smart POS devices have expanded their functionality beyond simply accepting payments, becoming true service platforms for businesses. Today, they allow, for example, bill payments, mobile top-ups, and other transactions, contributing to increased customer traffic and generating new business opportunities for 22
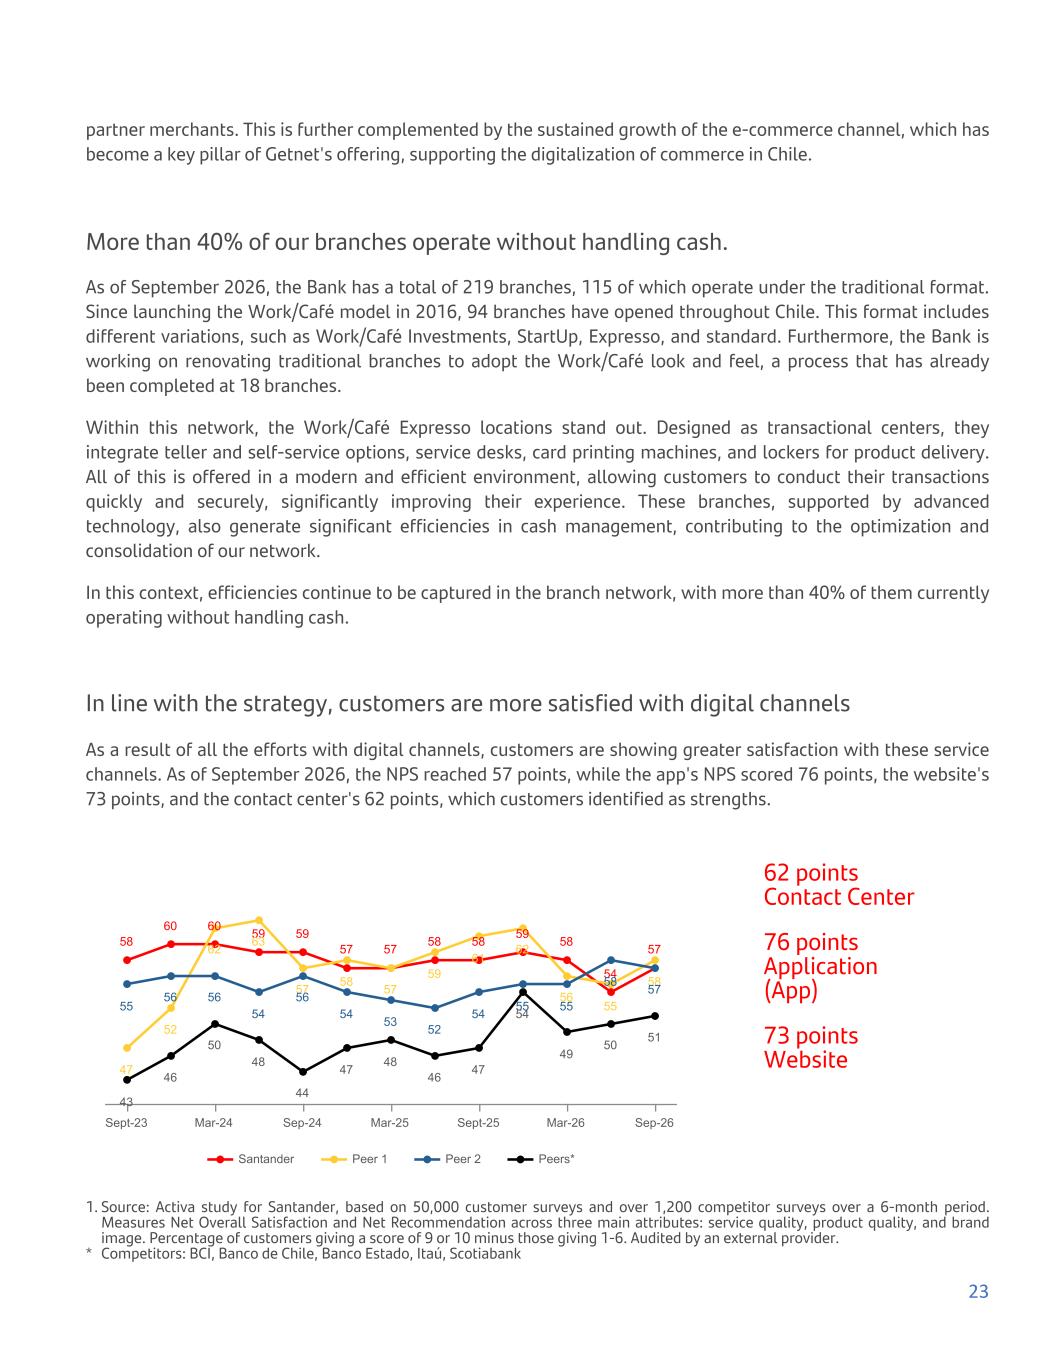
partner merchants. This is further complemented by the sustained growth of the e-commerce channel, which has become a key pillar of Getnet's offering, supporting the digitalization of commerce in Chile. More than 40% of our branches operate without handling cash. As of September 2026, the Bank has a total of 219 branches, 115 of which operate under the traditional format. Since launching the Work/Café model in 2016, 94 branches have opened throughout Chile. This format includes different variations, such as Work/Café Investments, StartUp, Expresso, and standard. Furthermore, the Bank is working on renovating traditional branches to adopt the Work/Café look and feel, a process that has already been completed at 18 branches. Within this network, the Work/Café Expresso locations stand out. Designed as transactional centers, they integrate teller and self-service options, service desks, card printing machines, and lockers for product delivery. All of this is offered in a modern and efficient environment, allowing customers to conduct their transactions quickly and securely, significantly improving their experience. These branches, supported by advanced technology, also generate significant efficiencies in cash management, contributing to the optimization and consolidation of our network. In this context, efficiencies continue to be captured in the branch network, with more than 40% of them currently operating without handling cash. In line with the strategy, customers are more satisfied with digital channels As a result of all the efforts with digital channels, customers are showing greater satisfaction with these service channels. As of September 2026, the NPS reached 57 points, while the app's NPS scored 76 points, the website's 73 points, and the contact center's 62 points, which customers identified as strengths. 58 60 60 59 59 57 57 58 58 59 58 54 57 47 52 62 63 57 58 57 59 61 62 56 55 58 55 56 56 54 56 54 53 52 54 55 55 58 57 43 46 50 48 44 47 48 46 47 54 49 50 51 Santander Peer 1 Peer 2 Peers* Sept-23 Mar-24 Sep-24 Mar-25 Sept-25 Mar-26 Sep-26 62 points Contact Center 76 points Application (App) 73 points Website 1. Source: Activa study for Santander, based on 50,000 customer surveys and over 1,200 competitor surveys over a 6-month period. Measures Net Overall Satisfaction and Net Recommendation across three main attributes: service quality, product quality, and brand image. Percentage of customers giving a score of 9 or 10 minus those giving 1-6. Audited by an external provider. * Competitors: BCI, Banco de Chile, Banco Estado, Itaú, Scotiabank 23
Awards • Obtaining the highest rating in the MSCI classification (AAA). • Global Finance: We are among the top 5 safest banks in Latin America in 2026. • Euromoney: Best Bank in Chile, Best Bank for ESG and Best Bank for SMEs in 2026. • Top Employer Certification January 2026 (eighth consecutive year). • Best annual report of the MSCI nuam Index (Chile, Peru and Colombia) by Corp. Report. Corporate governance For more information on corporate governance, Board of Directors and organizational structure, please see the Corporate Governance section of the website. Latest events Further information on the Bank's latest developments can be found in notes 5 and 49 to the financial statements. It is worth noting that in March, Claudio Melandri Hinojosa resigned from his position as director and president of Banco Santander Chile. Rodrigo Vergara Montes, formerly vice-president of the board, assumed this role. At the shareholders' meeting on April 28, there were elections for the board of directors, where the following directors were elected/ratified: Rodrigo Vergara Montes (President), José Félix de Vicente Mingo (Vice-President), María Francisca Yánez Castillo, Orlando Poblete Iturrate, Gloria Hutt Hesse, Blanca Bustamante Bravo, Juan Benavides Feliú, José Francisco Doncel Tazola, Mónica López-Monis Gallego, Juan Pedro Santa María Pérez, Alfonso Gómez Morales. At the regular meeting of the Board of Directors on September 22, 2026, it was agreed to appoint Javier Maldonado Trinchant as alternate director to replace Alfonso Gómez Morales who submitted his resignation on September 10, 2026. During the year, Angel Garcia, formerly the Cards Manager, has taken on Getnet and Payments responsibilities. Nicolas Besa also assumed the role of VP of Technology and Operations. Previously, he was Director of Strategy and Transformation at Santander Spain and held various leadership positions at Santander Chile. 24
Section 5: Segment information Segment information is based on the financial information presented to senior management and the Board of Directors. The Bank has aligned segment information consistently with the underlying information used internally for management reporting purposes and with that presented in other public documents of the Bank. Senior management has been determined to be primarily responsible for the Bank's operational decision- making. The Bank's operating segments reflect its organizational and management structures. Senior management reviews internal information on a segment basis to assess performance and allocate resources. As of March 31, 2026, the Bank revised the identification of its operating segments to reflect changes in its internal management structure and in how the Chief Operating Decision Maker (CODM) evaluates performance and allocates resources. Consequently, comparative information has been restated for consistency with the current period's presentation. Management believes this revised presentation provides more relevant information for users of the financial statements. In order to achieve the strategic objectives set by senior management and adapt to changing market conditions, the Bank periodically makes adjustments to its organization. These modifications, in turn, impact, to a greater or lesser extent, how the Bank is managed and administered.This disclosure provides information on how the Bank is managed as of September 30, 2026. Segment descriptions Retail & Commercial Retail This is the bank's largest business line focused on individuals and SMEs. It encompasses non-corporate individual clients from high, middle, and low income segments, as well as SMEs, businesses, and commercial establishments (with annual net sales up to approximately $4 billion). These segments are offered a variety of products and services, including consumer loans, credit cards, mortgages, debit cards, current accounts, savings products (mutual funds, stock brokerage, time deposits), and insurance. In addition, SME clients are offered government-guaranteed loans, leasing, and factoring. The vast majority of these clients are served through our branch network. Commercial This business area focuses on financing clients' economic activities, offering sophisticated services such as cash management, trade finance, and financial advisory services. These services include commercial loans in local and foreign currency, foreign trade credit, leasing, factoring, confirming, and corporate credit lines, among others. Wealth Management & Insurance It encompasses the Investments, Insurance, and Private Banking businesses, also coordinating the distribution of various investment products and services to the other Santander Group divisions in Chile. The Santander Insurance business offers personal and business protection products, including health, life, travel, savings, personal protection, auto, and unemployment insurance, among others. The Private Banking business, Santander Private Bank, serves high-net-worth clients and offers transactional products and services (loans, cards, foreign trade, stock trading) and value-added services such as international investment accounts, structured funds, alternative investment funds, wealth management, and open investment architecture. 25
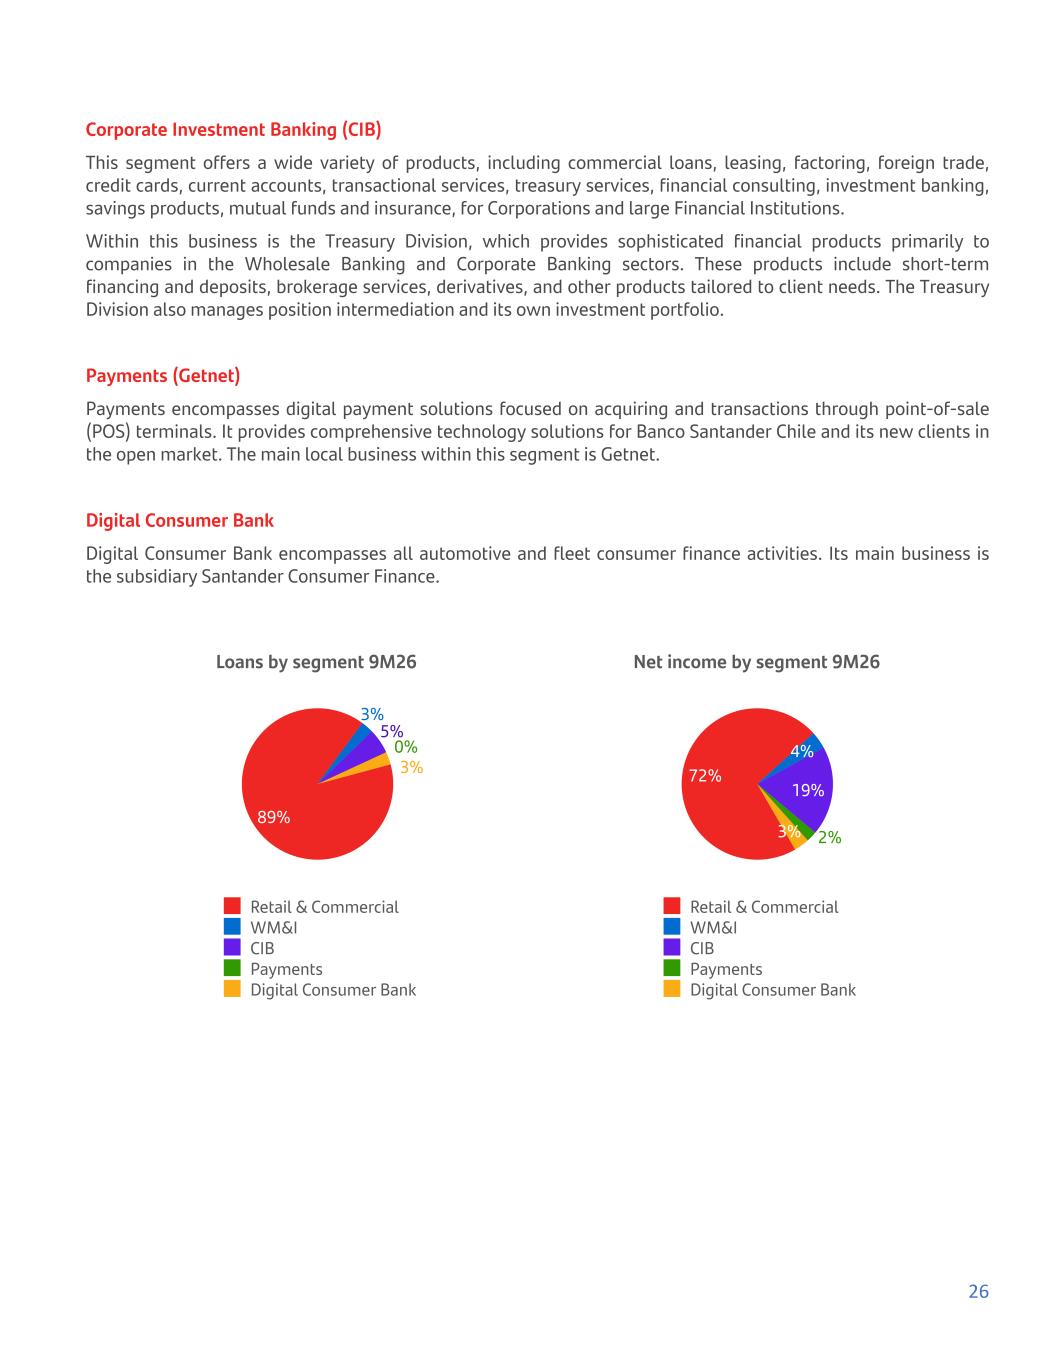
Corporate Investment Banking (CIB) This segment offers a wide variety of products, including commercial loans, leasing, factoring, foreign trade, credit cards, current accounts, transactional services, treasury services, financial consulting, investment banking, savings products, mutual funds and insurance, for Corporations and large Financial Institutions. Within this business is the Treasury Division, which provides sophisticated financial products primarily to companies in the Wholesale Banking and Corporate Banking sectors. These products include short-term financing and deposits, brokerage services, derivatives, and other products tailored to client needs. The Treasury Division also manages position intermediation and its own investment portfolio. Payments (Getnet) Payments encompasses digital payment solutions focused on acquiring and transactions through point-of-sale (POS) terminals. It provides comprehensive technology solutions for Banco Santander Chile and its new clients in the open market. The main local business within this segment is Getnet. Digital Consumer Bank Digital Consumer Bank encompasses all automotive and fleet consumer finance activities. Its main business is the subsidiary Santander Consumer Finance. Loans by segment 9M26 89% 3% 5% 0% 3% Retail & Commercial WM&I CIB Payments Digital Consumer Bank Net income by segment 9M26 72% 4% 19% 2%3% Retail & Commercial WM&I CIB Payments Digital Consumer Bank 26
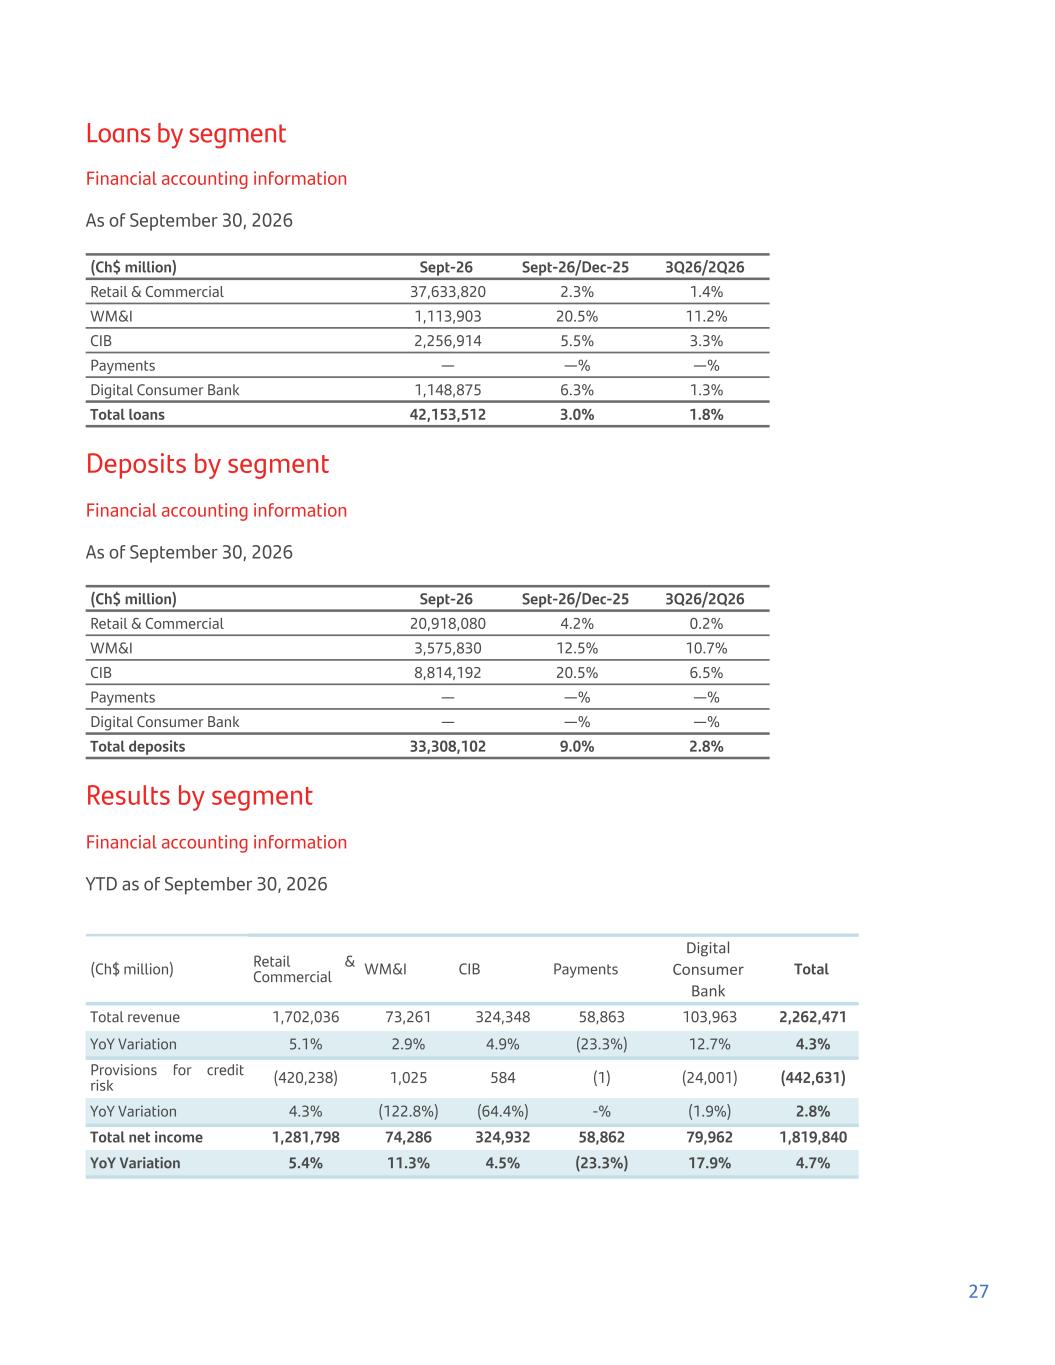
Loans by segment Financial accounting information As of September 30, 2026 (Ch$ million) Sept-26 Sept-26/Dec-25 3Q26/2Q26 Retail & Commercial 37,633,820 2.3% 1.4% WM&I 1,113,903 20.5% 11.2% CIB 2,256,914 5.5% 3.3% Payments — —% —% Digital Consumer Bank 1,148,875 6.3% 1.3% Total loans 42,153,512 3.0% 1.8% Deposits by segment Financial accounting information As of September 30, 2026 (Ch$ million) Sept-26 Sept-26/Dec-25 3Q26/2Q26 Retail & Commercial 20,918,080 4.2% 0.2% WM&I 3,575,830 12.5% 10.7% CIB 8,814,192 20.5% 6.5% Payments — —% —% Digital Consumer Bank — —% —% Total deposits 33,308,102 9.0% 2.8% Results by segment Financial accounting information YTD as of September 30, 2026 (Ch$ million) Retail & Commercial WM&I CIB Payments Digital Consumer Bank Total Total revenue 1,702,036 73,261 324,348 58,863 103,963 2,262,471 YoY Variation 5.1% 2.9% 4.9% (23.3%) 12.7% 4.3% Provisions for credit risk (420,238) 1,025 584 (1) (24,001) (442,631) YoY Variation 4.3% (122.8%) (64.4%) -% (1.9%) 2.8% Total net income 1,281,798 74,286 324,932 58,862 79,962 1,819,840 YoY Variation 5.4% 11.3% 4.5% (23.3%) 17.9% 4.7% 27
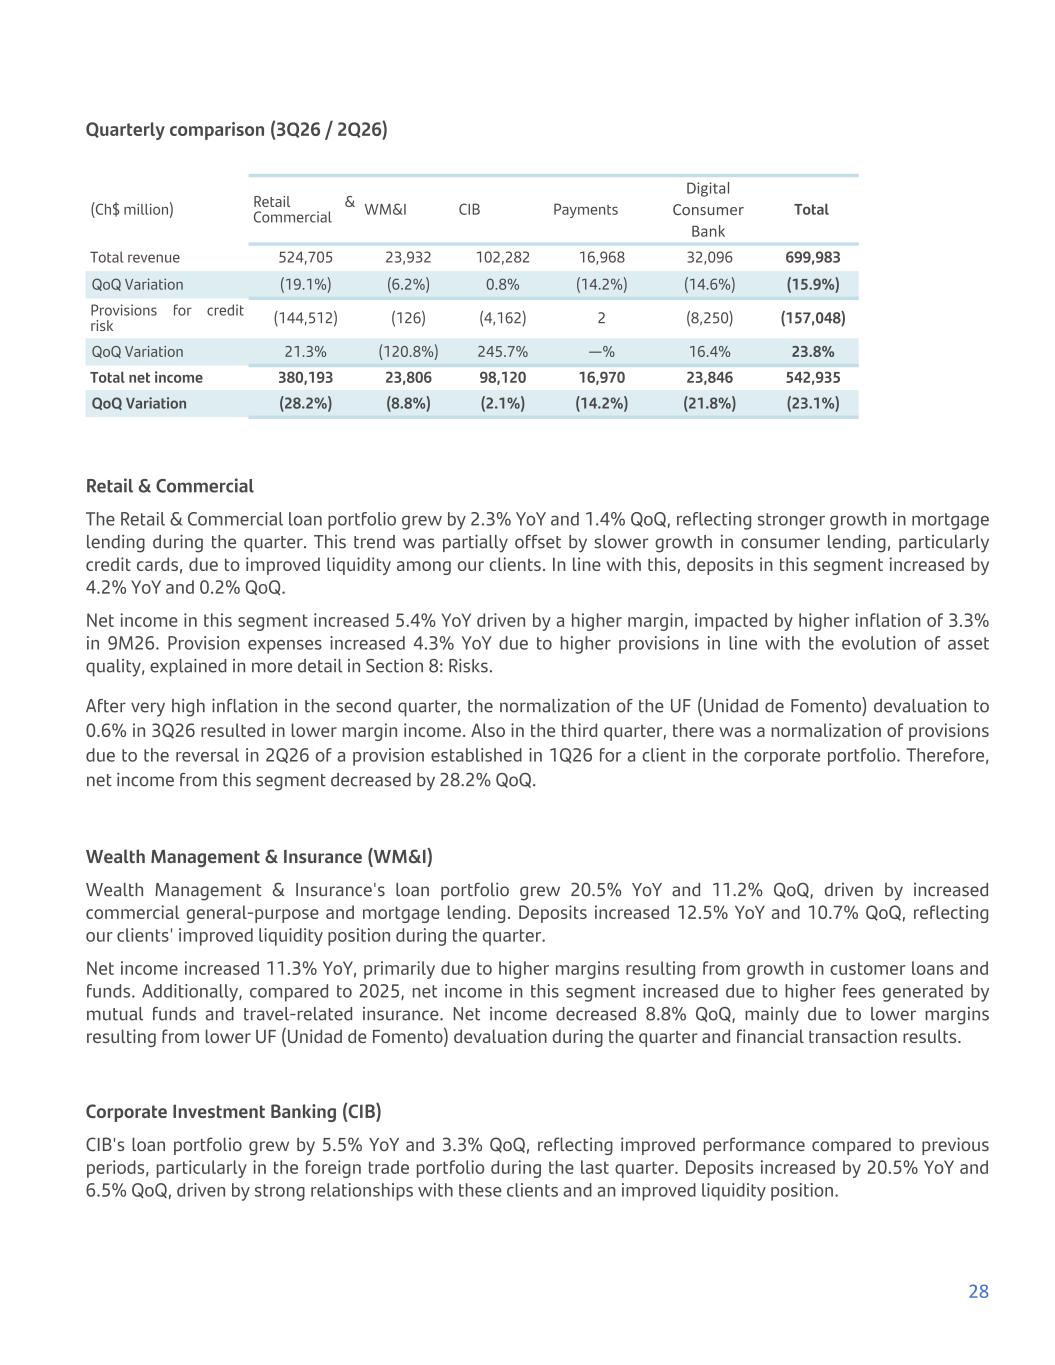
Quarterly comparison (3Q26 / 2Q26) (Ch$ million) Retail & Commercial WM&I CIB Payments Digital Consumer Bank Total Total revenue 524,705 23,932 102,282 16,968 32,096 699,983 QoQ Variation (19.1%) (6.2%) 0.8% (14.2%) (14.6%) (15.9%) Provisions for credit risk (144,512) (126) (4,162) 2 (8,250) (157,048) QoQ Variation 21.3% (120.8%) 245.7% —% 16.4% 23.8% Total net income 380,193 23,806 98,120 16,970 23,846 542,935 QoQ Variation (28.2%) (8.8%) (2.1%) (14.2%) (21.8%) (23.1%) Retail & Commercial The Retail & Commercial loan portfolio grew by 2.3% YoY and 1.4% QoQ, reflecting stronger growth in mortgage lending during the quarter. This trend was partially offset by slower growth in consumer lending, particularly credit cards, due to improved liquidity among our clients. In line with this, deposits in this segment increased by 4.2% YoY and 0.2% QoQ. Net income in this segment increased 5.4% YoY driven by a higher margin, impacted by higher inflation of 3.3% in 9M26. Provision expenses increased 4.3% YoY due to higher provisions in line with the evolution of asset quality, explained in more detail in Section 8: Risks. After very high inflation in the second quarter, the normalization of the UF (Unidad de Fomento) devaluation to 0.6% in 3Q26 resulted in lower margin income. Also in the third quarter, there was a normalization of provisions due to the reversal in 2Q26 of a provision established in 1Q26 for a client in the corporate portfolio. Therefore, net income from this segment decreased by 28.2% QoQ. Wealth Management & Insurance (WM&I) Wealth Management & Insurance's loan portfolio grew 20.5% YoY and 11.2% QoQ, driven by increased commercial general-purpose and mortgage lending. Deposits increased 12.5% YoY and 10.7% QoQ, reflecting our clients' improved liquidity position during the quarter. Net income increased 11.3% YoY, primarily due to higher margins resulting from growth in customer loans and funds. Additionally, compared to 2025, net income in this segment increased due to higher fees generated by mutual funds and travel-related insurance. Net income decreased 8.8% QoQ, mainly due to lower margins resulting from lower UF (Unidad de Fomento) devaluation during the quarter and financial transaction results. Corporate Investment Banking (CIB) CIB's loan portfolio grew by 5.5% YoY and 3.3% QoQ, reflecting improved performance compared to previous periods, particularly in the foreign trade portfolio during the last quarter. Deposits increased by 20.5% YoY and 6.5% QoQ, driven by strong relationships with these clients and an improved liquidity position. 28
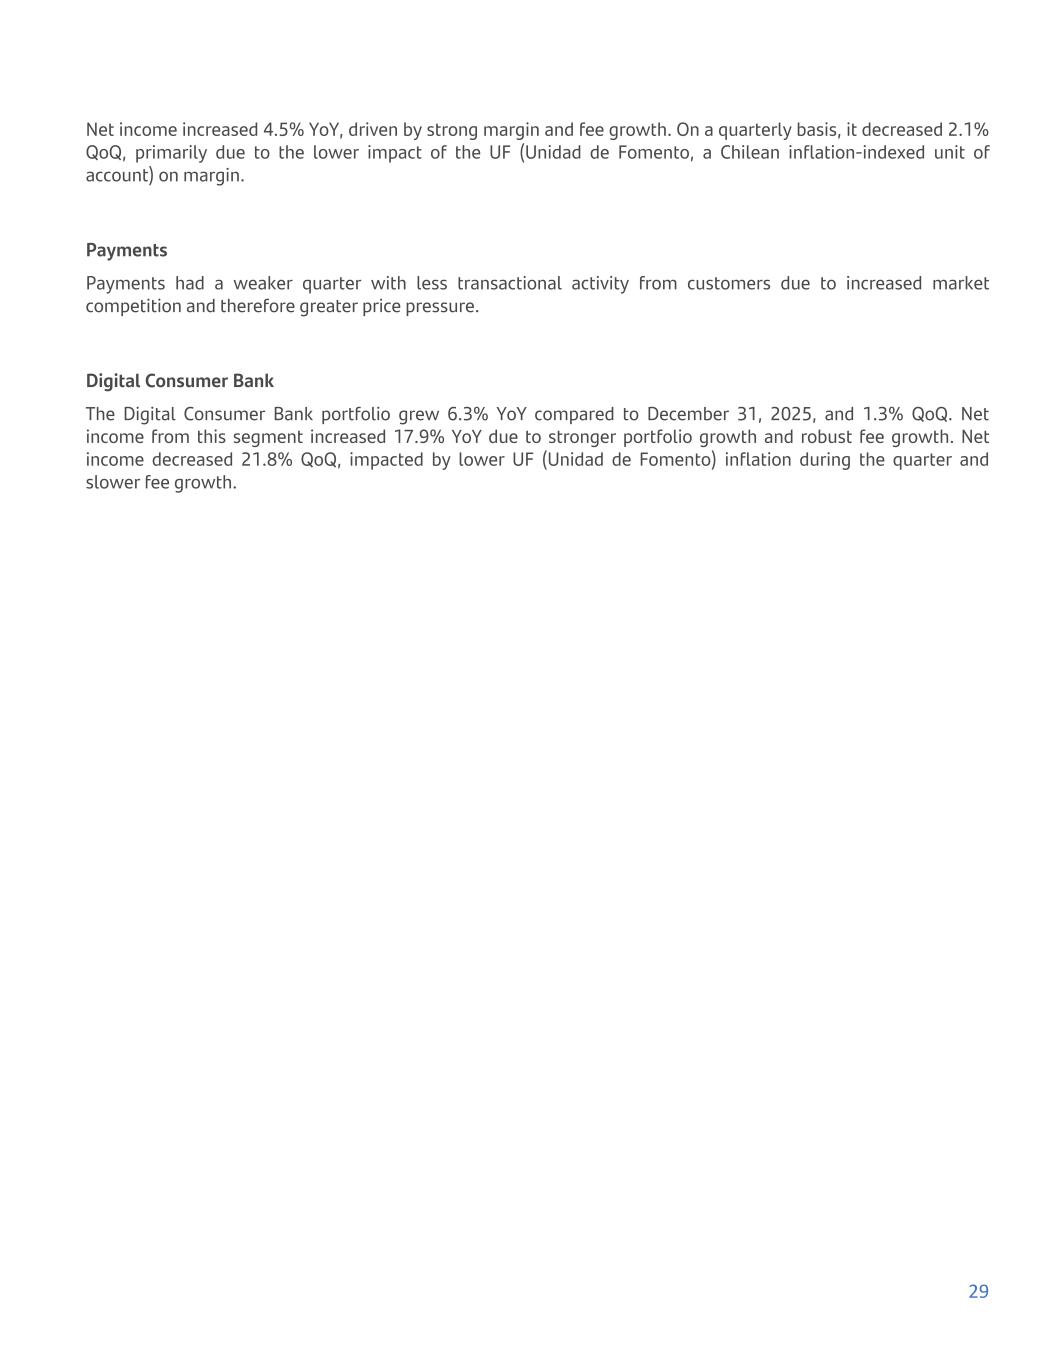
Net income increased 4.5% YoY, driven by strong margin and fee growth. On a quarterly basis, it decreased 2.1% QoQ, primarily due to the lower impact of the UF (Unidad de Fomento, a Chilean inflation-indexed unit of account) on margin. Payments Payments had a weaker quarter with less transactional activity from customers due to increased market competition and therefore greater price pressure. Digital Consumer Bank The Digital Consumer Bank portfolio grew 6.3% YoY compared to December 31, 2025, and 1.3% QoQ. Net income from this segment increased 17.9% YoY due to stronger portfolio growth and robust fee growth. Net income decreased 21.8% QoQ, impacted by lower UF (Unidad de Fomento) inflation during the quarter and slower fee growth. 29
Section 6: Financial Performance Balance sheet Total loans grow 1.8% QoQ, driven by higher demand for loans to large companies Loans by product: Financial accounting information YTD % Change (Ch$ million) Sept-26 Jun-26 Dec-25 Sept-26/ Dec-25 Sept-26/ Jun-26 Consumer loans 6,038,627 6,065,982 6,057,304 (0.3%) (0.5%) Santander Consumer (car loans) 1,148,874 1,125,338 1,080,862 6.3% 2.1% Credit cards 1,960,306 2,030,414 2,061,691 (4.9%) (3.5%) Other consumer loans 2,929,447 2,910,228 2,914,751 0.5% 0.7% Mortgage 17,779,978 17,696,111 17,443,563 1.9% 0.5% Commercial 18,315,178 17,616,970 17,363,835 5.5% 4.0% Interbank 19,729 47,565 68,178 (71.1%) (58.5%) Total(1) 42,153,512 41,426,628 40,932,880 3.0% 1.8% 1. Total loans at amortised cost, gross of provisions. Total loans at amortized cost increased by 3.0% compared to December 31, 2025, and by 1.8% QoQ, driven by growth in commercial, mortgage, and auto loans. In contrast, credit card lending showed less dynamism during the period. Approximately 56% of the loan portfolio is indexed to the UF (Unidad de Fomento, a Chilean inflation-indexed unit of account), given that most mortgage loans and about 33% of commercial loans are denominated in this unit. Additionally, around 23% of commercial loans are denominated in foreign currency, primarily US dollars. Consequently, the performance of these loans has shown some volatility in recent quarters, associated with exchange rate fluctuations. In recent periods, demand for commercial loans remained limited, particularly among large companies. However, during the second and third quarters, incipient signs of recovery began to appear, with growth of 5.5% since December 31, 2025, and 4.0% QoQ. This trend was primarily driven by increased demand for financing for foreign trade loans and the depreciation of the Chilean peso against the US dollar since December 2025. Secondly, it was also influenced by improved growth in non-trade credit for large companies. Mortgage originations increased by 1.9% since December 31, 2025, and by 0.5% QoQ, driven by improved sales dynamics and offset by lower inflation in the quarter. In recent periods, new loan origination has slowed, reflecting still-weak demand, impacted by rising house prices, as well as the inflation and interest rates observed in previous years. However, with an improved economic environment and new measures to encourage home 30
purchases, such as those included in the Reconstruction Reform, we expect a gradual recovery in mortgage demand in the coming periods. Consumer loans decreased slightly by 0.3% as of December 31, 2025, and by 0.5% QoQ. Within consumer loans is the auto finance business, Santander Consumer, which has shown positive trends with an increase of 6.3% as of December 31, 2025, and a increase of 2.1% QoQ, thanks to more commercial agreements with car dealerships. Credit card spending decreased by 4.9% since December 31, 2025, and by 3.5% QoQ, while consumer installment loans also increased slightly. The third quarter was affected by lower transaction volume and card usage, reflecting a weaker socio-economic environment and the new minimum payment regulations, which accelerate the amortization of the loan. Financial Investments: Financial accounting information YTD % Change (Ch$ million) Sept-26 Jun-26 Dec-25 Sept-26/ Dec-25 Sept-26/ Jun-26 Financial assets held for trading at fair value through profit or loss (Trading portfolio) 436,306 511,221 714,628 (38.9%) (14.7%) Financial assets at fair value through other comprehensive income (Available-for-sale portfolio) 4,860,835 4,622,947 3,598,366 35.1% 5.1% Financial assets at amortized cost (Held to maturity portfolio) 5,741,937 5,676,311 5,525,242 3.9% 1.2% Total 11,039,078 10,810,479 9,838,236 12.2% 2.1% The financial investment portfolio is mainly composed of HQLA (high-quality liquid assets) such as Central Bank bonds and notes, Chilean sovereign bonds, and US Treasury bonds. Financial assets at fair value through other comprehensive income increased by 35.1% from December 2025, due to higher bonds and notes issued by the Chilean Treasury. Financial assets at amortized cost increased by 3.9% from December 2025 due to higher purchases of bonds issued by the Treasury. As of September 2026, instruments classified as held to maturity had a fair market value of CLP 5,787,901 million. 31
Customer funds grow 3.7% in the quarter. Funding: Financial accounting information YTD % change (Ch$ million) Sept-26 Jun-26 Dec-25 Sept-26/ Dec-25 Sept-26/ Jun-26 Demand deposits 13,829,127 13,943,771 14,075,590 (1.8%) (0.8%) Time deposits 19,478,975 18,447,020 16,493,783 18.1% 5.6% Total deposits 33,308,102 32,390,791 30,569,373 9.0% 2.8% Mutual Fund Brokerage (1) 16,817,524 15,934,831 14,556,643 15.5% 5.5% Total Customer Funds 50,125,626 48,325,622 45,126,016 11.1% 3.7% Bonds (2) 9,648,840 9,868,741 10,277,061 (6.1%) (2.2%) Liquidity Coverage Ratio (LCR) (3) 172.3% 177.1% 187.7% Net stable financing ratio (NSFR) (3) 116.9% 118.2% 115.1% 1. Banco Santander Chile is the exclusive intermediary for mutual funds managed by Santander Asset Management S.A. Administradora General de Fondos, a subsidiary of SAM Investment Holdings Limited. This figure is not included in the Bank's consolidated financial statements. 2. It includes regulatory capital financial instruments (AT1 and Tier 2). 3. Calculated in accordance with Chilean regulations. The Bank's total deposits increased by 9.0% since December 31, 2025, driven by an 18.1% growth in time deposits. This was partially offset by a slight contraction in demand deposits, associated with normal seasonality compared to the previous year-end. We also saw increased demand for mutual funds, which grew by 15.5% over the same period. Overall, client funds grew by 11.1% since December 31, 2025. In the third quarter (3Q26), total deposits increased by 2.8% QoQ. With lower expectations of cuts to the Monetary Policy Rate, time deposits grew by 5.6% QoQ, while demand deposits decreased slightly by 0.8% QoQ. Meanwhile, mutual funds increased by 5.5% QoQ. Overall, customer funds grew by 3.7% QoQ. Bond issuance decreased by 6.1% since December 31, 2025, and by 2.2% QoQ , in line with increased liquidity among our clients and slower demand in the long-term loan portfolio. Through September 2026, the Bank issued bonds totaling UF 6,855,000,000, CLP 253,500,000,000, CHF 100,000,000, and USD 555,000,000, taking advantage of favorable conditions in both local and international fixed-income markets. Of particular note is the issuance of a USD 500 million 144A bond in January 2026, maturing in November 2030 with a 4.55% interest rate. In terms of liquidity, the Bank's Liquidity Coverage Ratio (LCR), which measures the percentage of liquid assets relative to net cash outflows, stood at 172.3% as of September 30, 2026, well above the regulatory minimum. At the same date, the Bank's Net Stable Funding Ratio (NSFR), which measures the percentage of illiquid assets financed through stable funding sources, was 116.9%, also significantly above the required minimum. 32
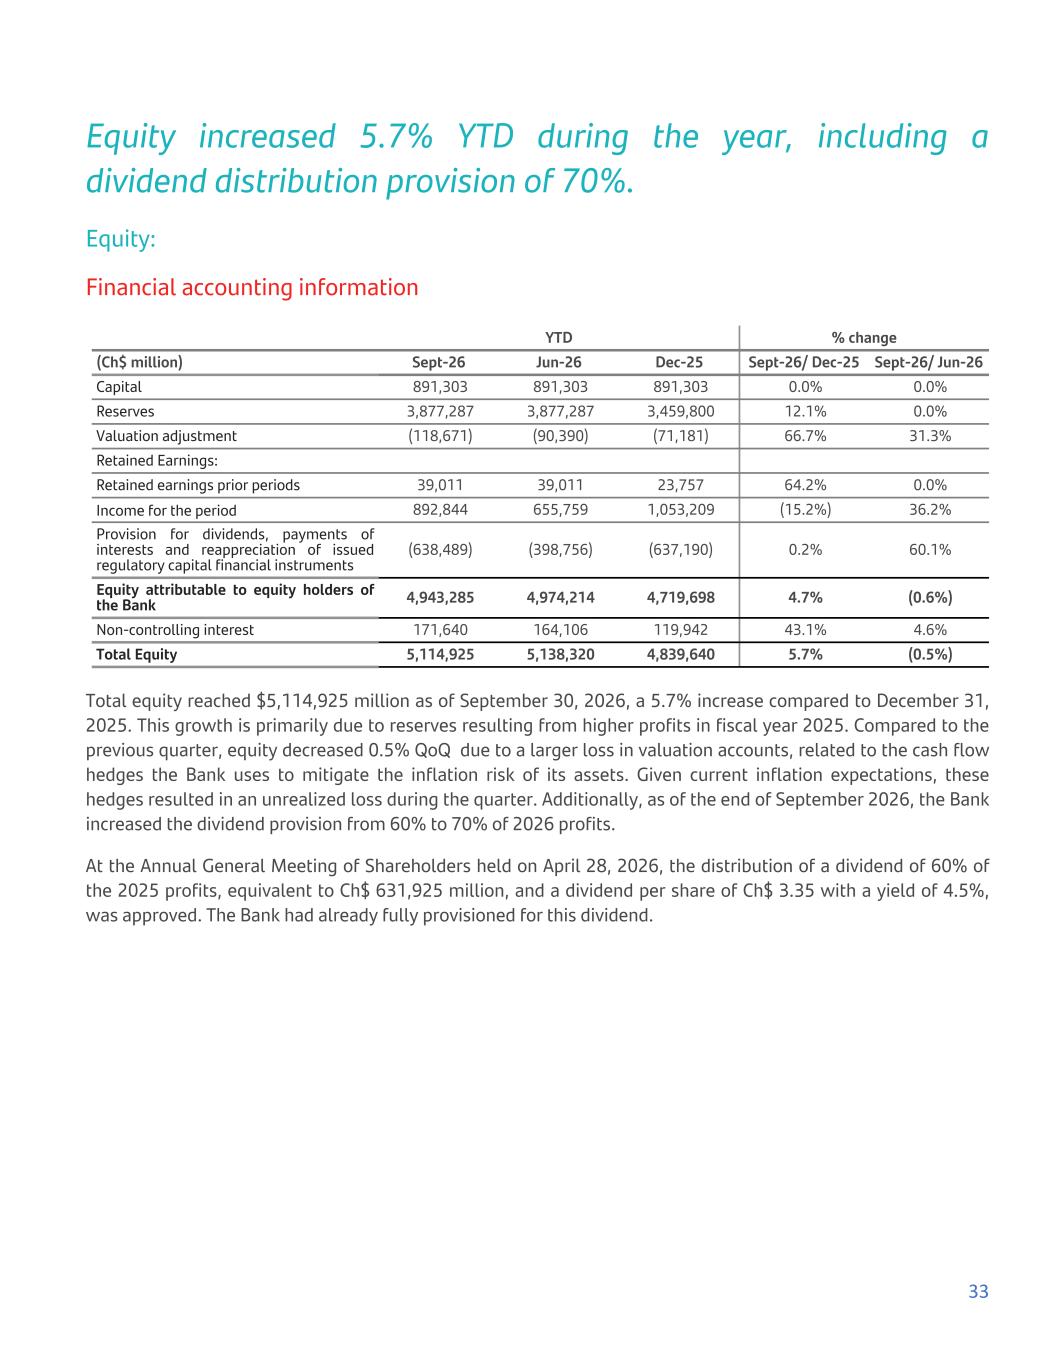
Equity increased 5.7% YTD during the year, including a dividend distribution provision of 70%. Equity: Financial accounting information YTD % change (Ch$ million) Sept-26 Jun-26 Dec-25 Sept-26/ Dec-25 Sept-26/ Jun-26 Capital 891,303 891,303 891,303 0.0% 0.0% Reserves 3,877,287 3,877,287 3,459,800 12.1% 0.0% Valuation adjustment (118,671) (90,390) (71,181) 66.7% 31.3% Retained Earnings: Retained earnings prior periods 39,011 39,011 23,757 64.2% 0.0% Income for the period 892,844 655,759 1,053,209 (15.2%) 36.2% Provision for dividends, payments of interests and reappreciation of issued regulatory capital financial instruments (638,489) (398,756) (637,190) 0.2% 60.1% Equity attributable to equity holders of the Bank 4,943,285 4,974,214 4,719,698 4.7% (0.6%) Non-controlling interest 171,640 164,106 119,942 43.1% 4.6% Total Equity 5,114,925 5,138,320 4,839,640 5.7% (0.5%) Total equity reached $5,114,925 million as of September 30, 2026, a 5.7% increase compared to December 31, 2025. This growth is primarily due to reserves resulting from higher profits in fiscal year 2025. Compared to the previous quarter, equity decreased 0.5% QoQ due to a larger loss in valuation accounts, related to the cash flow hedges the Bank uses to mitigate the inflation risk of its assets. Given current inflation expectations, these hedges resulted in an unrealized loss during the quarter. Additionally, as of the end of September 2026, the Bank increased the dividend provision from 60% to 70% of 2026 profits. At the Annual General Meeting of Shareholders held on April 28, 2026, the distribution of a dividend of 60% of the 2025 profits, equivalent to Ch$ 631,925 million, and a dividend per share of Ch$ 3.35 with a yield of 4.5%, was approved. The Bank had already fully provisioned for this dividend. 33
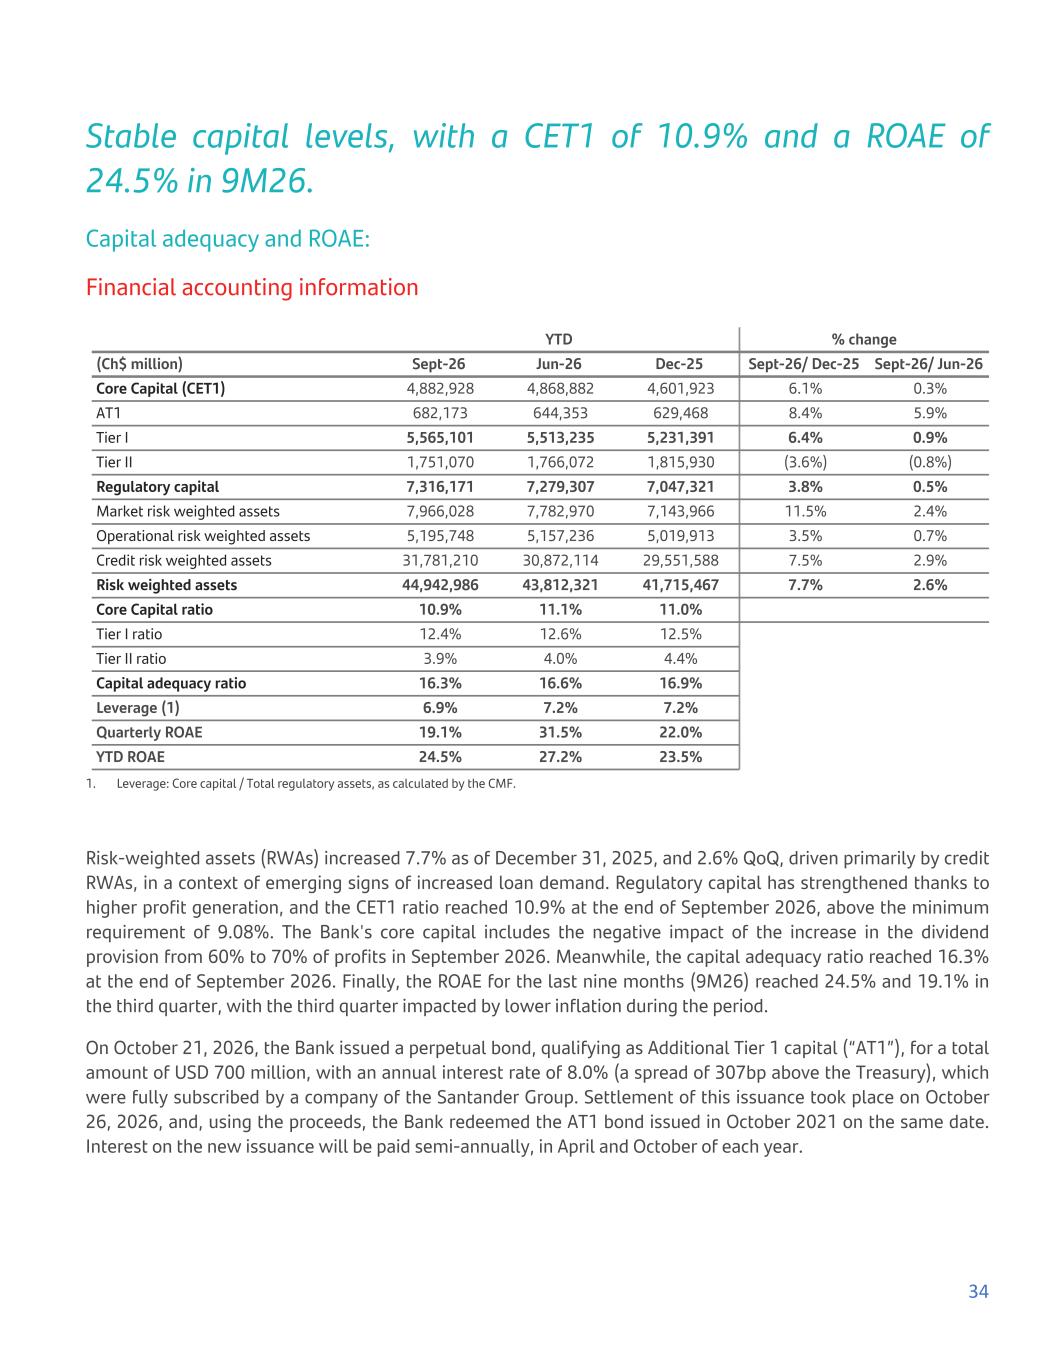
Stable capital levels, with a CET1 of 10.9% and a ROAE of 24.5% in 9M26. Capital adequacy and ROAE: Financial accounting information YTD % change (Ch$ million) Sept-26 Jun-26 Dec-25 Sept-26/ Dec-25 Sept-26/ Jun-26 Core Capital (CET1) 4,882,928 4,868,882 4,601,923 6.1% 0.3% AT1 682,173 644,353 629,468 8.4% 5.9% Tier I 5,565,101 5,513,235 5,231,391 6.4% 0.9% Tier II 1,751,070 1,766,072 1,815,930 (3.6%) (0.8%) Regulatory capital 7,316,171 7,279,307 7,047,321 3.8% 0.5% Market risk weighted assets 7,966,028 7,782,970 7,143,966 11.5% 2.4% Operational risk weighted assets 5,195,748 5,157,236 5,019,913 3.5% 0.7% Credit risk weighted assets 31,781,210 30,872,114 29,551,588 7.5% 2.9% Risk weighted assets 44,942,986 43,812,321 41,715,467 7.7% 2.6% Core Capital ratio 10.9% 11.1% 11.0% Tier I ratio 12.4% 12.6% 12.5% Tier II ratio 3.9% 4.0% 4.4% Capital adequacy ratio 16.3% 16.6% 16.9% Leverage (1) 6.9% 7.2% 7.2% Quarterly ROAE 19.1% 31.5% 22.0% YTD ROAE 24.5% 27.2% 23.5% 1. Leverage: Core capital / Total regulatory assets, as calculated by the CMF. Risk-weighted assets (RWAs) increased 7.7% as of December 31, 2025, and 2.6% QoQ, driven primarily by credit RWAs, in a context of emerging signs of increased loan demand. Regulatory capital has strengthened thanks to higher profit generation, and the CET1 ratio reached 10.9% at the end of September 2026, above the minimum requirement of 9.08%. The Bank's core capital includes the negative impact of the increase in the dividend provision from 60% to 70% of profits in September 2026. Meanwhile, the capital adequacy ratio reached 16.3% at the end of September 2026. Finally, the ROAE for the last nine months (9M26) reached 24.5% and 19.1% in the third quarter, with the third quarter impacted by lower inflation during the period. On October 21, 2026, the Bank issued a perpetual bond, qualifying as Additional Tier 1 capital (“AT1”), for a total amount of USD 700 million, with an annual interest rate of 8.0% (a spread of 307bp above the Treasury), which were fully subscribed by a company of the Santander Group. Settlement of this issuance took place on October 26, 2026, and, using the proceeds, the Bank redeemed the AT1 bond issued in October 2021 on the same date. Interest on the new issuance will be paid semi-annually, in April and October of each year. 34
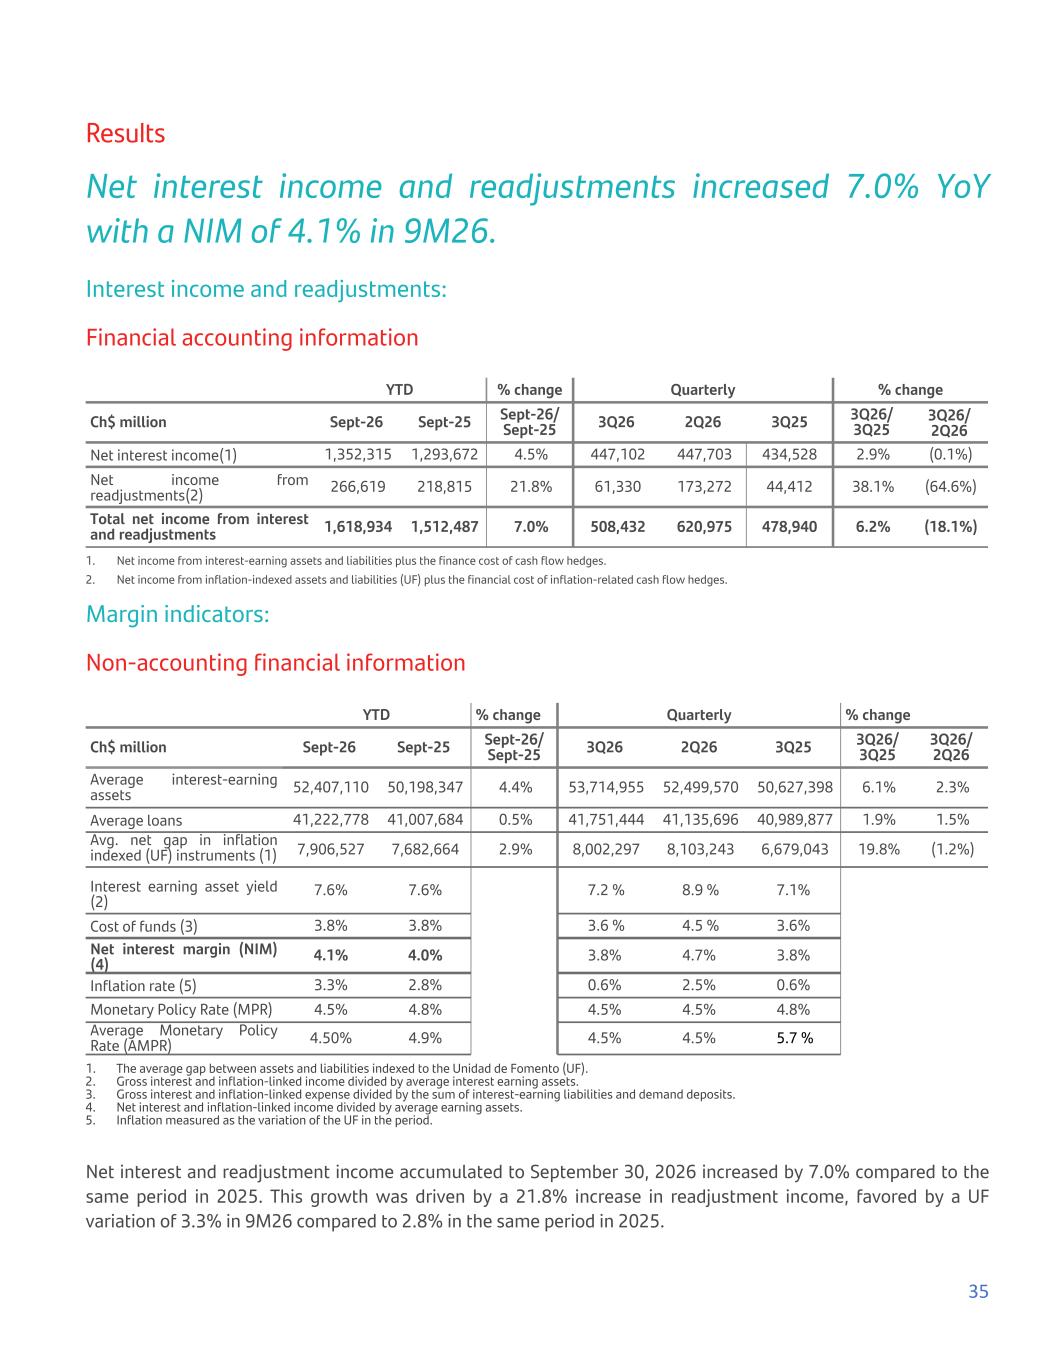
Results Net interest income and readjustments increased 7.0% YoY with a NIM of 4.1% in 9M26. Interest income and readjustments: Financial accounting information YTD % change Quarterly % change Ch$ million Sept-26 Sept-25 Sept-26/ Sept-25 3Q26 2Q26 3Q25 3Q26/ 3Q25 3Q26/ 2Q26 Net interest income(1) 1,352,315 1,293,672 4.5% 447,102 447,703 434,528 2.9% (0.1%) Net income from readjustments(2) 266,619 218,815 21.8% 61,330 173,272 44,412 38.1% (64.6%) Total net income from interest and readjustments 1,618,934 1,512,487 7.0% 508,432 620,975 478,940 6.2% (18.1%) 1. Net income from interest-earning assets and liabilities plus the finance cost of cash flow hedges. 2. Net income from inflation-indexed assets and liabilities (UF) plus the financial cost of inflation-related cash flow hedges. Margin indicators: Non-accounting financial information YTD % change Quarterly % change Ch$ million Sept-26 Sept-25 Sept-26/ Sept-25 3Q26 2Q26 3Q25 3Q26/ 3Q25 3Q26/ 2Q26 Average interest-earning assets 52,407,110 50,198,347 4.4% 53,714,955 52,499,570 50,627,398 6.1% 2.3% Average loans 41,222,778 41,007,684 0.5% 41,751,444 41,135,696 40,989,877 1.9% 1.5% Avg. net gap in inflation indexed (UF) instruments (1) 7,906,527 7,682,664 2.9% 8,002,297 8,103,243 6,679,043 19.8% (1.2%) Interest earning asset yield (2) 7.6% 7.6% 7.2 % 8.9 % 7.1% Cost of funds (3) 3.8% 3.8% 3.6 % 4.5 % 3.6% Net interest margin (NIM) (4) 4.1% 4.0% 3.8% 4.7% 3.8% Inflation rate (5) 3.3% 2.8% 0.6% 2.5% 0.6% Monetary Policy Rate (MPR) 4.5% 4.8% 4.5% 4.5% 4.8% Average Monetary Policy Rate (AMPR) 4.50% 4.9% 4.5% 4.5% 5.7 % 1. The average gap between assets and liabilities indexed to the Unidad de Fomento (UF). 2. Gross interest and inflation-linked income divided by average interest earning assets. 3. Gross interest and inflation-linked expense divided by the sum of interest-earning liabilities and demand deposits. 4. Net interest and inflation-linked income divided by average earning assets. 5. Inflation measured as the variation of the UF in the period. Net interest and readjustment income accumulated to September 30, 2026 increased by 7.0% compared to the same period in 2025. This growth was driven by a 21.8% increase in readjustment income, favored by a UF variation of 3.3% in 9M26 compared to 2.8% in the same period in 2025. 35
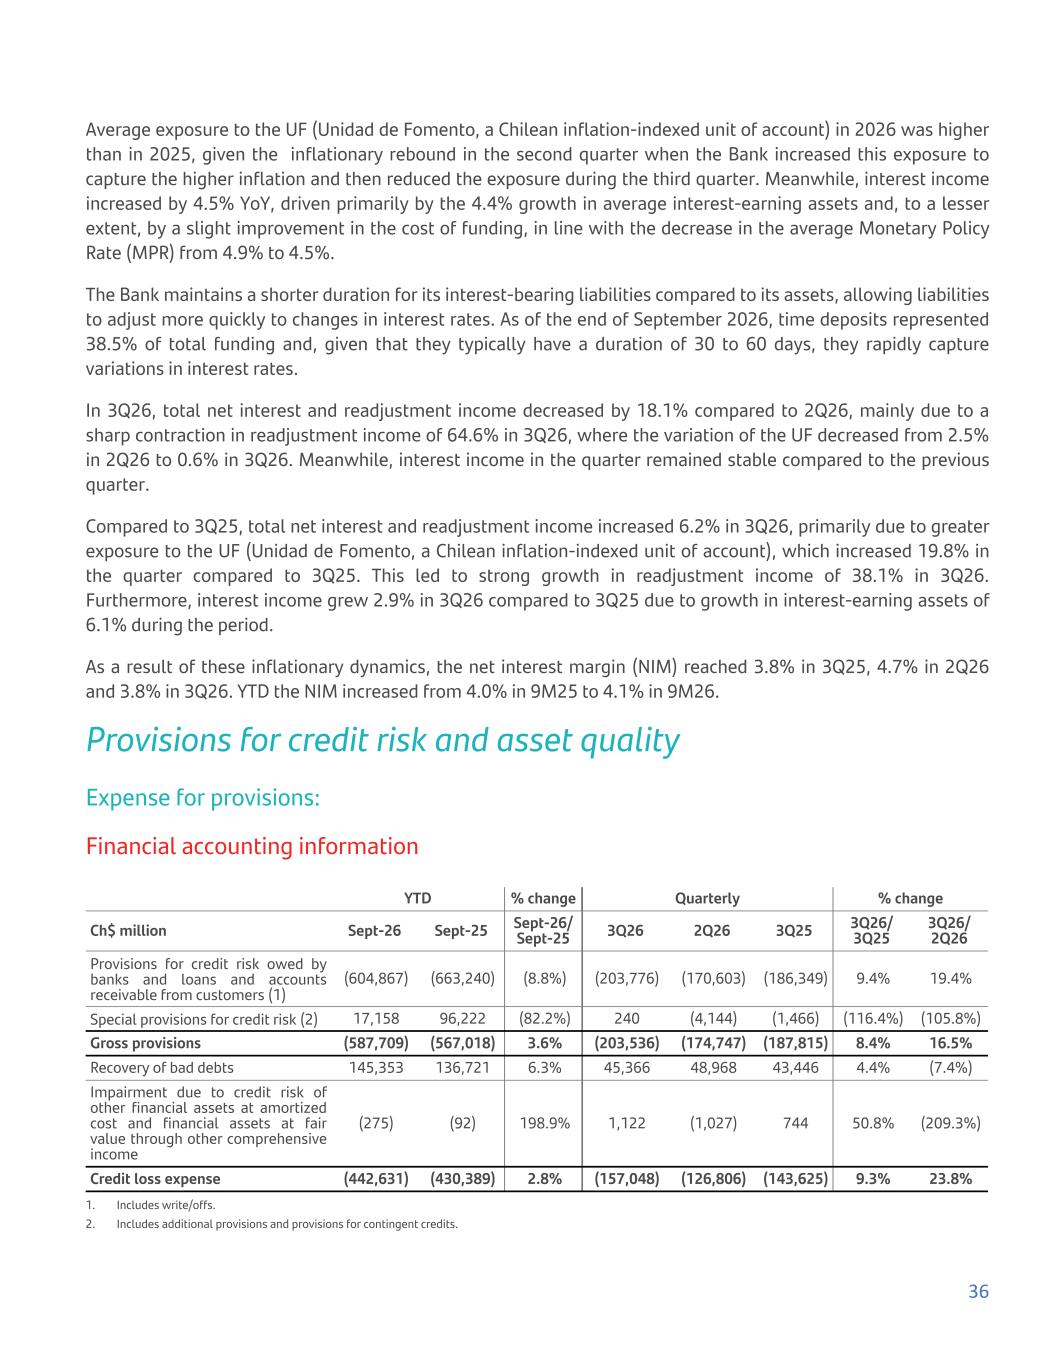
Average exposure to the UF (Unidad de Fomento, a Chilean inflation-indexed unit of account) in 2026 was higher than in 2025, given the inflationary rebound in the second quarter when the Bank increased this exposure to capture the higher inflation and then reduced the exposure during the third quarter. Meanwhile, interest income increased by 4.5% YoY, driven primarily by the 4.4% growth in average interest-earning assets and, to a lesser extent, by a slight improvement in the cost of funding, in line with the decrease in the average Monetary Policy Rate (MPR) from 4.9% to 4.5%. The Bank maintains a shorter duration for its interest-bearing liabilities compared to its assets, allowing liabilities to adjust more quickly to changes in interest rates. As of the end of September 2026, time deposits represented 38.5% of total funding and, given that they typically have a duration of 30 to 60 days, they rapidly capture variations in interest rates. In 3Q26, total net interest and readjustment income decreased by 18.1% compared to 2Q26, mainly due to a sharp contraction in readjustment income of 64.6% in 3Q26, where the variation of the UF decreased from 2.5% in 2Q26 to 0.6% in 3Q26. Meanwhile, interest income in the quarter remained stable compared to the previous quarter. Compared to 3Q25, total net interest and readjustment income increased 6.2% in 3Q26, primarily due to greater exposure to the UF (Unidad de Fomento, a Chilean inflation-indexed unit of account), which increased 19.8% in the quarter compared to 3Q25. This led to strong growth in readjustment income of 38.1% in 3Q26. Furthermore, interest income grew 2.9% in 3Q26 compared to 3Q25 due to growth in interest-earning assets of 6.1% during the period. As a result of these inflationary dynamics, the net interest margin (NIM) reached 3.8% in 3Q25, 4.7% in 2Q26 and 3.8% in 3Q26. YTD the NIM increased from 4.0% in 9M25 to 4.1% in 9M26. Provisions for credit risk and asset quality Expense for provisions: Financial accounting information YTD % change Quarterly % change Ch$ million Sept-26 Sept-25 Sept-26/ Sept-25 3Q26 2Q26 3Q25 3Q26/ 3Q25 3Q26/ 2Q26 Provisions for credit risk owed by banks and loans and accounts receivable from customers (1) (604,867) (663,240) (8.8%) (203,776) (170,603) (186,349) 9.4% 19.4% Special provisions for credit risk (2) 17,158 96,222 (82.2%) 240 (4,144) (1,466) (116.4%) (105.8%) Gross provisions (587,709) (567,018) 3.6% (203,536) (174,747) (187,815) 8.4% 16.5% Recovery of bad debts 145,353 136,721 6.3% 45,366 48,968 43,446 4.4% (7.4%) Impairment due to credit risk of other financial assets at amortized cost and financial assets at fair value through other comprehensive income (275) (92) 198.9% 1,122 (1,027) 744 50.8% (209.3%) Credit loss expense (442,631) (430,389) 2.8% (157,048) (126,806) (143,625) 9.3% 23.8% 1. Includes write/offs. 2. Includes additional provisions and provisions for contingent credits. 36
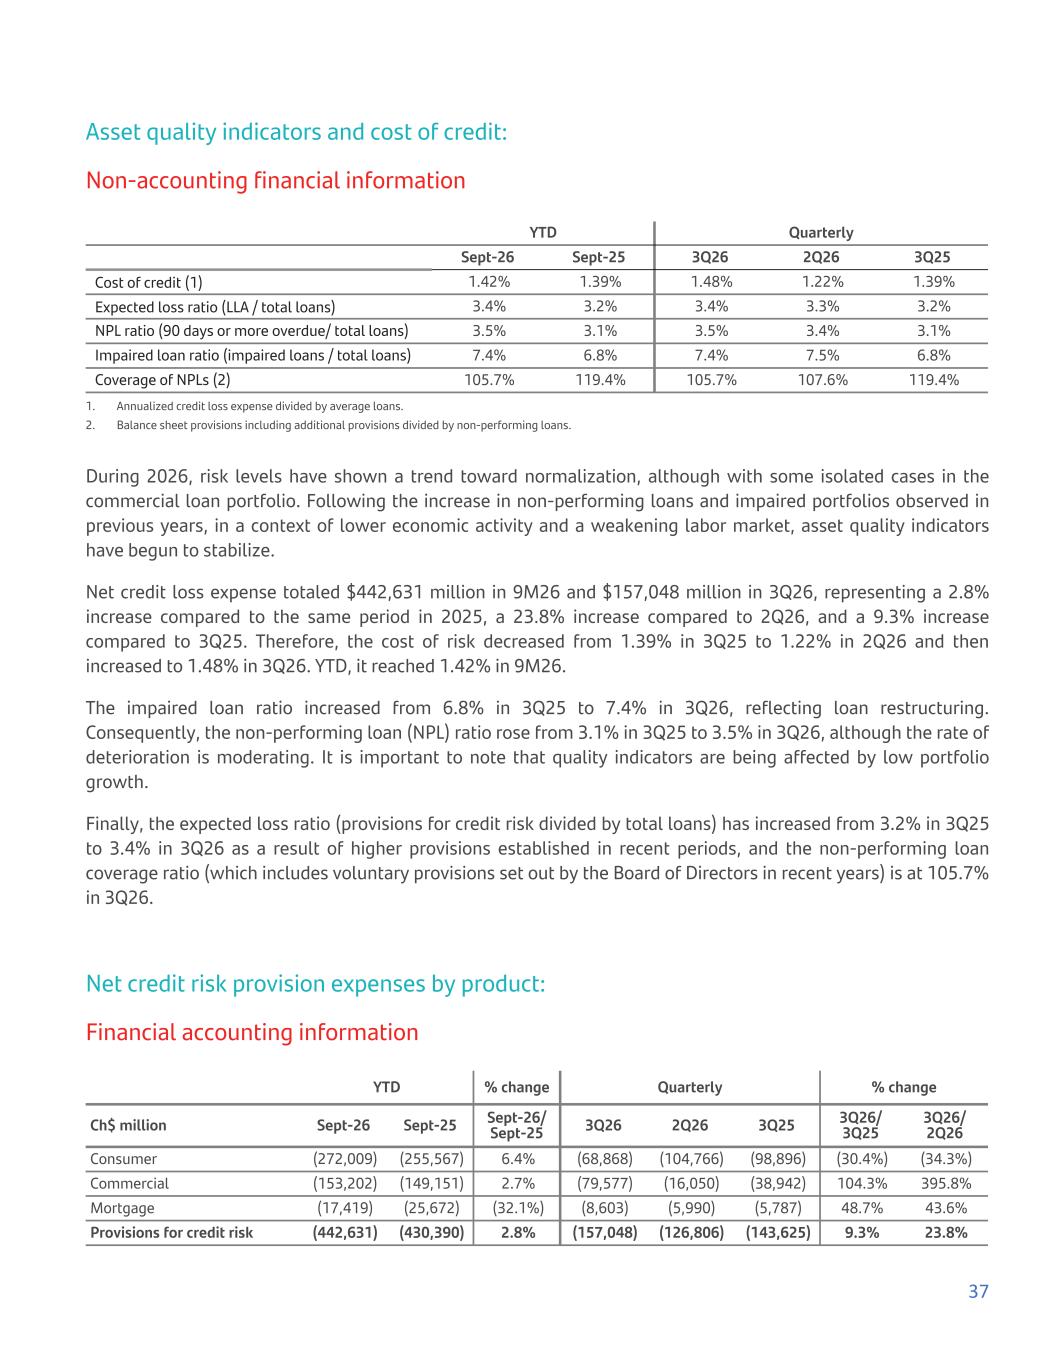
Asset quality indicators and cost of credit: Non-accounting financial information YTD Quarterly Sept-26 Sept-25 3Q26 2Q26 3Q25 Cost of credit (1) 1.42% 1.39% 1.48% 1.22% 1.39% Expected loss ratio (LLA / total loans) 3.4% 3.2% 3.4% 3.3% 3.2% NPL ratio (90 days or more overdue/ total loans) 3.5% 3.1% 3.5% 3.4% 3.1% Impaired loan ratio (impaired loans / total loans) 7.4% 6.8% 7.4% 7.5% 6.8% Coverage of NPLs (2) 105.7% 119.4% 105.7% 107.6% 119.4% 1. Annualized credit loss expense divided by average loans. 2. Balance sheet provisions including additional provisions divided by non-performing loans. During 2026, risk levels have shown a trend toward normalization, although with some isolated cases in the commercial loan portfolio. Following the increase in non-performing loans and impaired portfolios observed in previous years, in a context of lower economic activity and a weakening labor market, asset quality indicators have begun to stabilize. Net credit loss expense totaled $442,631 million in 9M26 and $157,048 million in 3Q26, representing a 2.8% increase compared to the same period in 2025, a 23.8% increase compared to 2Q26, and a 9.3% increase compared to 3Q25. Therefore, the cost of risk decreased from 1.39% in 3Q25 to 1.22% in 2Q26 and then increased to 1.48% in 3Q26. YTD, it reached 1.42% in 9M26. The impaired loan ratio increased from 6.8% in 3Q25 to 7.4% in 3Q26, reflecting loan restructuring. Consequently, the non-performing loan (NPL) ratio rose from 3.1% in 3Q25 to 3.5% in 3Q26, although the rate of deterioration is moderating. It is important to note that quality indicators are being affected by low portfolio growth. Finally, the expected loss ratio (provisions for credit risk divided by total loans) has increased from 3.2% in 3Q25 to 3.4% in 3Q26 as a result of higher provisions established in recent periods, and the non-performing loan coverage ratio (which includes voluntary provisions set out by the Board of Directors in recent years) is at 105.7% in 3Q26. Net credit risk provision expenses by product: Financial accounting information YTD % change Quarterly % change Ch$ million Sept-26 Sept-25 Sept-26/ Sept-25 3Q26 2Q26 3Q25 3Q26/ 3Q25 3Q26/ 2Q26 Consumer (272,009) (255,567) 6.4% (68,868) (104,766) (98,896) (30.4%) (34.3%) Commercial (153,202) (149,151) 2.7% (79,577) (16,050) (38,942) 104.3% 395.8% Mortgage (17,419) (25,672) (32.1%) (8,603) (5,990) (5,787) 48.7% 43.6% Provisions for credit risk (442,631) (430,390) 2.8% (157,048) (126,806) (143,625) 9.3% 23.8% 37
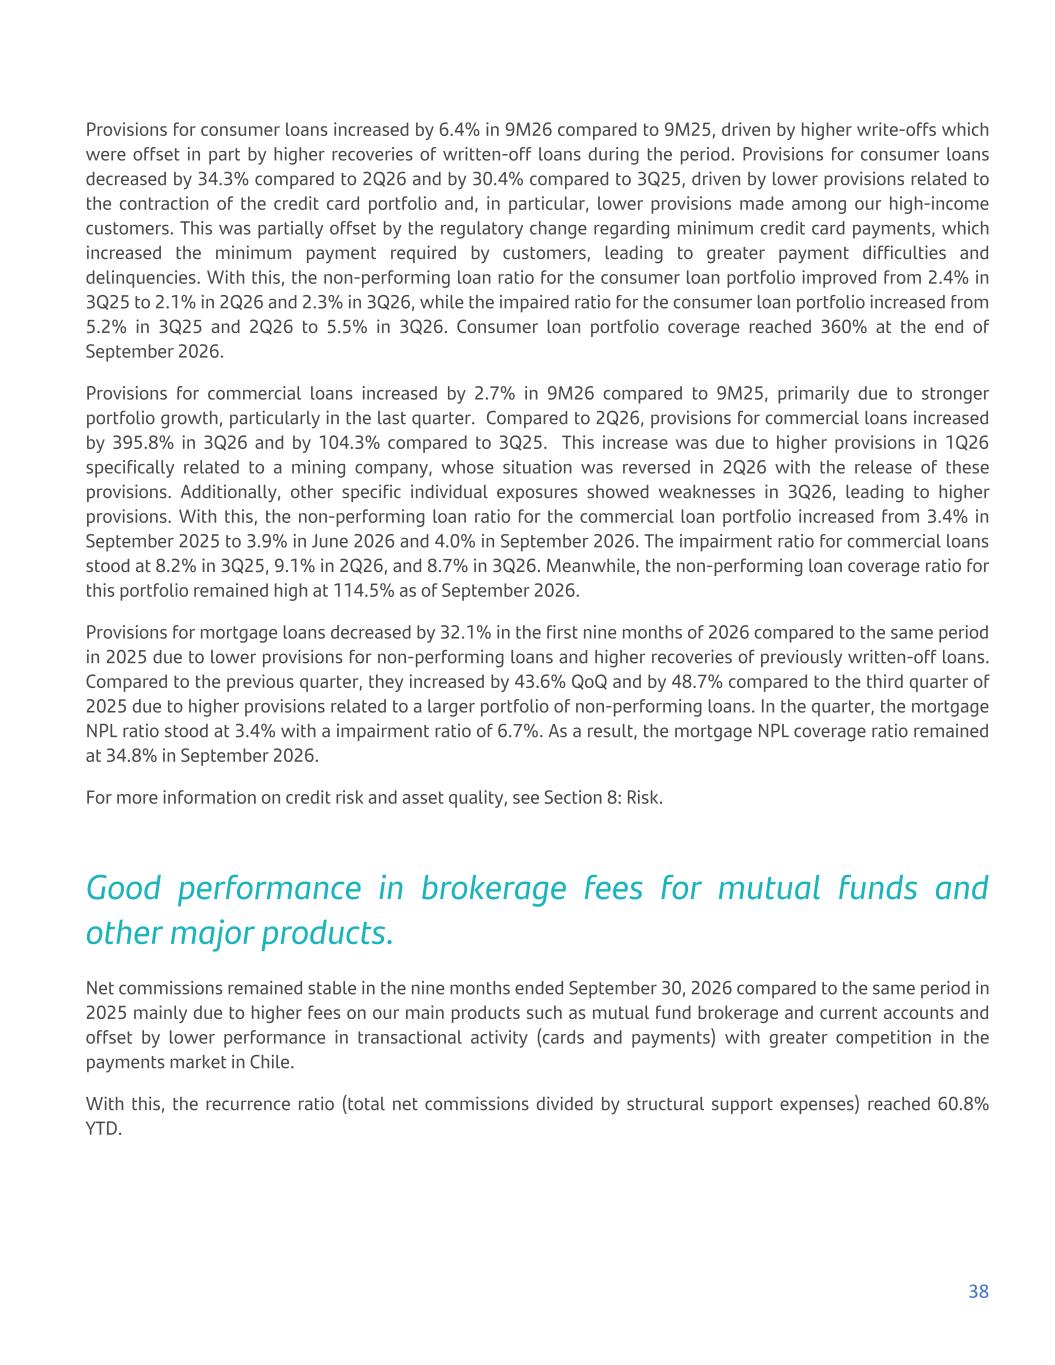
Provisions for consumer loans increased by 6.4% in 9M26 compared to 9M25, driven by higher write-offs which were offset in part by higher recoveries of written-off loans during the period. Provisions for consumer loans decreased by 34.3% compared to 2Q26 and by 30.4% compared to 3Q25, driven by lower provisions related to the contraction of the credit card portfolio and, in particular, lower provisions made among our high-income customers. This was partially offset by the regulatory change regarding minimum credit card payments, which increased the minimum payment required by customers, leading to greater payment difficulties and delinquencies. With this, the non-performing loan ratio for the consumer loan portfolio improved from 2.4% in 3Q25 to 2.1% in 2Q26 and 2.3% in 3Q26, while the impaired ratio for the consumer loan portfolio increased from 5.2% in 3Q25 and 2Q26 to 5.5% in 3Q26. Consumer loan portfolio coverage reached 360% at the end of September 2026. Provisions for commercial loans increased by 2.7% in 9M26 compared to 9M25, primarily due to stronger portfolio growth, particularly in the last quarter. Compared to 2Q26, provisions for commercial loans increased by 395.8% in 3Q26 and by 104.3% compared to 3Q25. This increase was due to higher provisions in 1Q26 specifically related to a mining company, whose situation was reversed in 2Q26 with the release of these provisions. Additionally, other specific individual exposures showed weaknesses in 3Q26, leading to higher provisions. With this, the non-performing loan ratio for the commercial loan portfolio increased from 3.4% in September 2025 to 3.9% in June 2026 and 4.0% in September 2026. The impairment ratio for commercial loans stood at 8.2% in 3Q25, 9.1% in 2Q26, and 8.7% in 3Q26. Meanwhile, the non-performing loan coverage ratio for this portfolio remained high at 114.5% as of September 2026. Provisions for mortgage loans decreased by 32.1% in the first nine months of 2026 compared to the same period in 2025 due to lower provisions for non-performing loans and higher recoveries of previously written-off loans. Compared to the previous quarter, they increased by 43.6% QoQ and by 48.7% compared to the third quarter of 2025 due to higher provisions related to a larger portfolio of non-performing loans. In the quarter, the mortgage NPL ratio stood at 3.4% with a impairment ratio of 6.7%. As a result, the mortgage NPL coverage ratio remained at 34.8% in September 2026. For more information on credit risk and asset quality, see Section 8: Risk. Good performance in brokerage fees for mutual funds and other major products. Net commissions remained stable in the nine months ended September 30, 2026 compared to the same period in 2025 mainly due to higher fees on our main products such as mutual fund brokerage and current accounts and offset by lower performance in transactional activity (cards and payments) with greater competition in the payments market in Chile. With this, the recurrence ratio (total net commissions divided by structural support expenses) reached 60.8% YTD. 38
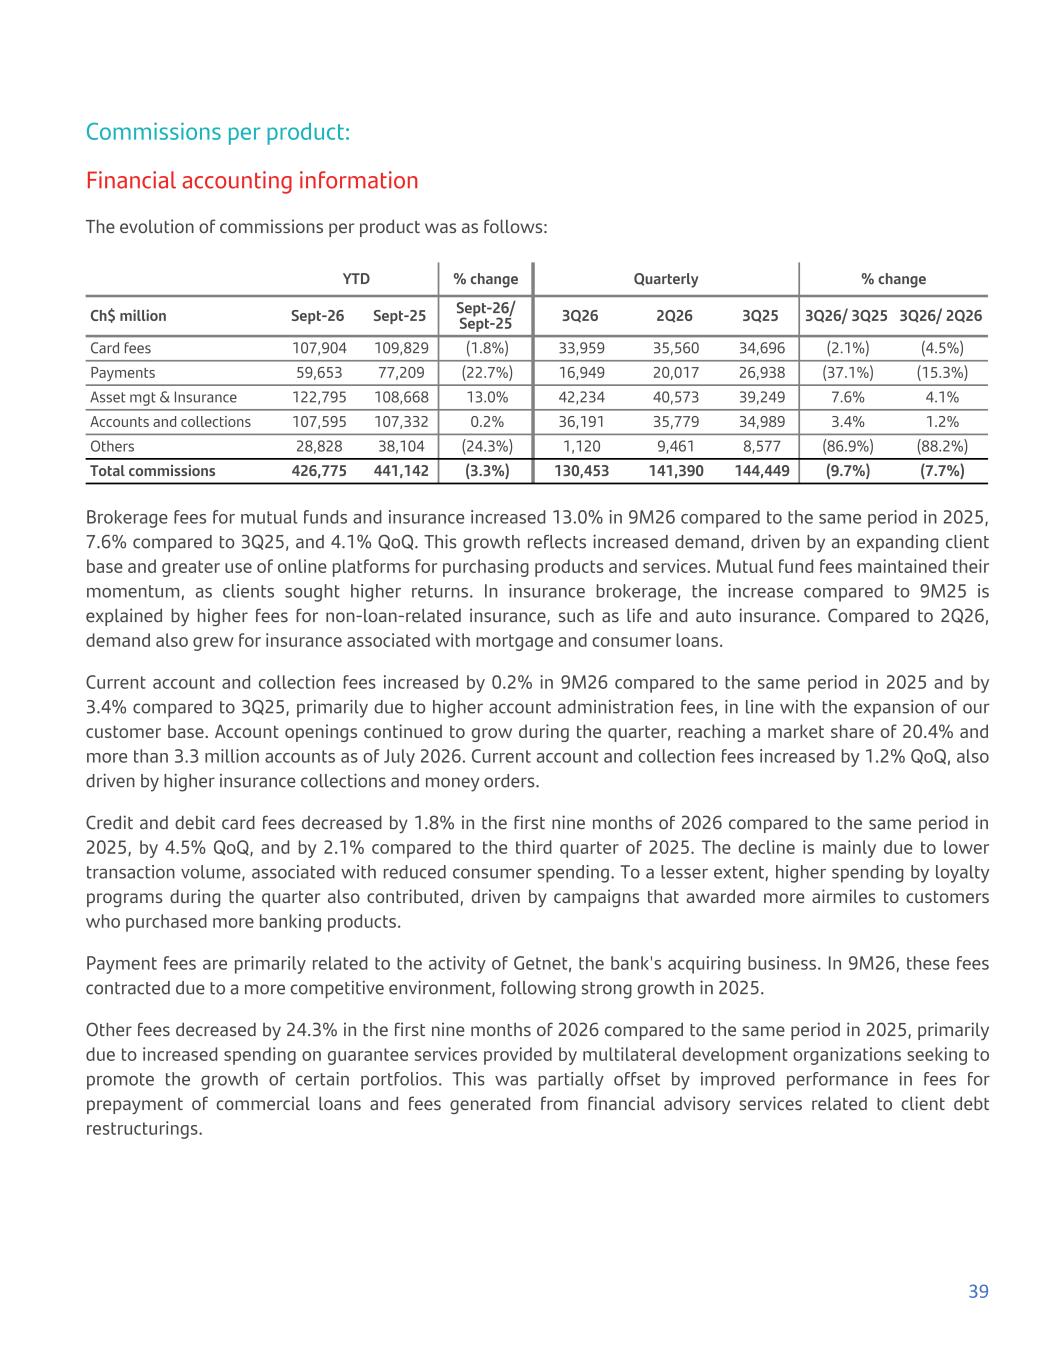
Commissions per product: Financial accounting information The evolution of commissions per product was as follows: YTD % change Quarterly % change Ch$ million Sept-26 Sept-25 Sept-26/ Sept-25 3Q26 2Q26 3Q25 3Q26/ 3Q25 3Q26/ 2Q26 Card fees 107,904 109,829 (1.8%) 33,959 35,560 34,696 (2.1%) (4.5%) Payments 59,653 77,209 (22.7%) 16,949 20,017 26,938 (37.1%) (15.3%) Asset mgt & Insurance 122,795 108,668 13.0% 42,234 40,573 39,249 7.6% 4.1% Accounts and collections 107,595 107,332 0.2% 36,191 35,779 34,989 3.4% 1.2% Others 28,828 38,104 (24.3%) 1,120 9,461 8,577 (86.9%) (88.2%) Total commissions 426,775 441,142 (3.3%) 130,453 141,390 144,449 (9.7%) (7.7%) Brokerage fees for mutual funds and insurance increased 13.0% in 9M26 compared to the same period in 2025, 7.6% compared to 3Q25, and 4.1% QoQ. This growth reflects increased demand, driven by an expanding client base and greater use of online platforms for purchasing products and services. Mutual fund fees maintained their momentum, as clients sought higher returns. In insurance brokerage, the increase compared to 9M25 is explained by higher fees for non-loan-related insurance, such as life and auto insurance. Compared to 2Q26, demand also grew for insurance associated with mortgage and consumer loans. Current account and collection fees increased by 0.2% in 9M26 compared to the same period in 2025 and by 3.4% compared to 3Q25, primarily due to higher account administration fees, in line with the expansion of our customer base. Account openings continued to grow during the quarter, reaching a market share of 20.4% and more than 3.3 million accounts as of July 2026. Current account and collection fees increased by 1.2% QoQ, also driven by higher insurance collections and money orders. Credit and debit card fees decreased by 1.8% in the first nine months of 2026 compared to the same period in 2025, by 4.5% QoQ, and by 2.1% compared to the third quarter of 2025. The decline is mainly due to lower transaction volume, associated with reduced consumer spending. To a lesser extent, higher spending by loyalty programs during the quarter also contributed, driven by campaigns that awarded more airmiles to customers who purchased more banking products. Payment fees are primarily related to the activity of Getnet, the bank's acquiring business. In 9M26, these fees contracted due to a more competitive environment, following strong growth in 2025. Other fees decreased by 24.3% in the first nine months of 2026 compared to the same period in 2025, primarily due to increased spending on guarantee services provided by multilateral development organizations seeking to promote the growth of certain portfolios. This was partially offset by improved performance in fees for prepayment of commercial loans and fees generated from financial advisory services related to client debt restructurings. 39
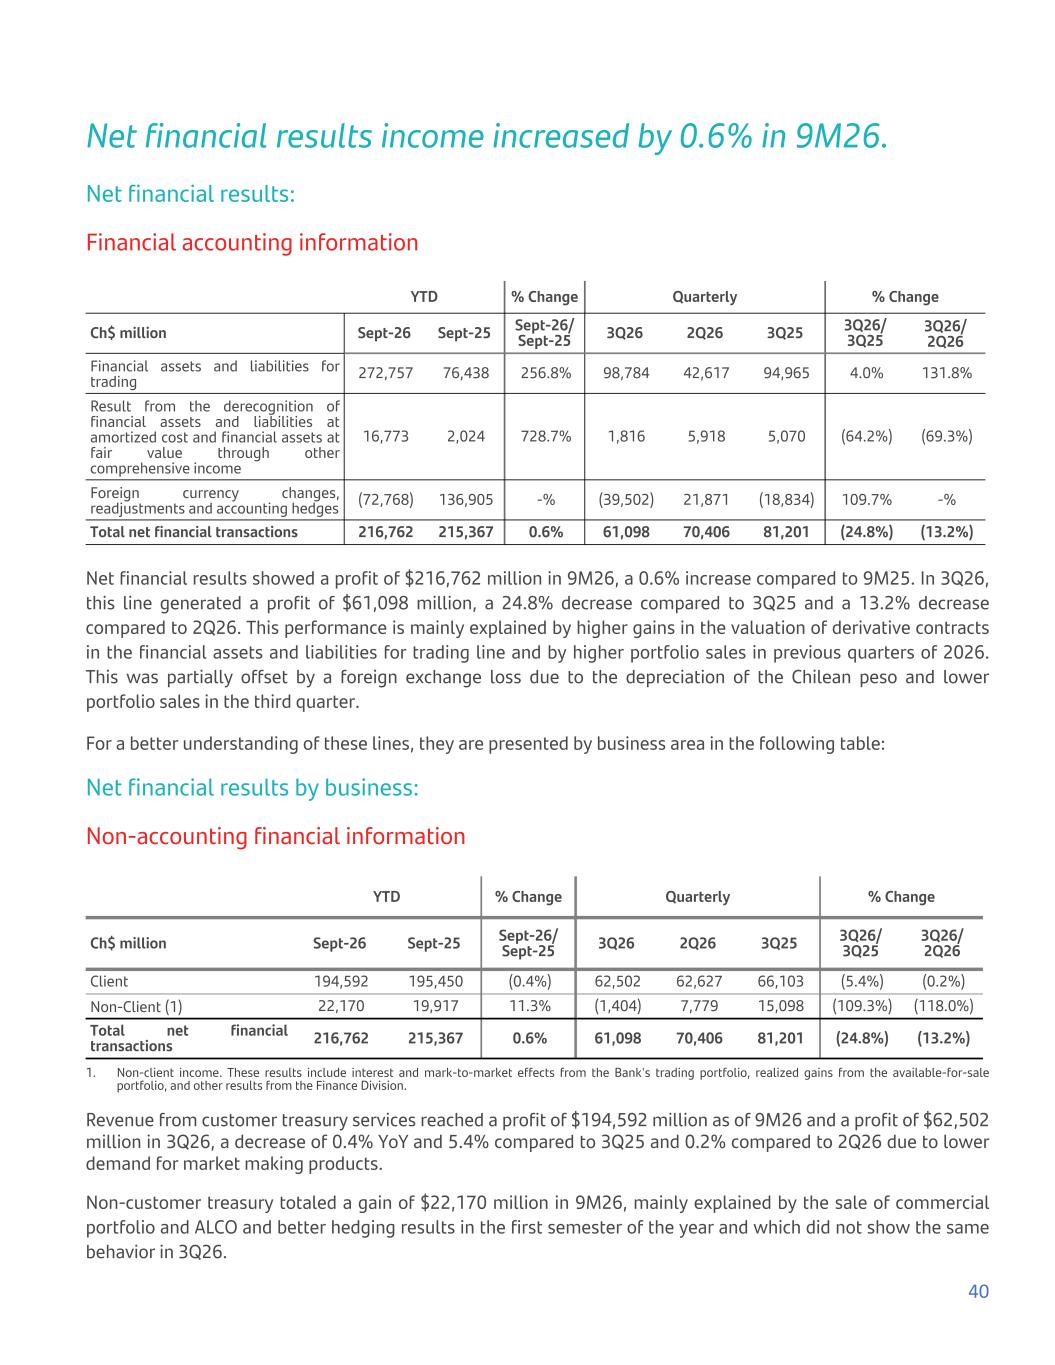
Net financial results income increased by 0.6% in 9M26. Net financial results: Financial accounting information YTD % Change Quarterly % Change Ch$ million Sept-26 Sept-25 Sept-26/ Sept-25 3Q26 2Q26 3Q25 3Q26/ 3Q25 3Q26/ 2Q26 Financial assets and liabilities for trading 272,757 76,438 256.8% 98,784 42,617 94,965 4.0% 131.8% Result from the derecognition of financial assets and liabilities at amortized cost and financial assets at fair value through other comprehensive income 16,773 2,024 728.7% 1,816 5,918 5,070 (64.2%) (69.3%) Foreign currency changes, readjustments and accounting hedges (72,768) 136,905 -% (39,502) 21,871 (18,834) 109.7% -% Total net financial transactions 216,762 215,367 0.6% 61,098 70,406 81,201 (24.8%) (13.2%) Net financial results showed a profit of $216,762 million in 9M26, a 0.6% increase compared to 9M25. In 3Q26, this line generated a profit of $61,098 million, a 24.8% decrease compared to 3Q25 and a 13.2% decrease compared to 2Q26. This performance is mainly explained by higher gains in the valuation of derivative contracts in the financial assets and liabilities for trading line and by higher portfolio sales in previous quarters of 2026. This was partially offset by a foreign exchange loss due to the depreciation of the Chilean peso and lower portfolio sales in the third quarter. For a better understanding of these lines, they are presented by business area in the following table: Net financial results by business: Non-accounting financial information YTD % Change Quarterly % Change Ch$ million Sept-26 Sept-25 Sept-26/ Sept-25 3Q26 2Q26 3Q25 3Q26/ 3Q25 3Q26/ 2Q26 Client 194,592 195,450 (0.4%) 62,502 62,627 66,103 (5.4%) (0.2%) Non-Client (1) 22,170 19,917 11.3% (1,404) 7,779 15,098 (109.3%) (118.0%) Total net financial transactions 216,762 215,367 0.6% 61,098 70,406 81,201 (24.8%) (13.2%) 1. Non-client income. These results include interest and mark-to-market effects from the Bank's trading portfolio, realized gains from the available-for-sale portfolio, and other results from the Finance Division. Revenue from customer treasury services reached a profit of $194,592 million as of 9M26 and a profit of $62,502 million in 3Q26, a decrease of 0.4% YoY and 5.4% compared to 3Q25 and 0.2% compared to 2Q26 due to lower demand for market making products. Non-customer treasury totaled a gain of $22,170 million in 9M26, mainly explained by the sale of commercial portfolio and ALCO and better hedging results in the first semester of the year and which did not show the same behavior in 3Q26. 40
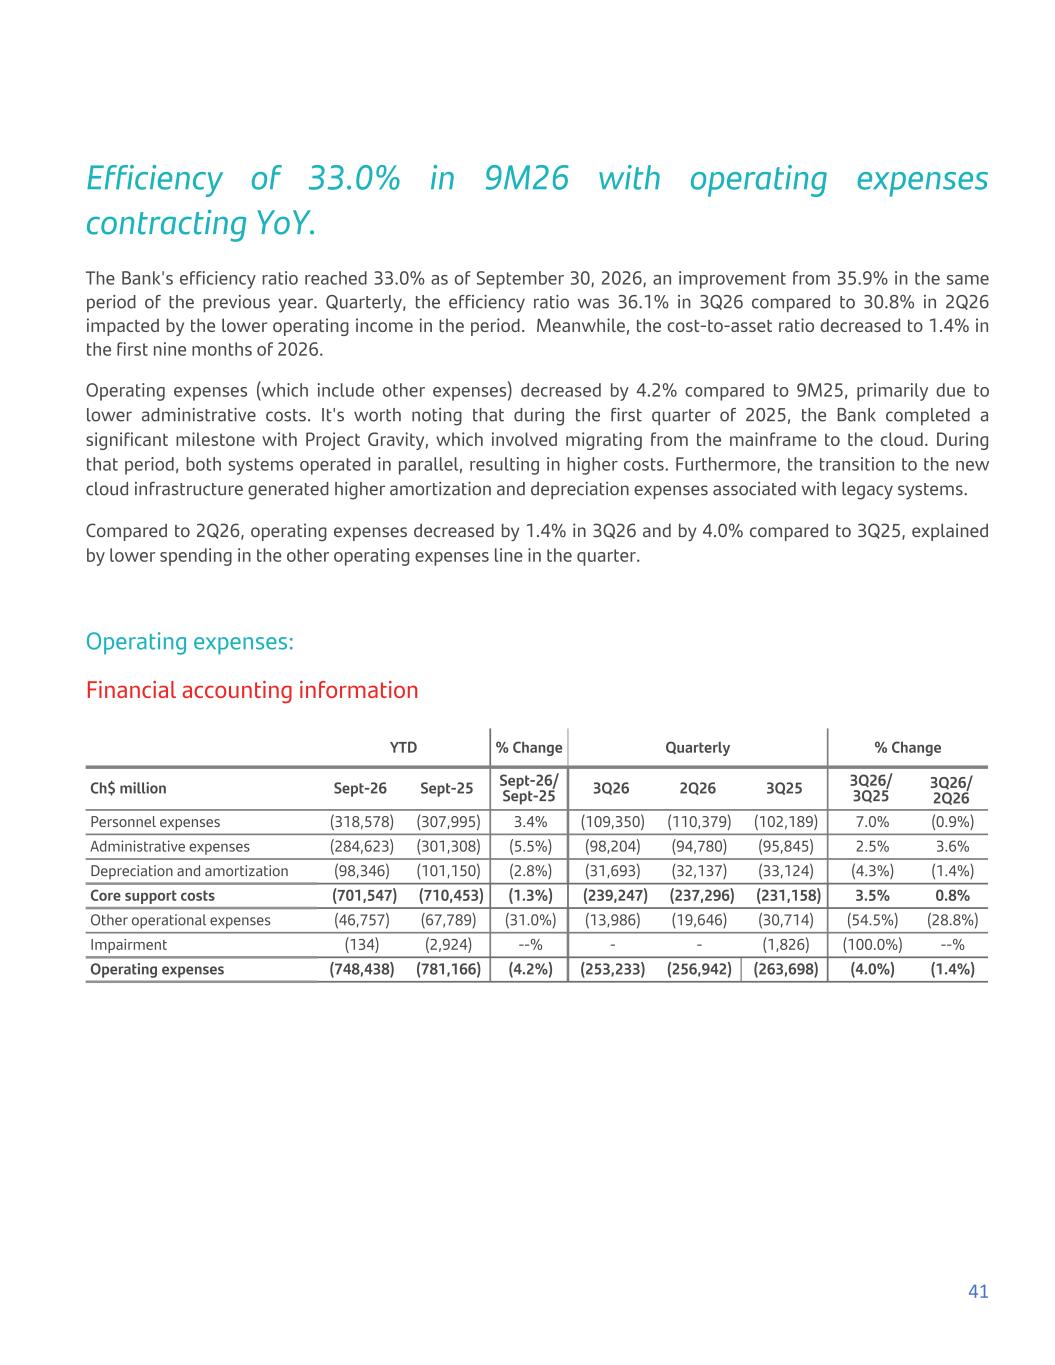
Efficiency of 33.0% in 9M26 with operating expenses contracting YoY. The Bank's efficiency ratio reached 33.0% as of September 30, 2026, an improvement from 35.9% in the same period of the previous year. Quarterly, the efficiency ratio was 36.1% in 3Q26 compared to 30.8% in 2Q26 impacted by the lower operating income in the period. Meanwhile, the cost-to-asset ratio decreased to 1.4% in the first nine months of 2026. Operating expenses (which include other expenses) decreased by 4.2% compared to 9M25, primarily due to lower administrative costs. It's worth noting that during the first quarter of 2025, the Bank completed a significant milestone with Project Gravity, which involved migrating from the mainframe to the cloud. During that period, both systems operated in parallel, resulting in higher costs. Furthermore, the transition to the new cloud infrastructure generated higher amortization and depreciation expenses associated with legacy systems. Compared to 2Q26, operating expenses decreased by 1.4% in 3Q26 and by 4.0% compared to 3Q25, explained by lower spending in the other operating expenses line in the quarter. Operating expenses: Financial accounting information YTD % Change Quarterly % Change Ch$ million Sept-26 Sept-25 Sept-26/ Sept-25 3Q26 2Q26 3Q25 3Q26/ 3Q25 3Q26/ 2Q26 Personnel expenses (318,578) (307,995) 3.4% (109,350) (110,379) (102,189) 7.0% (0.9%) Administrative expenses (284,623) (301,308) (5.5%) (98,204) (94,780) (95,845) 2.5% 3.6% Depreciation and amortization (98,346) (101,150) (2.8%) (31,693) (32,137) (33,124) (4.3%) (1.4%) Core support costs (701,547) (710,453) (1.3%) (239,247) (237,296) (231,158) 3.5% 0.8% Other operational expenses (46,757) (67,789) (31.0%) (13,986) (19,646) (30,714) (54.5%) (28.8%) Impairment (134) (2,924) --% - - (1,826) (100.0%) --% Operating expenses (748,438) (781,166) (4.2%) (253,233) (256,942) (263,698) (4.0%) (1.4%) 41
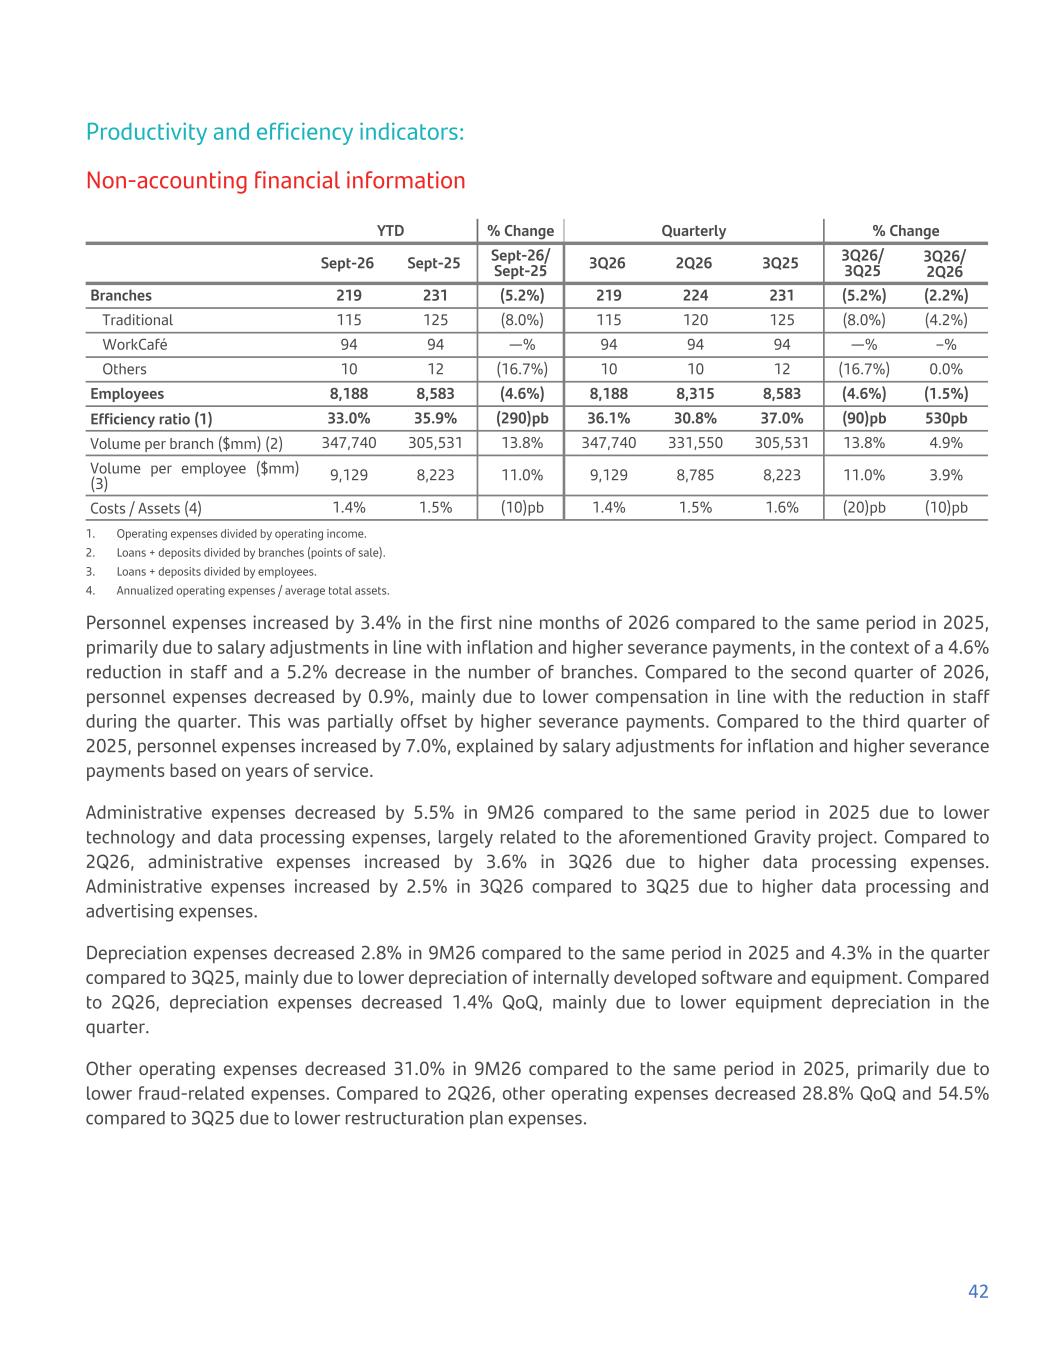
Productivity and efficiency indicators: Non-accounting financial information YTD % Change Quarterly % Change Sept-26 Sept-25 Sept-26/ Sept-25 3Q26 2Q26 3Q25 3Q26/ 3Q25 3Q26/ 2Q26 Branches 219 231 (5.2%) 219 224 231 (5.2%) (2.2%) Traditional 115 125 (8.0%) 115 120 125 (8.0%) (4.2%) WorkCafé 94 94 —% 94 94 94 —% –% Others 10 12 (16.7%) 10 10 12 (16.7%) 0.0% Employees 8,188 8,583 (4.6%) 8,188 8,315 8,583 (4.6%) (1.5%) Efficiency ratio (1) 33.0% 35.9% (290)pb 36.1% 30.8% 37.0% (90)pb 530pb Volume per branch ($mm) (2) 347,740 305,531 13.8% 347,740 331,550 305,531 13.8% 4.9% Volume per employee ($mm) (3) 9,129 8,223 11.0% 9,129 8,785 8,223 11.0% 3.9% Costs / Assets (4) 1.4% 1.5% (10)pb 1.4% 1.5% 1.6% (20)pb (10)pb 1. Operating expenses divided by operating income. 2. Loans + deposits divided by branches (points of sale). 3. Loans + deposits divided by employees. 4. Annualized operating expenses / average total assets. Personnel expenses increased by 3.4% in the first nine months of 2026 compared to the same period in 2025, primarily due to salary adjustments in line with inflation and higher severance payments, in the context of a 4.6% reduction in staff and a 5.2% decrease in the number of branches. Compared to the second quarter of 2026, personnel expenses decreased by 0.9%, mainly due to lower compensation in line with the reduction in staff during the quarter. This was partially offset by higher severance payments. Compared to the third quarter of 2025, personnel expenses increased by 7.0%, explained by salary adjustments for inflation and higher severance payments based on years of service. Administrative expenses decreased by 5.5% in 9M26 compared to the same period in 2025 due to lower technology and data processing expenses, largely related to the aforementioned Gravity project. Compared to 2Q26, administrative expenses increased by 3.6% in 3Q26 due to higher data processing expenses. Administrative expenses increased by 2.5% in 3Q26 compared to 3Q25 due to higher data processing and advertising expenses. Depreciation expenses decreased 2.8% in 9M26 compared to the same period in 2025 and 4.3% in the quarter compared to 3Q25, mainly due to lower depreciation of internally developed software and equipment. Compared to 2Q26, depreciation expenses decreased 1.4% QoQ, mainly due to lower equipment depreciation in the quarter. Other operating expenses decreased 31.0% in 9M26 compared to the same period in 2025, primarily due to lower fraud-related expenses. Compared to 2Q26, other operating expenses decreased 28.8% QoQ and 54.5% compared to 3Q25 due to lower restructuration plan expenses. 42
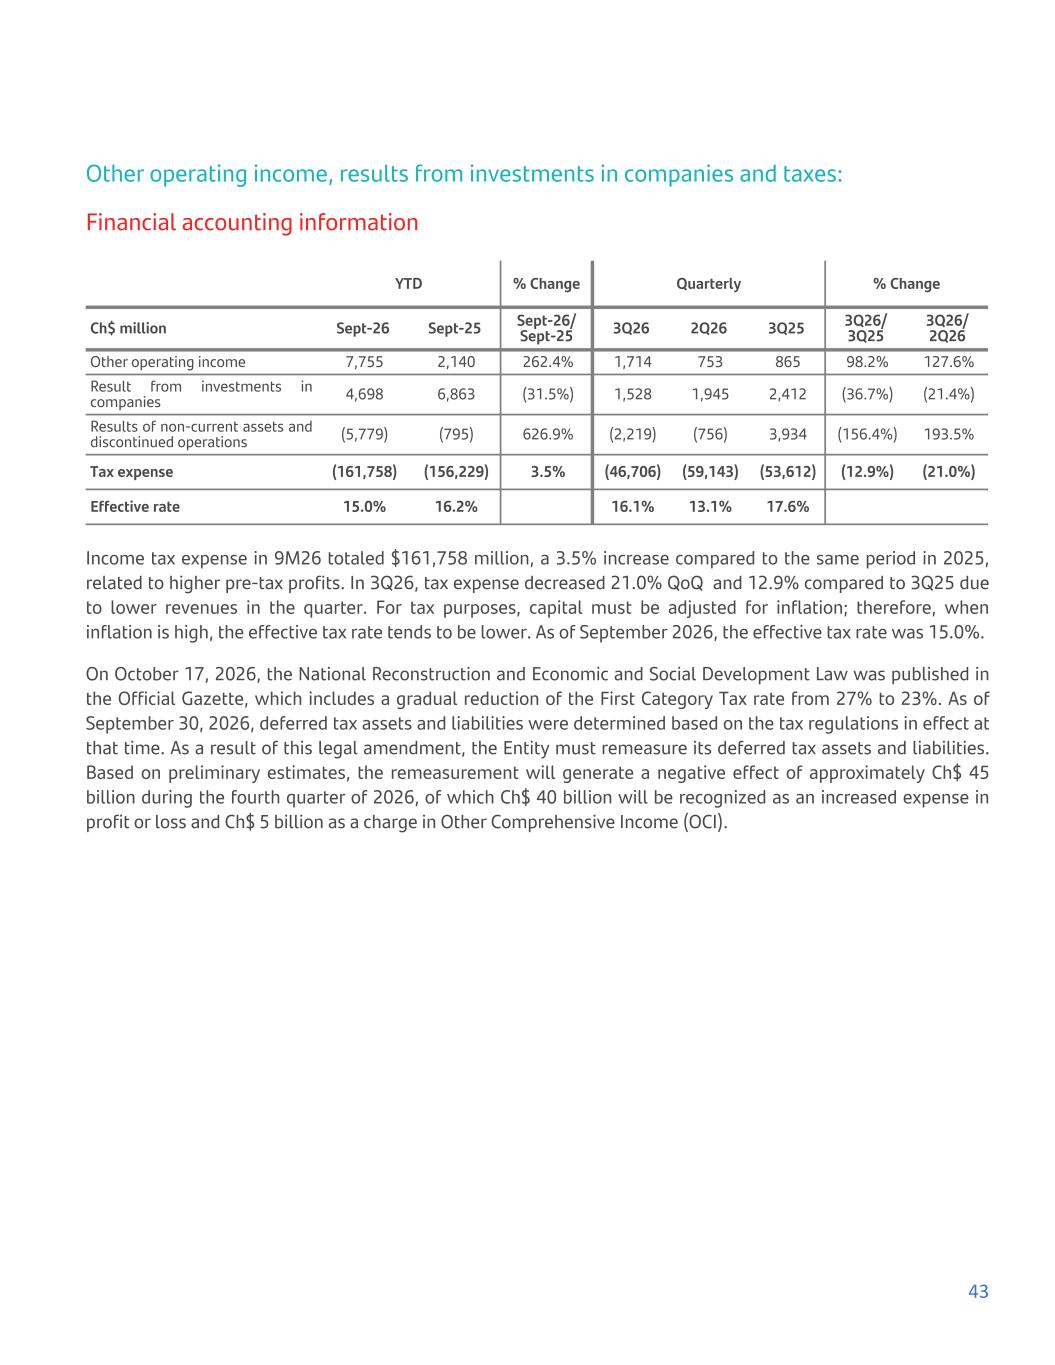
Other operating income, results from investments in companies and taxes: Financial accounting information YTD % Change Quarterly % Change Ch$ million Sept-26 Sept-25 Sept-26/ Sept-25 3Q26 2Q26 3Q25 3Q26/ 3Q25 3Q26/ 2Q26 Other operating income 7,755 2,140 262.4% 1,714 753 865 98.2% 127.6% Result from investments in companies 4,698 6,863 (31.5%) 1,528 1,945 2,412 (36.7%) (21.4%) Results of non-current assets and discontinued operations (5,779) (795) 626.9% (2,219) (756) 3,934 (156.4%) 193.5% Tax expense (161,758) (156,229) 3.5% (46,706) (59,143) (53,612) (12.9%) (21.0%) Effective rate 15.0% 16.2% 16.1% 13.1% 17.6% Income tax expense in 9M26 totaled $161,758 million, a 3.5% increase compared to the same period in 2025, related to higher pre-tax profits. In 3Q26, tax expense decreased 21.0% QoQ and 12.9% compared to 3Q25 due to lower revenues in the quarter. For tax purposes, capital must be adjusted for inflation; therefore, when inflation is high, the effective tax rate tends to be lower. As of September 2026, the effective tax rate was 15.0%. On October 17, 2026, the National Reconstruction and Economic and Social Development Law was published in the Official Gazette, which includes a gradual reduction of the First Category Tax rate from 27% to 23%. As of September 30, 2026, deferred tax assets and liabilities were determined based on the tax regulations in effect at that time. As a result of this legal amendment, the Entity must remeasure its deferred tax assets and liabilities. Based on preliminary estimates, the remeasurement will generate a negative effect of approximately Ch$ 45 billion during the fourth quarter of 2026, of which Ch$ 40 billion will be recognized as an increased expense in profit or loss and Ch$ 5 billion as a charge in Other Comprehensive Income (OCI). 43
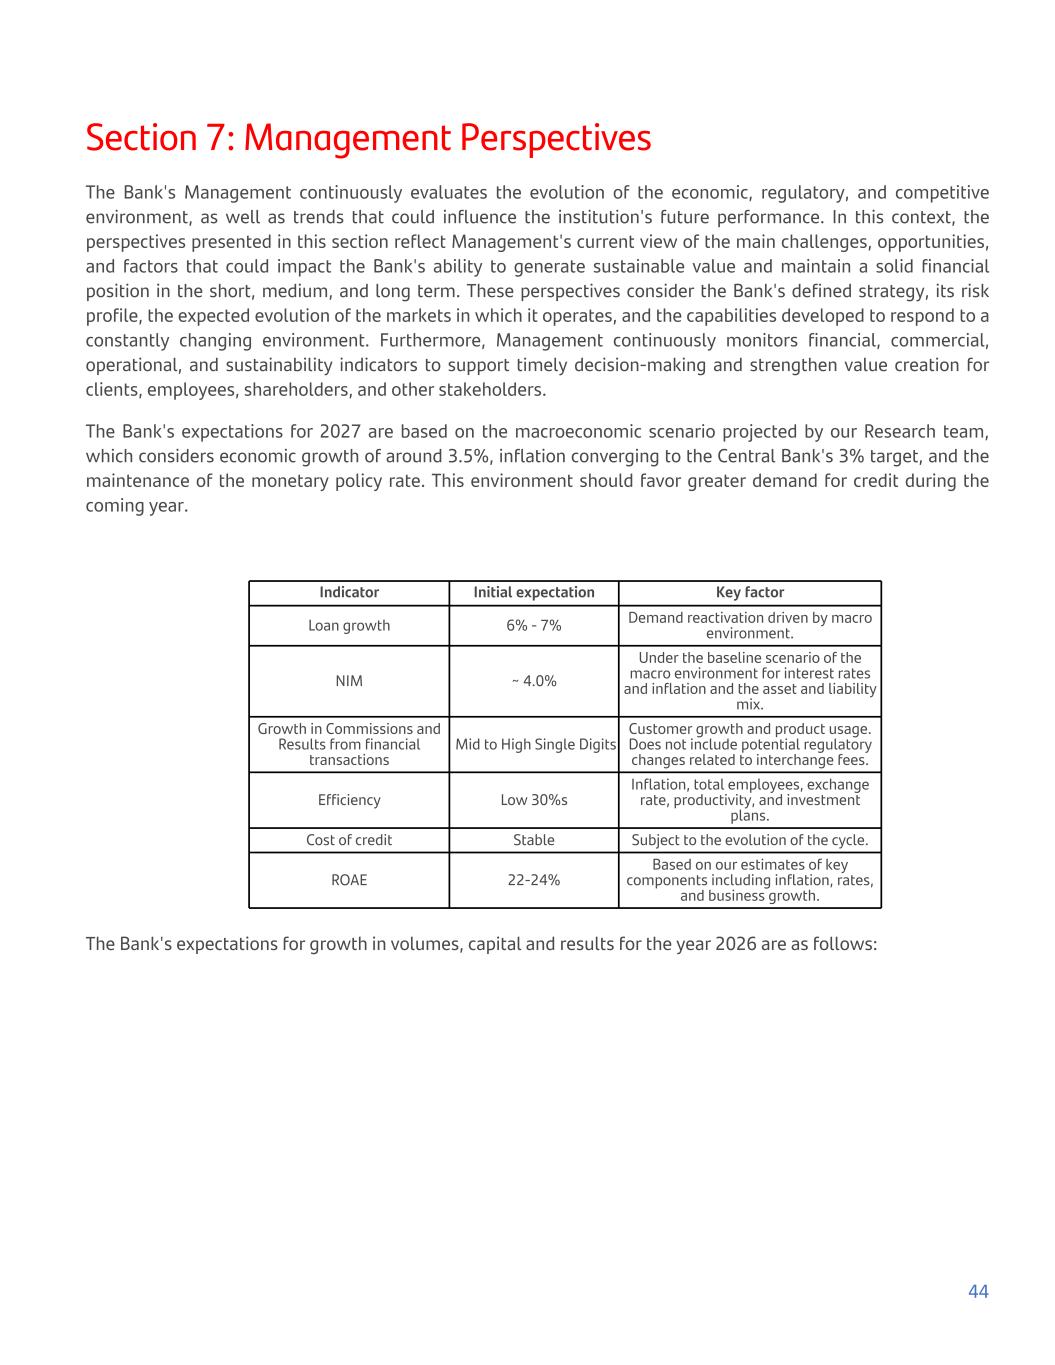
Section 7: Management Perspectives The Bank's Management continuously evaluates the evolution of the economic, regulatory, and competitive environment, as well as trends that could influence the institution's future performance. In this context, the perspectives presented in this section reflect Management's current view of the main challenges, opportunities, and factors that could impact the Bank's ability to generate sustainable value and maintain a solid financial position in the short, medium, and long term. These perspectives consider the Bank's defined strategy, its risk profile, the expected evolution of the markets in which it operates, and the capabilities developed to respond to a constantly changing environment. Furthermore, Management continuously monitors financial, commercial, operational, and sustainability indicators to support timely decision-making and strengthen value creation for clients, employees, shareholders, and other stakeholders. The Bank's expectations for 2027 are based on the macroeconomic scenario projected by our Research team, which considers economic growth of around 3.5%, inflation converging to the Central Bank's 3% target, and the maintenance of the monetary policy rate. This environment should favor greater demand for credit during the coming year. Indicator Initial expectation Key factor Loan growth 6% - 7% Demand reactivation driven by macro environment. NIM ~ 4.0% Under the baseline scenario of the macro environment for interest rates and inflation and the asset and liability mix. Growth in Commissions and Results from financial transactions Mid to High Single Digits Customer growth and product usage. Does not include potential regulatory changes related to interchange fees. Efficiency Low 30%s Inflation, total employees, exchange rate, productivity, and investment plans. Cost of credit Stable Subject to the evolution of the cycle. ROAE 22-24% Based on our estimates of key components including inflation, rates, and business growth. The Bank's expectations for growth in volumes, capital and results for the year 2026 are as follows: 44
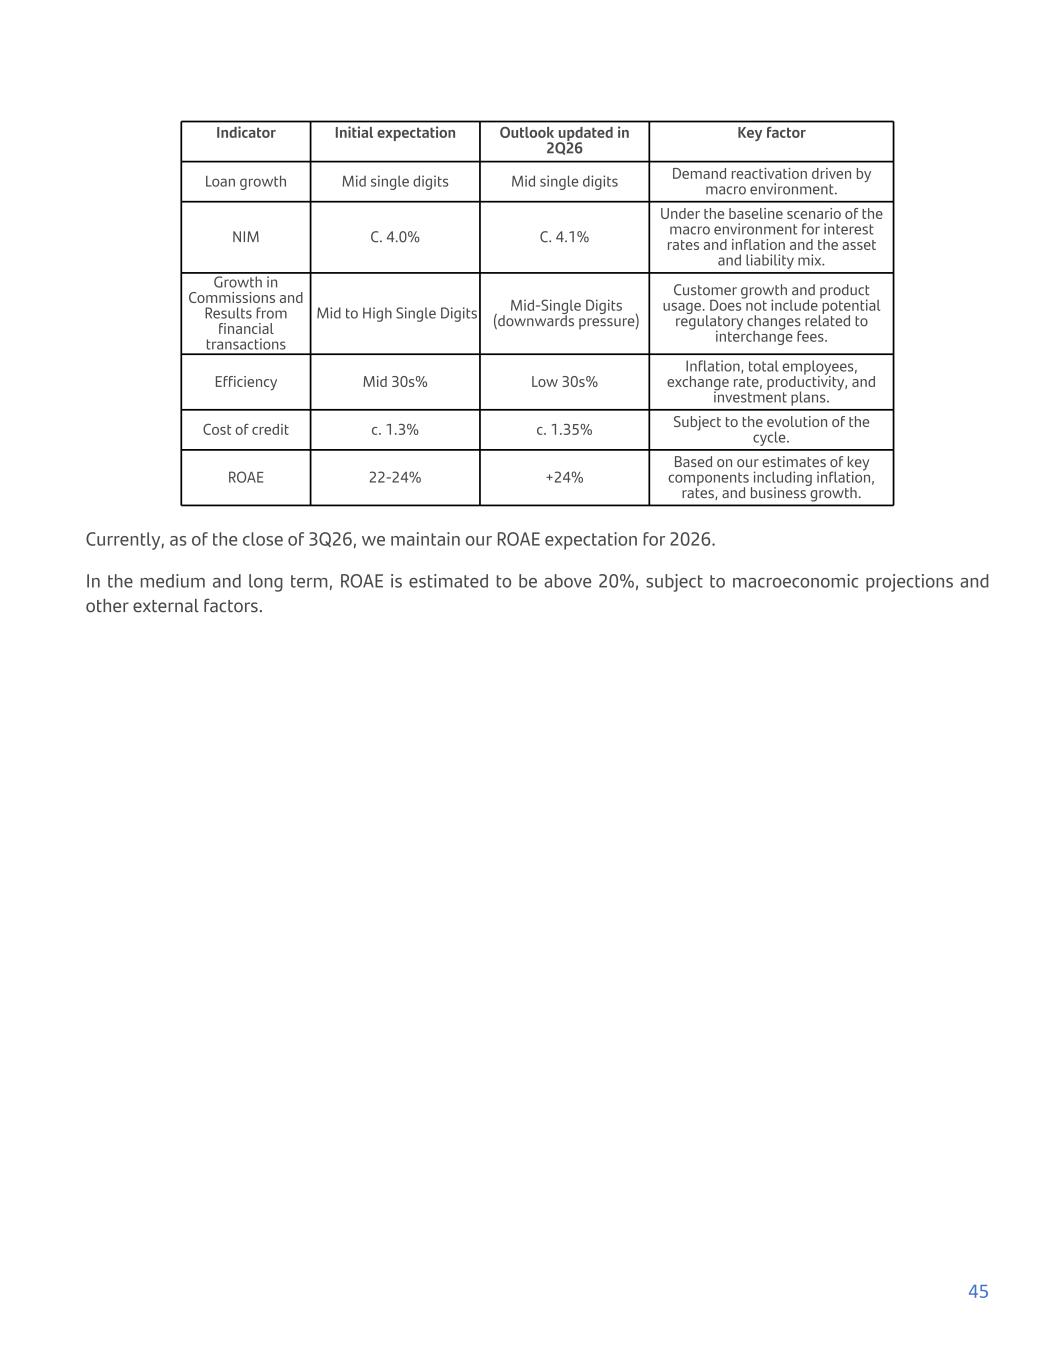
Indicator Initial expectation Outlook updated in 2Q26 Key factor Loan growth Mid single digits Mid single digits Demand reactivation driven by macro environment. NIM C. 4.0% C. 4.1% Under the baseline scenario of the macro environment for interest rates and inflation and the asset and liability mix. Growth in Commissions and Results from financial transactions Mid to High Single Digits Mid-Single Digits (downwards pressure) Customer growth and product usage. Does not include potential regulatory changes related to interchange fees. Efficiency Mid 30s% Low 30s% Inflation, total employees, exchange rate, productivity, and investment plans. Cost of credit c. 1.3% c. 1.35% Subject to the evolution of the cycle. ROAE 22-24% +24% Based on our estimates of key components including inflation, rates, and business growth. Currently, as of the close of 3Q26, we maintain our ROAE expectation for 2026. In the medium and long term, ROAE is estimated to be above 20%, subject to macroeconomic projections and other external factors. 45
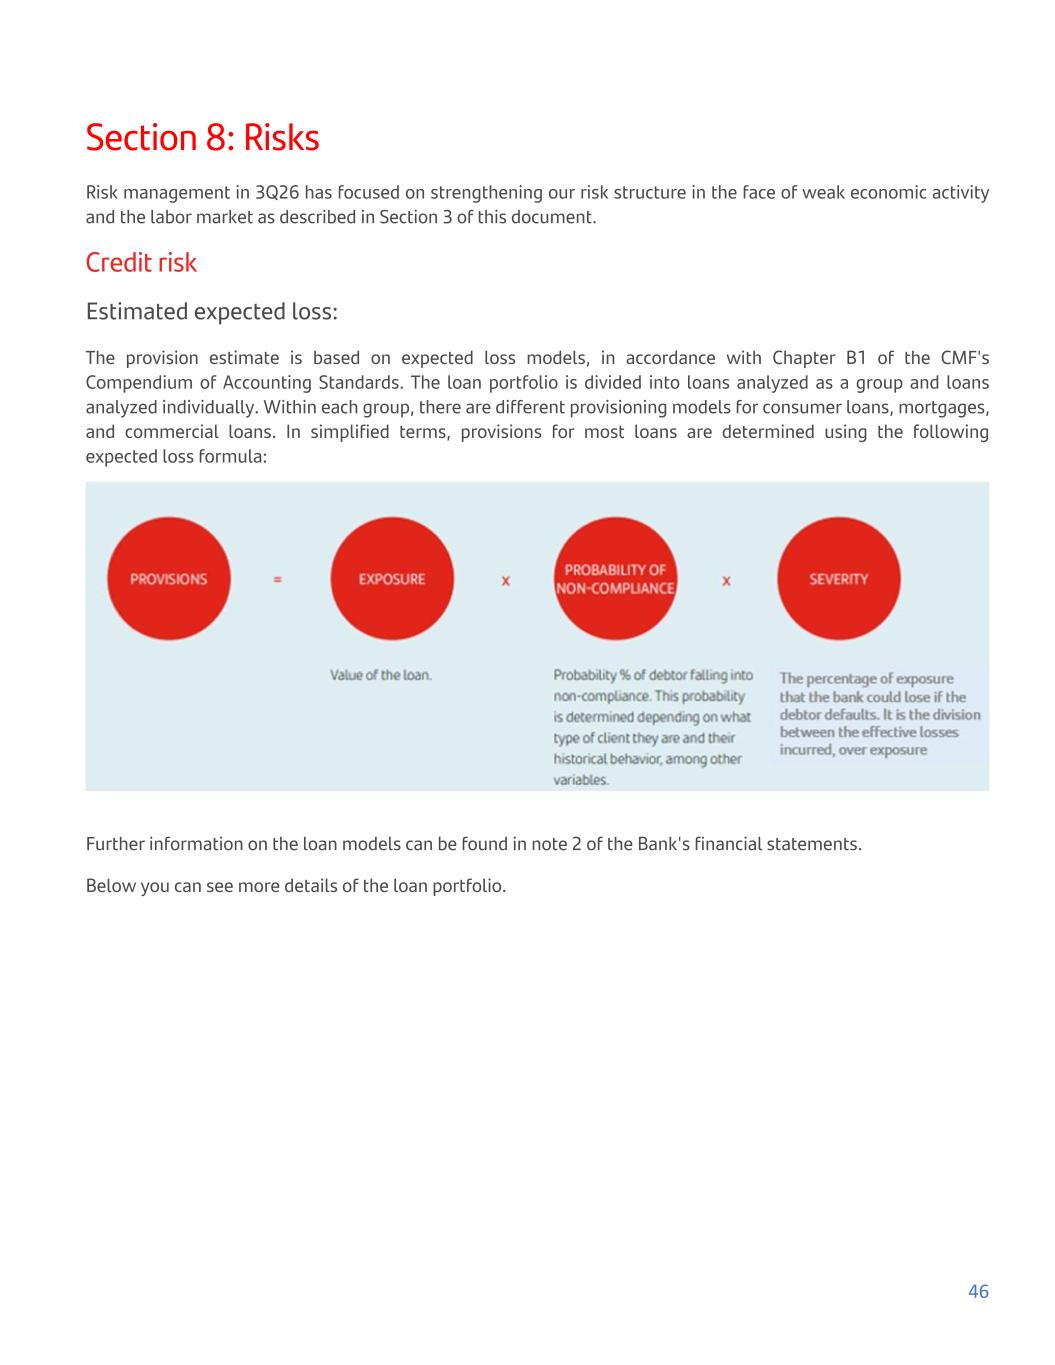
Section 8: Risks Risk management in 3Q26 has focused on strengthening our risk structure in the face of weak economic activity and the labor market as described in Section 3 of this document. Credit risk Estimated expected loss: The provision estimate is based on expected loss models, in accordance with Chapter B1 of the CMF's Compendium of Accounting Standards. The loan portfolio is divided into loans analyzed as a group and loans analyzed individually. Within each group, there are different provisioning models for consumer loans, mortgages, and commercial loans. In simplified terms, provisions for most loans are determined using the following expected loss formula: Further information on the loan models can be found in note 2 of the Bank's financial statements. Below you can see more details of the loan portfolio. 46
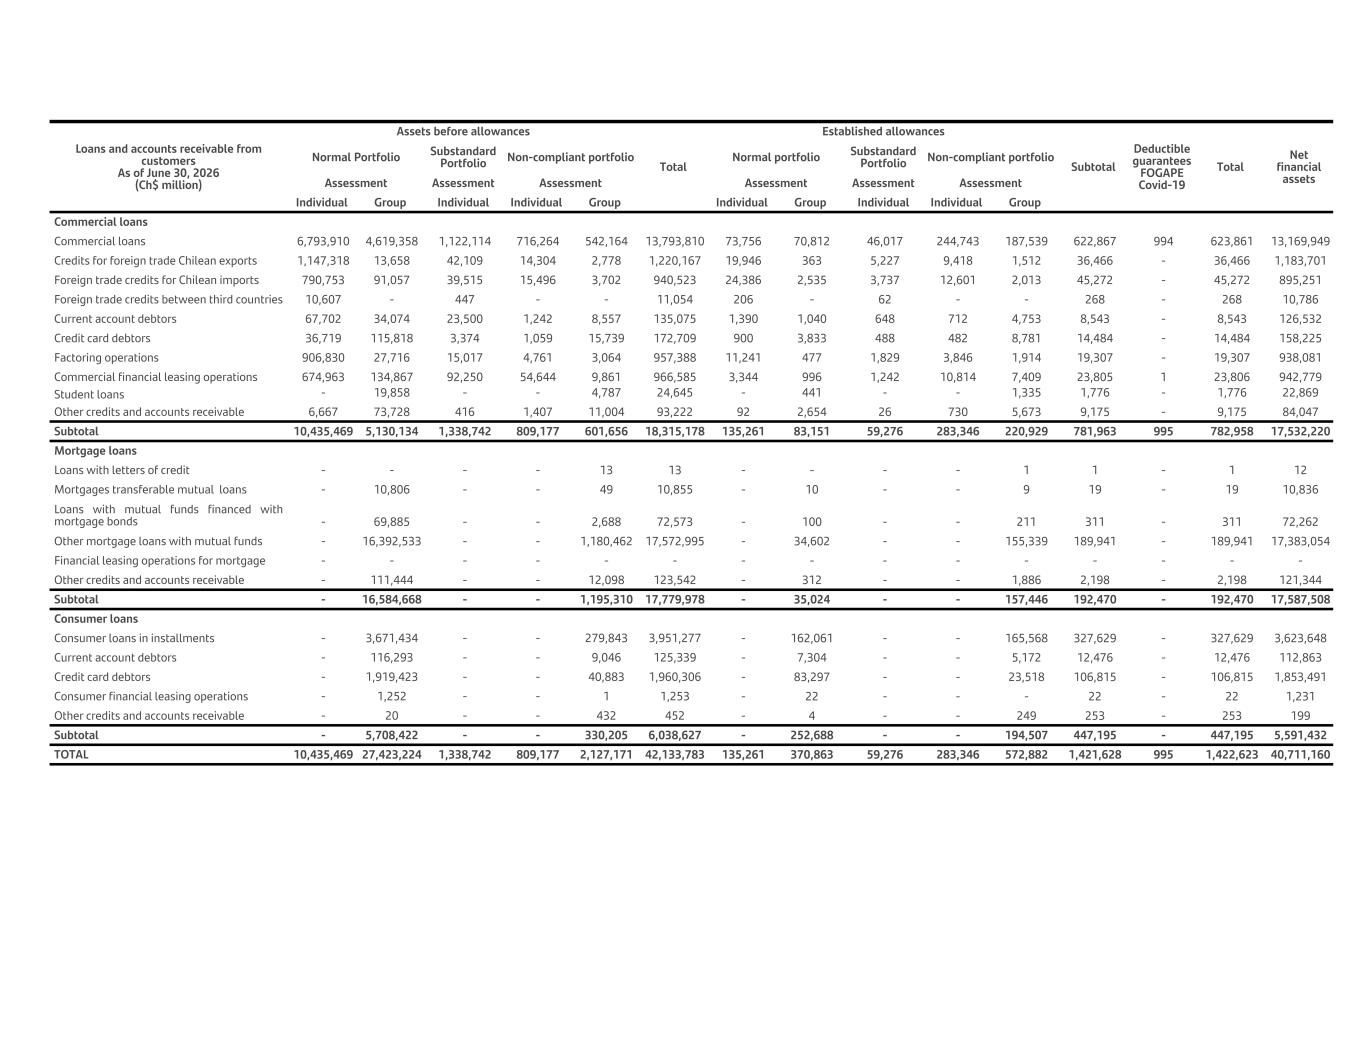
Loans and accounts receivable from customers As of June 30, 2026 (Ch$ million) Assets before allowances Total Established allowances Subtotal Deductible guarantees FOGAPE Covid-19 Total Net financial assets Normal Portfolio Substandard Portfolio Non-compliant portfolio Normal portfolio Substandard Portfolio Non-compliant portfolio Assessment Assessment Assessment Assessment Assessment Assessment Individual Group Individual Individual Group Individual Group Individual Individual Group Commercial loans Commercial loans 6,793,910 4,619,358 1,122,114 716,264 542,164 13,793,810 73,756 70,812 46,017 244,743 187,539 622,867 994 623,861 13,169,949 Credits for foreign trade Chilean exports 1,147,318 13,658 42,109 14,304 2,778 1,220,167 19,946 363 5,227 9,418 1,512 36,466 - 36,466 1,183,701 Foreign trade credits for Chilean imports 790,753 91,057 39,515 15,496 3,702 940,523 24,386 2,535 3,737 12,601 2,013 45,272 - 45,272 895,251 Foreign trade credits between third countries 10,607 - 447 - - 11,054 206 - 62 - - 268 - 268 10,786 Current account debtors 67,702 34,074 23,500 1,242 8,557 135,075 1,390 1,040 648 712 4,753 8,543 - 8,543 126,532 Credit card debtors 36,719 115,818 3,374 1,059 15,739 172,709 900 3,833 488 482 8,781 14,484 - 14,484 158,225 Factoring operations 906,830 27,716 15,017 4,761 3,064 957,388 11,241 477 1,829 3,846 1,914 19,307 - 19,307 938,081 Commercial financial leasing operations 674,963 134,867 92,250 54,644 9,861 966,585 3,344 996 1,242 10,814 7,409 23,805 1 23,806 942,779 Student loans - 19,858 - - 4,787 24,645 - 441 - - 1,335 1,776 - 1,776 22,869 Other credits and accounts receivable 6,667 73,728 416 1,407 11,004 93,222 92 2,654 26 730 5,673 9,175 - 9,175 84,047 Subtotal 10,435,469 5,130,134 1,338,742 809,177 601,656 18,315,178 135,261 83,151 59,276 283,346 220,929 781,963 995 782,958 17,532,220 Mortgage loans Loans with letters of credit - - - - 13 13 - - - - 1 1 - 1 12 Mortgages transferable mutual loans - 10,806 - - 49 10,855 - 10 - - 9 19 - 19 10,836 Loans with mutual funds financed with mortgage bonds - 69,885 - - 2,688 72,573 - 100 - - 211 311 - 311 72,262 Other mortgage loans with mutual funds - 16,392,533 - - 1,180,462 17,572,995 - 34,602 - - 155,339 189,941 - 189,941 17,383,054 Financial leasing operations for mortgage - - - - - - - - - - - - - - - Other credits and accounts receivable - 111,444 - - 12,098 123,542 - 312 - - 1,886 2,198 - 2,198 121,344 Subtotal - 16,584,668 - - 1,195,310 17,779,978 - 35,024 - - 157,446 192,470 - 192,470 17,587,508 Consumer loans Consumer loans in installments - 3,671,434 - - 279,843 3,951,277 - 162,061 - - 165,568 327,629 - 327,629 3,623,648 Current account debtors - 116,293 - - 9,046 125,339 - 7,304 - - 5,172 12,476 - 12,476 112,863 Credit card debtors - 1,919,423 - - 40,883 1,960,306 - 83,297 - - 23,518 106,815 - 106,815 1,853,491 Consumer financial leasing operations - 1,252 - - 1 1,253 - 22 - - - 22 - 22 1,231 Other credits and accounts receivable - 20 - - 432 452 - 4 - - 249 253 - 253 199 Subtotal - 5,708,422 - - 330,205 6,038,627 - 252,688 - - 194,507 447,195 - 447,195 5,591,432 TOTAL 10,435,469 27,423,224 1,338,742 809,177 2,127,171 42,133,783 135,261 370,863 59,276 283,346 572,882 1,421,628 995 1,422,623 40,711,160
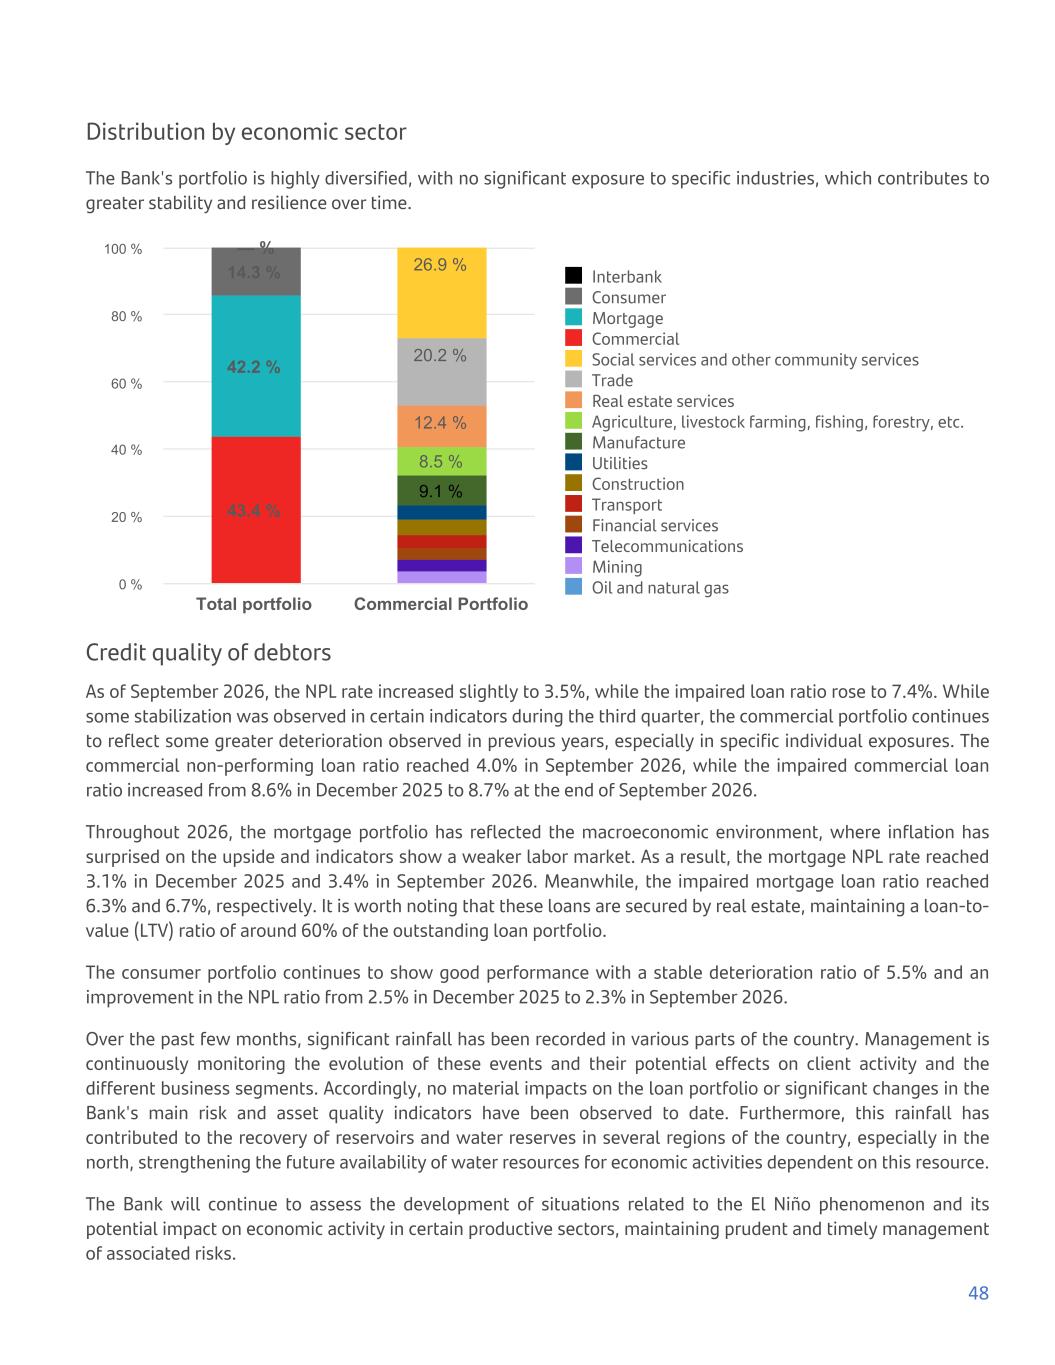
Distribution by economic sector The Bank's portfolio is highly diversified, with no significant exposure to specific industries, which contributes to greater stability and resilience over time. 9.1 % 8.5 % 12.4 % 20.2 % 26.9 % 43.4 % 42.2 % 14.3 % — % Interbank Consumer Mortgage Commercial Social services and other community services Trade Real estate services Agriculture, livestock farming, fishing, forestry, etc. Manufacture Utilities Construction Transport Financial services Telecommunications Mining Oil and natural gas Total portfolio Commercial Portfolio 0 % 20 % 40 % 60 % 80 % 100 % Credit quality of debtors As of September 2026, the NPL rate increased slightly to 3.5%, while the impaired loan ratio rose to 7.4%. While some stabilization was observed in certain indicators during the third quarter, the commercial portfolio continues to reflect some greater deterioration observed in previous years, especially in specific individual exposures. The commercial non-performing loan ratio reached 4.0% in September 2026, while the impaired commercial loan ratio increased from 8.6% in December 2025 to 8.7% at the end of September 2026. Throughout 2026, the mortgage portfolio has reflected the macroeconomic environment, where inflation has surprised on the upside and indicators show a weaker labor market. As a result, the mortgage NPL rate reached 3.1% in December 2025 and 3.4% in September 2026. Meanwhile, the impaired mortgage loan ratio reached 6.3% and 6.7%, respectively. It is worth noting that these loans are secured by real estate, maintaining a loan-to- value (LTV) ratio of around 60% of the outstanding loan portfolio. The consumer portfolio continues to show good performance with a stable deterioration ratio of 5.5% and an improvement in the NPL ratio from 2.5% in December 2025 to 2.3% in September 2026. Over the past few months, significant rainfall has been recorded in various parts of the country. Management is continuously monitoring the evolution of these events and their potential effects on client activity and the different business segments. Accordingly, no material impacts on the loan portfolio or significant changes in the Bank's main risk and asset quality indicators have been observed to date. Furthermore, this rainfall has contributed to the recovery of reservoirs and water reserves in several regions of the country, especially in the north, strengthening the future availability of water resources for economic activities dependent on this resource. The Bank will continue to assess the development of situations related to the El Niño phenomenon and its potential impact on economic activity in certain productive sectors, maintaining prudent and timely management of associated risks. 48
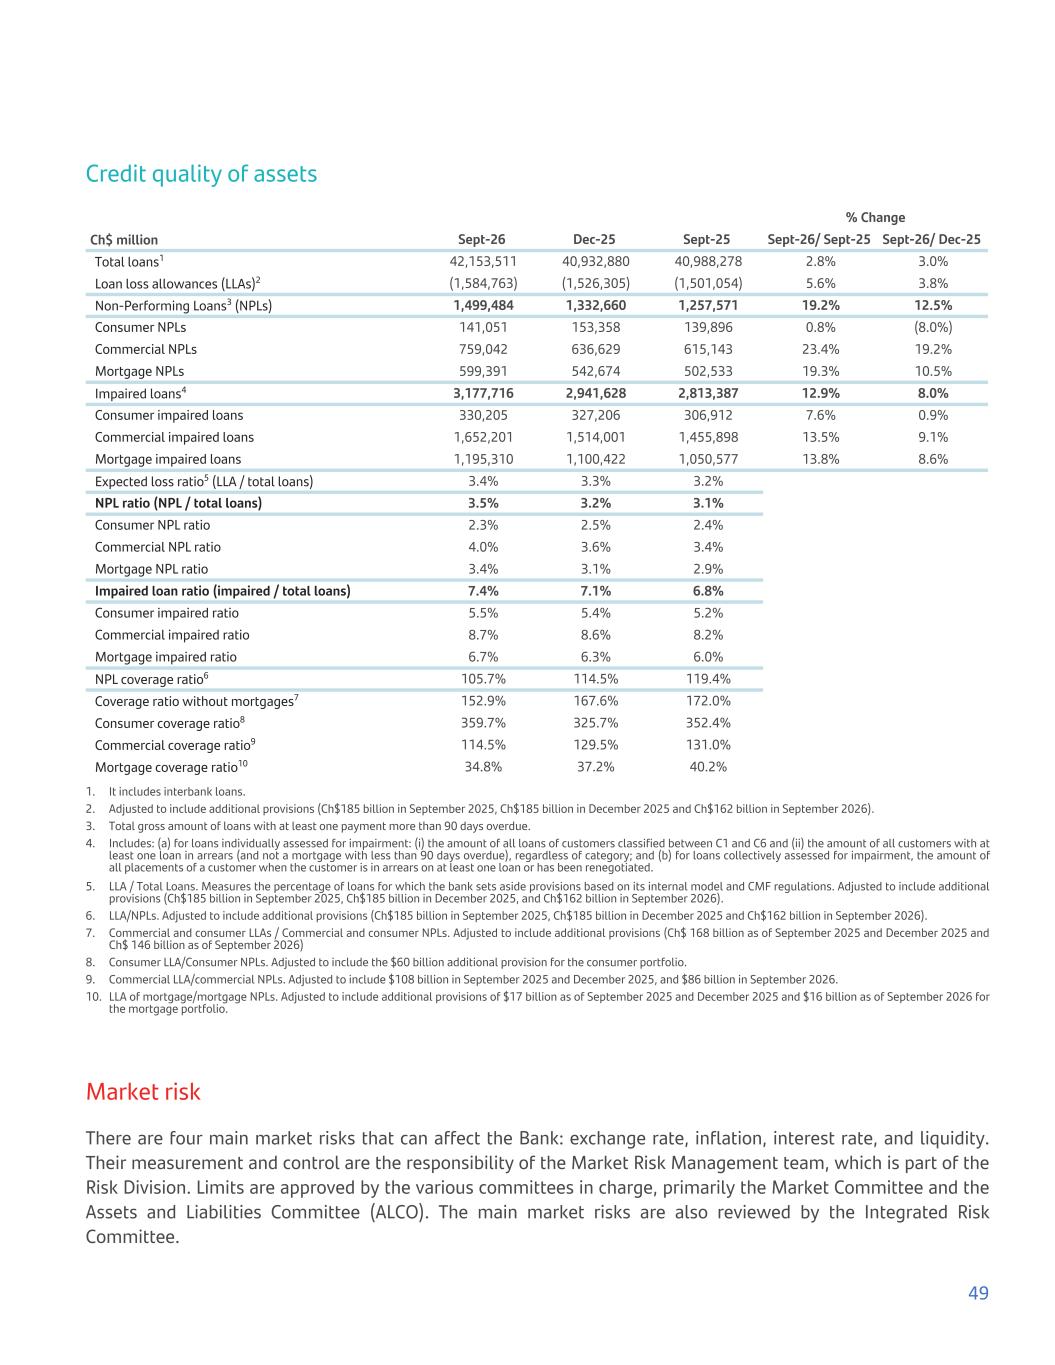
Credit quality of assets % Change Ch$ million Sept-26 Dec-25 Sept-25 Sept-26/ Sept-25 Sept-26/ Dec-25 Total loans1 42,153,511 40,932,880 40,988,278 2.8% 3.0% Loan loss allowances (LLAs)2 (1,584,763) (1,526,305) (1,501,054) 5.6% 3.8% Non-Performing Loans3 (NPLs) 1,499,484 1,332,660 1,257,571 19.2% 12.5% Consumer NPLs 141,051 153,358 139,896 0.8% (8.0%) Commercial NPLs 759,042 636,629 615,143 23.4% 19.2% Mortgage NPLs 599,391 542,674 502,533 19.3% 10.5% Impaired loans4 3,177,716 2,941,628 2,813,387 12.9% 8.0% Consumer impaired loans 330,205 327,206 306,912 7.6% 0.9% Commercial impaired loans 1,652,201 1,514,001 1,455,898 13.5% 9.1% Mortgage impaired loans 1,195,310 1,100,422 1,050,577 13.8% 8.6% Expected loss ratio5 (LLA / total loans) 3.4% 3.3% 3.2% NPL ratio (NPL / total loans) 3.5% 3.2% 3.1% Consumer NPL ratio 2.3% 2.5% 2.4% Commercial NPL ratio 4.0% 3.6% 3.4% Mortgage NPL ratio 3.4% 3.1% 2.9% Impaired loan ratio (impaired / total loans) 7.4% 7.1% 6.8% Consumer impaired ratio 5.5% 5.4% 5.2% Commercial impaired ratio 8.7% 8.6% 8.2% Mortgage impaired ratio 6.7% 6.3% 6.0% NPL coverage ratio6 105.7% 114.5% 119.4% Coverage ratio without mortgages7 152.9% 167.6% 172.0% Consumer coverage ratio8 359.7% 325.7% 352.4% Commercial coverage ratio9 114.5% 129.5% 131.0% Mortgage coverage ratio10 34.8% 37.2% 40.2% 1. It includes interbank loans. 2. Adjusted to include additional provisions (Ch$185 billion in September 2025, Ch$185 billion in December 2025 and Ch$162 billion in September 2026). 3. Total gross amount of loans with at least one payment more than 90 days overdue. 4. Includes: (a) for loans individually assessed for impairment: (i) the amount of all loans of customers classified between C1 and C6 and (ii) the amount of all customers with at least one loan in arrears (and not a mortgage with less than 90 days overdue), regardless of category; and (b) for loans collectively assessed for impairment, the amount of all placements of a customer when the customer is in arrears on at least one loan or has been renegotiated. 5. LLA / Total Loans. Measures the percentage of loans for which the bank sets aside provisions based on its internal model and CMF regulations. Adjusted to include additional provisions (Ch$185 billion in September 2025, Ch$185 billion in December 2025, and Ch$162 billion in September 2026). 6. LLA/NPLs. Adjusted to include additional provisions (Ch$185 billion in September 2025, Ch$185 billion in December 2025 and Ch$162 billion in September 2026). 7. Commercial and consumer LLAs / Commercial and consumer NPLs. Adjusted to include additional provisions (Ch$ 168 billion as of September 2025 and December 2025 and Ch$ 146 billion as of September 2026) 8. Consumer LLA/Consumer NPLs. Adjusted to include the $60 billion additional provision for the consumer portfolio. 9. Commercial LLA/commercial NPLs. Adjusted to include $108 billion in September 2025 and December 2025, and $86 billion in September 2026. 10. LLA of mortgage/mortgage NPLs. Adjusted to include additional provisions of $17 billion as of September 2025 and December 2025 and $16 billion as of September 2026 for the mortgage portfolio. Market risk There are four main market risks that can affect the Bank: exchange rate, inflation, interest rate, and liquidity. Their measurement and control are the responsibility of the Market Risk Management team, which is part of the Risk Division. Limits are approved by the various committees in charge, primarily the Market Committee and the Assets and Liabilities Committee (ALCO). The main market risks are also reviewed by the Integrated Risk Committee. 49
The Financial and Capital Management areas, as part of the Financial Division, have the following functions, which are supervised and controlled by the ALCO and the Risk Management: • Optimizing the cost of liabilities by seeking the most efficient financing strategies, including the issuance of bonds and bank lines of credit. • Manage short- and long-term regulatory liquidity limits. • Inflation risk management and exposure. • Manage local and foreign currency exchange rate risk. • Capital adequacy and requirements. Liquidity risk The Financial Management area manages liquidity risk using a portfolio of liquid assets to ensure the Bank always maintains sufficient liquidity to cover short-term fluctuations and long-term financing, in compliance with internal regulatory liquidity requirements. The Financial Management Department receives information from all business units regarding the liquidity profile of their financial assets and liabilities, as well as a breakdown of other projected cash flows from future business activities. Based on this information, the area maintains a portfolio of short-term liquid assets, primarily consisting of liquid investments, loans, and advances to other banks, to ensure the Bank has sufficient liquidity. The liquidity needs of the business units are met through short-term transfers from Financial Management to cover short-term fluctuations and long-term financing to address all structural liquidity requirements. The Bank monitors its liquidity position daily, determining future cash inflows and outflows. Additionally, stress tests are conducted at the end of each month, using a variety of scenarios that encompass both normal market conditions and market fluctuations. Liquidity policies and procedures are subject to review and approval by the Bank's Board of Directors. Periodic reports are generated by the Market Risk Department, detailing the liquidity position of the Bank and its subsidiaries, including exceptions and corrective measures taken. These reports are submitted periodically to the ALCO for review. The Bank obtains demand and time deposits from its customer base, while the Finance Department obtains funding from correspondent banks, debt instruments, commercial paper, and wholesale time deposits. Although most obligations to banks and debt instruments mature in more than one year, customer and wholesale deposits tend to have shorter maturities, with a large proportion payable within 90 days. The short-term nature of these deposits increases the Bank's liquidity risk, and therefore, the Bank actively manages this risk through continuous monitoring of market trends and pricing management. High-quality liquid assets High-quality liquid assets (HQLAs) are an essential component of liquidity risk management. They consist of balance sheet assets, primarily composed of financial investments that are not pledged as collateral, have low credit risk, and have a deep secondary market. According to Basel III standards, these assets are divided into three tiers, with Tier 1 assets being the most liquid and Tier 3 assets the least liquid. 50
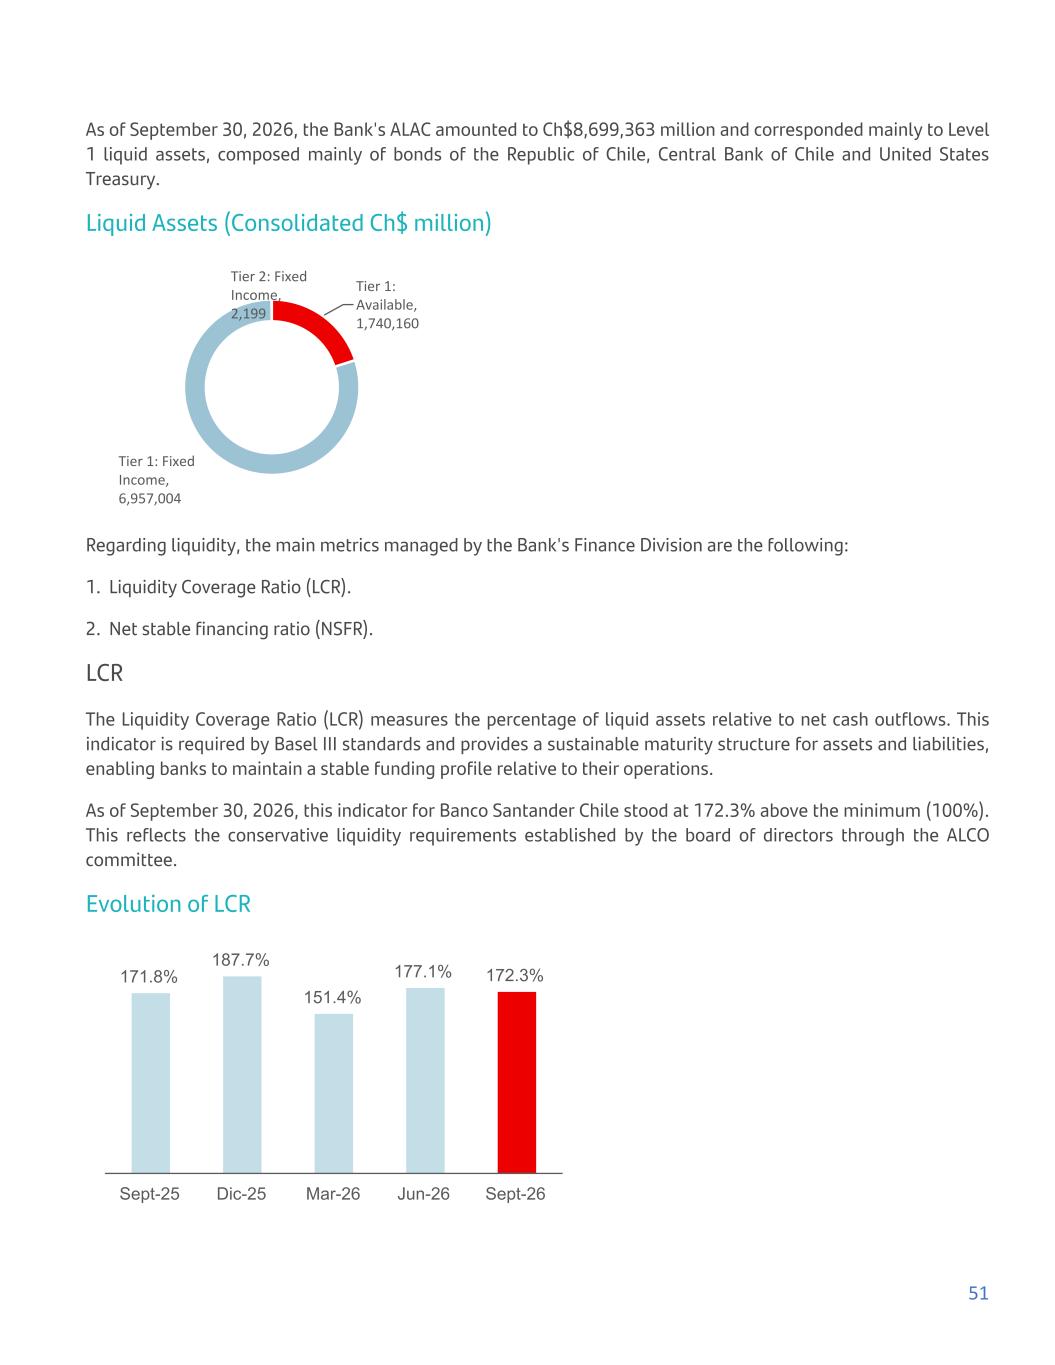
As of September 30, 2026, the Bank's ALAC amounted to Ch$8,699,363 million and corresponded mainly to Level 1 liquid assets, composed mainly of bonds of the Republic of Chile, Central Bank of Chile and United States Treasury. Liquid Assets (Consolidated Ch$ million) Tier 1: Available, 1,740,160 Tier 1: Fixed Income, 6,957,004 Tier 2: Fixed Income, 2,199 Regarding liquidity, the main metrics managed by the Bank's Finance Division are the following: 1. Liquidity Coverage Ratio (LCR). 2. Net stable financing ratio (NSFR). LCR The Liquidity Coverage Ratio (LCR) measures the percentage of liquid assets relative to net cash outflows. This indicator is required by Basel III standards and provides a sustainable maturity structure for assets and liabilities, enabling banks to maintain a stable funding profile relative to their operations. As of September 30, 2026, this indicator for Banco Santander Chile stood at 172.3% above the minimum (100%). This reflects the conservative liquidity requirements established by the board of directors through the ALCO committee. Evolution of LCR 171.8% 187.7% 151.4% 177.1% 172.3% Sept-25 Dic-25 Mar-26 Jun-26 Sept-26 51
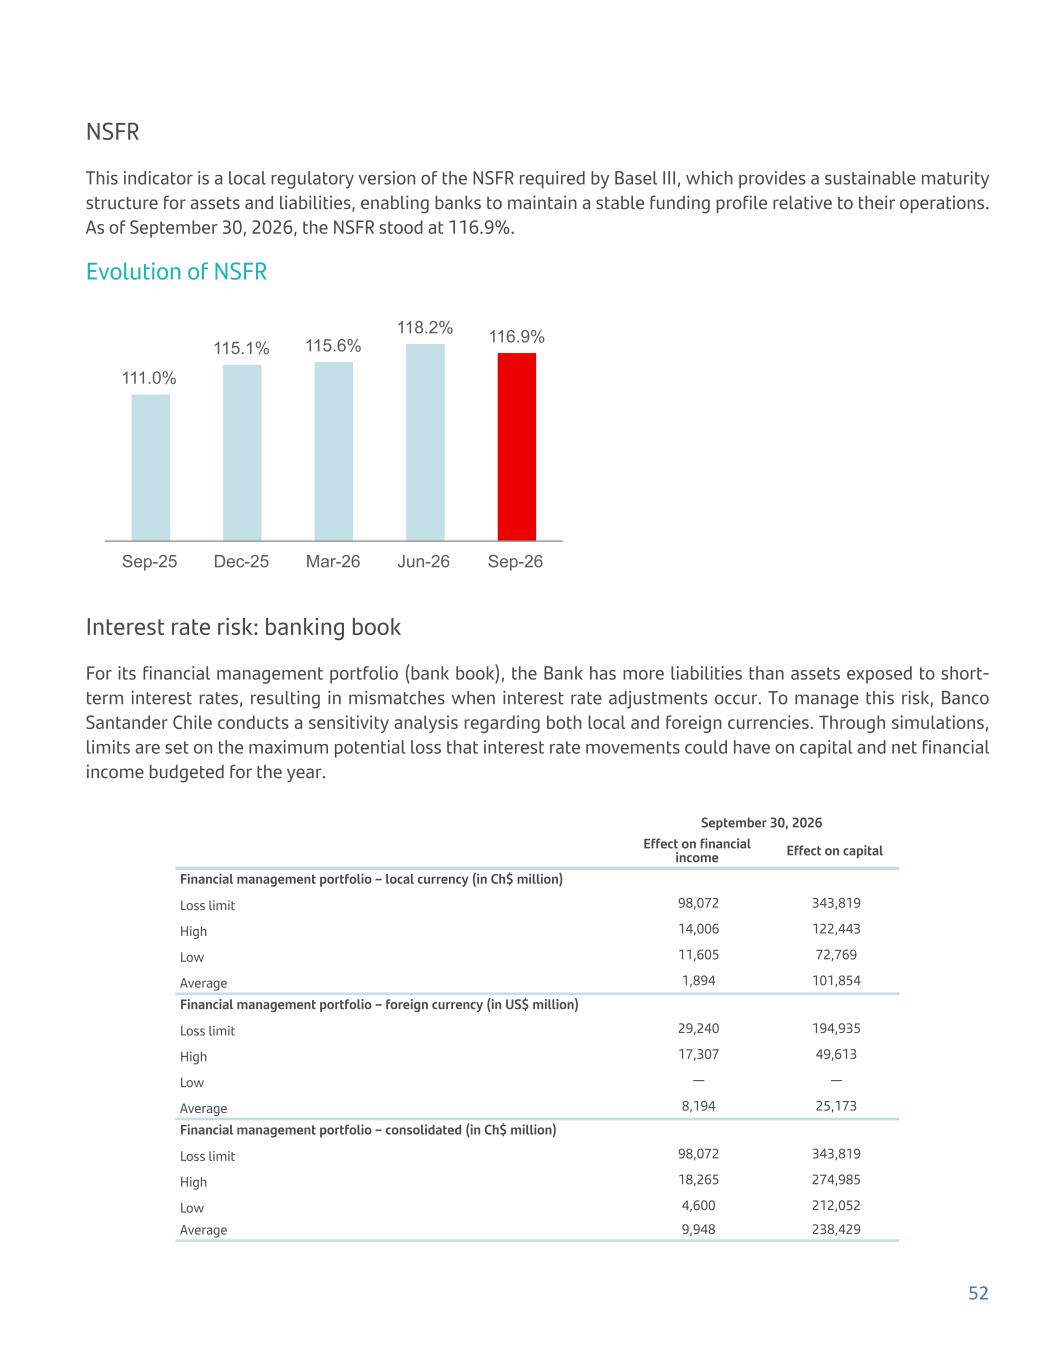
NSFR This indicator is a local regulatory version of the NSFR required by Basel III, which provides a sustainable maturity structure for assets and liabilities, enabling banks to maintain a stable funding profile relative to their operations. As of September 30, 2026, the NSFR stood at 116.9%. Evolution of NSFR 111.0% 115.1% 115.6% 118.2% 116.9% Sep-25 Dec-25 Mar-26 Jun-26 Sep-26 Interest rate risk: banking book For its financial management portfolio (bank book), the Bank has more liabilities than assets exposed to short- term interest rates, resulting in mismatches when interest rate adjustments occur. To manage this risk, Banco Santander Chile conducts a sensitivity analysis regarding both local and foreign currencies. Through simulations, limits are set on the maximum potential loss that interest rate movements could have on capital and net financial income budgeted for the year. September 30, 2026 Effect on financial income Effect on capital Financial management portfolio – local currency (in Ch$ million) Loss limit 98,072 343,819 High 14,006 122,443 Low 11,605 72,769 Average 1,894 101,854 Financial management portfolio – foreign currency (in US$ million) Loss limit 29,240 194,935 High 17,307 49,613 Low — — Average 8,194 25,173 Financial management portfolio – consolidated (in Ch$ million) Loss limit 98,072 343,819 High 18,265 274,985 Low 4,600 212,052 Average 9,948 238,429 52
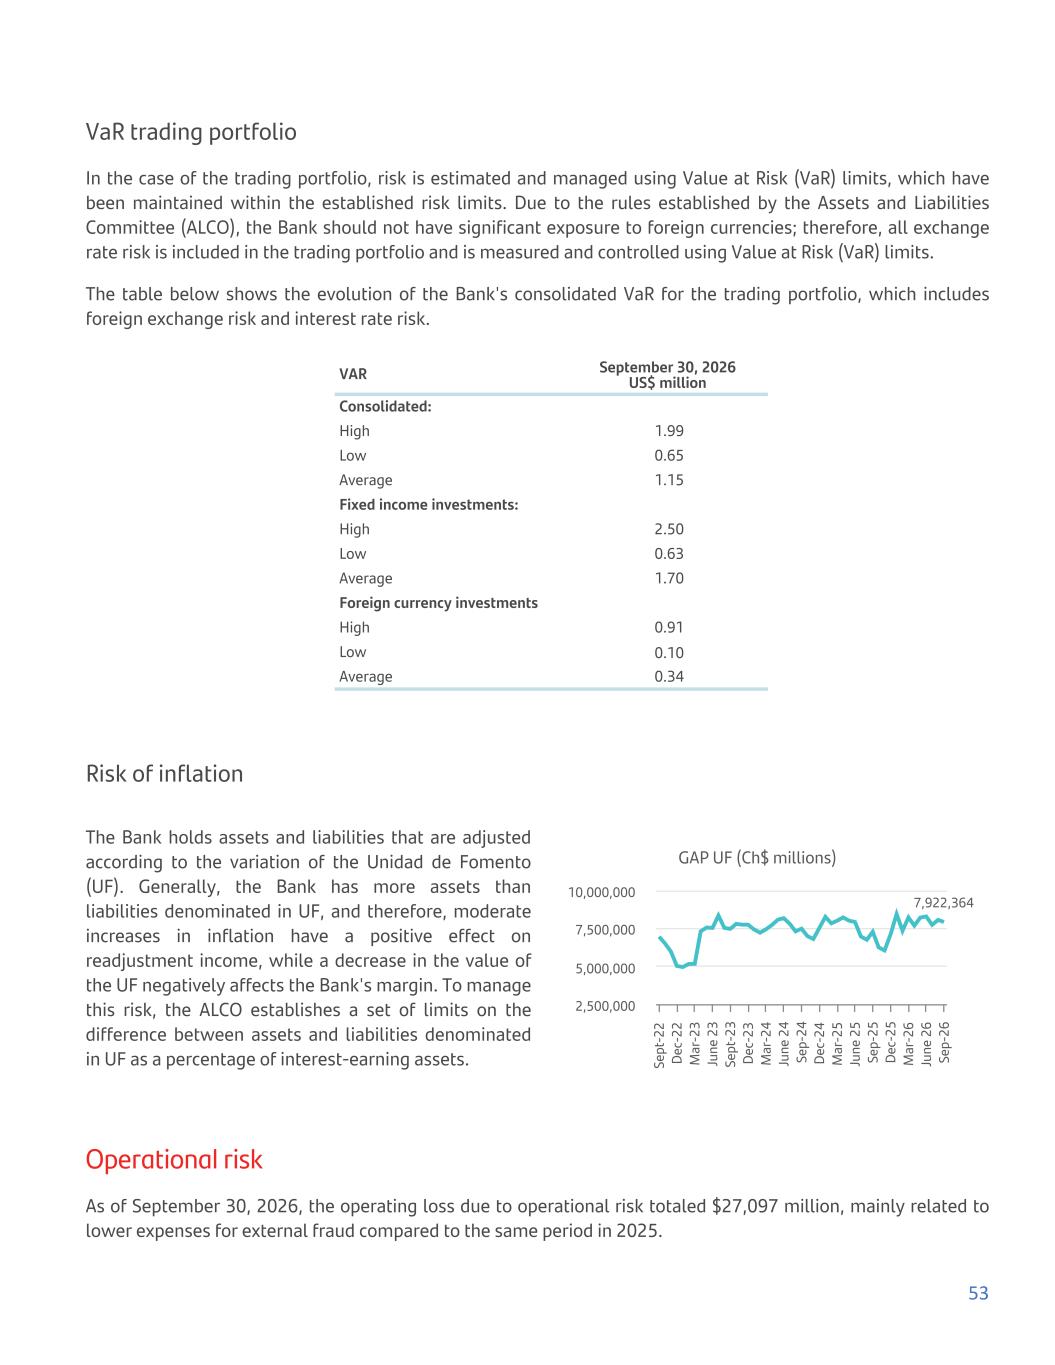
VaR trading portfolio In the case of the trading portfolio, risk is estimated and managed using Value at Risk (VaR) limits, which have been maintained within the established risk limits. Due to the rules established by the Assets and Liabilities Committee (ALCO), the Bank should not have significant exposure to foreign currencies; therefore, all exchange rate risk is included in the trading portfolio and is measured and controlled using Value at Risk (VaR) limits. The table below shows the evolution of the Bank's consolidated VaR for the trading portfolio, which includes foreign exchange risk and interest rate risk. VAR September 30, 2026 US$ million Consolidated: High 1.99 Low 0.65 Average 1.15 Fixed income investments: High 2.50 Low 0.63 Average 1.70 Foreign currency investments High 0.91 Low 0.10 Average 0.34 Risk of inflation The Bank holds assets and liabilities that are adjusted according to the variation of the Unidad de Fomento (UF). Generally, the Bank has more assets than liabilities denominated in UF, and therefore, moderate increases in inflation have a positive effect on readjustment income, while a decrease in the value of the UF negatively affects the Bank's margin. To manage this risk, the ALCO establishes a set of limits on the difference between assets and liabilities denominated in UF as a percentage of interest-earning assets. GAP UF (Ch$ millions) 7,922,364 Se pt -2 2 De c- 22 M ar -2 3 Ju ne 2 3 Se pt -2 3 De c- 23 M ar -2 4 Ju ne 2 4 Se p- 24 De c- 24 M ar -2 5 Ju ne 2 5 Se p- 25 De c- 25 M ar -2 6 Ju ne 2 6 Se p- 26 2,500,000 5,000,000 7,500,000 10,000,000 Operational risk As of September 30, 2026, the operating loss due to operational risk totaled $27,097 million, mainly related to lower expenses for external fraud compared to the same period in 2025. 53
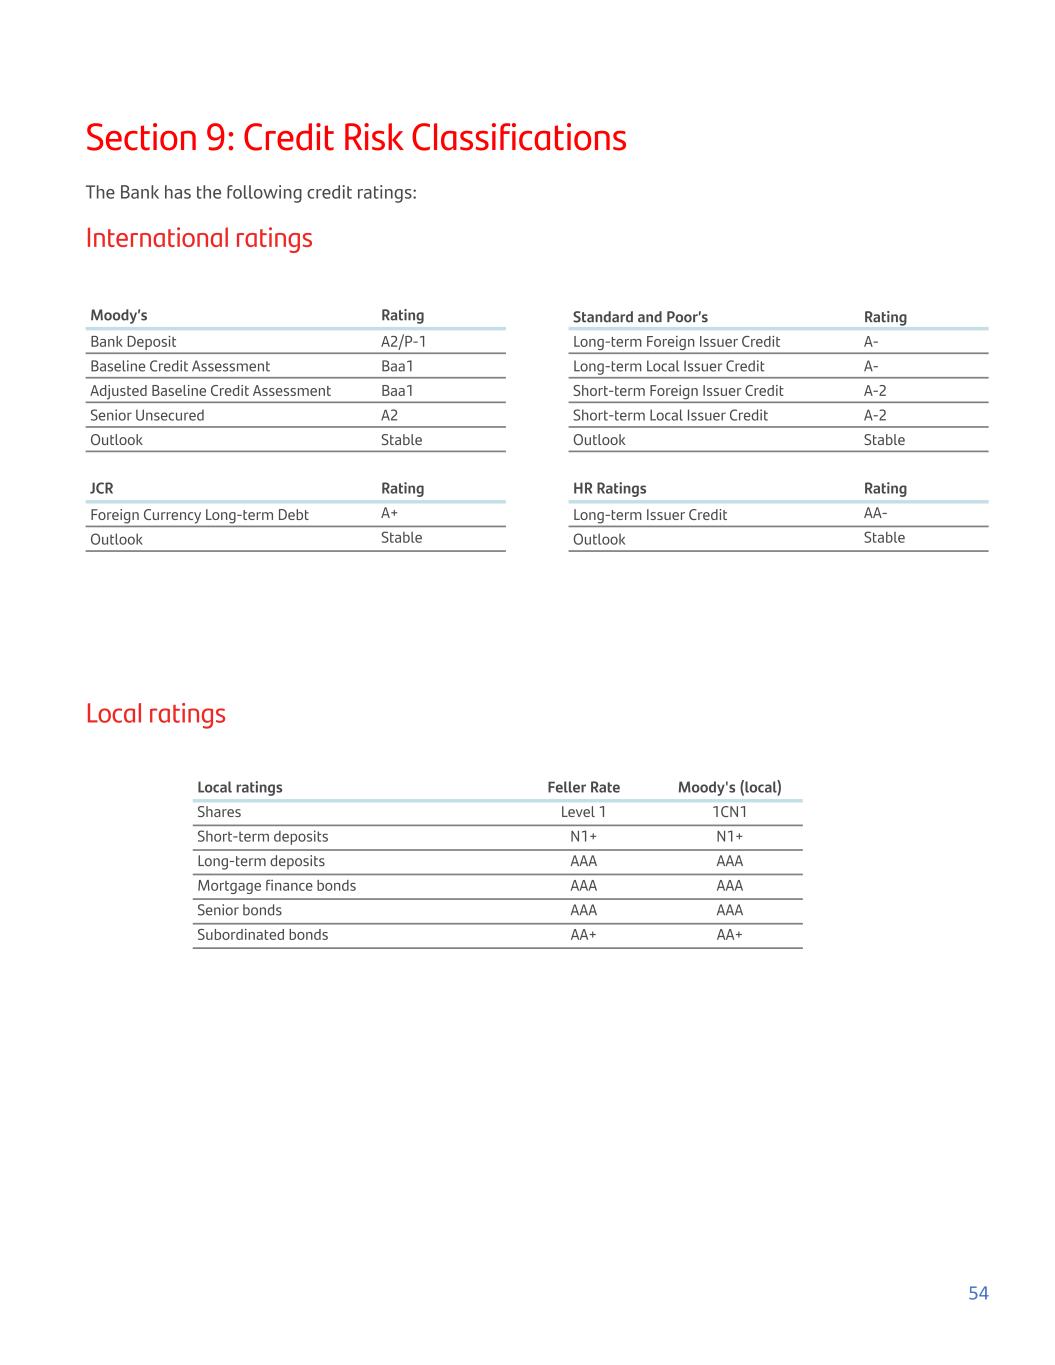
Section 9: Credit Risk Classifications The Bank has the following credit ratings: International ratings Moody’s Rating Bank Deposit A2/P-1 Baseline Credit Assessment Baa1 Adjusted Baseline Credit Assessment Baa1 Senior Unsecured A2 Outlook Stable Standard and Poor’s Rating Long-term Foreign Issuer Credit A- Long-term Local Issuer Credit A- Short-term Foreign Issuer Credit A-2 Short-term Local Issuer Credit A-2 Outlook Stable JCR Rating Foreign Currency Long-term Debt A+ Outlook Stable HR Ratings Rating Long-term Issuer Credit AA- Outlook Stable Local ratings Local ratings Feller Rate Moody's (local) Shares Level 1 1CN1 Short-term deposits N1+ N1+ Long-term deposits AAA AAA Mortgage finance bonds AAA AAA Senior bonds AAA AAA Subordinated bonds AA+ AA+ 54
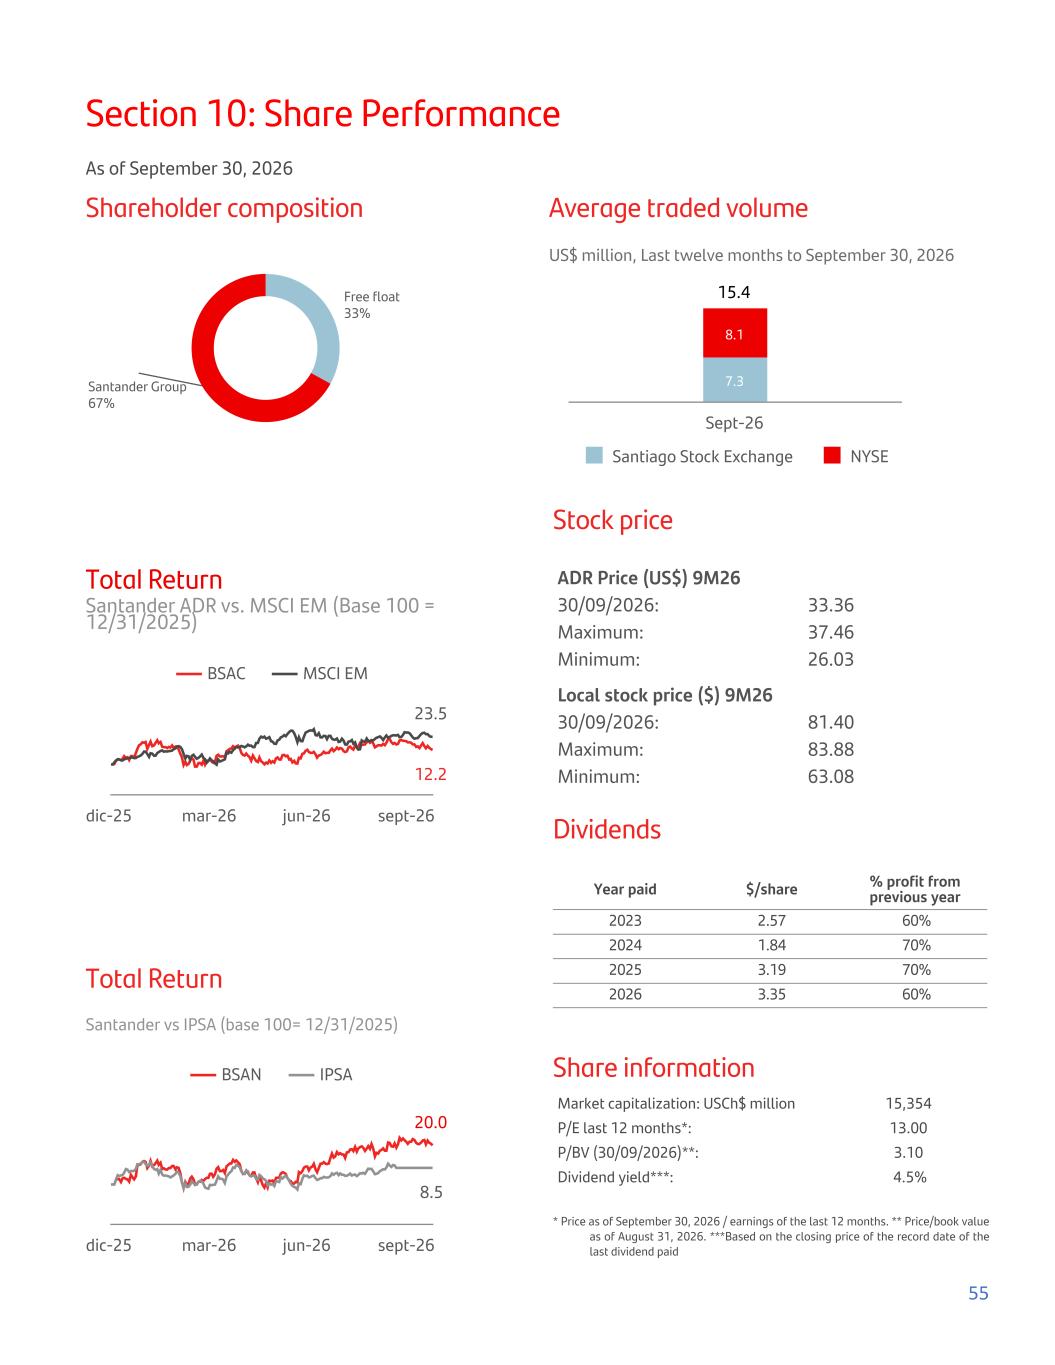
Section 10: Share Performance As of September 30, 2026 Shareholder composition Free float 33% Santander Group 67% Average traded volume US$ million, Last twelve months to September 30, 2026 15.4 7.3 8.1 Santiago Stock Exchange NYSE Sept-26 Total Return Santander ADR vs. MSCI EM (Base 100 = 12/31/2025) 12.2 23.5 BSAC MSCI EM dic-25 mar-26 jun-26 sept-26 Total Return Santander vs IPSA (base 100= 12/31/2025) 20.0 8.5 BSAN IPSA dic-25 mar-26 jun-26 sept-26 Stock price ADR Price (US$) 9M26 30/09/2026: 33.36 Maximum: 37.46 Minimum: 26.03 Local stock price ($) 9M26 30/09/2026: 81.40 Maximum: 83.88 Minimum: 63.08 Dividends Year paid $/share % profit from previous year 2023 2.57 60% 2024 1.84 70% 2025 3.19 70% 2026 3.35 60% Share information Market capitalization: USCh$ million 15,354 P/E last 12 months*: 13.00 P/BV (30/09/2026)**: 3.10 Dividend yield***: 4.5% * Price as of September 30, 2026 / earnings of the last 12 months. ** Price/book value as of August 31, 2026. ***Based on the closing price of the record date of the last dividend paid 55
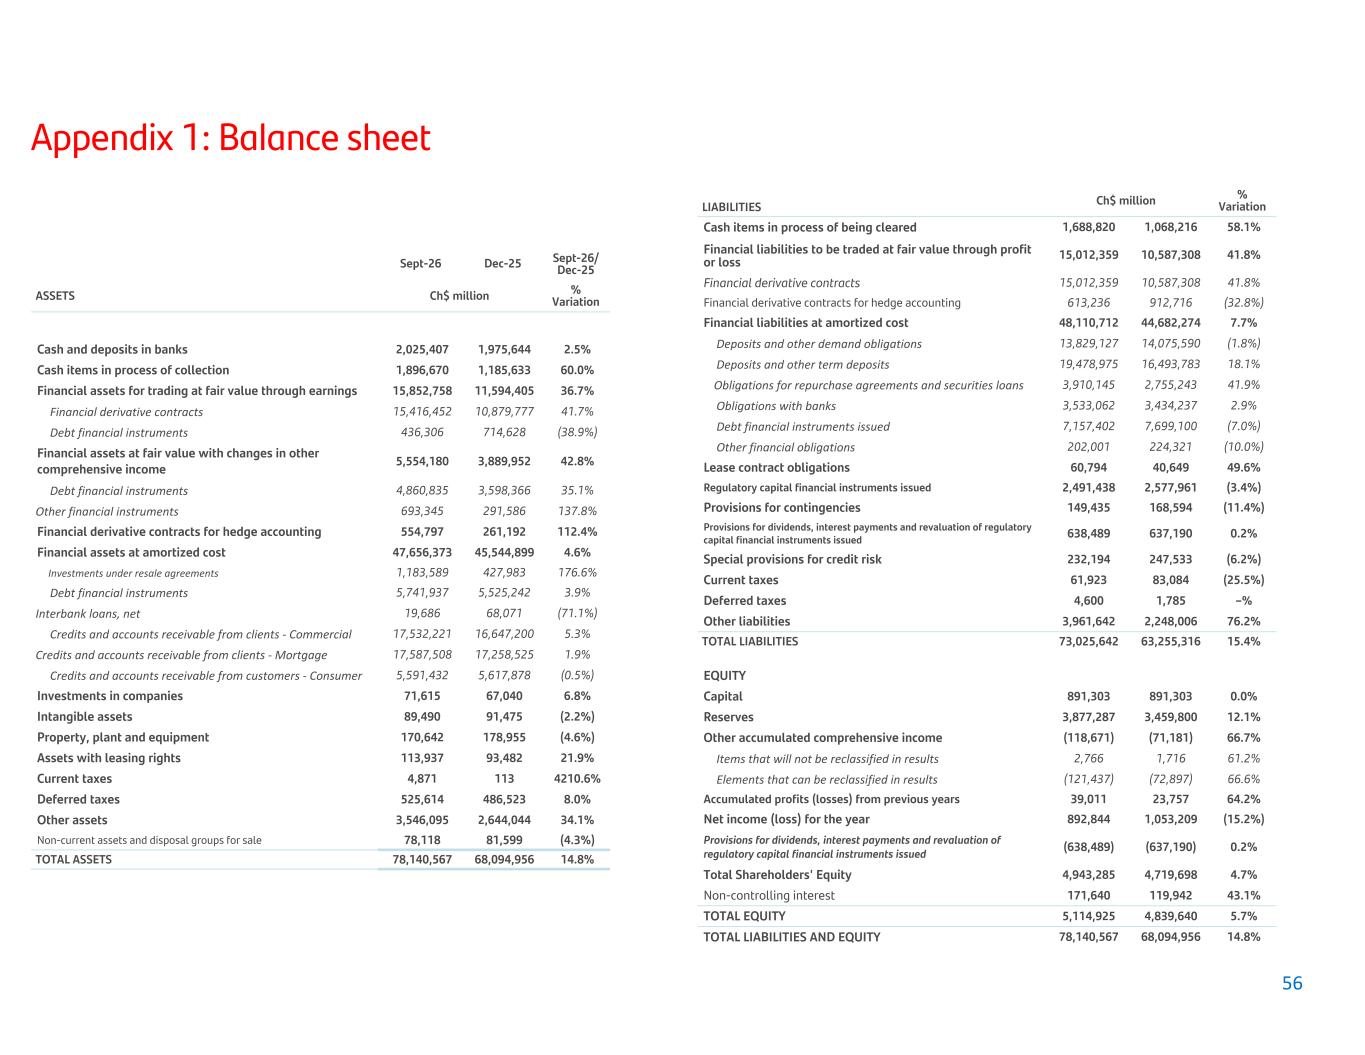
Appendix 1: Balance sheet Sept-26 Dec-25 Sept-26/ Dec-25 ASSETS Ch$ million % Variation Cash and deposits in banks 2,025,407 1,975,644 2.5% Cash items in process of collection 1,896,670 1,185,633 60.0% Financial assets for trading at fair value through earnings 15,852,758 11,594,405 36.7% Financial derivative contracts 15,416,452 10,879,777 41.7% Debt financial instruments 436,306 714,628 (38.9%) Financial assets at fair value with changes in other comprehensive income 5,554,180 3,889,952 42.8% Debt financial instruments 4,860,835 3,598,366 35.1% Other financial instruments 693,345 291,586 137.8% Financial derivative contracts for hedge accounting 554,797 261,192 112.4% Financial assets at amortized cost 47,656,373 45,544,899 4.6% Investments under resale agreements 1,183,589 427,983 176.6% Debt financial instruments 5,741,937 5,525,242 3.9% Interbank loans, net 19,686 68,071 (71.1%) Credits and accounts receivable from clients - Commercial 17,532,221 16,647,200 5.3% Credits and accounts receivable from clients - Mortgage 17,587,508 17,258,525 1.9% Credits and accounts receivable from customers - Consumer 5,591,432 5,617,878 (0.5%) Investments in companies 71,615 67,040 6.8% Intangible assets 89,490 91,475 (2.2%) Property, plant and equipment 170,642 178,955 (4.6%) Assets with leasing rights 113,937 93,482 21.9% Current taxes 4,871 113 4210.6% Deferred taxes 525,614 486,523 8.0% Other assets 3,546,095 2,644,044 34.1% Non-current assets and disposal groups for sale 78,118 81,599 (4.3%) TOTAL ASSETS 78,140,567 68,094,956 14.8% LIABILITIES Ch$ million % Variation Cash items in process of being cleared 1,688,820 1,068,216 58.1% Financial liabilities to be traded at fair value through profit or loss 15,012,359 10,587,308 41.8% Financial derivative contracts 15,012,359 10,587,308 41.8% Financial derivative contracts for hedge accounting 613,236 912,716 (32.8%) Financial liabilities at amortized cost 48,110,712 44,682,274 7.7% Deposits and other demand obligations 13,829,127 14,075,590 (1.8%) Deposits and other term deposits 19,478,975 16,493,783 18.1% Obligations for repurchase agreements and securities loans 3,910,145 2,755,243 41.9% Obligations with banks 3,533,062 3,434,237 2.9% Debt financial instruments issued 7,157,402 7,699,100 (7.0%) Other financial obligations 202,001 224,321 (10.0%) Lease contract obligations 60,794 40,649 49.6% Regulatory capital financial instruments issued 2,491,438 2,577,961 (3.4%) Provisions for contingencies 149,435 168,594 (11.4%) Provisions for dividends, interest payments and revaluation of regulatory capital financial instruments issued 638,489 637,190 0.2% Special provisions for credit risk 232,194 247,533 (6.2%) Current taxes 61,923 83,084 (25.5%) Deferred taxes 4,600 1,785 –% Other liabilities 3,961,642 2,248,006 76.2% TOTAL LIABILITIES 73,025,642 63,255,316 15.4% EQUITY Capital 891,303 891,303 0.0% Reserves 3,877,287 3,459,800 12.1% Other accumulated comprehensive income (118,671) (71,181) 66.7% Items that will not be reclassified in results 2,766 1,716 61.2% Elements that can be reclassified in results (121,437) (72,897) 66.6% Accumulated profits (losses) from previous years 39,011 23,757 64.2% Net income (loss) for the year 892,844 1,053,209 (15.2%) Provisions for dividends, interest payments and revaluation of regulatory capital financial instruments issued (638,489) (637,190) 0.2% Total Shareholders' Equity 4,943,285 4,719,698 4.7% Non-controlling interest 171,640 119,942 43.1% TOTAL EQUITY 5,114,925 4,839,640 5.7% TOTAL LIABILITIES AND EQUITY 78,140,567 68,094,956 14.8% 56
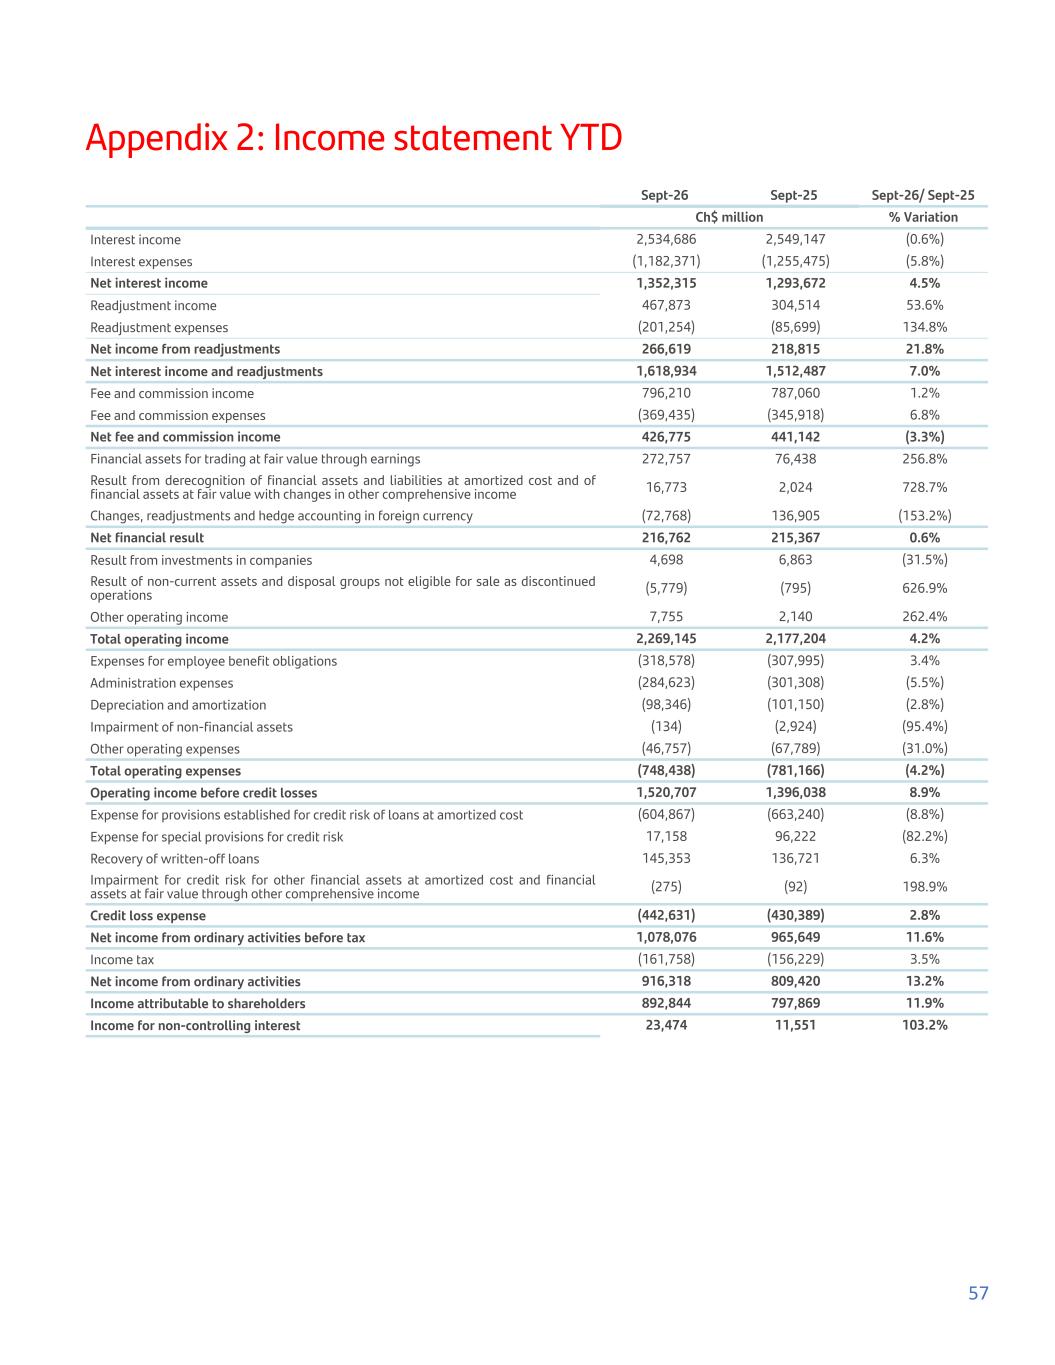
Appendix 2: Income statement YTD Sept-26 Sept-25 Sept-26/ Sept-25 Ch$ million % Variation Interest income 2,534,686 2,549,147 (0.6%) Interest expenses (1,182,371) (1,255,475) (5.8%) Net interest income 1,352,315 1,293,672 4.5% Readjustment income 467,873 304,514 53.6% Readjustment expenses (201,254) (85,699) 134.8% Net income from readjustments 266,619 218,815 21.8% Net interest income and readjustments 1,618,934 1,512,487 7.0% Fee and commission income 796,210 787,060 1.2% Fee and commission expenses (369,435) (345,918) 6.8% Net fee and commission income 426,775 441,142 (3.3%) Financial assets for trading at fair value through earnings 272,757 76,438 256.8% Result from derecognition of financial assets and liabilities at amortized cost and of financial assets at fair value with changes in other comprehensive income 16,773 2,024 728.7% Changes, readjustments and hedge accounting in foreign currency (72,768) 136,905 (153.2%) Net financial result 216,762 215,367 0.6% Result from investments in companies 4,698 6,863 (31.5%) Result of non-current assets and disposal groups not eligible for sale as discontinued operations (5,779) (795) 626.9% Other operating income 7,755 2,140 262.4% Total operating income 2,269,145 2,177,204 4.2% Expenses for employee benefit obligations (318,578) (307,995) 3.4% Administration expenses (284,623) (301,308) (5.5%) Depreciation and amortization (98,346) (101,150) (2.8%) Impairment of non-financial assets (134) (2,924) (95.4%) Other operating expenses (46,757) (67,789) (31.0%) Total operating expenses (748,438) (781,166) (4.2%) Operating income before credit losses 1,520,707 1,396,038 8.9% Expense for provisions established for credit risk of loans at amortized cost (604,867) (663,240) (8.8%) Expense for special provisions for credit risk 17,158 96,222 (82.2%) Recovery of written-off loans 145,353 136,721 6.3% Impairment for credit risk for other financial assets at amortized cost and financial assets at fair value through other comprehensive income (275) (92) 198.9% Credit loss expense (442,631) (430,389) 2.8% Net income from ordinary activities before tax 1,078,076 965,649 11.6% Income tax (161,758) (156,229) 3.5% Net income from ordinary activities 916,318 809,420 13.2% Income attributable to shareholders 892,844 797,869 11.9% Income for non-controlling interest 23,474 11,551 103.2% 57
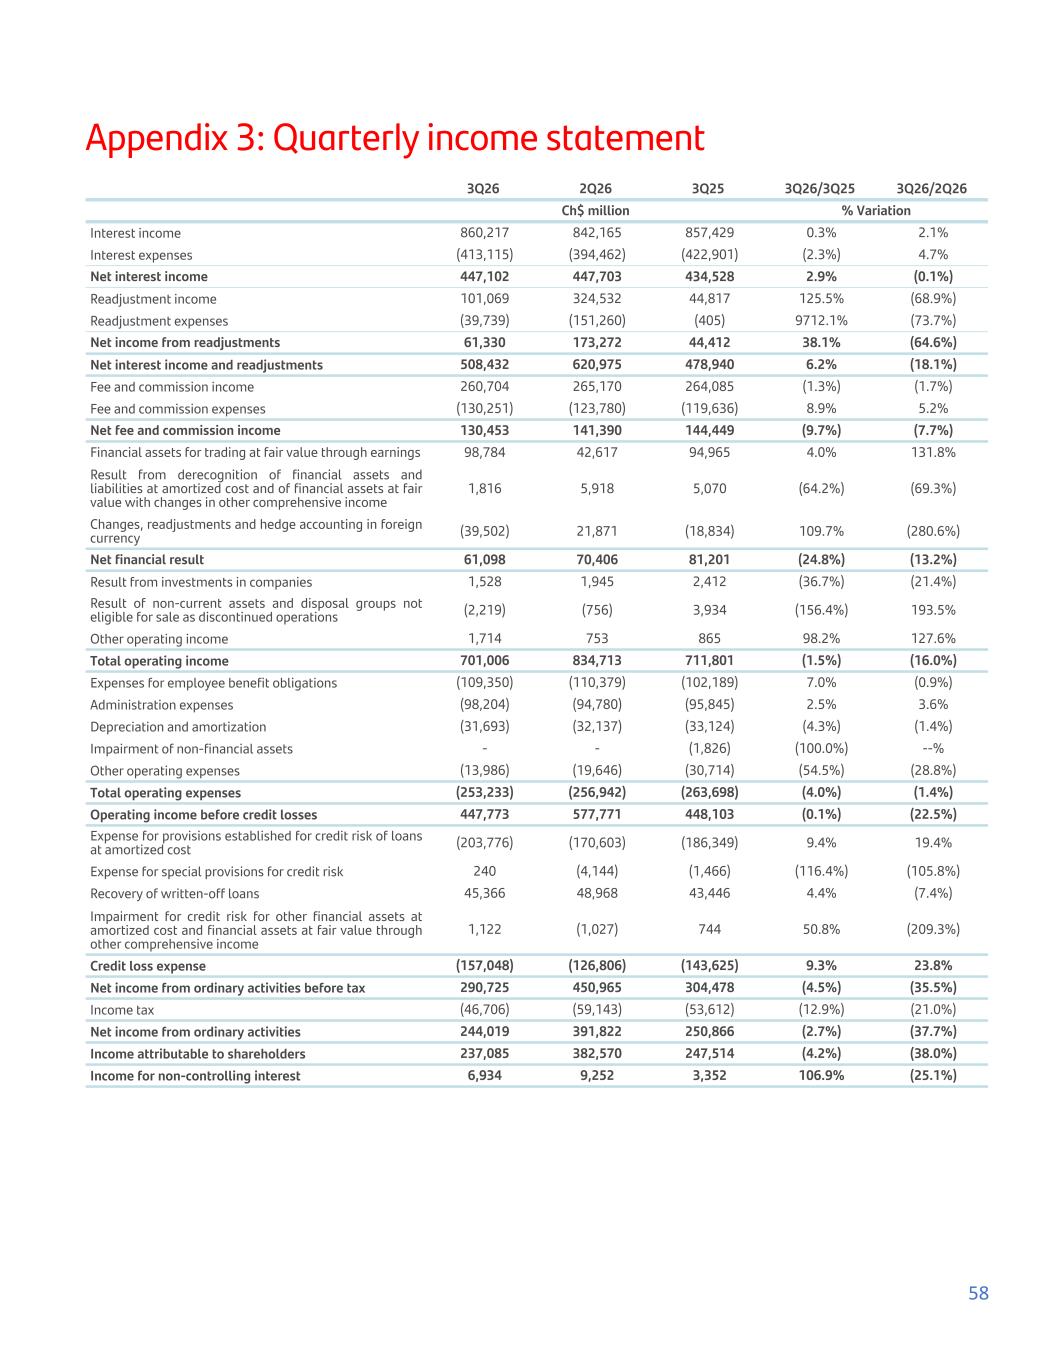
Appendix 3: Quarterly income statement 3Q26 2Q26 3Q25 3Q26/3Q25 3Q26/2Q26 Ch$ million % Variation Interest income 860,217 842,165 857,429 0.3% 2.1% Interest expenses (413,115) (394,462) (422,901) (2.3%) 4.7% Net interest income 447,102 447,703 434,528 2.9% (0.1%) Readjustment income 101,069 324,532 44,817 125.5% (68.9%) Readjustment expenses (39,739) (151,260) (405) 9712.1% (73.7%) Net income from readjustments 61,330 173,272 44,412 38.1% (64.6%) Net interest income and readjustments 508,432 620,975 478,940 6.2% (18.1%) Fee and commission income 260,704 265,170 264,085 (1.3%) (1.7%) Fee and commission expenses (130,251) (123,780) (119,636) 8.9% 5.2% Net fee and commission income 130,453 141,390 144,449 (9.7%) (7.7%) Financial assets for trading at fair value through earnings 98,784 42,617 94,965 4.0% 131.8% Result from derecognition of financial assets and liabilities at amortized cost and of financial assets at fair value with changes in other comprehensive income 1,816 5,918 5,070 (64.2%) (69.3%) Changes, readjustments and hedge accounting in foreign currency (39,502) 21,871 (18,834) 109.7% (280.6%) Net financial result 61,098 70,406 81,201 (24.8%) (13.2%) Result from investments in companies 1,528 1,945 2,412 (36.7%) (21.4%) Result of non-current assets and disposal groups not eligible for sale as discontinued operations (2,219) (756) 3,934 (156.4%) 193.5% Other operating income 1,714 753 865 98.2% 127.6% Total operating income 701,006 834,713 711,801 (1.5%) (16.0%) Expenses for employee benefit obligations (109,350) (110,379) (102,189) 7.0% (0.9%) Administration expenses (98,204) (94,780) (95,845) 2.5% 3.6% Depreciation and amortization (31,693) (32,137) (33,124) (4.3%) (1.4%) Impairment of non-financial assets - - (1,826) (100.0%) --% Other operating expenses (13,986) (19,646) (30,714) (54.5%) (28.8%) Total operating expenses (253,233) (256,942) (263,698) (4.0%) (1.4%) Operating income before credit losses 447,773 577,771 448,103 (0.1%) (22.5%) Expense for provisions established for credit risk of loans at amortized cost (203,776) (170,603) (186,349) 9.4% 19.4% Expense for special provisions for credit risk 240 (4,144) (1,466) (116.4%) (105.8%) Recovery of written-off loans 45,366 48,968 43,446 4.4% (7.4%) Impairment for credit risk for other financial assets at amortized cost and financial assets at fair value through other comprehensive income 1,122 (1,027) 744 50.8% (209.3%) Credit loss expense (157,048) (126,806) (143,625) 9.3% 23.8% Net income from ordinary activities before tax 290,725 450,965 304,478 (4.5%) (35.5%) Income tax (46,706) (59,143) (53,612) (12.9%) (21.0%) Net income from ordinary activities 244,019 391,822 250,866 (2.7%) (37.7%) Income attributable to shareholders 237,085 382,570 247,514 (4.2%) (38.0%) Income for non-controlling interest 6,934 9,252 3,352 106.9% (25.1%) 58
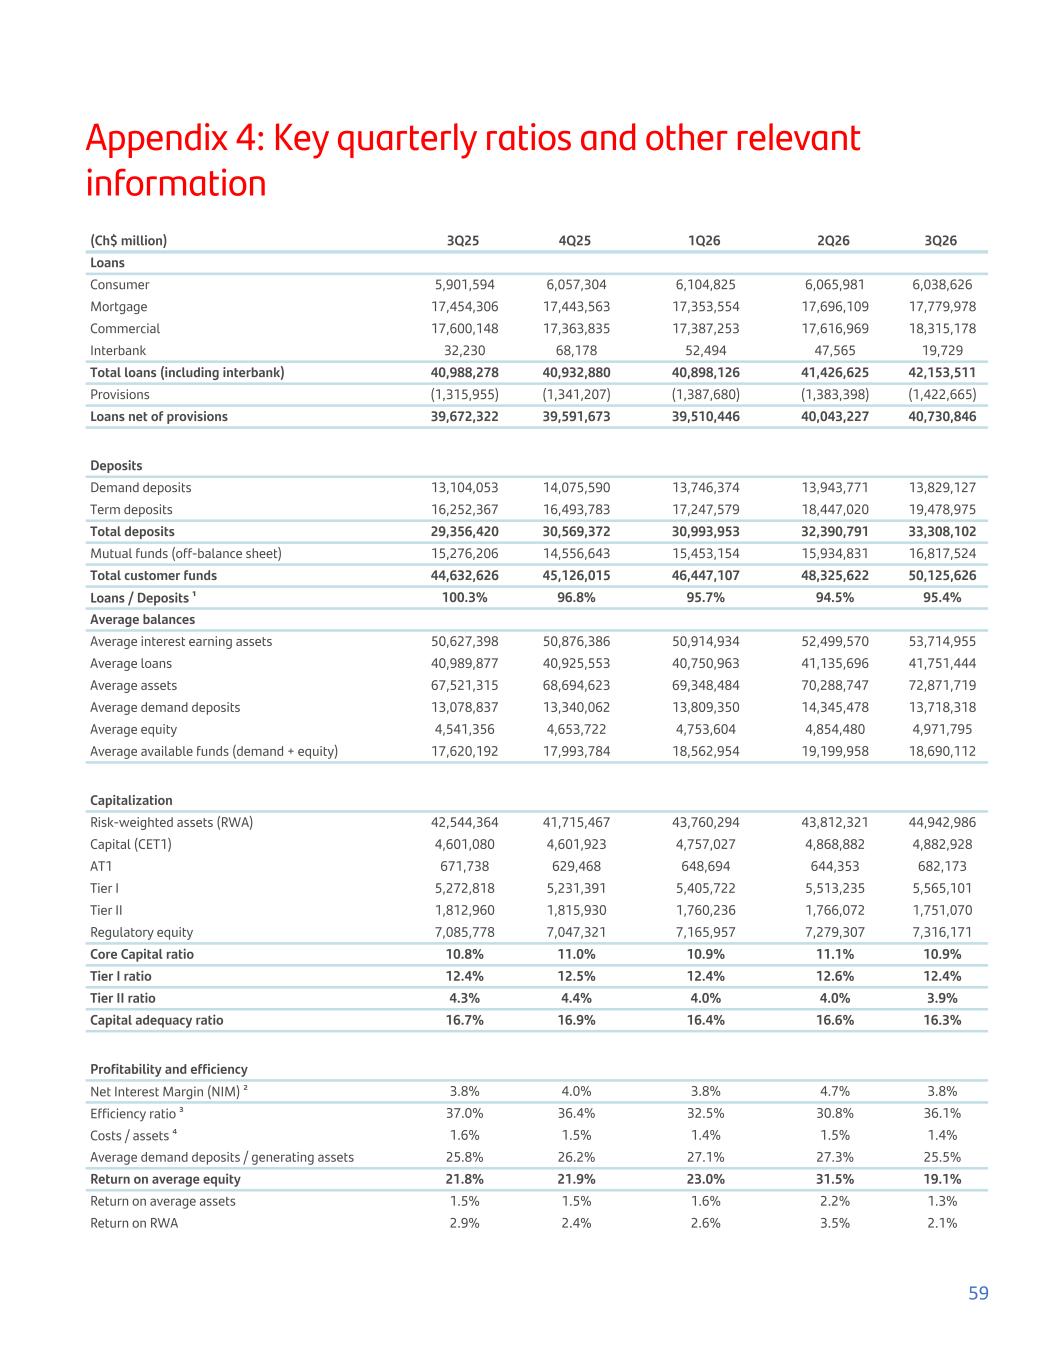
Appendix 4: Key quarterly ratios and other relevant information (Ch$ million) 3Q25 4Q25 1Q26 2Q26 3Q26 Loans Consumer 5,901,594 6,057,304 6,104,825 6,065,981 6,038,626 Mortgage 17,454,306 17,443,563 17,353,554 17,696,109 17,779,978 Commercial 17,600,148 17,363,835 17,387,253 17,616,969 18,315,178 Interbank 32,230 68,178 52,494 47,565 19,729 Total loans (including interbank) 40,988,278 40,932,880 40,898,126 41,426,625 42,153,511 Provisions (1,315,955) (1,341,207) (1,387,680) (1,383,398) (1,422,665) Loans net of provisions 39,672,322 39,591,673 39,510,446 40,043,227 40,730,846 Deposits Demand deposits 13,104,053 14,075,590 13,746,374 13,943,771 13,829,127 Term deposits 16,252,367 16,493,783 17,247,579 18,447,020 19,478,975 Total deposits 29,356,420 30,569,372 30,993,953 32,390,791 33,308,102 Mutual funds (off-balance sheet) 15,276,206 14,556,643 15,453,154 15,934,831 16,817,524 Total customer funds 44,632,626 45,126,015 46,447,107 48,325,622 50,125,626 Loans / Deposits ¹ 100.3% 96.8% 95.7% 94.5% 95.4% Average balances Average interest earning assets 50,627,398 50,876,386 50,914,934 52,499,570 53,714,955 Average loans 40,989,877 40,925,553 40,750,963 41,135,696 41,751,444 Average assets 67,521,315 68,694,623 69,348,484 70,288,747 72,871,719 Average demand deposits 13,078,837 13,340,062 13,809,350 14,345,478 13,718,318 Average equity 4,541,356 4,653,722 4,753,604 4,854,480 4,971,795 Average available funds (demand + equity) 17,620,192 17,993,784 18,562,954 19,199,958 18,690,112 Capitalization Risk-weighted assets (RWA) 42,544,364 41,715,467 43,760,294 43,812,321 44,942,986 Capital (CET1) 4,601,080 4,601,923 4,757,027 4,868,882 4,882,928 AT1 671,738 629,468 648,694 644,353 682,173 Tier I 5,272,818 5,231,391 5,405,722 5,513,235 5,565,101 Tier II 1,812,960 1,815,930 1,760,236 1,766,072 1,751,070 Regulatory equity 7,085,778 7,047,321 7,165,957 7,279,307 7,316,171 Core Capital ratio 10.8% 11.0% 10.9% 11.1% 10.9% Tier I ratio 12.4% 12.5% 12.4% 12.6% 12.4% Tier II ratio 4.3% 4.4% 4.0% 4.0% 3.9% Capital adequacy ratio 16.7% 16.9% 16.4% 16.6% 16.3% Profitability and efficiency Net Interest Margin (NIM) ² 3.8% 4.0% 3.8% 4.7% 3.8% Efficiency ratio ³ 37.0% 36.4% 32.5% 30.8% 36.1% Costs / assets ⁴ 1.6% 1.5% 1.4% 1.5% 1.4% Average demand deposits / generating assets 25.8% 26.2% 27.1% 27.3% 25.5% Return on average equity 21.8% 21.9% 23.0% 31.5% 19.1% Return on average assets 1.5% 1.5% 1.6% 2.2% 1.3% Return on RWA 2.9% 2.4% 2.6% 3.5% 2.1% 59
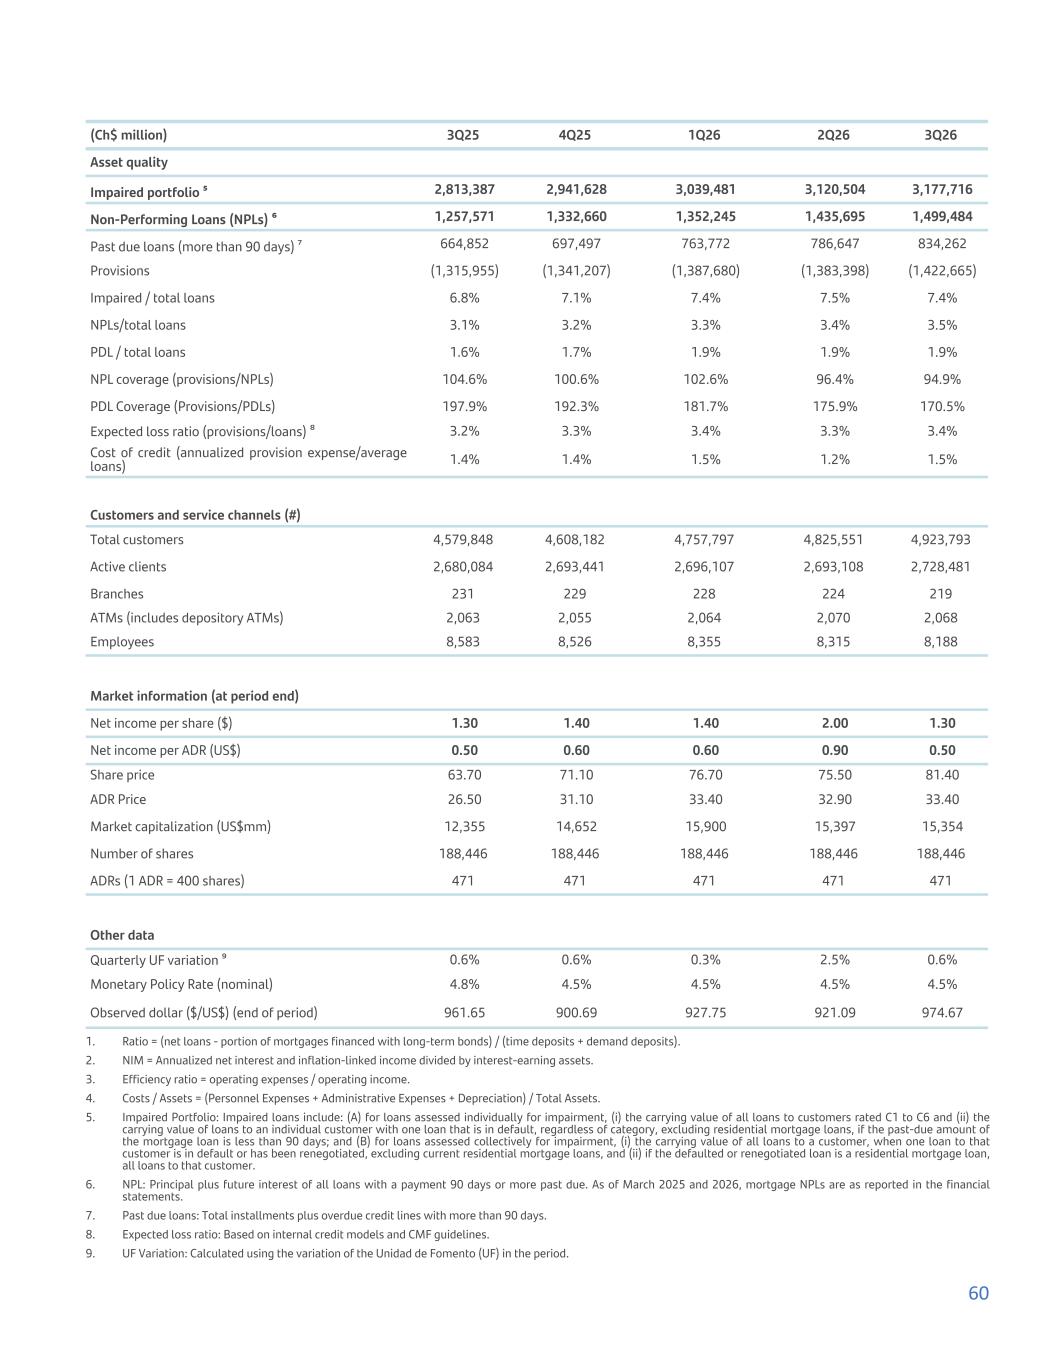
(Ch$ million) 3Q25 4Q25 1Q26 2Q26 3Q26 Asset quality Impaired portfolio ⁵ 2,813,387 2,941,628 3,039,481 3,120,504 3,177,716 Non-Performing Loans (NPLs) ⁶ 1,257,571 1,332,660 1,352,245 1,435,695 1,499,484 Past due loans (more than 90 days) ⁷ 664,852 697,497 763,772 786,647 834,262 Provisions (1,315,955) (1,341,207) (1,387,680) (1,383,398) (1,422,665) Impaired / total loans 6.8% 7.1% 7.4% 7.5% 7.4% NPLs/total loans 3.1% 3.2% 3.3% 3.4% 3.5% PDL / total loans 1.6% 1.7% 1.9% 1.9% 1.9% NPL coverage (provisions/NPLs) 104.6% 100.6% 102.6% 96.4% 94.9% PDL Coverage (Provisions/PDLs) 197.9% 192.3% 181.7% 175.9% 170.5% Expected loss ratio (provisions/loans) ⁸ 3.2% 3.3% 3.4% 3.3% 3.4% Cost of credit (annualized provision expense/average loans) 1.4% 1.4% 1.5% 1.2% 1.5% Customers and service channels (#) Total customers 4,579,848 4,608,182 4,757,797 4,825,551 4,923,793 Active clients 2,680,084 2,693,441 2,696,107 2,693,108 2,728,481 Branches 231 229 228 224 219 ATMs (includes depository ATMs) 2,063 2,055 2,064 2,070 2,068 Employees 8,583 8,526 8,355 8,315 8,188 Market information (at period end) Net income per share ($) 1.30 1.40 1.40 2.00 1.30 Net income per ADR (US$) 0.50 0.60 0.60 0.90 0.50 Share price 63.70 71.10 76.70 75.50 81.40 ADR Price 26.50 31.10 33.40 32.90 33.40 Market capitalization (US$mm) 12,355 14,652 15,900 15,397 15,354 Number of shares 188,446 188,446 188,446 188,446 188,446 ADRs (1 ADR = 400 shares) 471 471 471 471 471 Other data Quarterly UF variation ⁹ 0.6% 0.6% 0.3% 2.5% 0.6% Monetary Policy Rate (nominal) 4.8% 4.5% 4.5% 4.5% 4.5% Observed dollar ($/US$) (end of period) 961.65 900.69 927.75 921.09 974.67 1. Ratio = (net loans - portion of mortgages financed with long-term bonds) / (time deposits + demand deposits). 2. NIM = Annualized net interest and inflation-linked income divided by interest-earning assets. 3. Efficiency ratio = operating expenses / operating income. 4. Costs / Assets = (Personnel Expenses + Administrative Expenses + Depreciation) / Total Assets. 5. Impaired Portfolio: Impaired loans include: (A) for loans assessed individually for impairment, (i) the carrying value of all loans to customers rated C1 to C6 and (ii) the carrying value of loans to an individual customer with one loan that is in default, regardless of category, excluding residential mortgage loans, if the past-due amount of the mortgage loan is less than 90 days; and (B) for loans assessed collectively for impairment, (i) the carrying value of all loans to a customer, when one loan to that customer is in default or has been renegotiated, excluding current residential mortgage loans, and (ii) if the defaulted or renegotiated loan is a residential mortgage loan, all loans to that customer. 6. NPL: Principal plus future interest of all loans with a payment 90 days or more past due. As of March 2025 and 2026, mortgage NPLs are as reported in the financial statements. 7. Past due loans: Total installments plus overdue credit lines with more than 90 days. 8. Expected loss ratio: Based on internal credit models and CMF guidelines. 9. UF Variation: Calculated using the variation of the Unidad de Fomento (UF) in the period. 60